Embed Size (px)
Citation preview
11
2013
November 2013
Sector Report
Health Care
Economics, FI/FX & Commodities ResearchCredit Research Equity Research Cross Asset Research
“Credit Health Check”
<date>
November 2013 Credit Research
Sector Report Health Care
UniCredit Research page 2 See last pages for disclaimer.
Contents 3 Summary
4 Sector SWOT Analysis
5 Company Overview
7 Business Profiles
8 Strategy Outlook 2014
10 Investment Recommendation
16 Trading Ideas
19 Healthcare bonds: supply and outlook
21 Rating trend
27 Credit drivers for the Pharma Industry
27 Growth outlook for the sector
29 Patent expirations
32 Product pipeline and approval process
33 M&A activity
36 Competition from Generics
38 Cost-cutting attempts
39 Healthcare reforms
42 Credit Profile Overviews
44 Amgen
46 Amplifon
50 AstraZeneca
52 Bayer
54 Bristol-Myers Squibb
56 Celesio AG
60 Fresenius
66 GlaxoSmithKline
68 Johnson & Johnson
70 Merck & Co.
72 Merck KGaA
74 Novartis AG
76 Pfizer
78 Phoenix Pharmahandel
82 Rhön-Klinikum
84 Roche
86 Sanofi
88 Teva
Coverpicture © Daniel Fuhr - Fotolia.com
<date>
UniCredit Research page 3 See last pages for disclaimer.
November 2013 Credit Research
Sector Report Health Care
Summary Sector recommendation: iBoxx Health Care sector: Underweight Top pans: Astra Zeneca Bristol-Myers Squibb Merck & Co. Rhön-Klinikum Top picks: Teva Amgen
We have an underweight recommendation on the iBoxx EUR Health Care sector. Given the relatively high average rating of the iBoxx Health Care index, bonds trade at tight levels and offer only limited potential for further tightening. Our recommendations are based on ourfundamental view on single names combined with relative value considerations. Our top picksare Teva, a generic drug company, and Amgen, the largest biotech company. Both are well-positioned in the global pharma market regarding patent expiries. Among AA rated pharma bonds, we see the best value in Roche (marketweight), highlighted by its attractive pipeline and the high percentage of biological drugs in its portfolio. We have an underweightrecommendation on Astra Zeneca, Bristol-Myers Squibb and Merck & Co due to their tight spread levels and the negative impact on sales from patent expiries.
HY Health Care sector (UniCredit): Hold Top pick: Amplifon Hold: Fresenius Celesio Phoenix Pharmahandel
We have a buy recommendation on Amplifon and a hold recommendation in our HY EUR Healthcare universe on Fresenius, Celesio and Phoenix Pharmahandel. For Amplifon, the number-one global retailer of hearing aid devices and related services, we initiate coverage with abuy recommendation. Despite remaining price pressure, we expect credit metrics to improve in2014 due to a better volume trend and operational cost savings. We like Fresenius's leading market positions in its high margin-business, as well as Phoenix's commitment to deleveraging and conservative financial policy. The main risks to their credit ratings are large M&A deals, as recentlydemonstrated by Fresenius's acquisition of the majority of Rhön-Klinikum's hospitals. The intendedtakeover of pharmaceutical wholesaler and pharmacy owner Celesio by McKesson is slightlypositive for Celesio's bondholders due to synergies and higher purchasing volumes in the future.
Rating development Still the best-rated sector in iBoxx
The pharma sector is still the best-rated in the iBoxx bond universe. In 9M13, the average rating of the iBoxx Health Care index recovered to A+, the same level seen ten years ago. Withfew exceptions, the absence of patent-loss-related downgrades during the peak of the so-called "patent cliff" in 2012 demonstrated the resilience of global pharmaceutical companies' credit.
Pharma outlook 2014: stable credit metrics Medium term: slight improvement in credit metrics
For 2014, we anticipate stable credit metrics and a slight improvement in the medium term due to the higher quality of drugs in the pipeline, fewer patent expiries and more approvals by the US Food and Drug Administration (FDA). With an annual growth rate in the low single-digit range in 2012 and 2013, top-line momentum in the pharmaceutical industry is expected to rebound to 5-7% p.a. by 2016. Looking ahead, regional growth should come from emerging markets and – from a therapeutic perspective – mainly from oncology. Nevertheless, drug companies continue to face price pressure from austerity measures in Europe and the US.
M&A volume increased in 9M13 More activity on the M&A front in 2014, but big M&A of minor focus Licensing deals of more interest Shareholder remuneration up
M&A volume in 9M13 already surpassed its level in 2012. However, the number of in-licensing deals has exceeded M&A deals since 2010. Big M&A deals pose a large risk to credit ratings in this sector. In our view, the improved quality of companies' late-stage pipelines (phase III) is a good indicator that big deals are not absolutely necessary. In FY12, drug makersfavored in-licensing deals (new ingredients from biotech companies) over M&A to improve their drug pipelines, a trend that should continue. Nevertheless, 2014 could be more active on the M&Afront, after increasing volume already in 9M13. After more debt reduction, pharma companies willagain be able to distribute more profits to shareholders via share buy-backs or dividends, in our view.
Pharma bond supply and outlook
In 2014, we expect issuance activity to more than double yoy in the iBoxx EUR Healthcare sector and increase slightly for the corresponding HY sector. This is mainly due to the companies' redemption schedules. Opportunistic M&A could increase this number further. For 2014,yield levels in EUR should remain well below those in USD; more issuance in EUR is expected. Weexpect to see issuance of EUR 5bn in the iBoxx EUR Healthcare index and EUR 2.5bn in the corresponding HY sector. Issuance activity in our HY EUR healthcare universe is supported byexpected bond issues from Fresenius after the asset deal with Rhön-Klinikum.
<date>
UniCredit Research page 4 See last pages for disclaimer.
November 2013 Credit Research
Sector Report Health Care
Sector SWOT Analysis Strengths/opportunities ■ The healthcare business is non-cyclical with stable cash-flow generation, even during the
economic crisis.
■ The iBoxx EUR Healthcare is the best-rated sector in the iBoxx universe with low leverage (average 1.6x adj. total debt/EBITDA in 9M13).
■ Business models are supported by demographic trends in the western hemisphere: rising life expectancy, an increasing proportion of elderly people, an increase in "lifestyle"diseases and technological progress.
■ Emerging markets will be the growth region over the next few years. IMS Health, a research institute, predicts that emerging markets will grow at a total annual rate of 10-13% between 2012 and 2016.
■ There are high barriers-to-entry in the healthcare sector in general. Big pharma companiesreport high R&D costs (15% of sales) and marketing costs (25% of sales). The pharmaceuticalwholesale and dialysis markets are also characterized by oligopolistic structures.
■ Restructuring programs bolstered big pharma companies' abilities to generate strong cashflows. Also, pharmaceutical wholesalers (Celesio, Phoenix Pharmahandel) have efficiencyprograms in place to improve their operating results.
■ Big pharma companies show a healthy margin trend with strong EBITDA margins between25% -40%.
■ Issuers are only headquartered in countries with a AA/AAA credit rating (Germany,Switzerland, UK, US).
Weaknesses/threats ■ Health care reforms remain an uncertainty factor in the US and many European countries.Reforms might hamper top-line growth and might burden industry margins.
■ Globally-branded pharmaceutical companies went through a challenging period of losing their patent exclusivity ("patent cliff") on attractive drugs in 2011/2012. Nevertheless, theysaw a slight improvement in 2013. The next wave of patent expirations in 2015 will be mitigated by biopharmaceutical drugs, which are difficult to copy.
■ Approval standards and requirements for new drugs have been raised, mainly by the USFood and Drug Administration (FDA). Nevertheless, the FDA's approval process for drugs trended up in 2012, i.e. more new patented drugs will be launched per year with a positiveimpact on the cash flow of pharma companies in the future.
■ Many pharmaceutical companies have shareholder-friendly financial policies with share buy-backs and dividend increases.
■ M&A deals remain an event risk in the healthcare sector for credit investors. In 2012 and2013, big M&A deals were of minor importance for pharma companies.
■ Competition from generic drug manufacturers is getting tougher due to cost pressure from government healthcare reforms and the expiration of patents in developed markets.
■ Weakening late-stage pipelines and a low number of new drugs with blockbuster potential.
■ Uncertainty for generic drug companies prevails due to legal issues arising mainly from "pay for delay" or patent violations. In June 2013, the US Supreme Court ruled that pharmaceutical companies can be sued for antitrust violations when a branded company pays a generic company to keep a cheaper generic version of a drug off the market.
November 2013 Credit Research
Sector Report Health Care
UniCredit Research page 5 See last pages for disclaimer.
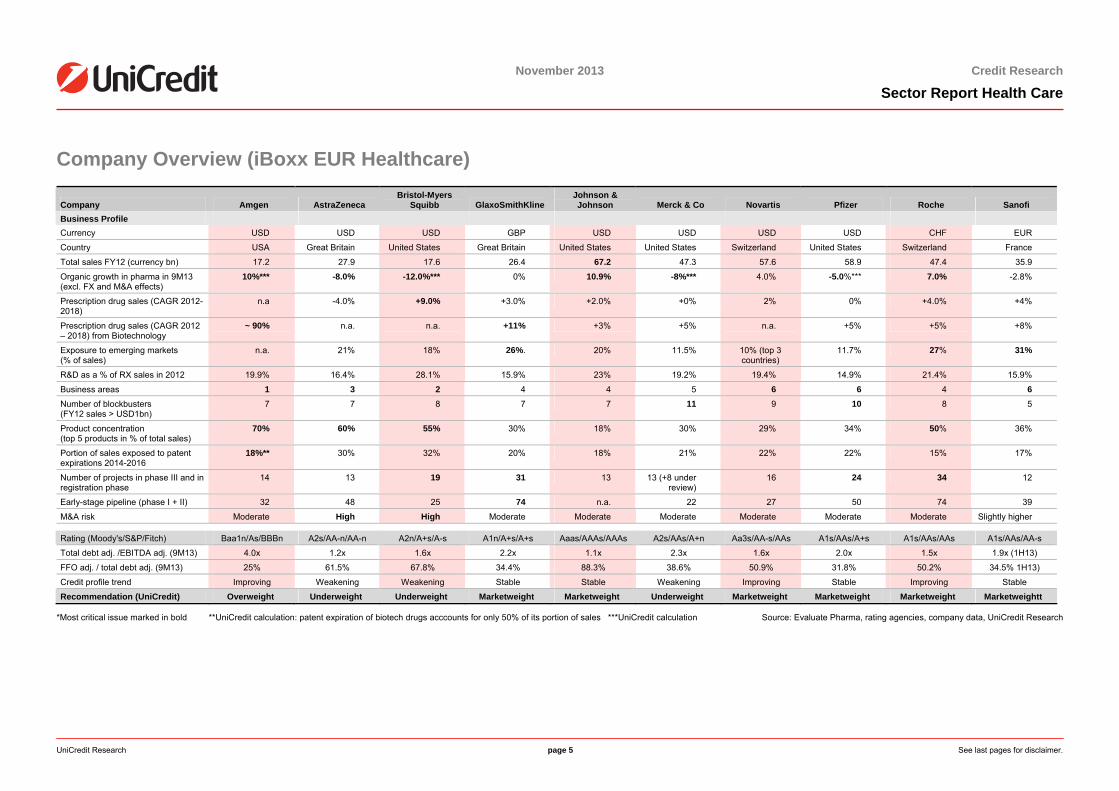
Company Overview (iBoxx EUR Healthcare)
Company Amgen AstraZeneca Bristol-Myers
Squibb GlaxoSmithKline Johnson & Johnson Merck & Co Novartis Pfizer Roche Sanofi
Business Profile Currency USD USD USD GBP USD USD USD USD CHF EUR
Country USA Great Britain United States Great Britain United States United States Switzerland United States Switzerland France
Total sales FY12 (currency bn) 17.2 27.9 17.6 26.4 67.2 47.3 57.6 58.9 47.4 35.9
Organic growth in pharma in 9M13 (excl. FX and M&A effects)
10%*** -8.0% -12.0%*** 0% 10.9% -8%*** 4.0% -5.0%*** 7.0% -2.8%
Prescription drug sales (CAGR 2012-2018)
n.a -4.0% +9.0% +3.0% +2.0% +0% 2% 0% +4.0% +4%
Prescription drug sales (CAGR 2012 – 2018) from Biotechnology
~ 90% n.a. n.a. +11% +3% +5% n.a. +5% +5% +8%
Exposure to emerging markets (% of sales)
n.a. 21% 18% 26%. 20% 11.5% 10% (top 3 countries)
11.7% 27% 31%
R&D as a % of RX sales in 2012 19.9% 16.4% 28.1% 15.9% 23% 19.2% 19.4% 14.9% 21.4% 15.9%
Business areas 1 3 2 4 4 5 6 6 4 6 Number of blockbusters (FY12 sales > USD1bn)
7 7 8 7 7 11 9 10 8 5
Product concentration (top 5 products in % of total sales)
70% 60% 55% 30% 18% 30% 29% 34% 50% 36%
Portion of sales exposed to patent expirations 2014-2016
18%** 30% 32% 20% 18% 21% 22% 22% 15% 17%
Number of projects in phase III and in registration phase
14 13 19 31 13 13 (+8 under review)
16 24 34 12
Early-stage pipeline (phase I + II) 32 48 25 74 n.a. 22 27 50 74 39
M&A risk Moderate High High Moderate Moderate Moderate Moderate Moderate Moderate Slightly higher
Rating (Moody's/S&P/Fitch) Baa1n/As/BBBn A2s/AA-n/AA-n A2n/A+s/A-s A1n/A+s/A+s Aaas/AAAs/AAAs A2s/AAs/A+n Aa3s/AA-s/AAs A1s/AAs/A+s A1s/AAs/AAs A1s/AAs/AA-s
Total debt adj. /EBITDA adj. (9M13) 4.0x 1.2x 1.6x 2.2x 1.1x 2.3x 1.6x 2.0x 1.5x 1.9x (1H13)
FFO adj. / total debt adj. (9M13) 25% 61.5% 67.8% 34.4% 88.3% 38.6% 50.9% 31.8% 50.2% 34.5% 1H13)
Credit profile trend Improving Weakening Weakening Stable Stable Weakening Improving Stable Improving Stable
Recommendation (UniCredit) Overweight Underweight Underweight Marketweight Marketweight Underweight Marketweight Marketweight Marketweight Marketweightt
*Most critical issue marked in bold **UniCredit calculation: patent expiration of biotech drugs acccounts for only 50% of its portion of sales ***UniCredit calculation Source: Evaluate Pharma, rating agencies, company data, UniCredit Research
November 2013 Credit Research
Sector Report Health Care
UniCredit Research page 6 See last pages for disclaimer.
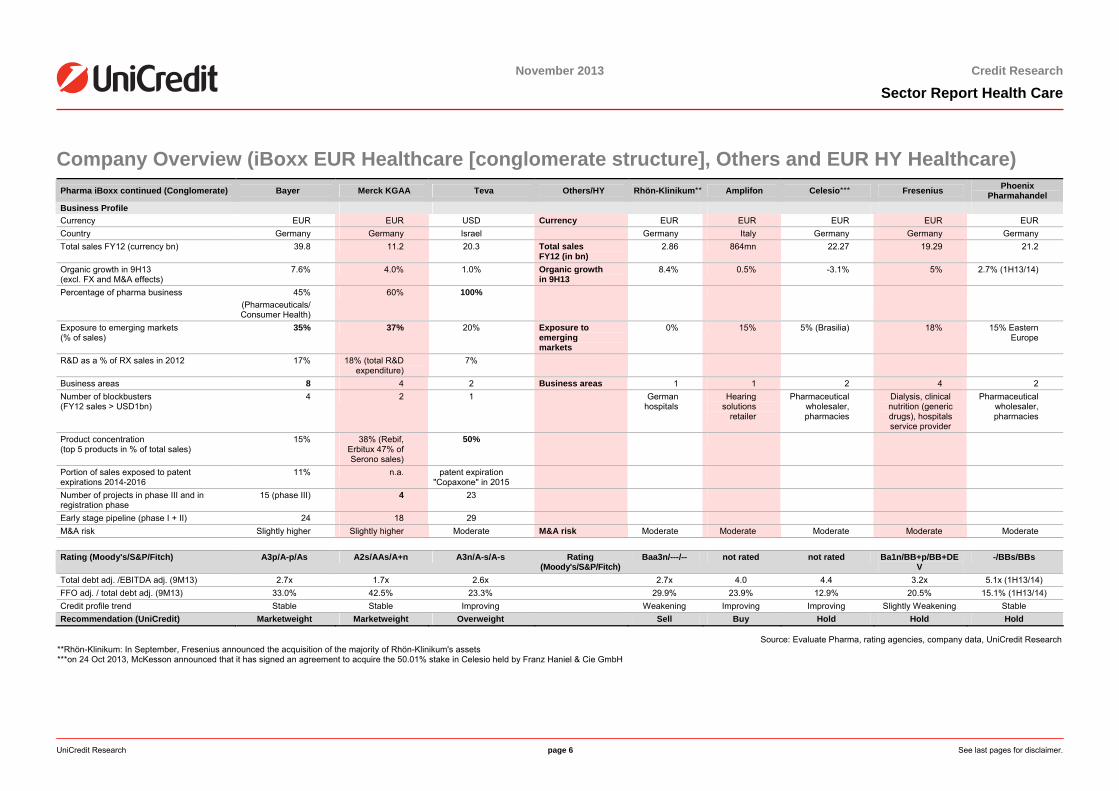
Company Overview (iBoxx EUR Healthcare [conglomerate structure], Others and EUR HY Healthcare) Pharma iBoxx continued (Conglomerate) Bayer Merck KGAA Teva Others/HY Rhön-Klinikum** Amplifon Celesio*** Fresenius Phoenix
Pharmahandel Business Profile Currency EUR EUR USD Currency EUR EUR EUR EUR EUR Country Germany Germany Israel Germany Italy Germany Germany Germany Total sales FY12 (currency bn) 39.8 11.2 20.3 Total sales
FY12 (in bn) 2.86 864mn 22.27 19.29 21.2
Organic growth in 9H13 (excl. FX and M&A effects)
7.6% 4.0% 1.0% Organic growth in 9H13
8.4% 0.5% -3.1% 5% 2.7% (1H13/14)
Percentage of pharma business 45% (Pharmaceuticals/ Consumer Health)
60% 100%
Exposure to emerging markets (% of sales)
35% 37% 20% Exposure to emerging markets
0% 15% 5% (Brasilia) 18% 15% Eastern Europe
R&D as a % of RX sales in 2012 17% 18% (total R&D expenditure)
7%
Business areas 8 4 2 Business areas 1 1 2 4 2 Number of blockbusters (FY12 sales > USD1bn)
4 2 1 German hospitals
Hearing solutions
retailer
Pharmaceutical wholesaler, pharmacies
Dialysis, clinical nutrition (generic drugs), hospitals service provider
Pharmaceutical wholesaler, pharmacies
Product concentration (top 5 products in % of total sales)
15% 38% (Rebif, Erbitux 47% of Serono sales)
50%
Portion of sales exposed to patent expirations 2014-2016
11% n.a. patent expiration "Copaxone" in 2015
Number of projects in phase III and in registration phase
15 (phase III) 4 23
Early stage pipeline (phase I + II) 24 18 29 M&A risk Slightly higher Slightly higher Moderate M&A risk Moderate Moderate Moderate Moderate Moderate Rating (Moody's/S&P/Fitch) A3p/A-p/As A2s/AAs/A+n A3n/A-s/A-s Rating
(Moody's/S&P/Fitch) Baa3n/---/-- not rated not rated Ba1n/BB+p/BB+DE
V -/BBs/BBs
Total debt adj. /EBITDA adj. (9M13) 2.7x 1.7x 2.6x 2.7x 4.0 4.4 3.2x 5.1x (1H13/14) FFO adj. / total debt adj. (9M13) 33.0% 42.5% 23.3% 29.9% 23.9% 12.9% 20.5% 15.1% (1H13/14) Credit profile trend Stable Stable Improving Weakening Improving Improving Slightly Weakening Stable Recommendation (UniCredit) Marketweight Marketweight Overweight Sell Buy Hold Hold Hold
Source: Evaluate Pharma, rating agencies, company data, UniCredit Research **Rhön-Klinikum: In September, Fresenius announced the acquisition of the majority of Rhön-Klinikum's assets ***on 24 Oct 2013, McKesson announced that it has signed an agreement to acquire the 50.01% stake in Celesio held by Franz Haniel & Cie GmbH
<date>
November 2013 Credit Research
Sector Report Health Care
UniCredit Research page 7 See last pages for disclaimer.
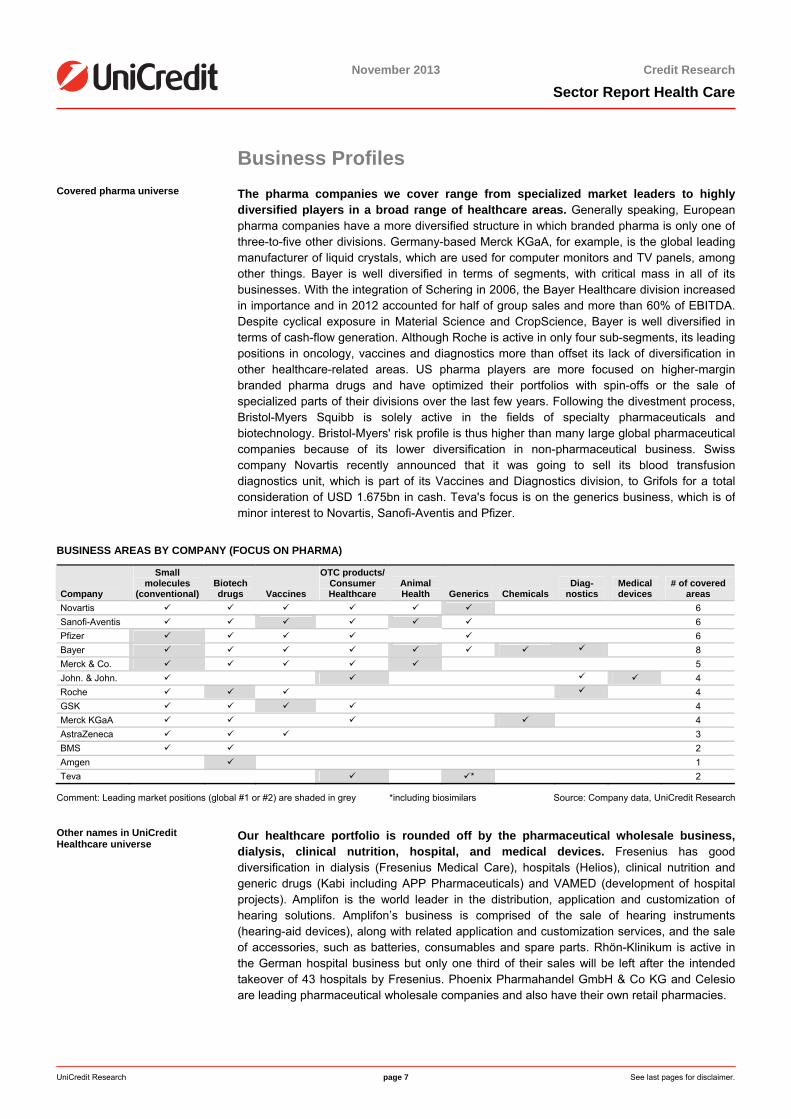
Business Profiles Covered pharma universe The pharma companies we cover range from specialized market leaders to highly
diversified players in a broad range of healthcare areas. Generally speaking, Europeanpharma companies have a more diversified structure in which branded pharma is only one ofthree-to-five other divisions. Germany-based Merck KGaA, for example, is the global leading manufacturer of liquid crystals, which are used for computer monitors and TV panels, among other things. Bayer is well diversified in terms of segments, with critical mass in all of its businesses. With the integration of Schering in 2006, the Bayer Healthcare division increasedin importance and in 2012 accounted for half of group sales and more than 60% of EBITDA.Despite cyclical exposure in Material Science and CropScience, Bayer is well diversified in terms of cash-flow generation. Although Roche is active in only four sub-segments, its leading positions in oncology, vaccines and diagnostics more than offset its lack of diversification in other healthcare-related areas. US pharma players are more focused on higher-margin branded pharma drugs and have optimized their portfolios with spin-offs or the sale of specialized parts of their divisions over the last few years. Following the divestment process, Bristol-Myers Squibb is solely active in the fields of specialty pharmaceuticals and biotechnology. Bristol-Myers' risk profile is thus higher than many large global pharmaceutical companies because of its lower diversification in non-pharmaceutical business. Swiss company Novartis recently announced that it was going to sell its blood transfusiondiagnostics unit, which is part of its Vaccines and Diagnostics division, to Grifols for a totalconsideration of USD 1.675bn in cash. Teva's focus is on the generics business, which is ofminor interest to Novartis, Sanofi-Aventis and Pfizer.
BUSINESS AREAS BY COMPANY (FOCUS ON PHARMA)
Company
Small molecules
(conventional) Biotech drugs Vaccines
OTC products/ Consumer Healthcare
Animal Health Generics Chemicals
Diag-nostics
Medical devices
# of covered areas
Novartis 6 Sanofi-Aventis 6 Pfizer 6 Bayer 8 Merck & Co. 5 John. & John. 4 Roche 4 GSK 4 Merck KGaA 4 AstraZeneca 3 BMS 2 Amgen 1 Teva * 2
Comment: Leading market positions (global #1 or #2) are shaded in grey *including biosimilars Source: Company data, UniCredit Research
Other names in UniCredit Healthcare universe
Our healthcare portfolio is rounded off by the pharmaceutical wholesale business,dialysis, clinical nutrition, hospital, and medical devices. Fresenius has good diversification in dialysis (Fresenius Medical Care), hospitals (Helios), clinical nutrition and generic drugs (Kabi including APP Pharmaceuticals) and VAMED (development of hospitalprojects). Amplifon is the world leader in the distribution, application and customization of hearing solutions. Amplifon’s business is comprised of the sale of hearing instruments (hearing-aid devices), along with related application and customization services, and the sale of accessories, such as batteries, consumables and spare parts. Rhön-Klinikum is active in the German hospital business but only one third of their sales will be left after the intendedtakeover of 43 hospitals by Fresenius. Phoenix Pharmahandel GmbH & Co KG and Celesio are leading pharmaceutical wholesale companies and also have their own retail pharmacies.
<date>
November 2013 Credit Research
Sector Report Health Care
UniCredit Research page 8 See last pages for disclaimer.
Strategy Outlook 2014 2013 proved a solid year for credit with Healthcare trailing
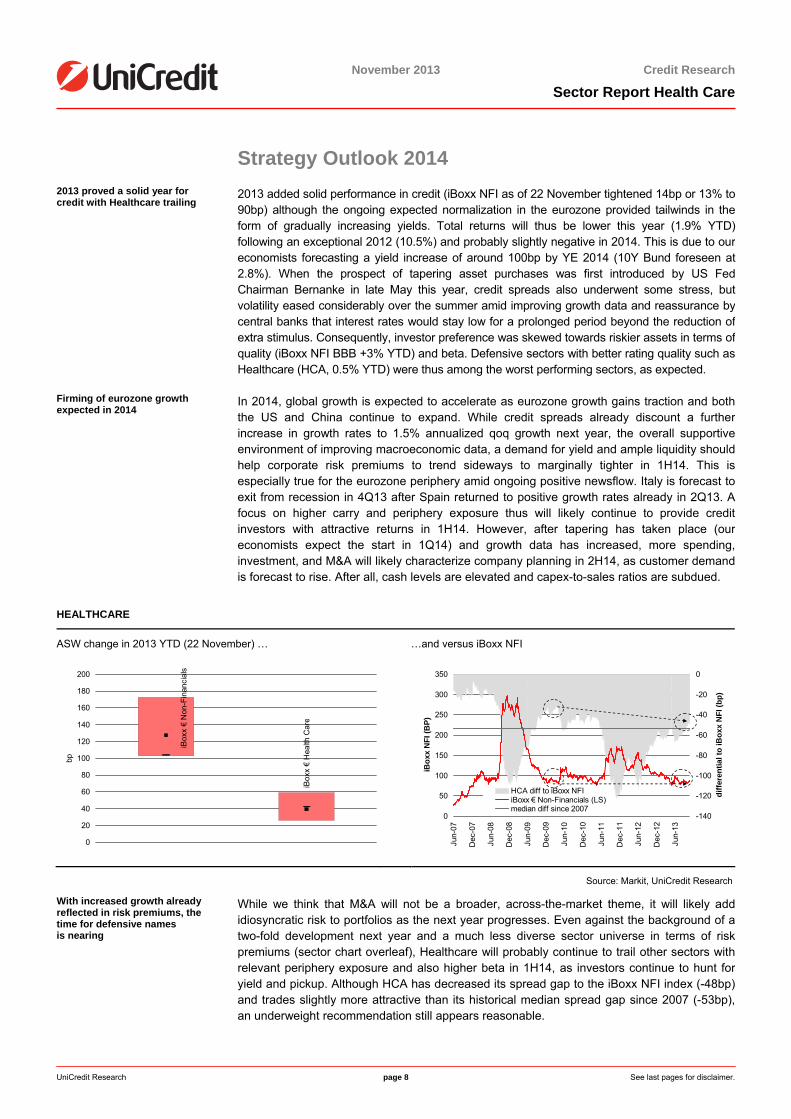
2013 added solid performance in credit (iBoxx NFI as of 22 November tightened 14bp or 13% to90bp) although the ongoing expected normalization in the eurozone provided tailwinds in theform of gradually increasing yields. Total returns will thus be lower this year (1.9% YTD)following an exceptional 2012 (10.5%) and probably slightly negative in 2014. This is due to oureconomists forecasting a yield increase of around 100bp by YE 2014 (10Y Bund foreseen at 2.8%). When the prospect of tapering asset purchases was first introduced by US FedChairman Bernanke in late May this year, credit spreads also underwent some stress, butvolatility eased considerably over the summer amid improving growth data and reassurance by central banks that interest rates would stay low for a prolonged period beyond the reduction ofextra stimulus. Consequently, investor preference was skewed towards riskier assets in terms ofquality (iBoxx NFI BBB +3% YTD) and beta. Defensive sectors with better rating quality such as Healthcare (HCA, 0.5% YTD) were thus among the worst performing sectors, as expected.
Firming of eurozone growth expected in 2014
In 2014, global growth is expected to accelerate as eurozone growth gains traction and both the US and China continue to expand. While credit spreads already discount a furtherincrease in growth rates to 1.5% annualized qoq growth next year, the overall supportiveenvironment of improving macroeconomic data, a demand for yield and ample liquidity should help corporate risk premiums to trend sideways to marginally tighter in 1H14. This isespecially true for the eurozone periphery amid ongoing positive newsflow. Italy is forecast toexit from recession in 4Q13 after Spain returned to positive growth rates already in 2Q13. A focus on higher carry and periphery exposure thus will likely continue to provide creditinvestors with attractive returns in 1H14. However, after tapering has taken place (oureconomists expect the start in 1Q14) and growth data has increased, more spending,investment, and M&A will likely characterize company planning in 2H14, as customer demandis forecast to rise. After all, cash levels are elevated and capex-to-sales ratios are subdued.
HEALTHCARE
ASW change in 2013 YTD (22 November) … …and versus iBoxx NFI
iBox
x €
Hea
lth C
are
iBox
x €
Non
-Fin
anci
als
0
20
40
60
80
100
120
140
160
180
200
bp
0
50
100
150
200
250
300
350
Jun-
07
Dec
-07
Jun-
08
Dec
-08
Jun-
09
Dec
-09
Jun-
10
Dec
-10
Jun-
11
Dec
-11
Jun-
12
Dec
-12
Jun-
13
iBox
x N
FI (B
P)
-140
-120
-100
-80
-60
-40
-20
0
diffe
rent
ial t
o iB
oxx
NFI
(bp)
HCA diff to iBoxx NFIiBoxx € Non-Financials (LS)median diff since 2007
Source: Markit, UniCredit Research
With increased growth already reflected in risk premiums, the time for defensive names is nearing
While we think that M&A will not be a broader, across-the-market theme, it will likely addidiosyncratic risk to portfolios as the next year progresses. Even against the background of atwo-fold development next year and a much less diverse sector universe in terms of riskpremiums (sector chart overleaf), Healthcare will probably continue to trail other sectors withrelevant periphery exposure and also higher beta in 1H14, as investors continue to hunt foryield and pickup. Although HCA has decreased its spread gap to the iBoxx NFI index (-48bp) and trades slightly more attractive than its historical median spread gap since 2007 (-53bp), an underweight recommendation still appears reasonable.
<date>
November 2013 Credit Research
Sector Report Health Care
UniCredit Research page 9 See last pages for disclaimer.
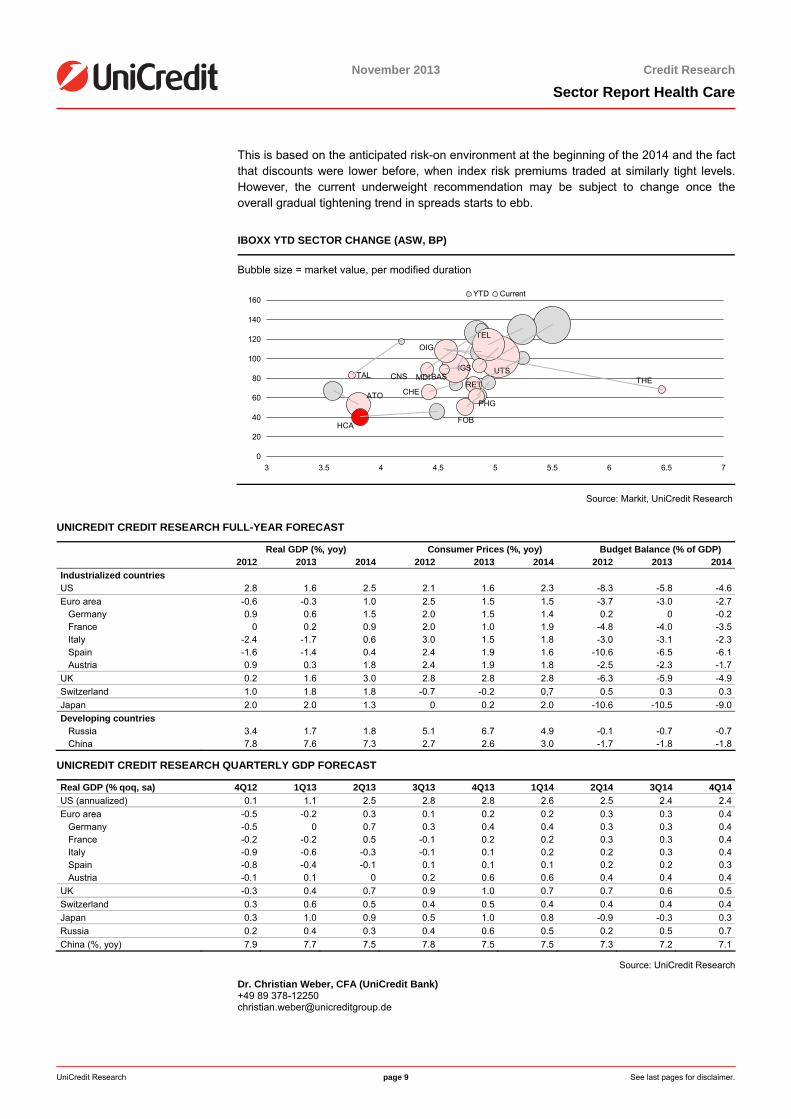
This is based on the anticipated risk-on environment at the beginning of the 2014 and the fact that discounts were lower before, when index risk premiums traded at similarly tight levels.However, the current underweight recommendation may be subject to change once theoverall gradual tightening trend in spreads starts to ebb.
IBOXX YTD SECTOR CHANGE (ASW, BP)
Bubble size = market value, per modified duration
TALTHEMDICNS BAS
CHEPHG
RET
HCAFOB
OIG
ATO
IGS
TEL
UTS
0
20
40
60
80
100
120
140
160
3 3.5 4 4.5 5 5.5 6 6.5 7
YTD Current
Source: Markit, UniCredit Research
UNICREDIT CREDIT RESEARCH FULL-YEAR FORECAST
Real GDP (%, yoy) Consumer Prices (%, yoy) Budget Balance (% of GDP) 2012 2013 2014 2012 2013 2014 2012 2013 2014Industrialized countries US 2.8 1.6 2.5 2.1 1.6 2.3 -8.3 -5.8 -4.6Euro area -0.6 -0.3 1.0 2.5 1.5 1.5 -3.7 -3.0 -2.7 Germany 0.9 0.6 1.5 2.0 1.5 1.4 0.2 0 -0.2 France 0 0.2 0.9 2.0 1.0 1.9 -4.8 -4.0 -3.5 Italy -2.4 -1.7 0.6 3.0 1.5 1.8 -3.0 -3.1 -2.3 Spain -1.6 -1.4 0.4 2.4 1.9 1.6 -10.6 -6.5 -6.1 Austria 0.9 0.3 1.8 2.4 1.9 1.8 -2.5 -2.3 -1.7UK 0.2 1.6 3.0 2.8 2.8 2.8 -6.3 -5.9 -4.9Switzerland 1.0 1.8 1.8 -0.7 -0.2 0,7 0.5 0.3 0.3Japan 2.0 2.0 1.3 0 0.2 2.0 -10.6 -10.5 -9.0Developing countries Russia 3.4 1.7 1.8 5.1 6.7 4.9 -0.1 -0.7 -0.7 China 7.8 7.6 7.3 2.7 2.6 3.0 -1.7 -1.8 -1.8
UNICREDIT CREDIT RESEARCH QUARTERLY GDP FORECAST
Real GDP (% qoq, sa) 4Q12 1Q13 2Q13 3Q13 4Q13 1Q14 2Q14 3Q14 4Q14US (annualized) 0.1 1.1 2.5 2.8 2.8 2.6 2.5 2.4 2.4Euro area -0.5 -0.2 0.3 0.1 0.2 0.2 0.3 0.3 0.4 Germany -0.5 0 0.7 0.3 0.4 0.4 0.3 0.3 0.4 France -0.2 -0.2 0.5 -0.1 0.2 0.2 0.3 0.3 0.4 Italy -0.9 -0.6 -0.3 -0.1 0.1 0.2 0.2 0.3 0.4 Spain -0.8 -0.4 -0.1 0.1 0.1 0.1 0.2 0.2 0.3 Austria -0.1 0.1 0 0.2 0.6 0.6 0.4 0.4 0.4UK -0.3 0.4 0.7 0.9 1.0 0.7 0.7 0.6 0.5Switzerland 0.3 0.6 0.5 0.4 0.5 0.4 0.4 0.4 0.4Japan 0.3 1.0 0.9 0.5 1.0 0.8 -0.9 -0.3 0.3Russia 0.2 0.4 0.3 0.4 0.6 0.5 0.2 0.5 0.7China (%, yoy) 7.9 7.7 7.5 7.8 7.5 7.5 7.3 7.2 7.1
Source: UniCredit Research
Dr. Christian Weber, CFA (UniCredit Bank) +49 89 378-12250 [email protected]
<date>
November 2013 Credit Research
Sector Report Health Care
UniCredit Research page 10 See last pages for disclaimer.
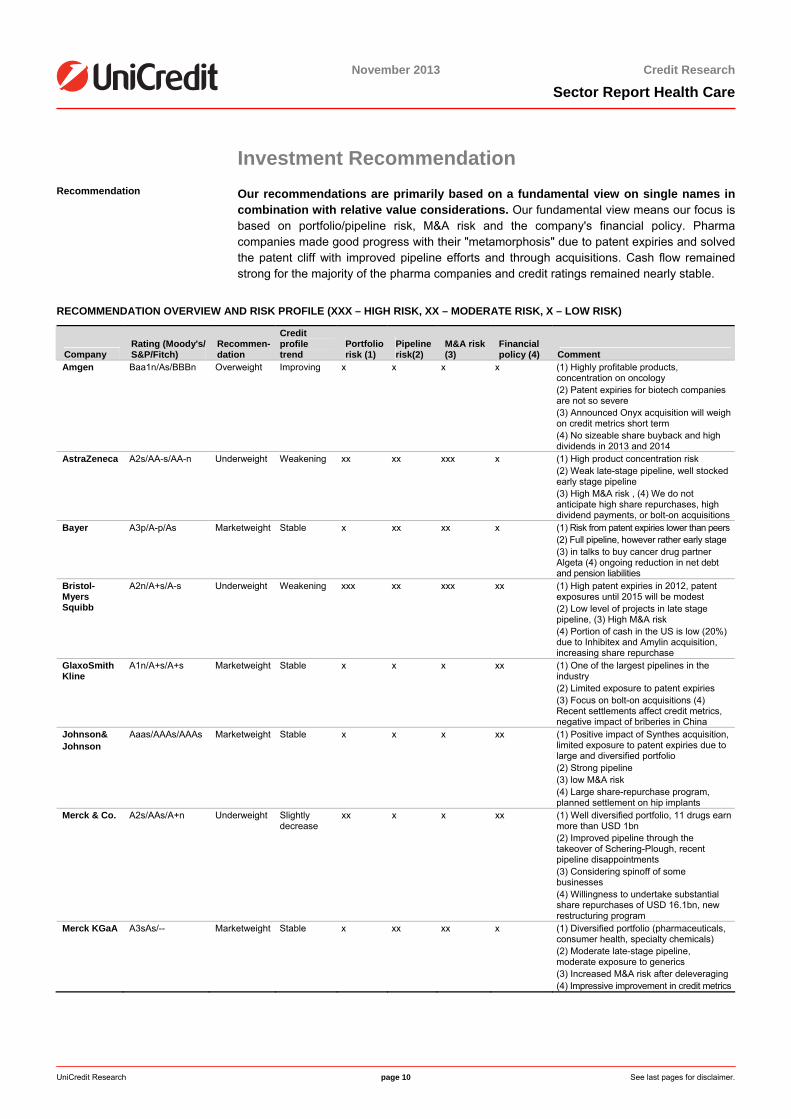
Investment Recommendation Recommendation Our recommendations are primarily based on a fundamental view on single names in
combination with relative value considerations. Our fundamental view means our focus is based on portfolio/pipeline risk, M&A risk and the company's financial policy. Pharmacompanies made good progress with their "metamorphosis" due to patent expiries and solved the patent cliff with improved pipeline efforts and through acquisitions. Cash flow remainedstrong for the majority of the pharma companies and credit ratings remained nearly stable.
RECOMMENDATION OVERVIEW AND RISK PROFILE (XXX – HIGH RISK, XX – MODERATE RISK, X – LOW RISK)
Company Rating (Moody's/ S&P/Fitch)
Recommen- dation
Credit profile trend
Portfoliorisk (1)
Pipelinerisk(2)
M&A risk(3)
Financial policy (4) Comment
Amgen Baa1n/As/BBBn Overweight Improving x x x x (1) Highly profitable products, concentration on oncology (2) Patent expiries for biotech companies are not so severe (3) Announced Onyx acquisition will weigh on credit metrics short term (4) No sizeable share buyback and high dividends in 2013 and 2014
AstraZeneca A2s/AA-s/AA-n Underweight Weakening xx xx xxx x (1) High product concentration risk (2) Weak late-stage pipeline, well stocked early stage pipeline (3) High M&A risk , (4) We do not anticipate high share repurchases, high dividend payments, or bolt-on acquisitions
Bayer A3p/A-p/As Marketweight Stable x xx xx x (1) Risk from patent expiries lower than peers (2) Full pipeline, however rather early stage (3) in talks to buy cancer drug partner Algeta (4) ongoing reduction in net debt and pension liabilities
Bristol-Myers Squibb
A2n/A+s/A-s Underweight Weakening xxx xx xxx xx (1) High patent expiries in 2012, patent exposures until 2015 will be modest (2) Low level of projects in late stage pipeline, (3) High M&A risk (4) Portion of cash in the US is low (20%) due to Inhibitex and Amylin acquisition, increasing share repurchase
GlaxoSmithKline
A1n/A+s/A+s Marketweight Stable x x x xx (1) One of the largest pipelines in the industry (2) Limited exposure to patent expiries (3) Focus on bolt-on acquisitions (4) Recent settlements affect credit metrics, negative impact of briberies in China
Johnson& Johnson
Aaas/AAAs/AAAs Marketweight Stable x x x xx (1) Positive impact of Synthes acquisition, limited exposure to patent expiries due to large and diversified portfolio (2) Strong pipeline (3) low M&A risk (4) Large share-repurchase program, planned settlement on hip implants
Merck & Co. A2s/AAs/A+n Underweight Slightly decrease
xx x x xx (1) Well diversified portfolio, 11 drugs earn more than USD 1bn (2) Improved pipeline through the takeover of Schering-Plough, recent pipeline disappointments (3) Considering spinoff of some businesses (4) Willingness to undertake substantial share repurchases of USD 16.1bn, new restructuring program
Merck KGaA A3sAs/-- Marketweight Stable x xx xx x (1) Diversified portfolio (pharmaceuticals, consumer health, specialty chemicals) (2) Moderate late-stage pipeline, moderate exposure to generics (3) Increased M&A risk after deleveraging (4) Impressive improvement in credit metrics
<date>
November 2013 Credit Research
Sector Report Health Care
UniCredit Research page 11 See last pages for disclaimer.
Company Rating (Moody's/ S&P/Fitch)
Recommen- dation
Credit profile trend
Portfoliorisk (1)
Pipelinerisk(2)
M&A risk(3)
Financial policy (4) Comment
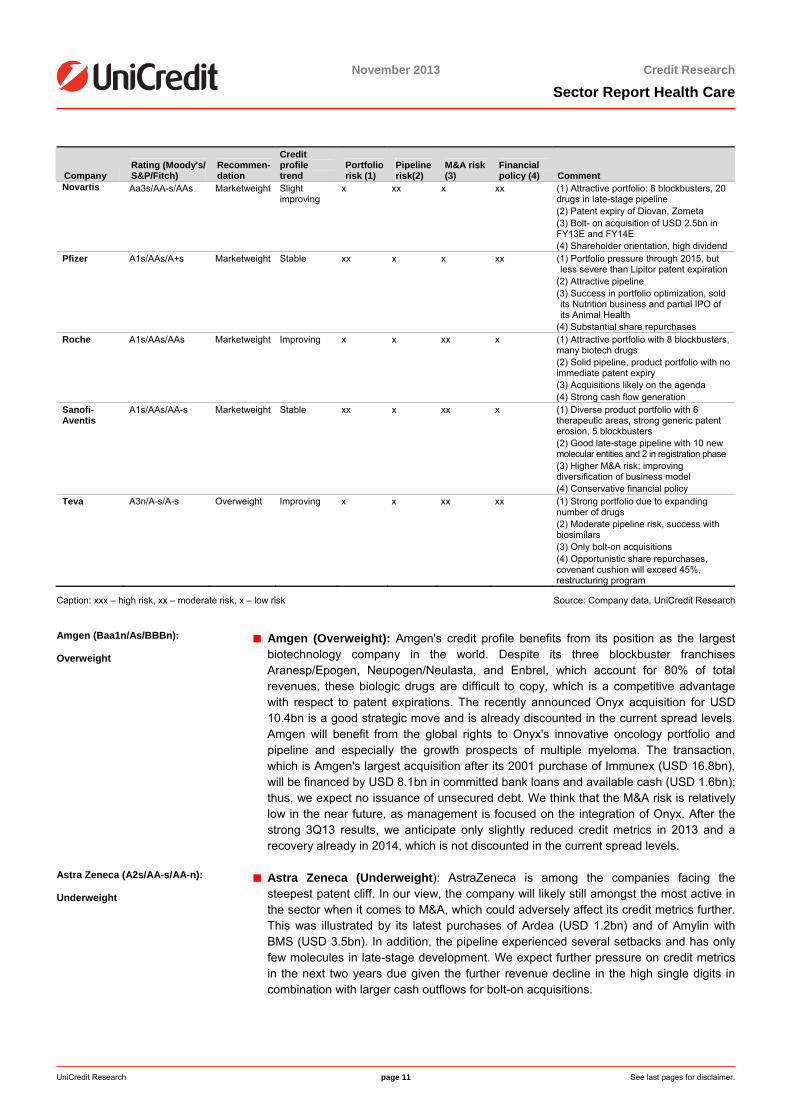
Novartis Aa3s/AA-s/AAs Marketweight Slight improving
x xx x xx (1) Attractive portfolio: 8 blockbusters, 20 drugs in late-stage pipeline (2) Patent expiry of Diovan, Zometa (3) Bolt- on acquisition of USD 2.5bn in FY13E and FY14E (4) Shareholder orientation, high dividend
Pfizer A1s/AAs/A+s Marketweight Stable xx x x xx (1) Portfolio pressure through 2015, but less severe than Lipitor patent expiration
(2) Attractive pipeline (3) Success in portfolio optimization, sold its Nutrition business and partial IPO of its Animal Health
(4) Substantial share repurchases Roche A1s/AAs/AAs Marketweight Improving x x xx x (1) Attractive portfolio with 8 blockbusters,
many biotech drugs (2) Solid pipeline, product portfolio with no immediate patent expiry (3) Acquisitions likely on the agenda (4) Strong cash flow generation
Sanofi-Aventis
A1s/AAs/AA-s Marketweight Stable xx x xx x (1) Diverse product portfolio with 6 therapeutic areas, strong generic patent erosion, 5 blockbusters (2) Good late-stage pipeline with 10 new molecular entities and 2 in registration phase (3) Higher M&A risk; improving diversification of business model (4) Conservative financial policy
Teva A3n/A-s/A-s Overweight Improving x x xx xx (1) Strong portfolio due to expanding number of drugs (2) Moderate pipeline risk, success with biosimilars (3) Only bolt-on acquisitions (4) Opportunistic share repurchases, covenant cushion will exceed 45%, restructuring program
Caption: xxx – high risk, xx – moderate risk, x – low risk Source: Company data, UniCredit Research
Amgen (Baa1n/As/BBBn): Overweight
■ Amgen (Overweight): Amgen's credit profile benefits from its position as the largestbiotechnology company in the world. Despite its three blockbuster franchises Aranesp/Epogen, Neupogen/Neulasta, and Enbrel, which account for 80% of totalrevenues, these biologic drugs are difficult to copy, which is a competitive advantagewith respect to patent expirations. The recently announced Onyx acquisition for USD 10.4bn is a good strategic move and is already discounted in the current spread levels.Amgen will benefit from the global rights to Onyx's innovative oncology portfolio and pipeline and especially the growth prospects of multiple myeloma. The transaction, which is Amgen's largest acquisition after its 2001 purchase of Immunex (USD 16.8bn),will be financed by USD 8.1bn in committed bank loans and available cash (USD 1.6bn);thus, we expect no issuance of unsecured debt. We think that the M&A risk is relatively low in the near future, as management is focused on the integration of Onyx. After thestrong 3Q13 results, we anticipate only slightly reduced credit metrics in 2013 and arecovery already in 2014, which is not discounted in the current spread levels.
Astra Zeneca (A2s/AA-s/AA-n): Underweight
■ Astra Zeneca (Underweight): AstraZeneca is among the companies facing the steepest patent cliff. In our view, the company will likely still amongst the most active inthe sector when it comes to M&A, which could adversely affect its credit metrics further. This was illustrated by its latest purchases of Ardea (USD 1.2bn) and of Amylin withBMS (USD 3.5bn). In addition, the pipeline experienced several setbacks and has onlyfew molecules in late-stage development. We expect further pressure on credit metrics in the next two years due given the further revenue decline in the high single digits incombination with larger cash outflows for bolt-on acquisitions.
<date>
November 2013 Credit Research
Sector Report Health Care
UniCredit Research page 12 See last pages for disclaimer.
Bayer (A3p/A-p/As): Marketweight
■ Bayer (Marketweight): The company benefits from its good business diversification,which balances earnings volatility. Bayer's risk from patent expirations is relatively low inthe short term in comparison to its peers. However, its R&D pipeline in Pharmaceuticals beyond recently launched drugs remains earlier stage and therefore more speculative.There are rumors that Bayer is in early-stage talks to buy its Norwegian cancer drug partner Algeta for NOK 336 a share (EV of around USD 2.4bn, source: Bloomberg, EuroInvestor). In our view, a completely debt-financed transaction would only modestly weaken Bayer's credit metrics and would in a worst case merely pose a risk to the positive outlook shared by Moody's and S&P. In addition, Bayer is suffering from underrepresentation of sales in the US healthcare system where price levels for drugsare more attractive. The cautious view on 2013 results remains mainly due to FXeffects. Bayer expects a negative currency impact on operating profit of EUR 200-250mn. From a credit perspective, the ongoing reduction in net debt and pension liabilities is positive, but already discounted in current spread levels.
Bristol Myers (A2n/A+s/A-s) : Underweight
■ Bristol-Myers (Underweight): Bristol-Myers belongs to the companies with the highest risk of a negative impact on credit metrics due to patent expirations, i.e. Plavix and Avapro. The expected recovery of profits will be only short-lived as the next patent cliff is looming in 2015. To balance the negative impact on financials, the company spent more than USD 7.5bn on M&A in FY12. The largest pharma M&A deal in 2012 was Bristol-Myers Squibb's acquisition of Amylin Pharmaceuticals, valued at USD 6.5bn, albeit halfof the deal was paid for by Astra Zeneca. The company recently confirmed that it is still looking for outside deals, which is also credit negative.
GlaxoSmithKline (A1n/A+s/A+s): Marketweight
■ GlaxoSmithKline (Marketweight): In recent years, Glaxo has increased diversification into new geographic regions and products that are less impacted by patent expiries.Nevertheless, recent bribery allegations in China are impacting GSK heavily, as alternative treatments are available (Novartis, Roche). In terms of patent expirations, the majority has already occurred, and GSK offers an attractive late-stage pipeline. Nevertheless, this is already reflected in the current tight spread levels.
Johnson & Johnson (Aaas/AAAs/AAAs): Marketweight
■ Johnson & Johnson (Marketweight): The company benefits from its large and diversified portfolio. Big generic hits are largely behind the company, and a number ofnew product launches are being rolled out on the pharmaceutical side. The positive impact of the Synthes acquisition is already reflected in the current credit profile with a leverage ratio of 1.0x, which is required for the Aaa rating going forward. J&J increased its 2013 guidance mainly due to the gain on the sale of the equity interest in ElanCorporation. A planned settlement of more than USD 4bn aimed at resolving thousandsof lawsuits over the recalled hip implants is credit negative. Overall, we anticipate stable credit metrics going forward.
Merck & Co (A2s/AAs/A+n): Underweight
■ Merck & Co (Underweight): A key challenge will be to mitigate the ongoing earnings gap due to the US and European patent expiration of Singulair (US: August 2012, majorEuropean markets: February 2013), a once-a-day oral medicine for chronic treatment of asthma and relief of symptoms of allergic rhinitis. Even with good pipeline growth,Merck's top-line growth will fall in the low single-digits. The announcement of the company in April to extend its share repurchase program to USD 16.1bn is creditnegative. Merck intends to use debt issuances to partly repurchase USD 7.5bn worth ofshares until mid-2014. In October 2013, Merck announced a restructuring program focused on R&D, marketing and administrative expenses, to reduce annual opex byUSD 2.5bn by the end of 2015 vs. 2012 levels. However, this should compensate onlypartly for the impact of share repurchases and declining top-line growth.
Merck KGaA (A3sAs/--): Marketweight
■ Merck KGaA (Marketweight): The company has a well-diversified portfolio, with pharmaceuticals, consumer health and specialty chemicals (liquid crystals, pigments).
<date>
November 2013 Credit Research
Sector Report Health Care
UniCredit Research page 13 See last pages for disclaimer.
Due to the focus on biological drugs, the negative impact of generics is limited. Thepipeline saw several setbacks and the potential of the late-stage pipeline is limited. Credit metrics improved after the Millipore acquisition and the company showed animpressive track record in deleveraging. Since its last capital markets day in May 2012,Merck KGaA has focused on cost savings and also indicated potential acquisitions thatmatch its portfolio for 2014. In our view, Merck KGaA has headroom to spend more than EUR 10bn on M&A, while keeping total leverage below 3x (company definition), with US acquisitions for its drug unit being the most likely scenario. The improvement in credit metrics and the risk of potential M&A is discounted in current spread levels.
Novartis (Aa3s/AA-s/AAs): Marketweight
■ Novartis (Marketweight): Novartis remains one of the more stable names in our Pharma coverage. The company has a highly diversified business model with criticalmass in the business segments. Despite the patent expiry of Diovan (hypertension, 15% of sales), Novartis will be able to compensate the loss of sales due to its new drugpipeline (16 drugs in the late-stage pipeline). Novartis is well positioned in its generic business, Sandoz, due to the ability to produce biosimilars, which are difficult to copy. The recently announced disposal of the blood transfusion diagnostics business, which ispart of the Vaccines and Diagnostics division, to Grifols, is credit positive. The company again increased its outlook for 2013 to reflect the lower impact from generic competition but all positive newsflow is already reflected in the tight spread levels.
Pfizer (A1s/AAs/A+s): Marketweight
■ Pfizer (Marketweight): The company has weathered the worst effects of the 2011-2012 Lipitor patent expiration, reducing the impact with significant cost reductions. Goingforward, additional patent expirations will impact earnings but to a lesser extent. Pfizer'shigh share repurchase was mostly funded with asset sales rather than new debt. In2012, the company sold its Nutrition business and performed a partial IPO of its AnimalHealth business. A key area of uncertainty is the timing of biosimilar versions of Enbrelin its drug portfolio, thus upside spread upside potential is limited, in our view.
Roche (A1s/AAs/AAs): Marketweight
■ Roche (Marketweight): Roche is among those pharmaceutical companies that are theleast exposed to patent expiration in the next three years. The company increased itspresence in the biotech industry through Genentech in 2009, which was a good strategic step due to further protection beyond patent expiration dates. Overall, Roche has an attractive late-stage pipeline and eight blockbusters in its current portfolio. We keep our marketweight recommendation in light of the relatively tight spread levels.
Sanofi (A1s/AAs/AA-s): Marketweight
■ Sanofi (Marketweight): Sanofi benefits from its business diversification strategy ingrowth areas and from its improved late-stage pipeline. The growth platform comprises Emerging Markets, Diabetes Solutions, Vaccines, Consumer Health, Innovative Products and Biotech and generated 75% of group sales in 3Q13 and 5.5% growth yoy. Sanofi's three best-selling drugs – Lantus, Plavix and Lovenox – accounted for only around 30% of total sales. With its six therapeutic areas, Sanofi has five blockbusters in its portfolio and 10 new molecular entities in its late-stage pipeline (+2 drugs in theregistration phase), which is more or less average in comparison to its peers. Wehighlight that Sanofi has a conservative financial policy with a payout of EUR 3-3.6bn, and focuses less on share buybacks. Nevertheless, there are rumors about buying back the L'Oreal stake (Bloomberg). In this context, please note that the takeover ofGenzyme in 2011 was also financed with scrip dividend funding. We anticipate stable credit metrics for 2014. The weak 3Q13 results are already reflected in the currentspread levels.
Teva (A3n/A-s/A-s): Overweight
■ Teva (Overweight): Teva offers value versus other A-rated companies such as Pfizer and Bristol Myers due to its leading market position in generics. The record number ofpatent expirations in 2012-2014 will expand the range of generic drugs available.
<date>
November 2013 Credit Research
Sector Report Health Care
UniCredit Research page 14 See last pages for disclaimer.
The focus on high-value products and a better cost structure should offset the potential decline in earnings due to the loss of exclusivity of the multiple sclerosis blockbusterCopaxone (in 2014). In addition, the company will make continued progress in its biosimilars and biotechnology strategy. Teva recently announced an acceleration of its program of USD 2bn in annual cost savings by the end of 2017, compared to theprevious range of USD 1.5-2.0bn. We anticipate an improvement in the credit profile, which is not reflected in the current spread levels.
RECOMMENDATION OVERVIEW OTHERS/ HIGH YIELD AND RISK PROFILE
Company Rating (Moody's/ S&P/Fitch)
Recommen- dation
Credit profile trend
Portfolio-risk (1)
Pipelinerisk (2)
M&A risk (3)
Financial policy (4) Comment
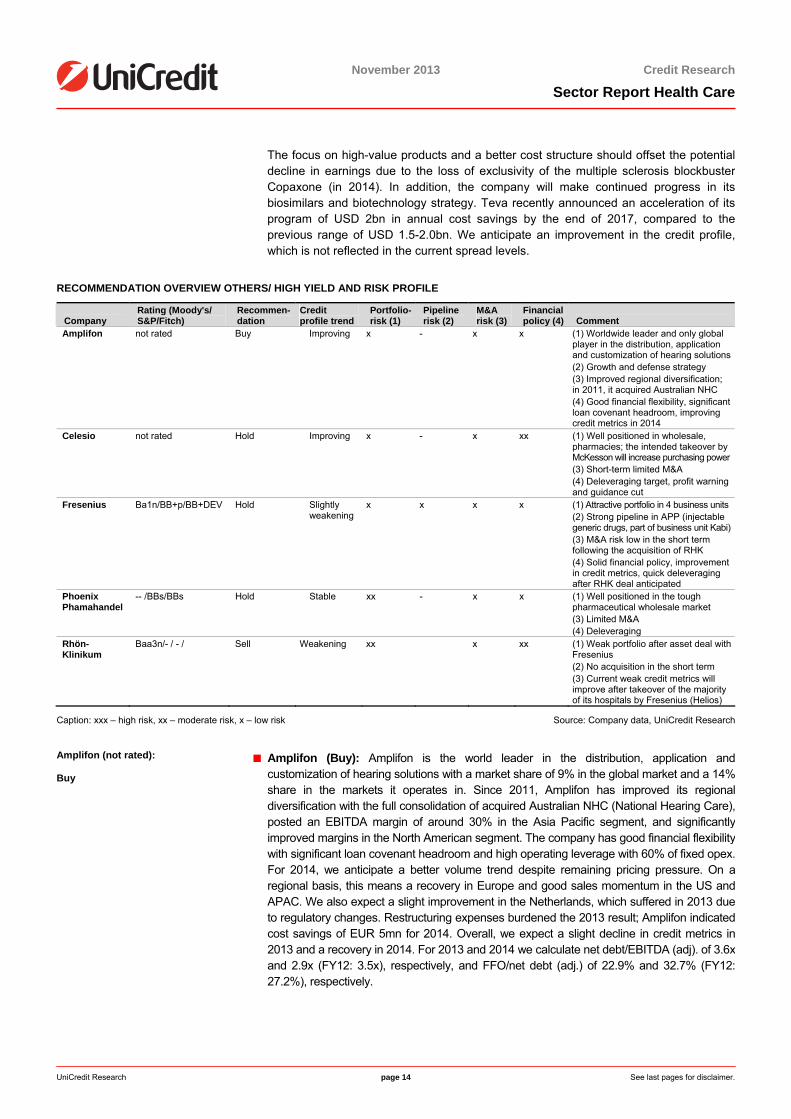
Amplifon not rated Buy Improving x - x x (1) Worldwide leader and only global player in the distribution, application and customization of hearing solutions(2) Growth and defense strategy (3) Improved regional diversification; in 2011, it acquired Australian NHC (4) Good financial flexibility, significant loan covenant headroom, improving credit metrics in 2014
Celesio not rated Hold Improving x - x xx (1) Well positioned in wholesale, pharmacies; the intended takeover by McKesson will increase purchasing power (3) Short-term limited M&A (4) Deleveraging target, profit warning and guidance cut
Fresenius Ba1n/BB+p/BB+DEV Hold Slightly weakening
x x x x (1) Attractive portfolio in 4 business units (2) Strong pipeline in APP (injectable generic drugs, part of business unit Kabi)(3) M&A risk low in the short term following the acquisition of RHK (4) Solid financial policy, improvement in credit metrics, quick deleveraging after RHK deal anticipated
Phoenix Phamahandel
-- /BBs/BBs Hold Stable xx - x x (1) Well positioned in the tough pharmaceutical wholesale market (3) Limited M&A (4) Deleveraging
Rhön-Klinikum
Baa3n/- / - / Sell Weakening xx x xx (1) Weak portfolio after asset deal with Fresenius (2) No acquisition in the short term (3) Current weak credit metrics will improve after takeover of the majority of its hospitals by Fresenius (Helios)
Caption: xxx – high risk, xx – moderate risk, x – low risk Source: Company data, UniCredit Research
Amplifon (not rated): Buy
■ Amplifon (Buy): Amplifon is the world leader in the distribution, application andcustomization of hearing solutions with a market share of 9% in the global market and a 14%share in the markets it operates in. Since 2011, Amplifon has improved its regionaldiversification with the full consolidation of acquired Australian NHC (National Hearing Care), posted an EBITDA margin of around 30% in the Asia Pacific segment, and significantlyimproved margins in the North American segment. The company has good financial flexibilitywith significant loan covenant headroom and high operating leverage with 60% of fixed opex. For 2014, we anticipate a better volume trend despite remaining pricing pressure. On aregional basis, this means a recovery in Europe and good sales momentum in the US andAPAC. We also expect a slight improvement in the Netherlands, which suffered in 2013 due to regulatory changes. Restructuring expenses burdened the 2013 result; Amplifon indicatedcost savings of EUR 5mn for 2014. Overall, we expect a slight decline in credit metrics in2013 and a recovery in 2014. For 2013 and 2014 we calculate net debt/EBITDA (adj). of 3.6x and 2.9x (FY12: 3.5x), respectively, and FFO/net debt (adj.) of 22.9% and 32.7% (FY12:27.2%), respectively.
<date>
November 2013 Credit Research
Sector Report Health Care
UniCredit Research page 15 See last pages for disclaimer.
Celesio (not rated):
Hold
■ Celesio (Hold): Ongoing strong competition in the German wholesale market, austerity measures in many European countries and a negative currency impact weighed on operatingresults. On 24 October 2013, McKesson announced its intention to acquire a 50.01% stake inCelesio held by Franz Haniel & Cie GmbH and made a tender offer to buy the remaining publicly-listed shares and the two convertible bonds. In our view, Celesio, which is not rated, would benefit from the stronger business and financial profile and the IG rating of McKesson.The change-of-control clause of the CLSGR 10/16 and CLSGR 4/17 includes the following (summarized) conditions 1. takeover of > 50%; 2. still no rating for Celesio; 3. opportunity of repayment of the bond (at fixed nominal value), which does not seem attractive forbondholders at current levels. We confirm our hold recommendation on the CLSGR bonds, as spread levels more or less discount a successful takeover of Celesio by McKesson.
Fresenius (Ba1n/BB+p/BB+DEV): Hold
■ Fresenius (Hold) The company has a leading market position in all segments, a high-marginbusiness, a good track record of its latest acquisitions and showed successful portfoliooptimization (the Biotech unit was sold). The main risk for the credit involves potentiallylarge M&A deals, as demonstrated recently by the acquisition of the majority of Rhön Klinikum's (RHK) hospitals for EUR 3.1bn. However, we do not anticipate further big transforming deals in the short term. Fresenius indicated that the asset deal with Rhön-Klinikum will be entirely debt-financed and that it will not assume any of RHK's financial debt (UniCredit estimate: EUR 800mn). On a pro-forma basis, the transaction will be in line with Fresenius's net debt/EBITDA target of 2.5-3.0x (comp. def.) in FY14E; this means that leverage is expected to exceed temporarily 3.0x in FY13E, but will remain below 3.5x. An upgrade by the rating agencies to investment grade, which would be amajor spread driver, seems unlikely in the short term.
Phoenix Pharmahandel (-/BBs/BBs): Hold
■ Phoenix Pharmahandel (Hold): We confirm our hold recommendation on PHARGR issues, despite the challenging situation in the European pharmaceutical markets, givenmanagement's commitment to deleveraging, its conservative financial policy and tight M&A budget. Nevertheless, the wording of the guidance regarding EBITDA in FY13/14 seems more conservative. The company now anticipates a decline in EBITDA, which can only partly be "balanced" by a significant improvement in the financial result.Phoenix aims to compensate some of the negative market impacts by implementing internal measures based on its "PHOENIX FORWARD" program. The target is to reduce costs and increase efficiency. The positive effects from this program will mostlikely arise from fiscal year FY14/15 onwards and should result in EUR 100mn in potential savings in FY15/16. It is credit positive that management underlined that net debt is likely to further decrease due to continued cash generation and that it maintainsits general financial target of net debt to adj. EBITDA (comp. def) of around 3.0x.
Rhön-Klinikum (Baa3n/--/--): Underweight
■ Rhön-Klinikum (Underweight): The proposed transaction of Fresenius taking over 43 hospitals (65% of RHK sales) will significantly reduce RHK's size, making it more of a regional player, which would be credit negative. The operating performance remains subject to the ongoing restructuring of its largest remaining hospital, the University Hospital of Giessen and Marburg, which accounts for more than 50% of post-disposal sales. Moody's already indicated that the business profile of RHK would appear as having non-investment grade characteristics after the disposal.
<date>
November 2013 Credit Research
Sector Report Health Care
UniCredit Research page 16 See last pages for disclaimer.
Trading Ideas Switch idea Roche (A1s/AAs/AAs)
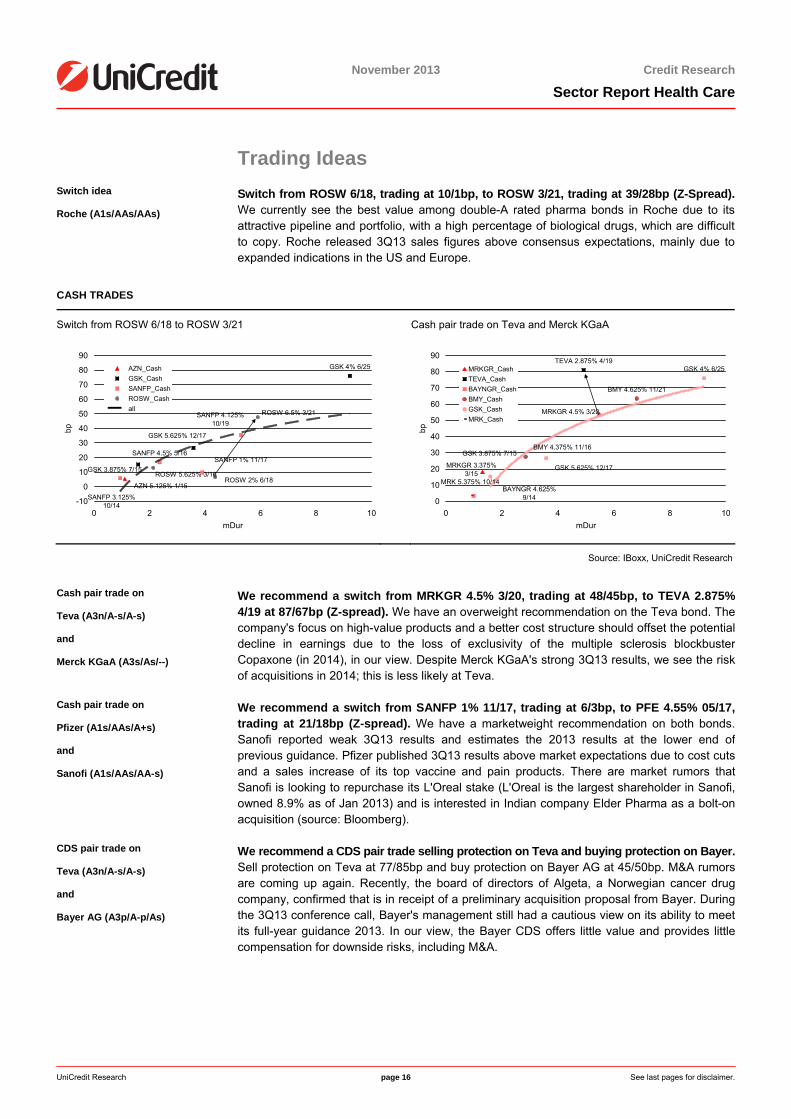
Switch from ROSW 6/18, trading at 10/1bp, to ROSW 3/21, trading at 39/28bp (Z-Spread).We currently see the best value among double-A rated pharma bonds in Roche due to its attractive pipeline and portfolio, with a high percentage of biological drugs, which are difficultto copy. Roche released 3Q13 sales figures above consensus expectations, mainly due toexpanded indications in the US and Europe.
CASH TRADES
Switch from ROSW 6/18 to ROSW 3/21 Cash pair trade on Teva and Merck KGaA
AZN 5.125% 1/15
GSK 4% 6/25
GSK 5.625% 12/17
GSK 3.875% 7/15SANFP 1% 11/17
SANFP 4.125% 10/19
SANFP 4.5% 5/16
SANFP 3.125% 10/14
ROSW 6.5% 3/21
ROSW 2% 6/18ROSW 5.625% 3/16
-10
0
10
20
30
40
50
60
70
80
90
0 2 4 6 8 10mDur
bp
AZN_CashGSK_CashSANFP_CashROSW_Cashall
MRKGR 4.5% 3/20
MRKGR 3.375% 3/15
TEVA 2.875% 4/19
BAYNGR 4.625% 9/14
BMY 4.625% 11/21
BMY 4.375% 11/16
GSK 4% 6/25
GSK 5.625% 12/17
GSK 3.875% 7/15
MRK 5.375% 10/14
0
10
20
30
40
50
60
70
80
90
0 2 4 6 8 10mDur
bp
MRKGR_CashTEVA_CashBAYNGR_CashBMY_CashGSK_CashMRK_Cash
Source: IBoxx, UniCredit Research
Cash pair trade on Teva (A3n/A-s/A-s) and Merck KGaA (A3s/As/--)
We recommend a switch from MRKGR 4.5% 3/20, trading at 48/45bp, to TEVA 2.875% 4/19 at 87/67bp (Z-spread). We have an overweight recommendation on the Teva bond. Thecompany's focus on high-value products and a better cost structure should offset the potentialdecline in earnings due to the loss of exclusivity of the multiple sclerosis blockbusterCopaxone (in 2014), in our view. Despite Merck KGaA's strong 3Q13 results, we see the risk of acquisitions in 2014; this is less likely at Teva.
Cash pair trade on Pfizer (A1s/AAs/A+s) and Sanofi (A1s/AAs/AA-s)
We recommend a switch from SANFP 1% 11/17, trading at 6/3bp, to PFE 4.55% 05/17,trading at 21/18bp (Z-spread). We have a marketweight recommendation on both bonds. Sanofi reported weak 3Q13 results and estimates the 2013 results at the lower end of previous guidance. Pfizer published 3Q13 results above market expectations due to cost cutsand a sales increase of its top vaccine and pain products. There are market rumors thatSanofi is looking to repurchase its L'Oreal stake (L'Oreal is the largest shareholder in Sanofi, owned 8.9% as of Jan 2013) and is interested in Indian company Elder Pharma as a bolt-on acquisition (source: Bloomberg).
CDS pair trade on Teva (A3n/A-s/A-s) and Bayer AG (A3p/A-p/As)
We recommend a CDS pair trade selling protection on Teva and buying protection on Bayer.Sell protection on Teva at 77/85bp and buy protection on Bayer AG at 45/50bp. M&A rumors are coming up again. Recently, the board of directors of Algeta, a Norwegian cancer drug company, confirmed that is in receipt of a preliminary acquisition proposal from Bayer. During the 3Q13 conference call, Bayer's management still had a cautious view on its ability to meet its full-year guidance 2013. In our view, the Bayer CDS offers little value and provides little compensation for downside risks, including M&A.
<date>
November 2013 Credit Research
Sector Report Health Care
UniCredit Research page 17 See last pages for disclaimer.
CASH TRADES AND PAIR TRADES
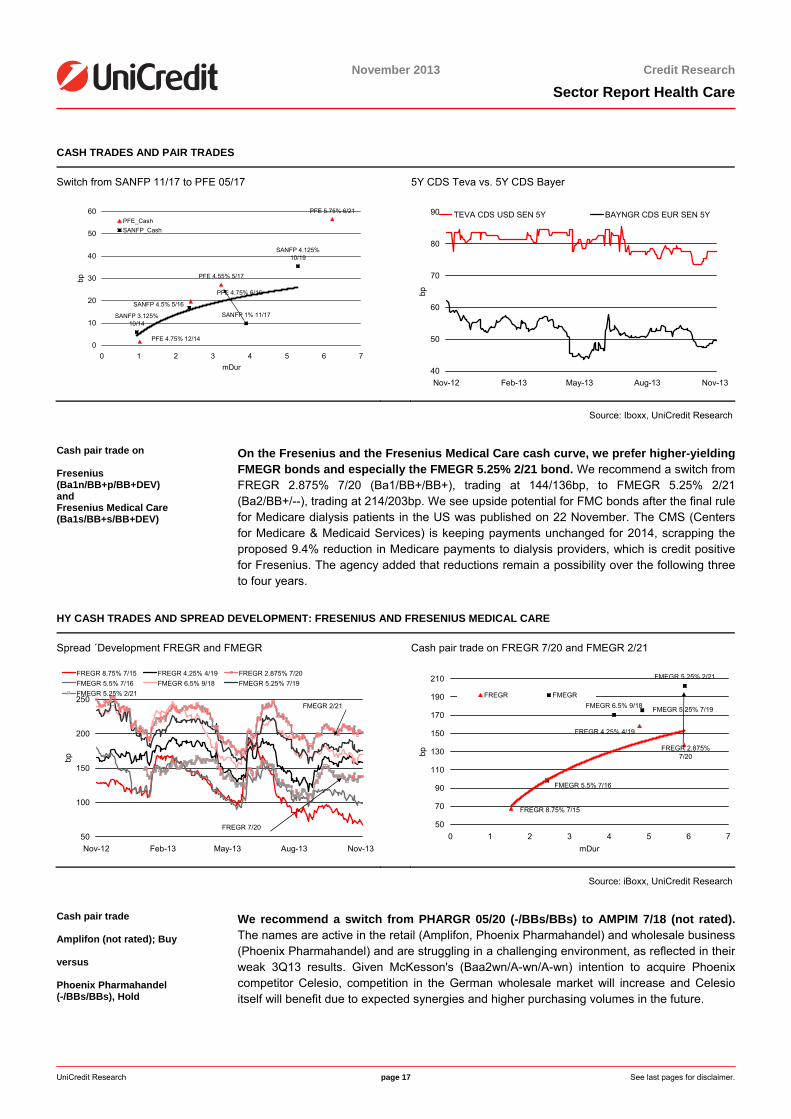
Switch from SANFP 11/17 to PFE 05/17 5Y CDS Teva vs. 5Y CDS Bayer
PFE 5.75% 6/21
PFE 4.55% 5/17
PFE 4.75% 6/16
PFE 4.75% 12/14
SANFP 1% 11/17
SANFP 4.125% 10/19
SANFP 4.5% 5/16
SANFP 3.125% 10/14
0
10
20
30
40
50
60
0 1 2 3 4 5 6 7mDur
bp
PFE_CashSANFP_Cash
40
50
60
70
80
90
Nov-12 Feb-13 May-13 Aug-13 Nov-13
bp
TEVA CDS USD SEN 5Y BAYNGR CDS EUR SEN 5Y
Source: Iboxx, UniCredit Research
Cash pair trade on Fresenius (Ba1n/BB+p/BB+DEV) and Fresenius Medical Care (Ba1s/BB+s/BB+DEV)
On the Fresenius and the Fresenius Medical Care cash curve, we prefer higher-yielding FMEGR bonds and especially the FMEGR 5.25% 2/21 bond. We recommend a switch from FREGR 2.875% 7/20 (Ba1/BB+/BB+), trading at 144/136bp, to FMEGR 5.25% 2/21 (Ba2/BB+/--), trading at 214/203bp. We see upside potential for FMC bonds after the final rulefor Medicare dialysis patients in the US was published on 22 November. The CMS (Centers for Medicare & Medicaid Services) is keeping payments unchanged for 2014, scrapping theproposed 9.4% reduction in Medicare payments to dialysis providers, which is credit positivefor Fresenius. The agency added that reductions remain a possibility over the following threeto four years.
HY CASH TRADES AND SPREAD DEVELOPMENT: FRESENIUS AND FRESENIUS MEDICAL CARE
Spread ´Development FREGR and FMEGR Cash pair trade on FREGR 7/20 and FMEGR 2/21
50
100
150
200
250
Nov-12 Feb-13 May-13 Aug-13 Nov-13
bp
FREGR 8.75% 7/15 FREGR 4.25% 4/19 FREGR 2.875% 7/20FMEGR 5.5% 7/16 FMEGR 6.5% 9/18 FMEGR 5.25% 7/19FMEGR 5.25% 2/21
FMEGR 2/21
FREGR 7/20
FREGR 2.875% 7/20
FREGR 4.25% 4/19
FREGR 8.75% 7/15
FMEGR 5.25% 2/21
FMEGR 5.25% 7/19FMEGR 6.5% 9/18
FMEGR 5.5% 7/16
50
70
90
110
130
150
170
190
210
0 1 2 3 4 5 6 7mDur
bp
FREGR FMEGR
Source: iBoxx, UniCredit Research
Cash pair trade Amplifon (not rated); Buy versus Phoenix Pharmahandel (-/BBs/BBs), Hold
We recommend a switch from PHARGR 05/20 (-/BBs/BBs) to AMPIM 7/18 (not rated). The names are active in the retail (Amplifon, Phoenix Pharmahandel) and wholesale business(Phoenix Pharmahandel) and are struggling in a challenging environment, as reflected in their weak 3Q13 results. Given McKesson's (Baa2wn/A-wn/A-wn) intention to acquire Phoenix competitor Celesio, competition in the German wholesale market will increase and Celesioitself will benefit due to expected synergies and higher purchasing volumes in the future.
<date>
November 2013 Credit Research
Sector Report Health Care
UniCredit Research page 18 See last pages for disclaimer.
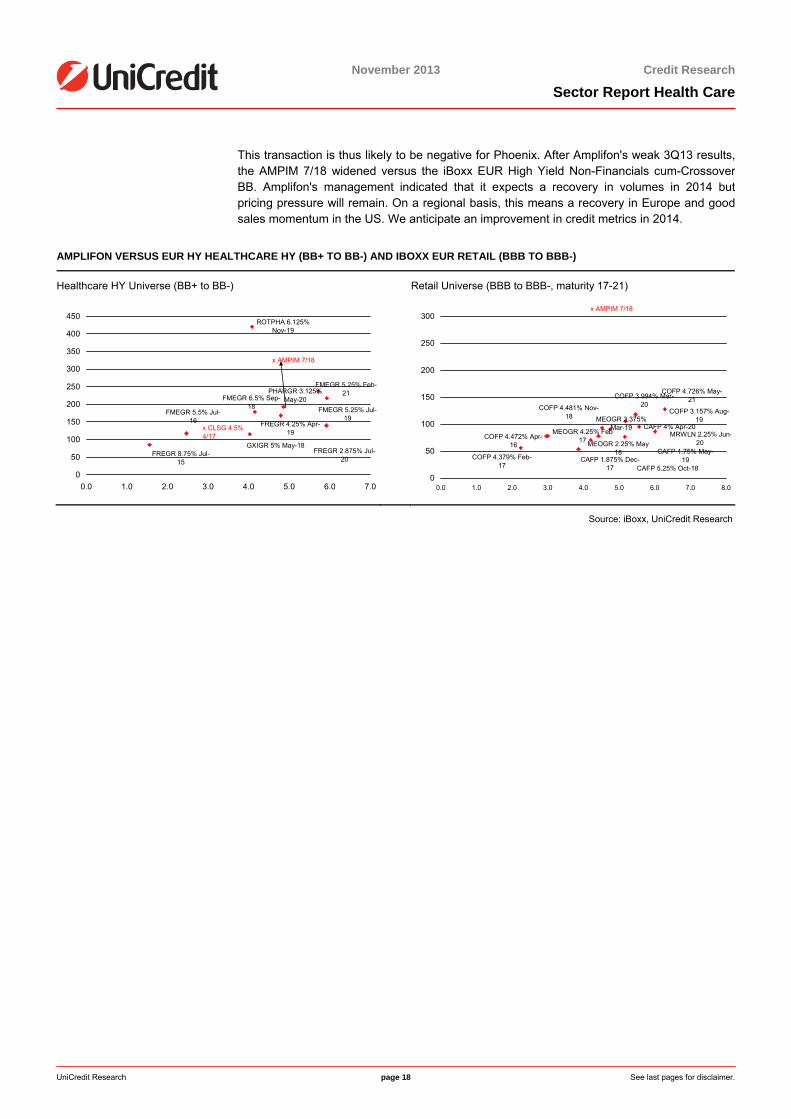
This transaction is thus likely to be negative for Phoenix. After Amplifon's weak 3Q13 results, the AMPIM 7/18 widened versus the iBoxx EUR High Yield Non-Financials cum-Crossover BB. Amplifon's management indicated that it expects a recovery in volumes in 2014 but pricing pressure will remain. On a regional basis, this means a recovery in Europe and good sales momentum in the US. We anticipate an improvement in credit metrics in 2014.
AMPLIFON VERSUS EUR HY HEALTHCARE HY (BB+ TO BB-) AND IBOXX EUR RETAIL (BBB TO BBB-)
Healthcare HY Universe (BB+ to BB-) Retail Universe (BBB to BBB-, maturity 17-21)
ROTPHA 6.125% Nov-19
PHARGR 3.125% May-20
GXIGR 5% May-18FREGR 8.75% Jul-
15
FREGR 4.25% Apr-19
FREGR 2.875% Jul-20
FMEGR 5.5% Jul-16
FMEGR 6.5% Sep-18 FMEGR 5.25% Jul-
19
FMEGR 5.25% Feb-21
0
50
100
150
200
250
300
350
400
450
0.0 1.0 2.0 3.0 4.0 5.0 6.0 7.0
x CLSG 4.5% 4/17
x AMPIM 7/18
MRWLN 2.25% Jun-20
MEOGR 4.25% Feb-17 MEOGR 2.25% May-
18
MEOGR 3.375% Mar-19
COFP 4.472% Apr-16
COFP 4.379% Feb-17
COFP 4.481% Nov-18
COFP 3.157% Aug-19
COFP 3.994% Mar-20
COFP 4.726% May-21
CAFP 1.875% Dec-17 CAFP 5.25% Oct-18
CAFP 1.75% May-19
CAFP 4% Apr-20
0
50
100
150
200
250
300
0.0 1.0 2.0 3.0 4.0 5.0 6.0 7.0 8.0
x AMPIM 7/18
Source: iBoxx, UniCredit Research
<date>
November 2013 Credit Research
Sector Report Health Care
UniCredit Research page 19 See last pages for disclaimer.
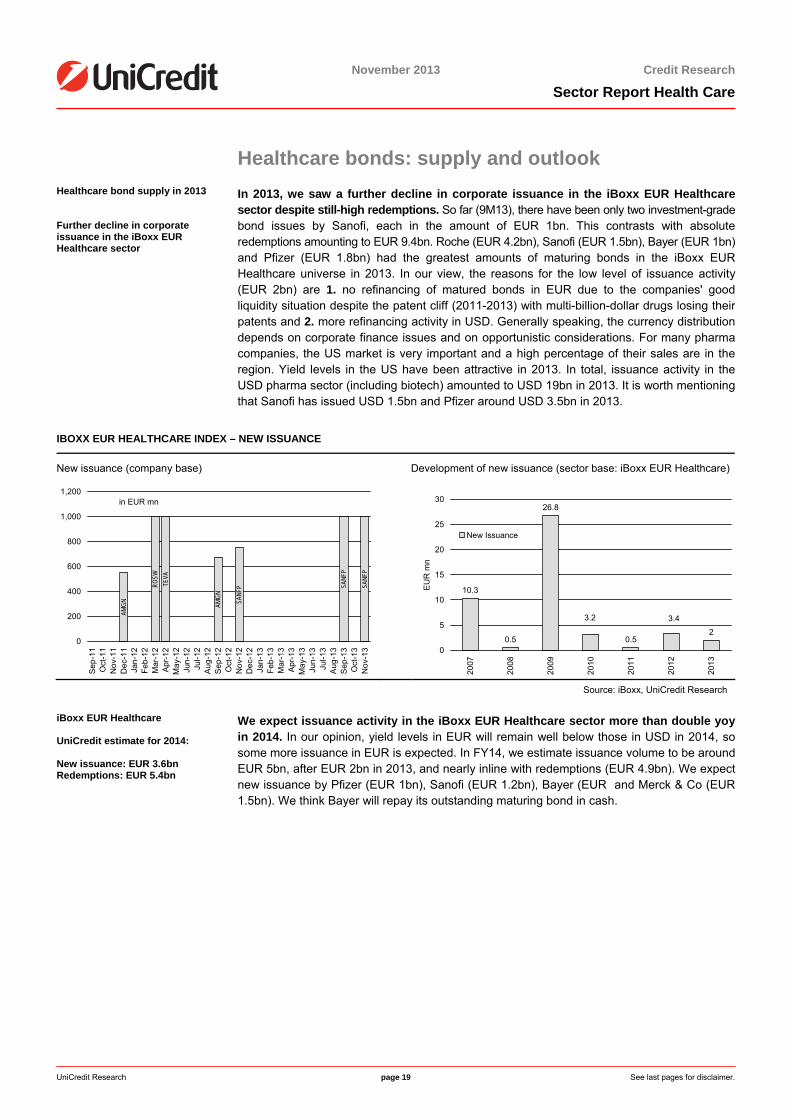
Healthcare bonds: supply and outlook Healthcare bond supply in 2013 Further decline in corporate issuance in the iBoxx EUR Healthcare sector
In 2013, we saw a further decline in corporate issuance in the iBoxx EUR Healthcaresector despite still-high redemptions. So far (9M13), there have been only two investment-gradebond issues by Sanofi, each in the amount of EUR 1bn. This contrasts with absoluteredemptions amounting to EUR 9.4bn. Roche (EUR 4.2bn), Sanofi (EUR 1.5bn), Bayer (EUR 1bn) and Pfizer (EUR 1.8bn) had the greatest amounts of maturing bonds in the iBoxx EURHealthcare universe in 2013. In our view, the reasons for the low level of issuance activity(EUR 2bn) are 1. no refinancing of matured bonds in EUR due to the companies' goodliquidity situation despite the patent cliff (2011-2013) with multi-billion-dollar drugs losing their patents and 2. more refinancing activity in USD. Generally speaking, the currency distribution depends on corporate finance issues and on opportunistic considerations. For many pharmacompanies, the US market is very important and a high percentage of their sales are in theregion. Yield levels in the US have been attractive in 2013. In total, issuance activity in the USD pharma sector (including biotech) amounted to USD 19bn in 2013. It is worth mentioning that Sanofi has issued USD 1.5bn and Pfizer around USD 3.5bn in 2013.
IBOXX EUR HEALTHCARE INDEX – NEW ISSUANCE
New issuance (company base) Development of new issuance (sector base: iBoxx EUR Healthcare)
ROSW
SANF
P
SANF
P
SANF
P
AMGN
AMGN
TEVA
0
200
400
600
800
1,000
1,200
Sep
-11
Oct
-11
Nov
-11
Dec
-11
Jan-
12Fe
b-12
Mar
-12
Apr
-12
May
-12
Jun-
12Ju
l-12
Aug
-12
Sep
-12
Oct
-12
Nov
-12
Dec
-12
Jan-
13Fe
b-13
Mar
-13
Apr
-13
May
-13
Jun-
13Ju
l-13
Aug
-13
Sep
-13
Oct
-13
Nov
-13
in EUR mn
10.3
0.5 0.52
3.2 3.4
26.8
0
5
10
15
20
25
30
2007
2008
2009
2010
2011
2012
2013
EU
R m
n
New Issuance
Source: iBoxx, UniCredit Research
iBoxx EUR Healthcare UniCredit estimate for 2014: New issuance: EUR 3.6bn Redemptions: EUR 5.4bn
We expect issuance activity in the iBoxx EUR Healthcare sector more than double yoy in 2014. In our opinion, yield levels in EUR will remain well below those in USD in 2014, so some more issuance in EUR is expected. In FY14, we estimate issuance volume to be aroundEUR 5bn, after EUR 2bn in 2013, and nearly inline with redemptions (EUR 4.9bn). We expectnew issuance by Pfizer (EUR 1bn), Sanofi (EUR 1.2bn), Bayer (EUR and Merck & Co (EUR 1.5bn). We think Bayer will repay its outstanding maturing bond in cash.
<date>
November 2013 Credit Research
Sector Report Health Care
UniCredit Research page 20 See last pages for disclaimer.
IBOXX EUR HEALTHCARE INDEX – REDEMPTIONS
Development of redemptions (company base)
Development of redemptions (sector base) iBoxx EUR Healthcare versus iBoxx EUR HY Healthcare
PFESA
NFP GS
K
MRKG
R
BAYN
GR
AZN
MRK
0
500
1,000
1,500
2,000
2,500
3,000
Oct
-13
Nov
-13
Dec
-13
Jan-
14Fe
b-14
Mar
-14
Apr
-14
May
-14
Jun-
14Ju
l-14
Aug
-14
Sep
-14
Oct
-14
Nov
-14
Dec
-14
Jan-
15Fe
b-15
Mar
-15
Apr
-15
May
-15
Jun-
15Ju
l-15
Aug
-15
Sep
-15
Oct
-15
Nov
-15
EU
R m
n
0
2,000
4,000
6,000
8,000
10,000
12,000
2006
2007
2008
2009
2010
2011
2012
2013
2014
2015
2016
2017
2018
2019
2020
2021
2022
2023
2024
2025
EU
R m
n
HCA HCA HY
Source: iBoxx, UniCredit Research
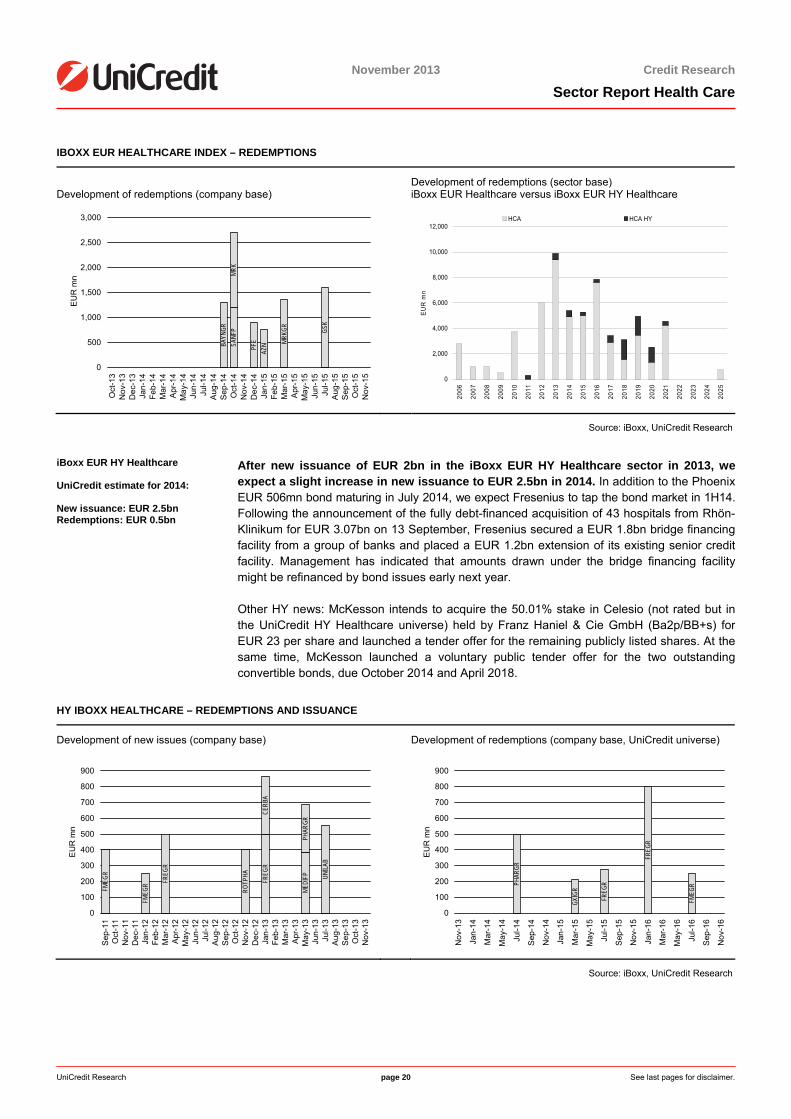
iBoxx EUR HY Healthcare UniCredit estimate for 2014: New issuance: EUR 2.5bn Redemptions: EUR 0.5bn
After new issuance of EUR 2bn in the iBoxx EUR HY Healthcare sector in 2013, we expect a slight increase in new issuance to EUR 2.5bn in 2014. In addition to the Phoenix EUR 506mn bond maturing in July 2014, we expect Fresenius to tap the bond market in 1H14. Following the announcement of the fully debt-financed acquisition of 43 hospitals from Rhön-Klinikum for EUR 3.07bn on 13 September, Fresenius secured a EUR 1.8bn bridge financing facility from a group of banks and placed a EUR 1.2bn extension of its existing senior creditfacility. Management has indicated that amounts drawn under the bridge financing facility might be refinanced by bond issues early next year.
Other HY news: McKesson intends to acquire the 50.01% stake in Celesio (not rated but inthe UniCredit HY Healthcare universe) held by Franz Haniel & Cie GmbH (Ba2p/BB+s) for EUR 23 per share and launched a tender offer for the remaining publicly listed shares. At thesame time, McKesson launched a voluntary public tender offer for the two outstandingconvertible bonds, due October 2014 and April 2018.
HY IBOXX HEALTHCARE – REDEMPTIONS AND ISSUANCE
Development of new issues (company base) Development of redemptions (company base, UniCredit universe)
FREG
R
FREG
R
FMEG
RFMEG
R UNILA
B
ROTP
HA
MEDI
FP
CERB
A
PHAR
GR
0
100
200
300
400
500
600
700
800
900
Sep
-11
Oct
-11
Nov
-11
Dec
-11
Jan-
12Fe
b-12
Mar
-12
Apr
-12
May
-12
Jun-
12Ju
l-12
Aug
-12
Sep
-12
Oct
-12
Nov
-12
Dec
-12
Jan-
13Fe
b-13
Mar
-13
Apr
-13
May
-13
Jun-
13Ju
l-13
Aug
-13
Sep
-13
Oct
-13
Nov
-13
EU
R m
n
FREG
R
FREG
R
FMEG
RPHAR
GR
GXIG
R
0
100
200
300
400
500
600
700
800
900
Nov
-13
Jan-
14
Mar
-14
May
-14
Jul-1
4
Sep
-14
Nov
-14
Jan-
15
Mar
-15
May
-15
Jul-1
5
Sep
-15
Nov
-15
Jan-
16
Mar
-16
May
-16
Jul-1
6
Sep
-16
Nov
-16
EU
R m
n
Source: iBoxx, UniCredit Research
<date>
November 2013 Credit Research
Sector Report Health Care
UniCredit Research page 21 See last pages for disclaimer.
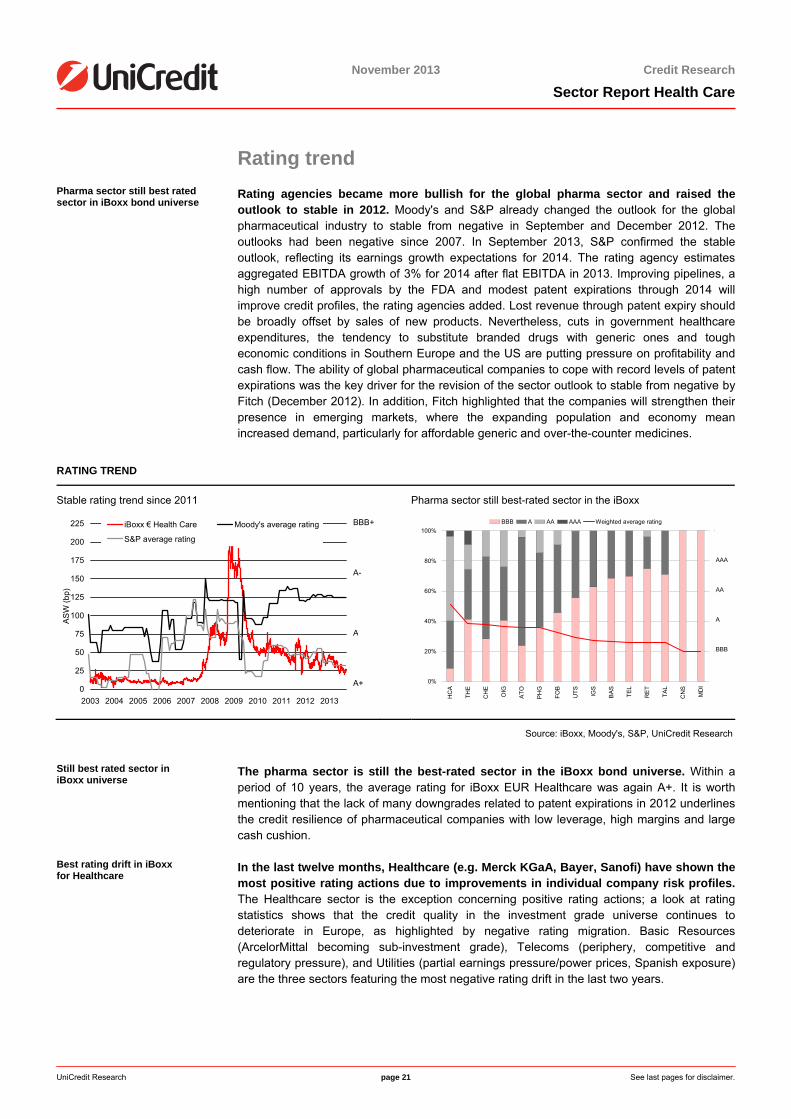
Rating trend Pharma sector still best rated sector in iBoxx bond universe
Rating agencies became more bullish for the global pharma sector and raised the outlook to stable in 2012. Moody's and S&P already changed the outlook for the globalpharmaceutical industry to stable from negative in September and December 2012. The outlooks had been negative since 2007. In September 2013, S&P confirmed the stableoutlook, reflecting its earnings growth expectations for 2014. The rating agency estimatesaggregated EBITDA growth of 3% for 2014 after flat EBITDA in 2013. Improving pipelines, a high number of approvals by the FDA and modest patent expirations through 2014 willimprove credit profiles, the rating agencies added. Lost revenue through patent expiry shouldbe broadly offset by sales of new products. Nevertheless, cuts in government healthcare expenditures, the tendency to substitute branded drugs with generic ones and tougheconomic conditions in Southern Europe and the US are putting pressure on profitability andcash flow. The ability of global pharmaceutical companies to cope with record levels of patent expirations was the key driver for the revision of the sector outlook to stable from negative byFitch (December 2012). In addition, Fitch highlighted that the companies will strengthen theirpresence in emerging markets, where the expanding population and economy mean increased demand, particularly for affordable generic and over-the-counter medicines.
RATING TREND
Stable rating trend since 2011 Pharma sector still best-rated sector in the iBoxx
0
25
50
75
100
125
150
175
200
225
2003 2004 2005 2006 2007 2008 2009 2010 2011 2012 2013
AS
W (b
p)
4
5
6
7iBoxx € Health Care Moody's average rating
S&P average rating
BBB+
A-
A
A+
0%
20%
40%
60%
80%
100%
HC
A
THE
CH
E
OIG
ATO
PHG
FOB
UTS IG
S
BAS TE
L
RE
T
TAL
CN
S
MD
I
0
1
2
3
4
5
BBB A AA AAA Weighted average rating
AAA
AA
A
BBB
Source: iBoxx, Moody's, S&P, UniCredit Research
Still best rated sector in iBoxx universe
The pharma sector is still the best-rated sector in the iBoxx bond universe. Within a period of 10 years, the average rating for iBoxx EUR Healthcare was again A+. It is worth mentioning that the lack of many downgrades related to patent expirations in 2012 underlinesthe credit resilience of pharmaceutical companies with low leverage, high margins and largecash cushion.
Best rating drift in iBoxx for Healthcare
In the last twelve months, Healthcare (e.g. Merck KGaA, Bayer, Sanofi) have shown themost positive rating actions due to improvements in individual company risk profiles.The Healthcare sector is the exception concerning positive rating actions; a look at rating statistics shows that the credit quality in the investment grade universe continues todeteriorate in Europe, as highlighted by negative rating migration. Basic Resources (ArcelorMittal becoming sub-investment grade), Telecoms (periphery, competitive andregulatory pressure), and Utilities (partial earnings pressure/power prices, Spanish exposure)are the three sectors featuring the most negative rating drift in the last two years.
<date>
November 2013 Credit Research
Sector Report Health Care
UniCredit Research page 22 See last pages for disclaimer.
RATING TREND IBOXX NON-FINANCIALS (REGIONAL AND SECTOR PERSPECTIVE)
Long-term rating drift of iBoxx Non-Financials, still largely negative in FY13 YTD
iBoxx Non-Financials: 1-year rating drift by sector
-1
-0.8
-0.6
-0.4
-0.2
0
0.2
0.4
2013YTD201220112010200920082007
Western EuropeItalySpain
PHGF OB
CHETAL
OIGA TO
IGSRET
BASN FI
TELU TS
THEHCA
-0.8 -0.6 -0.4 -0.2 0 0.2 0.4 0.6 0.8
Note: + upgrade, - downgrade Source: iBoxx, Moody's, S&P, UniCredit Research
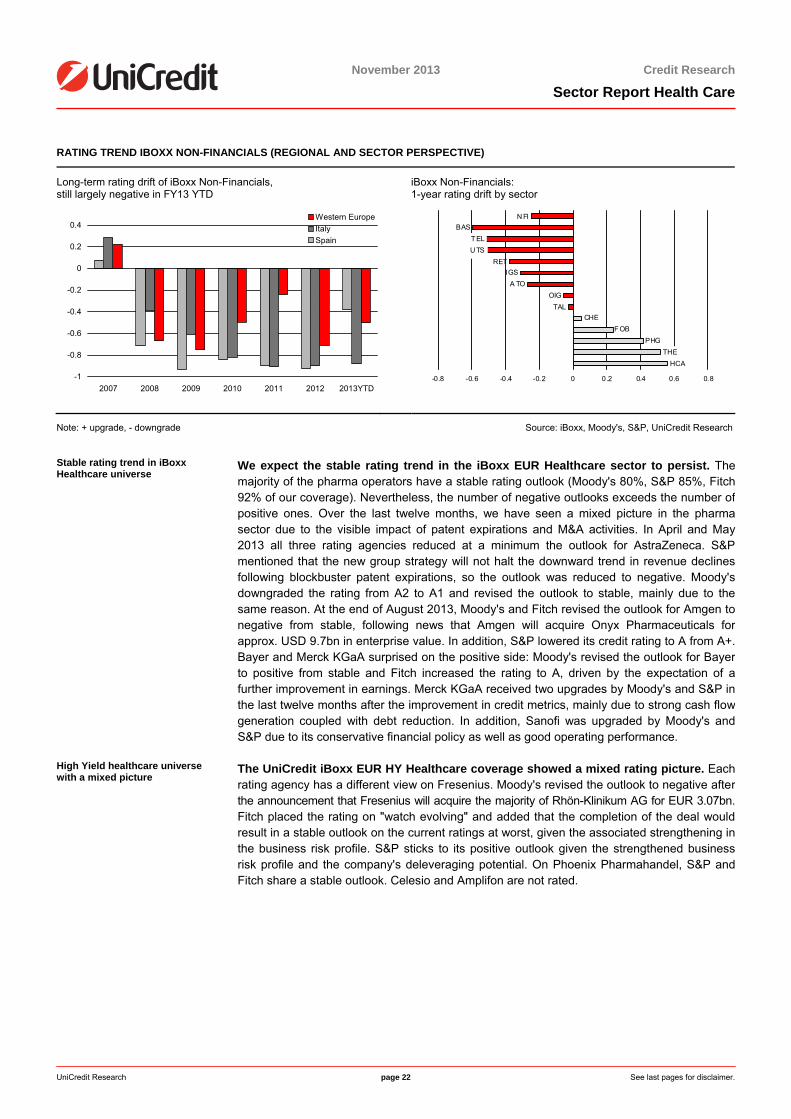
Stable rating trend in iBoxx Healthcare universe
We expect the stable rating trend in the iBoxx EUR Healthcare sector to persist. The majority of the pharma operators have a stable rating outlook (Moody's 80%, S&P 85%, Fitch92% of our coverage). Nevertheless, the number of negative outlooks exceeds the number of positive ones. Over the last twelve months, we have seen a mixed picture in the pharmasector due to the visible impact of patent expirations and M&A activities. In April and May2013 all three rating agencies reduced at a minimum the outlook for AstraZeneca. S&P mentioned that the new group strategy will not halt the downward trend in revenue declinesfollowing blockbuster patent expirations, so the outlook was reduced to negative. Moody'sdowngraded the rating from A2 to A1 and revised the outlook to stable, mainly due to the same reason. At the end of August 2013, Moody's and Fitch revised the outlook for Amgen tonegative from stable, following news that Amgen will acquire Onyx Pharmaceuticals forapprox. USD 9.7bn in enterprise value. In addition, S&P lowered its credit rating to A from A+. Bayer and Merck KGaA surprised on the positive side: Moody's revised the outlook for Bayerto positive from stable and Fitch increased the rating to A, driven by the expectation of afurther improvement in earnings. Merck KGaA received two upgrades by Moody's and S&P inthe last twelve months after the improvement in credit metrics, mainly due to strong cash flowgeneration coupled with debt reduction. In addition, Sanofi was upgraded by Moody's andS&P due to its conservative financial policy as well as good operating performance.
High Yield healthcare universe with a mixed picture
The UniCredit iBoxx EUR HY Healthcare coverage showed a mixed rating picture. Each rating agency has a different view on Fresenius. Moody's revised the outlook to negative after the announcement that Fresenius will acquire the majority of Rhön-Klinikum AG for EUR 3.07bn. Fitch placed the rating on "watch evolving" and added that the completion of the deal wouldresult in a stable outlook on the current ratings at worst, given the associated strengthening inthe business risk profile. S&P sticks to its positive outlook given the strengthened businessrisk profile and the company's deleveraging potential. On Phoenix Pharmahandel, S&P and Fitch share a stable outlook. Celesio and Amplifon are not rated.
<date>
November 2013 Credit Research
Sector Report Health Care
UniCredit Research page 23 See last pages for disclaimer.
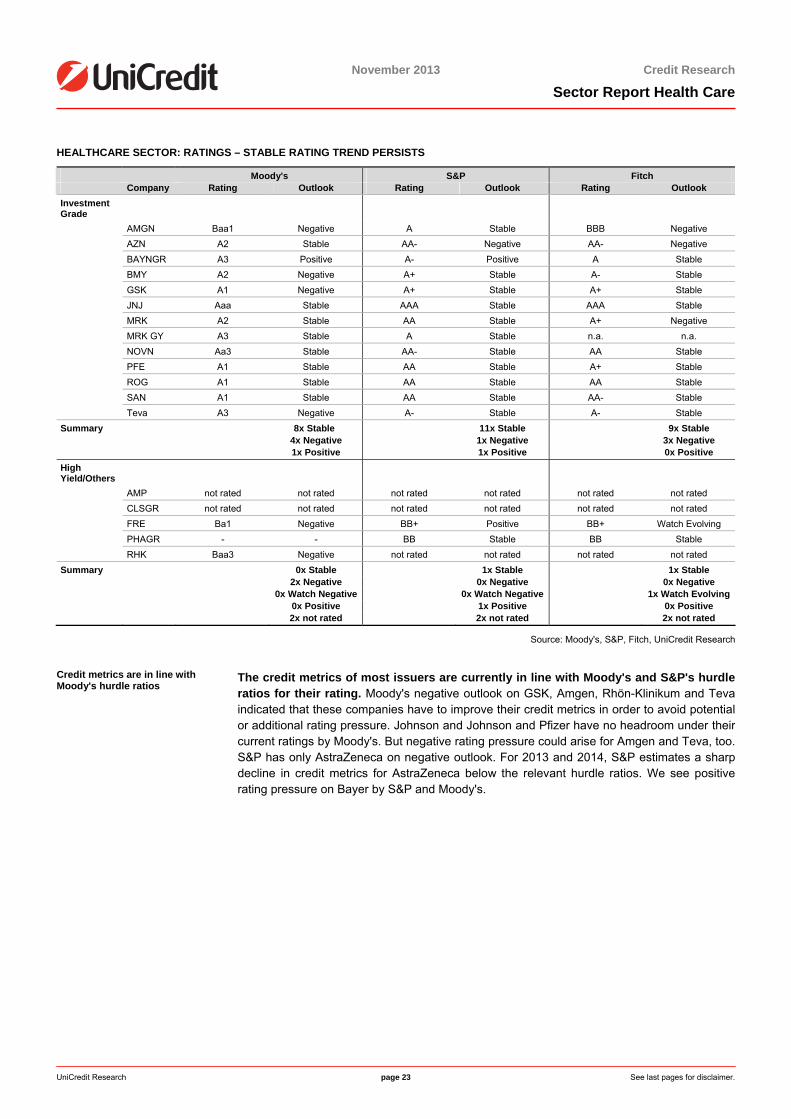
HEALTHCARE SECTOR: RATINGS – STABLE RATING TREND PERSISTS
Moody's S&P Fitch Company Rating Outlook Rating Outlook Rating Outlook Investment Grade
AMGN Baa1 Negative A Stable BBB Negative AZN A2 Stable AA- Negative AA- Negative BAYNGR A3 Positive A- Positive A Stable BMY A2 Negative A+ Stable A- Stable GSK A1 Negative A+ Stable A+ Stable JNJ Aaa Stable AAA Stable AAA Stable MRK A2 Stable AA Stable A+ Negative MRK GY A3 Stable A Stable n.a. n.a. NOVN Aa3 Stable AA- Stable AA Stable PFE A1 Stable AA Stable A+ Stable ROG A1 Stable AA Stable AA Stable SAN A1 Stable AA Stable AA- Stable Teva A3 Negative A- Stable A- Stable Summary 8x Stable 11x Stable 9x Stable 4x Negative 1x Negative 3x Negative 1x Positive 1x Positive 0x Positive High Yield/Others
AMP not rated not rated not rated not rated not rated not rated CLSGR not rated not rated not rated not rated not rated not rated FRE Ba1 Negative BB+ Positive BB+ Watch Evolving PHAGR - - BB Stable BB Stable RHK Baa3 Negative not rated not rated not rated not rated Summary 0x Stable 1x Stable 1x Stable 2x Negative 0x Negative 0x Negative 0x Watch Negative 0x Watch Negative 1x Watch Evolving 0x Positive 1x Positive 0x Positive 2x not rated 2x not rated 2x not rated
Source: Moody's, S&P, Fitch, UniCredit Research
Credit metrics are in line with Moody's hurdle ratios
The credit metrics of most issuers are currently in line with Moody's and S&P's hurdleratios for their rating. Moody's negative outlook on GSK, Amgen, Rhön-Klinikum and Teva indicated that these companies have to improve their credit metrics in order to avoid potentialor additional rating pressure. Johnson and Johnson and Pfizer have no headroom under theircurrent ratings by Moody's. But negative rating pressure could arise for Amgen and Teva, too. S&P has only AstraZeneca on negative outlook. For 2013 and 2014, S&P estimates a sharp decline in credit metrics for AstraZeneca below the relevant hurdle ratios. We see positiverating pressure on Bayer by S&P and Moody's.
<date>
November 2013 Credit Research
Sector Report Health Care
UniCredit Research page 24 See last pages for disclaimer.
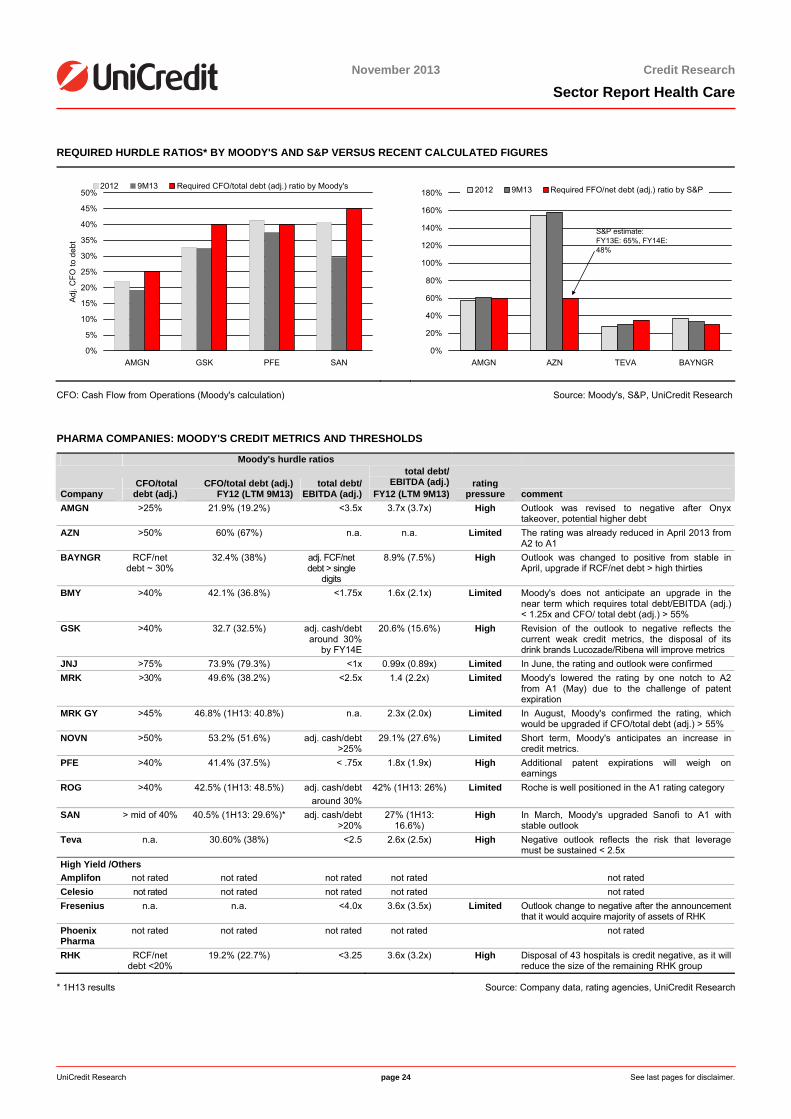
REQUIRED HURDLE RATIOS* BY MOODY'S AND S&P VERSUS RECENT CALCULATED FIGURES
0%
5%
10%
15%
20%
25%
30%
35%
40%
45%
50%
AMGN GSK PFE SAN
Adj
. CFO
to d
ebt
2012 9M13 Required CFO/total debt (adj.) ratio by Moody's
0%
20%
40%
60%
80%
100%
120%
140%
160%
180%
AMGN AZN TEVA BAYNGR
2012 9M13 Required FFO/net debt (adj.) ratio by S&P
S&P estimate:FY13E: 65%, FY14E: 48%
CFO: Cash Flow from Operations (Moody's calculation) Source: Moody's, S&P, UniCredit Research
PHARMA COMPANIES: MOODY'S CREDIT METRICS AND THRESHOLDS
Moody's hurdle ratios
Company CFO/total
debt (adj.) CFO/total debt (adj.)
FY12 (LTM 9M13) total debt/
EBITDA (adj.)
total debt/EBITDA (adj.)
FY12 (LTM 9M13) rating
pressure comment AMGN >25% 21.9% (19.2%) <3.5x 3.7x (3.7x) High Outlook was revised to negative after Onyx
takeover, potential higher debt AZN >50% 60% (67%) n.a. n.a. Limited The rating was already reduced in April 2013 from
A2 to A1 BAYNGR RCF/net
debt ~ 30% 32.4% (38%) adj. FCF/net
debt > single digits
8.9% (7.5%) High Outlook was changed to positive from stable in April, upgrade if RCF/net debt > high thirties
BMY >40% 42.1% (36.8%) <1.75x 1.6x (2.1x) Limited Moody's does not anticipate an upgrade in the near term which requires total debt/EBITDA (adj.) < 1.25x and CFO/ total debt (adj.) > 55%
GSK >40% 32.7 (32.5%) adj. cash/debt around 30%
by FY14E
20.6% (15.6%) High Revision of the outlook to negative reflects the current weak credit metrics, the disposal of its drink brands Lucozade/Ribena will improve metrics
JNJ >75% 73.9% (79.3%) <1x 0.99x (0.89x) Limited In June, the rating and outlook were confirmed MRK >30% 49.6% (38.2%) <2.5x 1.4 (2.2x) Limited Moody's lowered the rating by one notch to A2
from A1 (May) due to the challenge of patent expiration
MRK GY >45% 46.8% (1H13: 40.8%) n.a. 2.3x (2.0x) Limited In August, Moody's confirmed the rating, which would be upgraded if CFO/total debt (adj.) > 55%
NOVN >50% 53.2% (51.6%) adj. cash/debt >25%
29.1% (27.6%) Limited Short term, Moody's anticipates an increase in credit metrics.
PFE >40% 41.4% (37.5%) < .75x 1.8x (1.9x) High Additional patent expirations will weigh on earnings
ROG >40% 42.5% (1H13: 48.5%) adj. cash/debt around 30%
42% (1H13: 26%) Limited Roche is well positioned in the A1 rating category
SAN > mid of 40% 40.5% (1H13: 29.6%)* adj. cash/debt >20%
27% (1H13: 16.6%)
High In March, Moody's upgraded Sanofi to A1 with stable outlook
Teva n.a. 30.60% (38%) <2.5 2.6x (2.5x) High Negative outlook reflects the risk that leverage must be sustained < 2.5x
High Yield /Others Amplifon not rated not rated not rated not rated not rated Celesio not rated not rated not rated not rated not rated Fresenius n.a. n.a. <4.0x 3.6x (3.5x) Limited Outlook change to negative after the announcement
that it would acquire majority of assets of RHK Phoenix Pharma
not rated not rated not rated not rated not rated
RHK RCF/net debt <20%
19.2% (22.7%) <3.25 3.6x (3.2x) High Disposal of 43 hospitals is credit negative, as it will reduce the size of the remaining RHK group
* 1H13 results Source: Company data, rating agencies, UniCredit Research
<date>
November 2013 Credit Research
Sector Report Health Care
UniCredit Research page 25 See last pages for disclaimer.
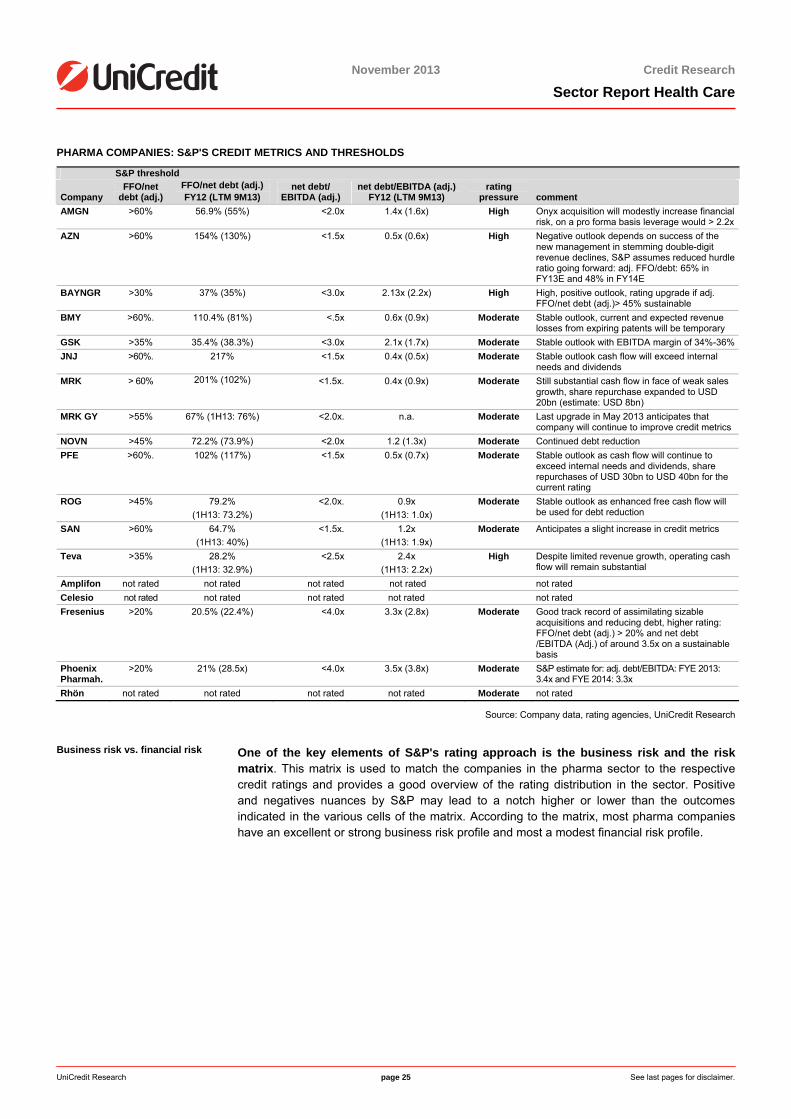
PHARMA COMPANIES: S&P'S CREDIT METRICS AND THRESHOLDS
S&P threshold
Company FFO/net
debt (adj.) FFO/net debt (adj.) FY12 (LTM 9M13)
net debt/ EBITDA (adj.)
net debt/EBITDA (adj.) FY12 (LTM 9M13)
rating pressure comment
AMGN >60% 56.9% (55%) <2.0x 1.4x (1.6x) High Onyx acquisition will modestly increase financial risk, on a pro forma basis leverage would > 2.2x
AZN >60% 154% (130%) <1.5x 0.5x (0.6x) High Negative outlook depends on success of the new management in stemming double-digit revenue declines, S&P assumes reduced hurdle ratio going forward: adj. FFO/debt: 65% in FY13E and 48% in FY14E
BAYNGR >30% 37% (35%) <3.0x 2.13x (2.2x) High High, positive outlook, rating upgrade if adj. FFO/net debt (adj.)> 45% sustainable
BMY >60%. 110.4% (81%) <.5x 0.6x (0.9x) Moderate Stable outlook, current and expected revenue losses from expiring patents will be temporary
GSK >35% 35.4% (38.3%) <3.0x 2.1x (1.7x) Moderate Stable outlook with EBITDA margin of 34%-36%JNJ >60%. 217% <1.5x 0.4x (0.5x) Moderate Stable outlook cash flow will exceed internal
needs and dividends MRK > 60% 201% (102%) <1.5x. 0.4x (0.9x) Moderate Still substantial cash flow in face of weak sales
growth, share repurchase expanded to USD 20bn (estimate: USD 8bn)
MRK GY >55% 67% (1H13: 76%) <2.0x. n.a. Moderate Last upgrade in May 2013 anticipates that company will continue to improve credit metrics
NOVN >45% 72.2% (73.9%) <2.0x 1.2 (1.3x) Moderate Continued debt reduction PFE >60%. 102% (117%) <1.5x 0.5x (0.7x) Moderate Stable outlook as cash flow will continue to
exceed internal needs and dividends, share repurchases of USD 30bn to USD 40bn for the current rating
ROG >45% 79.2% (1H13: 73.2%)
<2.0x. 0.9x (1H13: 1.0x)
Moderate Stable outlook as enhanced free cash flow will be used for debt reduction
SAN >60% 64.7% (1H13: 40%)
<1.5x. 1.2x (1H13: 1.9x)
Moderate Anticipates a slight increase in credit metrics
Teva >35% 28.2% (1H13: 32.9%)
<2.5x 2.4x (1H13: 2.2x)
High Despite limited revenue growth, operating cash flow will remain substantial
Amplifon not rated not rated not rated not rated not rated Celesio not rated not rated not rated not rated not rated Fresenius >20% 20.5% (22.4%) <4.0x 3.3x (2.8x) Moderate Good track record of assimilating sizable
acquisitions and reducing debt, higher rating: FFO/net debt (adj.) > 20% and net debt /EBITDA (Adj.) of around 3.5x on a sustainable basis
Phoenix Pharmah.
>20% 21% (28.5x) <4.0x 3.5x (3.8x) Moderate S&P estimate for: adj. debt/EBITDA: FYE 2013: 3.4x and FYE 2014: 3.3x
Rhön not rated not rated not rated not rated Moderate not rated
Source: Company data, rating agencies, UniCredit Research
Business risk vs. financial risk One of the key elements of S&P's rating approach is the business risk and the riskmatrix. This matrix is used to match the companies in the pharma sector to the respective credit ratings and provides a good overview of the rating distribution in the sector. Positiveand negatives nuances by S&P may lead to a notch higher or lower than the outcomesindicated in the various cells of the matrix. According to the matrix, most pharma companies have an excellent or strong business risk profile and most a modest financial risk profile.
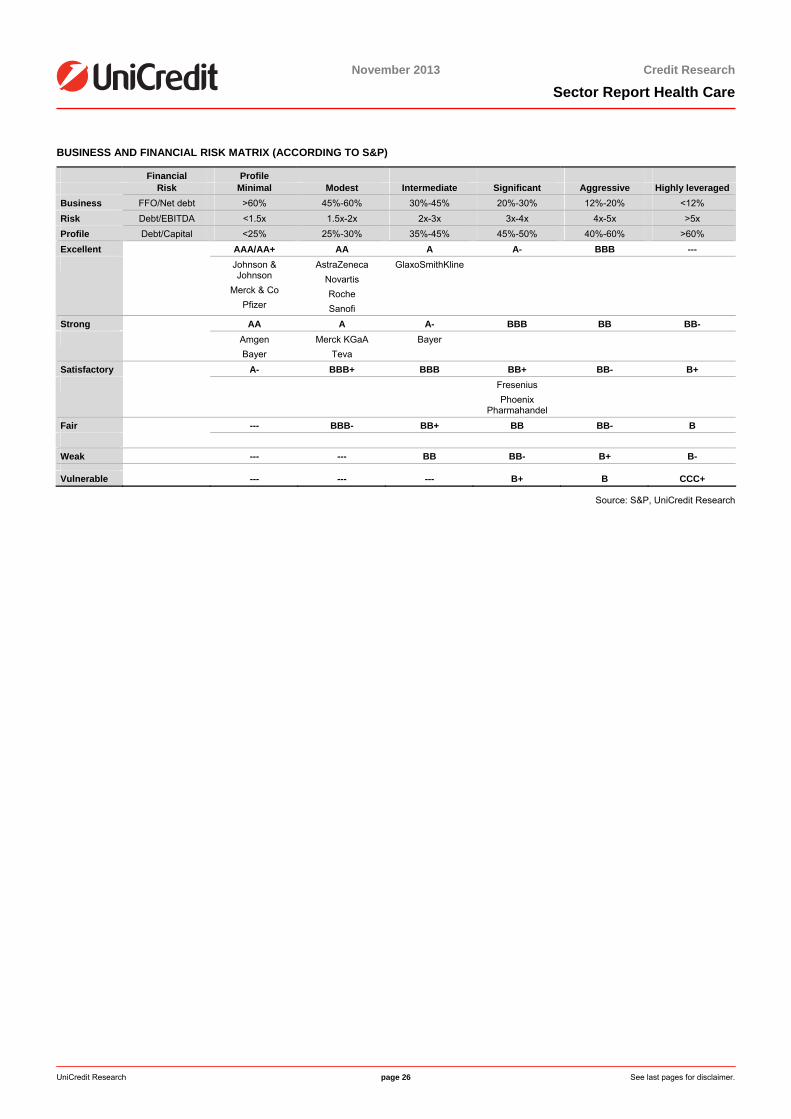
<date>
November 2013 Credit Research
Sector Report Health Care
UniCredit Research page 26 See last pages for disclaimer.
BUSINESS AND FINANCIAL RISK MATRIX (ACCORDING TO S&P)
Financial Profile Risk Minimal Modest Intermediate Significant Aggressive Highly leveraged Business FFO/Net debt >60% 45%-60% 30%-45% 20%-30% 12%-20% <12% Risk Debt/EBITDA <1.5x 1.5x-2x 2x-3x 3x-4x 4x-5x >5x Profile Debt/Capital <25% 25%-30% 35%-45% 45%-50% 40%-60% >60% Excellent AAA/AA+ AA A A- BBB --- Johnson &
Johnson Merck & Co
Pfizer
AstraZeneca Novartis Roche Sanofi
GlaxoSmithKline
Strong AA A A- BBB BB BB- Amgen
Bayer Merck KGaA
Teva Bayer
Satisfactory A- BBB+ BBB BB+ BB- B+ Fresenius
Phoenix Pharmahandel
Fair --- BBB- BB+ BB BB- B Weak --- --- BB BB- B+ B-
Vulnerable --- --- --- B+ B CCC+
Source: S&P, UniCredit Research
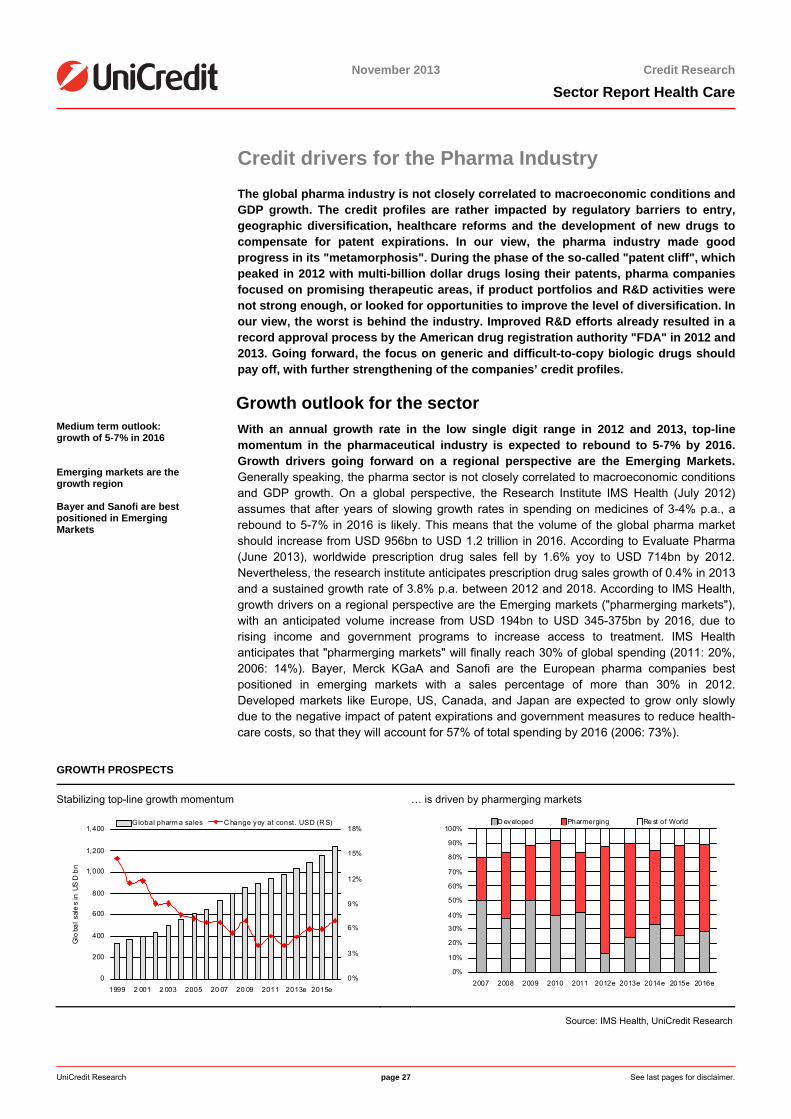
<date>
November 2013 Credit Research
Sector Report Health Care
UniCredit Research page 27 See last pages for disclaimer.
Credit drivers for the Pharma Industry The global pharma industry is not closely correlated to macroeconomic conditions and
GDP growth. The credit profiles are rather impacted by regulatory barriers to entry,geographic diversification, healthcare reforms and the development of new drugs tocompensate for patent expirations. In our view, the pharma industry made goodprogress in its "metamorphosis". During the phase of the so-called "patent cliff", which peaked in 2012 with multi-billion dollar drugs losing their patents, pharma companiesfocused on promising therapeutic areas, if product portfolios and R&D activities werenot strong enough, or looked for opportunities to improve the level of diversification. In our view, the worst is behind the industry. Improved R&D efforts already resulted in arecord approval process by the American drug registration authority "FDA" in 2012 and2013. Going forward, the focus on generic and difficult-to-copy biologic drugs should pay off, with further strengthening of the companies’ credit profiles.
Growth outlook for the sector Medium term outlook: growth of 5-7% in 2016 Emerging markets are the growth region Bayer and Sanofi are best positioned in Emerging Markets
With an annual growth rate in the low single digit range in 2012 and 2013, top-line momentum in the pharmaceutical industry is expected to rebound to 5-7% by 2016. Growth drivers going forward on a regional perspective are the Emerging Markets. Generally speaking, the pharma sector is not closely correlated to macroeconomic conditionsand GDP growth. On a global perspective, the Research Institute IMS Health (July 2012)assumes that after years of slowing growth rates in spending on medicines of 3-4% p.a., a rebound to 5-7% in 2016 is likely. This means that the volume of the global pharma market should increase from USD 956bn to USD 1.2 trillion in 2016. According to Evaluate Pharma(June 2013), worldwide prescription drug sales fell by 1.6% yoy to USD 714bn by 2012.Nevertheless, the research institute anticipates prescription drug sales growth of 0.4% in 2013and a sustained growth rate of 3.8% p.a. between 2012 and 2018. According to IMS Health,growth drivers on a regional perspective are the Emerging markets ("pharmerging markets"),with an anticipated volume increase from USD 194bn to USD 345-375bn by 2016, due to rising income and government programs to increase access to treatment. IMS Healthanticipates that "pharmerging markets" will finally reach 30% of global spending (2011: 20%,2006: 14%). Bayer, Merck KGaA and Sanofi are the European pharma companies bestpositioned in emerging markets with a sales percentage of more than 30% in 2012.Developed markets like Europe, US, Canada, and Japan are expected to grow only slowlydue to the negative impact of patent expirations and government measures to reduce health-care costs, so that they will account for 57% of total spending by 2016 (2006: 73%).
GROWTH PROSPECTS
Stabilizing top-line growth momentum … is driven by pharmerging markets
0
200
400
600
800
1,000
1,200
1,400
1999 2 001 2 003 2005 20 07 20 09 2011 2013e 2015e
Glo
bal s
ale
s in
US
D b
n
0%
3%
6%
9%
12%
15%
18%Global pharm a sales C hange yoy at const. USD (R S)
0%
10%
20%
30%
40%
50%
60%
70%
80%
90%
100%
2007 2008 2009 2010 2011 2012e 2013e 2014e 2015e 2016e
D eveloped Pharmerging Re st of World
Source: IMS Health, UniCredit Research
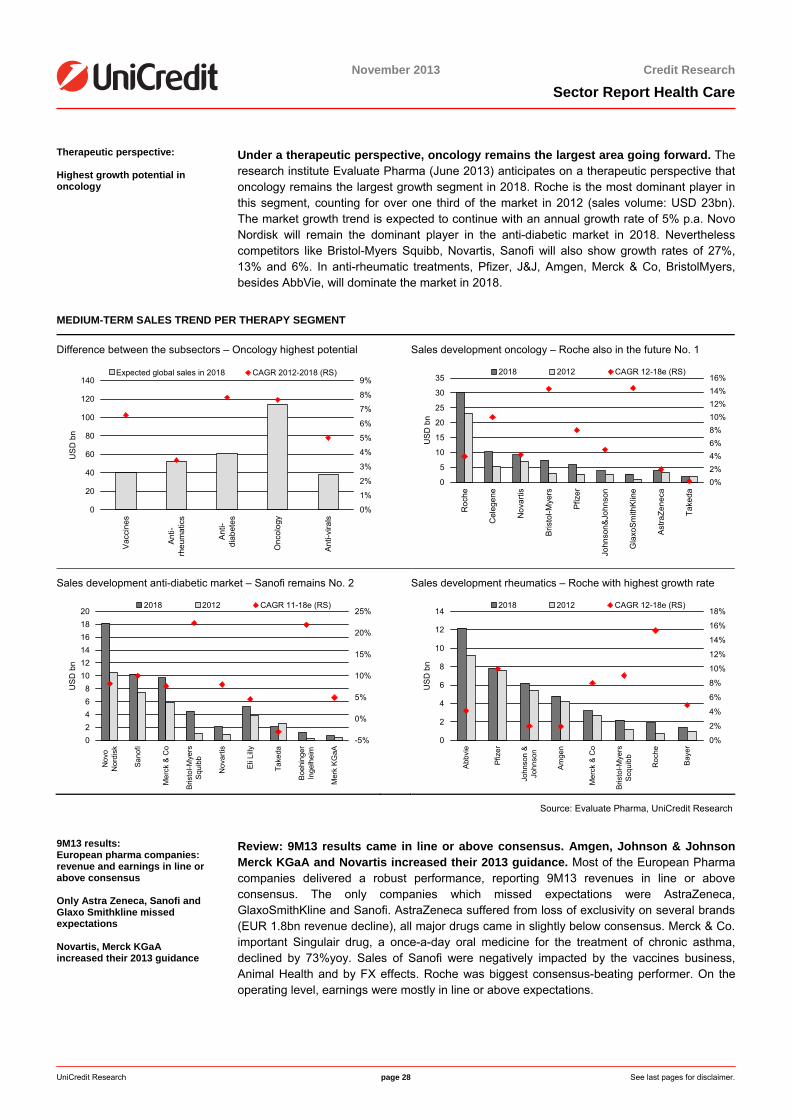
<date>
November 2013 Credit Research
Sector Report Health Care
UniCredit Research page 28 See last pages for disclaimer.
Therapeutic perspective: Highest growth potential in oncology
Under a therapeutic perspective, oncology remains the largest area going forward. The research institute Evaluate Pharma (June 2013) anticipates on a therapeutic perspective thatoncology remains the largest growth segment in 2018. Roche is the most dominant player inthis segment, counting for over one third of the market in 2012 (sales volume: USD 23bn). The market growth trend is expected to continue with an annual growth rate of 5% p.a. NovoNordisk will remain the dominant player in the anti-diabetic market in 2018. Nevertheless competitors like Bristol-Myers Squibb, Novartis, Sanofi will also show growth rates of 27%,13% and 6%. In anti-rheumatic treatments, Pfizer, J&J, Amgen, Merck & Co, BristolMyers,besides AbbVie, will dominate the market in 2018.
MEDIUM-TERM SALES TREND PER THERAPY SEGMENT
Difference between the subsectors – Oncology highest potential Sales development oncology – Roche also in the future No. 1
0
20
40
60
80
100
120
140
Vac
cine
s
Anti-
rheu
mat
ics
Ant
i-di
abet
es
Onc
olog
y
Anti-
vira
ls
US
D b
n
0%
1%
2%
3%
4%
5%
6%
7%
8%
9%Expected global sales in 2018 CAGR 2012-2018 (RS)
0
5
10
15
20
25
30
35
Roc
he
Cel
egen
e
Nov
artis
Bris
tol-M
yers
Pfiz
er
John
son&
John
son
Gla
xoSm
ithK
line
Ast
raZe
neca
Take
da
US
D b
n
0%2%4%6%8%10%12%14%16%
2018 2012 CAGR 12-18e (RS)
Sales development anti-diabetic market – Sanofi remains No. 2 Sales development rheumatics – Roche with highest growth rate
02468
101214161820
Nov
oN
ordi
sk
Sano
fi
Mer
ck &
Co
Bris
tol-M
yers
Squ
ibb
Nov
artis
Eli
Lilly
Take
da
Boe
hing
erIn
gelh
eim
Mer
k K
GaA
US
D b
n
-5%
0%
5%
10%
15%
20%
25%2018 2012 CAGR 11-18e (RS)
0
2
4
6
8
10
12
14
Abb
vie
Pfiz
er
John
son
&Jo
hnso
n
Am
gen
Mer
ck &
Co
Bris
tol-M
yers
Scqu
ibb
Roc
he
Bay
er
US
D b
n
0%
2%
4%
6%
8%
10%
12%
14%
16%
18%2018 2012 CAGR 12-18e (RS)
Source: Evaluate Pharma, UniCredit Research
9M13 results: European pharma companies: revenue and earnings in line or above consensus Only Astra Zeneca, Sanofi and Glaxo Smithkline missed expectations Novartis, Merck KGaA increased their 2013 guidance
Review: 9M13 results came in line or above consensus. Amgen, Johnson & JohnsonMerck KGaA and Novartis increased their 2013 guidance. Most of the European Pharma companies delivered a robust performance, reporting 9M13 revenues in line or above consensus. The only companies which missed expectations were AstraZeneca,GlaxoSmithKline and Sanofi. AstraZeneca suffered from loss of exclusivity on several brands(EUR 1.8bn revenue decline), all major drugs came in slightly below consensus. Merck & Co.important Singulair drug, a once-a-day oral medicine for the treatment of chronic asthma, declined by 73%yoy. Sales of Sanofi were negatively impacted by the vaccines business, Animal Health and by FX effects. Roche was biggest consensus-beating performer. On theoperating level, earnings were mostly in line or above expectations.
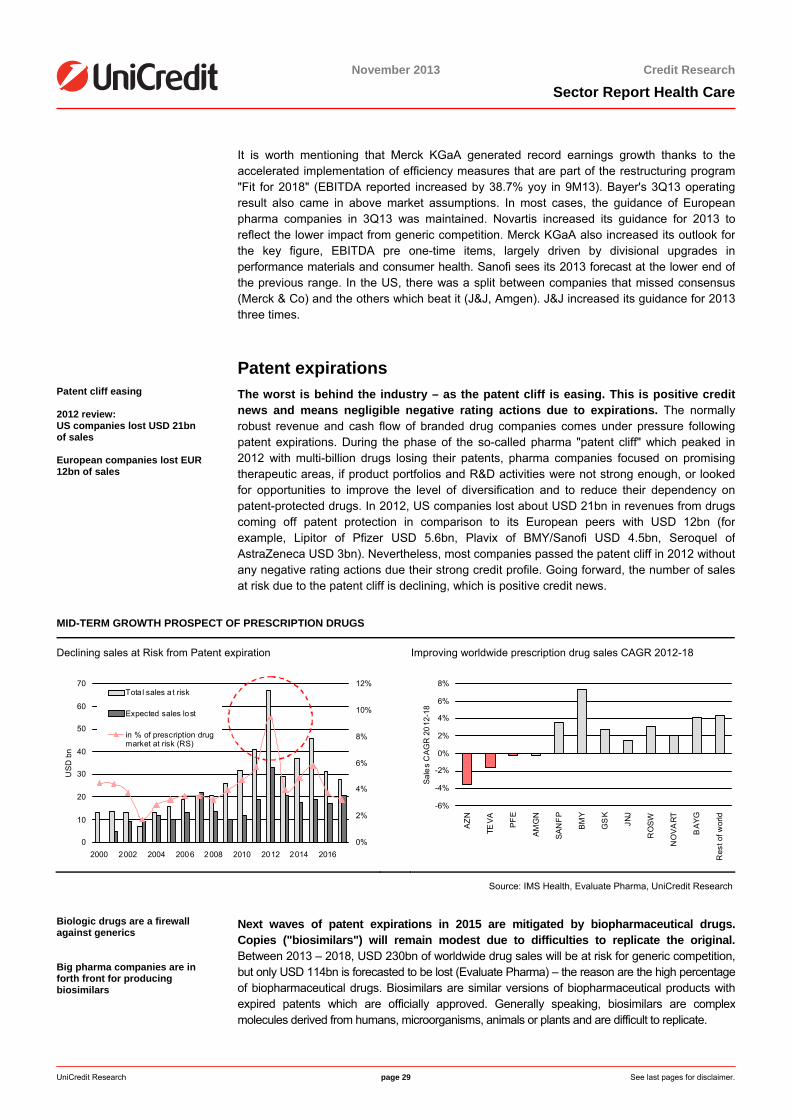
<date>
November 2013 Credit Research
Sector Report Health Care
UniCredit Research page 29 See last pages for disclaimer.
It is worth mentioning that Merck KGaA generated record earnings growth thanks to theaccelerated implementation of efficiency measures that are part of the restructuring program "Fit for 2018" (EBITDA reported increased by 38.7% yoy in 9M13). Bayer's 3Q13 operating result also came in above market assumptions. In most cases, the guidance of Europeanpharma companies in 3Q13 was maintained. Novartis increased its guidance for 2013 toreflect the lower impact from generic competition. Merck KGaA also increased its outlook forthe key figure, EBITDA pre one-time items, largely driven by divisional upgrades in performance materials and consumer health. Sanofi sees its 2013 forecast at the lower end of the previous range. In the US, there was a split between companies that missed consensus(Merck & Co) and the others which beat it (J&J, Amgen). J&J increased its guidance for 2013three times.
Patent expirations
Patent cliff easing 2012 review: US companies lost USD 21bn of sales European companies lost EUR 12bn of sales
The worst is behind the industry – as the patent cliff is easing. This is positive credit news and means negligible negative rating actions due to expirations. The normally robust revenue and cash flow of branded drug companies comes under pressure followingpatent expirations. During the phase of the so-called pharma "patent cliff" which peaked in 2012 with multi-billion drugs losing their patents, pharma companies focused on promising therapeutic areas, if product portfolios and R&D activities were not strong enough, or lookedfor opportunities to improve the level of diversification and to reduce their dependency onpatent-protected drugs. In 2012, US companies lost about USD 21bn in revenues from drugs coming off patent protection in comparison to its European peers with USD 12bn (forexample, Lipitor of Pfizer USD 5.6bn, Plavix of BMY/Sanofi USD 4.5bn, Seroquel ofAstraZeneca USD 3bn). Nevertheless, most companies passed the patent cliff in 2012 withoutany negative rating actions due their strong credit profile. Going forward, the number of sales at risk due to the patent cliff is declining, which is positive credit news.
MID-TERM GROWTH PROSPECT OF PRESCRIPTION DRUGS
Declining sales at Risk from Patent expiration Improving worldwide prescription drug sales CAGR 2012-18
0
10
20
30
40
50
60
70
2000 2002 2004 2006 2008 2010 2012 2014 2016
US
D b
n
0%
2%
4%
6%
8%
10%
12%Tota l sales a t risk
Expected sales lost
in % of prescription drugmarket at risk (RS)
-6%
-4%
-2%
0%
2%
4%
6%
8%
AZN
TEVA PF
E
AM
GN
SAN
FP
BM
Y
GS
K
JNJ
RO
SW
NO
VAR
T
BA
YG
Res
t of w
orld
Sale
s C
AG
R 2
012
-18
Source: IMS Health, Evaluate Pharma, UniCredit Research
Biologic drugs are a firewall against generics Big pharma companies are in forth front for producing biosimilars
Next waves of patent expirations in 2015 are mitigated by biopharmaceutical drugs.Copies ("biosimilars") will remain modest due to difficulties to replicate the original.Between 2013 – 2018, USD 230bn of worldwide drug sales will be at risk for generic competition, but only USD 114bn is forecasted to be lost (Evaluate Pharma) – the reason are the high percentageof biopharmaceutical drugs. Biosimilars are similar versions of biopharmaceutical products withexpired patents which are officially approved. Generally speaking, biosimilars are complex molecules derived from humans, microorganisms, animals or plants and are difficult to replicate.
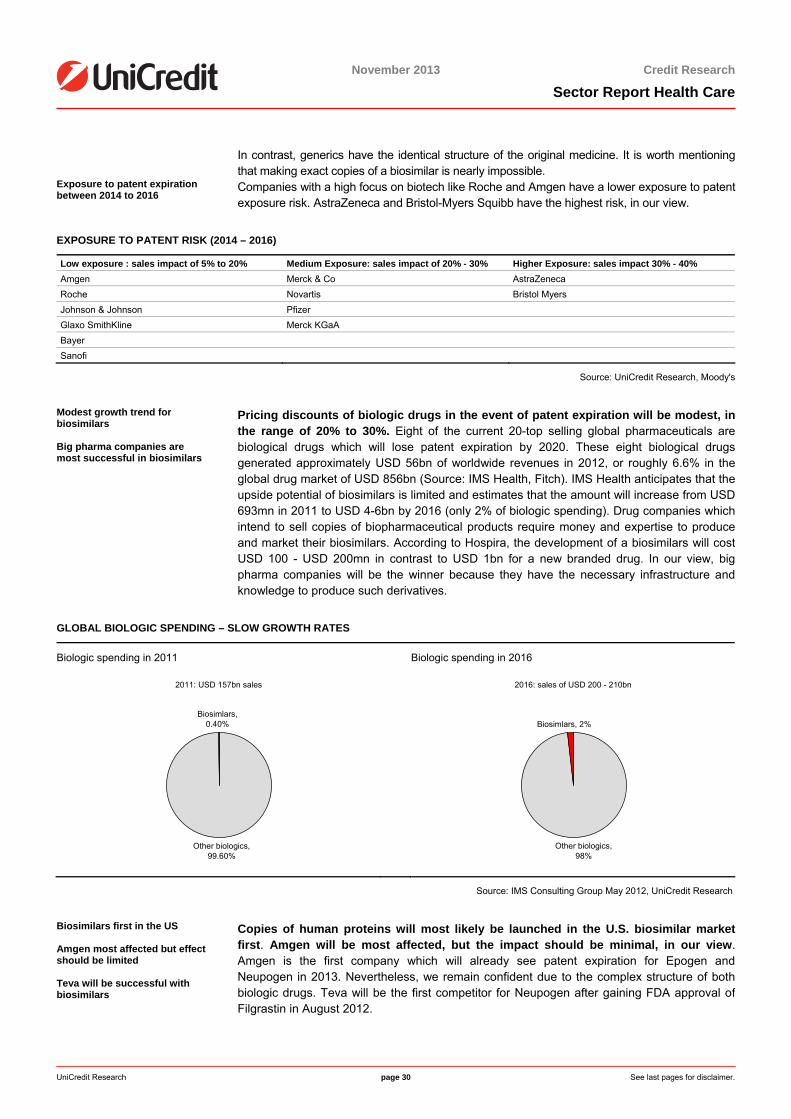
<date>
November 2013 Credit Research
Sector Report Health Care
UniCredit Research page 30 See last pages for disclaimer.
In contrast, generics have the identical structure of the original medicine. It is worth mentioning that making exact copies of a biosimilar is nearly impossible.
Exposure to patent expiration between 2014 to 2016
Companies with a high focus on biotech like Roche and Amgen have a lower exposure to patentexposure risk. AstraZeneca and Bristol-Myers Squibb have the highest risk, in our view.
EXPOSURE TO PATENT RISK (2014 – 2016)
Low exposure : sales impact of 5% to 20% Medium Exposure: sales impact of 20% - 30% Higher Exposure: sales impact 30% - 40% Amgen Merck & Co AstraZeneca Roche Novartis Bristol Myers Johnson & Johnson Pfizer Glaxo SmithKline Merck KGaA Bayer Sanofi
Source: UniCredit Research, Moody's
Modest growth trend for biosimilars Big pharma companies are most successful in biosimilars
Pricing discounts of biologic drugs in the event of patent expiration will be modest, inthe range of 20% to 30%. Eight of the current 20-top selling global pharmaceuticals are biological drugs which will lose patent expiration by 2020. These eight biological drugs generated approximately USD 56bn of worldwide revenues in 2012, or roughly 6.6% in theglobal drug market of USD 856bn (Source: IMS Health, Fitch). IMS Health anticipates that theupside potential of biosimilars is limited and estimates that the amount will increase from USD 693mn in 2011 to USD 4-6bn by 2016 (only 2% of biologic spending). Drug companies whichintend to sell copies of biopharmaceutical products require money and expertise to produceand market their biosimilars. According to Hospira, the development of a biosimilars will cost USD 100 - USD 200mn in contrast to USD 1bn for a new branded drug. In our view, bigpharma companies will be the winner because they have the necessary infrastructure andknowledge to produce such derivatives.
GLOBAL BIOLOGIC SPENDING – SLOW GROWTH RATES
Biologic spending in 2011 Biologic spending in 2016
2011: USD 157bn sales
Other biologics, 99.60%
Biosimlars, 0.40%
2016: sales of USD 200 - 210bn
Other biologics, 98%
Biosimlars, 2%
Source: IMS Consulting Group May 2012, UniCredit Research
Biosimilars first in the US Amgen most affected but effect should be limited Teva will be successful with biosimilars
Copies of human proteins will most likely be launched in the U.S. biosimilar marketfirst. Amgen will be most affected, but the impact should be minimal, in our view. Amgen is the first company which will already see patent expiration for Epogen and Neupogen in 2013. Nevertheless, we remain confident due to the complex structure of bothbiologic drugs. Teva will be the first competitor for Neupogen after gaining FDA approval ofFilgrastin in August 2012.
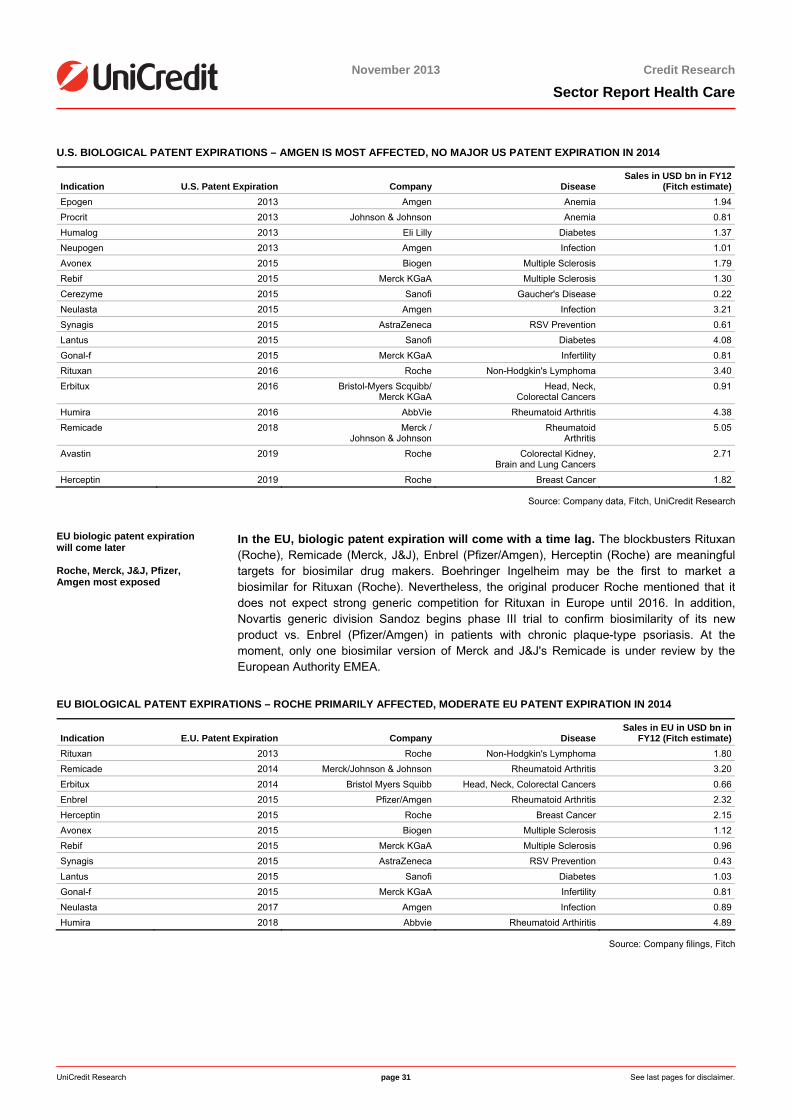
<date>
November 2013 Credit Research
Sector Report Health Care
UniCredit Research page 31 See last pages for disclaimer.
U.S. BIOLOGICAL PATENT EXPIRATIONS – AMGEN IS MOST AFFECTED, NO MAJOR US PATENT EXPIRATION IN 2014
Indication
U.S. Patent Expiration Company
Disease
Sales in USD bn in FY12 (Fitch estimate)
Epogen 2013 Amgen Anemia 1.94Procrit 2013 Johnson & Johnson Anemia 0.81Humalog 2013 Eli Lilly Diabetes 1.37Neupogen 2013 Amgen Infection 1.01Avonex 2015 Biogen Multiple Sclerosis 1.79Rebif 2015 Merck KGaA Multiple Sclerosis 1.30Cerezyme 2015 Sanofi Gaucher's Disease 0.22Neulasta 2015 Amgen Infection 3.21Synagis 2015 AstraZeneca RSV Prevention 0.61Lantus 2015 Sanofi Diabetes 4.08Gonal-f 2015 Merck KGaA Infertility 0.81Rituxan 2016 Roche Non-Hodgkin's Lymphoma 3.40Erbitux 2016 Bristol-Myers Scquibb/
Merck KGaAHead, Neck,
Colorectal Cancers 0.91
Humira 2016 AbbVie Rheumatoid Arthritis 4.38Remicade 2018 Merck /
Johnson & JohnsonRheumatoid
Arthritis 5.05
Avastin 2019 Roche Colorectal Kidney, Brain and Lung Cancers
2.71
Herceptin 2019 Roche Breast Cancer 1.82
Source: Company data, Fitch, UniCredit Research
EU biologic patent expiration will come later Roche, Merck, J&J, Pfizer, Amgen most exposed
In the EU, biologic patent expiration will come with a time lag. The blockbusters Rituxan (Roche), Remicade (Merck, J&J), Enbrel (Pfizer/Amgen), Herceptin (Roche) are meaningful targets for biosimilar drug makers. Boehringer Ingelheim may be the first to market abiosimilar for Rituxan (Roche). Nevertheless, the original producer Roche mentioned that itdoes not expect strong generic competition for Rituxan in Europe until 2016. In addition, Novartis generic division Sandoz begins phase III trial to confirm biosimilarity of its newproduct vs. Enbrel (Pfizer/Amgen) in patients with chronic plaque-type psoriasis. At the moment, only one biosimilar version of Merck and J&J's Remicade is under review by the European Authority EMEA.
EU BIOLOGICAL PATENT EXPIRATIONS – ROCHE PRIMARILY AFFECTED, MODERATE EU PATENT EXPIRATION IN 2014
Indication
E.U. Patent Expiration Company
Disease
Sales in EU in USD bn in FY12 (Fitch estimate)
Rituxan 2013 Roche Non-Hodgkin's Lymphoma 1.80Remicade 2014 Merck/Johnson & Johnson Rheumatoid Arthritis 3.20Erbitux 2014 Bristol Myers Squibb Head, Neck, Colorectal Cancers 0.66Enbrel 2015 Pfizer/Amgen Rheumatoid Arthritis 2.32Herceptin 2015 Roche Breast Cancer 2.15Avonex 2015 Biogen Multiple Sclerosis 1.12Rebif 2015 Merck KGaA Multiple Sclerosis 0.96Synagis 2015 AstraZeneca RSV Prevention 0.43Lantus 2015 Sanofi Diabetes 1.03Gonal-f 2015 Merck KGaA Infertility 0.81Neulasta 2017 Amgen Infection 0.89Humira 2018 Abbvie Rheumatoid Arthiritis 4.89
Source: Company filings, Fitch
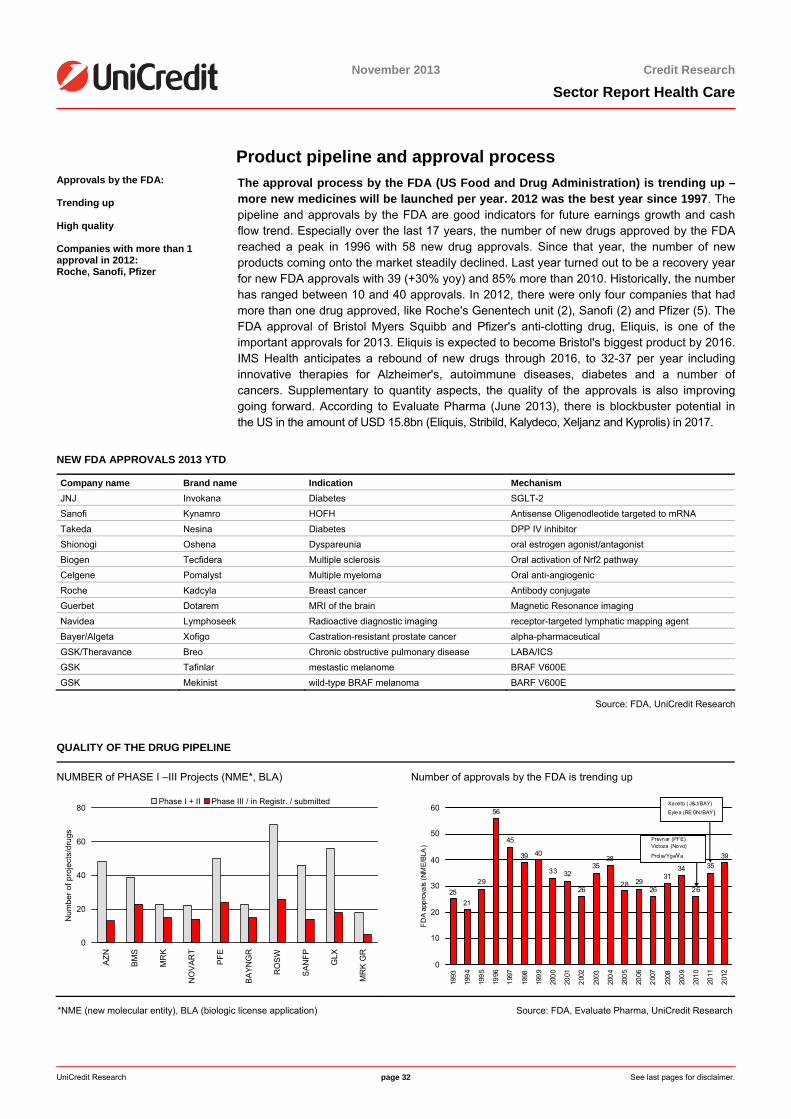
<date>
November 2013 Credit Research
Sector Report Health Care
UniCredit Research page 32 See last pages for disclaimer.
Product pipeline and approval process Approvals by the FDA: Trending up High quality Companies with more than 1 approval in 2012: Roche, Sanofi, Pfizer
The approval process by the FDA (US Food and Drug Administration) is trending up –more new medicines will be launched per year. 2012 was the best year since 1997. The pipeline and approvals by the FDA are good indicators for future earnings growth and cashflow trend. Especially over the last 17 years, the number of new drugs approved by the FDAreached a peak in 1996 with 58 new drug approvals. Since that year, the number of newproducts coming onto the market steadily declined. Last year turned out to be a recovery year for new FDA approvals with 39 (+30% yoy) and 85% more than 2010. Historically, the numberhas ranged between 10 and 40 approvals. In 2012, there were only four companies that hadmore than one drug approved, like Roche's Genentech unit (2), Sanofi (2) and Pfizer (5). The FDA approval of Bristol Myers Squibb and Pfizer's anti-clotting drug, Eliquis, is one of the important approvals for 2013. Eliquis is expected to become Bristol's biggest product by 2016.IMS Health anticipates a rebound of new drugs through 2016, to 32-37 per year including innovative therapies for Alzheimer's, autoimmune diseases, diabetes and a number ofcancers. Supplementary to quantity aspects, the quality of the approvals is also improvinggoing forward. According to Evaluate Pharma (June 2013), there is blockbuster potential in the US in the amount of USD 15.8bn (Eliquis, Stribild, Kalydeco, Xeljanz and Kyprolis) in 2017.
NEW FDA APPROVALS 2013 YTD
Company name Brand name Indication Mechanism JNJ Invokana Diabetes SGLT-2 Sanofi Kynamro HOFH Antisense Oligenodleotide targeted to mRNA Takeda Nesina Diabetes DPP IV inhibitor Shionogi Oshena Dyspareunia oral estrogen agonist/antagonist Biogen Tecfidera Multiple sclerosis Oral activation of Nrf2 pathway Celgene Pomalyst Multiple myeloma Oral anti-angiogenic Roche Kadcyla Breast cancer Antibody conjugate Guerbet Dotarem MRI of the brain Magnetic Resonance imaging Navidea Lymphoseek Radioactive diagnostic imaging receptor-targeted lymphatic mapping agent Bayer/Algeta Xofigo Castration-resistant prostate cancer alpha-pharmaceutical GSK/Theravance Breo Chronic obstructive pulmonary disease LABA/ICS GSK Tafinlar mestastic melanome BRAF V600E GSK Mekinist wild-type BRAF melanoma BARF V600E
Source: FDA, UniCredit Research
QUALITY OF THE DRUG PIPELINE
NUMBER of PHASE I –III Projects (NME*, BLA) Number of approvals by the FDA is trending up
0
20
40
60
80
AZN
BM
S
MR
K
NO
VAR
T
PFE
BA
YNG
R
RO
SW
SA
NFP
GLX
MR
K G
R
Num
ber o
f pro
ject
s/dr
ugs
Phase I + II Phase III / in Registr. / submitted
2521
29
56
45
39 40
33 32
26
3538
28 2926
3134
26
3539
0
10
20
30
40
50
60
1993
1994
1995
1996
1997
1998
1999
2000
2001
2002
2003
2004
2005
2006
2007
2008
2009
2010
2011
2012
FDA
appr
oval
s (N
ME/
BLA
)
Xarel to ( J&J/BAY)
Eylea (RE GN/BAY)
Prevnar (PFE)Victoza (Novo)
Prol ia/Ygeva
*NME (new molecular entity), BLA (biologic license application) Source: FDA, Evaluate Pharma, UniCredit Research
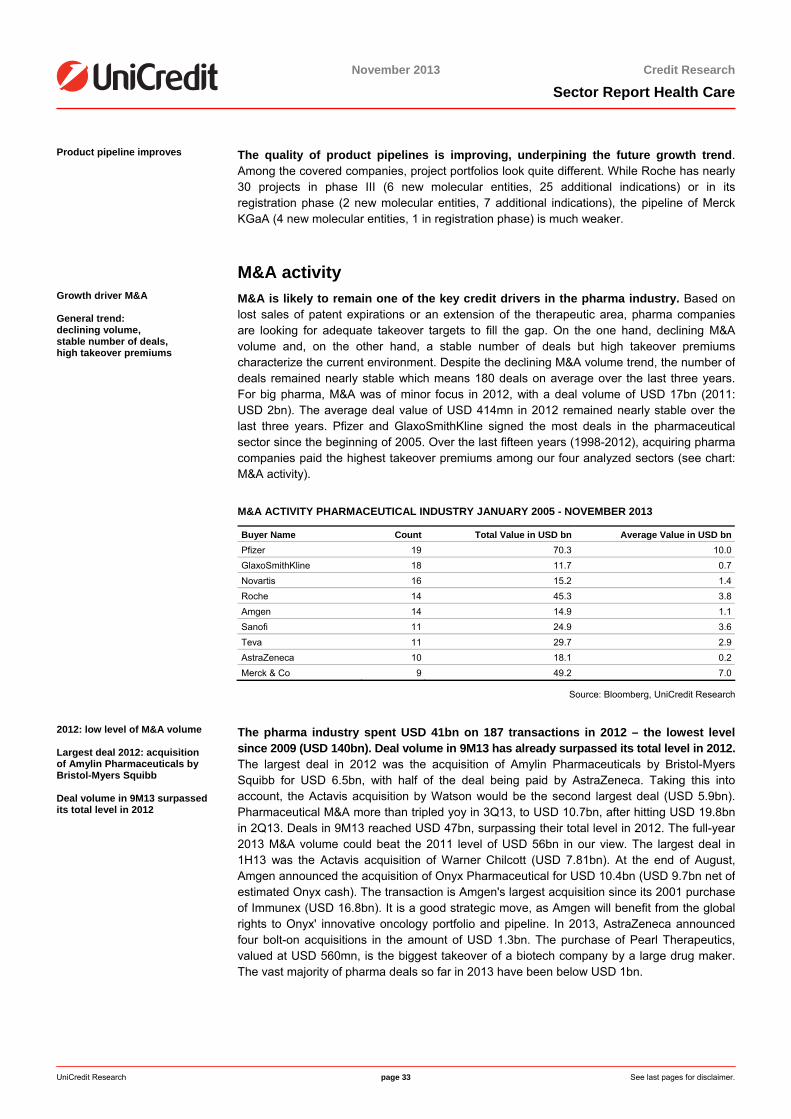
<date>
November 2013 Credit Research
Sector Report Health Care
UniCredit Research page 33 See last pages for disclaimer.
Product pipeline improves The quality of product pipelines is improving, underpining the future growth trend. Among the covered companies, project portfolios look quite different. While Roche has nearly30 projects in phase III (6 new molecular entities, 25 additional indications) or in its registration phase (2 new molecular entities, 7 additional indications), the pipeline of MerckKGaA (4 new molecular entities, 1 in registration phase) is much weaker.
M&A activity
Growth driver M&A General trend: declining volume, stable number of deals, high takeover premiums
M&A is likely to remain one of the key credit drivers in the pharma industry. Based on lost sales of patent expirations or an extension of the therapeutic area, pharma companies are looking for adequate takeover targets to fill the gap. On the one hand, declining M&A volume and, on the other hand, a stable number of deals but high takeover premiums characterize the current environment. Despite the declining M&A volume trend, the number of deals remained nearly stable which means 180 deals on average over the last three years. For big pharma, M&A was of minor focus in 2012, with a deal volume of USD 17bn (2011: USD 2bn). The average deal value of USD 414mn in 2012 remained nearly stable over the last three years. Pfizer and GlaxoSmithKline signed the most deals in the pharmaceutical sector since the beginning of 2005. Over the last fifteen years (1998-2012), acquiring pharma companies paid the highest takeover premiums among our four analyzed sectors (see chart: M&A activity).
M&A ACTIVITY PHARMACEUTICAL INDUSTRY JANUARY 2005 - NOVEMBER 2013
Buyer Name Count Total Value in USD bn Average Value in USD bnPfizer 19 70.3 10.0GlaxoSmithKline 18 11.7 0.7Novartis 16 15.2 1.4Roche 14 45.3 3.8Amgen 14 14.9 1.1Sanofi 11 24.9 3.6Teva 11 29.7 2.9AstraZeneca 10 18.1 0.2Merck & Co 9 49.2 7.0
Source: Bloomberg, UniCredit Research
2012: low level of M&A volume Largest deal 2012: acquisition of Amylin Pharmaceuticals by Bristol-Myers Squibb Deal volume in 9M13 surpassed its total level in 2012
The pharma industry spent USD 41bn on 187 transactions in 2012 – the lowest level since 2009 (USD 140bn). Deal volume in 9M13 has already surpassed its total level in 2012.The largest deal in 2012 was the acquisition of Amylin Pharmaceuticals by Bristol-Myers Squibb for USD 6.5bn, with half of the deal being paid by AstraZeneca. Taking this into account, the Actavis acquisition by Watson would be the second largest deal (USD 5.9bn). Pharmaceutical M&A more than tripled yoy in 3Q13, to USD 10.7bn, after hitting USD 19.8bn in 2Q13. Deals in 9M13 reached USD 47bn, surpassing their total level in 2012. The full-year 2013 M&A volume could beat the 2011 level of USD 56bn in our view. The largest deal in 1H13 was the Actavis acquisition of Warner Chilcott (USD 7.81bn). At the end of August,Amgen announced the acquisition of Onyx Pharmaceutical for USD 10.4bn (USD 9.7bn net ofestimated Onyx cash). The transaction is Amgen's largest acquisition since its 2001 purchase of Immunex (USD 16.8bn). It is a good strategic move, as Amgen will benefit from the global rights to Onyx' innovative oncology portfolio and pipeline. In 2013, AstraZeneca announced four bolt-on acquisitions in the amount of USD 1.3bn. The purchase of Pearl Therapeutics,valued at USD 560mn, is the biggest takeover of a biotech company by a large drug maker.The vast majority of pharma deals so far in 2013 have been below USD 1bn.
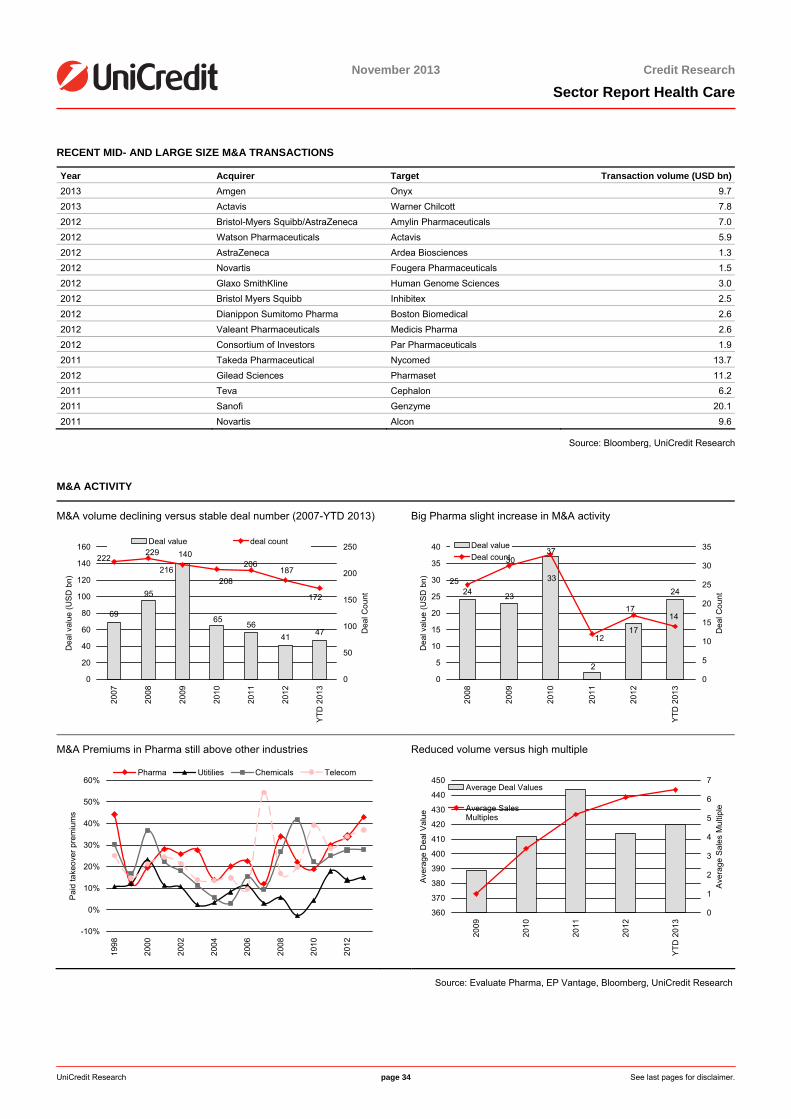
<date>
November 2013 Credit Research
Sector Report Health Care
UniCredit Research page 34 See last pages for disclaimer.
RECENT MID- AND LARGE SIZE M&A TRANSACTIONS
Year Acquirer Target Transaction volume (USD bn)2013 Amgen Onyx 9.72013 Actavis Warner Chilcott 7.82012 Bristol-Myers Squibb/AstraZeneca Amylin Pharmaceuticals 7.02012 Watson Pharmaceuticals Actavis 5.92012 AstraZeneca Ardea Biosciences 1.32012 Novartis Fougera Pharmaceuticals 1.52012 Glaxo SmithKline Human Genome Sciences 3.02012 Bristol Myers Squibb Inhibitex 2.52012 Dianippon Sumitomo Pharma Boston Biomedical 2.62012 Valeant Pharmaceuticals Medicis Pharma 2.62012 Consortium of Investors Par Pharmaceuticals 1.92011 Takeda Pharmaceutical Nycomed 13.72012 Gilead Sciences Pharmaset 11.22011 Teva Cephalon 6.22011 Sanofi Genzyme 20.12011 Novartis Alcon 9.6
Source: Bloomberg, UniCredit Research
M&A ACTIVITY
M&A volume declining versus stable deal number (2007-YTD 2013) Big Pharma slight increase in M&A activity
6956
41 47
140
65
95
222229
216208
206187
172
0
20
40
60
80
100
120
140
160
2007
2008
2009
2010
2011
2012
YTD
201
3
Dea
l val
ue (U
SD
bn)
0
50
100
150
200
250
Dea
l Cou
nt
Deal value deal count
24 24
17
23
2
37
1417
12
33
30
25
0
5
10
15
20
25
30
35
40
2008
2009
2010
2011
2012
YTD
201
3
Dea
l val
ue (U
SD
bn)
0
5
10
15
20
25
30
35
Dea
l Cou
nt
Deal valueDeal count
M&A Premiums in Pharma still above other industries Reduced volume versus high multiple
-10%
0%
10%
20%
30%
40%
50%
60%
1998
2000
2002
2004
2006
2008
2010
2012
Pai
d ta
keov
er p
rem
ium
s
Pharma Utitilies Chemicals Telecom
360
370
380
390
400
410
420
430
440
450
2009
2010
2011
2012
YTD
201
3
Ave
rage
Dea
l Val
ue
0
1
2
3
4
5
6
7
Ave
rage
Sal
es M
ultip
le
Average Deal Values
Average SalesMultiples
Source: Evaluate Pharma, EP Vantage, Bloomberg, UniCredit Research
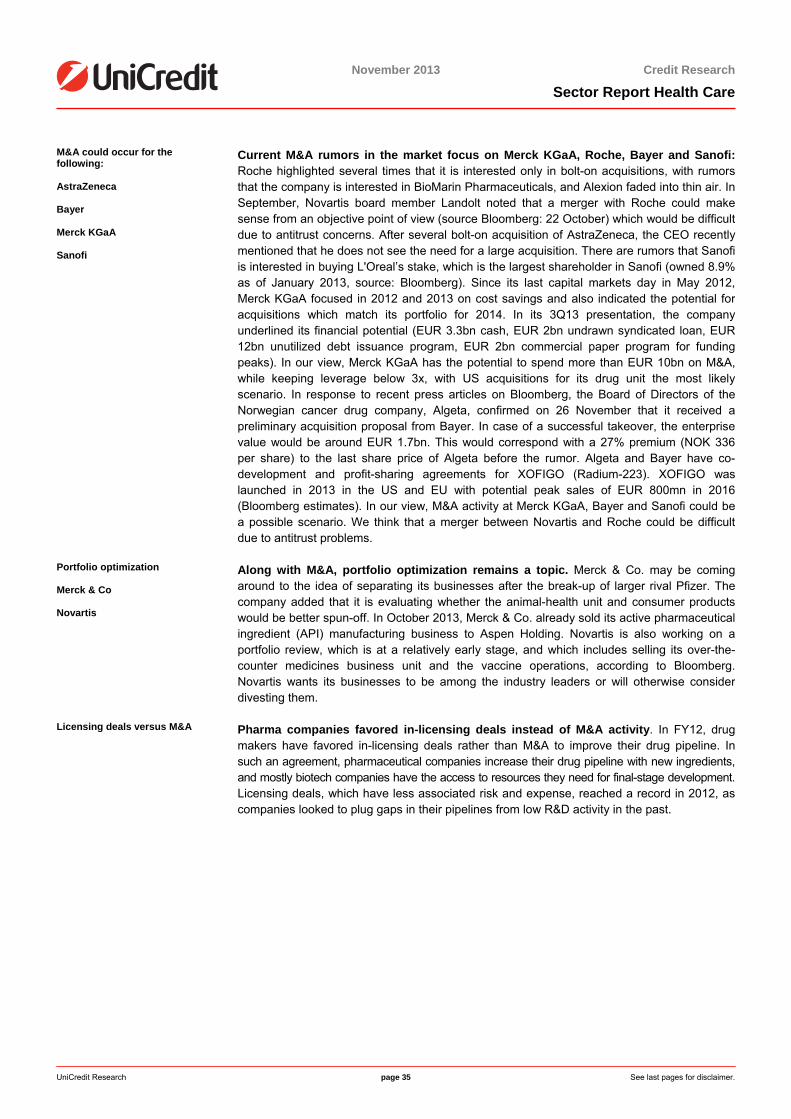
<date>
November 2013 Credit Research
Sector Report Health Care
UniCredit Research page 35 See last pages for disclaimer.
M&A could occur for the following: AstraZeneca Bayer Merck KGaA Sanofi
Current M&A rumors in the market focus on Merck KGaA, Roche, Bayer and Sanofi: Roche highlighted several times that it is interested only in bolt-on acquisitions, with rumors that the company is interested in BioMarin Pharmaceuticals, and Alexion faded into thin air. InSeptember, Novartis board member Landolt noted that a merger with Roche could makesense from an objective point of view (source Bloomberg: 22 October) which would be difficult due to antitrust concerns. After several bolt-on acquisition of AstraZeneca, the CEO recently mentioned that he does not see the need for a large acquisition. There are rumors that Sanofiis interested in buying L'Oreal’s stake, which is the largest shareholder in Sanofi (owned 8.9%as of January 2013, source: Bloomberg). Since its last capital markets day in May 2012, Merck KGaA focused in 2012 and 2013 on cost savings and also indicated the potential foracquisitions which match its portfolio for 2014. In its 3Q13 presentation, the company underlined its financial potential (EUR 3.3bn cash, EUR 2bn undrawn syndicated loan, EUR12bn unutilized debt issuance program, EUR 2bn commercial paper program for funding peaks). In our view, Merck KGaA has the potential to spend more than EUR 10bn on M&A,while keeping leverage below 3x, with US acquisitions for its drug unit the most likely scenario. In response to recent press articles on Bloomberg, the Board of Directors of the Norwegian cancer drug company, Algeta, confirmed on 26 November that it received apreliminary acquisition proposal from Bayer. In case of a successful takeover, the enterprise value would be around EUR 1.7bn. This would correspond with a 27% premium (NOK 336 per share) to the last share price of Algeta before the rumor. Algeta and Bayer have co-development and profit-sharing agreements for XOFIGO (Radium-223). XOFIGO waslaunched in 2013 in the US and EU with potential peak sales of EUR 800mn in 2016 (Bloomberg estimates). In our view, M&A activity at Merck KGaA, Bayer and Sanofi could bea possible scenario. We think that a merger between Novartis and Roche could be difficultdue to antitrust problems.
Portfolio optimization Merck & Co Novartis
Along with M&A, portfolio optimization remains a topic. Merck & Co. may be coming around to the idea of separating its businesses after the break-up of larger rival Pfizer. The company added that it is evaluating whether the animal-health unit and consumer products would be better spun-off. In October 2013, Merck & Co. already sold its active pharmaceuticalingredient (API) manufacturing business to Aspen Holding. Novartis is also working on a portfolio review, which is at a relatively early stage, and which includes selling its over-the-counter medicines business unit and the vaccine operations, according to Bloomberg. Novartis wants its businesses to be among the industry leaders or will otherwise considerdivesting them.
Licensing deals versus M&A Pharma companies favored in-licensing deals instead of M&A activity. In FY12, drug makers have favored in-licensing deals rather than M&A to improve their drug pipeline. In such an agreement, pharmaceutical companies increase their drug pipeline with new ingredients,and mostly biotech companies have the access to resources they need for final-stage development. Licensing deals, which have less associated risk and expense, reached a record in 2012, as companies looked to plug gaps in their pipelines from low R&D activity in the past.
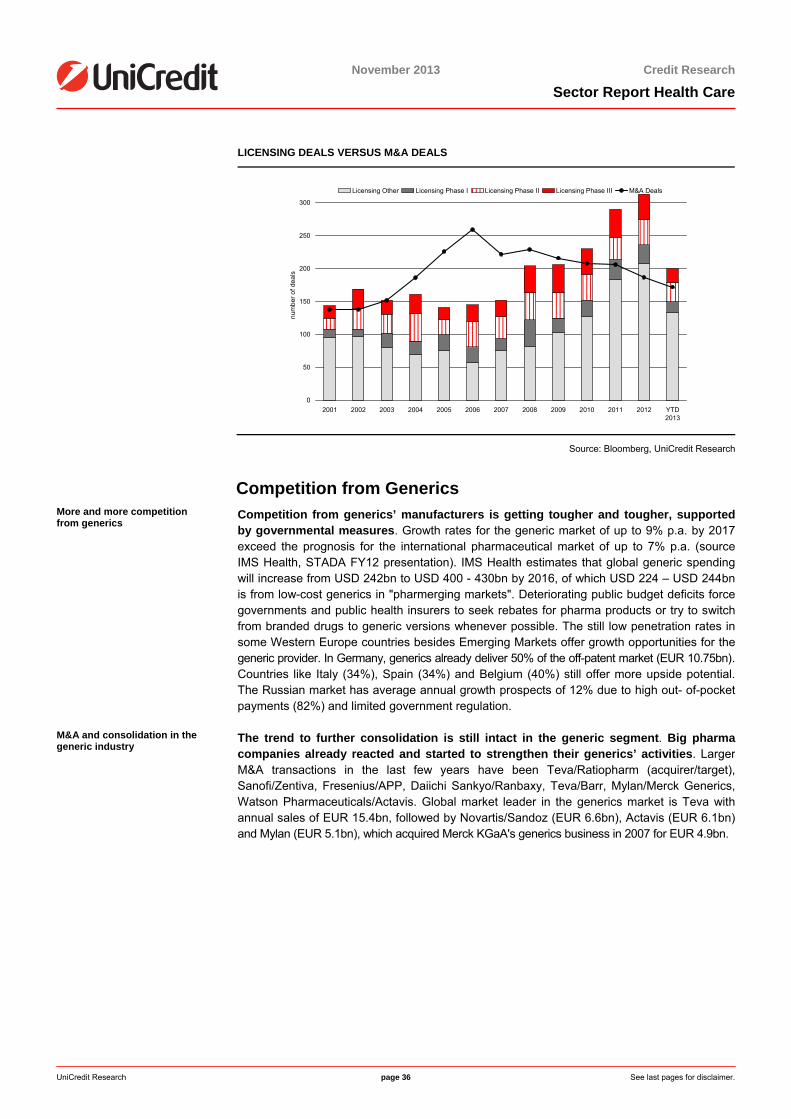
<date>
November 2013 Credit Research
Sector Report Health Care
UniCredit Research page 36 See last pages for disclaimer.
LICENSING DEALS VERSUS M&A DEALS
0
50
100
150
200
250
300
2001 2002 2003 2004 2005 2006 2007 2008 2009 2010 2011 2012 YTD2013
num
ber o
f dea
ls
Licensing Other Licensing Phase I Licensing Phase II Licensing Phase III M&A Deals
Source: Bloomberg, UniCredit Research
Competition from Generics More and more competition from generics
Competition from generics’ manufacturers is getting tougher and tougher, supportedby governmental measures. Growth rates for the generic market of up to 9% p.a. by 2017 exceed the prognosis for the international pharmaceutical market of up to 7% p.a. (sourceIMS Health, STADA FY12 presentation). IMS Health estimates that global generic spending will increase from USD 242bn to USD 400 - 430bn by 2016, of which USD 224 – USD 244bn is from low-cost generics in "pharmerging markets". Deteriorating public budget deficits forcegovernments and public health insurers to seek rebates for pharma products or try to switch from branded drugs to generic versions whenever possible. The still low penetration rates insome Western Europe countries besides Emerging Markets offer growth opportunities for the generic provider. In Germany, generics already deliver 50% of the off-patent market (EUR 10.75bn). Countries like Italy (34%), Spain (34%) and Belgium (40%) still offer more upside potential.The Russian market has average annual growth prospects of 12% due to high out- of-pocket payments (82%) and limited government regulation.
M&A and consolidation in the generic industry
The trend to further consolidation is still intact in the generic segment. Big pharma companies already reacted and started to strengthen their generics’ activities. Larger M&A transactions in the last few years have been Teva/Ratiopharm (acquirer/target), Sanofi/Zentiva, Fresenius/APP, Daiichi Sankyo/Ranbaxy, Teva/Barr, Mylan/Merck Generics,Watson Pharmaceuticals/Actavis. Global market leader in the generics market is Teva with annual sales of EUR 15.4bn, followed by Novartis/Sandoz (EUR 6.6bn), Actavis (EUR 6.1bn)and Mylan (EUR 5.1bn), which acquired Merck KGaA's generics business in 2007 for EUR 4.9bn.
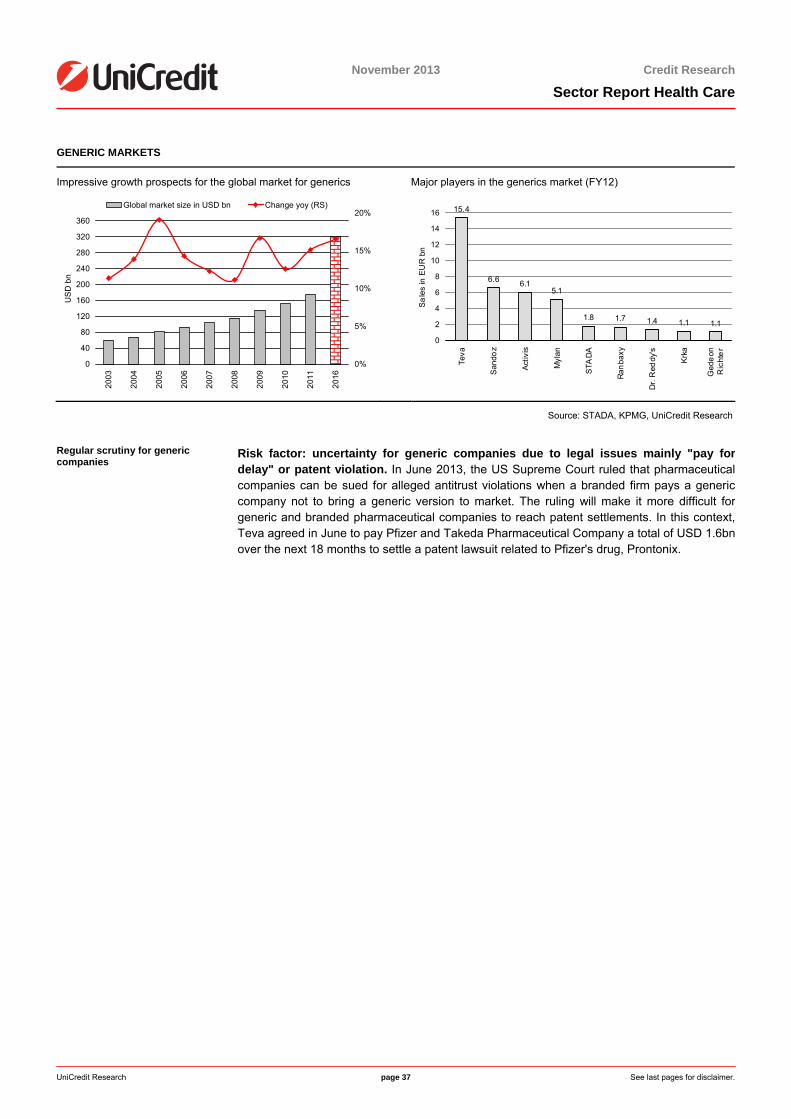
<date>
November 2013 Credit Research
Sector Report Health Care
UniCredit Research page 37 See last pages for disclaimer.
GENERIC MARKETS
Impressive growth prospects for the global market for generics Major players in the generics market (FY12)
0
40
80
120
160
200
240
280
320
360
2003
2004
2005
2006
2007
2008
2009
2010
2011
2016
US
D b
n
0%
5%
10%
15%
20%Global market size in USD bn Change yoy (RS)
15.4
6.6 6.15.1
1.8 1.7 1.4 1.1 1.1
0
2
4
6
8
10
12
14
16
Teva
San
doz
Activ
is
Myl
an
STA
DA
Ranb
axy
Dr.
Red
dy's
Krka
Ged
eon
Ric
hte
r
Sa
les
in E
UR
bn Source: STADA, KPMG, UniCredit Research
Regular scrutiny for generic companies
Risk factor: uncertainty for generic companies due to legal issues mainly "pay fordelay" or patent violation. In June 2013, the US Supreme Court ruled that pharmaceutical companies can be sued for alleged antitrust violations when a branded firm pays a genericcompany not to bring a generic version to market. The ruling will make it more difficult for generic and branded pharmaceutical companies to reach patent settlements. In this context,Teva agreed in June to pay Pfizer and Takeda Pharmaceutical Company a total of USD 1.6bnover the next 18 months to settle a patent lawsuit related to Pfizer's drug, Prontonix.
<date>
November 2013 Credit Research
Sector Report Health Care
UniCredit Research page 38 See last pages for disclaimer.
Cost-cutting attempts Cost reducing measures The pharma industry showed a good track record in cost cutting. As a result of the
drop in sales volumes due to patent expirations, big pharma downscaled its capacities and cost basis. Over the last five years, almost every pharma company put a restructuring or efficiency improvement program in place, linked to job cuts, especially affecting the sales staff, and closure of production capacity, or R&D facilities. As the major portion ofrestructuring costs were non-cash (e.g. impairments), pharma companies were able toimprove cash-flow generation during the last few years.
IMPLEMENTED COST CUTTING MEASURES
Company Year Comment AstraZeneca 2010-2014 Since 2007, AstraZeneca has undertaken efforts to restructure and reshape the business. The first phase was
completed in 2009. The second phase, which featured a change program in R&D, began in 2010. The restructuring actions for this phase were completed in 2011 (cost USD 2.1bn, headcount reduction: 9,000 positions). Total benefit of USD 1.9bn was to be delivered by the end of 2014. A third phase of restructuring was announced in 2012, comprising initiatives across the supply chain, SG&A and R&D (cost of USD 2.1bn). When completed, annual savings of USD 1.6bn by end of 2014 are expected, of which USD 350mn was already realized in 2012.
Bristol-Myers Squibb 2012 Additional employee termination costs of USD 300mn are expected to be incurred in 2013 as a result of workforce reductions in several European countries.
GlaxoSmithKline 2007, 2009 Over the past four years, GlaxoSmithKline has implemented a global restructuring program. Savings from this program have been seen across the business, including in R&D, manufacturing and through the centralization and streamlining of support functions such as finance. In FY12, the "Operational Excellence Program" delivered annual savings of GBP 2.5bn and a target of GBP 2.8bn of annual savings by 2014 (savings: FY10: GBP 1.7bn, FY11: GBP 2.2bn, FY12: GBP 2.5bn).
Johnson & Johnson 2009/2011 In 2009, J&J announced a global restructuring initiative with savings potential of USD 1.5bn in 2011. There was no restructuring charge in 2012.
Bayer 2010 Target of EUR 800mn (54% in healthcare, 34% CropScience, 12% Holding & Administration) annual cost savings by 2013, one-time charge of approx. EUR 1bn already booked.
Merck KGaA 2012 "Fit for 2018" efficiency program announced in FY12. Projects include consolidating headquarters and sites as well as optimizing SG&A and R&D. Financial cornerstones: EUR 385mn net savings, EUR 820mn restructuring costs. In FY12, savings implemented rose faster than planned which means EUR 115mn compared to planned EUR 55mn.
Merck & Co. 2013 In October 2013, Merck Co. announced a new global restructuring program ("2013 Restructuring Program) as part of a global initiative to sharpen R&D focus. The company expects to reduce the workforce by 8,500 positions. In 9M13, Merck recorded total pretax restructuring costs of USD 544mn. The 2013 Restructuring Program is expected to be substantially completed by the end of 2015, with the cumulative pretax costs estimated to be approximately USD 2.5bn to USD 3.0bn. In 2010, subsequent to the Merck and Schering-Plough Corporation (“Schering-Plough”) merger (the “Merger”), the company commenced actions under a global restructuring program (the “Merger Restructuring Program”)
Novartis 2012 Novartis announced the restructuring of its US Pharmaceuticals business to strengthen its competitive position in light of the loss of patent protection for Diovan. The restructuring of the US General Medicines business resulted in a reduction of 1,960 positions and leads to an exceptional charge of USD 160 million in the first quarter of 2012 and to expected annual savings of approximately USD 450 million by 2013.
Pfizer 2009 With respect to the 2009 announcements, Pfizer achieved its-reduction goal by the end of 2011, a year earlier than expected. In 2013, Pfizer expects to incur approximately USD 500-USD800 mn (after tax) in costs in connection with the ongoing cost-reduction/productivity initiatives.
Roche 2012 During 2012, Roche initiated several global restructuring plans with total costs of CHF 1,436mn (Pharma R&D: CHF 596mn, Diagnostics CHF 180mn, Pharma Informatics CHF 49mn, other plans CHF 611mn). Roche anticipates net savings in the amount of CHF 580mn p.a (2013: CHF 500mn, 2014: CHF 580mn).
Sanofi-Aventis 2009 Restructuring program (organizational structure, R&D operations) with expected annual cost savings of EUR 2bn by 2013 vs. 2008. In 2012, Sanofi reported restructuring costs of EUR 1.14bn. (FY11: EUR 1.31bn).
Teva 2012 Teva announced its program in December 2012 and included actions to divest non-core assets, increase organizational effectiveness, improve manufacturing efficiency and reduce excess capacity. Teva will reduce its global workforce by 10% and will complete the majority by the end of 2014. Recently, Teva accelerated its cost reduction program. The company expects to realize USD 2bn in annual cost savings by FY17E. Teva estimates that USD 1bn (50%) will be realized by the end of FY14 and 70% by FY15E.
Source: Company data, UniCredit Research
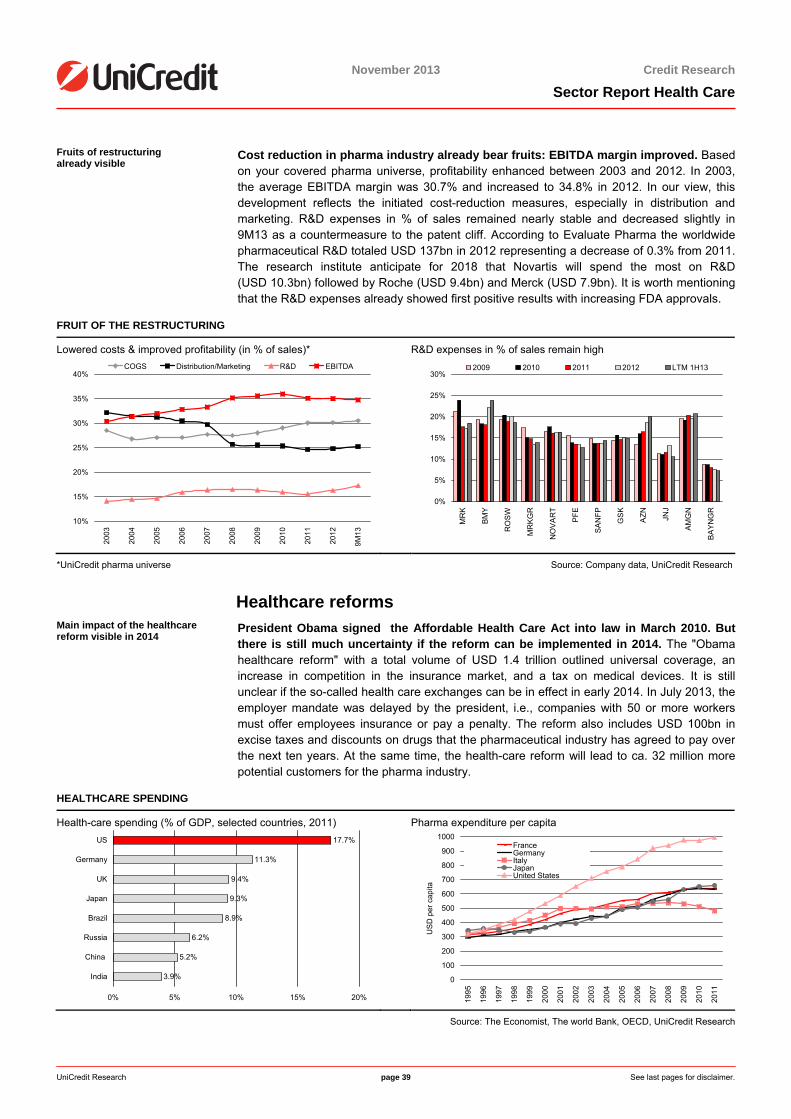
<date>
November 2013 Credit Research
Sector Report Health Care
UniCredit Research page 39 See last pages for disclaimer.
Fruits of restructuring already visible
Cost reduction in pharma industry already bear fruits: EBITDA margin improved. Based on your covered pharma universe, profitability enhanced between 2003 and 2012. In 2003,the average EBITDA margin was 30.7% and increased to 34.8% in 2012. In our view, thisdevelopment reflects the initiated cost-reduction measures, especially in distribution and marketing. R&D expenses in % of sales remained nearly stable and decreased slightly in 9M13 as a countermeasure to the patent cliff. According to Evaluate Pharma the worldwide pharmaceutical R&D totaled USD 137bn in 2012 representing a decrease of 0.3% from 2011. The research institute anticipate for 2018 that Novartis will spend the most on R&D(USD 10.3bn) followed by Roche (USD 9.4bn) and Merck (USD 7.9bn). It is worth mentioningthat the R&D expenses already showed first positive results with increasing FDA approvals.
FRUIT OF THE RESTRUCTURING
Lowered costs & improved profitability (in % of sales)* R&D expenses in % of sales remain high
10%
15%
20%
25%
30%
35%
40%
2003
2004
2005
2006
2007
2008
2009
2010
2011
2012
9M13
COGS Distribution/Marketing R&D EBITDA
0%
5%
10%
15%
20%
25%
30%
MR
K
BMY
RO
SW
MR
KGR
NO
VA
RT
PFE
SAN
FP
GS
K
AZN JN
J
AM
GN
BA
YN
GR
2009 2010 2011 2012 LTM 1H13
*UniCredit pharma universe Source: Company data, UniCredit Research
Healthcare reforms Main impact of the healthcare reform visible in 2014
President Obama signed the Affordable Health Care Act into law in March 2010. But there is still much uncertainty if the reform can be implemented in 2014. The "Obama healthcare reform" with a total volume of USD 1.4 trillion outlined universal coverage, an increase in competition in the insurance market, and a tax on medical devices. It is still unclear if the so-called health care exchanges can be in effect in early 2014. In July 2013, the employer mandate was delayed by the president, i.e., companies with 50 or more workers must offer employees insurance or pay a penalty. The reform also includes USD 100bn inexcise taxes and discounts on drugs that the pharmaceutical industry has agreed to pay overthe next ten years. At the same time, the health-care reform will lead to ca. 32 million more potential customers for the pharma industry.
HEALTHCARE SPENDING
Health-care spending (% of GDP, selected countries, 2011) Pharma expenditure per capita
3.9%
5.2%
6.2%
8.9%
9.3%
9.4%
11.3%
17.7%
0% 5% 10% 15% 20%
India
China
Russia
Brazil
Japan
UK
Germany
US
0
100
200
300
400
500
600
700
800
900
1000
1995
1996
1997
1998
1999
2000
2001
2002
2003
2004
2005
2006
2007
2008
2009
2010
2011
US
D p
er c
apita
FranceGermanyItalyJapanUnited States
Source: The Economist, The world Bank, OECD, UniCredit Research

<date>
November 2013 Credit Research
Sector Report Health Care
UniCredit Research page 40 See last pages for disclaimer.
US drug prices are the highest in the world Switch to generics will help to reduce costs
The US market is very important for the pharma industry due to the attractive price level.Branded drug prices in the US are not capped, which offers the opportunity for higher cash flows. According to IMS Health, US prescription drug sales account for more than 30% ofglobal pharma revenues (25% Europe). Government projections show that the averageannual growth in health-care spending in the US will be 6.2% per year through 2018,outpacing annual growth in the overall economy by 2.1% per year. Current US drug prices arethe highest in the world. The following table shows the difference in international prices for 150 branded drugs in comparison to the UK (price index = 100). The leading countries basedon price levels are the US, Germany, Ireland and Sweden.
DRUG PRICES COMPARISON
Country 2009 2009 rank 2010 2010 rankUS 249 1 281 1Germany 169 2 155 2Ireland 144 3 133 3Belgium 132 4 122 5Finland 113 10 105 9The Netherlands n.a. 12 n.a. 12Austria 125 6 117 6France 115 9 104 10Sweden 126 5 130 4
Source: UK Department of Health, UniCredit Research
EU pricing situation remains tough
The EU pricing situation for pharmaceuticals will remain tough. In Europe, prices are capped by governments and new high-priced medicines are difficult to market. Therefore,margins in Europe are lower in comparison to the US. Austerity measures in Europe will limit consumers’ access to healthcare going forward and reduce demand for medical devices,mainly in Greece, Spain, Italy and Portugal. Companies with more specialty care drugportfolios such as Roche and Sanofi will be hurt the least by pricing pressure in Europe. It is worth mentioning that price cuts often have a domino effect across Europe. Companies withlarger primary care portfolios, such as Glaxo Smithkline, have suffered the most mainly due to achange in reference pricing baskets which generally include the lowest drug prices across countries.
Emerging markets are the growth driver going forward… …but risks remain
Emerging markets and especially China are the growth drivers for pharma companies going forward. China's healthcare reform plan of 2009 included a budget of USD 124bn between 2009-2011 to support healthcare coverage of >90% of inhabitants (95% was alreadyreached in 2012). In general, China's future healthcare spending may rise from USD 357bn in 2011 to about USD 1,000bn in 2020. This corresponds with a healthcare spending CAGR of 12%. Nevertheless, only drugs which are listed in the EDL list (essential drug list) arereimbursed by the public health insurance system in China. Therefore, IMS Health anticipatesonly a slight increase in drug spending going forward, mainly as new approved drugs are covered only by private insurance. That said, volume growth over the next few years is coming more from generics and OTC rather than branded drugs. So pharma and healthcarespending as percent of GDP will also, in the future, lag behind Western Europe, US and Japan. In addition, there are also risks - intellectual property rights in emerging markets, particularly India and China are much weaker protected than in developed countries. Recently, an Indian court decided to deny Novartis' challenge over the rejection of a patent forcancer medicine Glived, although nearly 40 countries have already granted a patent.

<date>
November 2013 Credit Research
Sector Report Health Care
UniCredit Research page 41 See last pages for disclaimer.
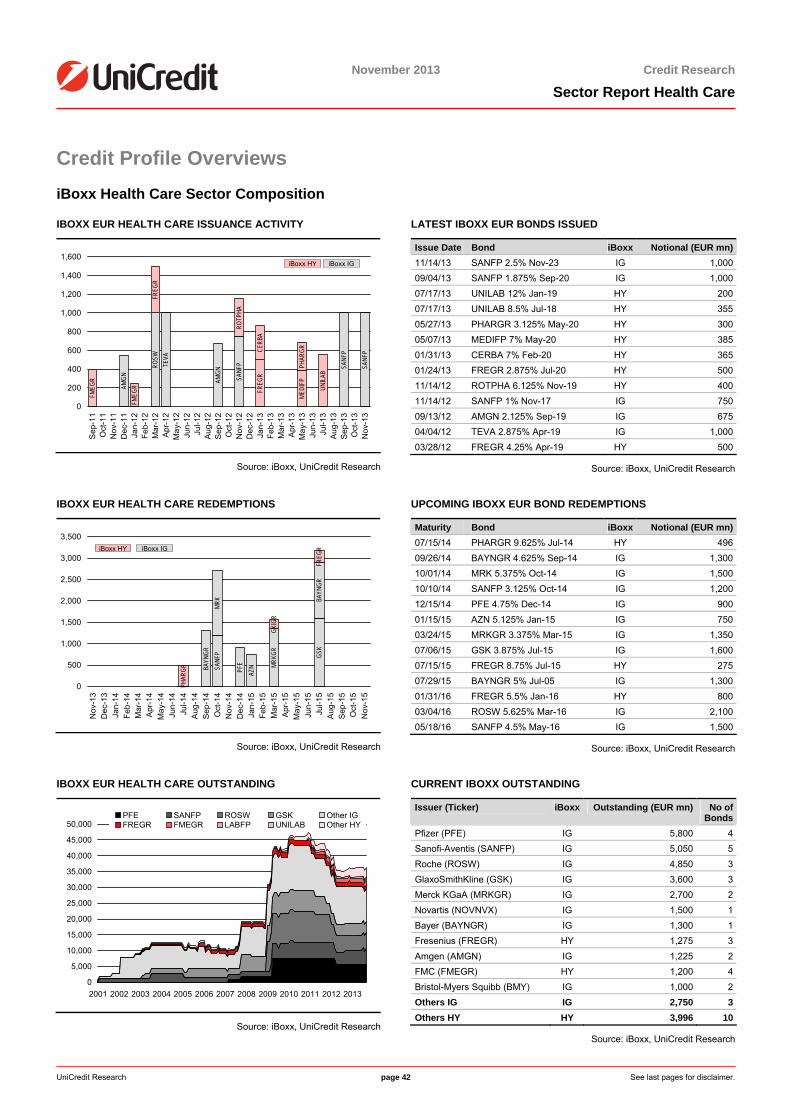
<date>
November 2013 Credit Research
Sector Report Health Care
UniCredit Research page 42 See last pages for disclaimer.
Credit Profile Overviews iBoxx Health Care Sector Composition
IBOXX EUR HEALTH CARE ISSUANCE ACTIVITY
SANF
P
SANF
P
SANF
PROSW
AMGN
AMGN
TEVA
FREG
R
FREG
R
FMEG
R
FMEG
R
UNILA
B
ROTP
HA
MEDI
FP
CERB
A
PHAR
GR
0
200
400
600
800
1,000
1,200
1,400
1,600
Sep
-11
Oct
-11
Nov
-11
Dec
-11
Jan-
12Fe
b-12
Mar
-12
Apr
-12
May
-12
Jun-
12Ju
l-12
Aug
-12
Sep
-12
Oct
-12
Nov
-12
Dec
-12
Jan-
13Fe
b-13
Mar
-13
Apr
-13
May
-13
Jun-
13Ju
l-13
Aug
-13
Sep
-13
Oct
-13
Nov
-13
iBoxx IGiBoxx HY
Source: iBoxx, UniCredit Research
LATEST IBOXX EUR BONDS ISSUED
Issue Date Bond iBoxx Notional (EUR mn)11/14/13 SANFP 2.5% Nov-23 IG 1,00009/04/13 SANFP 1.875% Sep-20 IG 1,00007/17/13 UNILAB 12% Jan-19 HY 20007/17/13 UNILAB 8.5% Jul-18 HY 35505/27/13 PHARGR 3.125% May-20 HY 30005/07/13 MEDIFP 7% May-20 HY 38501/31/13 CERBA 7% Feb-20 HY 36501/24/13 FREGR 2.875% Jul-20 HY 50011/14/12 ROTPHA 6.125% Nov-19 HY 40011/14/12 SANFP 1% Nov-17 IG 75009/13/12 AMGN 2.125% Sep-19 IG 67504/04/12 TEVA 2.875% Apr-19 IG 1,00003/28/12 FREGR 4.25% Apr-19 HY 500
Source: iBoxx, UniCredit Research
IBOXX EUR HEALTH CARE REDEMPTIONS
PFESANF
P GSK
MRKG
R
BAYN
GR
BAYN
GR
AZN
MRK
FREG
R
GXIG
R
PHAR
GR
0
500
1,000
1,500
2,000
2,500
3,000
3,500
Nov
-13
Dec
-13
Jan-
14Fe
b-14
Mar
-14
Apr
-14
May
-14
Jun-
14Ju
l-14
Aug
-14
Sep
-14
Oct
-14
Nov
-14
Dec
-14
Jan-
15Fe
b-15
Mar
-15
Apr
-15
May
-15
Jun-
15Ju
l-15
Aug
-15
Sep
-15
Oct
-15
Nov
-15
iBoxx IGiBoxx HY
Source: iBoxx, UniCredit Research
UPCOMING IBOXX EUR BOND REDEMPTIONS
Maturity Bond iBoxx Notional (EUR mn)07/15/14 PHARGR 9.625% Jul-14 HY 49609/26/14 BAYNGR 4.625% Sep-14 IG 1,30010/01/14 MRK 5.375% Oct-14 IG 1,50010/10/14 SANFP 3.125% Oct-14 IG 1,20012/15/14 PFE 4.75% Dec-14 IG 90001/15/15 AZN 5.125% Jan-15 IG 75003/24/15 MRKGR 3.375% Mar-15 IG 1,35007/06/15 GSK 3.875% Jul-15 IG 1,60007/15/15 FREGR 8.75% Jul-15 HY 27507/29/15 BAYNGR 5% Jul-05 IG 1,30001/31/16 FREGR 5.5% Jan-16 HY 80003/04/16 ROSW 5.625% Mar-16 IG 2,10005/18/16 SANFP 4.5% May-16 IG 1,500
Source: iBoxx, UniCredit Research
IBOXX EUR HEALTH CARE OUTSTANDING
0
5,000
10,000
15,000
20,000
25,000
30,000
35,000
40,000
45,000
50,000
2001 2002 2003 2004 2005 2006 2007 2008 2009 2010 2011 2012 2013
PFE SANFP ROSW GSK Other IGFREGR FMEGR LABFP UNILAB Other HY
Source: iBoxx, UniCredit Research
CURRENT IBOXX OUTSTANDING
Issuer (Ticker) iBoxx Outstanding (EUR mn) No of Bonds
Pfizer (PFE) IG 5,800 4Sanofi-Aventis (SANFP) IG 5,050 5Roche (ROSW) IG 4,850 3GlaxoSmithKline (GSK) IG 3,600 3Merck KGaA (MRKGR) IG 2,700 2Novartis (NOVNVX) IG 1,500 1Bayer (BAYNGR) IG 1,300 1Fresenius (FREGR) HY 1,275 3Amgen (AMGN) IG 1,225 2FMC (FMEGR) HY 1,200 4Bristol-Myers Squibb (BMY) IG 1,000 2Others IG IG 2,750 3Others HY HY 3,996 10
Source: iBoxx, UniCredit Research
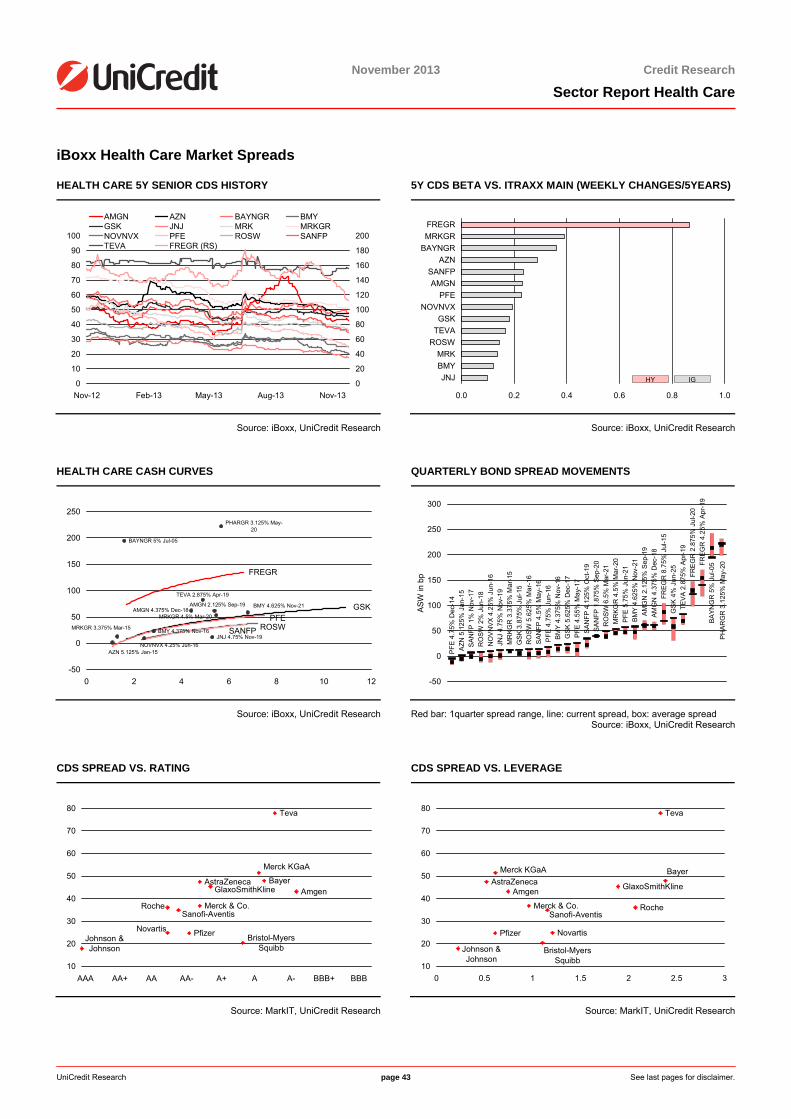
<date>
November 2013 Credit Research
Sector Report Health Care
UniCredit Research page 43 See last pages for disclaimer.
iBoxx Health Care Market Spreads
HEALTH CARE 5Y SENIOR CDS HISTORY
0
10
20
30
40
50
60
70
80
90
100
Nov-12 Feb-13 May-13 Aug-13 Nov-130
20
40
60
80
100
120
140
160
180
200
AMGN AZN BAYNGR BMYGSK JNJ MRK MRKGRNOVNVX PFE ROSW SANFPTEVA FREGR (RS)
Source: iBoxx, UniCredit Research
5Y CDS BETA VS. ITRAXX MAIN (WEEKLY CHANGES/5YEARS)
0.0 0.2 0.4 0.6 0.8 1.0
JNJBMYMRK
ROSWTEVAGSK
NOVNVXPFE
AMGNSANFP
AZNBAYNGRMRKGRFREGR
IGHY
Source: iBoxx, UniCredit Research
HEALTH CARE CASH CURVES
PHARGR 3.125% May-20
BAYNGR 5% Jul-05
TEVA 2.875% Apr-19
AMGN 4.375% Dec-18AMGN 2.125% Sep-19 BMY 4.625% Nov-21
MRKGR 4.5% Mar-20
BMY 4.375% Nov-16MRKGR 3.375% Mar-15
JNJ 4.75% Nov-19NOVNVX 4.25% Jun-16
AZN 5.125% Jan-15
SANFP ROSWPFE
GSK
FREGR
-50
0
50
100
150
200
250
0 2 4 6 8 10 12
Source: iBoxx, UniCredit Research
QUARTERLY BOND SPREAD MOVEMENTS
PFE
4.75
% D
ec-1
4AZ
N 5
.125
% J
an-1
5SA
NFP
1%
Nov
-17
RO
SW 2
% J
un-1
8N
OV
NVX
4.2
5% J
un-1
6JN
J 4.
75%
Nov
-19
MR
KGR
3.3
75%
Mar
-15
GS
K 3.
875%
Jul
-15
RO
SW 5
.625
% M
ar-1
6SA
NFP
4.5
% M
ay-1
6P
FE 4
.75%
Jun
-16
BM
Y 4
.375
% N
ov-1
6G
SK 5
.625
% D
ec-1
7PF
E 4
.55%
May
-17
SAN
FP 4
.125
% O
ct-1
9SA
NFP
1.8
75%
Sep
-20
RO
SW 6
.5%
Mar
-21
MR
KGR
4.5
% M
ar-2
0P
FE 5
.75%
Jun
-21
BM
Y 4
.625
% N
ov-2
1A
MG
N 2
.125
% S
ep-1
9AM
GN
4.3
75%
Dec
-18
FREG
R 8
.75%
Jul
-15
GS
K 4%
Jun
-25
TEVA
2.8
75%
Apr
-19
FRE
GR
2.8
75%
Jul
-20
FREG
R 4
.25%
Apr
-19
BAYN
GR
5%
Jul
-05
PH
ARG
R 3
.125
% M
ay-2
0
-50
0
50
100
150
200
250
300
ASW
in b
p
Red bar: 1quarter spread range, line: current spread, box: average spread Source: iBoxx, UniCredit Research
CDS SPREAD VS. RATING
Teva
Sanofi-AventisRoche
PfizerNovartis
Merck KGaA
Merck & Co.
Johnson & Johnson
GlaxoSmithKline
Bristol-Myers Squibb
BayerAstraZenecaAmgen
10
20
30
40
50
60
70
80
1 2 3 4 5 6 7 8 9 10 AAA AA+ AA AA- A+ A A- BBB+ BBB
Source: MarkIT, UniCredit Research
CDS SPREAD VS. LEVERAGE
Teva
Sanofi-AventisRoche
Pfizer Novartis
Merck KGaA
Merck & Co.
Johnson & Johnson
GlaxoSmithKline
Bristol-Myers Squibb
BayerAstraZeneca
Amgen
10
20
30
40
50
60
70
80
0 0.5 1 1.5 2 2.5 3
Source: MarkIT, UniCredit Research
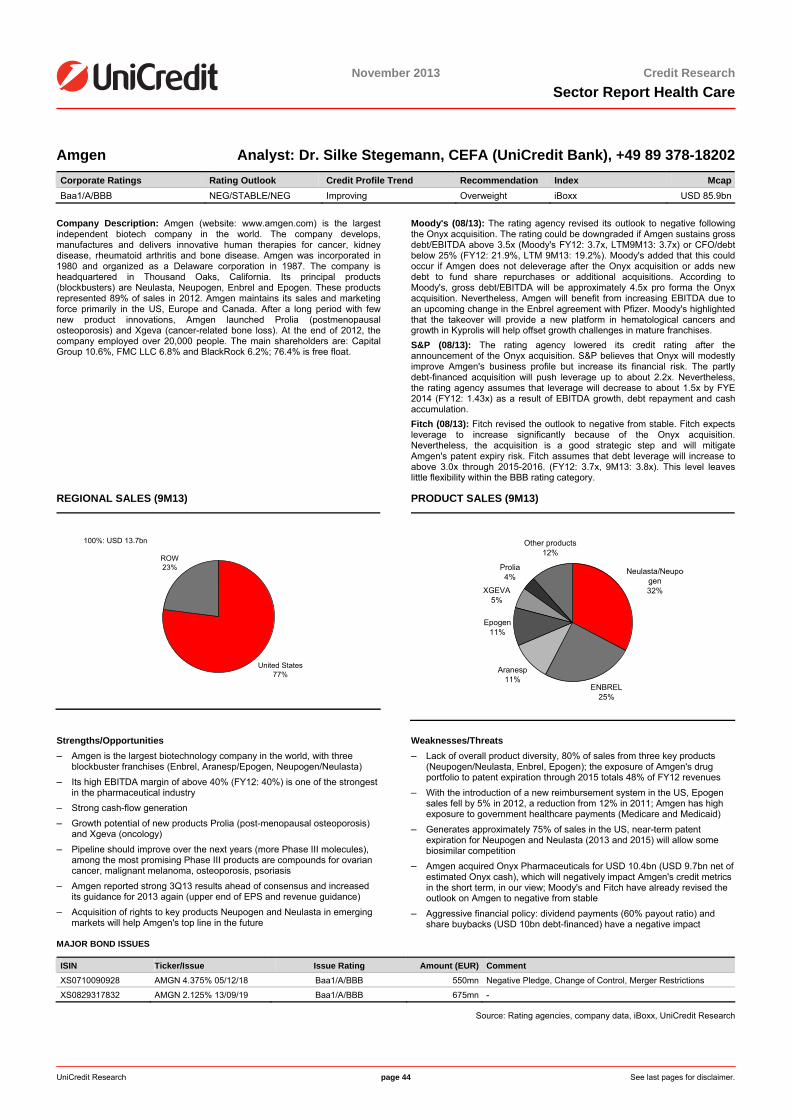
<date>
November 2013 Credit ResearchSector Report Health Care
UniCredit Research page 44 See last pages for disclaimer.
Amgen Analyst: Dr. Silke Stegemann, CEFA (UniCredit Bank), +49 89 378-18202 Corporate Ratings Rating Outlook Credit Profile Trend Recommendation Index McapBaa1/A/BBB NEG/STABLE/NEG Improving Overweight iBoxx USD 85.9bn
Company Description: Amgen (website: www.amgen.com) is the largest independent biotech company in the world. The company develops, manufactures and delivers innovative human therapies for cancer, kidney disease, rheumatoid arthritis and bone disease. Amgen was incorporated in 1980 and organized as a Delaware corporation in 1987. The company is headquartered in Thousand Oaks, California. Its principal products (blockbusters) are Neulasta, Neupogen, Enbrel and Epogen. These products represented 89% of sales in 2012. Amgen maintains its sales and marketing force primarily in the US, Europe and Canada. After a long period with few new product innovations, Amgen launched Prolia (postmenopausal osteoporosis) and Xgeva (cancer-related bone loss). At the end of 2012, the company employed over 20,000 people. The main shareholders are: Capital Group 10.6%, FMC LLC 6.8% and BlackRock 6.2%; 76.4% is free float.
Moody's (08/13): The rating agency revised its outlook to negative following the Onyx acquisition. The rating could be downgraded if Amgen sustains gross debt/EBITDA above 3.5x (Moody's FY12: 3.7x, LTM9M13: 3.7x) or CFO/debt below 25% (FY12: 21.9%, LTM 9M13: 19.2%). Moody's added that this could occur if Amgen does not deleverage after the Onyx acquisition or adds new debt to fund share repurchases or additional acquisitions. According to Moody's, gross debt/EBITDA will be approximately 4.5x pro forma the Onyx acquisition. Nevertheless, Amgen will benefit from increasing EBITDA due to an upcoming change in the Enbrel agreement with Pfizer. Moody's highlighted that the takeover will provide a new platform in hematological cancers and growth in Kyprolis will help offset growth challenges in mature franchises. S&P (08/13): The rating agency lowered its credit rating after the announcement of the Onyx acquisition. S&P believes that Onyx will modestly improve Amgen's business profile but increase its financial risk. The partly debt-financed acquisition will push leverage up to about 2.2x. Nevertheless, the rating agency assumes that leverage will decrease to about 1.5x by FYE 2014 (FY12: 1.43x) as a result of EBITDA growth, debt repayment and cash accumulation. Fitch (08/13): Fitch revised the outlook to negative from stable. Fitch expects leverage to increase significantly because of the Onyx acquisition. Nevertheless, the acquisition is a good strategic step and will mitigate Amgen's patent expiry risk. Fitch assumes that debt leverage will increase to above 3.0x through 2015-2016. (FY12: 3.7x, 9M13: 3.8x). This level leaves little flexibility within the BBB rating category.
REGIONAL SALES (9M13)
United States77%
ROW23%
100%: USD 13.7bn
PRODUCT SALES (9M13)
Neulasta/Neupo-gen32%
ENBREL25%
Aranesp11%
Epogen11%
XGEVA5%
Prolia4%
Other products12%
Strengths/Opportunities – Amgen is the largest biotechnology company in the world, with three
blockbuster franchises (Enbrel, Aranesp/Epogen, Neupogen/Neulasta) – Its high EBITDA margin of above 40% (FY12: 40%) is one of the strongest
in the pharmaceutical industry – Strong cash-flow generation – Growth potential of new products Prolia (post-menopausal osteoporosis)
and Xgeva (oncology) – Pipeline should improve over the next years (more Phase III molecules),
among the most promising Phase III products are compounds for ovarian cancer, malignant melanoma, osteoporosis, psoriasis
– Amgen reported strong 3Q13 results ahead of consensus and increased its guidance for 2013 again (upper end of EPS and revenue guidance)
– Acquisition of rights to key products Neupogen and Neulasta in emerging markets will help Amgen's top line in the future
Weaknesses/Threats – Lack of overall product diversity, 80% of sales from three key products
(Neupogen/Neulasta, Enbrel, Epogen); the exposure of Amgen's drug portfolio to patent expiration through 2015 totals 48% of FY12 revenues
– With the introduction of a new reimbursement system in the US, Epogen sales fell by 5% in 2012, a reduction from 12% in 2011; Amgen has high exposure to government healthcare payments (Medicare and Medicaid)
– Generates approximately 75% of sales in the US, near-term patent expiration for Neupogen and Neulasta (2013 and 2015) will allow some biosimilar competition
– Amgen acquired Onyx Pharmaceuticals for USD 10.4bn (USD 9.7bn net of estimated Onyx cash), which will negatively impact Amgen's credit metrics in the short term, in our view; Moody's and Fitch have already revised the outlook on Amgen to negative from stable
– Aggressive financial policy: dividend payments (60% payout ratio) and share buybacks (USD 10bn debt-financed) have a negative impact
MAJOR BOND ISSUES
ISIN Ticker/Issue Issue Rating Amount (EUR) Comment XS0710090928 AMGN 4.375% 05/12/18 Baa1/A/BBB 550mn Negative Pledge, Change of Control, Merger Restrictions
XS0829317832 AMGN 2.125% 13/09/19 Baa1/A/BBB 675mn -
Source: Rating agencies, company data, iBoxx, UniCredit Research
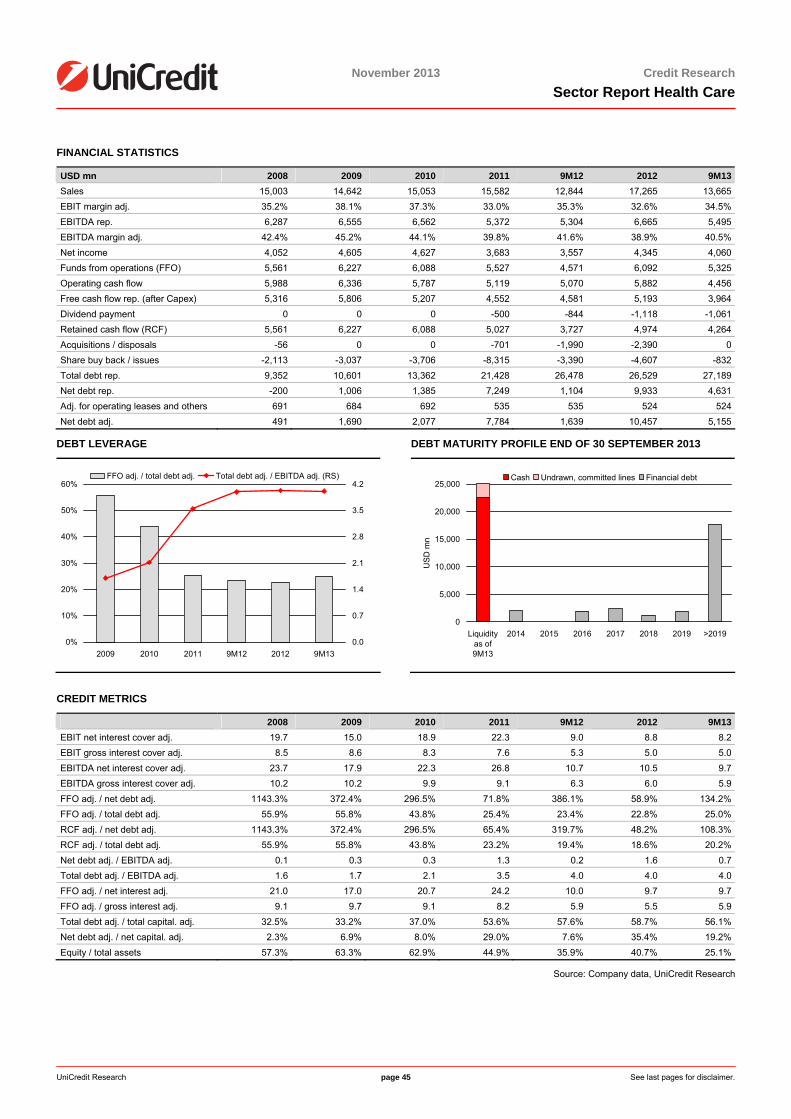
<date>
UniCredit Research page 45 See last pages for disclaimer.
November 2013 Credit ResearchSector Report Health Care
FINANCIAL STATISTICS
USD mn 2008 2009 2010 2011 9M12 2012 9M13Sales 15,003 14,642 15,053 15,582 12,844 17,265 13,665EBIT margin adj. 35.2% 38.1% 37.3% 33.0% 35.3% 32.6% 34.5%EBITDA rep. 6,287 6,555 6,562 5,372 5,304 6,665 5,495EBITDA margin adj. 42.4% 45.2% 44.1% 39.8% 41.6% 38.9% 40.5%Net income 4,052 4,605 4,627 3,683 3,557 4,345 4,060Funds from operations (FFO) 5,561 6,227 6,088 5,527 4,571 6,092 5,325Operating cash flow 5,988 6,336 5,787 5,119 5,070 5,882 4,456Free cash flow rep. (after Capex) 5,316 5,806 5,207 4,552 4,581 5,193 3,964Dividend payment 0 0 0 -500 -844 -1,118 -1,061Retained cash flow (RCF) 5,561 6,227 6,088 5,027 3,727 4,974 4,264Acquisitions / disposals -56 0 0 -701 -1,990 -2,390 0Share buy back / issues -2,113 -3,037 -3,706 -8,315 -3,390 -4,607 -832Total debt rep. 9,352 10,601 13,362 21,428 26,478 26,529 27,189Net debt rep. -200 1,006 1,385 7,249 1,104 9,933 4,631Adj. for operating leases and others 691 684 692 535 535 524 524Net debt adj. 491 1,690 2,077 7,784 1,639 10,457 5,155
DEBT LEVERAGE
0%
10%
20%
30%
40%
50%
60%
2009 2010 2011 9M12 2012 9M130.0
0.7
1.4
2.1
2.8
3.5
4.2FFO adj. / total debt adj. Total debt adj. / EBITDA adj. (RS)
DEBT MATURITY PROFILE END OF 30 SEPTEMBER 2013
0
5,000
10,000
15,000
20,000
25,000
Liquidityas of9M13
2014 2015 2016 2017 2018 2019 >2019
USD
mn
Cash Undrawn, committed lines Financial debt
CREDIT METRICS
2008 2009 2010 2011 9M12 2012 9M13EBIT net interest cover adj. 19.7 15.0 18.9 22.3 9.0 8.8 8.2EBIT gross interest cover adj. 8.5 8.6 8.3 7.6 5.3 5.0 5.0EBITDA net interest cover adj. 23.7 17.9 22.3 26.8 10.7 10.5 9.7EBITDA gross interest cover adj. 10.2 10.2 9.9 9.1 6.3 6.0 5.9FFO adj. / net debt adj. 1143.3% 372.4% 296.5% 71.8% 386.1% 58.9% 134.2%FFO adj. / total debt adj. 55.9% 55.8% 43.8% 25.4% 23.4% 22.8% 25.0%RCF adj. / net debt adj. 1143.3% 372.4% 296.5% 65.4% 319.7% 48.2% 108.3%RCF adj. / total debt adj. 55.9% 55.8% 43.8% 23.2% 19.4% 18.6% 20.2%Net debt adj. / EBITDA adj. 0.1 0.3 0.3 1.3 0.2 1.6 0.7Total debt adj. / EBITDA adj. 1.6 1.7 2.1 3.5 4.0 4.0 4.0FFO adj. / net interest adj. 21.0 17.0 20.7 24.2 10.0 9.7 9.7FFO adj. / gross interest adj. 9.1 9.7 9.1 8.2 5.9 5.5 5.9Total debt adj. / total capital. adj. 32.5% 33.2% 37.0% 53.6% 57.6% 58.7% 56.1%Net debt adj. / net capital. adj. 2.3% 6.9% 8.0% 29.0% 7.6% 35.4% 19.2%Equity / total assets 57.3% 63.3% 62.9% 44.9% 35.9% 40.7% 25.1%
Source: Company data, UniCredit Research
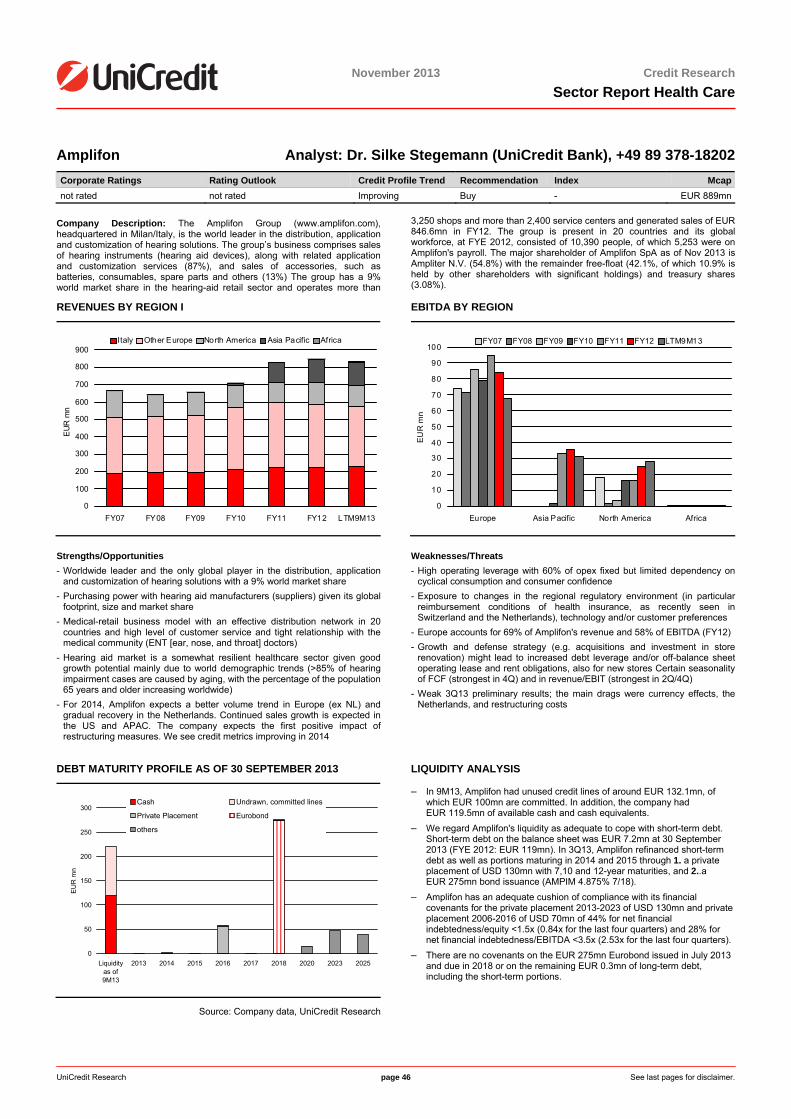
<date>
November 2013 Credit ResearchSector Report Health Care
UniCredit Research page 46 See last pages for disclaimer.
Amplifon Analyst: Dr. Silke Stegemann (UniCredit Bank), +49 89 378-18202 Corporate Ratings Rating Outlook Credit Profile Trend Recommendation Index Mcapnot rated not rated Improving Buy - EUR 889mn
Company Description: The Amplifon Group (www.amplifon.com), headquartered in Milan/Italy, is the world leader in the distribution, application and customization of hearing solutions. The group’s business comprises sales of hearing instruments (hearing aid devices), along with related application and customization services (87%), and sales of accessories, such as batteries, consumables, spare parts and others (13%) The group has a 9% world market share in the hearing-aid retail sector and operates more than
3,250 shops and more than 2,400 service centers and generated sales of EUR 846.6mn in FY12. The group is present in 20 countries and its global workforce, at FYE 2012, consisted of 10,390 people, of which 5,253 were on Amplifon's payroll. The major shareholder of Amplifon SpA as of Nov 2013 is Ampliter N.V. (54.8%) with the remainder free-float (42.1%, of which 10.9% is held by other shareholders with significant holdings) and treasury shares (3.08%).
REVENUES BY REGION I
0
100
200
300
400
500
600
700
800
900
FY07 FY08 FY09 FY10 FY11 FY12 LTM9M13
EUR
mn
Italy Other Europe North America Asia Pacific Africa
EBITDA BY REGION
0
10
20
30
40
50
60
70
80
90
100
Europe Asia Pacific North America Africa
EU
R m
n
FY07 FY08 FY09 FY10 FY11 FY12 LTM9M13
Strengths/Opportunities - Worldwide leader and the only global player in the distribution, application
and customization of hearing solutions with a 9% world market share - Purchasing power with hearing aid manufacturers (suppliers) given its global
footprint, size and market share - Medical-retail business model with an effective distribution network in 20
countries and high level of customer service and tight relationship with the medical community (ENT [ear, nose, and throat] doctors)
- Hearing aid market is a somewhat resilient healthcare sector given good growth potential mainly due to world demographic trends (>85% of hearing impairment cases are caused by aging, with the percentage of the population 65 years and older increasing worldwide)
- For 2014, Amplifon expects a better volume trend in Europe (ex NL) and gradual recovery in the Netherlands. Continued sales growth is expected in the US and APAC. The company expects the first positive impact of restructuring measures. We see credit metrics improving in 2014
Weaknesses/Threats - High operating leverage with 60% of opex fixed but limited dependency on
cyclical consumption and consumer confidence - Exposure to changes in the regional regulatory environment (in particular
reimbursement conditions of health insurance, as recently seen in Switzerland and the Netherlands), technology and/or customer preferences
- Europe accounts for 69% of Amplifon's revenue and 58% of EBITDA (FY12) - Growth and defense strategy (e.g. acquisitions and investment in store
renovation) might lead to increased debt leverage and/or off-balance sheet operating lease and rent obligations, also for new stores Certain seasonality of FCF (strongest in 4Q) and in revenue/EBIT (strongest in 2Q/4Q)
- Weak 3Q13 preliminary results; the main drags were currency effects, the Netherlands, and restructuring costs
DEBT MATURITY PROFILE AS OF 30 SEPTEMBER 2013
0
50
100
150
200
250
300
Liquidityas of9M13
2013 2014 2015 2016 2017 2018 2020 2023 2025
EUR
mn
Cash Undrawn, committed lines
Private Placement Eurobond
others
Source: Company data, UniCredit Research
LIQUIDITY ANALYSIS
– In 9M13, Amplifon had unused credit lines of around EUR 132.1mn, of which EUR 100mn are committed. In addition, the company had EUR 119.5mn of available cash and cash equivalents.
– We regard Amplifon's liquidity as adequate to cope with short-term debt. Short-term debt on the balance sheet was EUR 7.2mn at 30 September 2013 (FYE 2012: EUR 119mn). In 3Q13, Amplifon refinanced short-term debt as well as portions maturing in 2014 and 2015 through 1. a private placement of USD 130mn with 7,10 and 12-year maturities, and 2..a EUR 275mn bond issuance (AMPIM 4.875% 7/18).
– Amplifon has an adequate cushion of compliance with its financial covenants for the private placement 2013-2023 of USD 130mn and private placement 2006-2016 of USD 70mn of 44% for net financial indebtedness/equity <1.5x (0.84x for the last four quarters) and 28% for net financial indebtedness/EBITDA <3.5x (2.53x for the last four quarters).
– There are no covenants on the EUR 275mn Eurobond issued in July 2013 and due in 2018 or on the remaining EUR 0.3mn of long-term debt, including the short-term portions.
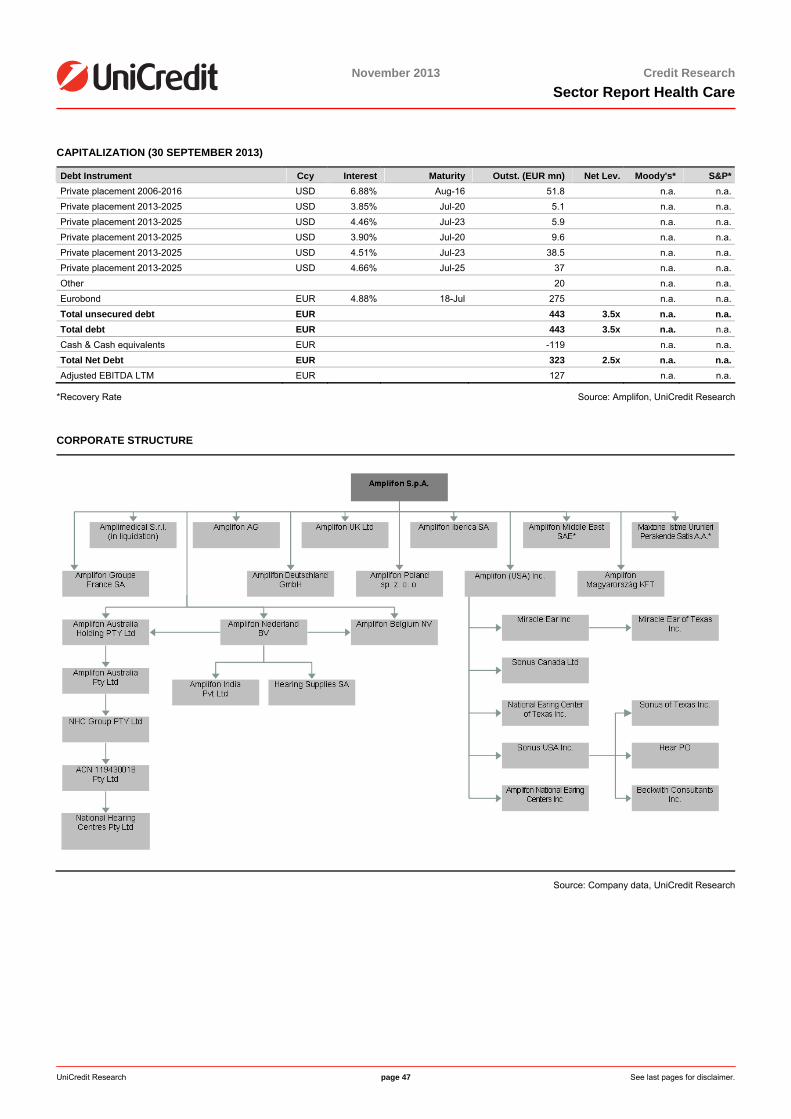
<date>
UniCredit Research page 47 See last pages for disclaimer.
November 2013 Credit ResearchSector Report Health Care
CAPITALIZATION (30 SEPTEMBER 2013)
Debt Instrument Ccy Interest Maturity Outst. (EUR mn) Net Lev. Moody's* S&P*Private placement 2006-2016 USD 6.88% Aug-16 51.8 n.a. n.a.Private placement 2013-2025 USD 3.85% Jul-20 5.1 n.a. n.a.Private placement 2013-2025 USD 4.46% Jul-23 5.9 n.a. n.a.Private placement 2013-2025 USD 3.90% Jul-20 9.6 n.a. n.a.Private placement 2013-2025 USD 4.51% Jul-23 38.5 n.a. n.a.Private placement 2013-2025 USD 4.66% Jul-25 37 n.a. n.a.Other 20 n.a. n.a.Eurobond EUR 4.88% 18-Jul 275 n.a. n.a.Total unsecured debt EUR 443 3.5x n.a. n.a.Total debt EUR 443 3.5x n.a. n.a.Cash & Cash equivalents EUR -119 n.a. n.a.Total Net Debt EUR 323 2.5x n.a. n.a.Adjusted EBITDA LTM EUR 127 n.a. n.a.
*Recovery Rate Source: Amplifon, UniCredit Research
CORPORATE STRUCTURE
Source: Company data, UniCredit Research
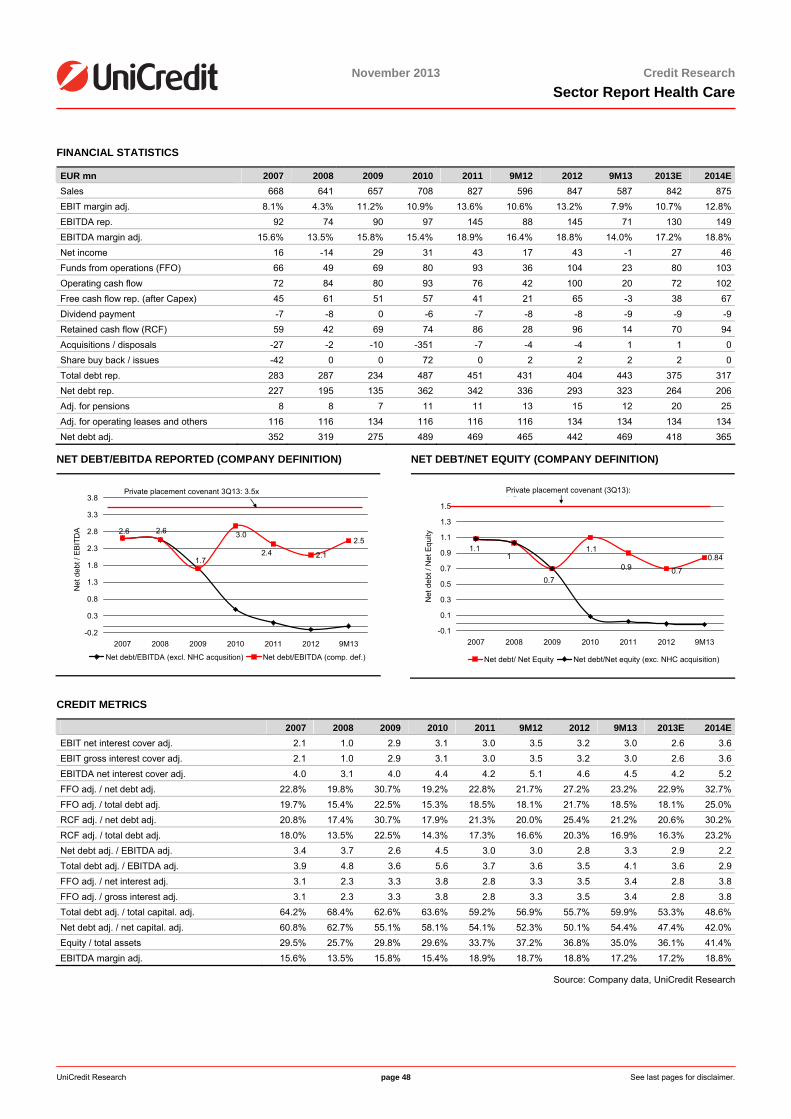
<date>
UniCredit Research page 48 See last pages for disclaimer.
November 2013 Credit ResearchSector Report Health Care
FINANCIAL STATISTICS
EUR mn 2007 2008 2009 2010 2011 9M12 2012 9M13 2013E 2014ESales 668 641 657 708 827 596 847 587 842 875EBIT margin adj. 8.1% 4.3% 11.2% 10.9% 13.6% 10.6% 13.2% 7.9% 10.7% 12.8%EBITDA rep. 92 74 90 97 145 88 145 71 130 149EBITDA margin adj. 15.6% 13.5% 15.8% 15.4% 18.9% 16.4% 18.8% 14.0% 17.2% 18.8%Net income 16 -14 29 31 43 17 43 -1 27 46Funds from operations (FFO) 66 49 69 80 93 36 104 23 80 103Operating cash flow 72 84 80 93 76 42 100 20 72 102Free cash flow rep. (after Capex) 45 61 51 57 41 21 65 -3 38 67Dividend payment -7 -8 0 -6 -7 -8 -8 -9 -9 -9Retained cash flow (RCF) 59 42 69 74 86 28 96 14 70 94Acquisitions / disposals -27 -2 -10 -351 -7 -4 -4 1 1 0Share buy back / issues -42 0 0 72 0 2 2 2 2 0Total debt rep. 283 287 234 487 451 431 404 443 375 317Net debt rep. 227 195 135 362 342 336 293 323 264 206Adj. for pensions 8 8 7 11 11 13 15 12 20 25Adj. for operating leases and others 116 116 134 116 116 116 134 134 134 134Net debt adj. 352 319 275 489 469 465 442 469 418 365
NET DEBT/EBITDA REPORTED (COMPANY DEFINITION)
2.1
2.53.0
2.41.7
2.62.6
-0.2
0.3
0.8
1.3
1.8
2.3
2.8
3.3
3.8
2007 2008 2009 2010 2011 2012 9M13
Net
deb
t / E
BIT
DA
Net debt/EBITDA (excl. NHC acqusition) Net debt/EBITDA (comp. def.)
Private placement covenant 3Q13: 3.5x
NET DEBT/NET EQUITY (COMPANY DEFINITION)
0.84
0.70.9
1.1
0.7
11.1
-0.1
0.1
0.3
0.5
0.7
0.9
1.1
1.3
1.5
2007 2008 2009 2010 2011 2012 9M13
Net
deb
t / N
et E
quity
Net debt/ Net Equity Net debt/Net equity (exc. NHC acquisition)
Private placement covenant (3Q13): 1 5
CREDIT METRICS
2007 2008 2009 2010 2011 9M12 2012 9M13 2013E 2014EEBIT net interest cover adj. 2.1 1.0 2.9 3.1 3.0 3.5 3.2 3.0 2.6 3.6EBIT gross interest cover adj. 2.1 1.0 2.9 3.1 3.0 3.5 3.2 3.0 2.6 3.6EBITDA net interest cover adj. 4.0 3.1 4.0 4.4 4.2 5.1 4.6 4.5 4.2 5.2FFO adj. / net debt adj. 22.8% 19.8% 30.7% 19.2% 22.8% 21.7% 27.2% 23.2% 22.9% 32.7%FFO adj. / total debt adj. 19.7% 15.4% 22.5% 15.3% 18.5% 18.1% 21.7% 18.5% 18.1% 25.0%RCF adj. / net debt adj. 20.8% 17.4% 30.7% 17.9% 21.3% 20.0% 25.4% 21.2% 20.6% 30.2%RCF adj. / total debt adj. 18.0% 13.5% 22.5% 14.3% 17.3% 16.6% 20.3% 16.9% 16.3% 23.2%Net debt adj. / EBITDA adj. 3.4 3.7 2.6 4.5 3.0 3.0 2.8 3.3 2.9 2.2Total debt adj. / EBITDA adj. 3.9 4.8 3.6 5.6 3.7 3.6 3.5 4.1 3.6 2.9FFO adj. / net interest adj. 3.1 2.3 3.3 3.8 2.8 3.3 3.5 3.4 2.8 3.8FFO adj. / gross interest adj. 3.1 2.3 3.3 3.8 2.8 3.3 3.5 3.4 2.8 3.8Total debt adj. / total capital. adj. 64.2% 68.4% 62.6% 63.6% 59.2% 56.9% 55.7% 59.9% 53.3% 48.6%Net debt adj. / net capital. adj. 60.8% 62.7% 55.1% 58.1% 54.1% 52.3% 50.1% 54.4% 47.4% 42.0%Equity / total assets 29.5% 25.7% 29.8% 29.6% 33.7% 37.2% 36.8% 35.0% 36.1% 41.4%EBITDA margin adj. 15.6% 13.5% 15.8% 15.4% 18.9% 18.7% 18.8% 17.2% 17.2% 18.8%
Source: Company data, UniCredit Research

<date>
November 2013 Credit ResearchSector Report Health Care
UniCredit Research page 49 See last pages for disclaimer.
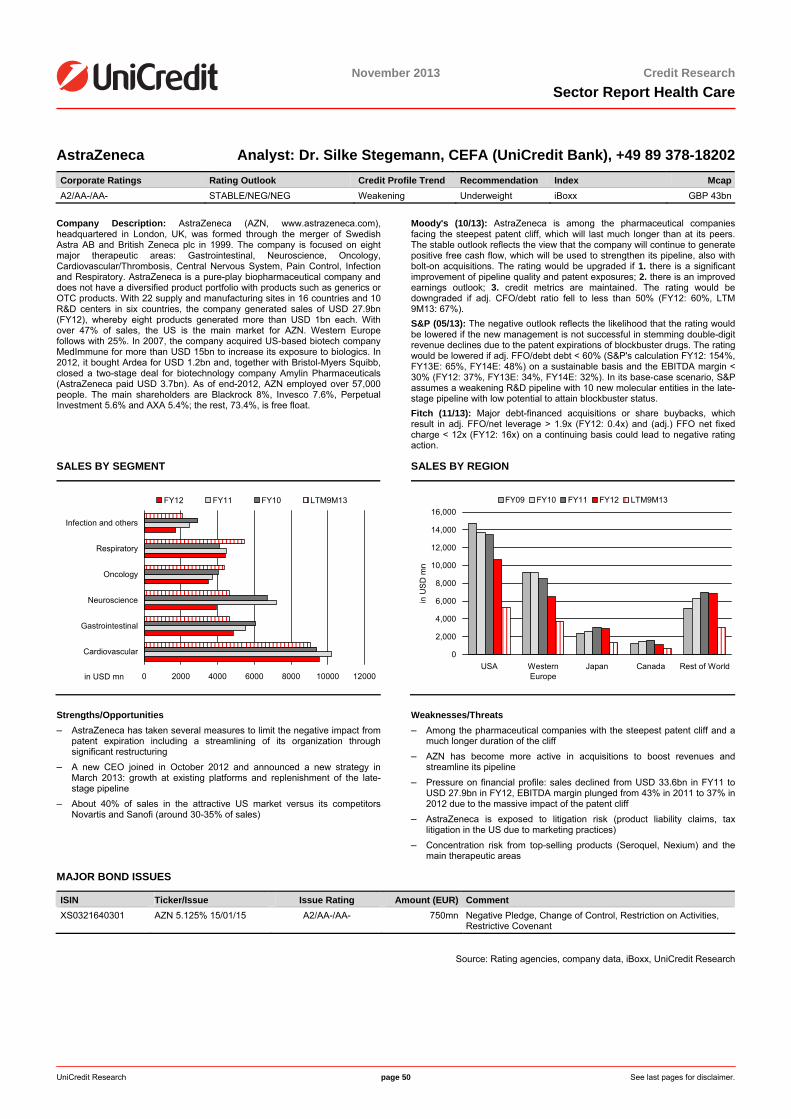
<date>
November 2013 Credit ResearchSector Report Health Care
UniCredit Research page 50 See last pages for disclaimer.
AstraZeneca Analyst: Dr. Silke Stegemann, CEFA (UniCredit Bank), +49 89 378-18202 Corporate Ratings Rating Outlook Credit Profile Trend Recommendation Index McapA2/AA-/AA- STABLE/NEG/NEG Weakening Underweight iBoxx GBP 43bn
Company Description: AstraZeneca (AZN, www.astrazeneca.com), headquartered in London, UK, was formed through the merger of Swedish Astra AB and British Zeneca plc in 1999. The company is focused on eight major therapeutic areas: Gastrointestinal, Neuroscience, Oncology, Cardiovascular/Thrombosis, Central Nervous System, Pain Control, Infection and Respiratory. AstraZeneca is a pure-play biopharmaceutical company and does not have a diversified product portfolio with products such as generics or OTC products. With 22 supply and manufacturing sites in 16 countries and 10 R&D centers in six countries, the company generated sales of USD 27.9bn (FY12), whereby eight products generated more than USD 1bn each. With over 47% of sales, the US is the main market for AZN. Western Europe follows with 25%. In 2007, the company acquired US-based biotech company MedImmune for more than USD 15bn to increase its exposure to biologics. In 2012, it bought Ardea for USD 1.2bn and, together with Bristol-Myers Squibb, closed a two-stage deal for biotechnology company Amylin Pharmaceuticals (AstraZeneca paid USD 3.7bn). As of end-2012, AZN employed over 57,000 people. The main shareholders are Blackrock 8%, Invesco 7.6%, Perpetual Investment 5.6% and AXA 5.4%; the rest, 73.4%, is free float.
Moody's (10/13): AstraZeneca is among the pharmaceutical companies facing the steepest patent cliff, which will last much longer than at its peers. The stable outlook reflects the view that the company will continue to generate positive free cash flow, which will be used to strengthen its pipeline, also with bolt-on acquisitions. The rating would be upgraded if 1. there is a significant improvement of pipeline quality and patent exposures; 2. there is an improved earnings outlook; 3. credit metrics are maintained. The rating would be downgraded if adj. CFO/debt ratio fell to less than 50% (FY12: 60%, LTM 9M13: 67%). S&P (05/13): The negative outlook reflects the likelihood that the rating would be lowered if the new management is not successful in stemming double-digit revenue declines due to the patent expirations of blockbuster drugs. The rating would be lowered if adj. FFO/debt debt < 60% (S&P's calculation FY12: 154%, FY13E: 65%, FY14E: 48%) on a sustainable basis and the EBITDA margin < 30% (FY12: 37%, FY13E: 34%, FY14E: 32%). In its base-case scenario, S&P assumes a weakening R&D pipeline with 10 new molecular entities in the late-stage pipeline with low potential to attain blockbuster status. Fitch (11/13): Major debt-financed acquisitions or share buybacks, which result in adj. FFO/net leverage > 1.9x (FY12: 0.4x) and (adj.) FFO net fixed charge < 12x (FY12: 16x) on a continuing basis could lead to negative rating action.
SALES BY SEGMENT
0 2000 4000 6000 8000 10000 12000
Cardiovascular
Gastrointestinal
Neuroscience
Oncology
Respiratory
Infection and others
FY12 FY11 FY10 LTM9M13
in USD mn
SALES BY REGION
0
2,000
4,000
6,000
8,000
10,000
12,000
14,000
16,000
USA WesternEurope
Japan Canada Rest of World
in U
SD
mn
FY09 FY10 FY11 FY12 LTM9M13
Strengths/Opportunities – AstraZeneca has taken several measures to limit the negative impact from
patent expiration including a streamlining of its organization through significant restructuring
– A new CEO joined in October 2012 and announced a new strategy in March 2013: growth at existing platforms and replenishment of the late-stage pipeline
– About 40% of sales in the attractive US market versus its competitors Novartis and Sanofi (around 30-35% of sales)
Weaknesses/Threats – Among the pharmaceutical companies with the steepest patent cliff and a
much longer duration of the cliff – AZN has become more active in acquisitions to boost revenues and
streamline its pipeline – Pressure on financial profile: sales declined from USD 33.6bn in FY11 to
USD 27.9bn in FY12, EBITDA margin plunged from 43% in 2011 to 37% in 2012 due to the massive impact of the patent cliff
– AstraZeneca is exposed to litigation risk (product liability claims, tax litigation in the US due to marketing practices)
– Concentration risk from top-selling products (Seroquel, Nexium) and the main therapeutic areas
MAJOR BOND ISSUES
ISIN Ticker/Issue Issue Rating Amount (EUR) Comment XS0321640301 AZN 5.125% 15/01/15 A2/AA-/AA- 750mn Negative Pledge, Change of Control, Restriction on Activities,
Restrictive Covenant
Source: Rating agencies, company data, iBoxx, UniCredit Research
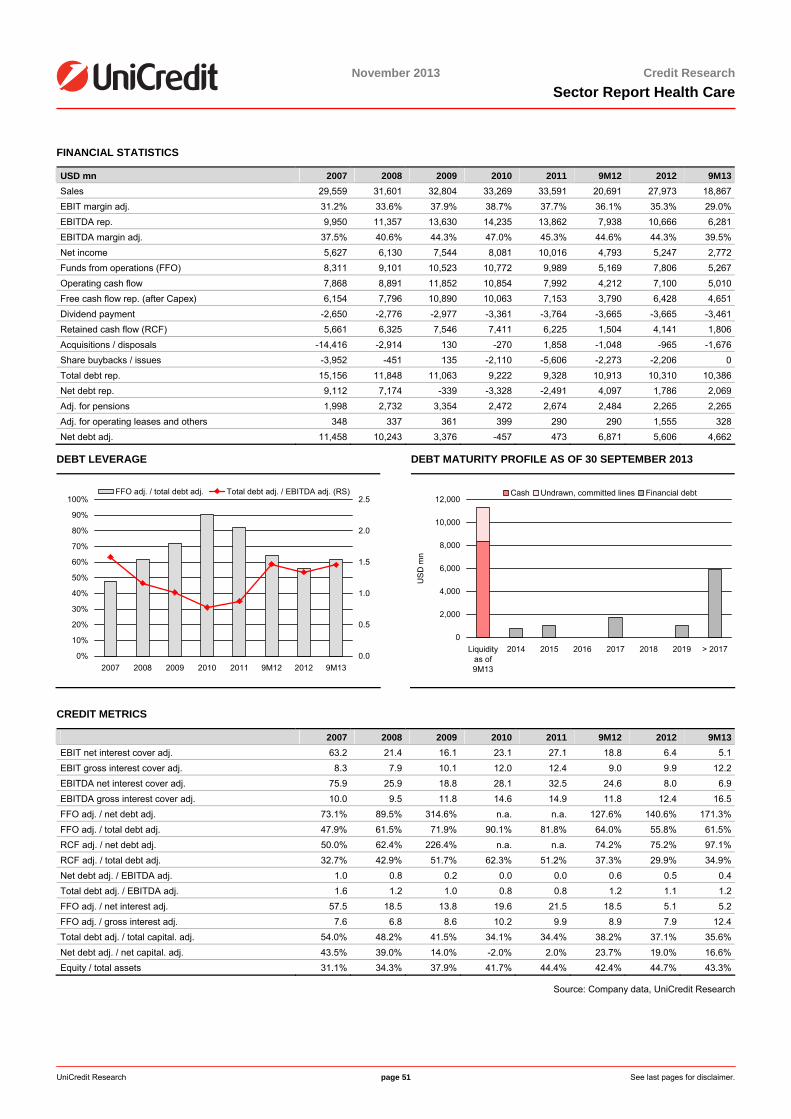
<date>
UniCredit Research page 51 See last pages for disclaimer.
November 2013 Credit ResearchSector Report Health Care
FINANCIAL STATISTICS
USD mn 2007 2008 2009 2010 2011 9M12 2012 9M13Sales 29,559 31,601 32,804 33,269 33,591 20,691 27,973 18,867EBIT margin adj. 31.2% 33.6% 37.9% 38.7% 37.7% 36.1% 35.3% 29.0%EBITDA rep. 9,950 11,357 13,630 14,235 13,862 7,938 10,666 6,281EBITDA margin adj. 37.5% 40.6% 44.3% 47.0% 45.3% 44.6% 44.3% 39.5%Net income 5,627 6,130 7,544 8,081 10,016 4,793 5,247 2,772Funds from operations (FFO) 8,311 9,101 10,523 10,772 9,989 5,169 7,806 5,267Operating cash flow 7,868 8,891 11,852 10,854 7,992 4,212 7,100 5,010Free cash flow rep. (after Capex) 6,154 7,796 10,890 10,063 7,153 3,790 6,428 4,651Dividend payment -2,650 -2,776 -2,977 -3,361 -3,764 -3,665 -3,665 -3,461Retained cash flow (RCF) 5,661 6,325 7,546 7,411 6,225 1,504 4,141 1,806Acquisitions / disposals -14,416 -2,914 130 -270 1,858 -1,048 -965 -1,676Share buybacks / issues -3,952 -451 135 -2,110 -5,606 -2,273 -2,206 0Total debt rep. 15,156 11,848 11,063 9,222 9,328 10,913 10,310 10,386Net debt rep. 9,112 7,174 -339 -3,328 -2,491 4,097 1,786 2,069Adj. for pensions 1,998 2,732 3,354 2,472 2,674 2,484 2,265 2,265Adj. for operating leases and others 348 337 361 399 290 290 1,555 328Net debt adj. 11,458 10,243 3,376 -457 473 6,871 5,606 4,662
DEBT LEVERAGE
0%
10%
20%
30%
40%
50%
60%
70%
80%
90%
100%
2007 2008 2009 2010 2011 9M12 2012 9M130.0
0.5
1.0
1.5
2.0
2.5FFO adj. / total debt adj. Total debt adj. / EBITDA adj. (RS)
DEBT MATURITY PROFILE AS OF 30 SEPTEMBER 2013
0
2,000
4,000
6,000
8,000
10,000
12,000
Liquidityas of9M13
2014 2015 2016 2017 2018 2019 > 2017
US
D m
n
Cash Undrawn, committed lines Financial debt
CREDIT METRICS
2007 2008 2009 2010 2011 9M12 2012 9M13EBIT net interest cover adj. 63.2 21.4 16.1 23.1 27.1 18.8 6.4 5.1EBIT gross interest cover adj. 8.3 7.9 10.1 12.0 12.4 9.0 9.9 12.2EBITDA net interest cover adj. 75.9 25.9 18.8 28.1 32.5 24.6 8.0 6.9EBITDA gross interest cover adj. 10.0 9.5 11.8 14.6 14.9 11.8 12.4 16.5FFO adj. / net debt adj. 73.1% 89.5% 314.6% n.a. n.a. 127.6% 140.6% 171.3%FFO adj. / total debt adj. 47.9% 61.5% 71.9% 90.1% 81.8% 64.0% 55.8% 61.5%RCF adj. / net debt adj. 50.0% 62.4% 226.4% n.a. n.a. 74.2% 75.2% 97.1%RCF adj. / total debt adj. 32.7% 42.9% 51.7% 62.3% 51.2% 37.3% 29.9% 34.9%Net debt adj. / EBITDA adj. 1.0 0.8 0.2 0.0 0.0 0.6 0.5 0.4Total debt adj. / EBITDA adj. 1.6 1.2 1.0 0.8 0.8 1.2 1.1 1.2FFO adj. / net interest adj. 57.5 18.5 13.8 19.6 21.5 18.5 5.1 5.2FFO adj. / gross interest adj. 7.6 6.8 8.6 10.2 9.9 8.9 7.9 12.4Total debt adj. / total capital. adj. 54.0% 48.2% 41.5% 34.1% 34.4% 38.2% 37.1% 35.6%Net debt adj. / net capital. adj. 43.5% 39.0% 14.0% -2.0% 2.0% 23.7% 19.0% 16.6%Equity / total assets 31.1% 34.3% 37.9% 41.7% 44.4% 42.4% 44.7% 43.3%
Source: Company data, UniCredit Research
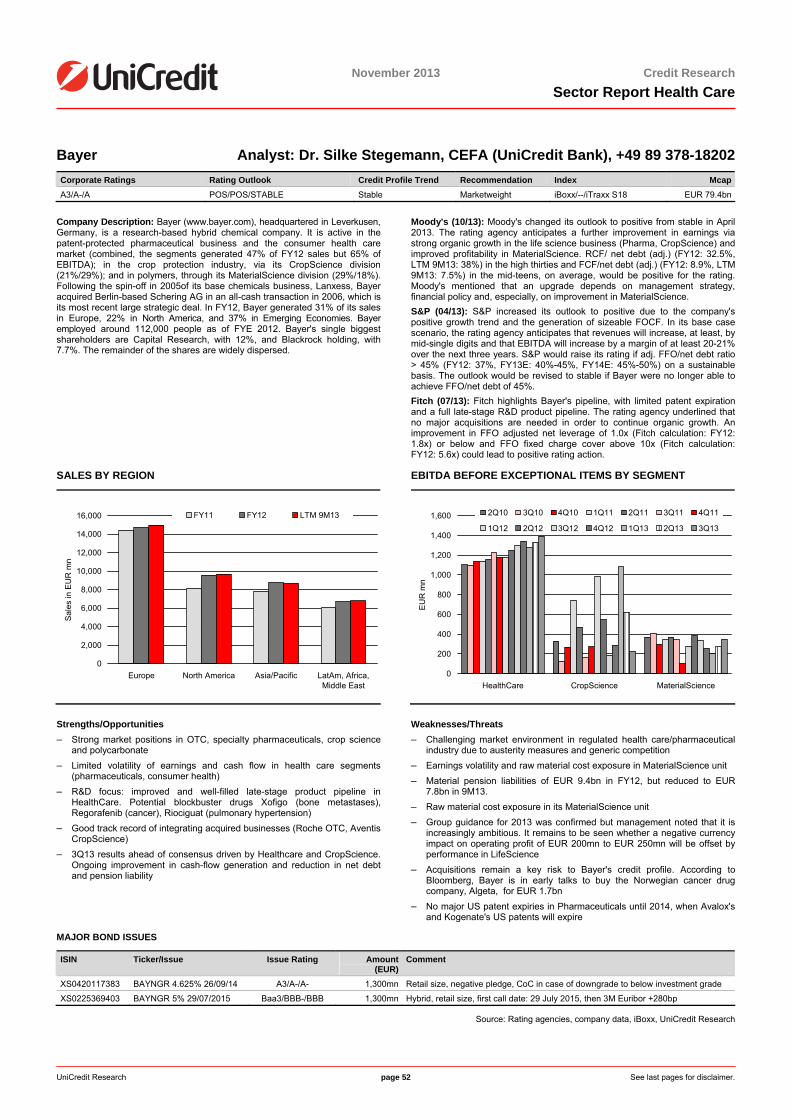
<date>
November 2013 Credit ResearchSector Report Health Care
UniCredit Research page 52 See last pages for disclaimer.
Bayer Analyst: Dr. Silke Stegemann, CEFA (UniCredit Bank), +49 89 378-18202 Corporate Ratings Rating Outlook Credit Profile Trend Recommendation Index McapA3/A-/A POS/POS/STABLE Stable Marketweight iBoxx/--/iTraxx S18 EUR 79.4bn
Company Description: Bayer (www.bayer.com), headquartered in Leverkusen, Germany, is a research-based hybrid chemical company. It is active in the patent-protected pharmaceutical business and the consumer health care market (combined, the segments generated 47% of FY12 sales but 65% of EBITDA); in the crop protection industry, via its CropScience division (21%/29%); and in polymers, through its MaterialScience division (29%/18%). Following the spin-off in 2005of its base chemicals business, Lanxess, Bayer acquired Berlin-based Schering AG in an all-cash transaction in 2006, which is its most recent large strategic deal. In FY12, Bayer generated 31% of its sales in Europe, 22% in North America, and 37% in Emerging Economies. Bayer employed around 112,000 people as of FYE 2012. Bayer's single biggest shareholders are Capital Research, with 12%, and Blackrock holding, with 7.7%. The remainder of the shares are widely dispersed.
Moody's (10/13): Moody's changed its outlook to positive from stable in April 2013. The rating agency anticipates a further improvement in earnings via strong organic growth in the life science business (Pharma, CropScience) and improved profitability in MaterialScience. RCF/ net debt (adj.) (FY12: 32.5%, LTM 9M13: 38%) in the high thirties and FCF/net debt (adj.) (FY12: 8.9%, LTM 9M13: 7.5%) in the mid-teens, on average, would be positive for the rating. Moody's mentioned that an upgrade depends on management strategy, financial policy and, especially, on improvement in MaterialScience. S&P (04/13): S&P increased its outlook to positive due to the company's positive growth trend and the generation of sizeable FOCF. In its base case scenario, the rating agency anticipates that revenues will increase, at least, by mid-single digits and that EBITDA will increase by a margin of at least 20-21% over the next three years. S&P would raise its rating if adj. FFO/net debt ratio > 45% (FY12: 37%, FY13E: 40%-45%, FY14E: 45%-50%) on a sustainable basis. The outlook would be revised to stable if Bayer were no longer able to achieve FFO/net debt of 45%. Fitch (07/13): Fitch highlights Bayer's pipeline, with limited patent expiration and a full late-stage R&D product pipeline. The rating agency underlined that no major acquisitions are needed in order to continue organic growth. An improvement in FFO adjusted net leverage of 1.0x (Fitch calculation: FY12: 1.8x) or below and FFO fixed charge cover above 10x (Fitch calculation: FY12: 5.6x) could lead to positive rating action.
SALES BY REGION
0
2,000
4,000
6,000
8,000
10,000
12,000
14,000
16,000
Europe North America Asia/Pacific LatAm, Africa,Middle East
Sal
es in
EU
R m
n
FY11 FY12 LTM 9M13
EBITDA BEFORE EXCEPTIONAL ITEMS BY SEGMENT
0
200
400
600
800
1,000
1,200
1,400
1,600
HealthCare CropScience MaterialScience
EUR
mn
2Q10 3Q10 4Q10 1Q11 2Q11 3Q11 4Q11
1Q12 2Q12 3Q12 4Q12 1Q13 2Q13 3Q13
Strengths/Opportunities – Strong market positions in OTC, specialty pharmaceuticals, crop science
and polycarbonate – Limited volatility of earnings and cash flow in health care segments
(pharmaceuticals, consumer health) – R&D focus: improved and well-filled late-stage product pipeline in
HealthCare. Potential blockbuster drugs Xofigo (bone metastases), Regorafenib (cancer), Riociguat (pulmonary hypertension)
– Good track record of integrating acquired businesses (Roche OTC, Aventis CropScience)
– 3Q13 results ahead of consensus driven by Healthcare and CropScience. Ongoing improvement in cash-flow generation and reduction in net debt and pension liability
Weaknesses/Threats – Challenging market environment in regulated health care/pharmaceutical
industry due to austerity measures and generic competition – Earnings volatility and raw material cost exposure in MaterialScience unit – Material pension liabilities of EUR 9.4bn in FY12, but reduced to EUR
7.8bn in 9M13. – Raw material cost exposure in its MaterialScience unit – Group guidance for 2013 was confirmed but management noted that it is
increasingly ambitious. It remains to be seen whether a negative currency impact on operating profit of EUR 200mn to EUR 250mn will be offset by performance in LifeScience
– Acquisitions remain a key risk to Bayer's credit profile. According to Bloomberg, Bayer is in early talks to buy the Norwegian cancer drug company, Algeta, for EUR 1.7bn
– No major US patent expiries in Pharmaceuticals until 2014, when Avalox's and Kogenate's US patents will expire
MAJOR BOND ISSUES
ISIN Ticker/Issue Issue Rating Amount (EUR)
Comment
XS0420117383 BAYNGR 4.625% 26/09/14 A3/A-/A- 1,300mn Retail size, negative pledge, CoC in case of downgrade to below investment grade
XS0225369403 BAYNGR 5% 29/07/2015 Baa3/BBB-/BBB 1,300mn Hybrid, retail size, first call date: 29 July 2015, then 3M Euribor +280bp
Source: Rating agencies, company data, iBoxx, UniCredit Research
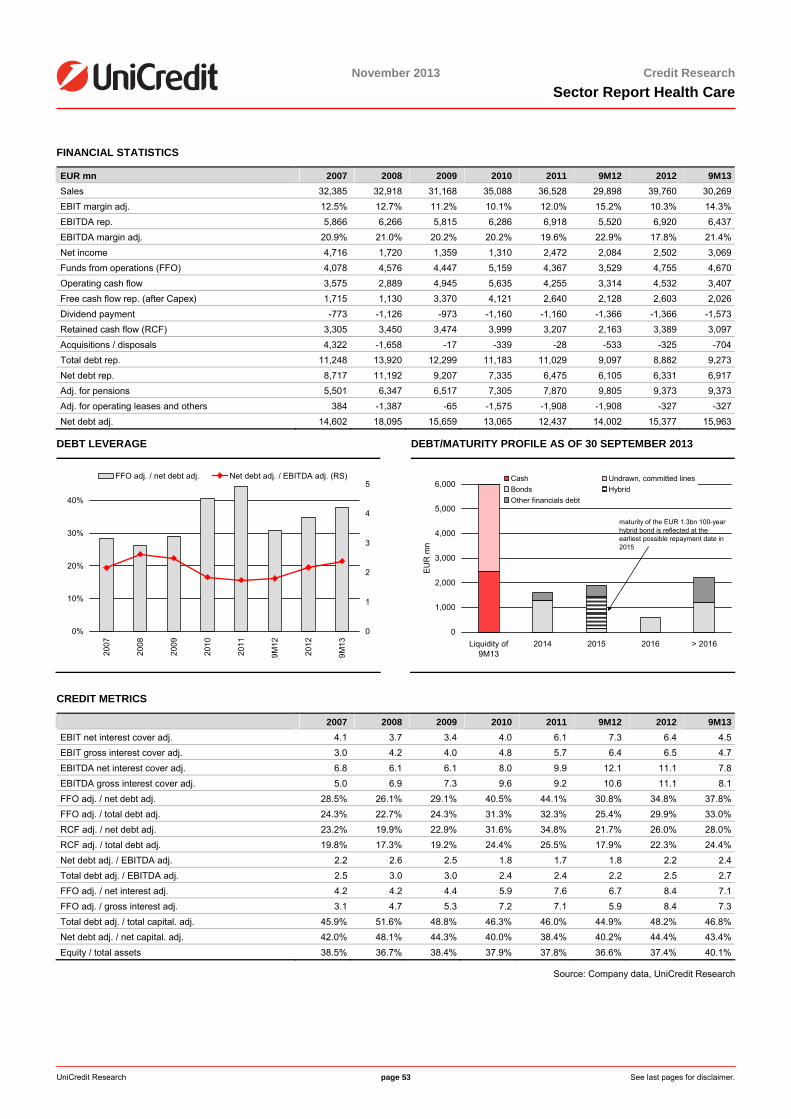
<date>
UniCredit Research page 53 See last pages for disclaimer.
November 2013 Credit ResearchSector Report Health Care
FINANCIAL STATISTICS
EUR mn 2007 2008 2009 2010 2011 9M12 2012 9M13Sales 32,385 32,918 31,168 35,088 36,528 29,898 39,760 30,269EBIT margin adj. 12.5% 12.7% 11.2% 10.1% 12.0% 15.2% 10.3% 14.3%EBITDA rep. 5,866 6,266 5,815 6,286 6,918 5,520 6,920 6,437EBITDA margin adj. 20.9% 21.0% 20.2% 20.2% 19.6% 22.9% 17.8% 21.4%Net income 4,716 1,720 1,359 1,310 2,472 2,084 2,502 3,069Funds from operations (FFO) 4,078 4,576 4,447 5,159 4,367 3,529 4,755 4,670Operating cash flow 3,575 2,889 4,945 5,635 4,255 3,314 4,532 3,407Free cash flow rep. (after Capex) 1,715 1,130 3,370 4,121 2,640 2,128 2,603 2,026Dividend payment -773 -1,126 -973 -1,160 -1,160 -1,366 -1,366 -1,573Retained cash flow (RCF) 3,305 3,450 3,474 3,999 3,207 2,163 3,389 3,097Acquisitions / disposals 4,322 -1,658 -17 -339 -28 -533 -325 -704Total debt rep. 11,248 13,920 12,299 11,183 11,029 9,097 8,882 9,273Net debt rep. 8,717 11,192 9,207 7,335 6,475 6,105 6,331 6,917Adj. for pensions 5,501 6,347 6,517 7,305 7,870 9,805 9,373 9,373Adj. for operating leases and others 384 -1,387 -65 -1,575 -1,908 -1,908 -327 -327Net debt adj. 14,602 18,095 15,659 13,065 12,437 14,002 15,377 15,963
DEBT LEVERAGE
0%
10%
20%
30%
40%
2007
2008
2009
2010
2011
9M12
2012
9M13
0
1
2
3
4
5FFO adj. / net debt adj. Net debt adj. / EBITDA adj. (RS)
DEBT/MATURITY PROFILE AS OF 30 SEPTEMBER 2013
0
1,000
2,000
3,000
4,000
5,000
6,000
Liquidity of9M13
2014 2015 2016 > 2016
EUR
mn
Cash Undrawn, committed linesBonds HybridOther financials debt
maturity of the EUR 1.3bn 100-year hybrid bond is reflected at the earliest possible repayment date in 2015
CREDIT METRICS
2007 2008 2009 2010 2011 9M12 2012 9M13EBIT net interest cover adj. 4.1 3.7 3.4 4.0 6.1 7.3 6.4 4.5EBIT gross interest cover adj. 3.0 4.2 4.0 4.8 5.7 6.4 6.5 4.7EBITDA net interest cover adj. 6.8 6.1 6.1 8.0 9.9 12.1 11.1 7.8EBITDA gross interest cover adj. 5.0 6.9 7.3 9.6 9.2 10.6 11.1 8.1FFO adj. / net debt adj. 28.5% 26.1% 29.1% 40.5% 44.1% 30.8% 34.8% 37.8%FFO adj. / total debt adj. 24.3% 22.7% 24.3% 31.3% 32.3% 25.4% 29.9% 33.0%RCF adj. / net debt adj. 23.2% 19.9% 22.9% 31.6% 34.8% 21.7% 26.0% 28.0%RCF adj. / total debt adj. 19.8% 17.3% 19.2% 24.4% 25.5% 17.9% 22.3% 24.4%Net debt adj. / EBITDA adj. 2.2 2.6 2.5 1.8 1.7 1.8 2.2 2.4Total debt adj. / EBITDA adj. 2.5 3.0 3.0 2.4 2.4 2.2 2.5 2.7FFO adj. / net interest adj. 4.2 4.2 4.4 5.9 7.6 6.7 8.4 7.1FFO adj. / gross interest adj. 3.1 4.7 5.3 7.2 7.1 5.9 8.4 7.3Total debt adj. / total capital. adj. 45.9% 51.6% 48.8% 46.3% 46.0% 44.9% 48.2% 46.8%Net debt adj. / net capital. adj. 42.0% 48.1% 44.3% 40.0% 38.4% 40.2% 44.4% 43.4%Equity / total assets 38.5% 36.7% 38.4% 37.9% 37.8% 36.6% 37.4% 40.1%
Source: Company data, UniCredit Research
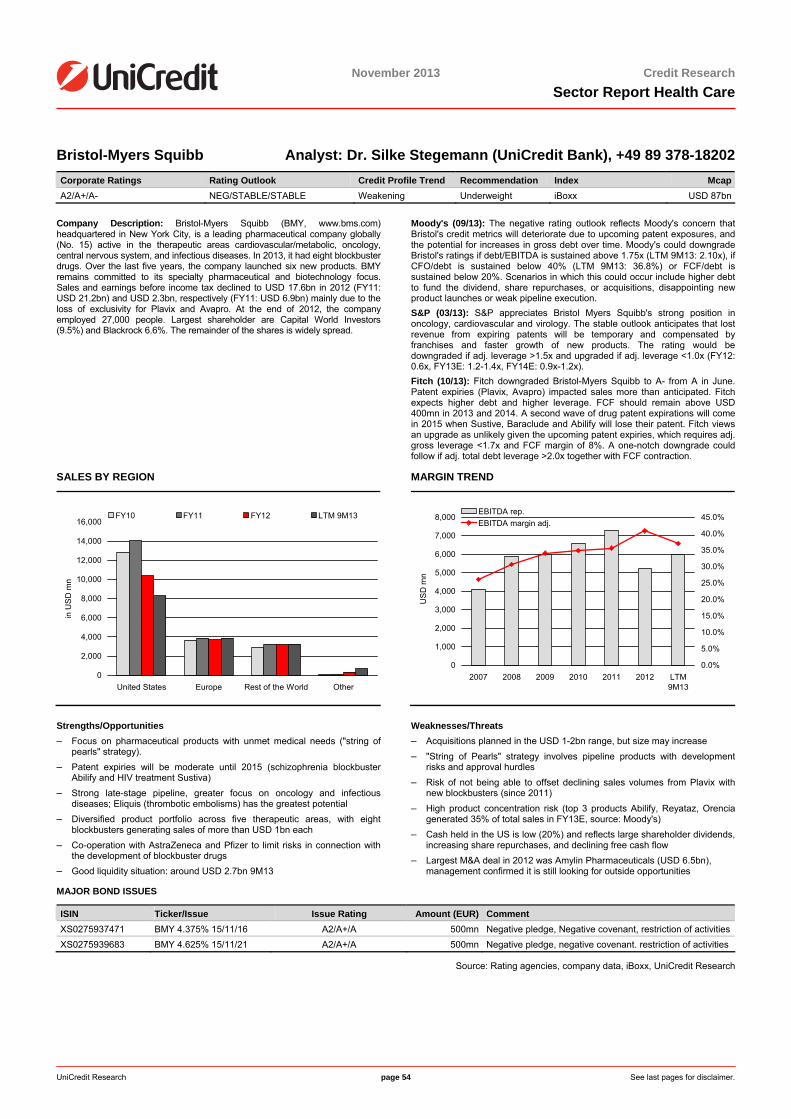
<date>
November 2013 Credit ResearchSector Report Health Care
UniCredit Research page 54 See last pages for disclaimer.
Bristol-Myers Squibb Analyst: Dr. Silke Stegemann (UniCredit Bank), +49 89 378-18202 Corporate Ratings Rating Outlook Credit Profile Trend Recommendation Index McapA2/A+/A- NEG/STABLE/STABLE Weakening Underweight iBoxx USD 87bn
Company Description: Bristol-Myers Squibb (BMY, www.bms.com) headquartered in New York City, is a leading pharmaceutical company globally (No. 15) active in the therapeutic areas cardiovascular/metabolic, oncology, central nervous system, and infectious diseases. In 2013, it had eight blockbuster drugs. Over the last five years, the company launched six new products. BMY remains committed to its specialty pharmaceutical and biotechnology focus. Sales and earnings before income tax declined to USD 17.6bn in 2012 (FY11: USD 21.2bn) and USD 2.3bn, respectively (FY11: USD 6.9bn) mainly due to the loss of exclusivity for Plavix and Avapro. At the end of 2012, the company employed 27,000 people. Largest shareholder are Capital World Investors (9.5%) and Blackrock 6.6%. The remainder of the shares is widely spread.
Moody's (09/13): The negative rating outlook reflects Moody's concern that Bristol's credit metrics will deteriorate due to upcoming patent exposures, and the potential for increases in gross debt over time. Moody's could downgrade Bristol's ratings if debt/EBITDA is sustained above 1.75x (LTM 9M13: 2.10x), if CFO/debt is sustained below 40% (LTM 9M13: 36.8%) or FCF/debt is sustained below 20%. Scenarios in which this could occur include higher debt to fund the dividend, share repurchases, or acquisitions, disappointing new product launches or weak pipeline execution. S&P (03/13): S&P appreciates Bristol Myers Squibb's strong position in oncology, cardiovascular and virology. The stable outlook anticipates that lost revenue from expiring patents will be temporary and compensated by franchises and faster growth of new products. The rating would be downgraded if adj. leverage >1.5x and upgraded if adj. leverage <1.0x (FY12: 0.6x, FY13E: 1.2-1.4x, FY14E: 0.9x-1.2x). Fitch (10/13): Fitch downgraded Bristol-Myers Squibb to A- from A in June. Patent expiries (Plavix, Avapro) impacted sales more than anticipated. Fitch expects higher debt and higher leverage. FCF should remain above USD 400mn in 2013 and 2014. A second wave of drug patent expirations will come in 2015 when Sustive, Baraclude and Abilify will lose their patent. Fitch views an upgrade as unlikely given the upcoming patent expiries, which requires adj. gross leverage <1.7x and FCF margin of 8%. A one-notch downgrade could follow if adj. total debt leverage >2.0x together with FCF contraction.
SALES BY REGION
0
2,000
4,000
6,000
8,000
10,000
12,000
14,000
16,000
United States Europe Rest of the World Other
in U
SD
mn
FY10 FY11 FY12 LTM 9M13
MARGIN TREND
0
1,000
2,000
3,000
4,000
5,000
6,000
7,000
8,000
2007 2008 2009 2010 2011 2012 LTM9M13
USD
mn
0.0%
5.0%
10.0%
15.0%
20.0%
25.0%
30.0%
35.0%
40.0%
45.0%EBITDA rep.EBITDA margin adj.
Strengths/Opportunities – Focus on pharmaceutical products with unmet medical needs ("string of
pearls" strategy). – Patent expiries will be moderate until 2015 (schizophrenia blockbuster
Abilify and HIV treatment Sustiva) – Strong late-stage pipeline, greater focus on oncology and infectious
diseases; Eliquis (thrombotic embolisms) has the greatest potential – Diversified product portfolio across five therapeutic areas, with eight
blockbusters generating sales of more than USD 1bn each – Co-operation with AstraZeneca and Pfizer to limit risks in connection with
the development of blockbuster drugs – Good liquidity situation: around USD 2.7bn 9M13
Weaknesses/Threats – Acquisitions planned in the USD 1-2bn range, but size may increase – "String of Pearls" strategy involves pipeline products with development
risks and approval hurdles – Risk of not being able to offset declining sales volumes from Plavix with
new blockbusters (since 2011) – High product concentration risk (top 3 products Abilify, Reyataz, Orencia
generated 35% of total sales in FY13E, source: Moody's) – Cash held in the US is low (20%) and reflects large shareholder dividends,
increasing share repurchases, and declining free cash flow – Largest M&A deal in 2012 was Amylin Pharmaceuticals (USD 6.5bn),
management confirmed it is still looking for outside opportunities
MAJOR BOND ISSUES
ISIN Ticker/Issue Issue Rating Amount (EUR) Comment XS0275937471 BMY 4.375% 15/11/16 A2/A+/A 500mn Negative pledge, Negative covenant, restriction of activities XS0275939683 BMY 4.625% 15/11/21 A2/A+/A 500mn Negative pledge, negative covenant. restriction of activities
Source: Rating agencies, company data, iBoxx, UniCredit Research
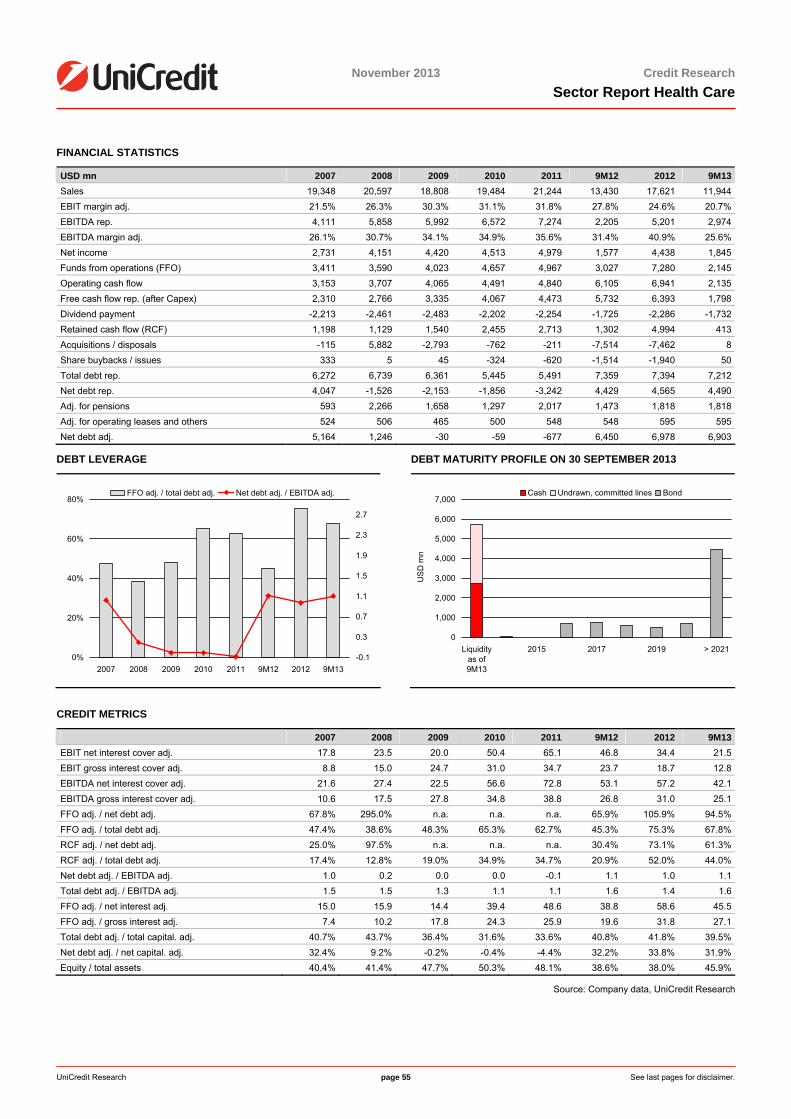
<date>
UniCredit Research page 55 See last pages for disclaimer.
November 2013 Credit ResearchSector Report Health Care
FINANCIAL STATISTICS
USD mn 2007 2008 2009 2010 2011 9M12 2012 9M13Sales 19,348 20,597 18,808 19,484 21,244 13,430 17,621 11,944EBIT margin adj. 21.5% 26.3% 30.3% 31.1% 31.8% 27.8% 24.6% 20.7%EBITDA rep. 4,111 5,858 5,992 6,572 7,274 2,205 5,201 2,974EBITDA margin adj. 26.1% 30.7% 34.1% 34.9% 35.6% 31.4% 40.9% 25.6%Net income 2,731 4,151 4,420 4,513 4,979 1,577 4,438 1,845Funds from operations (FFO) 3,411 3,590 4,023 4,657 4,967 3,027 7,280 2,145Operating cash flow 3,153 3,707 4,065 4,491 4,840 6,105 6,941 2,135Free cash flow rep. (after Capex) 2,310 2,766 3,335 4,067 4,473 5,732 6,393 1,798Dividend payment -2,213 -2,461 -2,483 -2,202 -2,254 -1,725 -2,286 -1,732Retained cash flow (RCF) 1,198 1,129 1,540 2,455 2,713 1,302 4,994 413Acquisitions / disposals -115 5,882 -2,793 -762 -211 -7,514 -7,462 8Share buybacks / issues 333 5 45 -324 -620 -1,514 -1,940 50Total debt rep. 6,272 6,739 6,361 5,445 5,491 7,359 7,394 7,212Net debt rep. 4,047 -1,526 -2,153 -1,856 -3,242 4,429 4,565 4,490Adj. for pensions 593 2,266 1,658 1,297 2,017 1,473 1,818 1,818Adj. for operating leases and others 524 506 465 500 548 548 595 595Net debt adj. 5,164 1,246 -30 -59 -677 6,450 6,978 6,903
DEBT LEVERAGE
0%
20%
40%
60%
80%
2007 2008 2009 2010 2011 9M12 2012 9M13-0.1
0.3
0.7
1.1
1.5
1.9
2.3
2.7
FFO adj. / total debt adj. Net debt adj. / EBITDA adj.
DEBT MATURITY PROFILE ON 30 SEPTEMBER 2013
0
1,000
2,000
3,000
4,000
5,000
6,000
7,000
Liquidityas of9M13
2015 2017 2019 > 2021
USD
mn
Cash Undrawn, committed lines Bond
CREDIT METRICS
2007 2008 2009 2010 2011 9M12 2012 9M13EBIT net interest cover adj. 17.8 23.5 20.0 50.4 65.1 46.8 34.4 21.5EBIT gross interest cover adj. 8.8 15.0 24.7 31.0 34.7 23.7 18.7 12.8EBITDA net interest cover adj. 21.6 27.4 22.5 56.6 72.8 53.1 57.2 42.1EBITDA gross interest cover adj. 10.6 17.5 27.8 34.8 38.8 26.8 31.0 25.1FFO adj. / net debt adj. 67.8% 295.0% n.a. n.a. n.a. 65.9% 105.9% 94.5%FFO adj. / total debt adj. 47.4% 38.6% 48.3% 65.3% 62.7% 45.3% 75.3% 67.8%RCF adj. / net debt adj. 25.0% 97.5% n.a. n.a. n.a. 30.4% 73.1% 61.3%RCF adj. / total debt adj. 17.4% 12.8% 19.0% 34.9% 34.7% 20.9% 52.0% 44.0%Net debt adj. / EBITDA adj. 1.0 0.2 0.0 0.0 -0.1 1.1 1.0 1.1Total debt adj. / EBITDA adj. 1.5 1.5 1.3 1.1 1.1 1.6 1.4 1.6FFO adj. / net interest adj. 15.0 15.9 14.4 39.4 48.6 38.8 58.6 45.5FFO adj. / gross interest adj. 7.4 10.2 17.8 24.3 25.9 19.6 31.8 27.1Total debt adj. / total capital. adj. 40.7% 43.7% 36.4% 31.6% 33.6% 40.8% 41.8% 39.5%Net debt adj. / net capital. adj. 32.4% 9.2% -0.2% -0.4% -4.4% 32.2% 33.8% 31.9%Equity / total assets 40.4% 41.4% 47.7% 50.3% 48.1% 38.6% 38.0% 45.9%
Source: Company data, UniCredit Research
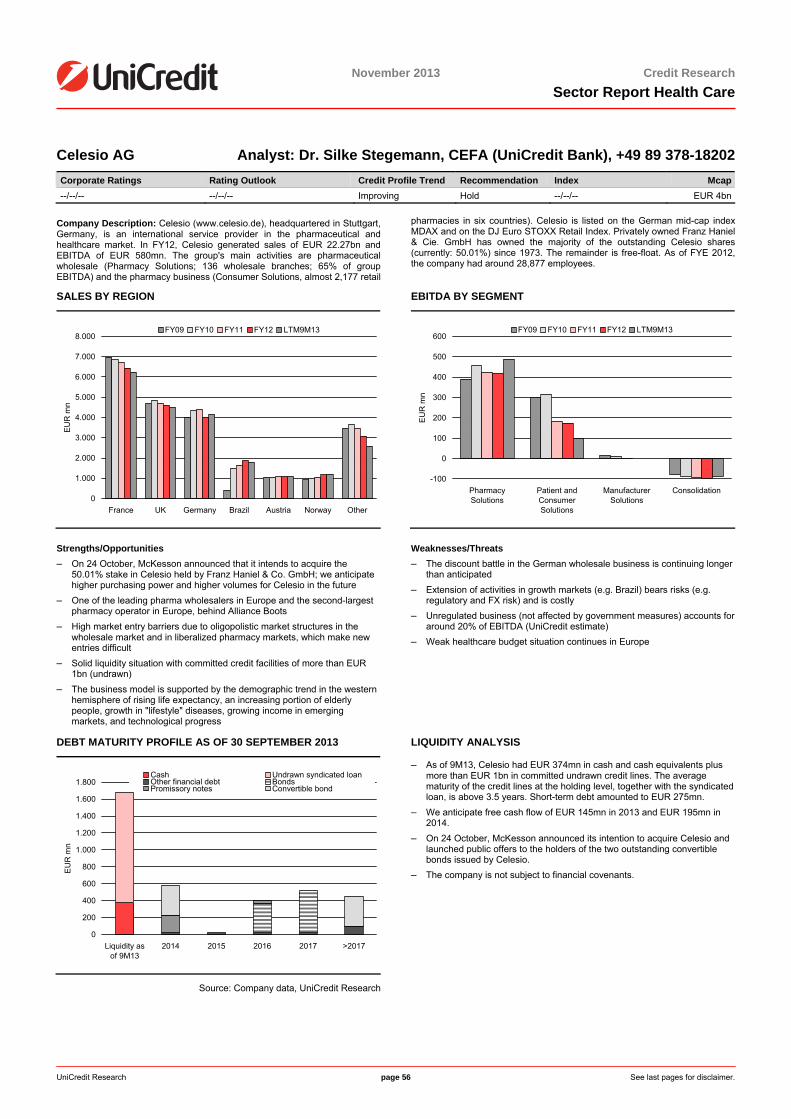
26 November 2013
November 2013 Credit ResearchSector Report Health Care
UniCredit Research page 56 See last pages for disclaimer.
Celesio AG Analyst: Dr. Silke Stegemann, CEFA (UniCredit Bank), +49 89 378-18202 Corporate Ratings Rating Outlook Credit Profile Trend Recommendation Index Mcap--/--/-- --/--/-- Improving Hold --/--/-- EUR 4bn
Company Description: Celesio (www.celesio.de), headquartered in Stuttgart, Germany, is an international service provider in the pharmaceutical and healthcare market. In FY12, Celesio generated sales of EUR 22.27bn and EBITDA of EUR 580mn. The group's main activities are pharmaceutical wholesale (Pharmacy Solutions; 136 wholesale branches; 65% of group EBITDA) and the pharmacy business (Consumer Solutions, almost 2,177 retail
pharmacies in six countries). Celesio is listed on the German mid-cap index MDAX and on the DJ Euro STOXX Retail Index. Privately owned Franz Haniel & Cie. GmbH has owned the majority of the outstanding Celesio shares (currently: 50.01%) since 1973. The remainder is free-float. As of FYE 2012, the company had around 28,877 employees.
SALES BY REGION
0
1.000
2.000
3.000
4.000
5.000
6.000
7.000
8.000
France UK Germany Brazil Austria Norway Other
EU
R m
n
FY09 FY10 FY11 FY12 LTM9M13
EBITDA BY SEGMENT
-100
0
100
200
300
400
500
600
PharmacySolutions
Patient andConsumerSolutions
ManufacturerSolutions
Consolidation
EU
R m
n
FY09 FY10 FY11 FY12 LTM9M13
Strengths/Opportunities – On 24 October, McKesson announced that it intends to acquire the
50.01% stake in Celesio held by Franz Haniel & Co. GmbH; we anticipate higher purchasing power and higher volumes for Celesio in the future
– One of the leading pharma wholesalers in Europe and the second-largest pharmacy operator in Europe, behind Alliance Boots
– High market entry barriers due to oligopolistic market structures in the wholesale market and in liberalized pharmacy markets, which make new entries difficult
– Solid liquidity situation with committed credit facilities of more than EUR 1bn (undrawn)
– The business model is supported by the demographic trend in the western hemisphere of rising life expectancy, an increasing portion of elderly people, growth in "lifestyle" diseases, growing income in emerging markets, and technological progress
Weaknesses/Threats – The discount battle in the German wholesale business is continuing longer
than anticipated – Extension of activities in growth markets (e.g. Brazil) bears risks (e.g.
regulatory and FX risk) and is costly – Unregulated business (not affected by government measures) accounts for
around 20% of EBITDA (UniCredit estimate) – Weak healthcare budget situation continues in Europe
DEBT MATURITY PROFILE AS OF 30 SEPTEMBER 2013
0
200
400
600
800
1.000
1.200
1.400
1.600
1.800
Liquidity asof 9M13
2014 2015 2016 2017 >2017
EU
R m
n
Cash Undrawn syndicated loanOther financial debt BondsPromissory notes Convertible bond
Source: Company data, UniCredit Research
LIQUIDITY ANALYSIS
– As of 9M13, Celesio had EUR 374mn in cash and cash equivalents plus more than EUR 1bn in committed undrawn credit lines. The average maturity of the credit lines at the holding level, together with the syndicated loan, is above 3.5 years. Short-term debt amounted to EUR 275mn.
– We anticipate free cash flow of EUR 145mn in 2013 and EUR 195mn in 2014.
– On 24 October, McKesson announced its intention to acquire Celesio and launched public offers to the holders of the two outstanding convertible bonds issued by Celesio.
– The company is not subject to financial covenants.
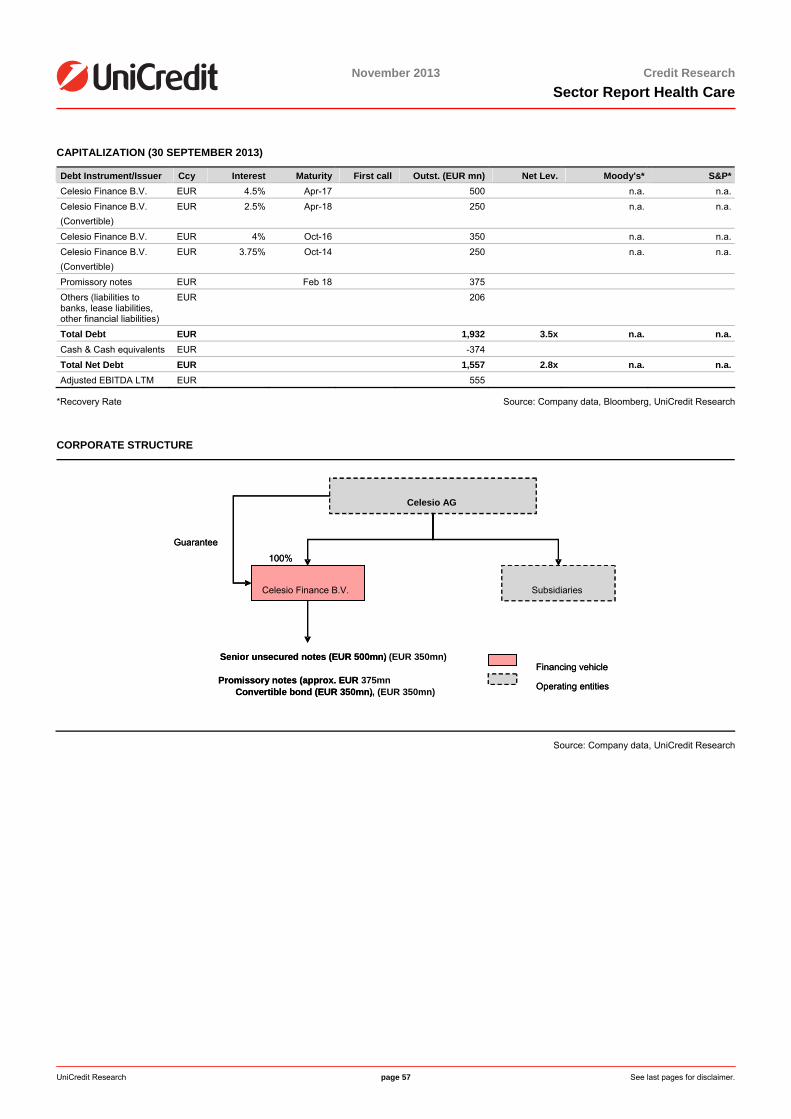
UniCredit Research page 57 See last pages for disclaimer.
November 2013 Credit ResearchSector Report Health Care
CAPITALIZATION (30 SEPTEMBER 2013)
Debt Instrument/Issuer Ccy Interest Maturity First call Outst. (EUR mn) Net Lev. Moody's* S&P*Celesio Finance B.V. EUR 4.5% Apr-17 500 n.a. n.a.Celesio Finance B.V. (Convertible)
EUR 2.5% Apr-18 250 n.a. n.a.
Celesio Finance B.V. EUR 4% Oct-16 350 n.a. n.a.Celesio Finance B.V. (Convertible)
EUR 3.75% Oct-14 250 n.a. n.a.
Promissory notes EUR Feb 18 375 Others (liabilities to banks, lease liabilities, other financial liabilities)
EUR 206
Total Debt EUR 1,932 3.5x n.a. n.a.Cash & Cash equivalents EUR -374 Total Net Debt EUR 1,557 2.8x n.a. n.a.Adjusted EBITDA LTM EUR 555
*Recovery Rate Source: Company data, Bloomberg, UniCredit Research
CORPORATE STRUCTURE
Source: Company data, UniCredit Research
Celesio AG
SubsidiariesCelesio Finance B.V.
Senior unsecured notes (EUR 500mn)
Promissory notes (approx. EUR 375mnConvertible bond (EUR 350mn)
100% Guarantee
Financing vehicle
Operating entities
Celesio AG
SubsidiariesCelesio Finance B.V.
Senior unsecured notes (EUR 500mn, (EUR 350mn)
Promissory notes (approx. EUR Convertible bond (EUR 350mn,, (EUR 350mn)
100% Guarantee
Financing vehicle
Operating entities
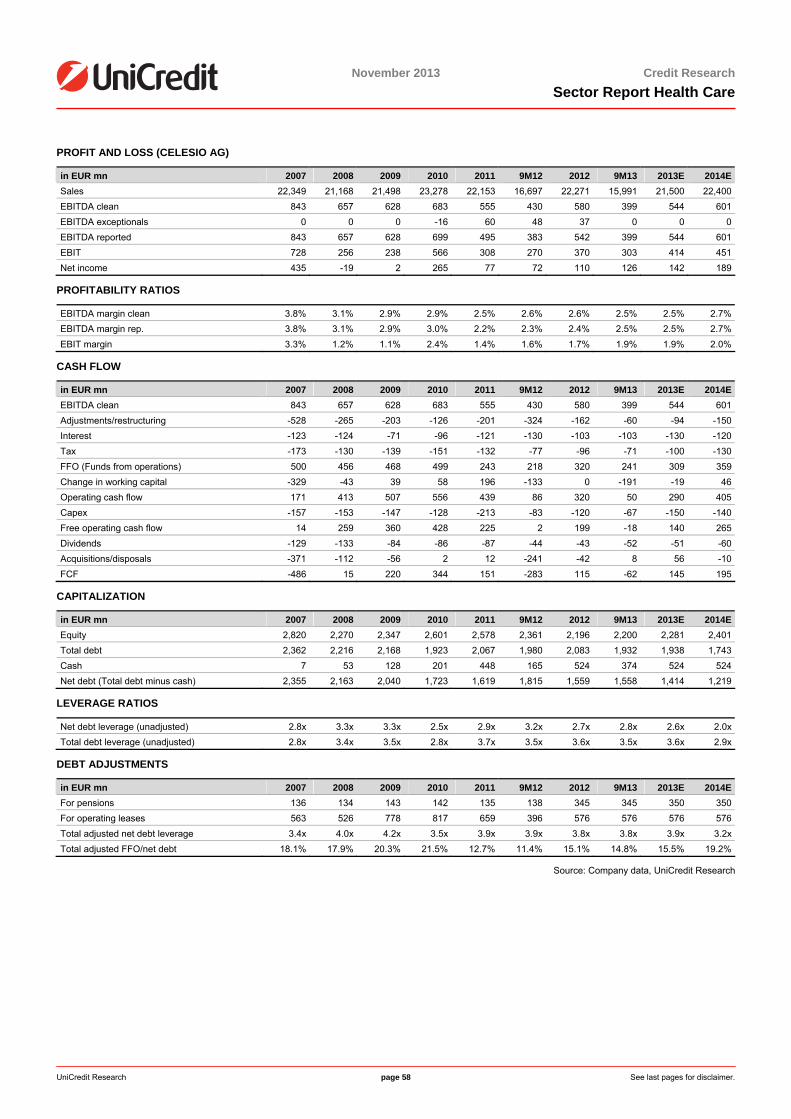
UniCredit Research page 58 See last pages for disclaimer.
November 2013 Credit ResearchSector Report Health Care
PROFIT AND LOSS (CELESIO AG)
in EUR mn 2007 2008 2009 2010 2011 9M12 2012 9M13 2013E 2014ESales 22,349 21,168 21,498 23,278 22,153 16,697 22,271 15,991 21,500 22,400EBITDA clean 843 657 628 683 555 430 580 399 544 601EBITDA exceptionals 0 0 0 -16 60 48 37 0 0 0EBITDA reported 843 657 628 699 495 383 542 399 544 601EBIT 728 256 238 566 308 270 370 303 414 451Net income 435 -19 2 265 77 72 110 126 142 189
PROFITABILITY RATIOS
EBITDA margin clean 3.8% 3.1% 2.9% 2.9% 2.5% 2.6% 2.6% 2.5% 2.5% 2.7%EBITDA margin rep. 3.8% 3.1% 2.9% 3.0% 2.2% 2.3% 2.4% 2.5% 2.5% 2.7%EBIT margin 3.3% 1.2% 1.1% 2.4% 1.4% 1.6% 1.7% 1.9% 1.9% 2.0%
CASH FLOW
in EUR mn 2007 2008 2009 2010 2011 9M12 2012 9M13 2013E 2014EEBITDA clean 843 657 628 683 555 430 580 399 544 601Adjustments/restructuring -528 -265 -203 -126 -201 -324 -162 -60 -94 -150Interest -123 -124 -71 -96 -121 -130 -103 -103 -130 -120Tax -173 -130 -139 -151 -132 -77 -96 -71 -100 -130FFO (Funds from operations) 500 456 468 499 243 218 320 241 309 359Change in working capital -329 -43 39 58 196 -133 0 -191 -19 46Operating cash flow 171 413 507 556 439 86 320 50 290 405Capex -157 -153 -147 -128 -213 -83 -120 -67 -150 -140Free operating cash flow 14 259 360 428 225 2 199 -18 140 265Dividends -129 -133 -84 -86 -87 -44 -43 -52 -51 -60Acquisitions/disposals -371 -112 -56 2 12 -241 -42 8 56 -10FCF -486 15 220 344 151 -283 115 -62 145 195
CAPITALIZATION
in EUR mn 2007 2008 2009 2010 2011 9M12 2012 9M13 2013E 2014EEquity 2,820 2,270 2,347 2,601 2,578 2,361 2,196 2,200 2,281 2,401Total debt 2,362 2,216 2,168 1,923 2,067 1,980 2,083 1,932 1,938 1,743Cash 7 53 128 201 448 165 524 374 524 524Net debt (Total debt minus cash) 2,355 2,163 2,040 1,723 1,619 1,815 1,559 1,558 1,414 1,219
LEVERAGE RATIOS
Net debt leverage (unadjusted) 2.8x 3.3x 3.3x 2.5x 2.9x 3.2x 2.7x 2.8x 2.6x 2.0xTotal debt leverage (unadjusted) 2.8x 3.4x 3.5x 2.8x 3.7x 3.5x 3.6x 3.5x 3.6x 2.9x
DEBT ADJUSTMENTS
in EUR mn 2007 2008 2009 2010 2011 9M12 2012 9M13 2013E 2014EFor pensions 136 134 143 142 135 138 345 345 350 350For operating leases 563 526 778 817 659 396 576 576 576 576Total adjusted net debt leverage 3.4x 4.0x 4.2x 3.5x 3.9x 3.9x 3.8x 3.8x 3.9x 3.2xTotal adjusted FFO/net debt 18.1% 17.9% 20.3% 21.5% 12.7% 11.4% 15.1% 14.8% 15.5% 19.2%
Source: Company data, UniCredit Research
UniCredit Research page 59 See last pages for disclaimer.
November 2013 Credit ResearchSector Report Health Care
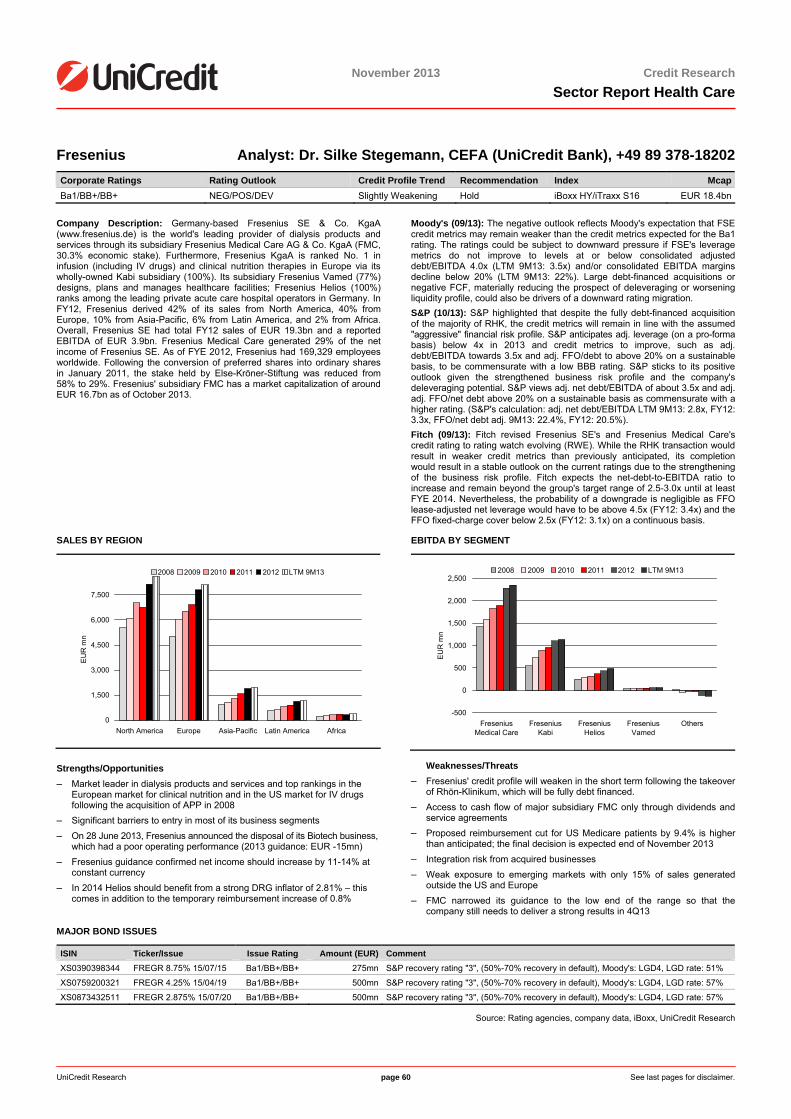
UniCredit Research page 60 See last pages for disclaimer.
November 2013 Credit ResearchSector Report Health Care
Fresenius Analyst: Dr. Silke Stegemann, CEFA (UniCredit Bank), +49 89 378-18202 Corporate Ratings Rating Outlook Credit Profile Trend Recommendation Index McapBa1/BB+/BB+ NEG/POS/DEV Slightly Weakening Hold iBoxx HY/iTraxx S16 EUR 18.4bn
Company Description: Germany-based Fresenius SE & Co. KgaA (www.fresenius.de) is the world's leading provider of dialysis products and services through its subsidiary Fresenius Medical Care AG & Co. KgaA (FMC, 30.3% economic stake). Furthermore, Fresenius KgaA is ranked No. 1 in infusion (including IV drugs) and clinical nutrition therapies in Europe via its wholly-owned Kabi subsidiary (100%). Its subsidiary Fresenius Vamed (77%) designs, plans and manages healthcare facilities; Fresenius Helios (100%) ranks among the leading private acute care hospital operators in Germany. In FY12, Fresenius derived 42% of its sales from North America, 40% from Europe, 10% from Asia-Pacific, 6% from Latin America, and 2% from Africa. Overall, Fresenius SE had total FY12 sales of EUR 19.3bn and a reported EBITDA of EUR 3.9bn. Fresenius Medical Care generated 29% of the net income of Fresenius SE. As of FYE 2012, Fresenius had 169,329 employees worldwide. Following the conversion of preferred shares into ordinary shares in January 2011, the stake held by Else-Kröner-Stiftung was reduced from 58% to 29%. Fresenius' subsidiary FMC has a market capitalization of around EUR 16.7bn as of October 2013.
Moody's (09/13): The negative outlook reflects Moody's expectation that FSE credit metrics may remain weaker than the credit metrics expected for the Ba1 rating. The ratings could be subject to downward pressure if FSE's leverage metrics do not improve to levels at or below consolidated adjusted debt/EBITDA 4.0x (LTM 9M13: 3.5x) and/or consolidated EBITDA margins decline below 20% (LTM 9M13: 22%). Large debt-financed acquisitions or negative FCF, materially reducing the prospect of deleveraging or worsening liquidity profile, could also be drivers of a downward rating migration. S&P (10/13): S&P highlighted that despite the fully debt-financed acquisition of the majority of RHK, the credit metrics will remain in line with the assumed "aggressive" financial risk profile. S&P anticipates adj. leverage (on a pro-forma basis) below 4x in 2013 and credit metrics to improve, such as adj. debt/EBITDA towards 3.5x and adj. FFO/debt to above 20% on a sustainable basis, to be commensurate with a low BBB rating. S&P sticks to its positive outlook given the strengthened business risk profile and the company's deleveraging potential. S&P views adj. net debt/EBITDA of about 3.5x and adj. adj. FFO/net debt above 20% on a sustainable basis as commensurate with a higher rating. (S&P's calculation: adj. net debt/EBITDA LTM 9M13: 2.8x, FY12: 3.3x, FFO/net debt adj. 9M13: 22.4%, FY12: 20.5%). Fitch (09/13): Fitch revised Fresenius SE's and Fresenius Medical Care's credit rating to rating watch evolving (RWE). While the RHK transaction would result in weaker credit metrics than previously anticipated, its completion would result in a stable outlook on the current ratings due to the strengthening of the business risk profile. Fitch expects the net-debt-to-EBITDA ratio to increase and remain beyond the group's target range of 2.5-3.0x until at least FYE 2014. Nevertheless, the probability of a downgrade is negligible as FFO lease-adjusted net leverage would have to be above 4.5x (FY12: 3.4x) and the FFO fixed-charge cover below 2.5x (FY12: 3.1x) on a continuous basis.
SALES BY REGION
0
1,500
3,000
4,500
6,000
7,500
North America Europe Asia-Pacific Latin America Africa
EU
R m
n
2008 2009 2010 2011 2012 LTM 9M13
EBITDA BY SEGMENT
-500
0
500
1,000
1,500
2,000
2,500
FreseniusMedical Care
FreseniusKabi
FreseniusHelios
FreseniusVamed
Others
EUR
mn
2008 2009 2010 2011 2012 LTM 9M13
Strengths/Opportunities – Market leader in dialysis products and services and top rankings in the
European market for clinical nutrition and in the US market for IV drugs following the acquisition of APP in 2008
– Significant barriers to entry in most of its business segments – On 28 June 2013, Fresenius announced the disposal of its Biotech business,
which had a poor operating performance (2013 guidance: EUR -15mn) – Fresenius guidance confirmed net income should increase by 11-14% at
constant currency – In 2014 Helios should benefit from a strong DRG inflator of 2.81% – this
comes in addition to the temporary reimbursement increase of 0.8%
Weaknesses/Threats – Fresenius' credit profile will weaken in the short term following the takeover
of Rhön-Klinikum, which will be fully debt financed. – Access to cash flow of major subsidiary FMC only through dividends and
service agreements – Proposed reimbursement cut for US Medicare patients by 9.4% is higher
than anticipated; the final decision is expected end of November 2013
– Integration risk from acquired businesses – Weak exposure to emerging markets with only 15% of sales generated
outside the US and Europe – FMC narrowed its guidance to the low end of the range so that the
company still needs to deliver a strong results in 4Q13
MAJOR BOND ISSUES
ISIN Ticker/Issue Issue Rating Amount (EUR) Comment XS0390398344 FREGR 8.75% 15/07/15 Ba1/BB+/BB+ 275mn S&P recovery rating "3", (50%-70% recovery in default), Moody's: LGD4, LGD rate: 51%
XS0759200321 FREGR 4.25% 15/04/19 Ba1/BB+/BB+ 500mn S&P recovery rating "3", (50%-70% recovery in default), Moody's: LGD4, LGD rate: 57%
XS0873432511 FREGR 2.875% 15/07/20 Ba1/BB+/BB+ 500mn S&P recovery rating "3", (50%-70% recovery in default), Moody's: LGD4, LGD rate: 57%
Source: Rating agencies, company data, iBoxx, UniCredit Research
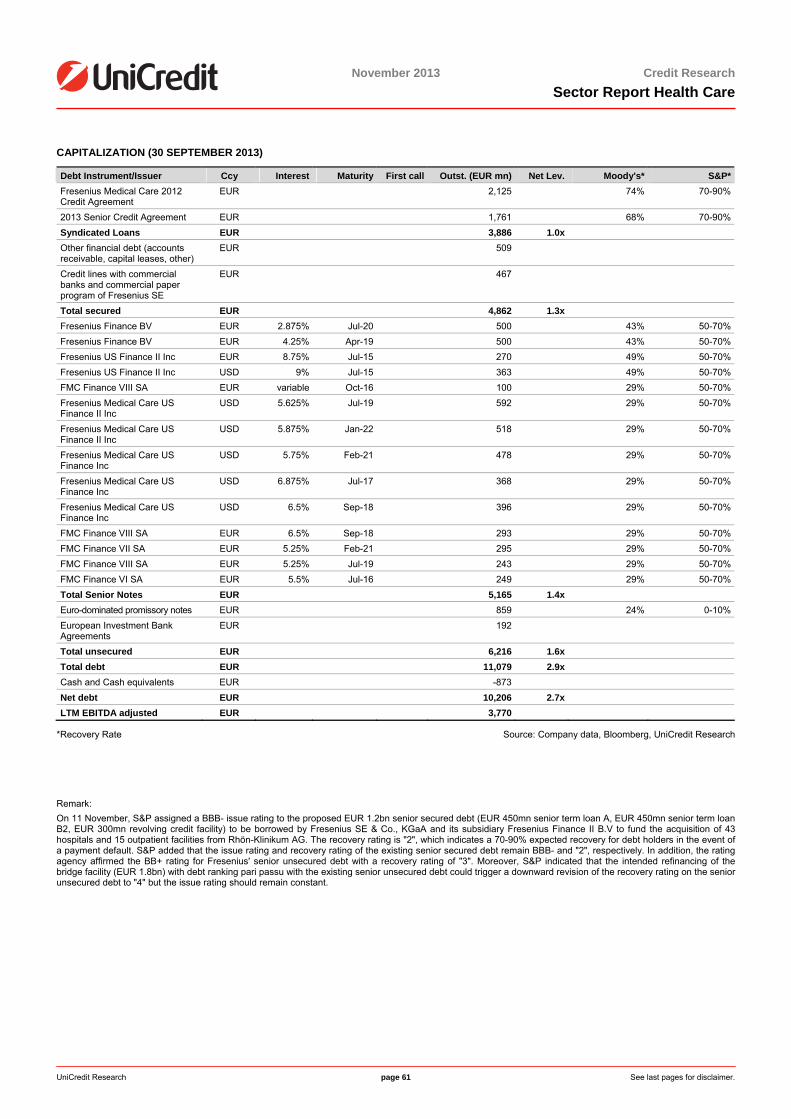
UniCredit Research page 61 See last pages for disclaimer.
November 2013 Credit ResearchSector Report Health Care
CAPITALIZATION (30 SEPTEMBER 2013)
Debt Instrument/Issuer Ccy Interest Maturity First call Outst. (EUR mn) Net Lev. Moody's* S&P*Fresenius Medical Care 2012 Credit Agreement
EUR 2,125 74% 70-90%
2013 Senior Credit Agreement EUR 1,761 68% 70-90%Syndicated Loans EUR 3,886 1.0x Other financial debt (accounts receivable, capital leases, other)
EUR 509
Credit lines with commercial banks and commercial paper program of Fresenius SE
EUR 467
Total secured EUR 4,862 1.3x Fresenius Finance BV EUR 2.875% Jul-20 500 43% 50-70%Fresenius Finance BV EUR 4.25% Apr-19 500 43% 50-70%Fresenius US Finance II Inc EUR 8.75% Jul-15 270 49% 50-70%Fresenius US Finance II Inc USD 9% Jul-15 363 49% 50-70%FMC Finance VIII SA EUR variable Oct-16 100 29% 50-70%Fresenius Medical Care US Finance II Inc
USD 5.625% Jul-19 592 29% 50-70%
Fresenius Medical Care US Finance II Inc
USD 5.875% Jan-22 518 29% 50-70%
Fresenius Medical Care US Finance Inc
USD 5.75% Feb-21 478 29% 50-70%
Fresenius Medical Care US Finance Inc
USD 6.875% Jul-17 368 29% 50-70%
Fresenius Medical Care US Finance Inc
USD 6.5% Sep-18 396 29% 50-70%
FMC Finance VIII SA EUR 6.5% Sep-18 293 29% 50-70%FMC Finance VII SA EUR 5.25% Feb-21 295 29% 50-70%FMC Finance VIII SA EUR 5.25% Jul-19 243 29% 50-70%FMC Finance VI SA EUR 5.5% Jul-16 249 29% 50-70%Total Senior Notes EUR 5,165 1.4x Euro-dominated promissory notes EUR 859 24% 0-10%European Investment Bank Agreements
EUR 192
Total unsecured EUR 6,216 1.6x Total debt EUR 11,079 2.9x Cash and Cash equivalents EUR -873 Net debt EUR 10,206 2.7x LTM EBITDA adjusted EUR 3,770
*Recovery Rate Source: Company data, Bloomberg, UniCredit Research
Remark: On 11 November, S&P assigned a BBB- issue rating to the proposed EUR 1.2bn senior secured debt (EUR 450mn senior term loan A, EUR 450mn senior term loan B2, EUR 300mn revolving credit facility) to be borrowed by Fresenius SE & Co., KGaA and its subsidiary Fresenius Finance II B.V to fund the acquisition of 43 hospitals and 15 outpatient facilities from Rhön-Klinikum AG. The recovery rating is "2", which indicates a 70-90% expected recovery for debt holders in the event of a payment default. S&P added that the issue rating and recovery rating of the existing senior secured debt remain BBB- and "2", respectively. In addition, the rating agency affirmed the BB+ rating for Fresenius' senior unsecured debt with a recovery rating of "3". Moreover, S&P indicated that the intended refinancing of the bridge facility (EUR 1.8bn) with debt ranking pari passu with the existing senior unsecured debt could trigger a downward revision of the recovery rating on the senior unsecured debt to "4" but the issue rating should remain constant.
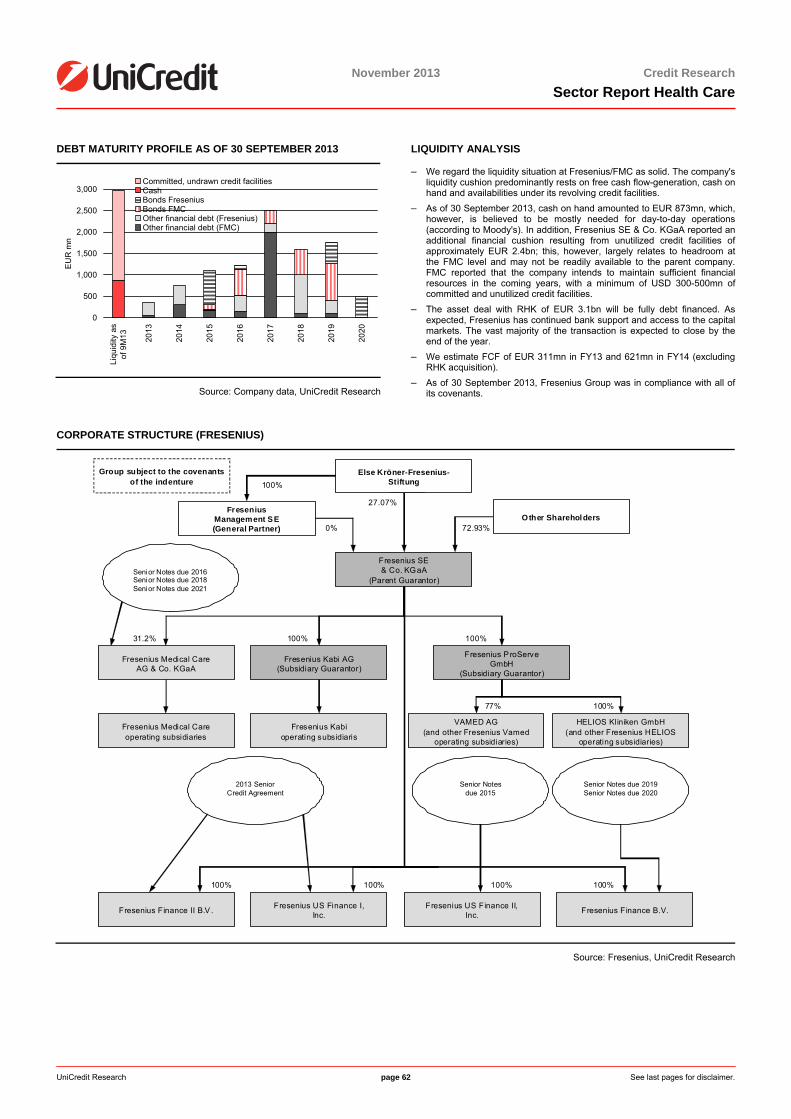
UniCredit Research page 62 See last pages for disclaimer.
November 2013 Credit ResearchSector Report Health Care
DEBT MATURITY PROFILE AS OF 30 SEPTEMBER 2013
0
500
1,000
1,500
2,000
2,500
3,000
Liqu
idity
as
of 9
M13 20
13
2014
2015
2016
2017
2018
2019
2020
EU
R m
n
Committed, undrawn credit facilitiesCashBonds FreseniusBonds FMCOther financial debt (Fresenius)Other financial debt (FMC)
Source: Company data, UniCredit Research
LIQUIDITY ANALYSIS
– We regard the liquidity situation at Fresenius/FMC as solid. The company's liquidity cushion predominantly rests on free cash flow-generation, cash on hand and availabilities under its revolving credit facilities.
– As of 30 September 2013, cash on hand amounted to EUR 873mn, which, however, is believed to be mostly needed for day-to-day operations (according to Moody's). In addition, Fresenius SE & Co. KGaA reported an additional financial cushion resulting from unutilized credit facilities of approximately EUR 2.4bn; this, however, largely relates to headroom at the FMC level and may not be readily available to the parent company. FMC reported that the company intends to maintain sufficient financial resources in the coming years, with a minimum of USD 300-500mn of committed and unutilized credit facilities.
– The asset deal with RHK of EUR 3.1bn will be fully debt financed. As expected, Fresenius has continued bank support and access to the capital markets. The vast majority of the transaction is expected to close by the end of the year.
– We estimate FCF of EUR 311mn in FY13 and 621mn in FY14 (excluding RHK acquisition).
– As of 30 September 2013, Fresenius Group was in compliance with all of its covenants.
CORPORATE STRUCTURE (FRESENIUS)
Fresenius Medical Care operating subsidiaries
Fresenius Kabi operating subsidiaris
2013 Senior
Credit Agreement
Senior Notes
due 2015
Senior Notes due 2019 Senior Notes due 2020
Fresenius SE & Co. KGaA
(Parent Guarantor)
Else Kröner-Fresenius- Stiftung
27.07%
Other Shareholders 72.93%
Fresenius Management SE (General Partner)
100%
0%
Fresenius Medical Care AG & Co. KGaA
31.2%
Fresenius Kabi AG (Subsidiary Guarantor)
100%
Fresenius P roServe GmbH
(Subsidiary Guarantor)
100%
VAMED AG (and other Fresenius Vamed
operating subsidiaries)
77%
HELIOS Kliniken GmbH (and other Fresenius HELIOS
operating subsidiaries)
100%
Fresenius Finance II B.V .
100%
Fresenius US Finance I, Inc.
100%
Fresenius US Finance II, Inc.
100%
Fresenius Finance B.V.
100%
Group subject to the covenants of the indenture
Senior Notes due 2016 Senior Notes due 2018 Senior Notes due 2021
Source: Fresenius, UniCredit Research
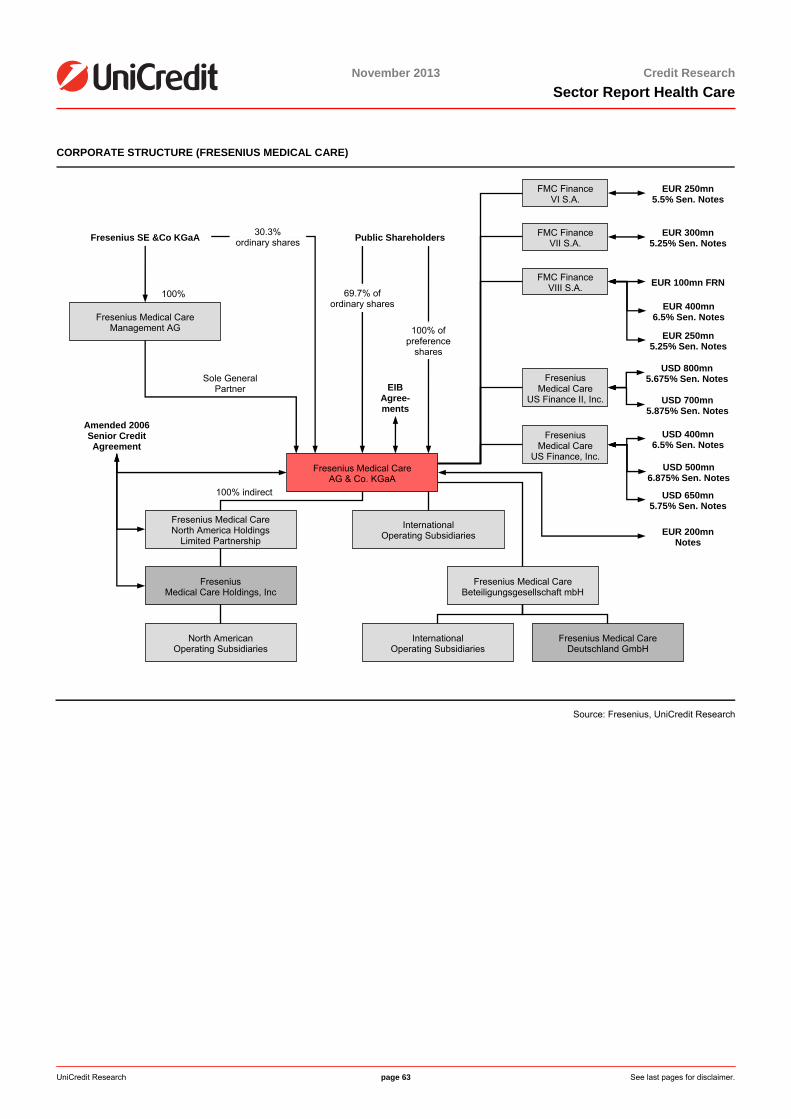
UniCredit Research page 63 See last pages for disclaimer.
November 2013 Credit ResearchSector Report Health Care
CORPORATE STRUCTURE (FRESENIUS MEDICAL CARE)
Source: Fresenius, UniCredit Research
Fresenius Medical Care North America Holdings
Limited Partnership
Fresenius Medical Care Holdings, Inc
North American Operating Subsidiaries
International Operating Subsidiaries
Fresenius Medical Care Beteiligungsgesellschaft mbH
Fresenius Medical Care Deutschland GmbH
International Operating Subsidiaries
Fresenius Medical Care
US Finance II, Inc.
Amended 2006 Senior Credit Agreement
100% indirect
USD 400mn 6.5% Sen. Notes
Fresenius Medical Care Management AG
Fresenius SE &Co KGaA
100%
30.3% ordinary shares
69.7% of ordinary shares
100% of preference
shares
Public Shareholders FMC Finance VII S.A.
FMC Finance VI S.A.
EUR 300mn 5.25% Sen. Notes
EUR 250mn 5.5% Sen. Notes
EUR 200mn Notes
EIB Agree-ments
Fresenius Medical Care AG & Co. KGaA
Fresenius Medical Care
US Finance, Inc. USD 500mn
6.875% Sen. Notes
USD 650mn 5.75% Sen. Notes
EUR 400mn 6.5% Sen. Notes
FMC Finance VIII S.A. EUR 100mn FRN
Sole General Partner
EUR 250mn 5.25% Sen. Notes
USD 800mn 5.675% Sen. Notes
USD 700mn 5.875% Sen. Notes
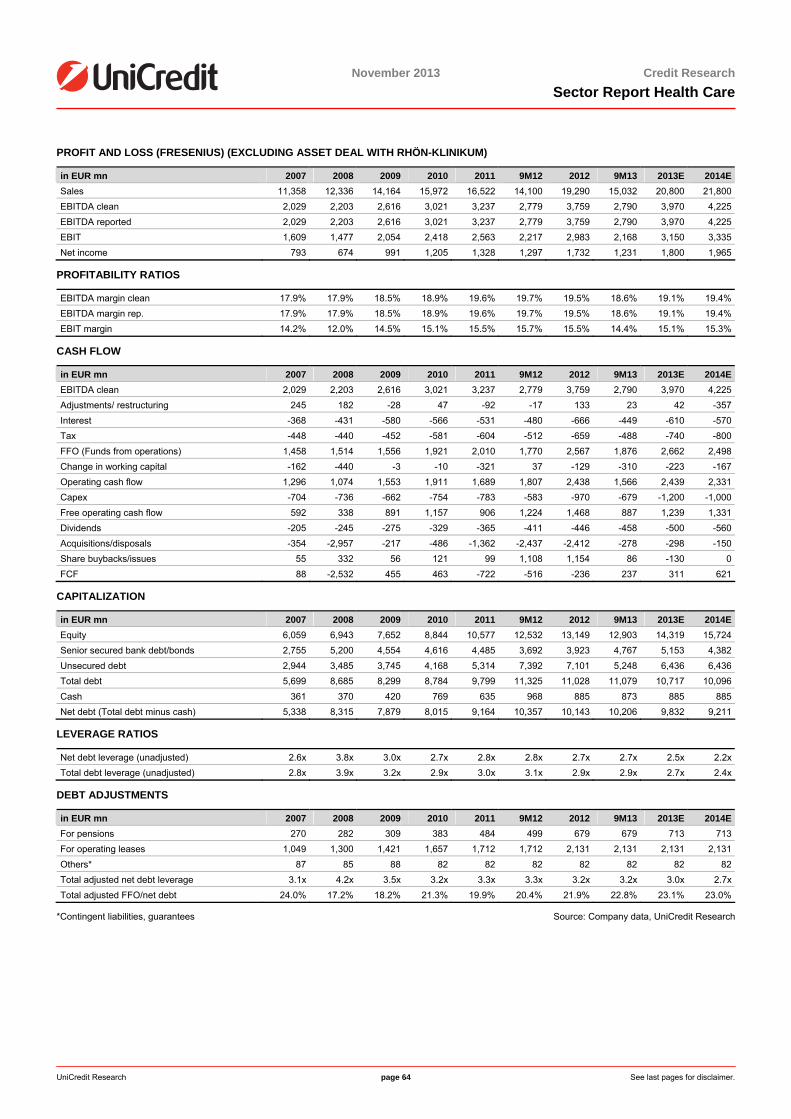
<date>
November 2013 Credit ResearchSector Report Health Care
UniCredit Research page 64 See last pages for disclaimer.
PROFIT AND LOSS (FRESENIUS) (EXCLUDING ASSET DEAL WITH RHÖN-KLINIKUM)
in EUR mn 2007 2008 2009 2010 2011 9M12 2012 9M13 2013E 2014ESales 11,358 12,336 14,164 15,972 16,522 14,100 19,290 15,032 20,800 21,800EBITDA clean 2,029 2,203 2,616 3,021 3,237 2,779 3,759 2,790 3,970 4,225EBITDA reported 2,029 2,203 2,616 3,021 3,237 2,779 3,759 2,790 3,970 4,225EBIT 1,609 1,477 2,054 2,418 2,563 2,217 2,983 2,168 3,150 3,335Net income 793 674 991 1,205 1,328 1,297 1,732 1,231 1,800 1,965
PROFITABILITY RATIOS
EBITDA margin clean 17.9% 17.9% 18.5% 18.9% 19.6% 19.7% 19.5% 18.6% 19.1% 19.4%EBITDA margin rep. 17.9% 17.9% 18.5% 18.9% 19.6% 19.7% 19.5% 18.6% 19.1% 19.4%EBIT margin 14.2% 12.0% 14.5% 15.1% 15.5% 15.7% 15.5% 14.4% 15.1% 15.3%
CASH FLOW
in EUR mn 2007 2008 2009 2010 2011 9M12 2012 9M13 2013E 2014EEBITDA clean 2,029 2,203 2,616 3,021 3,237 2,779 3,759 2,790 3,970 4,225Adjustments/ restructuring 245 182 -28 47 -92 -17 133 23 42 -357Interest -368 -431 -580 -566 -531 -480 -666 -449 -610 -570Tax -448 -440 -452 -581 -604 -512 -659 -488 -740 -800FFO (Funds from operations) 1,458 1,514 1,556 1,921 2,010 1,770 2,567 1,876 2,662 2,498Change in working capital -162 -440 -3 -10 -321 37 -129 -310 -223 -167Operating cash flow 1,296 1,074 1,553 1,911 1,689 1,807 2,438 1,566 2,439 2,331Capex -704 -736 -662 -754 -783 -583 -970 -679 -1,200 -1,000Free operating cash flow 592 338 891 1,157 906 1,224 1,468 887 1,239 1,331Dividends -205 -245 -275 -329 -365 -411 -446 -458 -500 -560Acquisitions/disposals -354 -2,957 -217 -486 -1,362 -2,437 -2,412 -278 -298 -150Share buybacks/issues 55 332 56 121 99 1,108 1,154 86 -130 0FCF 88 -2,532 455 463 -722 -516 -236 237 311 621
CAPITALIZATION
in EUR mn 2007 2008 2009 2010 2011 9M12 2012 9M13 2013E 2014EEquity 6,059 6,943 7,652 8,844 10,577 12,532 13,149 12,903 14,319 15,724Senior secured bank debt/bonds 2,755 5,200 4,554 4,616 4,485 3,692 3,923 4,767 5,153 4,382Unsecured debt 2,944 3,485 3,745 4,168 5,314 7,392 7,101 5,248 6,436 6,436Total debt 5,699 8,685 8,299 8,784 9,799 11,325 11,028 11,079 10,717 10,096Cash 361 370 420 769 635 968 885 873 885 885Net debt (Total debt minus cash) 5,338 8,315 7,879 8,015 9,164 10,357 10,143 10,206 9,832 9,211
LEVERAGE RATIOS
Net debt leverage (unadjusted) 2.6x 3.8x 3.0x 2.7x 2.8x 2.8x 2.7x 2.7x 2.5x 2.2xTotal debt leverage (unadjusted) 2.8x 3.9x 3.2x 2.9x 3.0x 3.1x 2.9x 2.9x 2.7x 2.4x
DEBT ADJUSTMENTS
in EUR mn 2007 2008 2009 2010 2011 9M12 2012 9M13 2013E 2014EFor pensions 270 282 309 383 484 499 679 679 713 713For operating leases 1,049 1,300 1,421 1,657 1,712 1,712 2,131 2,131 2,131 2,131Others* 87 85 88 82 82 82 82 82 82 82Total adjusted net debt leverage 3.1x 4.2x 3.5x 3.2x 3.3x 3.3x 3.2x 3.2x 3.0x 2.7xTotal adjusted FFO/net debt 24.0% 17.2% 18.2% 21.3% 19.9% 20.4% 21.9% 22.8% 23.1% 23.0%
*Contingent liabilities, guarantees Source: Company data, UniCredit Research

<date>
November 2013 Credit ResearchSector Report Health Care
UniCredit Research page 65 See last pages for disclaimer.
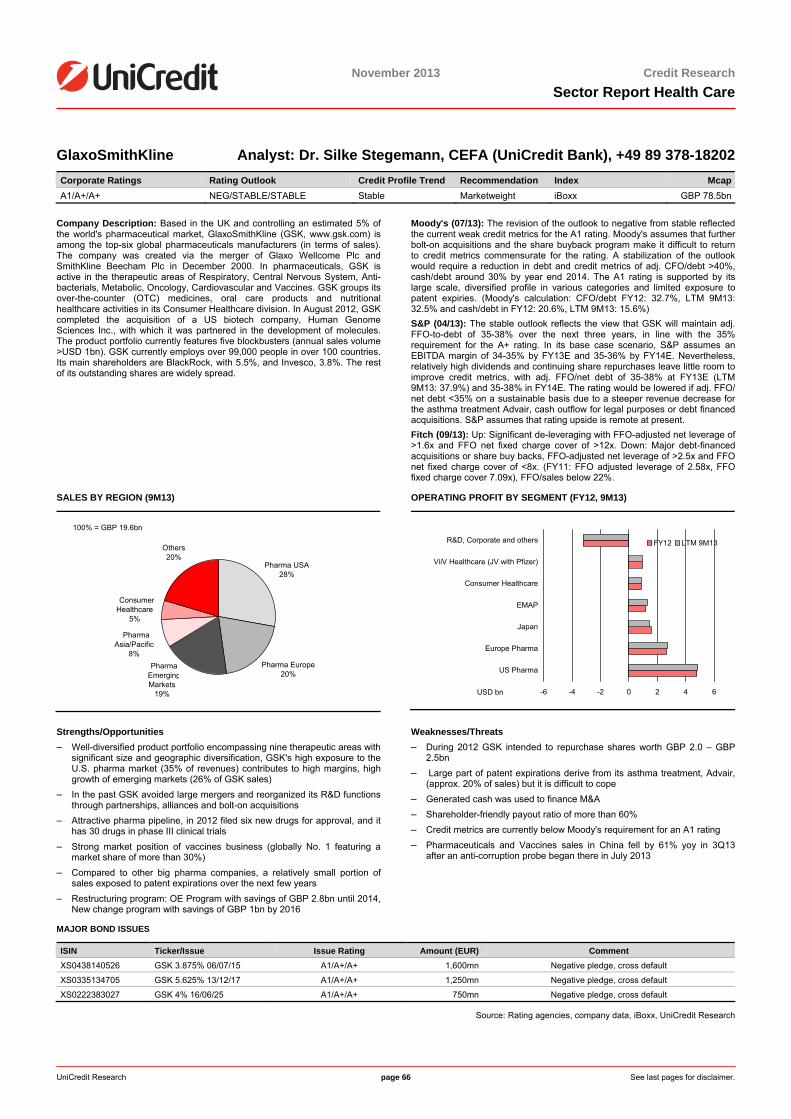
<date>
November 2013 Credit ResearchSector Report Health Care
UniCredit Research page 66 See last pages for disclaimer.
GlaxoSmithKline Analyst: Dr. Silke Stegemann, CEFA (UniCredit Bank), +49 89 378-18202 Corporate Ratings Rating Outlook Credit Profile Trend Recommendation Index McapA1/A+/A+ NEG/STABLE/STABLE Stable Marketweight iBoxx GBP 78.5bn
Company Description: Based in the UK and controlling an estimated 5% of the world's pharmaceutical market, GlaxoSmithKline (GSK, www.gsk.com) is among the top-six global pharmaceuticals manufacturers (in terms of sales). The company was created via the merger of Glaxo Wellcome Plc and SmithKline Beecham Plc in December 2000. In pharmaceuticals, GSK is active in the therapeutic areas of Respiratory, Central Nervous System, Anti-bacterials, Metabolic, Oncology, Cardiovascular and Vaccines. GSK groups its over-the-counter (OTC) medicines, oral care products and nutritional healthcare activities in its Consumer Healthcare division. In August 2012, GSK completed the acquisition of a US biotech company, Human Genome Sciences Inc., with which it was partnered in the development of molecules. The product portfolio currently features five blockbusters (annual sales volume >USD 1bn). GSK currently employs over 99,000 people in over 100 countries. Its main shareholders are BlackRock, with 5.5%, and Invesco, 3.8%. The rest of its outstanding shares are widely spread.
Moody's (07/13): The revision of the outlook to negative from stable reflected the current weak credit metrics for the A1 rating. Moody's assumes that further bolt-on acquisitions and the share buyback program make it difficult to return to credit metrics commensurate for the rating. A stabilization of the outlook would require a reduction in debt and credit metrics of adj. CFO/debt >40%, cash/debt around 30% by year end 2014. The A1 rating is supported by its large scale, diversified profile in various categories and limited exposure to patent expiries. (Moody's calculation: CFO/debt FY12: 32.7%, LTM 9M13: 32.5% and cash/debt in FY12: 20.6%, LTM 9M13: 15.6%) S&P (04/13): The stable outlook reflects the view that GSK will maintain adj. FFO-to-debt of 35-38% over the next three years, in line with the 35% requirement for the A+ rating. In its base case scenario, S&P assumes an EBITDA margin of 34-35% by FY13E and 35-36% by FY14E. Nevertheless, relatively high dividends and continuing share repurchases leave little room to improve credit metrics, with adj. FFO/net debt of 35-38% at FY13E (LTM 9M13: 37.9%) and 35-38% in FY14E. The rating would be lowered if adj. FFO/ net debt <35% on a sustainable basis due to a steeper revenue decrease for the asthma treatment Advair, cash outflow for legal purposes or debt financed acquisitions. S&P assumes that rating upside is remote at present. Fitch (09/13): Up: Significant de-leveraging with FFO-adjusted net leverage of >1.6x and FFO net fixed charge cover of >12x. Down: Major debt-financed acquisitions or share buy backs, FFO-adjusted net leverage of >2.5x and FFO net fixed charge cover of <8x. (FY11: FFO adjusted leverage of 2.58x, FFO fixed charge cover 7.09x), FFO/sales below 22%.
SALES BY REGION (9M13)
Pharma USA28%
ConsumerHealthcare
5%
Others20%
Pharma EmergingMarkets
19%
PharmaAsia/Pacific
8%Pharma Europe
20%
100% = GBP 19.6bn
OPERATING PROFIT BY SEGMENT (FY12, 9M13)
-6 -4 -2 0 2 4 6
US Pharma
Europe Pharma
Japan
EMAP
Consumer Healthcare
ViiV Healthcare (JV with Pfizer)
R&D, Corporate and others FY12 LTM 9M13
USD bn
Strengths/Opportunities – Well-diversified product portfolio encompassing nine therapeutic areas with
significant size and geographic diversification, GSK's high exposure to the U.S. pharma market (35% of revenues) contributes to high margins, high growth of emerging markets (26% of GSK sales)
– In the past GSK avoided large mergers and reorganized its R&D functions through partnerships, alliances and bolt-on acquisitions
– Attractive pharma pipeline, in 2012 filed six new drugs for approval, and it has 30 drugs in phase III clinical trials
– Strong market position of vaccines business (globally No. 1 featuring a market share of more than 30%)
– Compared to other big pharma companies, a relatively small portion of sales exposed to patent expirations over the next few years
– Restructuring program: OE Program with savings of GBP 2.8bn until 2014, New change program with savings of GBP 1bn by 2016
Weaknesses/Threats – During 2012 GSK intended to repurchase shares worth GBP 2.0 – GBP
2.5bn – Large part of patent expirations derive from its asthma treatment, Advair,
(approx. 20% of sales) but it is difficult to cope – Generated cash was used to finance M&A – Shareholder-friendly payout ratio of more than 60% – Credit metrics are currently below Moody's requirement for an A1 rating – Pharmaceuticals and Vaccines sales in China fell by 61% yoy in 3Q13
after an anti-corruption probe began there in July 2013
MAJOR BOND ISSUES
ISIN Ticker/Issue Issue Rating Amount (EUR) Comment XS0438140526 GSK 3.875% 06/07/15 A1/A+/A+ 1,600mn Negative pledge, cross default
XS0335134705 GSK 5.625% 13/12/17 A1/A+/A+ 1,250mn Negative pledge, cross default
XS0222383027 GSK 4% 16/06/25 A1/A+/A+ 750mn Negative pledge, cross default
Source: Rating agencies, company data, iBoxx, UniCredit Research
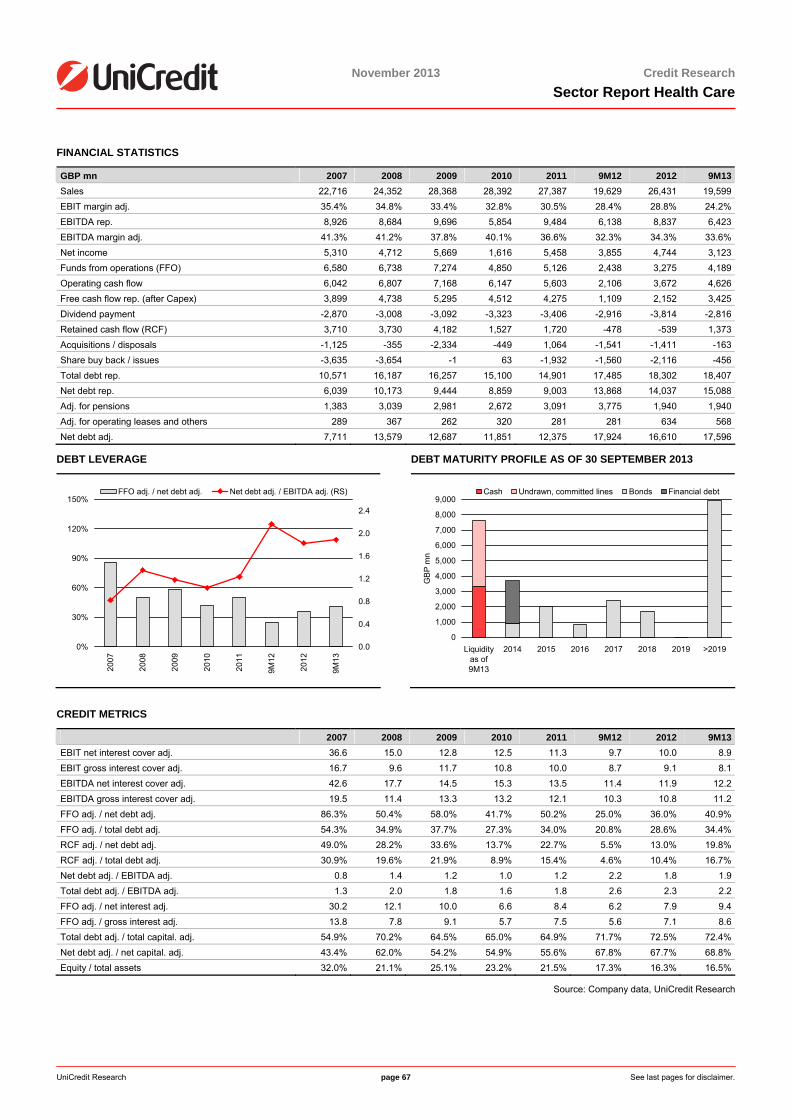
<date>
UniCredit Research page 67 See last pages for disclaimer.
November 2013 Credit ResearchSector Report Health Care
FINANCIAL STATISTICS
GBP mn 2007 2008 2009 2010 2011 9M12 2012 9M13Sales 22,716 24,352 28,368 28,392 27,387 19,629 26,431 19,599EBIT margin adj. 35.4% 34.8% 33.4% 32.8% 30.5% 28.4% 28.8% 24.2%EBITDA rep. 8,926 8,684 9,696 5,854 9,484 6,138 8,837 6,423EBITDA margin adj. 41.3% 41.2% 37.8% 40.1% 36.6% 32.3% 34.3% 33.6%Net income 5,310 4,712 5,669 1,616 5,458 3,855 4,744 3,123Funds from operations (FFO) 6,580 6,738 7,274 4,850 5,126 2,438 3,275 4,189Operating cash flow 6,042 6,807 7,168 6,147 5,603 2,106 3,672 4,626Free cash flow rep. (after Capex) 3,899 4,738 5,295 4,512 4,275 1,109 2,152 3,425Dividend payment -2,870 -3,008 -3,092 -3,323 -3,406 -2,916 -3,814 -2,816Retained cash flow (RCF) 3,710 3,730 4,182 1,527 1,720 -478 -539 1,373Acquisitions / disposals -1,125 -355 -2,334 -449 1,064 -1,541 -1,411 -163Share buy back / issues -3,635 -3,654 -1 63 -1,932 -1,560 -2,116 -456Total debt rep. 10,571 16,187 16,257 15,100 14,901 17,485 18,302 18,407Net debt rep. 6,039 10,173 9,444 8,859 9,003 13,868 14,037 15,088Adj. for pensions 1,383 3,039 2,981 2,672 3,091 3,775 1,940 1,940Adj. for operating leases and others 289 367 262 320 281 281 634 568Net debt adj. 7,711 13,579 12,687 11,851 12,375 17,924 16,610 17,596
DEBT LEVERAGE
0%
30%
60%
90%
120%
150%
2007
2008
2009
2010
2011
9M12
2012
9M13
0.0
0.4
0.8
1.2
1.6
2.0
2.4
FFO adj. / net debt adj. Net debt adj. / EBITDA adj. (RS)
DEBT MATURITY PROFILE AS OF 30 SEPTEMBER 2013
0
1,000
2,000
3,000
4,000
5,000
6,000
7,000
8,000
9,000
Liquidityas of9M13
2014 2015 2016 2017 2018 2019 >2019
GB
P m
n
Cash Undrawn, committed lines Bonds Financial debt
CREDIT METRICS
2007 2008 2009 2010 2011 9M12 2012 9M13EBIT net interest cover adj. 36.6 15.0 12.8 12.5 11.3 9.7 10.0 8.9EBIT gross interest cover adj. 16.7 9.6 11.7 10.8 10.0 8.7 9.1 8.1EBITDA net interest cover adj. 42.6 17.7 14.5 15.3 13.5 11.4 11.9 12.2EBITDA gross interest cover adj. 19.5 11.4 13.3 13.2 12.1 10.3 10.8 11.2FFO adj. / net debt adj. 86.3% 50.4% 58.0% 41.7% 50.2% 25.0% 36.0% 40.9%FFO adj. / total debt adj. 54.3% 34.9% 37.7% 27.3% 34.0% 20.8% 28.6% 34.4%RCF adj. / net debt adj. 49.0% 28.2% 33.6% 13.7% 22.7% 5.5% 13.0% 19.8%RCF adj. / total debt adj. 30.9% 19.6% 21.9% 8.9% 15.4% 4.6% 10.4% 16.7%Net debt adj. / EBITDA adj. 0.8 1.4 1.2 1.0 1.2 2.2 1.8 1.9Total debt adj. / EBITDA adj. 1.3 2.0 1.8 1.6 1.8 2.6 2.3 2.2FFO adj. / net interest adj. 30.2 12.1 10.0 6.6 8.4 6.2 7.9 9.4FFO adj. / gross interest adj. 13.8 7.8 9.1 5.7 7.5 5.6 7.1 8.6Total debt adj. / total capital. adj. 54.9% 70.2% 64.5% 65.0% 64.9% 71.7% 72.5% 72.4%Net debt adj. / net capital. adj. 43.4% 62.0% 54.2% 54.9% 55.6% 67.8% 67.7% 68.8%Equity / total assets 32.0% 21.1% 25.1% 23.2% 21.5% 17.3% 16.3% 16.5%
Source: Company data, UniCredit Research
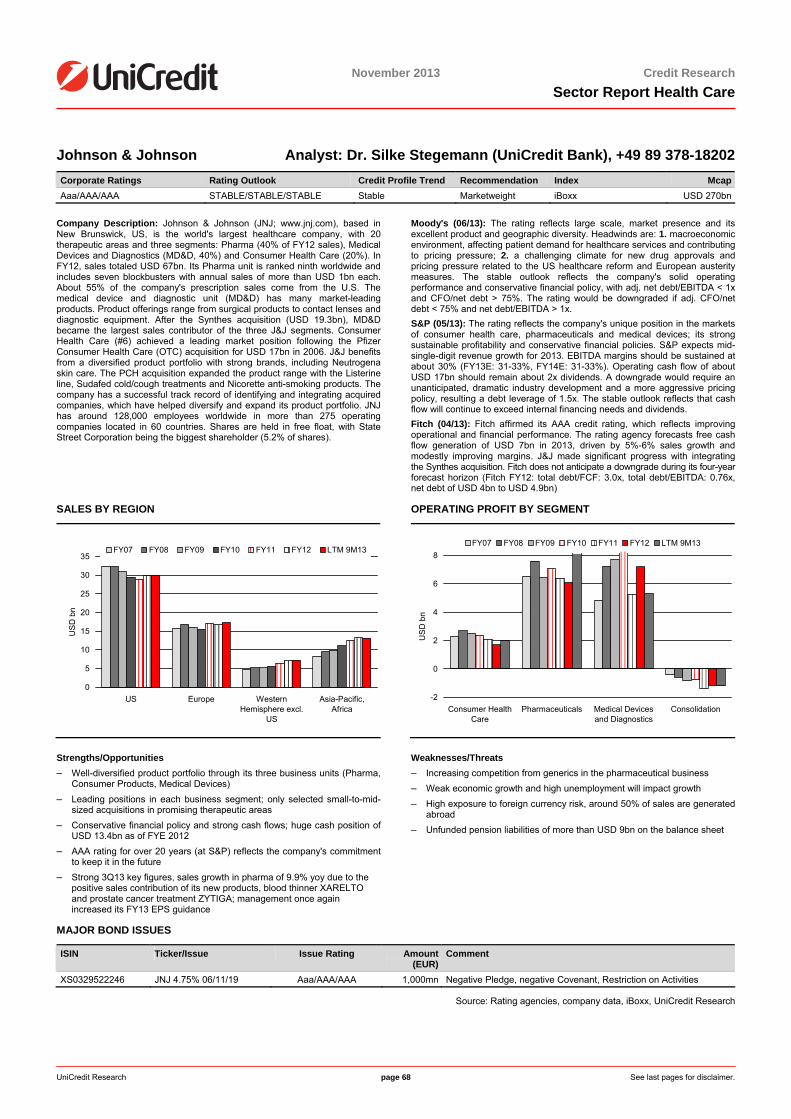
26 November 2013
November 2013 Credit ResearchSector Report Health Care
UniCredit Research page 68 See last pages for disclaimer.
Johnson & Johnson Analyst: Dr. Silke Stegemann (UniCredit Bank), +49 89 378-18202 Corporate Ratings Rating Outlook Credit Profile Trend Recommendation Index McapAaa/AAA/AAA STABLE/STABLE/STABLE Stable Marketweight iBoxx USD 270bn
Company Description: Johnson & Johnson (JNJ; www.jnj.com), based in New Brunswick, US, is the world's largest healthcare company, with 20 therapeutic areas and three segments: Pharma (40% of FY12 sales), Medical Devices and Diagnostics (MD&D, 40%) and Consumer Health Care (20%). In FY12, sales totaled USD 67bn. Its Pharma unit is ranked ninth worldwide and includes seven blockbusters with annual sales of more than USD 1bn each. About 55% of the company's prescription sales come from the U.S. The medical device and diagnostic unit (MD&D) has many market-leading products. Product offerings range from surgical products to contact lenses and diagnostic equipment. After the Synthes acquisition (USD 19.3bn), MD&D became the largest sales contributor of the three J&J segments. Consumer Health Care (#6) achieved a leading market position following the Pfizer Consumer Health Care (OTC) acquisition for USD 17bn in 2006. J&J benefits from a diversified product portfolio with strong brands, including Neutrogena skin care. The PCH acquisition expanded the product range with the Listerine line, Sudafed cold/cough treatments and Nicorette anti-smoking products. The company has a successful track record of identifying and integrating acquired companies, which have helped diversify and expand its product portfolio. JNJ has around 128,000 employees worldwide in more than 275 operating companies located in 60 countries. Shares are held in free float, with State Street Corporation being the biggest shareholder (5.2% of shares).
Moody's (06/13): The rating reflects large scale, market presence and its excellent product and geographic diversity. Headwinds are: 1. macroeconomic environment, affecting patient demand for healthcare services and contributing to pricing pressure; 2. a challenging climate for new drug approvals and pricing pressure related to the US healthcare reform and European austerity measures. The stable outlook reflects the company's solid operating performance and conservative financial policy, with adj. net debt/EBITDA < 1x and CFO/net debt > 75%. The rating would be downgraded if adj. CFO/net debt < 75% and net debt/EBITDA > 1x. S&P (05/13): The rating reflects the company's unique position in the markets of consumer health care, pharmaceuticals and medical devices; its strong sustainable profitability and conservative financial policies. S&P expects mid-single-digit revenue growth for 2013. EBITDA margins should be sustained at about 30% (FY13E: 31-33%, FY14E: 31-33%). Operating cash flow of about USD 17bn should remain about 2x dividends. A downgrade would require an unanticipated, dramatic industry development and a more aggressive pricing policy, resulting a debt leverage of 1.5x. The stable outlook reflects that cash flow will continue to exceed internal financing needs and dividends. Fitch (04/13): Fitch affirmed its AAA credit rating, which reflects improving operational and financial performance. The rating agency forecasts free cash flow generation of USD 7bn in 2013, driven by 5%-6% sales growth and modestly improving margins. J&J made significant progress with integrating the Synthes acquisition. Fitch does not anticipate a downgrade during its four-year forecast horizon (Fitch FY12: total debt/FCF: 3.0x, total debt/EBITDA: 0.76x, net debt of USD 4bn to USD 4.9bn)
SALES BY REGION
0
5
10
15
20
25
30
35
US Europe WesternHemisphere excl.
US
Asia-Pacific,Africa
US
D b
n
FY07 FY08 FY09 FY10 FY11 FY12 LTM 9M13
OPERATING PROFIT BY SEGMENT
-2
0
2
4
6
8
Consumer HealthCare
Pharmaceuticals Medical Devicesand Diagnostics
Consolidation
US
D b
n
FY07 FY08 FY09 FY10 FY11 FY12 LTM 9M13
Strengths/Opportunities – Well-diversified product portfolio through its three business units (Pharma,
Consumer Products, Medical Devices) – Leading positions in each business segment; only selected small-to-mid-
sized acquisitions in promising therapeutic areas – Conservative financial policy and strong cash flows; huge cash position of
USD 13.4bn as of FYE 2012 – AAA rating for over 20 years (at S&P) reflects the company's commitment
to keep it in the future – Strong 3Q13 key figures, sales growth in pharma of 9.9% yoy due to the
positive sales contribution of its new products, blood thinner XARELTO and prostate cancer treatment ZYTIGA; management once again increased its FY13 EPS guidance
Weaknesses/Threats – Increasing competition from generics in the pharmaceutical business – Weak economic growth and high unemployment will impact growth – High exposure to foreign currency risk, around 50% of sales are generated
abroad – Unfunded pension liabilities of more than USD 9bn on the balance sheet
MAJOR BOND ISSUES
ISIN Ticker/Issue Issue Rating Amount (EUR)
Comment
XS0329522246 JNJ 4.75% 06/11/19 Aaa/AAA/AAA 1,000mn Negative Pledge, negative Covenant, Restriction on Activities
Source: Rating agencies, company data, iBoxx, UniCredit Research
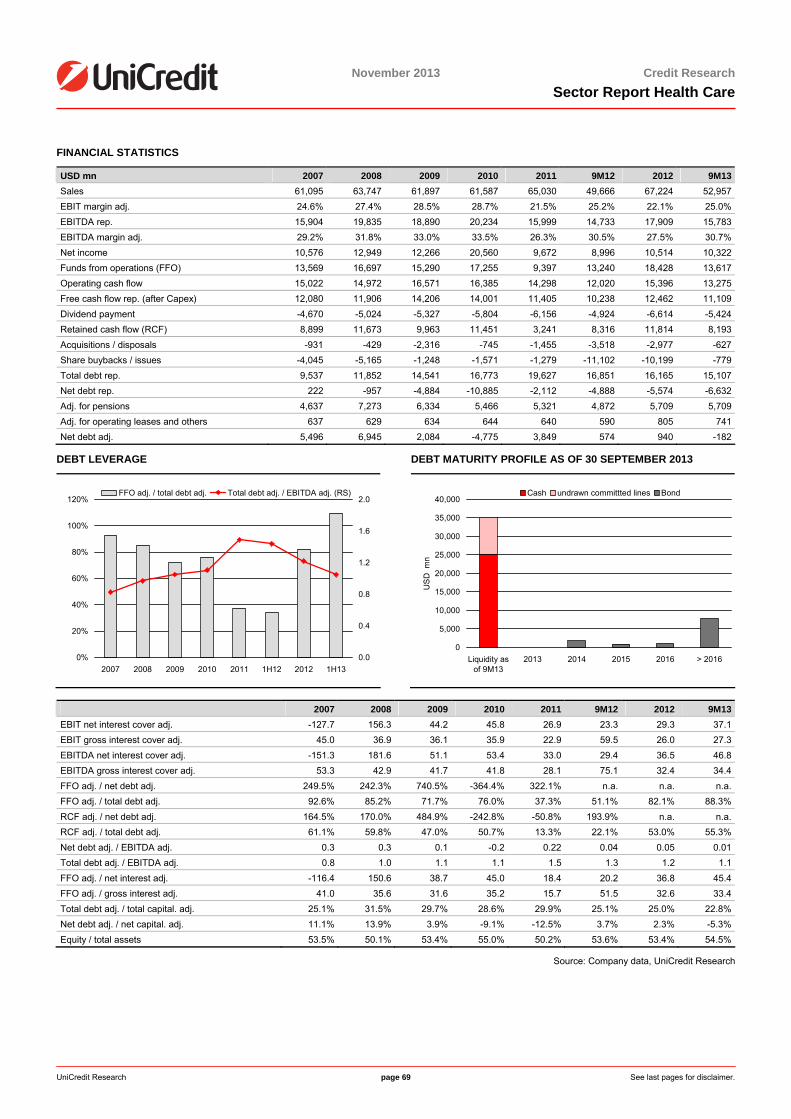
<date>
UniCredit Research page 69 See last pages for disclaimer.
November 2013 Credit ResearchSector Report Health Care
FINANCIAL STATISTICS
USD mn 2007 2008 2009 2010 2011 9M12 2012 9M13Sales 61,095 63,747 61,897 61,587 65,030 49,666 67,224 52,957EBIT margin adj. 24.6% 27.4% 28.5% 28.7% 21.5% 25.2% 22.1% 25.0%EBITDA rep. 15,904 19,835 18,890 20,234 15,999 14,733 17,909 15,783EBITDA margin adj. 29.2% 31.8% 33.0% 33.5% 26.3% 30.5% 27.5% 30.7%Net income 10,576 12,949 12,266 20,560 9,672 8,996 10,514 10,322Funds from operations (FFO) 13,569 16,697 15,290 17,255 9,397 13,240 18,428 13,617Operating cash flow 15,022 14,972 16,571 16,385 14,298 12,020 15,396 13,275Free cash flow rep. (after Capex) 12,080 11,906 14,206 14,001 11,405 10,238 12,462 11,109Dividend payment -4,670 -5,024 -5,327 -5,804 -6,156 -4,924 -6,614 -5,424Retained cash flow (RCF) 8,899 11,673 9,963 11,451 3,241 8,316 11,814 8,193Acquisitions / disposals -931 -429 -2,316 -745 -1,455 -3,518 -2,977 -627Share buybacks / issues -4,045 -5,165 -1,248 -1,571 -1,279 -11,102 -10,199 -779Total debt rep. 9,537 11,852 14,541 16,773 19,627 16,851 16,165 15,107Net debt rep. 222 -957 -4,884 -10,885 -2,112 -4,888 -5,574 -6,632Adj. for pensions 4,637 7,273 6,334 5,466 5,321 4,872 5,709 5,709Adj. for operating leases and others 637 629 634 644 640 590 805 741Net debt adj. 5,496 6,945 2,084 -4,775 3,849 574 940 -182
DEBT LEVERAGE
0%
20%
40%
60%
80%
100%
120%
2007 2008 2009 2010 2011 1H12 2012 1H130.0
0.4
0.8
1.2
1.6
2.0FFO adj. / total debt adj. Total debt adj. / EBITDA adj. (RS)
DEBT MATURITY PROFILE AS OF 30 SEPTEMBER 2013
0
5,000
10,000
15,000
20,000
25,000
30,000
35,000
40,000
Liquidity asof 9M13
2013 2014 2015 2016 > 2016
US
D m
n
Cash undrawn committted lines Bond
2007 2008 2009 2010 2011 9M12 2012 9M13EBIT net interest cover adj. -127.7 156.3 44.2 45.8 26.9 23.3 29.3 37.1EBIT gross interest cover adj. 45.0 36.9 36.1 35.9 22.9 59.5 26.0 27.3EBITDA net interest cover adj. -151.3 181.6 51.1 53.4 33.0 29.4 36.5 46.8EBITDA gross interest cover adj. 53.3 42.9 41.7 41.8 28.1 75.1 32.4 34.4FFO adj. / net debt adj. 249.5% 242.3% 740.5% -364.4% 322.1% n.a. n.a. n.a.FFO adj. / total debt adj. 92.6% 85.2% 71.7% 76.0% 37.3% 51.1% 82.1% 88.3%RCF adj. / net debt adj. 164.5% 170.0% 484.9% -242.8% -50.8% 193.9% n.a. n.a.RCF adj. / total debt adj. 61.1% 59.8% 47.0% 50.7% 13.3% 22.1% 53.0% 55.3%Net debt adj. / EBITDA adj. 0.3 0.3 0.1 -0.2 0.22 0.04 0.05 0.01Total debt adj. / EBITDA adj. 0.8 1.0 1.1 1.1 1.5 1.3 1.2 1.1FFO adj. / net interest adj. -116.4 150.6 38.7 45.0 18.4 20.2 36.8 45.4FFO adj. / gross interest adj. 41.0 35.6 31.6 35.2 15.7 51.5 32.6 33.4Total debt adj. / total capital. adj. 25.1% 31.5% 29.7% 28.6% 29.9% 25.1% 25.0% 22.8%Net debt adj. / net capital. adj. 11.1% 13.9% 3.9% -9.1% -12.5% 3.7% 2.3% -5.3%Equity / total assets 53.5% 50.1% 53.4% 55.0% 50.2% 53.6% 53.4% 54.5%
Source: Company data, UniCredit Research
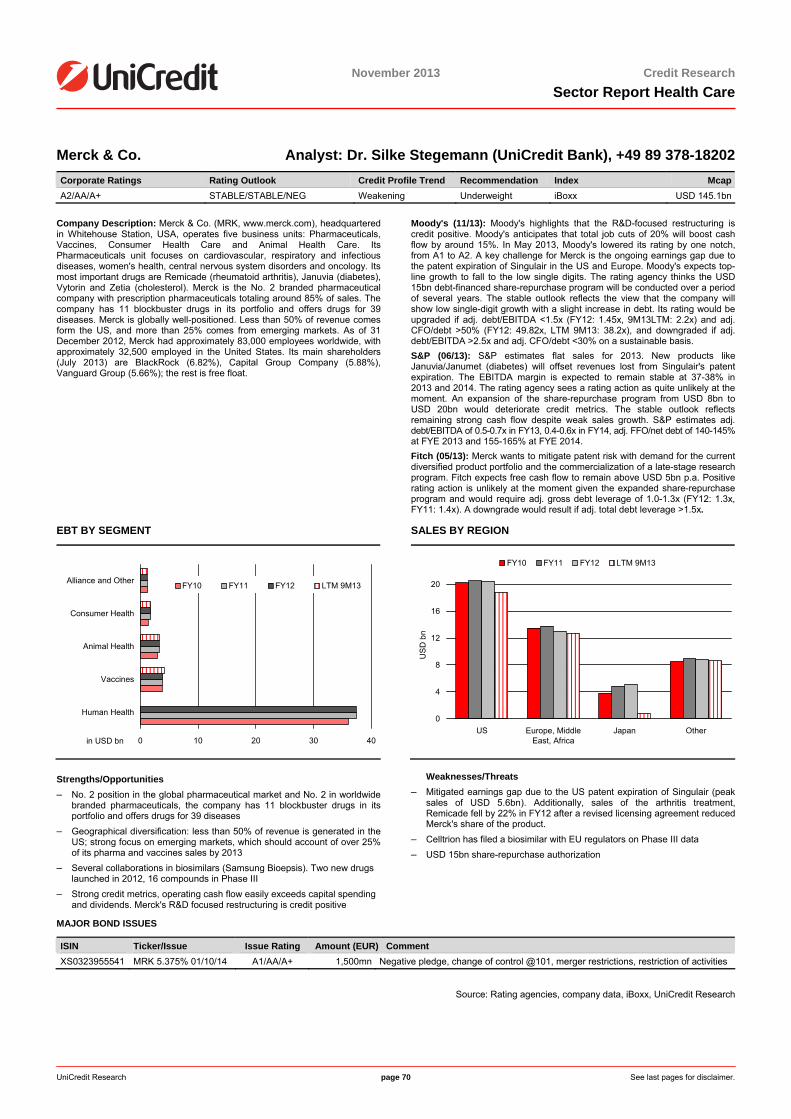
<date>
November 2013 Credit ResearchSector Report Health Care
UniCredit Research page 70 See last pages for disclaimer.
Merck & Co. Analyst: Dr. Silke Stegemann (UniCredit Bank), +49 89 378-18202 Corporate Ratings Rating Outlook Credit Profile Trend Recommendation Index McapA2/AA/A+ STABLE/STABLE/NEG Weakening Underweight iBoxx USD 145.1bn
Company Description: Merck & Co. (MRK, www.merck.com), headquartered in Whitehouse Station, USA, operates five business units: Pharmaceuticals, Vaccines, Consumer Health Care and Animal Health Care. Its Pharmaceuticals unit focuses on cardiovascular, respiratory and infectious diseases, women's health, central nervous system disorders and oncology. Its most important drugs are Remicade (rheumatoid arthritis), Januvia (diabetes), Vytorin and Zetia (cholesterol). Merck is the No. 2 branded pharmaceutical company with prescription pharmaceuticals totaling around 85% of sales. The company has 11 blockbuster drugs in its portfolio and offers drugs for 39 diseases. Merck is globally well-positioned. Less than 50% of revenue comes form the US, and more than 25% comes from emerging markets. As of 31 December 2012, Merck had approximately 83,000 employees worldwide, with approximately 32,500 employed in the United States. Its main shareholders (July 2013) are BlackRock (6.82%), Capital Group Company (5.88%), Vanguard Group (5.66%); the rest is free float.
Moody's (11/13): Moody's highlights that the R&D-focused restructuring is credit positive. Moody's anticipates that total job cuts of 20% will boost cash flow by around 15%. In May 2013, Moody's lowered its rating by one notch, from A1 to A2. A key challenge for Merck is the ongoing earnings gap due to the patent expiration of Singulair in the US and Europe. Moody's expects top-line growth to fall to the low single digits. The rating agency thinks the USD 15bn debt-financed share-repurchase program will be conducted over a period of several years. The stable outlook reflects the view that the company will show low single-digit growth with a slight increase in debt. Its rating would be upgraded if adj. debt/EBITDA <1.5x (FY12: 1.45x, 9M13LTM: 2.2x) and adj. CFO/debt >50% (FY12: 49.82x, LTM 9M13: 38.2x), and downgraded if adj. debt/EBITDA >2.5x and adj. CFO/debt <30% on a sustainable basis. S&P (06/13): S&P estimates flat sales for 2013. New products like Januvia/Janumet (diabetes) will offset revenues lost from Singulair's patent expiration. The EBITDA margin is expected to remain stable at 37-38% in 2013 and 2014. The rating agency sees a rating action as quite unlikely at the moment. An expansion of the share-repurchase program from USD 8bn to USD 20bn would deteriorate credit metrics. The stable outlook reflects remaining strong cash flow despite weak sales growth. S&P estimates adj. debt/EBITDA of 0.5-0.7x in FY13, 0.4-0.6x in FY14, adj. FFO/net debt of 140-145% at FYE 2013 and 155-165% at FYE 2014. Fitch (05/13): Merck wants to mitigate patent risk with demand for the current diversified product portfolio and the commercialization of a late-stage research program. Fitch expects free cash flow to remain above USD 5bn p.a. Positive rating action is unlikely at the moment given the expanded share-repurchase program and would require adj. gross debt leverage of 1.0-1.3x (FY12: 1.3x, FY11: 1.4x). A downgrade would result if adj. total debt leverage >1.5x.
EBT BY SEGMENT
0 10 20 30 40
Human Health
Vaccines
Animal Health
Consumer Health
Alliance and Other FY10 FY11 FY12 LTM 9M13
in USD bn
SALES BY REGION
0
4
8
12
16
20
US Europe, MiddleEast, Africa
Japan Other
US
D b
n
FY10 FY11 FY12 LTM 9M13
Strengths/Opportunities – No. 2 position in the global pharmaceutical market and No. 2 in worldwide
branded pharmaceuticals, the company has 11 blockbuster drugs in its portfolio and offers drugs for 39 diseases
– Geographical diversification: less than 50% of revenue is generated in the US; strong focus on emerging markets, which should account of over 25% of its pharma and vaccines sales by 2013
– Several collaborations in biosimilars (Samsung Bioepsis). Two new drugs launched in 2012, 16 compounds in Phase III
– Strong credit metrics, operating cash flow easily exceeds capital spending and dividends. Merck's R&D focused restructuring is credit positive
Weaknesses/Threats – Mitigated earnings gap due to the US patent expiration of Singulair (peak
sales of USD 5.6bn). Additionally, sales of the arthritis treatment, Remicade fell by 22% in FY12 after a revised licensing agreement reduced Merck's share of the product.
– Celltrion has filed a biosimilar with EU regulators on Phase III data – USD 15bn share-repurchase authorization
MAJOR BOND ISSUES
ISIN Ticker/Issue Issue Rating Amount (EUR) Comment XS0323955541 MRK 5.375% 01/10/14 A1/AA/A+ 1,500mn Negative pledge, change of control @101, merger restrictions, restriction of activities
Source: Rating agencies, company data, iBoxx, UniCredit Research
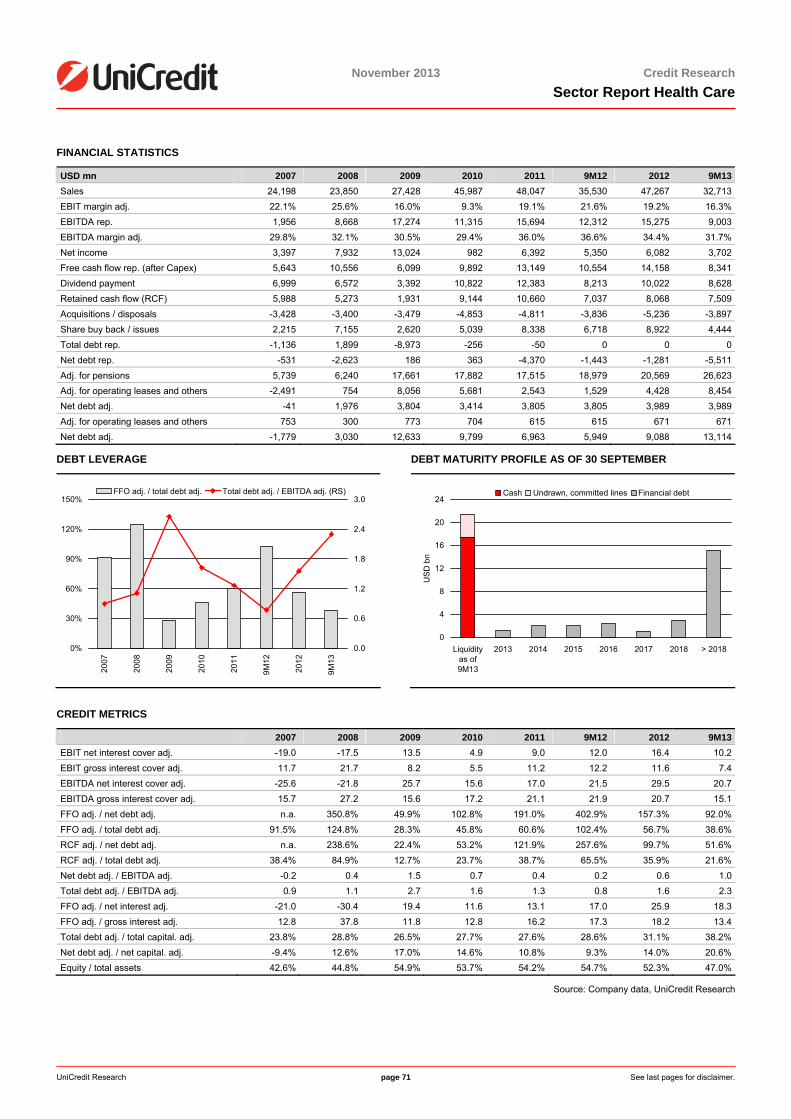
<date>
UniCredit Research page 71 See last pages for disclaimer.
November 2013 Credit ResearchSector Report Health Care
FINANCIAL STATISTICS
USD mn 2007 2008 2009 2010 2011 9M12 2012 9M13Sales 24,198 23,850 27,428 45,987 48,047 35,530 47,267 32,713EBIT margin adj. 22.1% 25.6% 16.0% 9.3% 19.1% 21.6% 19.2% 16.3%EBITDA rep. 1,956 8,668 17,274 11,315 15,694 12,312 15,275 9,003EBITDA margin adj. 29.8% 32.1% 30.5% 29.4% 36.0% 36.6% 34.4% 31.7%Net income 3,397 7,932 13,024 982 6,392 5,350 6,082 3,702Free cash flow rep. (after Capex) 5,643 10,556 6,099 9,892 13,149 10,554 14,158 8,341Dividend payment 6,999 6,572 3,392 10,822 12,383 8,213 10,022 8,628Retained cash flow (RCF) 5,988 5,273 1,931 9,144 10,660 7,037 8,068 7,509Acquisitions / disposals -3,428 -3,400 -3,479 -4,853 -4,811 -3,836 -5,236 -3,897Share buy back / issues 2,215 7,155 2,620 5,039 8,338 6,718 8,922 4,444Total debt rep. -1,136 1,899 -8,973 -256 -50 0 0 0Net debt rep. -531 -2,623 186 363 -4,370 -1,443 -1,281 -5,511Adj. for pensions 5,739 6,240 17,661 17,882 17,515 18,979 20,569 26,623Adj. for operating leases and others -2,491 754 8,056 5,681 2,543 1,529 4,428 8,454Net debt adj. -41 1,976 3,804 3,414 3,805 3,805 3,989 3,989Adj. for operating leases and others 753 300 773 704 615 615 671 671Net debt adj. -1,779 3,030 12,633 9,799 6,963 5,949 9,088 13,114
DEBT LEVERAGE
0%
30%
60%
90%
120%
150%
2007
2008
2009
2010
2011
9M12
2012
9M13
0.0
0.6
1.2
1.8
2.4
3.0FFO adj. / total debt adj. Total debt adj. / EBITDA adj. (RS)
DEBT MATURITY PROFILE AS OF 30 SEPTEMBER
0
4
8
12
16
20
24
Liquidityas of9M13
2013 2014 2015 2016 2017 2018 > 2018
US
D b
n
Cash Undrawn, committed lines Financial debt
CREDIT METRICS
2007 2008 2009 2010 2011 9M12 2012 9M13EBIT net interest cover adj. -19.0 -17.5 13.5 4.9 9.0 12.0 16.4 10.2EBIT gross interest cover adj. 11.7 21.7 8.2 5.5 11.2 12.2 11.6 7.4EBITDA net interest cover adj. -25.6 -21.8 25.7 15.6 17.0 21.5 29.5 20.7EBITDA gross interest cover adj. 15.7 27.2 15.6 17.2 21.1 21.9 20.7 15.1FFO adj. / net debt adj. n.a. 350.8% 49.9% 102.8% 191.0% 402.9% 157.3% 92.0%FFO adj. / total debt adj. 91.5% 124.8% 28.3% 45.8% 60.6% 102.4% 56.7% 38.6%RCF adj. / net debt adj. n.a. 238.6% 22.4% 53.2% 121.9% 257.6% 99.7% 51.6%RCF adj. / total debt adj. 38.4% 84.9% 12.7% 23.7% 38.7% 65.5% 35.9% 21.6%Net debt adj. / EBITDA adj. -0.2 0.4 1.5 0.7 0.4 0.2 0.6 1.0Total debt adj. / EBITDA adj. 0.9 1.1 2.7 1.6 1.3 0.8 1.6 2.3FFO adj. / net interest adj. -21.0 -30.4 19.4 11.6 13.1 17.0 25.9 18.3FFO adj. / gross interest adj. 12.8 37.8 11.8 12.8 16.2 17.3 18.2 13.4Total debt adj. / total capital. adj. 23.8% 28.8% 26.5% 27.7% 27.6% 28.6% 31.1% 38.2%Net debt adj. / net capital. adj. -9.4% 12.6% 17.0% 14.6% 10.8% 9.3% 14.0% 20.6%Equity / total assets 42.6% 44.8% 54.9% 53.7% 54.2% 54.7% 52.3% 47.0%
Source: Company data, UniCredit Research
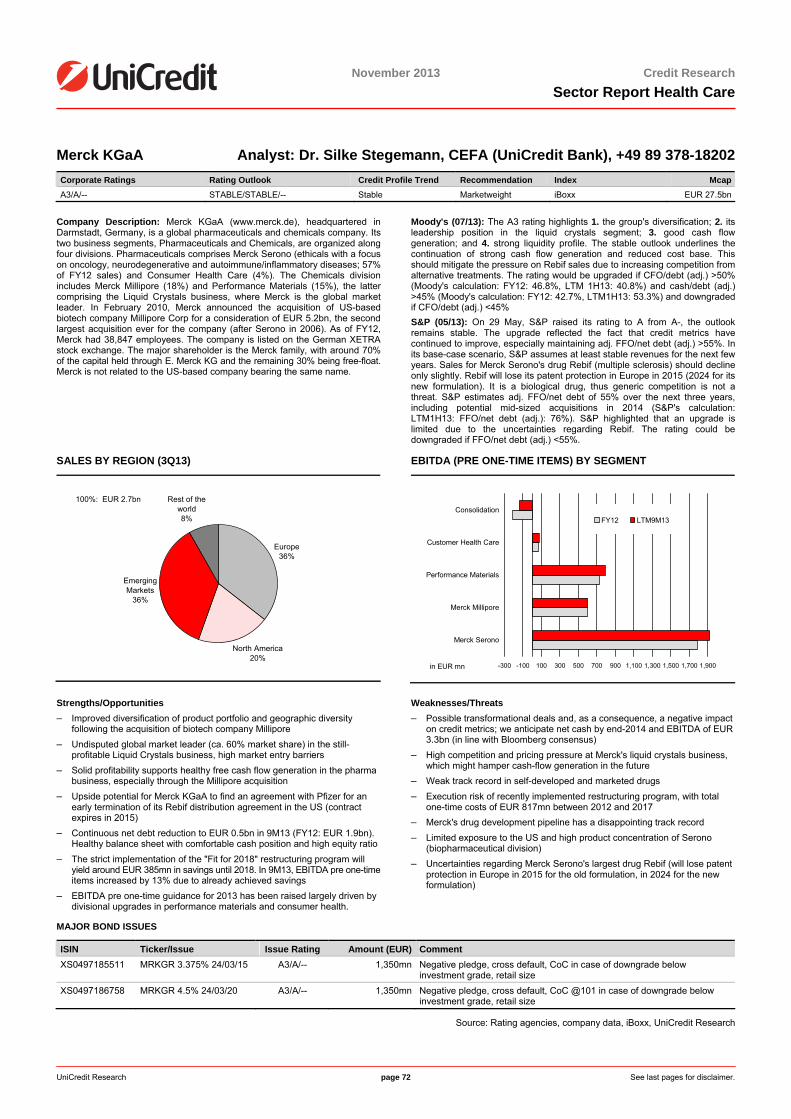
November 2013 Credit ResearchSector Report Health Care
UniCredit Research page 72 See last pages for disclaimer.
Merck KGaA Analyst: Dr. Silke Stegemann, CEFA (UniCredit Bank), +49 89 378-18202 Corporate Ratings Rating Outlook Credit Profile Trend Recommendation Index McapA3/A/-- STABLE/STABLE/-- Stable Marketweight iBoxx EUR 27.5bn
Company Description: Merck KGaA (www.merck.de), headquartered in Darmstadt, Germany, is a global pharmaceuticals and chemicals company. Its two business segments, Pharmaceuticals and Chemicals, are organized along four divisions. Pharmaceuticals comprises Merck Serono (ethicals with a focus on oncology, neurodegenerative and autoimmune/inflammatory diseases; 57% of FY12 sales) and Consumer Health Care (4%). The Chemicals division includes Merck Millipore (18%) and Performance Materials (15%), the latter comprising the Liquid Crystals business, where Merck is the global market leader. In February 2010, Merck announced the acquisition of US-based biotech company Millipore Corp for a consideration of EUR 5.2bn, the second largest acquisition ever for the company (after Serono in 2006). As of FY12, Merck had 38,847 employees. The company is listed on the German XETRA stock exchange. The major shareholder is the Merck family, with around 70% of the capital held through E. Merck KG and the remaining 30% being free-float. Merck is not related to the US-based company bearing the same name.
Moody's (07/13): The A3 rating highlights 1. the group's diversification; 2. its leadership position in the liquid crystals segment; 3. good cash flow generation; and 4. strong liquidity profile. The stable outlook underlines the continuation of strong cash flow generation and reduced cost base. This should mitigate the pressure on Rebif sales due to increasing competition from alternative treatments. The rating would be upgraded if CFO/debt (adj.) >50% (Moody's calculation: FY12: 46.8%, LTM 1H13: 40.8%) and cash/debt (adj.) >45% (Moody's calculation: FY12: 42.7%, LTM1H13: 53.3%) and downgraded if CFO/debt (adj.) <45% S&P (05/13): On 29 May, S&P raised its rating to A from A-, the outlook remains stable. The upgrade reflected the fact that credit metrics have continued to improve, especially maintaining adj. FFO/net debt (adj.) >55%. In its base-case scenario, S&P assumes at least stable revenues for the next few years. Sales for Merck Serono's drug Rebif (multiple sclerosis) should decline only slightly. Rebif will lose its patent protection in Europe in 2015 (2024 for its new formulation). It is a biological drug, thus generic competition is not a threat. S&P estimates adj. FFO/net debt of 55% over the next three years, including potential mid-sized acquisitions in 2014 (S&P's calculation: LTM1H13: FFO/net debt (adj.): 76%). S&P highlighted that an upgrade is limited due to the uncertainties regarding Rebif. The rating could be downgraded if FFO/net debt (adj.) <55%.
SALES BY REGION (3Q13)
Europe36%
North America20%
Emerging Markets
36%
Rest of the world8%
100%: EUR 2.7bn
EBITDA (PRE ONE-TIME ITEMS) BY SEGMENT
-300 -100 100 300 500 700 900 1,100 1,300 1,500 1,700 1,900
Merck Serono
Merck Millipore
Performance Materials
Customer Health Care
ConsolidationFY12 LTM9M13
in EUR mn
Strengths/Opportunities – Improved diversification of product portfolio and geographic diversity
following the acquisition of biotech company Millipore – Undisputed global market leader (ca. 60% market share) in the still-
profitable Liquid Crystals business, high market entry barriers – Solid profitability supports healthy free cash flow generation in the pharma
business, especially through the Millipore acquisition – Upside potential for Merck KGaA to find an agreement with Pfizer for an
early termination of its Rebif distribution agreement in the US (contract expires in 2015)
– Continuous net debt reduction to EUR 0.5bn in 9M13 (FY12: EUR 1.9bn). Healthy balance sheet with comfortable cash position and high equity ratio
– The strict implementation of the "Fit for 2018" restructuring program will yield around EUR 385mn in savings until 2018. In 9M13, EBITDA pre one-time items increased by 13% due to already achieved savings
– EBITDA pre one-time guidance for 2013 has been raised largely driven by divisional upgrades in performance materials and consumer health.
Weaknesses/Threats – Possible transformational deals and, as a consequence, a negative impact
on credit metrics; we anticipate net cash by end-2014 and EBITDA of EUR 3.3bn (in line with Bloomberg consensus)
– High competition and pricing pressure at Merck's liquid crystals business, which might hamper cash-flow generation in the future
– Weak track record in self-developed and marketed drugs – Execution risk of recently implemented restructuring program, with total
one-time costs of EUR 817mn between 2012 and 2017 – Merck's drug development pipeline has a disappointing track record – Limited exposure to the US and high product concentration of Serono
(biopharmaceutical division) – Uncertainties regarding Merck Serono's largest drug Rebif (will lose patent
protection in Europe in 2015 for the old formulation, in 2024 for the new formulation)
MAJOR BOND ISSUES
ISIN Ticker/Issue Issue Rating Amount (EUR) Comment XS0497185511 MRKGR 3.375% 24/03/15 A3/A/-- 1,350mn Negative pledge, cross default, CoC in case of downgrade below
investment grade, retail size XS0497186758 MRKGR 4.5% 24/03/20 A3/A/-- 1,350mn Negative pledge, cross default, CoC @101 in case of downgrade below
investment grade, retail size
Source: Rating agencies, company data, iBoxx, UniCredit Research
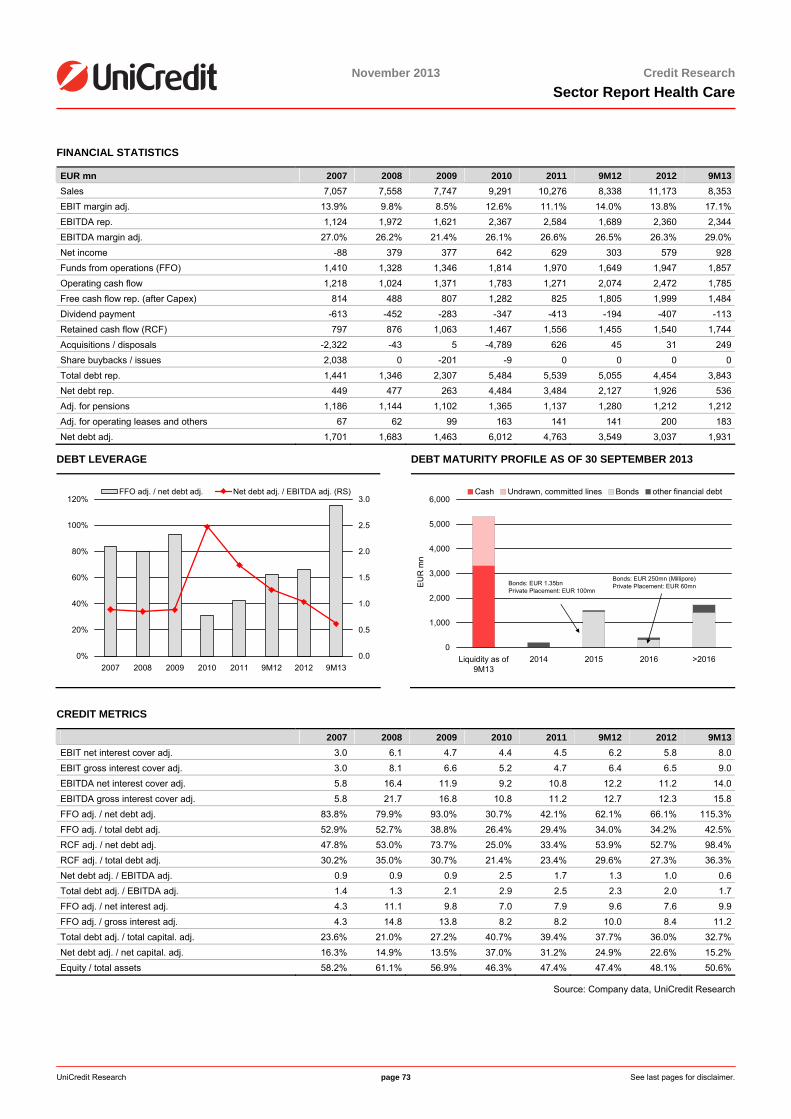
November 2013 Credit ResearchSector Report Health Care
UniCredit Research page 73 See last pages for disclaimer.
FINANCIAL STATISTICS
EUR mn 2007 2008 2009 2010 2011 9M12 2012 9M13Sales 7,057 7,558 7,747 9,291 10,276 8,338 11,173 8,353EBIT margin adj. 13.9% 9.8% 8.5% 12.6% 11.1% 14.0% 13.8% 17.1%EBITDA rep. 1,124 1,972 1,621 2,367 2,584 1,689 2,360 2,344EBITDA margin adj. 27.0% 26.2% 21.4% 26.1% 26.6% 26.5% 26.3% 29.0%Net income -88 379 377 642 629 303 579 928Funds from operations (FFO) 1,410 1,328 1,346 1,814 1,970 1,649 1,947 1,857Operating cash flow 1,218 1,024 1,371 1,783 1,271 2,074 2,472 1,785Free cash flow rep. (after Capex) 814 488 807 1,282 825 1,805 1,999 1,484Dividend payment -613 -452 -283 -347 -413 -194 -407 -113Retained cash flow (RCF) 797 876 1,063 1,467 1,556 1,455 1,540 1,744Acquisitions / disposals -2,322 -43 5 -4,789 626 45 31 249Share buybacks / issues 2,038 0 -201 -9 0 0 0 0Total debt rep. 1,441 1,346 2,307 5,484 5,539 5,055 4,454 3,843Net debt rep. 449 477 263 4,484 3,484 2,127 1,926 536Adj. for pensions 1,186 1,144 1,102 1,365 1,137 1,280 1,212 1,212Adj. for operating leases and others 67 62 99 163 141 141 200 183Net debt adj. 1,701 1,683 1,463 6,012 4,763 3,549 3,037 1,931
DEBT LEVERAGE
0%
20%
40%
60%
80%
100%
120%
2007 2008 2009 2010 2011 9M12 2012 9M130.0
0.5
1.0
1.5
2.0
2.5
3.0FFO adj. / net debt adj. Net debt adj. / EBITDA adj. (RS)
DEBT MATURITY PROFILE AS OF 30 SEPTEMBER 2013
0
1,000
2,000
3,000
4,000
5,000
6,000
Liquidity as of9M13
2014 2015 2016 >2016
EU
R m
n
Cash Undrawn, committed lines Bonds other financial debt
Bonds: EUR 1.35bnPrivate Placement: EUR 100mn
Bonds: EUR 250mn (Millipore)Private Placement: EUR 60mn
CREDIT METRICS
2007 2008 2009 2010 2011 9M12 2012 9M13EBIT net interest cover adj. 3.0 6.1 4.7 4.4 4.5 6.2 5.8 8.0EBIT gross interest cover adj. 3.0 8.1 6.6 5.2 4.7 6.4 6.5 9.0EBITDA net interest cover adj. 5.8 16.4 11.9 9.2 10.8 12.2 11.2 14.0EBITDA gross interest cover adj. 5.8 21.7 16.8 10.8 11.2 12.7 12.3 15.8FFO adj. / net debt adj. 83.8% 79.9% 93.0% 30.7% 42.1% 62.1% 66.1% 115.3%FFO adj. / total debt adj. 52.9% 52.7% 38.8% 26.4% 29.4% 34.0% 34.2% 42.5%RCF adj. / net debt adj. 47.8% 53.0% 73.7% 25.0% 33.4% 53.9% 52.7% 98.4%RCF adj. / total debt adj. 30.2% 35.0% 30.7% 21.4% 23.4% 29.6% 27.3% 36.3%Net debt adj. / EBITDA adj. 0.9 0.9 0.9 2.5 1.7 1.3 1.0 0.6Total debt adj. / EBITDA adj. 1.4 1.3 2.1 2.9 2.5 2.3 2.0 1.7FFO adj. / net interest adj. 4.3 11.1 9.8 7.0 7.9 9.6 7.6 9.9FFO adj. / gross interest adj. 4.3 14.8 13.8 8.2 8.2 10.0 8.4 11.2Total debt adj. / total capital. adj. 23.6% 21.0% 27.2% 40.7% 39.4% 37.7% 36.0% 32.7%Net debt adj. / net capital. adj. 16.3% 14.9% 13.5% 37.0% 31.2% 24.9% 22.6% 15.2%Equity / total assets 58.2% 61.1% 56.9% 46.3% 47.4% 47.4% 48.1% 50.6%
Source: Company data, UniCredit Research
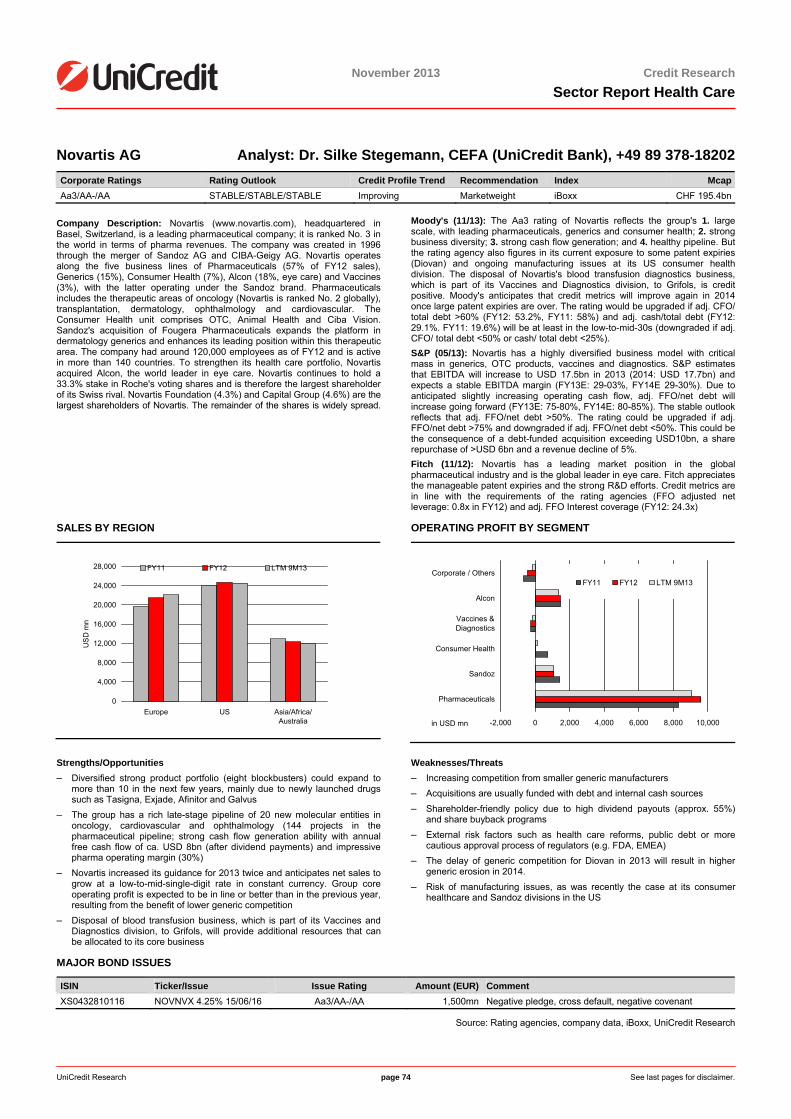
<date>
November 2013 Credit ResearchSector Report Health Care
UniCredit Research page 74 See last pages for disclaimer.
Novartis AG Analyst: Dr. Silke Stegemann, CEFA (UniCredit Bank), +49 89 378-18202 Corporate Ratings Rating Outlook Credit Profile Trend Recommendation Index McapAa3/AA-/AA STABLE/STABLE/STABLE Improving Marketweight iBoxx CHF 195.4bn
Company Description: Novartis (www.novartis.com), headquartered in Basel, Switzerland, is a leading pharmaceutical company; it is ranked No. 3 in the world in terms of pharma revenues. The company was created in 1996 through the merger of Sandoz AG and CIBA-Geigy AG. Novartis operates along the five business lines of Pharmaceuticals (57% of FY12 sales), Generics (15%), Consumer Health (7%), Alcon (18%, eye care) and Vaccines (3%), with the latter operating under the Sandoz brand. Pharmaceuticals includes the therapeutic areas of oncology (Novartis is ranked No. 2 globally), transplantation, dermatology, ophthalmology and cardiovascular. The Consumer Health unit comprises OTC, Animal Health and Ciba Vision. Sandoz's acquisition of Fougera Pharmaceuticals expands the platform in dermatology generics and enhances its leading position within this therapeutic area. The company had around 120,000 employees as of FY12 and is active in more than 140 countries. To strengthen its health care portfolio, Novartis acquired Alcon, the world leader in eye care. Novartis continues to hold a 33.3% stake in Roche's voting shares and is therefore the largest shareholder of its Swiss rival. Novartis Foundation (4.3%) and Capital Group (4.6%) are the largest shareholders of Novartis. The remainder of the shares is widely spread.
Moody's (11/13): The Aa3 rating of Novartis reflects the group's 1. large scale, with leading pharmaceuticals, generics and consumer health; 2. strong business diversity; 3. strong cash flow generation; and 4. healthy pipeline. But the rating agency also figures in its current exposure to some patent expiries (Diovan) and ongoing manufacturing issues at its US consumer health division. The disposal of Novartis's blood transfusion diagnostics business, which is part of its Vaccines and Diagnostics division, to Grifols, is credit positive. Moody's anticipates that credit metrics will improve again in 2014 once large patent expiries are over. The rating would be upgraded if adj. CFO/ total debt >60% (FY12: 53.2%, FY11: 58%) and adj. cash/total debt (FY12: 29.1%. FY11: 19.6%) will be at least in the low-to-mid-30s (downgraded if adj. CFO/ total debt <50% or cash/ total debt <25%). S&P (05/13): Novartis has a highly diversified business model with critical mass in generics, OTC products, vaccines and diagnostics. S&P estimates that EBITDA will increase to USD 17.5bn in 2013 (2014: USD 17.7bn) and expects a stable EBITDA margin (FY13E: 29-03%, FY14E 29-30%). Due to anticipated slightly increasing operating cash flow, adj. FFO/net debt will increase going forward (FY13E: 75-80%, FY14E: 80-85%). The stable outlook reflects that adj. FFO/net debt >50%. The rating could be upgraded if adj. FFO/net debt >75% and downgraded if adj. FFO/net debt <50%. This could be the consequence of a debt-funded acquisition exceeding USD10bn, a share repurchase of >USD 6bn and a revenue decline of 5%. Fitch (11/12): Novartis has a leading market position in the global pharmaceutical industry and is the global leader in eye care. Fitch appreciates the manageable patent expiries and the strong R&D efforts. Credit metrics are in line with the requirements of the rating agencies (FFO adjusted net leverage: 0.8x in FY12) and adj. FFO Interest coverage (FY12: 24.3x)
SALES BY REGION
0
4,000
8,000
12,000
16,000
20,000
24,000
28,000
Europe US Asia/Africa/Australia
US
D m
n
FY11 FY12 LTM 9M13
OPERATING PROFIT BY SEGMENT
-2,000 0 2,000 4,000 6,000 8,000 10,000
Pharmaceuticals
Sandoz
Consumer Health
Vaccines &Diagnostics
Alcon
Corporate / OthersFY11 FY12 LTM 9M13
in USD mn
Strengths/Opportunities – Diversified strong product portfolio (eight blockbusters) could expand to
more than 10 in the next few years, mainly due to newly launched drugs such as Tasigna, Exjade, Afinitor and Galvus
– The group has a rich late-stage pipeline of 20 new molecular entities in oncology, cardiovascular and ophthalmology (144 projects in the pharmaceutical pipeline; strong cash flow generation ability with annual free cash flow of ca. USD 8bn (after dividend payments) and impressive pharma operating margin (30%)
– Novartis increased its guidance for 2013 twice and anticipates net sales to grow at a low-to-mid-single-digit rate in constant currency. Group core operating profit is expected to be in line or better than in the previous year, resulting from the benefit of lower generic competition
– Disposal of blood transfusion business, which is part of its Vaccines and Diagnostics division, to Grifols, will provide additional resources that can be allocated to its core business
Weaknesses/Threats – Increasing competition from smaller generic manufacturers – Acquisitions are usually funded with debt and internal cash sources – Shareholder-friendly policy due to high dividend payouts (approx. 55%)
and share buyback programs – External risk factors such as health care reforms, public debt or more
cautious approval process of regulators (e.g. FDA, EMEA) – The delay of generic competition for Diovan in 2013 will result in higher
generic erosion in 2014. – Risk of manufacturing issues, as was recently the case at its consumer
healthcare and Sandoz divisions in the US
MAJOR BOND ISSUES
ISIN Ticker/Issue Issue Rating Amount (EUR) Comment XS0432810116 NOVNVX 4.25% 15/06/16 Aa3/AA-/AA 1,500mn Negative pledge, cross default, negative covenant
Source: Rating agencies, company data, iBoxx, UniCredit Research
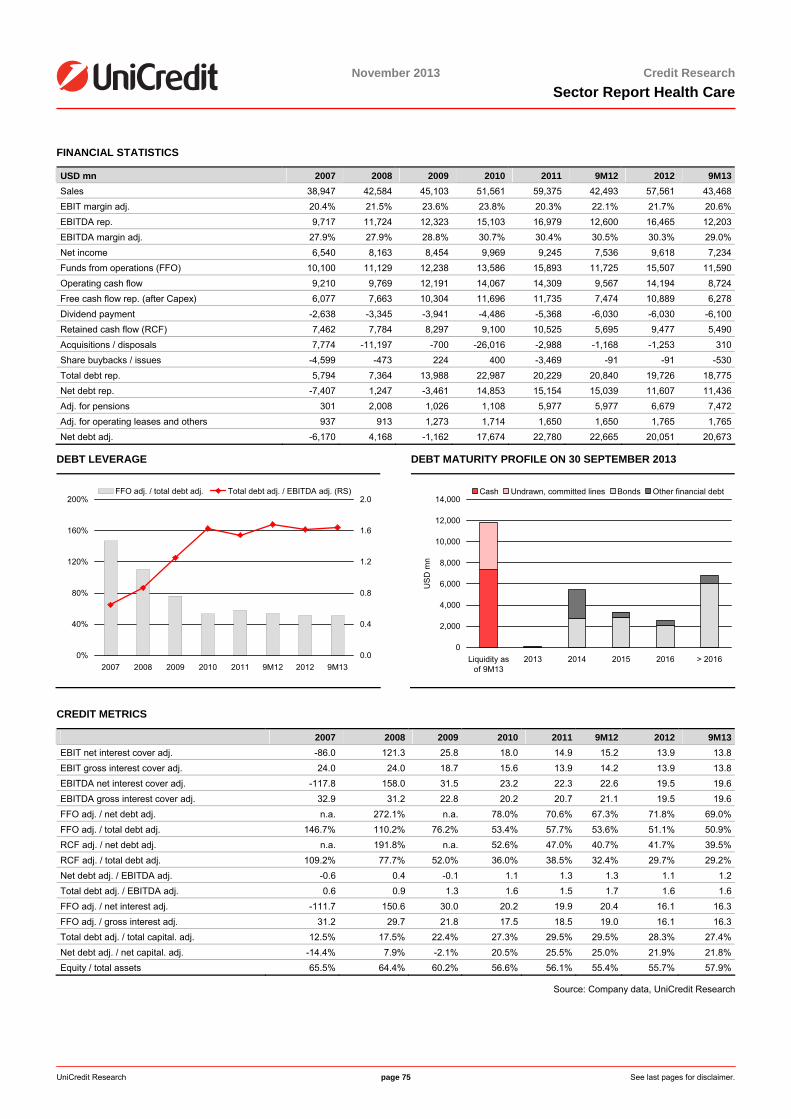
<date>
UniCredit Research page 75 See last pages for disclaimer.
November 2013 Credit ResearchSector Report Health Care
FINANCIAL STATISTICS
USD mn 2007 2008 2009 2010 2011 9M12 2012 9M13Sales 38,947 42,584 45,103 51,561 59,375 42,493 57,561 43,468EBIT margin adj. 20.4% 21.5% 23.6% 23.8% 20.3% 22.1% 21.7% 20.6%EBITDA rep. 9,717 11,724 12,323 15,103 16,979 12,600 16,465 12,203EBITDA margin adj. 27.9% 27.9% 28.8% 30.7% 30.4% 30.5% 30.3% 29.0%Net income 6,540 8,163 8,454 9,969 9,245 7,536 9,618 7,234Funds from operations (FFO) 10,100 11,129 12,238 13,586 15,893 11,725 15,507 11,590Operating cash flow 9,210 9,769 12,191 14,067 14,309 9,567 14,194 8,724Free cash flow rep. (after Capex) 6,077 7,663 10,304 11,696 11,735 7,474 10,889 6,278Dividend payment -2,638 -3,345 -3,941 -4,486 -5,368 -6,030 -6,030 -6,100Retained cash flow (RCF) 7,462 7,784 8,297 9,100 10,525 5,695 9,477 5,490Acquisitions / disposals 7,774 -11,197 -700 -26,016 -2,988 -1,168 -1,253 310Share buybacks / issues -4,599 -473 224 400 -3,469 -91 -91 -530Total debt rep. 5,794 7,364 13,988 22,987 20,229 20,840 19,726 18,775Net debt rep. -7,407 1,247 -3,461 14,853 15,154 15,039 11,607 11,436Adj. for pensions 301 2,008 1,026 1,108 5,977 5,977 6,679 7,472Adj. for operating leases and others 937 913 1,273 1,714 1,650 1,650 1,765 1,765Net debt adj. -6,170 4,168 -1,162 17,674 22,780 22,665 20,051 20,673
DEBT LEVERAGE
0%
40%
80%
120%
160%
200%
2007 2008 2009 2010 2011 9M12 2012 9M130.0
0.4
0.8
1.2
1.6
2.0FFO adj. / total debt adj. Total debt adj. / EBITDA adj. (RS)
DEBT MATURITY PROFILE ON 30 SEPTEMBER 2013
0
2,000
4,000
6,000
8,000
10,000
12,000
14,000
Liquidity asof 9M13
2013 2014 2015 2016 > 2016
USD
mn
Cash Undrawn, committed lines Bonds Other financial debt
CREDIT METRICS
2007 2008 2009 2010 2011 9M12 2012 9M13EBIT net interest cover adj. -86.0 121.3 25.8 18.0 14.9 15.2 13.9 13.8EBIT gross interest cover adj. 24.0 24.0 18.7 15.6 13.9 14.2 13.9 13.8EBITDA net interest cover adj. -117.8 158.0 31.5 23.2 22.3 22.6 19.5 19.6EBITDA gross interest cover adj. 32.9 31.2 22.8 20.2 20.7 21.1 19.5 19.6FFO adj. / net debt adj. n.a. 272.1% n.a. 78.0% 70.6% 67.3% 71.8% 69.0%FFO adj. / total debt adj. 146.7% 110.2% 76.2% 53.4% 57.7% 53.6% 51.1% 50.9%RCF adj. / net debt adj. n.a. 191.8% n.a. 52.6% 47.0% 40.7% 41.7% 39.5%RCF adj. / total debt adj. 109.2% 77.7% 52.0% 36.0% 38.5% 32.4% 29.7% 29.2%Net debt adj. / EBITDA adj. -0.6 0.4 -0.1 1.1 1.3 1.3 1.1 1.2Total debt adj. / EBITDA adj. 0.6 0.9 1.3 1.6 1.5 1.7 1.6 1.6FFO adj. / net interest adj. -111.7 150.6 30.0 20.2 19.9 20.4 16.1 16.3FFO adj. / gross interest adj. 31.2 29.7 21.8 17.5 18.5 19.0 16.1 16.3Total debt adj. / total capital. adj. 12.5% 17.5% 22.4% 27.3% 29.5% 29.5% 28.3% 27.4%Net debt adj. / net capital. adj. -14.4% 7.9% -2.1% 20.5% 25.5% 25.0% 21.9% 21.8%Equity / total assets 65.5% 64.4% 60.2% 56.6% 56.1% 55.4% 55.7% 57.9%
Source: Company data, UniCredit Research
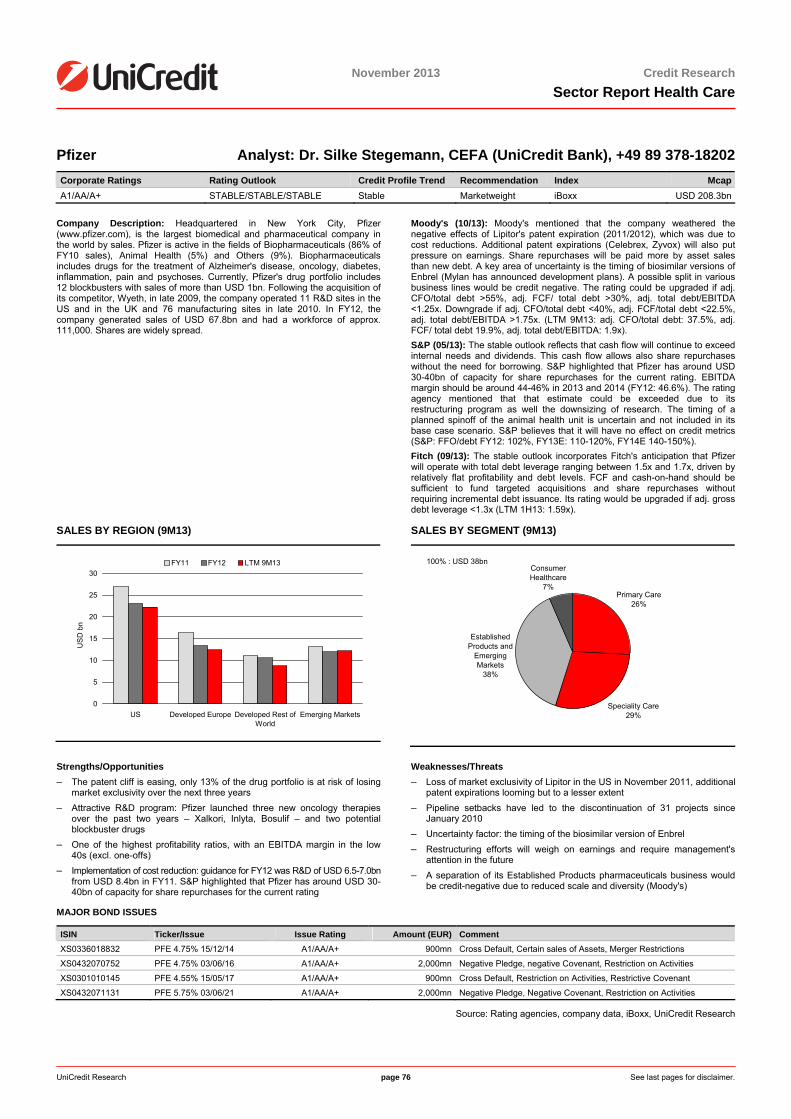
<date>
November 2013 Credit ResearchSector Report Health Care
UniCredit Research page 76 See last pages for disclaimer.
Pfizer Analyst: Dr. Silke Stegemann, CEFA (UniCredit Bank), +49 89 378-18202 Corporate Ratings Rating Outlook Credit Profile Trend Recommendation Index McapA1/AA/A+ STABLE/STABLE/STABLE Stable Marketweight iBoxx USD 208.3bn
Company Description: Headquartered in New York City, Pfizer (www.pfizer.com), is the largest biomedical and pharmaceutical company in the world by sales. Pfizer is active in the fields of Biopharmaceuticals (86% of FY10 sales), Animal Health (5%) and Others (9%). Biopharmaceuticals includes drugs for the treatment of Alzheimer's disease, oncology, diabetes, inflammation, pain and psychoses. Currently, Pfizer's drug portfolio includes 12 blockbusters with sales of more than USD 1bn. Following the acquisition of its competitor, Wyeth, in late 2009, the company operated 11 R&D sites in the US and in the UK and 76 manufacturing sites in late 2010. In FY12, the company generated sales of USD 67.8bn and had a workforce of approx. 111,000. Shares are widely spread.
Moody's (10/13): Moody's mentioned that the company weathered the negative effects of Lipitor's patent expiration (2011/2012), which was due to cost reductions. Additional patent expirations (Celebrex, Zyvox) will also put pressure on earnings. Share repurchases will be paid more by asset sales than new debt. A key area of uncertainty is the timing of biosimilar versions of Enbrel (Mylan has announced development plans). A possible split in various business lines would be credit negative. The rating could be upgraded if adj. CFO/total debt >55%, adj. FCF/ total debt >30%, adj. total debt/EBITDA <1.25x. Downgrade if adj. CFO/total debt <40%, adj. FCF/total debt <22.5%, adj. total debt/EBITDA >1.75x. (LTM 9M13: adj. CFO/total debt: 37.5%, adj. FCF/ total debt 19.9%, adj. total debt/EBITDA: 1.9x). S&P (05/13): The stable outlook reflects that cash flow will continue to exceed internal needs and dividends. This cash flow allows also share repurchases without the need for borrowing. S&P highlighted that Pfizer has around USD 30-40bn of capacity for share repurchases for the current rating. EBITDA margin should be around 44-46% in 2013 and 2014 (FY12: 46.6%). The rating agency mentioned that that estimate could be exceeded due to its restructuring program as well the downsizing of research. The timing of a planned spinoff of the animal health unit is uncertain and not included in its base case scenario. S&P believes that it will have no effect on credit metrics (S&P: FFO/debt FY12: 102%, FY13E: 110-120%, FY14E 140-150%). Fitch (09/13): The stable outlook incorporates Fitch's anticipation that Pfizer will operate with total debt leverage ranging between 1.5x and 1.7x, driven by relatively flat profitability and debt levels. FCF and cash-on-hand should be sufficient to fund targeted acquisitions and share repurchases without requiring incremental debt issuance. Its rating would be upgraded if adj. gross debt leverage <1.3x (LTM 1H13: 1.59x).
SALES BY REGION (9M13)
0
5
10
15
20
25
30
US Developed Europe Developed Rest ofWorld
Emerging Markets
US
D b
n
FY11 FY12 LTM 9M13
SALES BY SEGMENT (9M13)
Primary Care26%
Speciality Care29%
Established Products and
Emerging Markets
38%
Consumer Healthcare
7%
100% : USD 38bn
Strengths/Opportunities – The patent cliff is easing, only 13% of the drug portfolio is at risk of losing
market exclusivity over the next three years – Attractive R&D program: Pfizer launched three new oncology therapies
over the past two years – Xalkori, Inlyta, Bosulif – and two potential blockbuster drugs
– One of the highest profitability ratios, with an EBITDA margin in the low 40s (excl. one-offs)
– Implementation of cost reduction: guidance for FY12 was R&D of USD 6.5-7.0bn from USD 8.4bn in FY11. S&P highlighted that Pfizer has around USD 30-40bn of capacity for share repurchases for the current rating
Weaknesses/Threats – Loss of market exclusivity of Lipitor in the US in November 2011, additional
patent expirations looming but to a lesser extent – Pipeline setbacks have led to the discontinuation of 31 projects since
January 2010 – Uncertainty factor: the timing of the biosimilar version of Enbrel – Restructuring efforts will weigh on earnings and require management's
attention in the future – A separation of its Established Products pharmaceuticals business would
be credit-negative due to reduced scale and diversity (Moody's)
MAJOR BOND ISSUES
ISIN Ticker/Issue Issue Rating Amount (EUR) Comment XS0336018832 PFE 4.75% 15/12/14 A1/AA/A+ 900mn Cross Default, Certain sales of Assets, Merger Restrictions
XS0432070752 PFE 4.75% 03/06/16 A1/AA/A+ 2,000mn Negative Pledge, negative Covenant, Restriction on Activities
XS0301010145 PFE 4.55% 15/05/17 A1/AA/A+ 900mn Cross Default, Restriction on Activities, Restrictive Covenant
XS0432071131 PFE 5.75% 03/06/21 A1/AA/A+ 2,000mn Negative Pledge, Negative Covenant, Restriction on Activities
Source: Rating agencies, company data, iBoxx, UniCredit Research
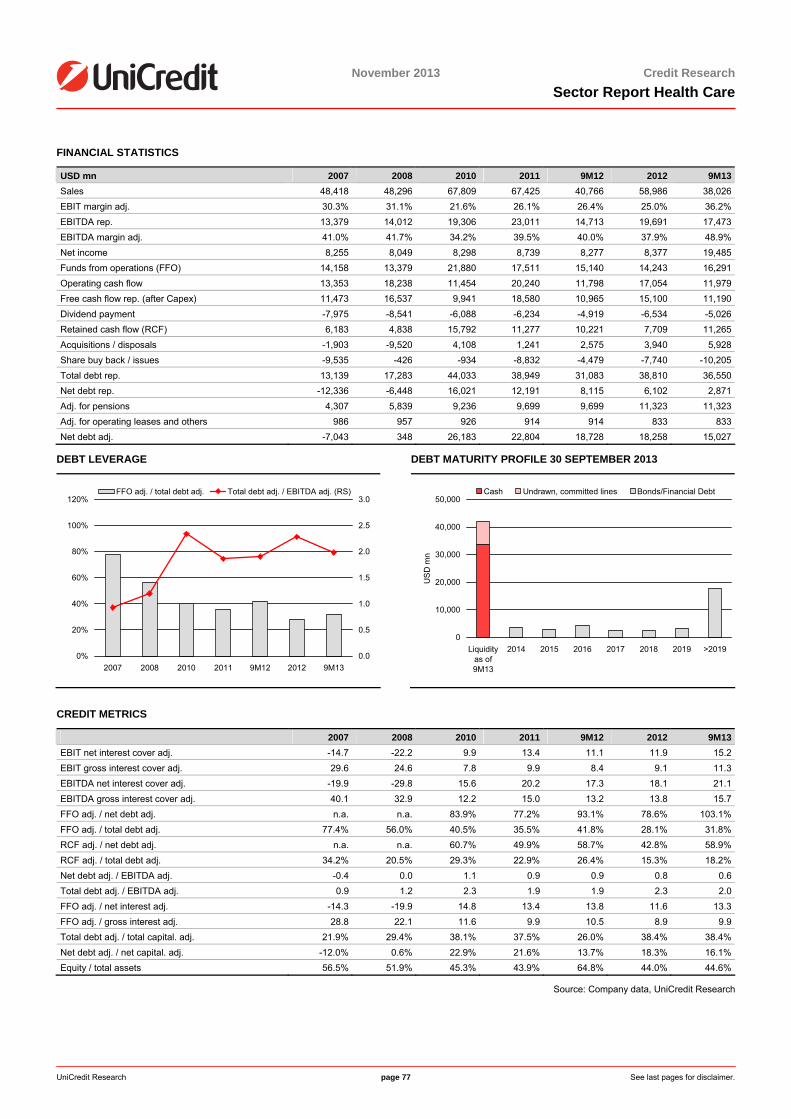
<date>
UniCredit Research page 77 See last pages for disclaimer.
November 2013 Credit ResearchSector Report Health Care
FINANCIAL STATISTICS
USD mn 2007 2008 2010 2011 9M12 2012 9M13Sales 48,418 48,296 67,809 67,425 40,766 58,986 38,026EBIT margin adj. 30.3% 31.1% 21.6% 26.1% 26.4% 25.0% 36.2%EBITDA rep. 13,379 14,012 19,306 23,011 14,713 19,691 17,473EBITDA margin adj. 41.0% 41.7% 34.2% 39.5% 40.0% 37.9% 48.9%Net income 8,255 8,049 8,298 8,739 8,277 8,377 19,485Funds from operations (FFO) 14,158 13,379 21,880 17,511 15,140 14,243 16,291Operating cash flow 13,353 18,238 11,454 20,240 11,798 17,054 11,979Free cash flow rep. (after Capex) 11,473 16,537 9,941 18,580 10,965 15,100 11,190Dividend payment -7,975 -8,541 -6,088 -6,234 -4,919 -6,534 -5,026Retained cash flow (RCF) 6,183 4,838 15,792 11,277 10,221 7,709 11,265Acquisitions / disposals -1,903 -9,520 4,108 1,241 2,575 3,940 5,928Share buy back / issues -9,535 -426 -934 -8,832 -4,479 -7,740 -10,205Total debt rep. 13,139 17,283 44,033 38,949 31,083 38,810 36,550Net debt rep. -12,336 -6,448 16,021 12,191 8,115 6,102 2,871Adj. for pensions 4,307 5,839 9,236 9,699 9,699 11,323 11,323Adj. for operating leases and others 986 957 926 914 914 833 833Net debt adj. -7,043 348 26,183 22,804 18,728 18,258 15,027
DEBT LEVERAGE
0%
20%
40%
60%
80%
100%
120%
2007 2008 2010 2011 9M12 2012 9M130.0
0.5
1.0
1.5
2.0
2.5
3.0FFO adj. / total debt adj. Total debt adj. / EBITDA adj. (RS)
DEBT MATURITY PROFILE 30 SEPTEMBER 2013
0
10,000
20,000
30,000
40,000
50,000
Liquidityas of9M13
2014 2015 2016 2017 2018 2019 >2019
US
D m
n
Cash Undrawn, committed lines Bonds/Financial Debt
CREDIT METRICS
2007 2008 2010 2011 9M12 2012 9M13EBIT net interest cover adj. -14.7 -22.2 9.9 13.4 11.1 11.9 15.2EBIT gross interest cover adj. 29.6 24.6 7.8 9.9 8.4 9.1 11.3EBITDA net interest cover adj. -19.9 -29.8 15.6 20.2 17.3 18.1 21.1EBITDA gross interest cover adj. 40.1 32.9 12.2 15.0 13.2 13.8 15.7FFO adj. / net debt adj. n.a. n.a. 83.9% 77.2% 93.1% 78.6% 103.1%FFO adj. / total debt adj. 77.4% 56.0% 40.5% 35.5% 41.8% 28.1% 31.8%RCF adj. / net debt adj. n.a. n.a. 60.7% 49.9% 58.7% 42.8% 58.9%RCF adj. / total debt adj. 34.2% 20.5% 29.3% 22.9% 26.4% 15.3% 18.2%Net debt adj. / EBITDA adj. -0.4 0.0 1.1 0.9 0.9 0.8 0.6Total debt adj. / EBITDA adj. 0.9 1.2 2.3 1.9 1.9 2.3 2.0FFO adj. / net interest adj. -14.3 -19.9 14.8 13.4 13.8 11.6 13.3FFO adj. / gross interest adj. 28.8 22.1 11.6 9.9 10.5 8.9 9.9Total debt adj. / total capital. adj. 21.9% 29.4% 38.1% 37.5% 26.0% 38.4% 38.4%Net debt adj. / net capital. adj. -12.0% 0.6% 22.9% 21.6% 13.7% 18.3% 16.1%Equity / total assets 56.5% 51.9% 45.3% 43.9% 64.8% 44.0% 44.6%
Source: Company data, UniCredit Research
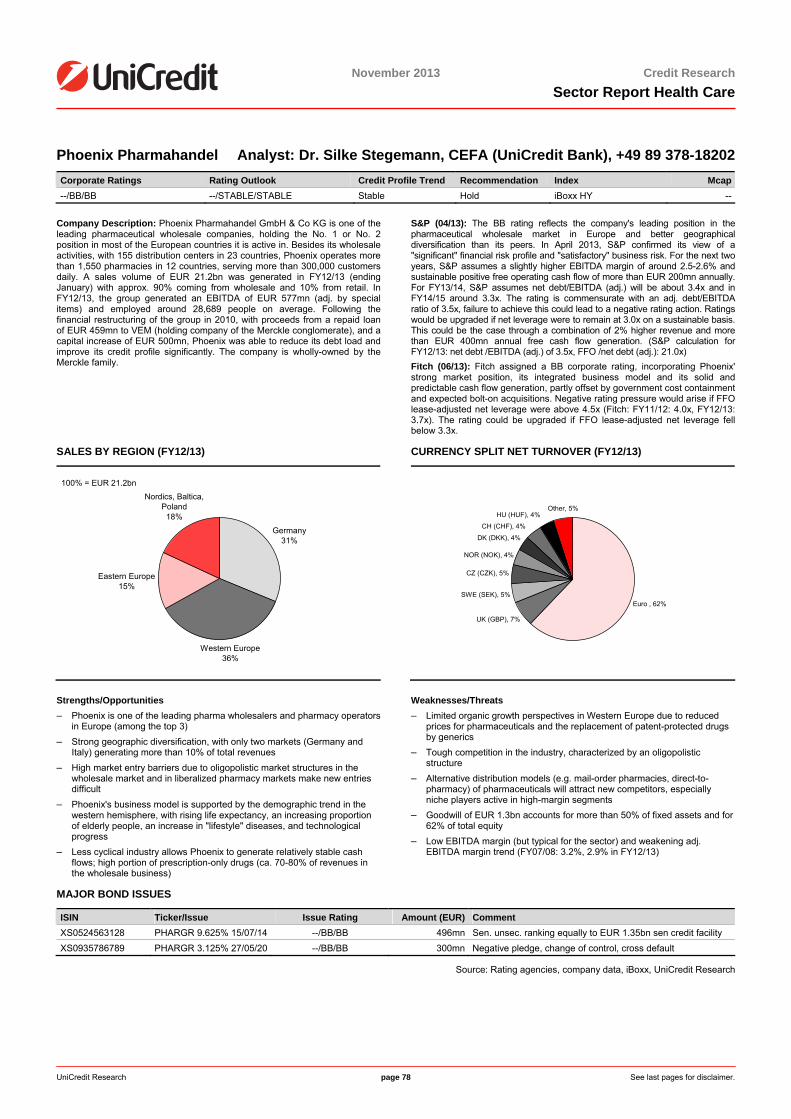
UniCredit Research page 78 See last pages for disclaimer.
November 2013 Credit ResearchSector Report Health Care
Phoenix Pharmahandel Analyst: Dr. Silke Stegemann, CEFA (UniCredit Bank), +49 89 378-18202 Corporate Ratings Rating Outlook Credit Profile Trend Recommendation Index Mcap--/BB/BB --/STABLE/STABLE Stable Hold iBoxx HY --
Company Description: Phoenix Pharmahandel GmbH & Co KG is one of the leading pharmaceutical wholesale companies, holding the No. 1 or No. 2 position in most of the European countries it is active in. Besides its wholesale activities, with 155 distribution centers in 23 countries, Phoenix operates more than 1,550 pharmacies in 12 countries, serving more than 300,000 customers daily. A sales volume of EUR 21.2bn was generated in FY12/13 (ending January) with approx. 90% coming from wholesale and 10% from retail. In FY12/13, the group generated an EBITDA of EUR 577mn (adj. by special items) and employed around 28,689 people on average. Following the financial restructuring of the group in 2010, with proceeds from a repaid loan of EUR 459mn to VEM (holding company of the Merckle conglomerate), and a capital increase of EUR 500mn, Phoenix was able to reduce its debt load and improve its credit profile significantly. The company is wholly-owned by the Merckle family.
S&P (04/13): The BB rating reflects the company's leading position in the pharmaceutical wholesale market in Europe and better geographical diversification than its peers. In April 2013, S&P confirmed its view of a "significant" financial risk profile and "satisfactory" business risk. For the next two years, S&P assumes a slightly higher EBITDA margin of around 2.5-2.6% and sustainable positive free operating cash flow of more than EUR 200mn annually. For FY13/14, S&P assumes net debt/EBITDA (adj.) will be about 3.4x and in FY14/15 around 3.3x. The rating is commensurate with an adj. debt/EBITDA ratio of 3.5x, failure to achieve this could lead to a negative rating action. Ratings would be upgraded if net leverage were to remain at 3.0x on a sustainable basis. This could be the case through a combination of 2% higher revenue and more than EUR 400mn annual free cash flow generation. (S&P calculation for FY12/13: net debt /EBITDA (adj.) of 3.5x, FFO /net debt (adj.): 21.0x) Fitch (06/13): Fitch assigned a BB corporate rating, incorporating Phoenix' strong market position, its integrated business model and its solid and predictable cash flow generation, partly offset by government cost containment and expected bolt-on acquisitions. Negative rating pressure would arise if FFO lease-adjusted net leverage were above 4.5x (Fitch: FY11/12: 4.0x, FY12/13: 3.7x). The rating could be upgraded if FFO lease-adjusted net leverage fell below 3.3x.
SALES BY REGION (FY12/13)
Germany31%
Western Europe36%
Eastern Europe15%
Nordics, Baltica, Poland
18%
100% = EUR 21.2bn
CURRENCY SPLIT NET TURNOVER (FY12/13)
Euro , 62%
UK (GBP), 7%
SWE (SEK), 5%
CZ (CZK), 5%
DK (DKK), 4%
CH (CHF), 4%
HU (HUF), 4%Other, 5%
NOR (NOK), 4%
Strengths/Opportunities – Phoenix is one of the leading pharma wholesalers and pharmacy operators
in Europe (among the top 3) – Strong geographic diversification, with only two markets (Germany and
Italy) generating more than 10% of total revenues – High market entry barriers due to oligopolistic market structures in the
wholesale market and in liberalized pharmacy markets make new entries difficult
– Phoenix's business model is supported by the demographic trend in the western hemisphere, with rising life expectancy, an increasing proportion of elderly people, an increase in "lifestyle" diseases, and technological progress
– Less cyclical industry allows Phoenix to generate relatively stable cash flows; high portion of prescription-only drugs (ca. 70-80% of revenues in the wholesale business)
Weaknesses/Threats – Limited organic growth perspectives in Western Europe due to reduced
prices for pharmaceuticals and the replacement of patent-protected drugs by generics
– Tough competition in the industry, characterized by an oligopolistic structure
– Alternative distribution models (e.g. mail-order pharmacies, direct-to-pharmacy) of pharmaceuticals will attract new competitors, especially niche players active in high-margin segments
– Goodwill of EUR 1.3bn accounts for more than 50% of fixed assets and for 62% of total equity
– Low EBITDA margin (but typical for the sector) and weakening adj. EBITDA margin trend (FY07/08: 3.2%, 2.9% in FY12/13)
MAJOR BOND ISSUES
ISIN Ticker/Issue Issue Rating Amount (EUR) Comment XS0524563128 PHARGR 9.625% 15/07/14 --/BB/BB 496mn Sen. unsec. ranking equally to EUR 1.35bn sen credit facility XS0935786789 PHARGR 3.125% 27/05/20 --/BB/BB 300mn Negative pledge, change of control, cross default
Source: Rating agencies, company data, iBoxx, UniCredit Research
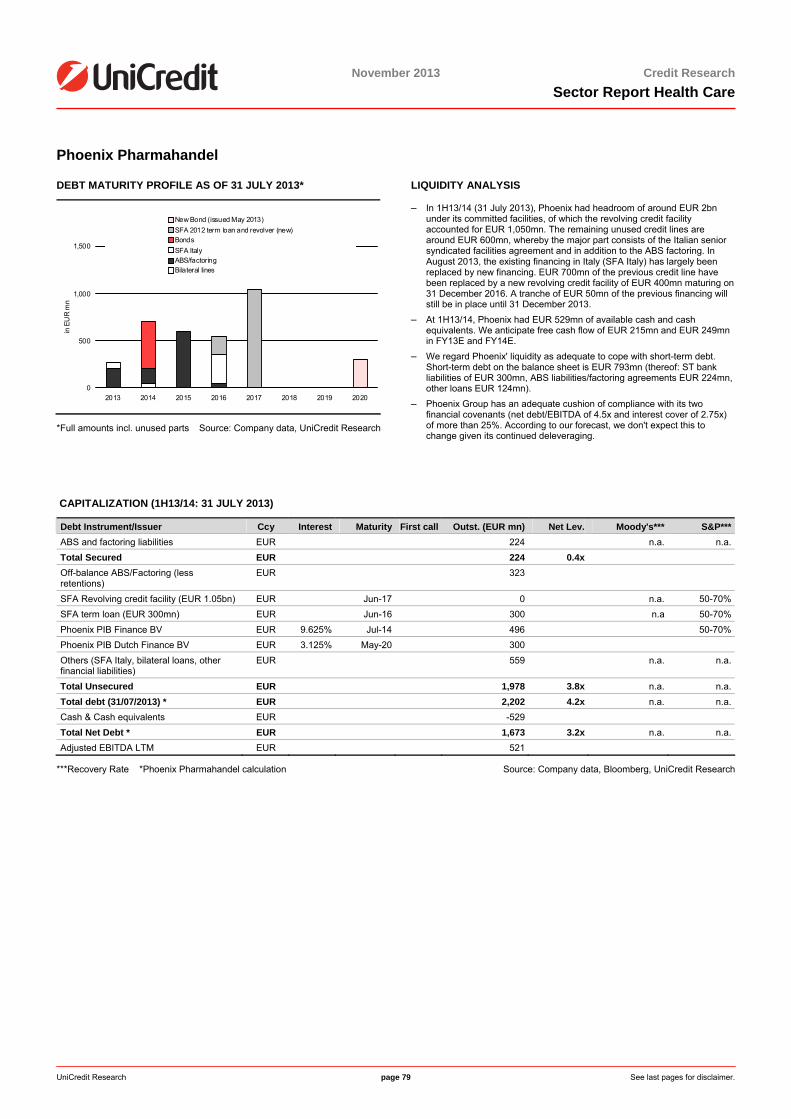
UniCredit Research page 79 See last pages for disclaimer.
November 2013 Credit ResearchSector Report Health Care
Phoenix Pharmahandel
DEBT MATURITY PROFILE AS OF 31 JULY 2013*
0
500
1,000
1,500
2013 2014 2015 2016 2017 2018 2019 2020
in E
UR
mn
New Bond (issued May 2013)SFA 2012 term loan and revolver (new)BondsSFA ItalyABS/factoringBilateral lines
*Full amounts incl. unused parts Source: Company data, UniCredit Research
LIQUIDITY ANALYSIS
– In 1H13/14 (31 July 2013), Phoenix had headroom of around EUR 2bn under its committed facilities, of which the revolving credit facility accounted for EUR 1,050mn. The remaining unused credit lines are around EUR 600mn, whereby the major part consists of the Italian senior syndicated facilities agreement and in addition to the ABS factoring. In August 2013, the existing financing in Italy (SFA Italy) has largely been replaced by new financing. EUR 700mn of the previous credit line have been replaced by a new revolving credit facility of EUR 400mn maturing on 31 December 2016. A tranche of EUR 50mn of the previous financing will still be in place until 31 December 2013.
– At 1H13/14, Phoenix had EUR 529mn of available cash and cash equivalents. We anticipate free cash flow of EUR 215mn and EUR 249mn in FY13E and FY14E.
– We regard Phoenix' liquidity as adequate to cope with short-term debt. Short-term debt on the balance sheet is EUR 793mn (thereof: ST bank liabilities of EUR 300mn, ABS liabilities/factoring agreements EUR 224mn, other loans EUR 124mn).
– Phoenix Group has an adequate cushion of compliance with its two financial covenants (net debt/EBITDA of 4.5x and interest cover of 2.75x) of more than 25%. According to our forecast, we don't expect this to change given its continued deleveraging.
CAPITALIZATION (1H13/14: 31 JULY 2013)
Debt Instrument/Issuer Ccy Interest Maturity First call Outst. (EUR mn) Net Lev. Moody's*** S&P***ABS and factoring liabilities EUR 224 n.a. n.a.Total Secured EUR 224 0.4x Off-balance ABS/Factoring (less retentions)
EUR 323
SFA Revolving credit facility (EUR 1.05bn) EUR Jun-17 0 n.a. 50-70%SFA term loan (EUR 300mn) EUR Jun-16 300 n.a 50-70%Phoenix PIB Finance BV EUR 9.625% Jul-14 496 50-70%Phoenix PIB Dutch Finance BV EUR 3.125% May-20 300 Others (SFA Italy, bilateral loans, other financial liabilities)
EUR 559 n.a. n.a.
Total Unsecured EUR 1,978 3.8x n.a. n.a.Total debt (31/07/2013) * EUR 2,202 4.2x n.a. n.a.Cash & Cash equivalents EUR -529 Total Net Debt * EUR 1,673 3.2x n.a. n.a.Adjusted EBITDA LTM EUR 521
***Recovery Rate *Phoenix Pharmahandel calculation Source: Company data, Bloomberg, UniCredit Research
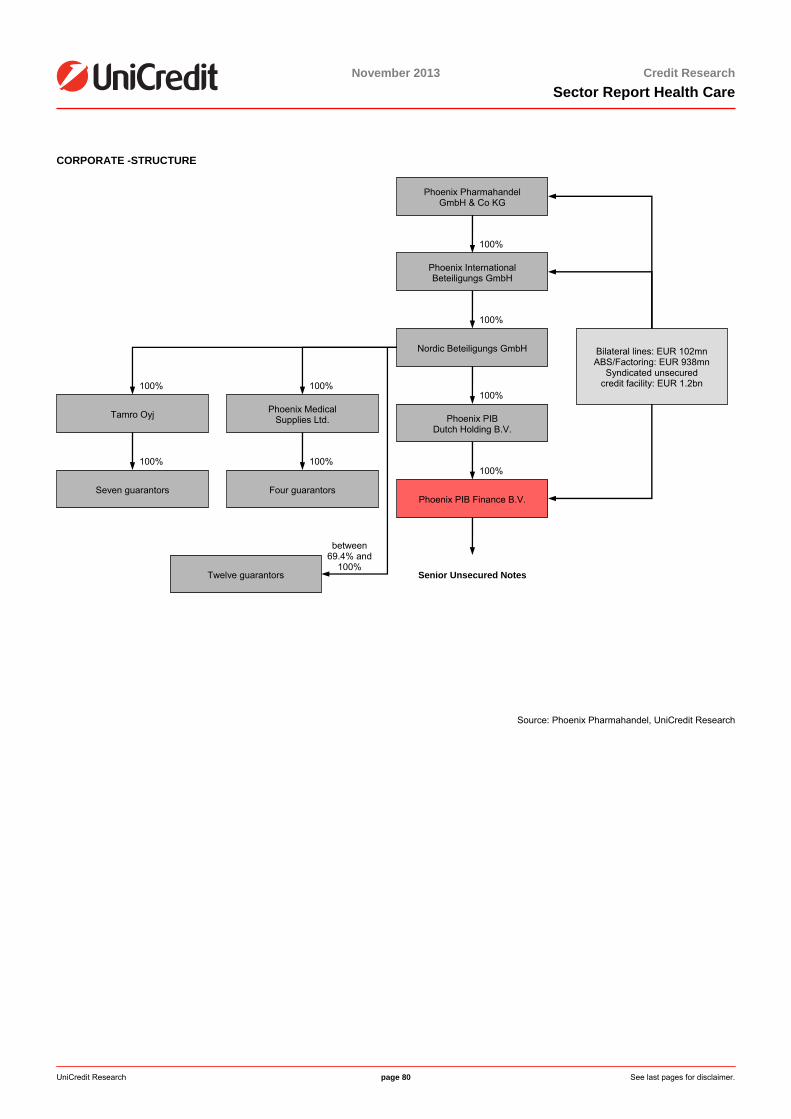
UniCredit Research page 80 See last pages for disclaimer.
November 2013 Credit ResearchSector Report Health Care
CORPORATE -STRUCTURE
Source: Phoenix Pharmahandel, UniCredit Research
between 69.4% and
100%
Phoenix PIB Finance B.V.
Phoenix Pharmahandel GmbH & Co KG
Phoenix International Beteiligungs GmbH
Nordic Beteiligungs GmbH
Phoenix PIB Dutch Holding B.V.
Tamro Oyj Phoenix Medical Supplies Ltd.
Four guarantors Seven guarantors
Bilateral lines: EUR 102mn ABS/Factoring: EUR 938mn
Syndicated unsecured credit facility: EUR 1.2bn
Twelve guarantors
100%
100%
100%
100%
100% 100%
100% 100%
Senior Unsecured Notes
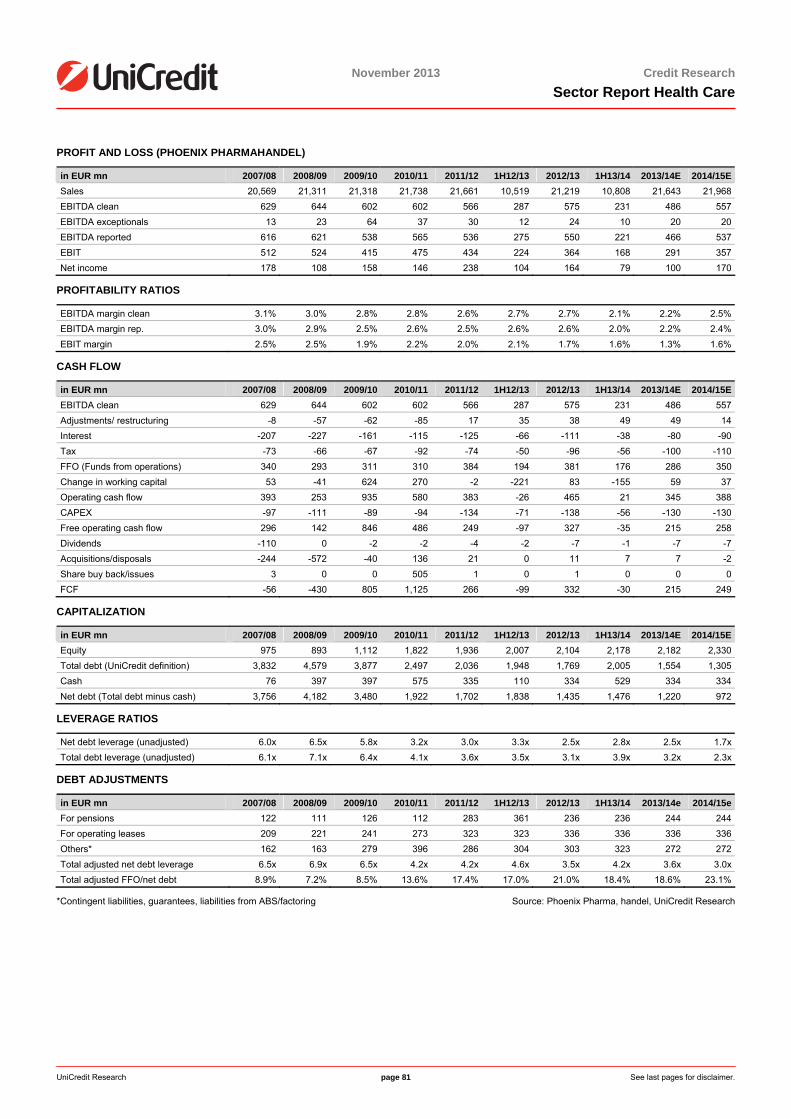
<date>
November 2013 Credit ResearchSector Report Health Care
UniCredit Research page 81 See last pages for disclaimer.
PROFIT AND LOSS (PHOENIX PHARMAHANDEL)
in EUR mn 2007/08 2008/09 2009/10 2010/11 2011/12 1H12/13 2012/13 1H13/14 2013/14E 2014/15ESales 20,569 21,311 21,318 21,738 21,661 10,519 21,219 10,808 21,643 21,968EBITDA clean 629 644 602 602 566 287 575 231 486 557EBITDA exceptionals 13 23 64 37 30 12 24 10 20 20EBITDA reported 616 621 538 565 536 275 550 221 466 537EBIT 512 524 415 475 434 224 364 168 291 357Net income 178 108 158 146 238 104 164 79 100 170
PROFITABILITY RATIOS
EBITDA margin clean 3.1% 3.0% 2.8% 2.8% 2.6% 2.7% 2.7% 2.1% 2.2% 2.5%EBITDA margin rep. 3.0% 2.9% 2.5% 2.6% 2.5% 2.6% 2.6% 2.0% 2.2% 2.4%EBIT margin 2.5% 2.5% 1.9% 2.2% 2.0% 2.1% 1.7% 1.6% 1.3% 1.6%
CASH FLOW
in EUR mn 2007/08 2008/09 2009/10 2010/11 2011/12 1H12/13 2012/13 1H13/14 2013/14E 2014/15EEBITDA clean 629 644 602 602 566 287 575 231 486 557Adjustments/ restructuring -8 -57 -62 -85 17 35 38 49 49 14Interest -207 -227 -161 -115 -125 -66 -111 -38 -80 -90Tax -73 -66 -67 -92 -74 -50 -96 -56 -100 -110FFO (Funds from operations) 340 293 311 310 384 194 381 176 286 350Change in working capital 53 -41 624 270 -2 -221 83 -155 59 37Operating cash flow 393 253 935 580 383 -26 465 21 345 388CAPEX -97 -111 -89 -94 -134 -71 -138 -56 -130 -130Free operating cash flow 296 142 846 486 249 -97 327 -35 215 258Dividends -110 0 -2 -2 -4 -2 -7 -1 -7 -7Acquisitions/disposals -244 -572 -40 136 21 0 11 7 7 -2Share buy back/issues 3 0 0 505 1 0 1 0 0 0FCF -56 -430 805 1,125 266 -99 332 -30 215 249
CAPITALIZATION
in EUR mn 2007/08 2008/09 2009/10 2010/11 2011/12 1H12/13 2012/13 1H13/14 2013/14E 2014/15EEquity 975 893 1,112 1,822 1,936 2,007 2,104 2,178 2,182 2,330Total debt (UniCredit definition) 3,832 4,579 3,877 2,497 2,036 1,948 1,769 2,005 1,554 1,305Cash 76 397 397 575 335 110 334 529 334 334Net debt (Total debt minus cash) 3,756 4,182 3,480 1,922 1,702 1,838 1,435 1,476 1,220 972
LEVERAGE RATIOS
Net debt leverage (unadjusted) 6.0x 6.5x 5.8x 3.2x 3.0x 3.3x 2.5x 2.8x 2.5x 1.7xTotal debt leverage (unadjusted) 6.1x 7.1x 6.4x 4.1x 3.6x 3.5x 3.1x 3.9x 3.2x 2.3x
DEBT ADJUSTMENTS
in EUR mn 2007/08 2008/09 2009/10 2010/11 2011/12 1H12/13 2012/13 1H13/14 2013/14e 2014/15eFor pensions 122 111 126 112 283 361 236 236 244 244For operating leases 209 221 241 273 323 323 336 336 336 336Others* 162 163 279 396 286 304 303 323 272 272Total adjusted net debt leverage 6.5x 6.9x 6.5x 4.2x 4.2x 4.6x 3.5x 4.2x 3.6x 3.0xTotal adjusted FFO/net debt 8.9% 7.2% 8.5% 13.6% 17.4% 17.0% 21.0% 18.4% 18.6% 23.1%
*Contingent liabilities, guarantees, liabilities from ABS/factoring Source: Phoenix Pharma, handel, UniCredit Research
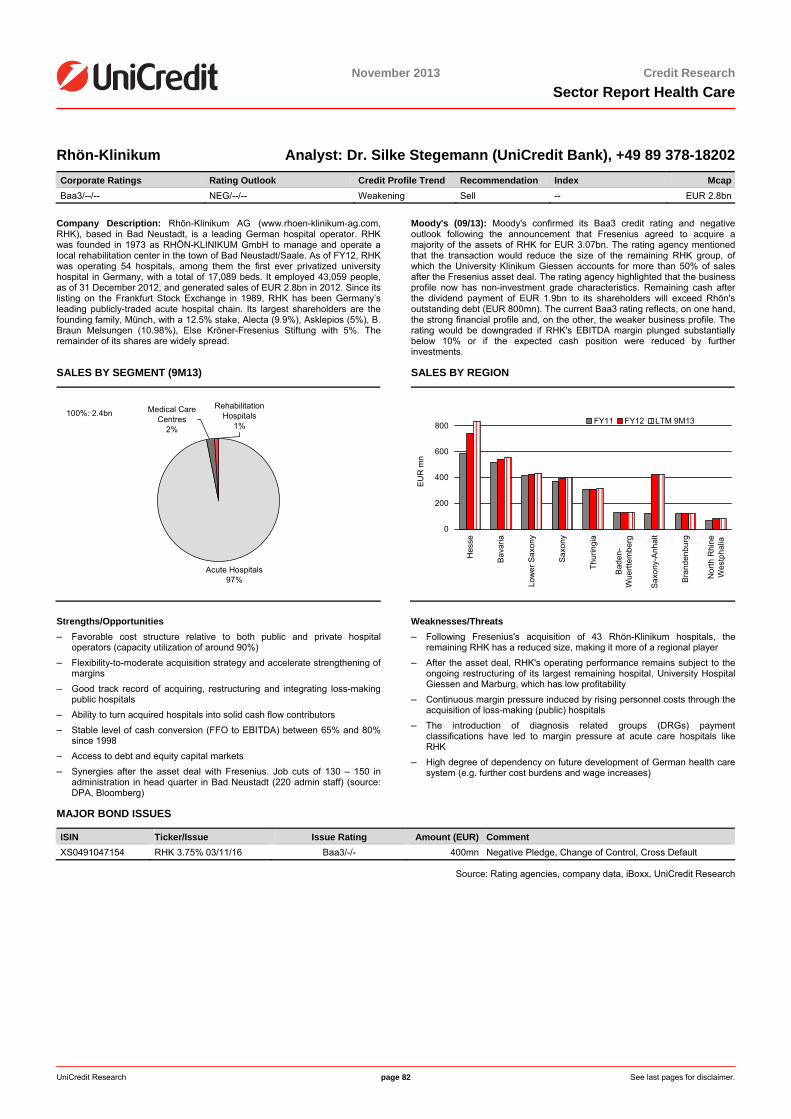
<date>
November 2013 Credit ResearchSector Report Health Care
UniCredit Research page 82 See last pages for disclaimer.
Rhön-Klinikum Analyst: Dr. Silke Stegemann (UniCredit Bank), +49 89 378-18202 Corporate Ratings Rating Outlook Credit Profile Trend Recommendation Index McapBaa3/--/-- NEG/--/-- Weakening Sell -- EUR 2.8bn
Company Description: Rhön-Klinikum AG (www.rhoen-klinikum-ag.com, RHK), based in Bad Neustadt, is a leading German hospital operator. RHK was founded in 1973 as RHÖN-KLINIKUM GmbH to manage and operate a local rehabilitation center in the town of Bad Neustadt/Saale. As of FY12, RHK was operating 54 hospitals, among them the first ever privatized university hospital in Germany, with a total of 17,089 beds. It employed 43,059 people, as of 31 December 2012, and generated sales of EUR 2.8bn in 2012. Since its listing on the Frankfurt Stock Exchange in 1989, RHK has been Germany’s leading publicly-traded acute hospital chain. Its largest shareholders are the founding family, Münch, with a 12.5% stake, Alecta (9.9%), Asklepios (5%), B. Braun Melsungen (10.98%), Else Kröner-Fresenius Stiftung with 5%. The remainder of its shares are widely spread.
Moody's (09/13): Moody's confirmed its Baa3 credit rating and negative outlook following the announcement that Fresenius agreed to acquire a majority of the assets of RHK for EUR 3.07bn. The rating agency mentioned that the transaction would reduce the size of the remaining RHK group, of which the University Klinikum Giessen accounts for more than 50% of sales after the Fresenius asset deal. The rating agency highlighted that the business profile now has non-investment grade characteristics. Remaining cash after the dividend payment of EUR 1.9bn to its shareholders will exceed Rhön's outstanding debt (EUR 800mn). The current Baa3 rating reflects, on one hand, the strong financial profile and, on the other, the weaker business profile. The rating would be downgraded if RHK's EBITDA margin plunged substantially below 10% or if the expected cash position were reduced by further investments.
SALES BY SEGMENT (9M13)
Acute Hospitals97%
Rehabilitation Hospitals
1%
Medical Care Centres
2%
100%: 2.4bn
SALES BY REGION
0
200
400
600
800
Hes
se
Bava
ria
Low
er S
axon
y
Sax
ony
Thur
ingi
a
Bad
en-
Wue
rttem
berg
Sax
ony-
Anh
alt
Bra
nden
burg
Nor
th R
hine
Wes
tpha
lia
EUR
mn
FY11 FY12 LTM 9M13
Strengths/Opportunities – Favorable cost structure relative to both public and private hospital
operators (capacity utilization of around 90%) – Flexibility-to-moderate acquisition strategy and accelerate strengthening of
margins – Good track record of acquiring, restructuring and integrating loss-making
public hospitals – Ability to turn acquired hospitals into solid cash flow contributors – Stable level of cash conversion (FFO to EBITDA) between 65% and 80%
since 1998 – Access to debt and equity capital markets – Synergies after the asset deal with Fresenius. Job cuts of 130 – 150 in
administration in head quarter in Bad Neustadt (220 admin staff) (source: DPA, Bloomberg)
Weaknesses/Threats – Following Fresenius's acquisition of 43 Rhön-Klinikum hospitals, the
remaining RHK has a reduced size, making it more of a regional player – After the asset deal, RHK's operating performance remains subject to the
ongoing restructuring of its largest remaining hospital, University Hospital Giessen and Marburg, which has low profitability
– Continuous margin pressure induced by rising personnel costs through the acquisition of loss-making (public) hospitals
– The introduction of diagnosis related groups (DRGs) payment classifications have led to margin pressure at acute care hospitals like RHK
– High degree of dependency on future development of German health care system (e.g. further cost burdens and wage increases)
MAJOR BOND ISSUES
ISIN Ticker/Issue Issue Rating Amount (EUR) Comment XS0491047154 RHK 3.75% 03/11/16 Baa3/-/- 400mn Negative Pledge, Change of Control, Cross Default
Source: Rating agencies, company data, iBoxx, UniCredit Research
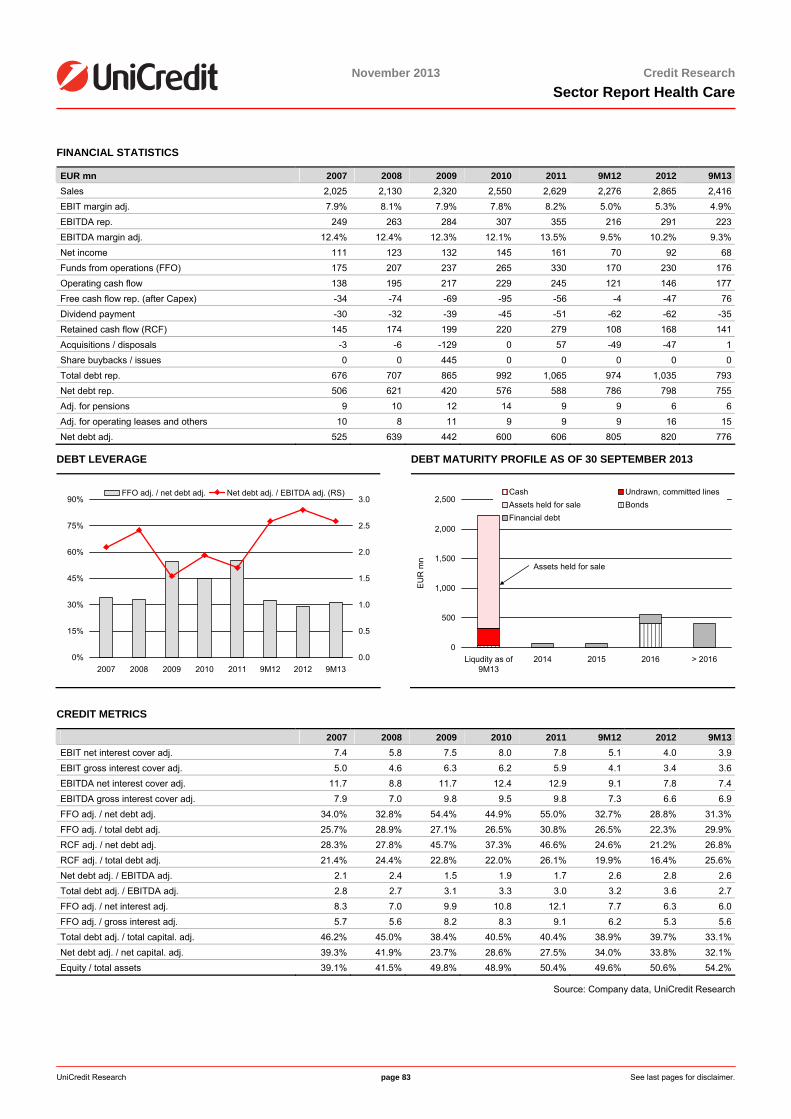
<date>
UniCredit Research page 83 See last pages for disclaimer.
November 2013 Credit ResearchSector Report Health Care
FINANCIAL STATISTICS
EUR mn 2007 2008 2009 2010 2011 9M12 2012 9M13Sales 2,025 2,130 2,320 2,550 2,629 2,276 2,865 2,416EBIT margin adj. 7.9% 8.1% 7.9% 7.8% 8.2% 5.0% 5.3% 4.9%EBITDA rep. 249 263 284 307 355 216 291 223EBITDA margin adj. 12.4% 12.4% 12.3% 12.1% 13.5% 9.5% 10.2% 9.3%Net income 111 123 132 145 161 70 92 68Funds from operations (FFO) 175 207 237 265 330 170 230 176Operating cash flow 138 195 217 229 245 121 146 177Free cash flow rep. (after Capex) -34 -74 -69 -95 -56 -4 -47 76Dividend payment -30 -32 -39 -45 -51 -62 -62 -35Retained cash flow (RCF) 145 174 199 220 279 108 168 141Acquisitions / disposals -3 -6 -129 0 57 -49 -47 1Share buybacks / issues 0 0 445 0 0 0 0 0Total debt rep. 676 707 865 992 1,065 974 1,035 793Net debt rep. 506 621 420 576 588 786 798 755Adj. for pensions 9 10 12 14 9 9 6 6Adj. for operating leases and others 10 8 11 9 9 9 16 15Net debt adj. 525 639 442 600 606 805 820 776
DEBT LEVERAGE
0%
15%
30%
45%
60%
75%
90%
2007 2008 2009 2010 2011 9M12 2012 9M130.0
0.5
1.0
1.5
2.0
2.5
3.0FFO adj. / net debt adj. Net debt adj. / EBITDA adj. (RS)
DEBT MATURITY PROFILE AS OF 30 SEPTEMBER 2013
0
500
1,000
1,500
2,000
2,500
Liqudity as of9M13
2014 2015 2016 > 2016
EU
R m
n
Cash Undrawn, committed linesAssets held for sale BondsFinancial debt
Assets held for sale
CREDIT METRICS
2007 2008 2009 2010 2011 9M12 2012 9M13EBIT net interest cover adj. 7.4 5.8 7.5 8.0 7.8 5.1 4.0 3.9EBIT gross interest cover adj. 5.0 4.6 6.3 6.2 5.9 4.1 3.4 3.6EBITDA net interest cover adj. 11.7 8.8 11.7 12.4 12.9 9.1 7.8 7.4EBITDA gross interest cover adj. 7.9 7.0 9.8 9.5 9.8 7.3 6.6 6.9FFO adj. / net debt adj. 34.0% 32.8% 54.4% 44.9% 55.0% 32.7% 28.8% 31.3%FFO adj. / total debt adj. 25.7% 28.9% 27.1% 26.5% 30.8% 26.5% 22.3% 29.9%RCF adj. / net debt adj. 28.3% 27.8% 45.7% 37.3% 46.6% 24.6% 21.2% 26.8%RCF adj. / total debt adj. 21.4% 24.4% 22.8% 22.0% 26.1% 19.9% 16.4% 25.6%Net debt adj. / EBITDA adj. 2.1 2.4 1.5 1.9 1.7 2.6 2.8 2.6Total debt adj. / EBITDA adj. 2.8 2.7 3.1 3.3 3.0 3.2 3.6 2.7FFO adj. / net interest adj. 8.3 7.0 9.9 10.8 12.1 7.7 6.3 6.0FFO adj. / gross interest adj. 5.7 5.6 8.2 8.3 9.1 6.2 5.3 5.6Total debt adj. / total capital. adj. 46.2% 45.0% 38.4% 40.5% 40.4% 38.9% 39.7% 33.1%Net debt adj. / net capital. adj. 39.3% 41.9% 23.7% 28.6% 27.5% 34.0% 33.8% 32.1%Equity / total assets 39.1% 41.5% 49.8% 48.9% 50.4% 49.6% 50.6% 54.2%
Source: Company data, UniCredit Research
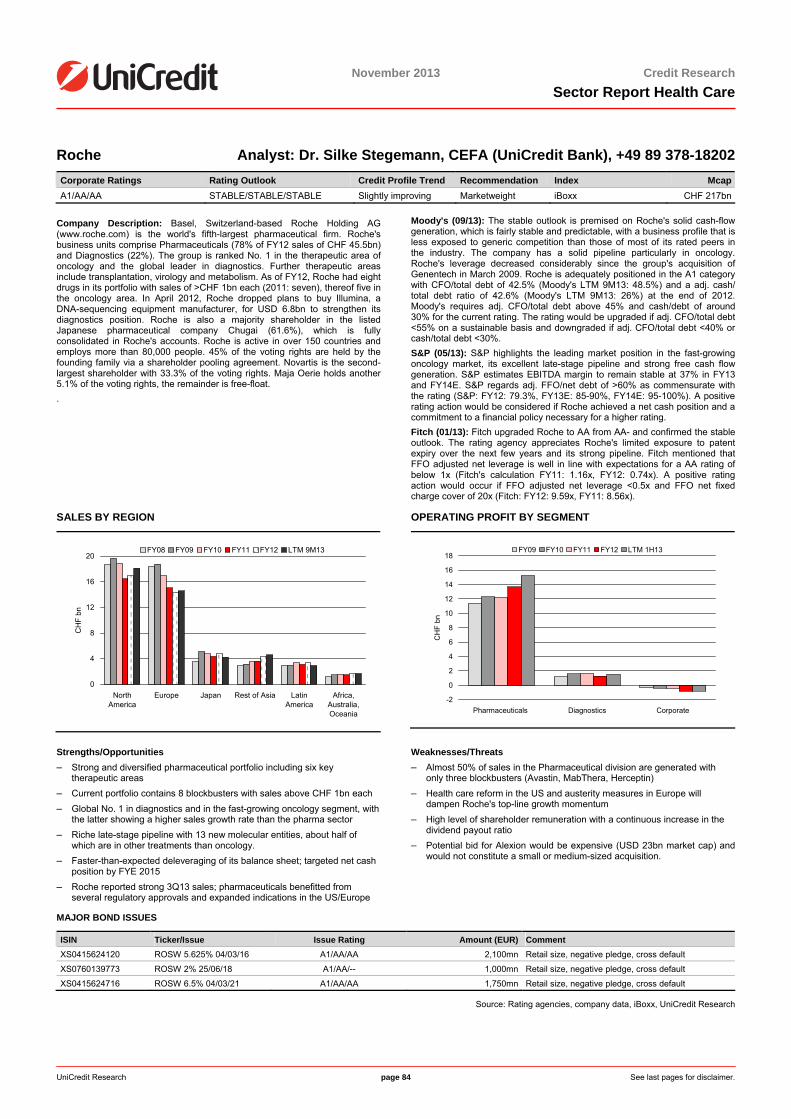
UniCredit Research page 84 See last pages for disclaimer.
November 2013 Credit ResearchSector Report Health Care
Roche Analyst: Dr. Silke Stegemann, CEFA (UniCredit Bank), +49 89 378-18202 Corporate Ratings Rating Outlook Credit Profile Trend Recommendation Index McapA1/AA/AA STABLE/STABLE/STABLE Slightly improving Marketweight iBoxx CHF 217bn
Company Description: Basel, Switzerland-based Roche Holding AG (www.roche.com) is the world's fifth-largest pharmaceutical firm. Roche's business units comprise Pharmaceuticals (78% of FY12 sales of CHF 45.5bn) and Diagnostics (22%). The group is ranked No. 1 in the therapeutic area of oncology and the global leader in diagnostics. Further therapeutic areas include transplantation, virology and metabolism. As of FY12, Roche had eight drugs in its portfolio with sales of >CHF 1bn each (2011: seven), thereof five in the oncology area. In April 2012, Roche dropped plans to buy Illumina, a DNA-sequencing equipment manufacturer, for USD 6.8bn to strengthen its diagnostics position. Roche is also a majority shareholder in the listed Japanese pharmaceutical company Chugai (61.6%), which is fully consolidated in Roche's accounts. Roche is active in over 150 countries and employs more than 80,000 people. 45% of the voting rights are held by the founding family via a shareholder pooling agreement. Novartis is the second-largest shareholder with 33.3% of the voting rights. Maja Oerie holds another 5.1% of the voting rights, the remainder is free-float. .
Moody's (09/13): The stable outlook is premised on Roche's solid cash-flow generation, which is fairly stable and predictable, with a business profile that is less exposed to generic competition than those of most of its rated peers in the industry. The company has a solid pipeline particularly in oncology. Roche's leverage decreased considerably since the group's acquisition of Genentech in March 2009. Roche is adequately positioned in the A1 category with CFO/total debt of 42.5% (Moody's LTM 9M13: 48.5%) and a adj. cash/ total debt ratio of 42.6% (Moody's LTM 9M13: 26%) at the end of 2012. Moody's requires adj. CFO/total debt above 45% and cash/debt of around 30% for the current rating. The rating would be upgraded if adj. CFO/total debt <55% on a sustainable basis and downgraded if adj. CFO/total debt <40% or cash/total debt <30%. S&P (05/13): S&P highlights the leading market position in the fast-growing oncology market, its excellent late-stage pipeline and strong free cash flow generation. S&P estimates EBITDA margin to remain stable at 37% in FY13 and FY14E. S&P regards adj. FFO/net debt of >60% as commensurate with the rating (S&P: FY12: 79.3%, FY13E: 85-90%, FY14E: 95-100%). A positive rating action would be considered if Roche achieved a net cash position and a commitment to a financial policy necessary for a higher rating. Fitch (01/13): Fitch upgraded Roche to AA from AA- and confirmed the stable outlook. The rating agency appreciates Roche's limited exposure to patent expiry over the next few years and its strong pipeline. Fitch mentioned that FFO adjusted net leverage is well in line with expectations for a AA rating of below 1x (Fitch's calculation FY11: 1.16x, FY12: 0.74x). A positive rating action would occur if FFO adjusted net leverage <0.5x and FFO net fixed charge cover of 20x (Fitch: FY12: 9.59x, FY11: 8.56x).
SALES BY REGION
0
4
8
12
16
20
NorthAmerica
Europe Japan Rest of Asia LatinAmerica
Africa,Australia,Oceania
CH
F bn
FY08 FY09 FY10 FY11 FY12 LTM 9M13
OPERATING PROFIT BY SEGMENT
-2
0
2
4
6
8
10
12
14
16
18
Pharmaceuticals Diagnostics Corporate
CH
F bn
FY09 FY10 FY11 FY12 LTM 1H13
Strengths/Opportunities – Strong and diversified pharmaceutical portfolio including six key
therapeutic areas – Current portfolio contains 8 blockbusters with sales above CHF 1bn each – Global No. 1 in diagnostics and in the fast-growing oncology segment, with
the latter showing a higher sales growth rate than the pharma sector – Riche late-stage pipeline with 13 new molecular entities, about half of
which are in other treatments than oncology. – Faster-than-expected deleveraging of its balance sheet; targeted net cash
position by FYE 2015 – Roche reported strong 3Q13 sales; pharmaceuticals benefitted from
several regulatory approvals and expanded indications in the US/Europe
Weaknesses/Threats – Almost 50% of sales in the Pharmaceutical division are generated with
only three blockbusters (Avastin, MabThera, Herceptin) – Health care reform in the US and austerity measures in Europe will
dampen Roche's top-line growth momentum – High level of shareholder remuneration with a continuous increase in the
dividend payout ratio – Potential bid for Alexion would be expensive (USD 23bn market cap) and
would not constitute a small or medium-sized acquisition.
MAJOR BOND ISSUES
ISIN Ticker/Issue Issue Rating Amount (EUR) Comment XS0415624120 ROSW 5.625% 04/03/16 A1/AA/AA 2,100mn Retail size, negative pledge, cross default
XS0760139773 ROSW 2% 25/06/18 A1/AA/-- 1,000mn Retail size, negative pledge, cross default
XS0415624716 ROSW 6.5% 04/03/21 A1/AA/AA 1,750mn Retail size, negative pledge, cross default
Source: Rating agencies, company data, iBoxx, UniCredit Research
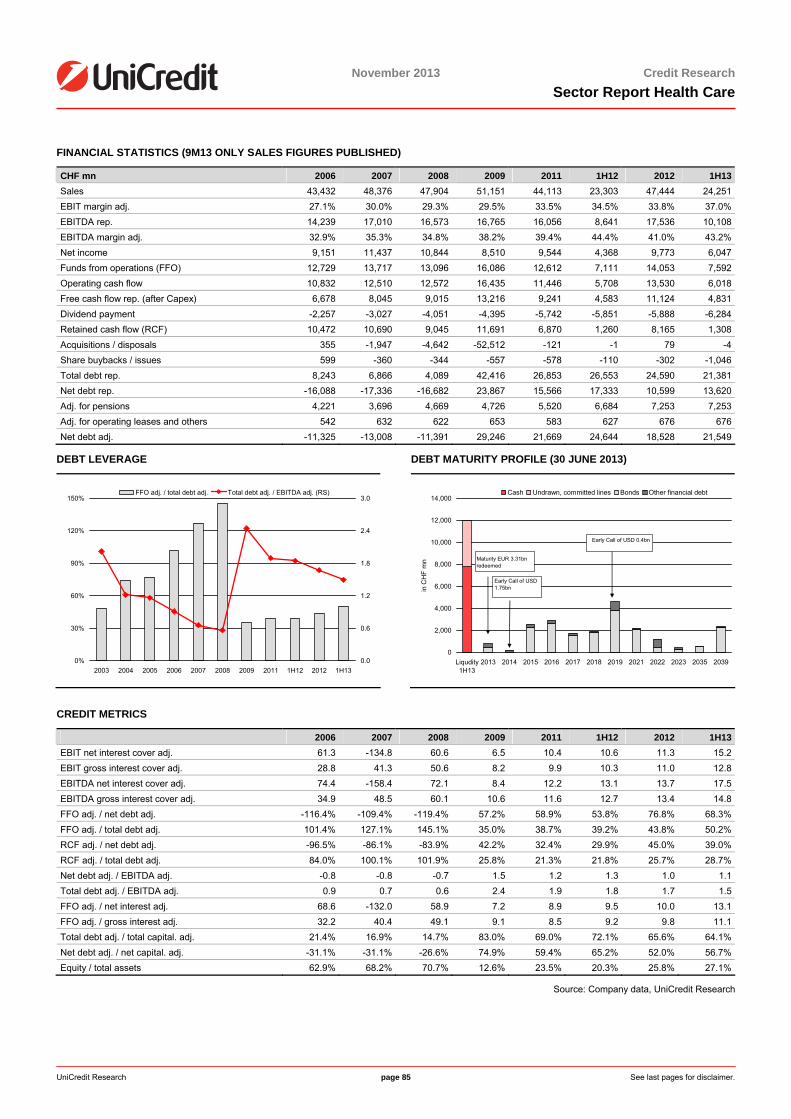
UniCredit Research page 85 See last pages for disclaimer.
November 2013 Credit ResearchSector Report Health Care
FINANCIAL STATISTICS (9M13 ONLY SALES FIGURES PUBLISHED)
CHF mn 2006 2007 2008 2009 2011 1H12 2012 1H13Sales 43,432 48,376 47,904 51,151 44,113 23,303 47,444 24,251EBIT margin adj. 27.1% 30.0% 29.3% 29.5% 33.5% 34.5% 33.8% 37.0%EBITDA rep. 14,239 17,010 16,573 16,765 16,056 8,641 17,536 10,108EBITDA margin adj. 32.9% 35.3% 34.8% 38.2% 39.4% 44.4% 41.0% 43.2%Net income 9,151 11,437 10,844 8,510 9,544 4,368 9,773 6,047Funds from operations (FFO) 12,729 13,717 13,096 16,086 12,612 7,111 14,053 7,592Operating cash flow 10,832 12,510 12,572 16,435 11,446 5,708 13,530 6,018Free cash flow rep. (after Capex) 6,678 8,045 9,015 13,216 9,241 4,583 11,124 4,831Dividend payment -2,257 -3,027 -4,051 -4,395 -5,742 -5,851 -5,888 -6,284Retained cash flow (RCF) 10,472 10,690 9,045 11,691 6,870 1,260 8,165 1,308Acquisitions / disposals 355 -1,947 -4,642 -52,512 -121 -1 79 -4Share buybacks / issues 599 -360 -344 -557 -578 -110 -302 -1,046Total debt rep. 8,243 6,866 4,089 42,416 26,853 26,553 24,590 21,381Net debt rep. -16,088 -17,336 -16,682 23,867 15,566 17,333 10,599 13,620Adj. for pensions 4,221 3,696 4,669 4,726 5,520 6,684 7,253 7,253Adj. for operating leases and others 542 632 622 653 583 627 676 676Net debt adj. -11,325 -13,008 -11,391 29,246 21,669 24,644 18,528 21,549
DEBT LEVERAGE
0%
30%
60%
90%
120%
150%
2003 2004 2005 2006 2007 2008 2009 2011 1H12 2012 1H130.0
0.6
1.2
1.8
2.4
3.0FFO adj. / total debt adj. Total debt adj. / EBITDA adj. (RS)
DEBT MATURITY PROFILE (30 JUNE 2013)
0
2,000
4,000
6,000
8,000
10,000
12,000
14,000
Liqudity1H13
2013 2014 2015 2016 2017 2018 2019 2021 2022 2023 2035 2039
in C
HF
mn
Cash Undrawn, committed lines Bonds Other financial debt
Early Call of USD 1.75bn
Maturity EUR 3.31bn redeemed
Early Call of USD 0.4bn
CREDIT METRICS
2006 2007 2008 2009 2011 1H12 2012 1H13EBIT net interest cover adj. 61.3 -134.8 60.6 6.5 10.4 10.6 11.3 15.2EBIT gross interest cover adj. 28.8 41.3 50.6 8.2 9.9 10.3 11.0 12.8EBITDA net interest cover adj. 74.4 -158.4 72.1 8.4 12.2 13.1 13.7 17.5EBITDA gross interest cover adj. 34.9 48.5 60.1 10.6 11.6 12.7 13.4 14.8FFO adj. / net debt adj. -116.4% -109.4% -119.4% 57.2% 58.9% 53.8% 76.8% 68.3%FFO adj. / total debt adj. 101.4% 127.1% 145.1% 35.0% 38.7% 39.2% 43.8% 50.2%RCF adj. / net debt adj. -96.5% -86.1% -83.9% 42.2% 32.4% 29.9% 45.0% 39.0%RCF adj. / total debt adj. 84.0% 100.1% 101.9% 25.8% 21.3% 21.8% 25.7% 28.7%Net debt adj. / EBITDA adj. -0.8 -0.8 -0.7 1.5 1.2 1.3 1.0 1.1Total debt adj. / EBITDA adj. 0.9 0.7 0.6 2.4 1.9 1.8 1.7 1.5FFO adj. / net interest adj. 68.6 -132.0 58.9 7.2 8.9 9.5 10.0 13.1FFO adj. / gross interest adj. 32.2 40.4 49.1 9.1 8.5 9.2 9.8 11.1Total debt adj. / total capital. adj. 21.4% 16.9% 14.7% 83.0% 69.0% 72.1% 65.6% 64.1%Net debt adj. / net capital. adj. -31.1% -31.1% -26.6% 74.9% 59.4% 65.2% 52.0% 56.7%Equity / total assets 62.9% 68.2% 70.7% 12.6% 23.5% 20.3% 25.8% 27.1%
Source: Company data, UniCredit Research
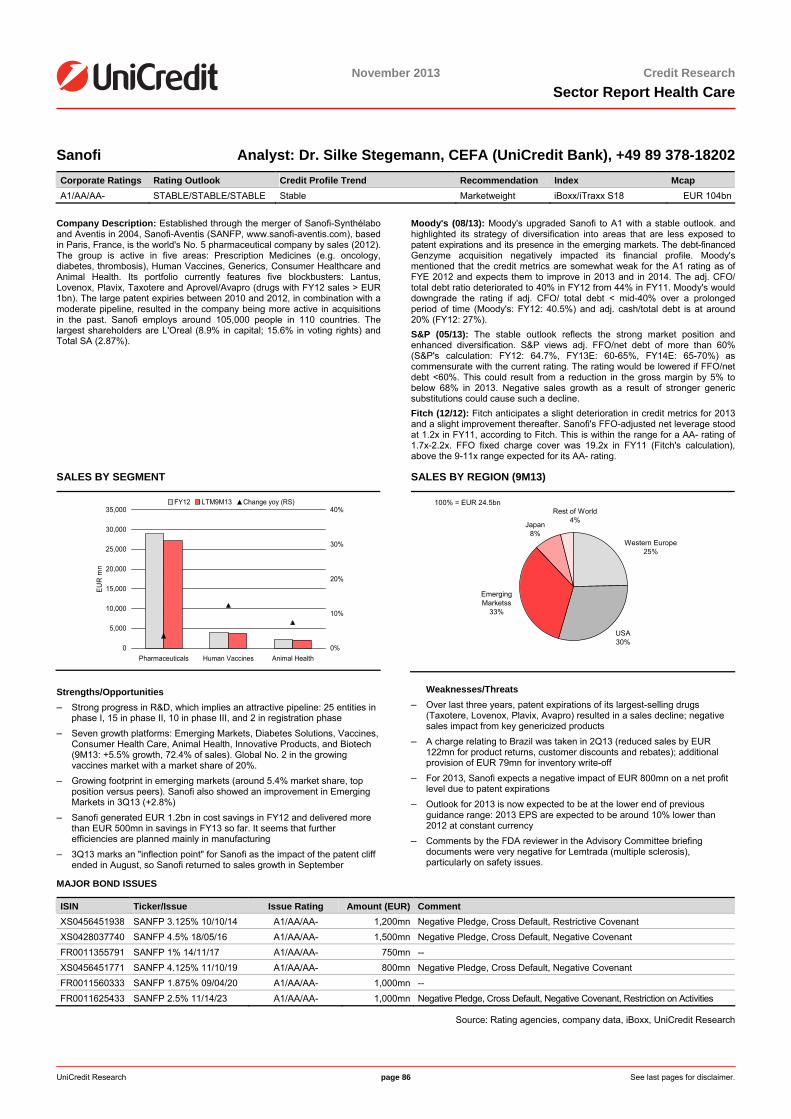
UniCredit Research page 86 See last pages for disclaimer.
November 2013 Credit ResearchSector Report Health Care
Sanofi Analyst: Dr. Silke Stegemann, CEFA (UniCredit Bank), +49 89 378-18202 Corporate Ratings Rating Outlook Credit Profile Trend Recommendation Index Mcap A1/AA/AA- STABLE/STABLE/STABLE Stable Marketweight iBoxx/iTraxx S18 EUR 104bn
Company Description: Established through the merger of Sanofi-Synthélabo and Aventis in 2004, Sanofi-Aventis (SANFP, www.sanofi-aventis.com), based in Paris, France, is the world's No. 5 pharmaceutical company by sales (2012). The group is active in five areas: Prescription Medicines (e.g. oncology, diabetes, thrombosis), Human Vaccines, Generics, Consumer Healthcare and Animal Health. Its portfolio currently features five blockbusters: Lantus, Lovenox, Plavix, Taxotere and Aprovel/Avapro (drugs with FY12 sales > EUR 1bn). The large patent expiries between 2010 and 2012, in combination with a moderate pipeline, resulted in the company being more active in acquisitions in the past. Sanofi employs around 105,000 people in 110 countries. The largest shareholders are L'Oreal (8.9% in capital; 15.6% in voting rights) and Total SA (2.87%).
Moody's (08/13): Moody's upgraded Sanofi to A1 with a stable outlook. and highlighted its strategy of diversification into areas that are less exposed to patent expirations and its presence in the emerging markets. The debt-financed Genzyme acquisition negatively impacted its financial profile. Moody's mentioned that the credit metrics are somewhat weak for the A1 rating as of FYE 2012 and expects them to improve in 2013 and in 2014. The adj. CFO/ total debt ratio deteriorated to 40% in FY12 from 44% in FY11. Moody's would downgrade the rating if adj. CFO/ total debt < mid-40% over a prolonged period of time (Moody's: FY12: 40.5%) and adj. cash/total debt is at around 20% (FY12: 27%). S&P (05/13): The stable outlook reflects the strong market position and enhanced diversification. S&P views adj. FFO/net debt of more than 60% (S&P's calculation: FY12: 64.7%, FY13E: 60-65%, FY14E: 65-70%) as commensurate with the current rating. The rating would be lowered if FFO/net debt <60%. This could result from a reduction in the gross margin by 5% to below 68% in 2013. Negative sales growth as a result of stronger generic substitutions could cause such a decline. Fitch (12/12): Fitch anticipates a slight deterioration in credit metrics for 2013 and a slight improvement thereafter. Sanofi's FFO-adjusted net leverage stood at 1.2x in FY11, according to Fitch. This is within the range for a AA- rating of 1.7x-2.2x. FFO fixed charge cover was 19.2x in FY11 (Fitch's calculation), above the 9-11x range expected for its AA- rating.
SALES BY SEGMENT
0
5,000
10,000
15,000
20,000
25,000
30,000
35,000
Pharmaceuticals Human Vaccines Animal Health
EU
R m
n
0%
10%
20%
30%
40%FY12 LTM9M13 Change yoy (RS)
SALES BY REGION (9M13)
Emerging Marketss
33%
USA30%
Western Europe25%
Japan8%
Rest of World4%
100% = EUR 24.5bn
Strengths/Opportunities – Strong progress in R&D, which implies an attractive pipeline: 25 entities in
phase I, 15 in phase II, 10 in phase III, and 2 in registration phase – Seven growth platforms: Emerging Markets, Diabetes Solutions, Vaccines,
Consumer Health Care, Animal Health, Innovative Products, and Biotech (9M13: +5.5% growth, 72.4% of sales). Global No. 2 in the growing vaccines market with a market share of 20%.
– Growing footprint in emerging markets (around 5.4% market share, top position versus peers). Sanofi also showed an improvement in Emerging Markets in 3Q13 (+2.8%)
– Sanofi generated EUR 1.2bn in cost savings in FY12 and delivered more than EUR 500mn in savings in FY13 so far. It seems that further efficiencies are planned mainly in manufacturing
– 3Q13 marks an "inflection point" for Sanofi as the impact of the patent cliff ended in August, so Sanofi returned to sales growth in September
Weaknesses/Threats – Over last three years, patent expirations of its largest-selling drugs
(Taxotere, Lovenox, Plavix, Avapro) resulted in a sales decline; negative sales impact from key genericized products
– A charge relating to Brazil was taken in 2Q13 (reduced sales by EUR 122mn for product returns, customer discounts and rebates); additional provision of EUR 79mn for inventory write-off
– For 2013, Sanofi expects a negative impact of EUR 800mn on a net profit level due to patent expirations
– Outlook for 2013 is now expected to be at the lower end of previous guidance range: 2013 EPS are expected to be around 10% lower than 2012 at constant currency
– Comments by the FDA reviewer in the Advisory Committee briefing documents were very negative for Lemtrada (multiple sclerosis), particularly on safety issues.
MAJOR BOND ISSUES
ISIN Ticker/Issue Issue Rating Amount (EUR) Comment XS0456451938 SANFP 3.125% 10/10/14 A1/AA/AA- 1,200mn Negative Pledge, Cross Default, Restrictive Covenant XS0428037740 SANFP 4.5% 18/05/16 A1/AA/AA- 1,500mn Negative Pledge, Cross Default, Negative Covenant FR0011355791 SANFP 1% 14/11/17 A1/AA/AA- 750mn -- XS0456451771 SANFP 4.125% 11/10/19 A1/AA/AA- 800mn Negative Pledge, Cross Default, Negative Covenant FR0011560333 SANFP 1.875% 09/04/20 A1/AA/AA- 1,000mn -- FR0011625433 SANFP 2.5% 11/14/23 A1/AA/AA- 1,000mn Negative Pledge, Cross Default, Negative Covenant, Restriction on Activities
Source: Rating agencies, company data, iBoxx, UniCredit Research
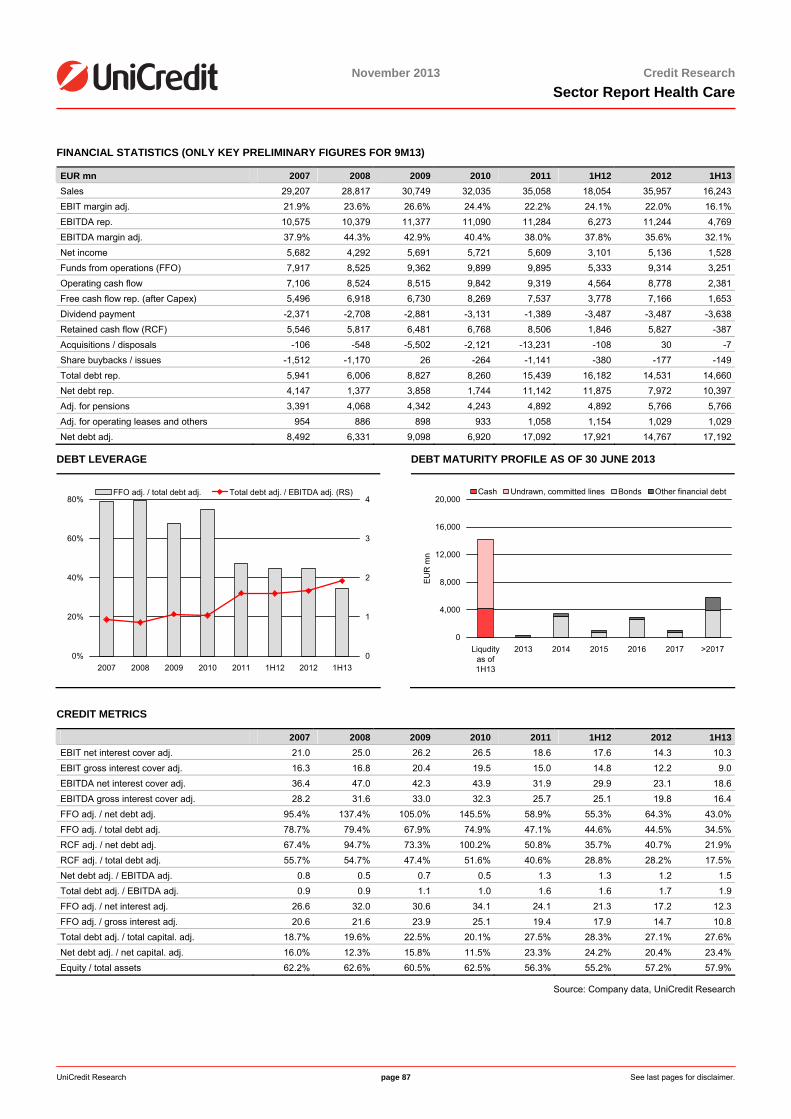
UniCredit Research page 87 See last pages for disclaimer.
November 2013 Credit ResearchSector Report Health Care
FINANCIAL STATISTICS (ONLY KEY PRELIMINARY FIGURES FOR 9M13)
EUR mn 2007 2008 2009 2010 2011 1H12 2012 1H13Sales 29,207 28,817 30,749 32,035 35,058 18,054 35,957 16,243EBIT margin adj. 21.9% 23.6% 26.6% 24.4% 22.2% 24.1% 22.0% 16.1%EBITDA rep. 10,575 10,379 11,377 11,090 11,284 6,273 11,244 4,769EBITDA margin adj. 37.9% 44.3% 42.9% 40.4% 38.0% 37.8% 35.6% 32.1%Net income 5,682 4,292 5,691 5,721 5,609 3,101 5,136 1,528Funds from operations (FFO) 7,917 8,525 9,362 9,899 9,895 5,333 9,314 3,251Operating cash flow 7,106 8,524 8,515 9,842 9,319 4,564 8,778 2,381Free cash flow rep. (after Capex) 5,496 6,918 6,730 8,269 7,537 3,778 7,166 1,653Dividend payment -2,371 -2,708 -2,881 -3,131 -1,389 -3,487 -3,487 -3,638Retained cash flow (RCF) 5,546 5,817 6,481 6,768 8,506 1,846 5,827 -387Acquisitions / disposals -106 -548 -5,502 -2,121 -13,231 -108 30 -7Share buybacks / issues -1,512 -1,170 26 -264 -1,141 -380 -177 -149Total debt rep. 5,941 6,006 8,827 8,260 15,439 16,182 14,531 14,660Net debt rep. 4,147 1,377 3,858 1,744 11,142 11,875 7,972 10,397Adj. for pensions 3,391 4,068 4,342 4,243 4,892 4,892 5,766 5,766Adj. for operating leases and others 954 886 898 933 1,058 1,154 1,029 1,029Net debt adj. 8,492 6,331 9,098 6,920 17,092 17,921 14,767 17,192
DEBT LEVERAGE
0%
20%
40%
60%
80%
2007 2008 2009 2010 2011 1H12 2012 1H130
1
2
3
4FFO adj. / total debt adj. Total debt adj. / EBITDA adj. (RS)
DEBT MATURITY PROFILE AS OF 30 JUNE 2013
0
4,000
8,000
12,000
16,000
20,000
Liqudityas of1H13
2013 2014 2015 2016 2017 >2017
EUR
mn
Cash Undrawn, committed lines Bonds Other financial debt
CREDIT METRICS
2007 2008 2009 2010 2011 1H12 2012 1H13EBIT net interest cover adj. 21.0 25.0 26.2 26.5 18.6 17.6 14.3 10.3EBIT gross interest cover adj. 16.3 16.8 20.4 19.5 15.0 14.8 12.2 9.0EBITDA net interest cover adj. 36.4 47.0 42.3 43.9 31.9 29.9 23.1 18.6EBITDA gross interest cover adj. 28.2 31.6 33.0 32.3 25.7 25.1 19.8 16.4FFO adj. / net debt adj. 95.4% 137.4% 105.0% 145.5% 58.9% 55.3% 64.3% 43.0%FFO adj. / total debt adj. 78.7% 79.4% 67.9% 74.9% 47.1% 44.6% 44.5% 34.5%RCF adj. / net debt adj. 67.4% 94.7% 73.3% 100.2% 50.8% 35.7% 40.7% 21.9%RCF adj. / total debt adj. 55.7% 54.7% 47.4% 51.6% 40.6% 28.8% 28.2% 17.5%Net debt adj. / EBITDA adj. 0.8 0.5 0.7 0.5 1.3 1.3 1.2 1.5Total debt adj. / EBITDA adj. 0.9 0.9 1.1 1.0 1.6 1.6 1.7 1.9FFO adj. / net interest adj. 26.6 32.0 30.6 34.1 24.1 21.3 17.2 12.3FFO adj. / gross interest adj. 20.6 21.6 23.9 25.1 19.4 17.9 14.7 10.8Total debt adj. / total capital. adj. 18.7% 19.6% 22.5% 20.1% 27.5% 28.3% 27.1% 27.6%Net debt adj. / net capital. adj. 16.0% 12.3% 15.8% 11.5% 23.3% 24.2% 20.4% 23.4%Equity / total assets 62.2% 62.6% 60.5% 62.5% 56.3% 55.2% 57.2% 57.9%
Source: Company data, UniCredit Research
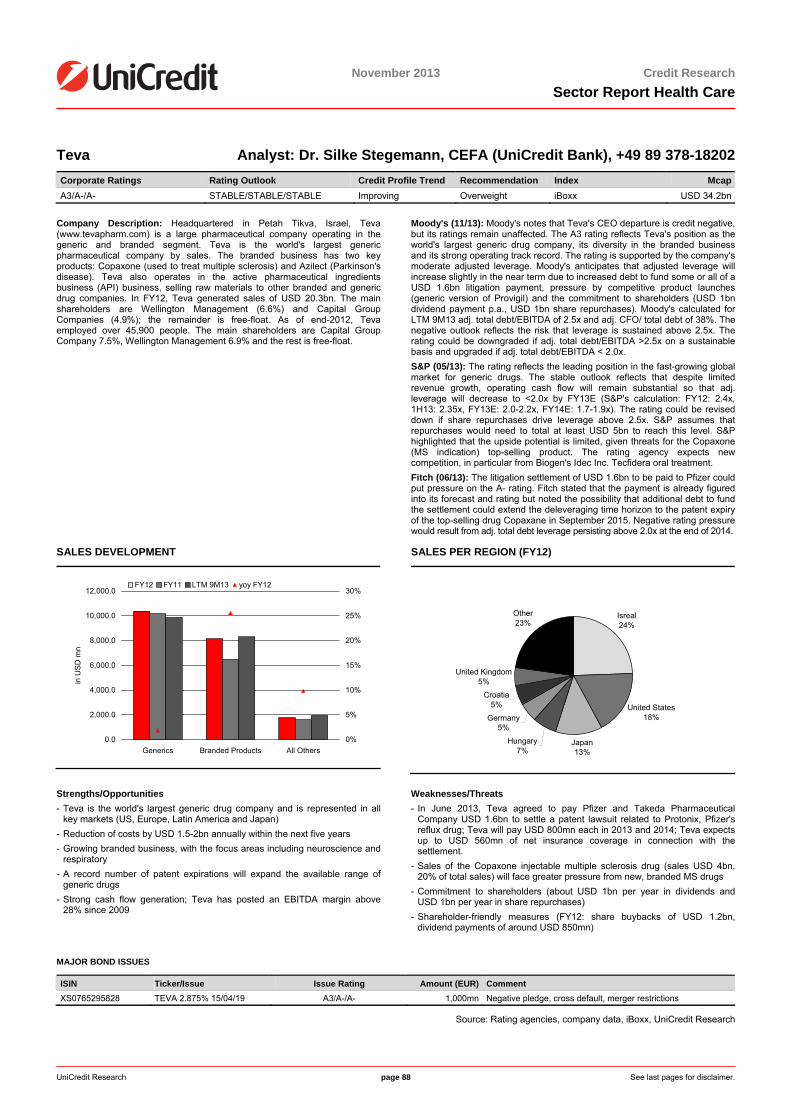
<date>
November 2013 Credit ResearchSector Report Health Care
UniCredit Research page 88 See last pages for disclaimer.
Teva Analyst: Dr. Silke Stegemann, CEFA (UniCredit Bank), +49 89 378-18202 Corporate Ratings Rating Outlook Credit Profile Trend Recommendation Index McapA3/A-/A- STABLE/STABLE/STABLE Improving Overweight iBoxx USD 34.2bn
Company Description: Headquartered in Petah Tikva, Israel, Teva (www.tevapharm.com) is a large pharmaceutical company operating in the generic and branded segment. Teva is the world's largest generic pharmaceutical company by sales. The branded business has two key products: Copaxone (used to treat multiple sclerosis) and Azilect (Parkinson's disease). Teva also operates in the active pharmaceutical ingredients business (API) business, selling raw materials to other branded and generic drug companies. In FY12, Teva generated sales of USD 20.3bn. The main shareholders are Wellington Management (6.6%) and Capital Group Companies (4.9%); the remainder is free-float. As of end-2012, Teva employed over 45,900 people. The main shareholders are Capital Group Company 7.5%, Wellington Management 6.9% and the rest is free-float.
Moody's (11/13): Moody's notes that Teva's CEO departure is credit negative, but its ratings remain unaffected. The A3 rating reflects Teva's position as the world's largest generic drug company, its diversity in the branded business and its strong operating track record. The rating is supported by the company's moderate adjusted leverage. Moody's anticipates that adjusted leverage will increase slightly in the near term due to increased debt to fund some or all of a USD 1.6bn litigation payment, pressure by competitive product launches (generic version of Provigil) and the commitment to shareholders (USD 1bn dividend payment p.a., USD 1bn share repurchases). Moody's calculated for LTM 9M13 adj. total debt/EBITDA of 2.5x and adj. CFO/ total debt of 38%. The negative outlook reflects the risk that leverage is sustained above 2.5x. The rating could be downgraded if adj. total debt/EBITDA >2.5x on a sustainable basis and upgraded if adj. total debt/EBITDA < 2.0x. S&P (05/13): The rating reflects the leading position in the fast-growing global market for generic drugs. The stable outlook reflects that despite limited revenue growth, operating cash flow will remain substantial so that adj. leverage will decrease to <2.0x by FY13E (S&P's calculation: FY12: 2.4x, 1H13: 2.35x, FY13E: 2.0-2.2x, FY14E: 1.7-1.9x). The rating could be revised down if share repurchases drive leverage above 2.5x. S&P assumes that repurchases would need to total at least USD 5bn to reach this level. S&P highlighted that the upside potential is limited, given threats for the Copaxone (MS indication) top-selling product. The rating agency expects new competition, in particular from Biogen's Idec Inc. Tecfidera oral treatment. Fitch (06/13): The litigation settlement of USD 1.6bn to be paid to Pfizer could put pressure on the A- rating. Fitch stated that the payment is already figured into its forecast and rating but noted the possibility that additional debt to fund the settlement could extend the deleveraging time horizon to the patent expiry of the top-selling drug Copaxane in September 2015. Negative rating pressure would result from adj. total debt leverage persisting above 2.0x at the end of 2014.
SALES DEVELOPMENT
0.0
2,000.0
4,000.0
6,000.0
8,000.0
10,000.0
12,000.0
Generics Branded Products All Others
in U
SD
mn
0%
5%
10%
15%
20%
25%
30%FY12 FY11 LTM 9M13 yoy FY12
SALES PER REGION (FY12)
Isreal24%
United States18%
Japan13%
Hungary7%
Germany5%
Croatia5%
United Kingdom5%
Other23%
Strengths/Opportunities - Teva is the world's largest generic drug company and is represented in all
key markets (US, Europe, Latin America and Japan) - Reduction of costs by USD 1.5-2bn annually within the next five years - Growing branded business, with the focus areas including neuroscience and
respiratory - A record number of patent expirations will expand the available range of
generic drugs - Strong cash flow generation; Teva has posted an EBITDA margin above
28% since 2009
Weaknesses/Threats - In June 2013, Teva agreed to pay Pfizer and Takeda Pharmaceutical
Company USD 1.6bn to settle a patent lawsuit related to Protonix, Pfizer's reflux drug; Teva will pay USD 800mn each in 2013 and 2014; Teva expects up to USD 560mn of net insurance coverage in connection with the settlement.
- Sales of the Copaxone injectable multiple sclerosis drug (sales USD 4bn, 20% of total sales) will face greater pressure from new, branded MS drugs
- Commitment to shareholders (about USD 1bn per year in dividends and USD 1bn per year in share repurchases)
- Shareholder-friendly measures (FY12: share buybacks of USD 1.2bn, dividend payments of around USD 850mn)
MAJOR BOND ISSUES
ISIN Ticker/Issue Issue Rating Amount (EUR) Comment XS0765295828 TEVA 2.875% 15/04/19 A3/A-/A- 1,000mn Negative pledge, cross default, merger restrictions
Source: Rating agencies, company data, iBoxx, UniCredit Research
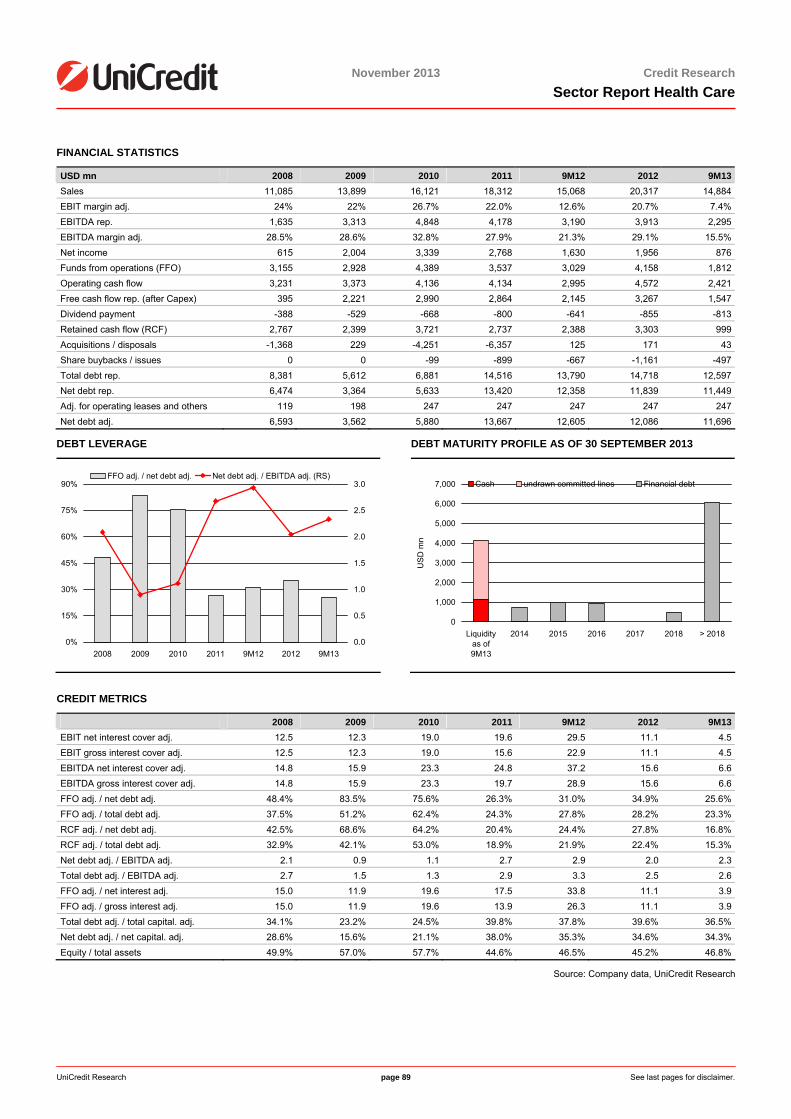
<date>
UniCredit Research page 89 See last pages for disclaimer.
November 2013 Credit ResearchSector Report Health Care
FINANCIAL STATISTICS
USD mn 2008 2009 2010 2011 9M12 2012 9M13Sales 11,085 13,899 16,121 18,312 15,068 20,317 14,884EBIT margin adj. 24% 22% 26.7% 22.0% 12.6% 20.7% 7.4%EBITDA rep. 1,635 3,313 4,848 4,178 3,190 3,913 2,295EBITDA margin adj. 28.5% 28.6% 32.8% 27.9% 21.3% 29.1% 15.5%Net income 615 2,004 3,339 2,768 1,630 1,956 876Funds from operations (FFO) 3,155 2,928 4,389 3,537 3,029 4,158 1,812Operating cash flow 3,231 3,373 4,136 4,134 2,995 4,572 2,421Free cash flow rep. (after Capex) 395 2,221 2,990 2,864 2,145 3,267 1,547Dividend payment -388 -529 -668 -800 -641 -855 -813Retained cash flow (RCF) 2,767 2,399 3,721 2,737 2,388 3,303 999Acquisitions / disposals -1,368 229 -4,251 -6,357 125 171 43Share buybacks / issues 0 0 -99 -899 -667 -1,161 -497Total debt rep. 8,381 5,612 6,881 14,516 13,790 14,718 12,597Net debt rep. 6,474 3,364 5,633 13,420 12,358 11,839 11,449Adj. for operating leases and others 119 198 247 247 247 247 247Net debt adj. 6,593 3,562 5,880 13,667 12,605 12,086 11,696
DEBT LEVERAGE
0%
15%
30%
45%
60%
75%
90%
2008 2009 2010 2011 9M12 2012 9M130.0
0.5
1.0
1.5
2.0
2.5
3.0FFO adj. / net debt adj. Net debt adj. / EBITDA adj. (RS)
DEBT MATURITY PROFILE AS OF 30 SEPTEMBER 2013
0
1,000
2,000
3,000
4,000
5,000
6,000
7,000
Liquidityas of9M13
2014 2015 2016 2017 2018 > 2018
USD
mn
Cash undrawn committed lines Financial debt
CREDIT METRICS
2008 2009 2010 2011 9M12 2012 9M13EBIT net interest cover adj. 12.5 12.3 19.0 19.6 29.5 11.1 4.5EBIT gross interest cover adj. 12.5 12.3 19.0 15.6 22.9 11.1 4.5EBITDA net interest cover adj. 14.8 15.9 23.3 24.8 37.2 15.6 6.6EBITDA gross interest cover adj. 14.8 15.9 23.3 19.7 28.9 15.6 6.6FFO adj. / net debt adj. 48.4% 83.5% 75.6% 26.3% 31.0% 34.9% 25.6%FFO adj. / total debt adj. 37.5% 51.2% 62.4% 24.3% 27.8% 28.2% 23.3%RCF adj. / net debt adj. 42.5% 68.6% 64.2% 20.4% 24.4% 27.8% 16.8%RCF adj. / total debt adj. 32.9% 42.1% 53.0% 18.9% 21.9% 22.4% 15.3%Net debt adj. / EBITDA adj. 2.1 0.9 1.1 2.7 2.9 2.0 2.3Total debt adj. / EBITDA adj. 2.7 1.5 1.3 2.9 3.3 2.5 2.6FFO adj. / net interest adj. 15.0 11.9 19.6 17.5 33.8 11.1 3.9FFO adj. / gross interest adj. 15.0 11.9 19.6 13.9 26.3 11.1 3.9Total debt adj. / total capital. adj. 34.1% 23.2% 24.5% 39.8% 37.8% 39.6% 36.5%Net debt adj. / net capital. adj. 28.6% 15.6% 21.1% 38.0% 35.3% 34.6% 34.3%Equity / total assets 49.9% 57.0% 57.7% 44.6% 46.5% 45.2% 46.8%
Source: Company data, UniCredit Research
November 2013 Credit Research
Sector Report Health Care
UniCredit Research page 90
Disclaimer Our recommendations are based on information obtained from, or are based upon public information sources that we consider to be reliable but for the completeness and accuracy of which we assume no liability. All estimates and opinions included in the report represent the independent judgment of the analysts as of the date of the issue. We reserve the right to modify the views expressed herein at any time without notice. Moreover, we reserve the right not to update this information or to discontinue it altogether without notice. This analysis is for information purposes only and (i) does not constitute or form part of any offer for sale or subscription of or solicitation of any offer to buy or subscribe for any financial, money market or investment instrument or any security, (ii) is neither intended as such an offer for sale or subscription of or solicitation of an offer to buy or subscribe for any financial, money market or investment instrument or any security nor (iii) as an advertisement thereof. The investment possibilities discussed in this report may not be suitable for certain investors depending on their specific investment objectives and time horizon or in the context of their overall financial situation. The investments discussed may fluctuate in price or value. Investors may get back less than they invested. Changes in rates of exchange may have an adverse effect on the value of investments. Furthermore, past performance is not necessarily indicative of future results. In particular, the risks associated with an investment in the financial, money market or investment instrument or security under discussion are not explained in their entirety. This information is given without any warranty on an "as is" basis and should not be regarded as a substitute for obtaining individual advice. Investors must make their own determination of the appropriateness of an investment in any instruments referred to herein based on the merits and risks involved, their own investment strategy and their legal, fiscal and financial position. As this document does not qualify as an investment recommendation or as a direct investment recommendation, neither this document nor any part of it shall form the basis of, or be relied on in connection with or act as an inducement to enter into, any contract or commitment whatsoever. Investors are urged to contact their bank's investment advisor for individual explanations and advice. Neither UniCredit Bank nor any of their respective directors, officers or employees nor any other person accepts any liability whatsoever (in negligence or otherwise) for any loss howsoever arising from any use of this document or its contents or otherwise arising in connection therewith. This analysis is being distributed by electronic and ordinary mail to professional investors, who are expected to make their own investment decisions without undue reliance on this publication, and may not be redistributed, reproduced or published in whole or in part for any purpose. Responsibility for the content of this publication lies with: UniCredit Bank AG (UniCredit Bank), Am Tucherpark 16, 80538 Munich, Germany, (also responsible for the distribution pursuant to §34b WpHG). The company belongs to UniCredit Group. Regulatory authority: “BaFin“ – Bundesanstalt für Finanzdienstleistungsaufsicht, Lurgiallee 12, 60439 Frankfurt, Germany.
POTENTIAL CONFLICTS OF INTERESTS Amgen 3; Amplifon 7; Bayer 3; Bristol-Myers Squibb 6a; Fresenius 2, 6a, 7; Johnson & Johnson 3; Merck & Co. 3; Novartis 3; Pfizer 3; Rhön Klinikum 3; Roche 3, 7; Sanofi-Aventis 3, 6a, 7; Key 1a: UniCredit Bank AG and/or a company affiliated with it (pursuant to relevant domestic law) owns at least 2% of the capital stock of the company. Key 1b: The analyzed company owns at least 2% of the capital stock of UniCredit Bank AG and/or a company affiliated with it (pursuant to relevant domestic law). Key 2: UniCredit Bank AG and/or a company affiliated with it (pursuant to relevant domestic law) belonged to a syndicate that has acquired securities or any related derivatives of the analyzed company within the twelve months preceding publication, in connection with any publicly disclosed offer of securities of the analyzed company, or in any related derivatives. Key 3: UniCredit Bank AG and/or a company affiliated (pursuant to relevant domestic law) administers the securities issued by the analyzed company on the stock exchange or on the market by quoting bid and ask prices (i.e. acts as a market maker or liquidity provider in the securities of the analyzed company or in any related derivatives). Key 4: The analyzed company and UniCredit Bank AG and/or a company affiliated (pursuant to relevant domestic law) concluded an agreement on services in connection with investment banking transactions in the last 12 months, in return for which the Bank received a consideration or promise of consideration. Key 5: The analyzed company and UniCredit Bank AG and/or a company affiliated (pursuant to relevant domestic law) have concluded an agreement on the preparation of analyses. Key 6a: Employees of UniCredit Bank AG Milan Branch and/or members of the Board of Directors of UniCredit (pursuant to relevant domestic law) are members of the Board of Directors of the Issuer. Members of the Board of Directors of the Issuer hold office in the Board of Directors of UniCredit (pursuant to relevant domestic law). Key 6b: The analyst is on the supervisory/management board of the company they cover. Key 7: UniCredit Bank AG Milan Branch and/or other Italian banks belonging to the UniCredit Group (pursuant to relevant domestic law) extended significant amounts of credit facilities to the Issuer. RECOMMENDATIONS, RATINGS AND EVALUATION METHODOLOGY Company Date Rec. Company Date Rec. Company Date Rec. AMGN 23/10/2013 Overweight CLSGR 28/03/2013 Hold TEVA 06/05/2013 Overweight AMPIM 26/11/2013 Buy MRK 31/07/2013 Underweight TEVA 06/02/2013 Marketweight BAYNGR 31/10/2013 Marketweight SANFP 02/10/2013 Marketweight TEVA 05/12/2012 Overweight BAYNGR 08/03/2013 Underweight SANFP 04/09/2013 TEVA 03/12/2012 Marketweight Overview of our ratings You will find the history of rating regarding recommendation changes as well as an overview of the breakdown in absolute and relative terms of our investment ratings on our website http://www.disclaimer.unicreditmib.eu/credit-research-rd/Recommendations_CR_e.pdf.
Note on the evaluation basis for interest-bearing securities: Recommendations relative to an index: For high grade names the recommendations are relative to the "iBoxx EUR Benchmark" index family, for sub investment grade names the recommendations are relative to the "iBoxx EUR High Yield" index family. Marketweight: We recommend having the same portfolio exposure in the name as the respective iBoxx index. We expect that the average total return of the instruments of the issuer is equal to the total return of the index. Overweight: We recommend having a higher portfolio exposure in the name as the respective iBoxx index. We expect that the average total return of the instruments of the issuer is greater than the total return of the index. Underweight: We recommend having a lower portfolio exposure in the name as the respective iBoxx index. We expect that the average total return of the instruments of the issuer is less than the total return of the index. Outright recommendations: Hold: We recommend holding the respective instrument for investors who already have exposure. We expect that the total return of the instruments of the issuer is equal to the yield. Buy: We recommend buying the respective instrument for investors who already have exposure. We expect that the total return of the instruments of the issuer is greater than the yield. Sell: We recommend selling the respective instrument for investors who already have exposure. We expect that the total return of the instruments of the issuer is less than the yield. We employ three further categorizations for interest-bearing securities in our coverage: Restricted: A recommendation and/or financial forecast is not disclosed owing to compliance or other regulatory considerations such as a blackout period or a conflict of interest. Coverage in transition: Due to changes in the research team, the disclosure of a recommendation and/or financial information are temporarily suspended. The interest-bearing security remains in the research universe and disclosures of relevant information will be resumed in due course. Not rated: Suspension of coverage. Trading recommendations for fixed-interest securities mostly focus on the credit spread (yield difference between the fixed-interest security and the relevant government bond or swap rate) and on the rating views and methodologies of recognized agencies (S&P, Moody’s, Fitch). Depending on the type of investor, investment ratings may refer to a short period or to a 6 to 9-month horizon. Please note that the provision of securities services may be subject to restrictions in certain jurisdictions. You are required to acquaint yourself with local laws and restrictions on the usage and the availability of any services described herein. The information is not intended for distribution to or use by any person or entity in any jurisdiction where such distribution would be contrary to the applicable law or provisions. Coverage Policy A list of the companies covered by UniCredit Bank is available upon request.
November 2013 Credit Research
Sector Report Health Care
UniCredit Research page 91
Frequency of reports and updates It is intended that each of these companies be covered at least once a year, in the event of key operations and/or changes in the recommendation. SIGNIFICANT FINANCIAL INTEREST: UniCredit Bank and/or a company affiliated (pursuant to relevant national law) with them regularly trade shares of the analyzed company. UniCredit Bank and/or a company affiliated may hold significant open derivative positions on the stocks of the company which are not delta-neutral. Analyses may refer to one or several companies and to the securities issued by them. In some cases, the analyzed issuers have actively supplied information for this analysis. ANALYST DECLARATION The author’s remuneration has not been, and will not be, geared to the recommendations or views expressed in this study, neither directly nor indirectly. ORGANIZATIONAL AND ADMINISTRATIVE ARRANGEMENTS TO AVOID AND PREVENT CONFLICTS OF INTEREST To prevent or remedy conflicts of interest, UniCredit Bank has established the organizational arrangements required from a legal and supervisory aspect, adherence to which is monitored by its compliance department. Conflicts of interest arising are managed by legal and physical and non-physical barriers (collectively referred to as “Chinese Walls”) designed to restrict the flow of information between one area/department of UniCredit Bank and another. In particular, Investment Banking units, including corporate finance, capital market activities, financial advisory and other capital raising activities, are segregated by physical and non-physical boundaries from Markets Units, as well as the research department. Disclosure of publicly available conflicts of interest and other material interests is made in the research. Analysts are supervised and managed on a day-to-day basis by line managers who do not have responsibility for Investment Banking activities, including corporate finance activities, or other activities other than the sale of securities to clients. ADDITIONAL REQUIRED DISCLOSURES UNDER THE LAWS AND REGULATIONS OF JURISDICTIONS INDICATED Notice to Australian investors This publication is intended for wholesale clients in Australia subject to the following: UniCredit Bank AG and its branches do not hold an Australian Financial Services licence but are exempt from the requirement to hold a licence under the Act in respect of the financial services to wholesale clients. UniCredit Bank AG and its branches are regulated by BaFin under German laws, which differ from Australian laws. This document is only for distribution to wholesale clients as defined in Section 761G of the Corporations Act. UniCredit Bank AG and its branches are not Authorised Deposit Taking Institutions under the Banking Act 1959 and are not authorised to conduct a banking business in Australia. Notice to Austrian investors This document does not constitute or form part of any offer for sale or subscription of or solicitation of any offer to buy or subscribe for any securities and neither this document nor any part of it shall form the basis of, or be relied on in connection with or act as an inducement to enter into, any contract or commitment whatsoever. This document is confidential and is being supplied to you solely for your information and may not be reproduced, redistributed or passed on to any other person or published, in whole or part, for any purpose. Notice to Czech investors This report is intended for clients of UniCredit in the Czech Republic and may not be used or relied upon by any other person for any purpose. Notice to Italian investors This document is not for distribution to retail clients as defined in article 26, paragraph 1(e) of Regulation n. 16190 approved by CONSOB on 29 October 2007. In the case of a short note, we invite the investors to read the related company report that can be found on UniCredit Research website www.research.unicreditgroup.eu. Notice to Japanese investors This document does not constitute or form part of any offer for sale or subscription for or solicitation of any offer to buy or subscribe for any securities and neither this document nor any part of it shall form the basis of, or be relied on in connection with or act as an inducement to enter into, any contract or commitment whatsoever. Notice to Polish investors This document is intended solely for professional clients as defined in Art. 3 39b of the Trading in Financial Instruments Act of 29 July 2005. The publisher and distributor of the recommendation certifies that it has acted with due care and diligence in preparing the recommendation, however, assumes no liability for its completeness and accuracy. Notice to Russian investors As far as we are aware, not all of the financial instruments referred to in this analysis have been registered under the federal law of the Russian Federation "On the Securities Market" dated 22 April 1996, as amended (the "Law"), and are not being offered, sold, delivered or advertised in the Russian Federation. This analysis is intended for qualified investors, as defined by the Law, and shall not be distributed or disseminated to a general public and to any person, who is not a qualified investor. Notice to Turkish investors Investment information, comments and recommendations stated herein are not within the scope of investment advisory activities. Investment advisory services are provided in accordance with a contract of engagement on investment advisory services concluded with brokerage houses, portfolio management companies, non-deposit banks and the clients. Comments and recommendations stated herein rely on the individual opinions of the ones providing these comments and recommendations. These opinions may not suit your financial status, risk and return preferences. For this reason, to make an investment decision by relying solely on the information stated here may not result in consequences that meet your expectations. Notice to UK investors This communication is directed only at clients of UniCredit Bank who (i) have professional experience in matters relating to investments or (ii) are persons falling within Article 49(2)(a) to (d) (“high net worth companies, unincorporated associations, etc.”) of the United Kingdom Financial Services and Markets Act 2000 (Financial Promotion) Order 2005 or (iii) to whom it may otherwise lawfully be communicated (all such persons together being referred to as “relevant persons”). This communication must not be acted on or relied on by persons who are not relevant persons. Any investment or investment activity to which this communication relates is available only to relevant persons and will be engaged in only with relevant persons. Notice to U.S. investors This report is being furnished to U.S. recipients in reliance on Rule 15a-6 ("Rule 15a-6") under the U.S. Securities Exchange Act of 1934, as amended. Each U.S. recipient of this report represents and agrees, by virtue of its acceptance thereof, that it is such a "major U.S. institutional investor" (as such term is defined in Rule 15a-6) and that it understands the risks involved in executing transactions in such securities. Any U.S. recipient of this report that wishes to discuss or receive additional information regarding any security or issuer mentioned herein, or engage in any transaction to purchase or sell or solicit or offer the purchase or sale of such securities, should contact a registered representative of UniCredit Capital Markets, LLC. Any transaction by U.S. persons (other than a registered U.S. broker-dealer or bank acting in a broker-dealer capacity) must be effected with or through UniCredit Capital Markets. The securities referred to in this report may not be registered under the U.S. Securities Act of 1933, as amended, and the issuer of such securities may not be subject to U.S. reporting and/or other requirements. Available information regarding the issuers of such securities may be limited, and such issuers may not be subject to the same auditing and reporting standards as U.S. issuers. The information contained in this report is intended solely for certain "major U.S. institutional investors" and may not be used or relied upon by any other person for any purpose. Such information is provided for informational purposes only and does not constitute a solicitation to buy or an offer to sell any securities under the Securities Act of 1933, as amended, or under any other U.S. federal or state securities laws, rules or regulations. The investment opportunities discussed in this report may be unsuitable for certain investors depending on their specific investment objectives, risk tolerance and financial position. In jurisdictions where UniCredit Capital Markets is not registered or licensed to trade in securities, commodities or other financial products, transactions may be executed only in accordance with applicable law and legislation, which may vary from jurisdiction to jurisdiction and which may require that a transaction be made in accordance with applicable exemptions from registration or licensing requirements. The information in this publication is based on carefully selected sources believed to be reliable, but UniCredit Capital Markets does not make any representation with respect to its completeness or accuracy. All opinions expressed herein reflect the author’s judgment at the original time of publication, without regard to the date on which you may receive such information, and are subject to change without notice. UniCredit Capital Markets may have issued other reports that are inconsistent with, and reach different conclusions from, the information presented in this report. These publications reflect the different assumptions, views and analytical methods of the analysts who prepared them. Past performance should not be taken as an indication or guarantee of future performance, and no representation or warranty, express or implied, is provided in relation to future performance. UniCredit Capital Markets and any company affiliated with it may, with respect to any securities discussed herein: (a) take a long or short position and buy or sell such securities; (b) act as investment and/or commercial bankers for issuers of such securities; (c) act as market makers for such securities; (d) serve on the board of any issuer of such securities; and (e) act as paid consultant or advisor to any issuer. The information contained herein may include forward-looking statements within the meaning of U.S. federal securities laws that are subject to risks and uncertainties. Factors that could cause a company’s actual results and financial condition to differ from expectations include, without limitation: political uncertainty, changes in general economic conditions that adversely affect the level of demand for the company’s products or services, changes in foreign exchange markets, changes in international and domestic financial markets and in the competitive environment, and other factors relating to the foregoing. All forward-looking statements contained in this report are qualified in their entirety by this cautionary statement This document may not be distributed in Canada.
November 2013 Credit Research
Sector Report Health Care
UniCredit Research page 92
UniCredit Research* Michael Baptista Global Head of CIB Research +44 207 826-1328 [email protected]
Dr. Ingo Heimig Head of Research Operations +49 89 378-13952 [email protected]
Credit Research
Luis Maglanoc, CFA, Head +49 89 378-12708 [email protected]
Credit Strategy & Structured Credit Research
Dr. Philip Gisdakis, Head Credit Strategy +49 89 378-13228 [email protected]
Dr. Christian Weber, CFA, Deputy Head Credit Strategy +49 89 378-12250 [email protected]
Dr. Tim Brunne Quantitative Credit Strategy +49 89 378-13521 [email protected]
Markus Ernst Credit Strategy & Structured Credit +49 89 378-14213 [email protected]
Dr. Stefan Kolek EEMEA Corporate Credits & Strategy +49 89 378-12495 [email protected]
Manuel Trojovsky Credit Strategy & Structured Credit +49 89 378-14145 [email protected]
Financials Credit Research
Franz Rudolf, CEFA, Head Covered Bonds +49 89 378-12449 [email protected]
Valentina Stadler, Deputy Head Sub-Sovereigns & Agencies +49 89 378-16296 [email protected]
Florian Hillenbrand, CFA Covered Bonds +49 89 378-12961 [email protected]
Dr. Tilo Höpker Banks +49 89 378-12960 [email protected]
Luis Maglanoc, CFA Regulatory & Accounting Service +49 89 378-12708 [email protected]
Natalie Tehrani Monfared Regulatory & Accounting Service +49 89 378-12242 [email protected]
Emanuel Teuber Banks, Financial Services, Insurance +49 89 378-14245 [email protected]
Dr. Claudia Vortmüller Banks +49 89 378-12429 [email protected]
Corporate Credit Research
Stephan Haber, CFA, Co-Head Telecoms, Technology +49 89 378-15192 [email protected]
Dr. Sven Kreitmair, CFA, Co-Head Automotive & Mobility +49 89 378-13246 [email protected]
Jana Arndt, CFA Basic Resources, Industrial G&S, Construction & Materials +49 89 378-13211 [email protected]
Christian Aust, CFA Industrial Transportation, Media, Pulp & Paper +49 89 378-12806 [email protected]
Olga Fedotova Russia/CIS (Banks, Oil & Gas, Basic Resources, Telecoms) +44 207 826-1376 [email protected]
Dr. Manuel Herold Consumers, Oil & Gas +49 89 378-12650 [email protected]
Max Huefner, CFA Chemicals, Aerospace & Defense, Packaging +49 89 378-13212 [email protected]
Susanne Reichhuber Utilities +49 89 378-13247 [email protected]
Alexander Rozhetskin Russia/CIS (Banks, Oil & Gas, Basic Resources, Telecoms) +44 207 826-7953 [email protected]
Dr. Silke Stegemann, CEFA Health Care & Pharma, Food & Beverage, Tobacco +49 89 378-18202 [email protected]
Publication Address
UniCredit Research Corporate & Investment Banking UniCredit Bank AG Arabellastrasse 12 D-81925 Munich Tel. +49 89 378-18927
Bloomberg UCCR Internet www.research.unicreditgroup.eu
*UniCredit Research is the joint research department of UniCredit Bank AG (UniCredit Bank), UniCredit Bank AG London Branch (UniCredit Bank London), UniCredit Bank AG Milan Branch (UniCredit Bank Milan), UniCredit Bank AG Vienna Branch (UniCredit Bank Vienna), UniCredit Bulbank, Zagrebačka banka d.d., UniCredit Bank Czech Republic (UniCredit Bank Czechia), Bank Pekao, ZAO UniCredit Bank Russia (UniCredit Russia), UniCredit Bank Slovakia a.s. (UniCredit Slovakia), UniCredit Tiriac Bank (UniCredit Tiriac).