Embed Size (px)
Citation preview
Journal of Marine Systems 77 (2009) 1–20
Contents lists available at ScienceDirect
Journal of Marine Systems
j ourna l homepage: www.e lsev ie r.com/ locate / jmarsys
Seasonal and interannual variability of cross-shelf transports of chlorophyllin the Gulf of Mexico
Benjamín Martínez-López ⁎, Jorge Zavala-HidalgoCentro de Ciencias de la Atmósfera, Universidad Nacional Autónoma de México, Circuito Exterior, Ciudad Universitaria, C.P. 04510, México D.F., Mexico
a r t i c l e i n f o
⁎ Corresponding author.E-mail address: [email protected] (B. M
0924-7963/$ – see front matter © 2008 Elsevier B.V.doi:10.1016/j.jmarsys.2008.10.002
a b s t r a c t
Article history:Received 20 December 2007Received in revised form 29 September 2008Accepted 1 October 2008Available online 17 October 2008
The seasonal and interannual variability of offshore cross-shelf transports of chlorophyll-richwaters in the Gulf of Mexico is studied using Level-3,monthly SeaWiFS data andmonthly NCEP/NCAR-Reanalysis winds for the period September 1997–August 2007. Offshore cross-shelftransports of chlorophyll-richwaters have a seasonal cyclemainlymodulated by the componentof the wind field along the coast. These transports are basically located at three regions:southwest of the Texas–Louisiana (LATEX) Shelf, the southern Bay of Campeche, and southeastof the Mississippi River mouth.Southwest of the LATEX Shelf and in the southern Bay of Campeche, the confluence of seasonalalong-coast currents, produced by the convergence of the seasonal along-coast wind stresscomponent, induces offshore cross-shelf transport of chlorophyll-rich waters, with maximumvalues of chlorophyll-a concentration occurring at these locations during May and October–November, respectively. On the slope, southeast of the Mississippi River mouth, the seasonalmaximumof chlorophyll-a concentration is observed in July due to the prevailing southwesterlywinds during this month.A large fraction of the interannual variability of the offshore cross-shelf transports ofchlorophyll-rich waters in the southern Bay of Campeche is explained by anomalies of theconvergence of the along-coast wind stress component. On the southwestern LATEX Shelf, inaddition to this process, cyclonic and anticyclonic eddies reaching this regionmay contribute tothe interannual variability by shifting the location of the offshore cross-shelf transports.
© 2008 Elsevier B.V. All rights reserved.
Keywords:Gulf of MexicoCross-shelf transportsChlorophyllAlong-coast wind stressWind-driven coastal currentsCoastal currents convergence
1. Introduction
In many regions of the ocean, chlorophyll-a (hereafterreferred to as Chl-a) concentration, a measure of phytoplank-ton biomass, is strongly dependant on ocean dynamics. Majorphysical processes affecting the distribution and abundanceof oceanic nutrients, and hence of Chl-a, are for example riverand estuarine plumes, the vertical mixing due to theentrainment associated with the deepening of the mixedlayer, upwelling induced by a positivewind stress curl, coastalupwelling, and advection of nutrient-rich waters.
The near-surface circulation in the deep regions of the Gulfof Mexico (GoM) is dominated by the energetic Loop Current
artínez-López).
All rights reserved.
and its associated large anticyclonic eddies. The widecontinental shelves of the GoM are dynamically isolatedfrom the deep ocean circulation by the shelf break. Thenorthern GoM shelves are influenced by the freshwaterdischarge and nutrient load of the Mississippi–AtchafalayaRiver system, which is a primary source of freshwater andnutrients into the upper layers of the GoM (Dunn, 1996).Lohrenz et al. (1997) showed a relationship between annualand interannual changes in nutrient fluxes from the Mis-sissippi River and temporal variations in primary productionin the adjacent coastal waters. Qian et al. (2003) showed thatphytoplankton biomass on the northeastern GoM continentalmargin, in particular the area of the Mississippi River Delta, islargely controlled by the magnitude and timing of the freshwater outflows from the Mississippi River. In addition toriverine effects, the nearshore primary production is also

2 B. Martínez-López, J. Zavala-Hidalgo / Journal of Marine Systems 77 (2009) 1–20
strongly influenced by the Loop Current andmesoscale eddiesrecurrently affecting the circulation in the northeastern GoM(Vukovich and Crissman, 1986; Müller-Karger et al., 1991;Toner et al., 2003).
Along the shelves of the Mexican States of Tamaulipas,Veracruz, and Tabasco the main contributions to the fresh-water input come from the Pánuco, Papaloapan, Coatzacoal-cos, and Grijalva–Usumacinta rivers. The interaction andexchange of mass and water properties between the shelvesand the deep regions of the GoM play an essential role in theredistribution of nutrients.
In theGoM, twoprincipalmechanisms havebeenproposedto generate offshore cross-shelf transports: the interaction ofeddies with the slope (Müller-Karger et al., 1991; Biggs andMüller-Karger, 1994; Toner et al., 2003) and the confluence ofalong-shelf currents that produces cross-shelf transports(Cochrane and Kelly, 1986; Zavala-Hidalgo et al., 2003).Ohlmann et al. (2001) used surface current velocities derivedfromsatellite altimetry to identify regions of pronounced eddyenergy south of the Mississippi outflow, south of the Texas–Louisiana Shelf (hereafter referred to as LATEX Shelf), and inthe northwest and northeast corners of the GoM. Their resultsalso suggest that gulf eddies promote cross-shore flows. Theinteraction of eddies with the slope does not have an annualperiodicity in itself. Eddies, however, mostly advect outer-shelf waters whose chlorophyll content has a seasonality,mainly determined by the shelf circulation, which can thenimpart a seasonality to the offshore chlorophyll transportassociated with this process (Morey et al., 2003b, 2005).
Cochrane and Kelly (1986) and Zavala-Hidalgo et al. (2003)showed that the along-coast currents in the GoM are mainlyproduced by the along-coast wind stress component and,because of the concave shape of the GoM, there are regionswhere this component converges, generating confluences ofthe along-coast currents and hence offshore cross-shelftransports. The along-coast currents in the GoM have aseasonal variability. On the Tamaulipas-Veracruz (TAVE) shelf,currents are downcoast (in the direction that a coastal Kelvinwave travels in the northern hemisphere, with the coast tothe right of the flow) during autumn and winter, while duringspring and summer they are upcoast (with the coast to the leftof the flow). During autumn and winter the current goes intothe southernmost part of the Bay of Campeche, where itmeets with a current moving in the opposite direction. Thisconvergence generates offshore cross-shelf transports. Thereare few observations of currents on the TAVE shelf but drifterobservations are consistent with these patterns (DiMarcoet al., 2005; Vázquez de la Cerda et al., 2005). During Apriland May, the coastal current reverses along the TAVE shelf andmeets a downcoast coastal current running southward alongthe Texas–Louisiana shelf (hereafter referred to as LATEXShelf), favoring offshore cross-shelf transports in the con-fluence region (Zavala-Hidalgo et al., 2003).
Another region of important cross-shelf transports islocated southeast of the Mississippi River mouth. Thesetransports also have an annual cycle with peak valuesassociated with the seasonal shift to upwelling favorablewinds in the northwestern GoM during July (Morey et al.,2003a, 2005; Walker et al., 2005).
It has been proposed that cross-shelf transports due to theconfluence of along-coast currents at both the Bay of
Campeche and the LATEX Shelf contribute, in addition tothe interaction of eddies with the slope, to the observedenhancement of phytoplankton at the shelf break of theseregions (Zavala-Hidalgo et al., 2003; Morey et al., 2005).
In this paper, the seasonal and interannual variability ofoffshore cross-shelf transports of chlorophyll-rich waters inthe GoM, observed during the Sea-WiFS era, is studied basedon the analysis of monthly maps of Chl-a concentrationanomalies relative to the long-term monthly means, withemphasis on the seasonal and interannual variability of Chl-aconcentration along the shelf break (200 m isobath) and theslope (1000 m isobath). The relation between the confluenceof coastal currents and cross-shelf Chl-a transports in thesouthern LATEX Shelf and in the southernmost region of theGoM is analyzed by correlation tests between the conver-gence of the along-coast wind stress component and Chl-aover the shelf break and the slope. It is shown that most of theseasonal and interannual variability of Chl-a in the regionswith dominant offshore cross-shelf transports of Chl-a isexplained by the seasonal and interannual variability of thealong-coast wind stress component, which has a highcorrelation with the coastal currents in the GoM. The strengthof the coupling between the along-coast wind stress and Chl-aconcentration is supported by the results of a singular valuedecomposition analysis performed on the temporal cross-covariance matrix of these variables.
2. Data and methods
In September of 1997, NASA launched the Sea-ViewingWide-Field-of-View Sensor (SeaWiFS) satellite whichmarkedthe beginning of a new era in ocean research. SeaWiFS hasprovided multi-year global chlorophyll observations fromspace (McClain et al., 1998) that allow the estimation of themean state of biological components in the global ocean aswell as their spatial and temporal variability. Satellite dataused in this study are the monthly SeaWiFS Level-3 StandardMapped Images of chlorophyll and their climatologies fromthe Goddard Distributed Active Archive Center at the NASA/Goddard Space Flight Center for the period September 1997–August 2007. Each image is a byte-valued, two-dimensionalarray of an equidistant cylindrical projection of the globewitha pixel resolution of approximately 0.088 degrees in bothlatitude and longitude. Monthly averaged maps of Chl-aconcentrationwere computed covering the region 18° N–30.5°N, 98° W–80.5° W. Monthly anomalies relative to the long-term monthly means and the annual mean were thencomputed. Due to the large range of anomaly values, alogarithmic transformation was used to plot them (bothpositive and negative anomaly values). This kind of plottinghelps to get a better visualization of the chlorophyll anomalies(a detailed description of themethod is given in the Appendix).Hovmöller (space-time) diagrams of chlorophyll and itsrespective anomaly along the 200 and 1000 m isobaths werealso analyzed (see Fig. 1).
NASA has implemented standard processing algorithms toimprove the estimation of chlorophyll from SeaWiFS in thecoastal zone (Stumpf et al., 2003a). The standard SeaWiFSalgorithm for chlorophyll estimation can lead to largeuncertainties in river influenced areas due to the presenceof dissolved organic matter, suspended particulate matter,
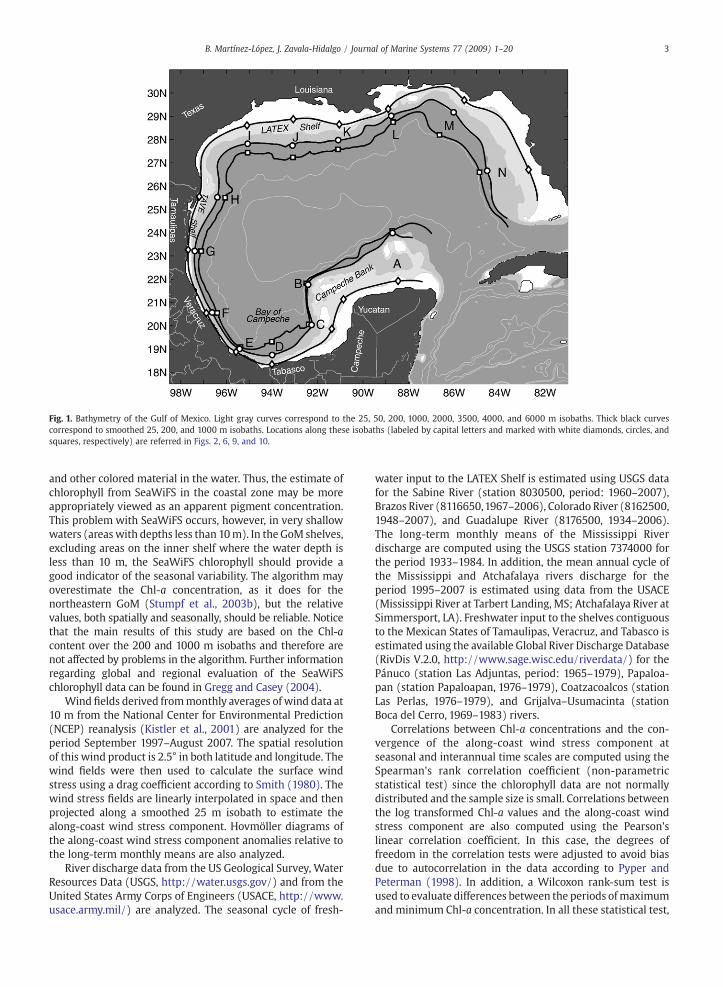
Fig. 1. Bathymetry of the Gulf of Mexico. Light gray curves correspond to the 25, 50, 200, 1000, 2000, 3500, 4000, and 6000 m isobaths. Thick black curvescorrespond to smoothed 25, 200, and 1000 m isobaths. Locations along these isobaths (labeled by capital letters and marked with white diamonds, circles, andsquares, respectively) are referred in Figs. 2, 6, 9, and 10.
3B. Martínez-López, J. Zavala-Hidalgo / Journal of Marine Systems 77 (2009) 1–20
and other colored material in the water. Thus, the estimate ofchlorophyll from SeaWiFS in the coastal zone may be moreappropriately viewed as an apparent pigment concentration.This problem with SeaWiFS occurs, however, in very shallowwaters (areaswith depths less than 10m). In the GoM shelves,excluding areas on the inner shelf where the water depth isless than 10 m, the SeaWiFS chlorophyll should provide agood indicator of the seasonal variability. The algorithm mayoverestimate the Chl-a concentration, as it does for thenortheastern GoM (Stumpf et al., 2003b), but the relativevalues, both spatially and seasonally, should be reliable. Noticethat the main results of this study are based on the Chl-acontent over the 200 and 1000 m isobaths and therefore arenot affected by problems in the algorithm. Further informationregarding global and regional evaluation of the SeaWiFSchlorophyll data can be found in Gregg and Casey (2004).
Wind fields derived frommonthly averages of wind data at10 m from the National Center for Environmental Prediction(NCEP) reanalysis (Kistler et al., 2001) are analyzed for theperiod September 1997–August 2007. The spatial resolutionof this wind product is 2.5° in both latitude and longitude. Thewind fields were then used to calculate the surface windstress using a drag coefficient according to Smith (1980). Thewind stress fields are linearly interpolated in space and thenprojected along a smoothed 25 m isobath to estimate thealong-coast wind stress component. Hovmöller diagrams ofthe along-coast wind stress component anomalies relative tothe long-term monthly means are also analyzed.
River discharge data from the US Geological Survey, WaterResources Data (USGS, http://water.usgs.gov/) and from theUnited States Army Corps of Engineers (USACE, http://www.usace.army.mil/) are analyzed. The seasonal cycle of fresh-
water input to the LATEX Shelf is estimated using USGS datafor the Sabine River (station 8030500, period: 1960–2007),Brazos River (8116650,1967–2006), Colorado River (8162500,1948–2007), and Guadalupe River (8176500, 1934–2006).The long-term monthly means of the Mississippi Riverdischarge are computed using the USGS station 7374000 forthe period 1933–1984. In addition, the mean annual cycle ofthe Mississippi and Atchafalaya rivers discharge for theperiod 1995–2007 is estimated using data from the USACE(Mississippi River at Tarbert Landing, MS; Atchafalaya River atSimmersport, LA). Freshwater input to the shelves contiguousto the Mexican States of Tamaulipas, Veracruz, and Tabasco isestimated using the available Global River Discharge Database(RivDis V.2.0, http://www.sage.wisc.edu/riverdata/) for thePánuco (station Las Adjuntas, period: 1965–1979), Papaloa-pan (station Papaloapan, 1976–1979), Coatzacoalcos (stationLas Perlas, 1976–1979), and Grijalva–Usumacinta (stationBoca del Cerro, 1969–1983) rivers.
Correlations between Chl-a concentrations and the con-vergence of the along-coast wind stress component atseasonal and interannual time scales are computed using theSpearman's rank correlation coefficient (non-parametricstatistical test) since the chlorophyll data are not normallydistributed and the sample size is small. Correlations betweenthe log transformed Chl-a values and the along-coast windstress component are also computed using the Pearson'slinear correlation coefficient. In this case, the degrees offreedom in the correlation tests were adjusted to avoid biasdue to autocorrelation in the data according to Pyper andPeterman (1998). In addition, a Wilcoxon rank-sum test isused to evaluate differences between the periods ofmaximumand minimum Chl-a concentration. In all these statistical test,

Fig. 2. Seasonal cycle of the along-coast wind component, computed over a smoothed 25 m isobath. Positive values indicate downwelling favorable winds andnegative values upwelling favorable winds. Letters along the top abscissa indicate locations as specified in Fig. 1. Black arrows indicate convergence zones.
4 B. Martínez-López, J. Zavala-Hidalgo / Journal of Marine Systems 77 (2009) 1–20
the results are considered statistically significant when theprobability value (P)b0.05.
Finally, a Maximum Covariance Analysis is performed onthe temporal cross-covariance matrix of the along-coast windstress and Chl-a concentration to identify spatial patters thatexplain as much as possible of the mean-squared temporalcovariance between the two fields (Bretherton et al., 1992;Wallace et al., 1992; Von Storch and Zwiers, 1999). MaximumCovariance Analysis produces two sets (left and right) ofsingular vectors along with a set of singular values. Therelevant property of these singular vectors is that theymaximize covariance and therefore we call them MaximumCovariance Patterns (MCP) (Von Storch and Zwiers, 1999).The expansion coefficients for each variable are computed byprojecting the MCP onto the original data. The two MCPassociated with the largest singular value maximizes thecovariance (first mode). The two MCP associated with thesecond largest singular value (orthogonal to the first pair)maximizes the covariability that remains in the original dataafter subtracting the contribution of the first mode, and so on.The correlation coefficient between the time series for eachmode quantifies the strength of the coupledMCP described bythat mode.
3. Seasonal variability
3.1. Wind stress field
Along-shelf currents on the western and southern shelvesof the GoM are mainly wind driven, with the flow directionbeing determined by the along-coast wind stress component,which, in turn, depends on both the concavity of the westernGoM coastline and the orientation of the wind field relative tothe littoral (Cochrane and Kelly, 1986; Nowlin et al., 1998; Choet al., 1998; Zavala-Hidalgo et al., 2003; Nowlin et al., 2005).Seasonally, the along-coast wind stress component of theGoM has strong variability. From the northeastern Campeche
Bank to the southernmost part of the Bay of Campeche,favorable upwelling winds prevail throughout the year(Fig. 2). The largest variance is observed on the TAVE shelf,with upwelling favorable winds from April to August, peakingin July, and downwelling favorable winds from September toMarch. Along the northern GoM, easterly downwellingfavorable winds prevail most of the year, generating wind-driven coastal currents that advect most of the MississippiRiver discharge, suspended sediments, and nutrients onto theLATEX Shelf (Nowlin et al., 1998; Rabalais et al., 2001; Nowlinet al., 2005). During June and July, however, the along-coastwind stress component is upcoast in the northernGoM,whichgenerates a reversal in the coastal currents (Li et al., 1997;Nowlin et al., 1998; Wiseman and Sturges, 1999; Morey et al.,2003a) favoring eastward flow of the Mississippi River plumeandwind-driven coastal upwelling (Cochrane and Kelly,1986;Müller-Karger, 2000).
Two regions of strong convergence of the along-coastwindstress component have been identified. One is located at thesouthern part of the Bay of Campeche, with convergencefavorable winds prevailing from September through February,peaking slightly in October–November (Fig. 2, locations F toC). The other region is located at the southwestern LATEXShelf, with convergence favorable winds from March toAugust, peaking in May (Fig. 2, locations H to I). In this site,there is a convergence of the along-coastwinds in September–October but its spatial scale and intensity are small incomparison with those observed in April–May. These resultsare consistent with those, based on COADS data, reported byZavala-Hidalgo et al. (2003, 2006) and Morey et al. (2005).
3.2. River discharge
The regions with important cross-shelf transports areinfluenced by freshwater discharges from the Mississippi–Atchafalaya River system, the Texas rivers, and the rivers ofthe Mexican States of Tampico, Veracruz, and Tabasco. The

5B. Martínez-López, J. Zavala-Hidalgo / Journal of Marine Systems 77 (2009) 1–20
seasonal cycle of river discharge is different in these threeregions, which also influences the seasonality of the Chl-aconcentration on the shelves of the GoM. The climatologicalpeak of the Mississippi River discharge for the period 1933–1984 is observed in April, while the lowest flow occurs inSeptember (Fig. 3, upper panel). The annual cycles of theMississippi and Atchafalaya rivers discharge overlapping theSeaWiFS period (1995–2007) are also shown. The values fortheMississippi River discharge are similar for the two periods,with largest differences occurring during April, June, andDecember, which are within one standard deviation from themean of the 1933–1984 climatology. In the shorter period,however, the climatological peak occurs a month earlier thanthat in the longer period.
In the Texas shelf, the climatological peak of the total riveroutflow (including the rivers Sabine, Brazos, Colorado, andGuadalupe) is observed in March, a secondary peak occurs in
Fig. 3. Seasonal cycle of freshwater discharge for the Mississippi–AtchafalayaRiver system (upper panel), for the Texas rivers (middle panel), and for themain Mexican rivers (lower panel). See Section 2 for details.
May, and the lowest value is observed in August (Fig. 3,middle panel). When the river discharge climatology iscomputed using data for the period 1995–2006, the Marchpeak and the values from October to December are increasedmore than 20 percent, while the secondary peak in May iscompletely suppressed. In contrast, the climatogical peak ofthe total river outflow is observed in May when theclimatology is computed using data up to 1994. In theTamaulipas, Veracruz, and Tabasco shelves, freshwater inputsmostly come from Pánuco, Papaloapan, Coatzacoalcos, andGrijalva–Usumacinta rivers, with maximum monthly dis-charge in September–October (Fig. 3, lower panel).
3.3. Chlorophyll-a concentration
Considering their Chl-a content, the surface waters of theGoMcanbedivided in two regions: the oligotrophic deepwatersof its central part and the eutrophic coastal waters (Fig. 4, upperpanel). These two regions are approximately delimited by the1000m isobath, but there are three clear exceptions, namely theBay of Campeche, the region located off the southwestern LATEXShelf, and those located south and southeast of the MississippiRiver mouth. Over these regions, the Chl-a concentrations arelarger than those observed in the adjacentwaterswith depths of1000m. The seasonal cycle of Chl-a concentration averaged overareas representative of these localities of the GoM is shown inthe lower panels of Fig. 4.
In the surface layers of the deep Gulf, the highestconcentrations occur between December and February, andthe lowest concentrations between July and September. Thelow concentrations in summer are due to the high stability ofthe water column, while the large concentrations in winterare due to fertilization of surface layers via vertical mixinginduced by thermal convection (cooling) and stronger winds(Müller-Karger et al., 1991; Melo González et al., 2000;Zavala-Hidalgo et al., 2002). The variability of Chl-a concen-trations (estimated as the standard deviation) is rather smallin the deep regions of the GoM. Although the Chl-aconcentrations in the deep waters of the GoM are lowerthan those observed in the Bay of Campeche and over theslope of the southwestern LATEX Shelf, their seasonalevolutions are similar except for specific periods of the year.Significant peaks of Chl-a concentration are observed in theBay of Campeche and off the southwestern LATEX Shelf inNovember andMay, respectively, which exhibit high variabilityand are not observed in most of the deep waters of the GoM(Fig. 4, lower-left panel). The seasonal evolution of Chl-aconcentration over the region located southeast of theMississippi River mouth is different to the other regions (seelower-right panel of Fig. 4) due to the large Chl-a peakobserved in July off the Mississippi River mouth. Clearly, in theBay of Campeche, offshore of the southwestern LATEX Shelf,and southeast of the Mississippi River mouth there areadditional processes to those influencing the seasonal evolu-tion of Chl-a in the rest of the deep waters of the GoM.
Maps of the monthly anomalies of Chl-a concentrationrelative to the long-term annual mean help to better visualizeand interpret the spatial patterns associatedwith the seasonalevolution of chlorophyll in the GoM (Fig. 5). The seasonalevolution of chlorophyll is more or less synchronousthroughout the deep waters of the GoM, with the largest

Fig. 4. Annual mean of SeaWiFS chlorophyll-a concentration for the period 1997–2007 (upper panel). Chlorophyll values larger that 2 mg m−3 are plotted inbrown. The thick cyan lines are smoothed 200 and 1000 m isobaths. The white boxes indicate the region over which data are averaged to estimate the seasonalcycle of chlorophyll-a concentration. Deep water, LATEX Shelf, and Bay of Campeche Chl-a values are plotted in blue, green, and red, respectively. Shading denotes±one standard deviation of the Chl-a concentration values (lower-left panel). Values off the Mississippi River mouth are shown in the lower-right panel.
6 B. Martínez-López, J. Zavala-Hidalgo / Journal of Marine Systems 77 (2009) 1–20
positive anomalies in December–February, and the lowestnegative anomalies in July–August. Off the southwesternLATEX Shelf, high positive anomalies are observed in April–May, and low negative anomalies in July–August. In thesouthern part of the Bay of Campeche, high positiveanomalies of Chl-a are observed in October–November, andlow negative anomalies in April–May. The largest seasonalvariability of the Chl-a content in the deep gulf is seen in thenorthern GoM, where the influence of the Mississippi–Atchafalaya River system is evident. Finally, the onset and
development of spring upwelling off the northeast tip of theYucatan Peninsula is clearly visible.
The seasonal cycle of SeaWiFS chlorophyll along the 200misobath helps to visualize the seasonal evolution of Chl-aconcentration along the shelf break and slope regions of theGoM (Fig. 6, upper panel). The maximum values are foundnear the Mississippi River mouth and in the Bay of Campeche.Offshore of the Mississippi River mouth (location L in Fig. 1),Chl-a concentrations have the lowest values during Octoberand November. In December, the Chl-a concentration begins

Fig. 5. Monthly anomalies of Chl-a concentration (mg m−3) relative to the annual mean in the Gulf of Mexico.
7B. Martínez-López, J. Zavala-Hidalgo / Journal of Marine Systems 77 (2009) 1–20

Fig. 5 (continued).
8 B. Martínez-López, J. Zavala-Hidalgo / Journal of Marine Systems 77 (2009) 1–20

Fig. 6. Seasonal cycle of SeaWiFS Chl-a concentration along the 200m (upper panel) and 1000m (lower panel) isobaths in the Gulf of Mexico. Letters along the topabscissa indicate locations as specified in Fig. 1.
9B. Martínez-López, J. Zavala-Hidalgo / Journal of Marine Systems 77 (2009) 1–20
to increase, reaching its maximum in July. After the significantseasonal peak in July, a rapid decrease is observed.
Off the southern coast of Veracruz (location E in Fig. 1), anarrow region shows a broad peak of chlorophyll in July–October. In this region, the 200 m isobath is located very closeto the shoreline due to the narrowness of the shelf (see Fig. 1)and there may be stronger influence of local rivers (Papaloa-pan and Coatzacoalcos), which have minimum discharge inNovember–May and maximum discharge in June–October(see Fig. 3, lower panel). In front of the border of the States ofVeracruz and Tabasco (location D), which is the southernmostpart of the Bay of Campeche, a broad significant peak of Chl-ais observed in October–December. Another region withrelative large values of Chl-a is the southwestern LATEXShelf, between locations H and I, where a clear significant
seasonal signal is also evident withmaximumvalues in April–May and minimum values in August.
Along the 1000m isobath (Fig. 6, lower panel), chlorophyllin front of the Mississippi River mouth and in the Bay ofCampeche shows a similar seasonal evolution as thatobserved along the 200 m isobath, but with smaller values.Southeast of the Mississippi River mouth (L), the maximumand minimum chlorophyll values are also reached in July andNovember, respectively. Off the southern coast of Veracruz(site E, Fig. 1), the broad peak of chlorophyll during July–October is also present, but with lower values. In the southernBay of Campeche (site D in Fig. 1), a small broad peak isobserved in October–December. On the southwestern LATEXShelf (H–I), the maximum is reached in May, one month laterthan that observed along the 200 m isobath, and the

10 B. Martínez-López, J. Zavala-Hidalgo / Journal of Marine Systems 77 (2009) 1–20
minimum is also reached in August. In addition, an increase ofChl-a is clearly observed along the 1000 m isobath duringOctober.
3.4. Discussion of the seasonal variability
Results of the previous subsections indicate that in most ofthe deep GoM there is a Chl-a concentration minimum duringJune–August and a maximum in December–January. Thereare, however, three regions that have a different seasonalcycle: Off the southwestern LATEX Shelf, which has amaximum in May; on the Bay of Campeche, with a maximumin October–November; and southeast of the Mississippi Rivermouth, with a maximum in July. In this subsection we showthat these regions have high values of Chl-a concentrationdue to an increase of the cross-shelf transports induced by theseasonality of the shelf circulation and that of the riversdischarge.
In the southern part of the Bay of Campeche there is astrong convergence of the along-coast wind stress component
Fig. 7. Upper panels: Schematic representation of cross-shelf mass transport (blackCampeche (left) and the southwestern LATEX Shelf (right). Lower panels: Joint seasocomponent (dashed line) and Chl-a concentration (solid line) at the southern Baydenotes±one standard deviation of the Chl-a concentrations. Wind values are averlocated between the 200 and 1000 m isobaths (thick solid gray lines and dark gray
during autumn–winter, while in the southwestern LATEXShelf this convergence occurs in spring. It is important to keepin mind that the seasonal variability of the along-coastcurrents on the western and southern shelves of the GoM ismainly driven by the along-coast wind stress component(Cochrane and Kelly, 1986; Nowlin et al., 1998; Cho et al.,1998; Zavala-Hidalgo et al., 2003); for example, correlationslarger than 0.9 between the along-coast wind stress compo-nent and the along-coast currents on the TAVE shelf wereobtained by Zavala-Hidalgo et al. (2003). Fig. 7 shows aschematic of the confluence zones located at the Bay ofCampeche and the southwestern LATEX Shelf.
An estimate of the seasonal convergence of thewind stressfield in the southern Bay of Campeche is constructed bycomputing the difference of the averaged along-coastseasonal wind stress component between the western andeastern limbs of the confluence region (spatial averages alongthe sections marked by thick gray lines over the 25 m isobath,upper-left panel of Fig. 7). The seasonal evolution of the Chl-aconcentration in the southern Bay of Campeche, spatially
arrows) due to the convergence of mass along the southern part of the Bay ofnal evolution of a measure of the convergence of the along-coast wind stressof Campeche (left) and the southwestern LATEX Shelf (right). Gray shadingaged along sections of the 25 m isobath and chlorophyll values over regionsregions in the upper panels, respectively).

Fig. 8. Joint seasonal evolution of the along-coast wind component (dashedline) and Chl-a concentration (solid line) along the 200 m isobath off theMississippi River mouth. Gray shading denotes±one standard deviation ofthe Chl-a concentrations.Wind and chlorophyll values near of theMississippiRiver mouth are averaged along a section of the 25 m isobath and over aregion located between the 200 and 1000 m isobaths (thick solid gray lineand dark gray region in the upper-right panel of Fig. 7, respectively).
11B. Martínez-López, J. Zavala-Hidalgo / Journal of Marine Systems 77 (2009) 1–20
averaged over the dark gray region located between the shelfbreak and the slope (upper-left panel of Fig. 7), is correlatedwith the estimated seasonal wind stress convergence (Spear-man rank correlation, rrank=0.69, Pb0.02, N=12). ThePearson's correlation coefficient between the monthly valuesof thewind stress convergence and the log-transformed Chl-aconcentrations is r=0.40, with Pb0.04. In this case, however,120 monthly values are used and the degrees of freedom inthe correlation tests are adjusted to avoid bias due toautocorrelation in the data (Pb0.00001 before adjustment).Thus, the onset of the chlorophyll autumn bloom, about midSeptember, has a positive correlation with the strength of thewind-driven confluence of coastal currents in the southernBay of Campeche. In addition to the wind effect, bothanticyclonic and cyclonic eddies can contribute to the Chl-avariability. These eddies, however, seemnot to be crucial in theobserved seasonal variability, simply because eddies do notvary at a seasonal time scale. Therefore, our results suggestthat the seasonal peak of Chl-a concentration observed in thisregion has a large contribution of offshore cross-shelftransports of chlorophyll-rich waters induced by the seasonalconvergence of the along-shelf currents, which are mainlydriven by the along-shelf seasonal wind stress component.
In a simplified view of this cycle, a gradual accumulation ofnutrients brought by the local rivers, and a consequentincreased biological production, begins along the innersouthern TAVE shelf in June, when the local rivers dischargeincreases (see Fig. 5). In July–August, high Chl-a values areobserved along the southern TAVE shelf and along the coastsof Campeche and Yucatan. Coastal upwelled waters alongthese shelves are an additional source of nutrients since alongthe TAVE shelf upwelling favorablewinds prevail fromApril toAugust, while on the Campeche Bank favorable upwellingwinds prevail throughout the year (Zavala-Hidalgo et al.,2006). In September, the rivers discharge (Usumacinta,Coatzacoalcos, and Papaloapan rivers) reaches its maximumand most of the inner shelf of the region has high chlorophyllvalues. During this month, the coastal currents on the TAVEshelf reverse (Zavala-Hidalgo et al., 2003) and cross-shelftransports of chlorophyll-rich waters begin to be visible at thesouthern part of the Bay of Campeche (see Fig. 5). In October,the totally developed cross-shelf transports are evident.Finally, in November, a large part of the Bay of Campecheshows the maximum values of Chl-a concentration.
From December to January, there is a drop in Chl-aconcentration even though wind stress convergence remainsstrong fromOctober to February. The annual cycle of Usumacintariver discharge offers a plausible explanation. The maximumdischarge is observed in September–October (see lower panel ofFig. 3) and there is a large drop in the discharge from October toDecember, which, considering the one-or-two-months time lagbetween themaxima of river discharge and Chl-a concentration,could explain the seasonal drop in Chl-a concentration fromDecember to January. It is important to interpret these resultswith caution and consider that others factors, like both cyclonicand anticylonic eddies, could be important in the dynamic of thisregion. This topic, however, deserves a separate study.
In addition to the cycle described above, high Chl-a valuesbegin to be evident along the TAVE shelf during October (seeFig. 5). These seasonal high values are not caused by winddriven upwelling (the autumn climatological winds are down-
welling favorable in this region), nor by eddy edge upwelling(the eddy field is non-seasonal), and they are probably causedby the advection of old bloom biological material fromupstream (Lohrenz et al., 1997) and vertical mixing inducedbycold air outbreaks that reach deep into theGoM, affecting theTamaulipas, Veracruz, Campeche, and Yucatan shelves, wherethese events are commonly called nortes.
In a similar way, an estimate of the seasonal convergenceof the wind stress field on the Texas shelf is constructed bycomputing the difference of the averaged along-coastseasonal wind stress component between the southwesternLATEX Shelf and the northern TAVE shelf (spatial averagesalong the sections marked by thick gray lines over the 25 misobath, upper-right panel of Fig. 7). In this region, there is nota statistically significant correlation between the estimatedseasonal wind stress convergence and the seasonal evolutionof the Chl-a concentration (spatially averaged over the darkgray region located between the shelf break and the slope,upper-right panel of Fig. 7), neither in the seasonal analysisusing the Spearman's test nor by using the 120 monthlyvalues in the Pearson's test. There is, however, a positive,statistically significant correlation between these variables onthe shelf break from March to October (rrank=0.86, Pb0.01,N=8; r=0.40, Pb0.05, see lower-right panel of Fig. 7).
A reason for the lack of correlation when the full seasonalcycle is considered could be that the seasonal evolution ofChl-a concentration has an absolute maximum in spring and asecondary maximum in winter, but each one is related todifferent physical processes. High Chl-a values are observedalong the southwestern LATEX Shelf break from December toMay, peaking in May (see Fig. 5). During this period, wind-induced vertical mixing, thermal convection, and riverdischarge contribute to the fertilization of coastal waters. InMarch–May, the convergence of the along-coast windsgradually increase and induce cross-shelf transports ofchlorophyll-rich inner-shelf waters, which results in themaximum Chl-a concentration observed in deep regions

12 B. Martínez-López, J. Zavala-Hidalgo / Journal of Marine Systems 77 (2009) 1–20
next to the southern LATEX Shelf. Thus, the absolutemaximum of Chl-a in spring is associated with the confluenceprocess, while the secondary maximum is rather caused bythe wind-induced vertical mixing and thermal convectionassociated with cold air outbreaks and extra-tropical storms.
Although stronger winds in the northwestern GoM increasethe vertical mixing during winter, the along-coast windcomponent is spatially uniform and is rather weak along thesouthernTexas shelf duringDecember–January (see Fig. 2). As aconsequence, the estimated convergence of the along-coastwindcomponenthas its lowest values in this period,while Chl-aconcentration reaches a secondarymaximum,which lead to lowcorrelation between the strength of the confluence regionand Chl-a concentration when the 12 months are considered.There is a secondary small peak in the convergence of thewinds along the southwestern LATEX Shelf in October, whichis probably relatedwith the increase of Chl-a concentration onthe shelf break (along the 200m isobath) and the slope (alongthe 1000 m isobath) during September–October and October,respectively (see Fig. 6, locations H to I). Thismay be observedin the Chl-a values between locations H and I, which aremarkedly larger than those of the adjacent waters. This isparticularly evident at the slope.
Fig. 9. Hovmöller diagram of SeaWiFS chlorophyll anomaly (mg m−3) with respecLetters along the top abscissa indicate locations as specified in Fig. 1.
These results indicate that the seasonal evolution ofoffshore cross-shelf transports taking place in the twoidentified confluence zones in the GoM exert a major influenceon the observed seasonal evolution of Chl-a concentration. Inaddition to this process, cyclonic and anticyclonic eddiesreaching the southwestern LATEX Shelf may contribute to thevariability by shifting the location of the offshore cross-shelftransports. This contribution to the observed variability is,however, more evident in the interannual time scale, as isshown in the Section 4.
Near the Mississippi River mouth, the situation is morecomplex because, in addition to the seasonal wind field, otherphysical processes originating in the eastern part of the GoM,such as the Loop Current, its eddies, and Mississippi Riverplumes, have an impact on the magnitude and distribution ofchlorophyll (Lohrenz et al.,1999;Müller-Karger, 2000; Nowlinet al., 2000; Hu et al., 2003; Morey et al., 2003a; Walker et al.,2005). In this region, the along-coast wind stress componentis downwelling favorablemost of the year (see subsection 3.1),thus inhibiting the development of coastal upwelling andtrapping theMississippi River plume, its sediments, nutrients,and associated phytoplankton blooms on the inner shelf andwithin the clockwise gyre of the Louisiana Bight (Nowlin et al.,
t to the monthly climatology along the 200 m isobath in the Gulf of Mexico.

13B. Martínez-López, J. Zavala-Hidalgo / Journal of Marine Systems 77 (2009) 1–20
2000; Walker et al., 2005). During June–August, peaking inJuly, in regions located south of the mouth of the MississippiRiver, the low frequencyalong-coastwind stress component isupcoast, favoring wind-driven coastal upwelling and forcingeastward the Mississippi River plume (Müller-Karger, 2000;Morey et al., 2003a; Walker et al., 2005), inducing phyto-plankton growth and leading to high values of Chl-a.
Although the maximum of Mississippi River dischargeusually occurs during March–April (see Fig. 3) (Walker et al.,2005), the maximum of Chl-a concentration east of thedischarge region is observed in July, which coincides with thereversal of the prevailing winds, supporting the idea that thewind field is the dominant factor affecting the seasonalevolution of Chl-a concentration in this region. The jointseasonal evolution of the averaged along-coast wind stresscomponent and the spatially averaged Chl-a concentration overa region located offshore of theMississippi Rivermouth (spatialaverages along the section marked by the thick gray line andover the dark gray area in the upper-right panel of Fig. 7) showsa strong correlation between the two time series (Fig. 8, rrank=−0.89, Pb0.0001, N=12; r=−0.53, Pb0.003); indicatingthat the seasonal wind field plays, via eastward advection of
Fig. 10. Hovmöller diagram of monthly anomalies of the along-25 m isobath wind stlocations as specified in Fig. 1.
Mississippi River water and coastal upwelling, a major roleamong the processes that control the seasonal evolution of Chl-a concentration southeast of the Mississippi River mouth.
4. Interannual variability
4.1. Chlorophyll-a concentration
In the GoM, the year 1998 was more productive than theothers, as indicated by the time series of Chl-a concentrationanomalies along the 200 m isobath (Fig. 9). During January1998, the Chl-a concentration southeast of the MississippiRiver mouth reached values comparable to those observed ina typical summer, and during July 1998 the absolutemaximum of the entire record was reached. High Chl-a valuesare also observed from the Bay of Campeche to the TAVE shelfduring autumns 1998 and 1999.
Another period of anomalous Chl-a concentration hap-pened during most of the year 2000 when negativeanomalous values were observed over the whole northernGoM (Fig. 9). From the Bay of Campeche to the TAVE shelf,high values are normally observed in autumn–winter. During
ress component in the Gulf of Mexico. Letters along the top abscissa indicate

14 B. Martínez-López, J. Zavala-Hidalgo / Journal of Marine Systems 77 (2009) 1–20
2004, however, an outstanding feature of the Chl-a concen-tration is a large negative anomaly along the 200 m isobath,covering from the Bay of Campeche to the LATEX Shelf. Noticethat the large positive and negative Chl-a concentrationanomalies, observed respectively during 1998 and 2000, overthe northern shelf break of the GoM are coincident with thepeaks of the warm and cold phase of El Niño/SouthernOscillation (ENSO) event. Strong warm phase of ENSO wasobserved in 1997/98 followed by a cold phase, which startedto develop in the central-eastern Pacific in spring 1998 andcontinued with variable intensity until early 2001, peaking in
Fig. 11.Wind stress field for October 1999 (upper panel) and October 2004 (lower pavalues of the along-coast wind stress component. Notice the strong convergenceinterpretation of the references to colour in this figure legend, the reader is referre
winter 1999/2000. During the warm phase of an ENSO event,positive precipitation anomalies have been observed in theGoM, extending from October of the ENSO year to March ofthe following year (Ropelewski and Halpert, 1987). Inparticular, anomalously high Mississippi River discharge wasobserved during the ENSO event of 1997/98 (Müller-Karger,2000; Nowlin et al., 2000), which, in addition to botheastward winds and northward migration of an anticycloniceddy detached from the Loop Current, lead to high Chl-avalues in the northeastern GoM (Müller-Karger, 2000). In thecentral waters of the GoM, Melo González et al. (2000)
nel). The solid (dashed) black line in both panels indicates positive (negative)of the wind field over the southern Bay of Campeche in October 1999. (Ford to the web version of this article.)

Fig. 12. Joint interannual evolution of anomalies of a measure of the along-shelf wind convergence (solid line) and Chl-a concentration (dashed line).Upper panel: Autumn anomalies in the Bay of Campeche. Lower panel: April–June anomalies in the southwestern LATEX Shelf.
15B. Martínez-López, J. Zavala-Hidalgo / Journal of Marine Systems 77 (2009) 1–20
reported positive anomalies of pigment concentration duringthe winter months of the ENSO event of 1982/83, which wereassociated with strongmixing of the water column by higher-frequency stronger winds associated with cold fronts. Resultsregarding the ENSO-effect on the interannual variability ofchlorophyll in the GoM are analyzed by Zavala-Hidalgo andMartínez-López (manuscript in preparation).
4.2. Wind stress field
Time series of the along-coast wind stress componentanomalies relative to the long-term monthly means shownegative values over the whole northern GoM from May toDecember 1997 and during the first seven months of 1998,with larger negative anomalies occurring from May to July of1998 (Fig. 10). The 1997–1998 negative anomalies areassociated with a weakening of the westward, along-coastwind stress component observed throughout most of the yearin the northern GoM, and with the strengthening of theeastward component observed principally during July. Theseatmospheric conditions were favorable for coastal upwellingand eastward transport of the Mississippi River plume,leading to the positive Chl-a anomalies seen in 1998 in thisarea. These results are consistent with those of other studies(Müller-Karger, 2000; Nowlin et al., 2000) and show that theanomalous atmospheric conditions prevailing in the springand summer of 1998 induced upwelling as well as fertilizationof coastal waters via advection of nutrient-rich riverinewaters, which lead to the largest Chl-a values observed inthe entire record of SeaWiFS data for this region.
Along the coasts of Yucatan and Campeche, strongnegative anomalies of the along-coast wind stress componentare found during October–November of 1998 which favorcoastal upwelling over the Campeche Bank and strengthenthe confluence zone located in the southern part of the Bay ofCampeche. From August through November of 1998, apositive anomaly is observed on the TAVE shelf, whichinduces an increase in the strength of the western limb ofthe confluence zone on the southern Bay of Campeche. Oneyear later, a high positive anomaly is observed over the sameregion, while a negative anomaly is observed along the coastof Campeche. Notice that these anomalies of the along-coastwind stress component, which strengthen the confluencezone, are coincident with the high Chl-a values observed inthe Bay of Campeche during the autumns of 1998 and 1999.
On the other hand, positive anomalies of the along-coastwind stress component are observed over the Campeche Bankduring the autumns of 1997, 2002, and 2004. These anomaliesreduce both upwelling and the magnitude of the coastalcurrents along the Campeche Bank, reducing the supply ofnutrients to the surface waters and leading to a weakening ofthe eastern limb of the confluence zone, respectively. There-fore, there is less advection of nutrient-rich water into the Bayof Campeche. In addition, the western limb of the confluencezone is alsoweakened by the negative anomalies of the along-coast wind stress component observed on the TAVE shelfduring the same period. This is more evident in 2004, when astrong negative anomaly is observed from the southernmostpart of the Bay of Campeche to the Mississippi River mouthand a positive anomaly is observed over the Campeche Bank.Thus, both reduced upwelling conditions along the Campeche
Bank and a weakened confluence zone induce a decrease inthe Chl-a concentration, which explains in part the largenegative anomaly observed from the Campeche Bank to theLATEX Shelf during the second semester of 2004.
4.3. Discussion of the interannual variability
Results of the previous subsections indicate that there is arelation at interannual time scales between anomalies of thealong-coast wind stress component and of Chl-a concentra-tion. In this subsection we show that the mechanismresponsible for this behavior is the same discussed in thesubsection 3.4, namely the offshore cross-shelf transportsassociated with the confluence of coastal currents induced bythe convergence of the along-coast winds.
On average, autumn wind conditions are favorable forcurrents confluence in the southern part of the Campeche Bay(see Fig. 2). There are, however, interannual variability in thewind patterns that changes the strength of the confluence. Forexample, during autumn 1999, a high positive along-coastwind-stress anomaly covered the TAVE shelf and a negativeanomaly was observed along the coast of Campeche, as

16 B. Martínez-López, J. Zavala-Hidalgo / Journal of Marine Systems 77 (2009) 1–20
already noted in the Section 4.2. A plot of the wind stress fieldfor October 1999 helps us to get a better understanding of thespatial pattern associated with the strength of the confluencezone (upper panel of Fig. 11). The strong, wind-induced massconvergence over the southern part of the Bay of Campecheshould be more than evident from this figure, which iscoincident with the highest Chl-a concentration observed inthe Bay of Campeche. On the other hand, the wind stresspattern observed in October 2004 diminishes the conver-gence of mass in this region, leading to a decrease of Chl-aconcentration along the shelf break and the slope (lowerpanel of Fig. 11). Similar patterns are observed in the years1997 and 2002.
A measure of the interannual variation of convergence ofthe along-coast wind stress component in the southern partof the Campeche Bay during autumn (Oct–Nov), togetherwith the Chl-a concentration averaged over a region of thesouthern part of the Campeche Bay during the same period,were computed following the same procedure described insubsection 3.4 (upper-panel of Fig. 12). There is a highlysignificant interannual positive correlation (Spearman rankcorrelation, rrank=0.78, Pb0.0137, N=10) between thestrength of the confluence and the Chl-a concentration overthe entire record.
In contrast, the evaluation of the relationship between theconvergence of the along-coast wind stress componentduring April and the late spring mean (May–June) of area-averaged chlorophyll in the southwestern LATEX Shelf showonly a small, no significant interannual positive correlation
Fig. 13. Sea level anomalies for 9 May 2007 (left panel). SeaWiFS Chl-a con
(rrank=0.49, Pb0.15) between the strength of the confluenceand the Chl-a concentration over the entire record (lowerpanel of Fig. 12). A larger and more significant correlationcoefficient is obtained (rrank=0.79, Pb0.048) when the lastthree years of data (2005–2007) are omitted from thecomputation. An analysis of maps of the sea level anomalies(variations of the sea surface height with respect to a several-year mean or a mean sea surface) for the Gulf of Mexicoobtained from the AVISO Altimetry Group (http://www.aviso.oceanobs.com) shows that in each May of years 2005–2007 cyclonic eddies advect coastal water southwestward,where this chlorophyll-rich water meets with a current,associated with an anticyclonic eddy, moving in the oppositedirection (left-panel of Fig. 13), forming a tongue ofchlorophyll-rich waters directed towards the deep gulf(right-panel of Fig. 13). Therefore, the eddies reaching theLATEX region during May of these years shift the cross-shelftransports south of the site associated with the convergenceof the along-coast wind component. An analysis (not shown)of geostrophic currents also from the AVISO Altimetry Groupis consistent with our interpretation of the role of eddies inthe distribution of chlorophyll during this period.
These results show that the variability of the convergenceof mass induced by the interannual variability of the along-shelf ocean currents, driven by the along-coast wind stresscomponent, modulates a large fraction of the observedvariability of Chl-a concentration in the Bay of Campeche atinterannual time scales. This mechanism is also important inthe southwestern LATEX Shelf, although eddies reaching this
centration for the period 9 May 2007 to 16 May 2007 (right panel).

Fig. 14. First five Maximum Covariance Patterns that explain the mean-squared temporal covariance between the along-coast wind stress and Chl-a concentrationand their corresponding expansion coefficients.
17B. Martínez-López, J. Zavala-Hidalgo / Journal of Marine Systems 77 (2009) 1–20

18 B. Martínez-López, J. Zavala-Hidalgo / Journal of Marine Systems 77 (2009) 1–20
region may contribute to the interannual variability of Chl-aconcentration.
5. Maximum Covariance Analysis
In this section, a Maximum Covariance Analysis (MCA)analysis is performed on the temporal cross-covariancematrix of the along-coast wind stress and Chl-a concentrationto identify spatial patterns that explain the mean-squaredtemporal covariance between the two variables (thesepatterns are hereafter referred to as Maximum CovariancePatterns, MCP).
The first four MCP (MCP1 to MCP4) explain 75%, 12%, 7%,and 3%, respectively, of the total squared covariance (Fig. 14,upper panels). The correlation coefficients between theexpansion coefficients for each mode are 0.72, 0.65, 0.46,and 0.46. The along-coastwind stressMCP1 (Fig.14, upper-leftpanel) represents positive anomalies covering almost thewhole GoM coast, while the chlorophyll MCP1 representspositive anomalies in the southern Bay of Campeche andnegative anomalies in the northeastern Gulf (Fig. 14, upper-right panel). The largest positive anomalies of the along-coastwind stress described by the MCP1 are seen near theMississippi River mouth (location L), which are related tothe largest negative anomalies of Chl-a concentrationobserved in this region. Notice that the convergence of thealong-coast wind stress MCP1 in the southern Bay ofCampeche is related to the largest positive anomalies of Chl-a concentration observed in locations D–E. The correspondingexpansion coefficients show that in June 1998, the largestnegative anomaly of the along-coast wind stress observednear location L was in phasewith the largest positive anomalyof Chl-a concentration (Fig.14, lowerpanels). These expansioncoefficients also show that in September–December 1999, thelargest positive anomalies of the along-coast wind stressobserved on the southern Bay of Campeche are coincidentwith the largest positive anomalies of Chl-a concentration.
The along-coast wind stress MCP1 suggests a massconvergence in the southern Bay of Campeche. This, however,is more evident in the fourth pattern. The along-coast windstress MCP4 in the southern Bay of Campeche (which inducesa convergence ofmass) is related to positive anomalies of Chl-aconcentration observed between locations C–D. The corre-sponding expansion coefficients show high values of along-coast wind stress anomalies (favouring mass convergence)during October–November of years 1998 and 1999. Inparticular, the autumn maximum values of along-coast windstress MCP4 are observed in October–November 1999, whichcoincidewith themaximum positive Chl-a anomaly. The MCP4also induces a convergence of mass in the LATEX shelf(between locations H and I, which is related to small positiveanomalies of Chl-a concentration.
The relationship between convergence of mass in theLATEX shelf and positive Chl-a anomalies is more evident inthe MCP3. These patterns represent large negative (positive)anomalies of the along-coast wind stress in the TAVE(southwestern LATEX) shelf and positive Chl-a anomalies inthe southwestern LATEX shelf. The corresponding expansioncoefficients show that these patterns were highly relatedduring April–June of years 1999, 2001, and 2004, whichcoincides with the analysis of the previous section.
6. Concluding remarks
The seasonal cycle and interannual variability of cross-shelf transports of chlorophyll-rich waters along the Gulf ofMexico shelf break is studied analyzing the along-coast windcomponent and monthly SeaWiFS satellite data. The spatialdistribution of Chl-a concentration along the shelf breakshows that the highest values are southeast of the MississippiRiver mouth. High values are also found along the southernshelf break of Veracruz, the southern part of the Bay ofCampeche, and the southwestern LATEX Shelf.
Between the southwestern LATEX Shelf and the southernpart of the Bay of Campeche there is a 5–6months phase shift inthe timingof themaximumofChl-a concentration,withmaximaobserved during May and October–November, respectively. Thephase shift is associated with seasonal changes in the windpatterns that regulate the offshore cross-shelf transport ofchlorophyll-rich waters and thus exert a major influence on theseasonal cycle of Chl-a concentration observed in these regions.
Southeast of the Mississippi River mouth, the seasonalmaximum of Chl-a concentration is reached in July, whichcoincides and is related to the reversal of the prevailing winds.After the July peak, it follows a rapid decrease of the Chl-aconcentration, reaching the lowest seasonal values duringOctober–November. There is a high significant correlationbetween the seasonal evolution of the along-coast windcomponent and Chl-a concentration southeast of the Mis-sissippi River mouth. These results confirm, as previous studiessuggest, that the early summer bloom of chlorophyll in thisregion is enhanced by the eastward entrainment of MississippiRiver water, which, in turn, is due to the reversal of the along-coast wind component observed in early summer.
The anomalous atmospheric conditions that prevail fromMay to December 1997 and during the first semester of 1998were strongly favorable for coastal upwelling and eastwardtransport of the Mississippi River plume, which in combina-tion with other processes lead to the highest values of Chl-aconcentration observed in the northeastern Gulf of Mexicoover the entire record of SeaWiFS data.
At the interannual time scale, the confluence of along-coastcurrents induced by thewind in the southern Bay of Campecheexplains, to a large extent, most of Chl-a concentrationvariability observed in this region. In the southwestern LATEXShelf, the confluence of along-coast currents driven by thewind explains the Chl-a concentration anomalies during the1998–2004 period. In the years 2005–2007, the confluencezone shifted southward as a result of surface currents inducedby cyclonic and anticylonic eddies.
Acknowledgments
This project was funded by CONACYT grants SEP-2003-C02-45634, CNA-2004-CO2-24, and UNAM base funding. Theauthors would like to thank the SeaWiFS Project and theDistributed Active Archive Center (Code 902) at the GoddardSpace Flight Center, Greenbelt, MD 20771, for the productionand distribution of the data. The altimeter products wereproduced by Ssalto/Duacs and distributed by Aviso, withsupport from CNES. The authors are grateful to threeanonymous reviewers and Rosario Romero-Centeno for theirconstructive criticism and suggestions to improve this

19B. Martínez-López, J. Zavala-Hidalgo / Journal of Marine Systems 77 (2009) 1–20
manuscript. We would like to thank Ranulfo Rodríguez andAgustín Fernández who processed the SeaWiFS data.
Appendix. A simple way to represent chlorophyll-aconcentration data anomalies in logarithmic scale
SeaWiFS Level-3 chlorophyll-a concentration data are themost often used in scientific applications. Each image of theLevel-3 data is a byte-valued, two-dimensional array of anequidistant cylindrical projection of the globe with a pixelresolution of approximately 0.088° in both latitude andlongitude. The byte values, ranging from 0 to 255, are scaledto real values and may be converted into geophysical valuesusing the scaling equation:
geophysical value = 10 byte value×slope + interceptð Þ ð1Þ
In order to have a logarithmic scale in their graphs, avoidnegative values in the byte values, and obtain values within a
specified range, the National Aeronautic and Space Adminis-tration (NASA) ocean color website (http: //oceancolor.gsfc.nasa.gov/DOCS/Ocean Color Level-3 Standard Mapped ImageProducts.pdf) uses the following transformation:byte value = log10 geophysical valueð Þ− interceptð Þ= slope ð2Þ
where intercept is chosen to avoid negative values in the bytevalue, and slope is chosen in a way that the whole range of
byte values be in a predefined interval. The NASA ocean colorwebsite uses intercept=−2 and slope=0.0150. With thesevalues, the lowest geophysical value that may be transformedwithout having a negative byte value is 0.01 which has anassociated byte value of zero. If the maximum byte valueallowed is 254 (because graphs may be stored in an eight-bitformat and the number 255 is reserved for flagged data), themaximum geophysical value would be 64.56. In this transfor-mation, values smaller than 0.01 should be considered as aspecial case, for example adding the condition:if geophysical valueb0:01; then byte value = 0 ð3Þ
In a similar way, for geophysical values larger than 64.56the condition would be:
if geophysical value N 64:56; then byte value = 254 ð4Þ
Considering the special cases specified by conditions (3)and (4), any positive data may be transformed into a
logarithmic scale. It is important to note that the chosenvalue for intercept and Eq. (3) guarantee that the transformeddata be greater than or equal to zero. If there is a dataset withpositive and negative geophysical values, as may be themonthly anomalies of chlorophyll-a concentration from theannual mean, the first step is to separate the positive andnegative values, recording their location. For the subset ofpositive data, simply apply Eqs. (2) taking into account (3) and(4). For the subset of negative data, the absolute value shouldbe taken and then the above transformation applied. Then,multiply the byte values corresponding to the negative subsetof geophysical values by minus one. The procedure wouldrequire an algorithm to separate the positive and negativedata. The procedure described here was first used in Zavala-Hidalgo et al. (2006) without a detailed explanation.
References
Biggs, D.C., Müller-Karger, F.E., 1994. Ship and satellite observations of chlorophyllstocks in interacting cyclone–anticyclone eddy pairs in the western Gulf ofMexico. J. Geophys. Res. 99 (C4), 7371–7384. doi:10.1029/93JC02153.
Bretherton, C.S., Smith, C., Wallace, J.M., 1992. An intercomparison ofmethods for finding coupled patterns in climate data. J. Clim. textit5,541–560.
Cho, K., Reid, R.O., Nowlin, W.D., 1998. Objectively mapped stream functionfields on the Texas–Louisiana shelf based on 32 months of moored currentmeter data. J. Geophys. Res. 103, 10,377–10,390. doi:10.1029/98JC00099.
Cochrane, J.D., Kelly, F.J., 1986. Low-frequency circulation on the Texas–Louisiana continental shelf. J. Geophys. Res. 91 (C9), 10,645–10,659.
DiMarco, S.F., Nowlin Jr., W.D., Reid, R.O., 2005. A statistical description of thevelocity fields from upper ocean drifters in the Gulf of Mexico. In: Sturges,W., Lugo-Fernandez, A. (Eds.), Circulation of the Gulf of Mexico: Observa-tions and Models. American Geophysical Union Monograph, pp. 101–110.
Dunn, D.D., 1996. Trends in nutrient inflows to the Gulf of Mexico from streamsdraining the conterminous United States 1972 1993. Tech. Rep. Invest. Rep.964113. U.S. Geol. Survey Water-Resour., USGS, Austin, TX. 60 pp.
Gregg, W.W., Casey, N.W., 2004. Global and regional evaluation of the Sea-WiFS chlorophyll data set. Remote Sens. Environ. 93 (4), 463–479.
Hu, C., Nababan, B., Biggs, D.C.,Müler-Karger, F.E., 2003. Variability of bio-opticalproperties at sampling stations and implications for remote sensing: a casestudy in the NE Gulf of Mexico. Int. J. Remote Sens. 25, 2111–2120.
Kistler, R., Kalnay, E., Collins, W., Saha, S., White, G., Woollen, J., Chelliah, M.,Ebisuzaki, W., Kanamitsu, M., Kousky, V., van den Dool, H., Jenne, R.,Fiorino, M., 2001. The NCEP-NCAR 50-year reanalysis: monthly meansCD-ROM and documentation. Bull. Am. Meteorol. Soc. 82 (2), 247–268.
Li, Y., Nowlin, W.D., Reid, R.O., 1997. Mean hydrographic fields and theirinterannual variability over the Texas–Louisiana continental shelfin spring, summer, and fall. J. Geophys. Res. 102 (C1), 1027–1050.doi:10.1029/96JC03210.
Lohrenz, S.E., Fahnenstiel, G.L., Redalje, D.G., Lang, G.A., Chen, X., Dagg, M.J.,1997. Variations in primary production of northern Gulf of Mexicocontinental shelf waters linked to nutrient inputs from the MississippiRiver. Mar. Ecol., Prog. Ser. 155, 45–54.
Lohrenz, S.E., Fahnenstiel, G.L., Redalje, D.G., Lang, G.A., Dagg, M.J., Whitledge,T.E., Dortch, Q., 1999. Nutrients, irradiance, and mixing as factorsregulating primary production in coastal waters impacted by theMississippi River plume. Cont. Shelf Res. 19 (9), 1113–1141.
McClain, C.R., Cleave, M., Feldman, G., Gregg, W., Hooker, S., Kuring, N., 1998.Science quality SeaWiFS data for global biosphere research. SeaTechnology 39, 10–16.
MeloGonzález, N., Müler-Karger, F.E., Estrada, S.C., de los Reyes, R.P., del Río, I.V.,Pérez, P.C., Arenal, I.M., 2000. Near-surface phytoplankton distribution inthe western Intra-Americas Sea: The influence of El Niño and weatherevents. J. Geophys. Res. 105, 14,029–14,044. doi:10.1029/2000JC900017.
Morey, S.L., Martin, P.J., O'Brien, J.J., Wallcraft, A.A., Zavala-Hidalgo, J., 2003a.Export pathways for river discharged fresh water in the northern Gulf ofMexico. J. Geophys. Res. 108 (C10), 3303. doi:10.1029/2002JC001674.
Morey, S.L., Schroeder, W.W., O'Brien, J.J., Zavala-Hidalgo, J., 2003b. Theannual cycle of riverine influence in the eastern Gulf of Mexico basin.Geophys. Res. Lett. 30, 5-1.
Morey, S.L., Zavala-Hidalgo, J., O'Brien, J.J., 2005. The seasonal variability ofcontinental shelf circulation in the northern and western Gulf of Mexicofroma high-resolution numericalmodel. In: Sturges,W., Lugo-Fernandez,A. (Eds.), Circulation of the Gulf of Mexico: observations and models.American Geophysical Union Monograph, pp. 203–218.
Müller-Karger, F.E., 2000. The spring 1998 northeastern Gulf of Mexico(NEGOM) cold water event: remote sensing evidence for upwelling andfor eastward advection of Mississippi water (or: how an errant LoopCurrent anticyclone took the NEGOM for a spin). Gulf Mex. Sci. 18, 55–67.
Müller-Karger, F.E., Walsh, J.J., Evans, R.H., Meyers, M.B., 1991. On the seasonalphytoplankton concentration and sea surface temperature cycles of theGulf of Mexico as determined by satellites. J. Geophys. Res. 96 (15),12,645–12,665. doi:10.1029/91JC00787.
Nowlin Jr., W.D., Jochens, A.E., Reid, R.O., DiMarco, S.F., 1998. Texas–Louisianashelf circulation and transport processes study: synthesis report. Tech. Rep.OCS Study MMS 98-0035, vol. I. U.S. Dept. of the Interior, MineralsManagement Service, Gulf of Mexico OCS Region, New Orleans, LA. 502 pp.
Nowlin Jr., W.D., Jochens, A.E., Howard, M.K., DiMarco, S.F., Schroeder, W.W.,2000. Hydrographic properties and inferred circulation over the north-eastern shelves of the Gulf of Mexico during spring and mid-summer1998. Gulf Mex. Sci. 18, 40–54.

20 B. Martínez-López, J. Zavala-Hidalgo / Journal of Marine Systems 77 (2009) 1–20
Nowlin Jr.,W.D., Jochens, A.E., DiMarco, S.F., Reid, R.O., Howard, M.K., 2005. Low-frequencycirculationover theTexas–Louisiana continental shelf. In: Sturges,W., Lugo-Fernandez, A. (Eds.), Circulation of the Gulf of Mexico: Observa-tions and Models. American Geophysical Union Monograph, pp. 219–240.
Ohlmann, J.C., Niiler, P.P., Fox, C.A., Leben, R.R., 2001. Eddy energy and shelfinteractions in the Gulf of Mexico. J. Geophys. Res. 106 (C2), 2605–2620.
Pyper, B.J., Peterman, R.M., 1998. Comparison of methods to account forautocorrelation in correlation analysis of fish data. Can. J. Fish. Aquat. Sci.55, 2127–2140. doi:10.1139/cjfas-55-9-2127.
Qian, Y., Jochens, A.E., Kennicutt II, M.C., Biggs, D.C., 2003. Spatial andtemporal variability of phytoplankton biomass and community structureover the continental margin of the northeast Gulf of Mexico based onpigment analysis. Cont. Shelf Res. 23 (1), 1–17.
Rabalais, N.N., Turner, R.E., Wiseman, W.J., 2001. Hypoxia in the Gulf ofMexico. J. Environ. Qual. 30 (2), 320–329.
Ropelewski, C.F., Halpert, M.S., 1987. Global and regional scale precipitationpatterns associatedwith the El Niño–Southern Oscillation. Mon.WeatherRev. 115, 1606–1626.
Smith, S.D., 1980. Wind stress and heat flux over the ocean in gale forcewinds. J. Phys. Oceanogr. 10, 709–726.
Stumpf, R.P., Arnone, R.A., Gould, R.W., Jr., Martinolich, P., and Ransibrahmana-kul, V., A partially-coupled ocean–atmospheremodel for retrieval of water-leaving radiance from SeaWiFS in coastal waters, in F.S. Patt et al., 2003a:Algorithm Updates for the Fourth SeaWiFS Data Reprocessing. NASA Tech.Memo.2002-206892, vol. 22, editedby S.B.HookerandE.R. Firestone,NASAGoddard Space Flight Center, Greenbelt, Maryland, 2003a.
Stumpf, R.P., Culver, M.E., Tester, P.A., Tomlinson, M., Kirkpatrick, G.J.,Pederson, B.A., Truby, E., Ransibrahmanakul, V., Soracco, M., 2003b.Monitoring Karenia brevis blooms in the Gulf of Mexico using satelliteocean color imagery and other data. Harmful Algae 2 (2), 147–160.
Toner,M., Kirwan, A.D., Poje, A.C., Kantha, L.H.,Müller-Karger, F.E., Jones, C.K.R.T.,2003. Chlorophylldispersal byeddy–eddy interactions in theGulfofMexico.J. Geophys. Res. 108 (C4), 3105. doi:10.1029/2002JC001499.
Vázquez de la Cerda, A.M., Reid, R.O., DiMarco, S.F., Jochens, A.E., 2005. Bay ofCampeche Circulation: an Update, in circulation of the Gulf of Mexico:observations and models. In: Sturges, W., Lugo-Fernandez, A. (Eds.),American Geophysical Union Monograph, pp. 279–293.
Von Storch, H., Zwiers, F.W., 1999. Statistical Analysis in Climate Research.Cambridge University Press.
Vukovich, F.M., Crissman, B.W., 1986. Aspects of warm rings in the Gulf ofMexico. J. Geophys. Res. 91 (C2), 2645–2660.
Walker, N.D., Wiseman, W.J., Rouse, L.J., Babin, A., 2005. Effects of riverdischarge, wind stress, and slope eddies on circulation and the satellite-observed structure of the Mississippi River plume. J. Coast. Res. 21 (6),1228–1244.
Wallace, J.M., Smith, C., Bretherton, C.S., 1992. Singular value decompositionof Wintertime sea surface temperature and 500-mb height anomalies.J. Clim. textit5, 561–576.
Wiseman,W., Sturges, W., 1999. Physical oceanography of the Gulf of Mexico:processes that regulate its biology. In: Kumpf, H., Steidinger, K., Sherman,K. (Eds.), The Gulf of Mexico Large Marine Ecosystem. Blackwell Science,Malden, MA, pp. 72–92.
Zavala-Hidalgo, J., Parés-Sierra, A., Ochoa, J., 2002. Seasonal variability of thetemperature and heat fluxes in the Gulf of Mexico. Atmosfera 15, 81–104.
Zavala-Hidalgo, J., Morey, S.L., O'Brien, J.J., 2003. Seasonal circulation on thewestern shelf of the Gulf of Mexico using a high-resolution numericalmodel. J. Geophys. Res. 108 (C12), 3389. doi:10.1029/2003JC001879.
Zavala-Hidalgo, J., Gallegos-García, A., Martínez-López, B., Morey, S.L.,O’Brien, J.J., 2006. Seasonal upwelling on the western and southernshelves of the Gulf of Mexico. Ocean Dyn. 56 (3–4), 333–338.


![Seasonal and interannual changes in the surface ... · chlorophyll‐aconcentration(Chl‐a)asaproxyforbiological productivity [e.g., Balch and Byrne, 1994], it remains the one of](https://img.dokumen.tips/doc/110x75/602e37c9b5faa56d200b5742/seasonal-and-interannual-changes-in-the-surface-chlorophyllaaconcentrationchlaaasaproxyforbiological.jpg)