Embed Size (px)
Citation preview
Sea Level Rise in the Treasure Coast Region
Prepared by Treasure Coast Regional Planning Council
301 East Ocean Boulevard, Suite 301 Stuart, Florida 34994
For Submission to
Southwest Florida Regional Planning Council 1926 Victoria Avenue
Fort Myers, Florida 33901
In Fulfillment of “Local Government Review and Approval of Sea Level Rise Maps”
Subagreement Executed October 24, 2002 Extended October 21, 2003
December 5, 2005
i December 5, 2005 Sea level Rise in the TCRPC Treasure Coast Region
Contents Page
Cover image ................................................................................................................................. ii Acronyms..................................................................................................................................... iii Acknowledgments........................................................................................................................ iv Summary ...................................................................................................................................... v Introduction.................................................................................................................................. 1 Characteristics of the Region ....................................................................................................... 3 Sea Level Rise Predictions in the Region .................................................................................... 4 Mapping Methodology................................................................................................................. 5 General Approach............................................................................................................... 5 Protection Scenarios ............................................................................................................ 5 Data Sets .............................................................................................................................10 Mapping Procedures ...........................................................................................................10 Local Government Review .................................................................................................11 Map Analysis ...............................................................................................................................13 Regional Results .................................................................................................................13 Indian River County............................................................................................................14 St. Lucie County .................................................................................................................18 Martin County.....................................................................................................................22 Palm Beach County.............................................................................................................26 Discussion....................................................................................................................................30 Responses to Sea Level Rise...............................................................................................30 Federal Policies and Programs............................................................................................30 State Policies and Programs................................................................................................34 Local Government Policies .................................................................................................36 Proposed Policies ................................................................................................................37 Conclusions ..................................................................................................................................39 Literature Cited ............................................................................................................................40 Maps 1 Anticipated response to sea level rise in Indian River County .........................................15 2 Anticipated response to sea level rise in St. Lucie County...............................................19 3 Anticipated response to sea level rise in Martin County ..................................................23 4 Anticipated response to sea level rise in Palm Beach County ..........................................27 Tables 1 Estimated sea level rise for the Treasure Coast Region.................................................... 4 2 State-wide approach for identifying likelihood of land use protection............................. 6 3 GIS data sets used to produce the sea level rise maps ......................................................10 4 Acres of each sea level rise category in the Treasure Coast Region.................................13
ii December 5, 2005 Sea level Rise in the TCRPC Treasure Coast Region
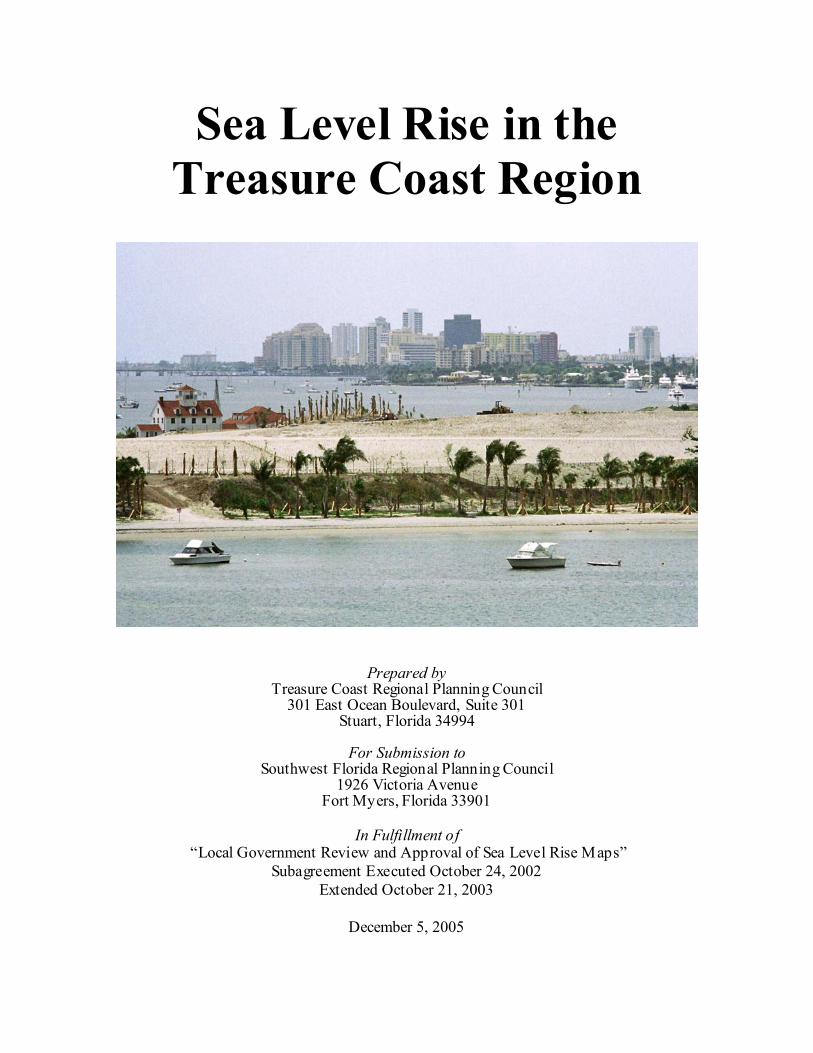
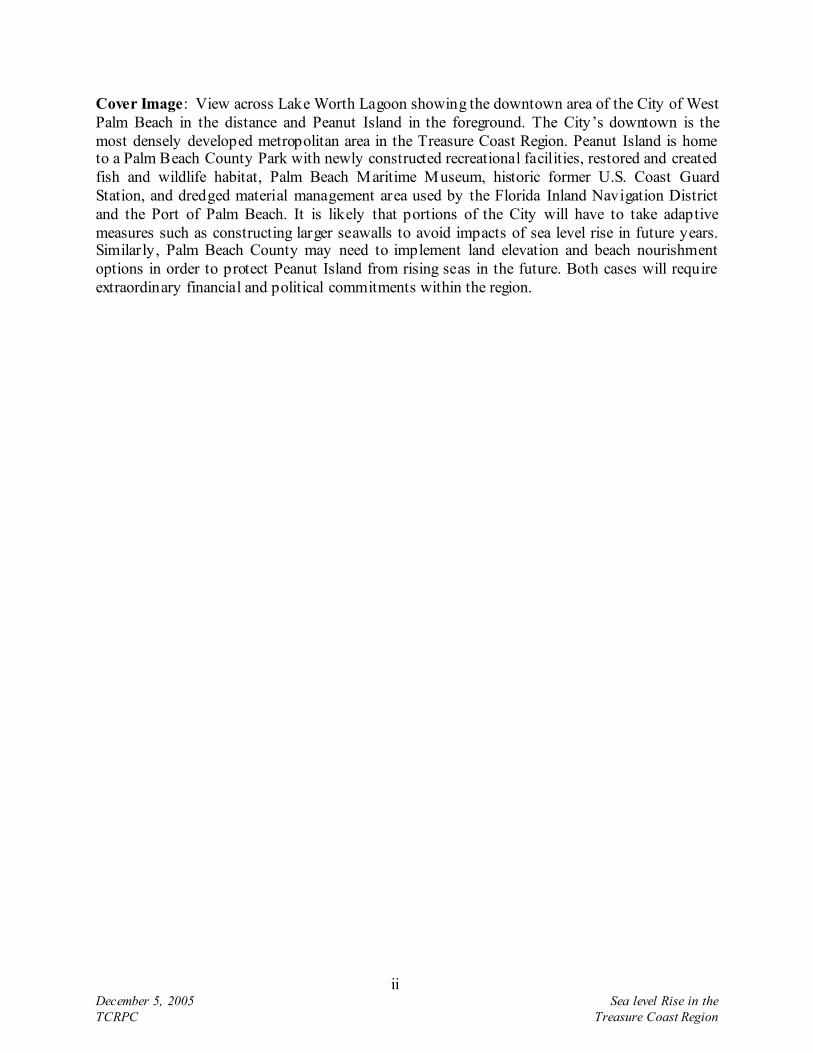
Cover Image: View across Lake Worth Lagoon showing the downtown area of the City of West Palm Beach in the distance and Peanut Island in the foreground. The City’s downtown is the most densely developed metropolitan area in the Treasure Coast Region. Peanut Island is home to a Palm Beach County Park with newly constructed recreational facilities, restored and created fish and wildlife habitat, Palm Beach Maritime Museum, historic former U.S. Coast Guard Station, and dredged material management area used by the Florida Inland Navigation District and the Port of Palm Beach. It is likely that portions of the City will have to take adaptive measures such as constructing larger seawalls to avoid impacts of sea level rise in future years. Similarly, Palm Beach County may need to implement land elevation and beach nourishment options in order to protect Peanut Island from rising seas in the future. Both cases will require extraordinary financial and political commitments within the region.
iii December 5, 2005 Sea level Rise in the TCRPC Treasure Coast Region
Acronyms BECP Beach Erosion Control Program BEBR Bureau of Economic and Business Research CBRA Coastal Barrier Resources Act CBZ Coastal Building Zone CCCL Coastal Construction Control Line CERP Comprehensive Everglades Restoration Plan COE U.S. Army Corps of Engineers CZMA Coastal Zone Management Act CZMP Coastal Zone Management Program EAR Evaluation and Appraisal Report EPA U.S. Environmental Protection Agency ESI Environmental Sensitive Index for Coastlines FAC Florida Administrative Code FDEP Florida Department of Environmental Protection FDOT Florida Department of Transportation FEMA Federal Emergency Management Agency FLUCCS Florida Land Use, Cover and Forms Classification System FLUM Future Land Use Map FMRI Florida Marine Research Institute FPL Florida Power and Light FS Florida Statutes GIS Geographic Information System ICW Intracoastal Waterway IRC Indian River County LIDAR Light Detection and Ranging MC Martin County NFIP National Flood Insurance Program NGVD National Geodetic Vertical Datum NOAA National Oceanic and Atmospheric Administration PBC Palm Beach County RHA Rivers and Harbors Act RPC Regional Planning Council SFRPC South Florida Regional Planning Council SFWMD South Florida Water Management District SJRWMD St. Johns River Water Management District SLC St. Lucie County SBMP Strategic Beach Management Plan SWFRPC Southwest Florida Regional Planning Council TCRPC Treasure Coast Regional Planning Council USGC United States Geologic Survey WMD Water Management District
iv December 5, 2005 Sea level Rise in the TCRPC Treasure Coast Region
Acknowledgments TCRPC offers its gratitude to the other RPCs in the State of Florida for sharing information and jointly developing language as a statewide report on sea level rise is developed. Appreciation is extended to Daniel L. Trescott of the SWFRPC and James G. Titus of the EPA for coordinating the statewide planning effort in Florida. Special thanks go to Manuel Cela of the SFRPC for producing the sea level rise maps for the Treasure Coast Region, and John E. Hulsey of the SFRPC for sharing planning ideas. This report benefited from discussions about sea level rise with local government planners, including: Bob Keating, Roland DeBlois, Sasan Rohani, Ken Oristaglio, and Andy Sobczak with Indian River County; David Kelly, Diana Waite, Vanessa Bessey and Donald B. West with St. Lucie County; Nicki van Vonno and Ross Wilcox with Martin County; and Lorenzo J. Aghemo, Isaac Hoyos, Michael R. Howe, Etim S. Udoh, and Erin Fitzhugh with Palm Beach County. The project manager for TCRPC and principal author of this document is Peter G. Merritt, Regional Ecologist with TCRPC.
v December 5, 2005 Sea level Rise in the TCRPC Treasure Coast Region
Summary As part of an ongoing program evaluating global climate change, the EPA has initiated a nationwide project promoting planning for and awareness of sea level rise. In 2000, the EPA issued a grant to the SWFRPC to participate in this program and coordinate the study of sea level rise throughout the State of Florida. In 2002, the TCRPC entered into a contract with SWFRPC to conduct a study of sea level rise within the Treasure Coast Region. This report creates maps of the Treasure Coast Region that distinguish the shores that are likely to be protected from erosion, inundation, and flooding, from those areas where natural shoreline retreat is likely to take place. This report is designed to support the EPA’s national effort encouraging the long-term thinking required to deal with the issues associated with sea level rise. The ultimate goal of this project is to diminish losses to life and property from coastal hazards, such as erosion and inundation, and to ensure the long-term survival of coastal wetlands. This study follows the general approach of other sea level rise planning studies sponsored by the EPA. We used decision rules defined by a statewide approach for identifying likelihood of land use protection to characterize all uplands from 0 to 10 feet in elevation and within 1000 feet of shoreline into the following four general categories: protection almost certain; protection reasonably likely; protection unlikely; and no protection. We assigned colors to these categories to distinguish the protection scenarios on the draft sea level rise maps prepared for each county. We then provided the draft maps to local government planners to obtain comments. Application of the state-wide approach for assessing the likelihood of land use protection in the Treasure Coast Region resulted in the identification of 119,157 acres (83.3 %) of uplands and 23,927 acres (16.7 %) of wetlands in the study area. Regionally, the “Protection Almost Certain” category accounted for 77.0 % of the uplands in the study area. This was followed by “Protection Reasonably Likely” (6.7 %), “Protection Unlikely” (10.7 %), and “No Protection” (5.6 %). A clear regional trend exists, reflecting an increase in the number of acres in the “Protection Almost Certain” category when moving north to south from Indian River County to Palm Beach County. A total of 34 municipalities in the four counties of the Treasure Coast Region are likely to be impacted by sea level rise in the future. This report is intended to stimulate local government planners and citizens to think about the problem of sea level rise. The sea level rise maps provided in this report only depict the expected response scenarios to sea level rise based on the best currently available knowledge. Local planners may decide in the future that it will be wise to retreat from lands currently deemed to be protected lands, due to costs and environmental considerations. This project represents the first step in planning for sea level rise in the Treasure Coast Region.
1 December 5, 2005 Sea level Rise in the TCRPC Treasure Coast Region
Introduction The earth’s ocean levels have risen and fallen throughout geologic history. Recent measurements from tidal gauges worldwide indicate that ocean levels are currently rising. During the past 100 years, the global mean sea level has risen an average of about 7 inches (Warrick et al. 1996). Measurements along the United States coast indicate that sea level is rising at a rate of 10 to 12 inches per century (Titus and Narayanan 1995). However, the rate of sea level rise is influenced by many factors, making it difficult to predict the exact levels over time. Twilley et al. (2001) reported that global projections for sea level rise range from 5 to 35 inches over the next 100 years. Clearly, there is concern that sea level may rise at an accelerated rate in the future. The prospect of sea level rise is of particular concern to the State of Florida because of its expansive coastline, low elevations and flat topography, economic dependence of the tourism industry on beaches and coastal resources, and significant public and private investment in coastal areas. The 2004 population estimates indicate that Florida has about 17.5 million residents (BEBR 2005) and the majority of these people live and work near coastal areas. The ramifications of sea level rise in Florida could be far reaching (Fiedler et al. 2001). In areas with a gently sloping shoreline the horizontal advance of the sea can be 150 to 200 times the vertical rise (Leatherman et al. 2000). This can cause increased erosion, flooding, and raise the frequency and severity of storm surges. Additionally, rising sea levels can contaminate freshwater supplies by causing saltwater intrusion into river systems, canals, groundwater aquifers, and low lying coastal wetlands such as the Everglades ecosystem. As part of an ongoing program evaluating global climate change, the EPA has initiated a nationwide project promoting planning for and awareness of sea level rise. In 2000, the EPA issued a grant to the SWFRPC to participate in this program and coordinate the study of sea level rise throughout the State of Florida. This nationwide project promotes planning for sea level rise by developing maps that illustrate how communities expect to address the most fundamental question about sea level rise: Where will we retreat and where will we hold back the sea? The cooperative agreement between the EPA and SFRPC represents the first attempt to examine the long-term response to sea level rise through land use planning in Florida. In order to comprehensively examine sea level rise issues throughout the State, the SWFRPC has established agreements between five other RPCs in Florida to assist in this statewide effort, and intends to coordinate with all of the coastal RPC’s when funds become available. In 2002, the TCRPC entered into a contract with SWFRPC to conduct a study of land use impacts and solutions to sea level rise within the Treasure Coast Region. TCRPC is acting as a subcontractor to SWFRPC in completing the project. At the same time, SWFRPC entered into an agreement with the SFRPC to conduct a similar project in the South Florida Region. As part of these agreements, SFRPC is responsible for preparing the GIS maps for the TCRPC portion of the project. This report creates maps of the Treasure Coast Region that distinguish the shores that are likely to be protected from erosion, inundation, and flooding, from those areas where natural shoreline retreat is likely to take place. This report, along with the sea level rise projects being implemented by other Florida RPCs are designed to support the EPA’s national effort encouraging the long-term thinking required to deal with the issues associated with sea level rise. The ultimate goal of this project and the other projects being conducted elsewhere in Florida and
2 December 5, 2005 Sea level Rise in the TCRPC Treasure Coast Region
the Atlantic Coastal states from Georgia to Massachusetts is to diminish losses to life and property from coastal hazards, such as erosion and inundation, and to ensure the long-term survival of coastal wetlands. The sea level rise planning maps provided in this document are intended for general planning purposes. The maps do not represent a comprehensive program to address sea level rise, but rather constitute a planning baseline that decision makers can use when evaluating land use, infrastructure, wetland permits, and other decisions whose outcomes may be sensitive to future sea level rise, flooding, and shoreline erosion. The maps are not the result of a cost-benefit analysis, but rather the best planning judgement of the local and regional authorities responsible for land use planning. Given the broad planning context of this study, an analysis of specific parcels is beyond the scope of this study. However, the maps are detailed enough to identify the jurisdictions where factoring sea level rise into near-term decision making is most important. This report is intended as a starting point to assist local governments to engage in a dialog concerning sea level rise. Communities in the region should begin to develop goals, strategies, and policies for inclusion in local government comprehensive plans. Sea level rise planning issues should become part of the discussion of all future development proposals in the coastal areas of the region.
3 December 5, 2005 Sea level Rise in the TCRPC Treasure Coast Region
Characteristics of the Region The Treasure Coast Region is comprised of four counties located along the southeastern coast of Florida. From north to south the region includes Indian River, St. Lucie, Martin, and Palm Beach counties. The Atlantic coast and lagoon system is the most prominent physiographic feature of the Region. The Region has approximately 100 miles of Atlantic coast line. Except for the southern part of Palm Beach County, the region has a coastal barrier island system. The region’s barrier island coastline consists entirely of a sandy beach, approximately 25 percent of which is in public ownership. The Indian River Lagoon lies west of the barrier island from the northern boundary of the region, south to Jupiter Inlet. This estuary is designated as an Estuary of National Significance. Lake Worth Lagoon is a 20-mile long estuary located centrally along the east coast of Palm Beach County. The Indian River and Lake Worth Lagoons are connected by the Atlantic Intracoastal Waterway, an inland navigation channel that traverses the east coast of Florida. The Region's estuaries are important because they contain highly productive natural communities and ecosystems, including seagrass beds, algal beds, oyster beds, exposed sand and shell bottoms, mud flats, tidal marshes, and mangrove swamps. Mangrove communities are the most abundant type of wetlands with exposed vegetation bordering the estuaries of the region. Mangrove communities provide a nutrient base which is critical in maintaining the Region's commercial and sport fish populations. The estuaries are heavily used by recreational boaters and are important to the marine industries. The estuaries are prime locations for boat facilities, waterfront development and other water-related activities. Immediately west of the lagoon system is the Atlantic coastal ridge, which parallels the present mainland edge through the region. During the Pamlico period, approximately 100,000 years ago, the ridge was the dune line when sea level was approximately 30 feet higher than it is today. In certain areas the sand dunes of the Atlantic coastal ridge reach elevations over 90 feet. The ridge has well-drained sandy soils favored by urban development. Inland, a vast eastern valley occupies much of the interior of the northern three counties. This valley is drained by the St. John’s, St. Lucie, and Loxahatchee Rivers. Much of southern and western Palm Beach County is part of the Everglades ecosystem. The estimated population for the Treasure Coast Region as of April 2004 was over 1.7 million (BEBR 2005). Approximately 71.7 percent of the region’s population occurs in Palm Beach County. The population of the region is projected to grow by approximately 59% over the next 25 years. Much of this growth is expected to occur in the region’s urbanized coastal communities. Of the four counties and 49 municipalities in the region, 72% have jurisdiction over land that is directly adjacent to the Atlantic coast, lagoon system, or Intracoastal Waterway. This includes four of the five local governments in Indian River County, all four local governments in St. Lucie County, all five local governments in Martin County, and 24 of the 38 local governments in Palm Beach County.
4 December 5, 2005 Sea level Rise in the TCRPC Treasure Coast Region
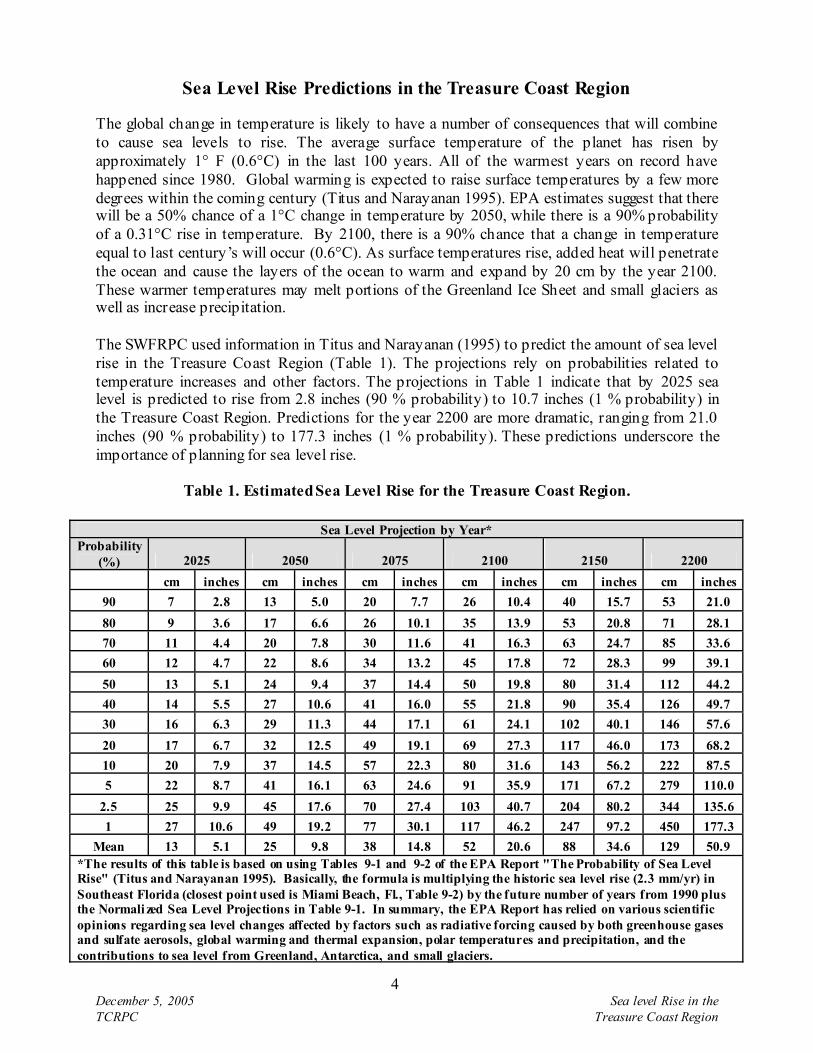
Sea Level Rise Predictions in the Treasure Coast Region The global change in temperature is likely to have a number of consequences that will combine to cause sea levels to rise. The average surface temperature of the planet has risen by approximately 1° F (0.6°C) in the last 100 years. All of the warmest years on record have happened since 1980. Global warming is expected to raise surface temperatures by a few more degrees within the coming century (Titus and Narayanan 1995). EPA estimates suggest that there will be a 50% chance of a 1°C change in temperature by 2050, while there is a 90% probability of a 0.31°C rise in temperature. By 2100, there is a 90% chance that a change in temperature equal to last century’s will occur (0.6°C). As surface temperatures rise, added heat will penetrate the ocean and cause the layers of the ocean to warm and expand by 20 cm by the year 2100. These warmer temperatures may melt portions of the Greenland Ice Sheet and small glaciers as well as increase precipitation. The SWFRPC used information in Titus and Narayanan (1995) to predict the amount of sea level rise in the Treasure Coast Region (Table 1). The projections rely on probabilities related to temperature increases and other factors. The projections in Table 1 indicate that by 2025 sea level is predicted to rise from 2.8 inches (90 % probability) to 10.7 inches (1 % probability) in the Treasure Coast Region. Predictions for the year 2200 are more dramatic, ranging from 21.0 inches (90 % probability) to 177.3 inches (1 % probability). These predictions underscore the importance of planning for sea level rise.
Table 1. Estimated Sea Level Rise for the Treasure Coast Region.
Sea Level Projection by Year* Probability
(%) 2025 2050 2075 2100 2150 2200 cm inches cm inches cm inches cm inches cm inches cm inches
90 7 2.8 13 5.0 20 7.7 26 10.4 40 15.7 53 21.0 80 9 3.6 17 6.6 26 10.1 35 13.9 53 20.8 71 28.1 70 11 4.4 20 7.8 30 11.6 41 16.3 63 24.7 85 33.6 60 12 4.7 22 8.6 34 13.2 45 17.8 72 28.3 99 39.1 50 13 5.1 24 9.4 37 14.4 50 19.8 80 31.4 112 44.2 40 14 5.5 27 10.6 41 16.0 55 21.8 90 35.4 126 49.7 30 16 6.3 29 11.3 44 17.1 61 24.1 102 40.1 146 57.6 20 17 6.7 32 12.5 49 19.1 69 27.3 117 46.0 173 68.2 10 20 7.9 37 14.5 57 22.3 80 31.6 143 56.2 222 87.5 5 22 8.7 41 16.1 63 24.6 91 35.9 171 67.2 279 110.0
2.5 25 9.9 45 17.6 70 27.4 103 40.7 204 80.2 344 135.6 1 27 10.6 49 19.2 77 30.1 117 46.2 247 97.2 450 177.3
Mean 13 5.1 25 9.8 38 14.8 52 20.6 88 34.6 129 50.9 *The results of this table is based on using Tables 9-1 and 9-2 of the EPA Report "The Probability of Sea Level Rise" (Titus and Narayanan 1995). Basically, the formula is multiplying the historic sea level rise (2.3 mm/yr) in Southeast Florida (closest point used is Miami Beach, Fl., Table 9-2) by the future number of years from 1990 plus the Normali zed Sea Level Projections in Table 9-1. In summary, the EPA Report has relied on various scientific opinions regarding sea level changes affected by factors such as radiative forcing caused by both greenhouse gases and sulfate aerosols, global warming and thermal expansion, polar temperatures and precipitation, and the contributions to sea level from Greenland, Antarctica, and small glaciers.
5 December 5, 2005 Sea level Rise in the TCRPC Treasure Coast Region
Mapping Methodology General Approach This study follows the general approach of the sea level rise planning studies that the EPA is sponsoring along other Atlantic Coast states. During the original design of this study, EPA and SWFRPC sought to identify a study area that could be implemented throughout Florida and that would include all land that might be significantly affected by sea level rise during the next century. If possible, they also sought to include land that might be affected over a longer period of time, but that goal had to be balanced against the extra cost of studying a larger study area. Similar to other sea level rise planning studies in Florida, this study considers all land below the 10-foot (NGVD) contour. We used the GIS data sets from the SFWMD and SJRWMD to define the study area by identifying all locations that have an elevation of less than 10 feet. The rational for the 10-foot elevation criterion is because: 1) this detail of topographic information can be gathered statewide, and 2) tidal influences can extend almost to the 5-foot contour, which means the 10-foot contour is approximately the highest elevation that might be inundated by tides if sea level rises several feet over current levels. Although the land below 5 feet is the most vulnerable, limiting the study area to such low land would exclude many areas that are potentially vulnerable to sea level rise during the next century. Statewide, most of the land between 5 and 10 feet is already below the base flood elevation for a 100-year storm, and hence will experience greater flooding as sea level rises. Furthermore, topographic contours are only estimates. Under the National Mapping Standards, up to 10 percent of the land can be higher or lower than the map indicates, by more than one-quarter of the contour interval. Thus a substantial amount of land depicted as between 5 and 10 feet may in reality be between 3 and 4 feet; using the 10-foot contour to delineate the study area helps to ensure that this very low land is considered. The study area also includes all land within 1000 feet of the shore, even if it is above the 10-foot contour, for two reasons. First, rising sea level and other coastal processes can cause beaches, dunes, bluffs, and other land to erode even though it may have sufficient elevation to avoid direct inundation by rising water levels. The 1000-foot extension is somewhat arbitrary; we chose that distance primarily to be consistent with similar studies in other states. Second, extending the study area 1000 feet inland also ensures that the study area is large enough to be seen along the entire shore on the county-scale maps produced by this study. Protection Scenarios Creation of the final project maps followed closely the criteria laid-out in the statewide approach for identifying likelihood of land use protection (Table 2). This table represents a summary of the approaches taken by other states but adapted for use in Florida by SWFRPC and EPA with input from the other Regional Planning Councils. We used this approach to characterize all uplands from 0 to 10 feet in elevation and within 1000 feet of shoreline into the following four general categories: protection almost certain; protection reasonably likely; protection unlikely; and no protection. We assigned colors to these categories to distinguish the protection scenarios on the draft sea level rise maps prepared for each county. We then provided the draft maps to the local governments to obtain any general or site-specific corrections to the maps. The protection scenarios shown on the maps in this study illustrate the areas that planners within this region expect will be protected, or not protected, from erosion and inundation in the

6 December 5, 2005 Sea level Rise in the TCRPC Treasure Coast Region
Table 2. State-wide approach for identifying likelihood of land use protection.
Likelihood of Protection2
Land-Use Category
Source Used to Identify Land Area
Existing developed land (FLUCCS Level 1-100 Urban and Built-up) within extensively developed areas and/or designated growth areas.
Developed Lands identi fied from Water Management Districts (WMD) existing Florida Land Use, Cover and Forms Classification System (FLUCCS) as defined by Florida Department of Transportation Handbook (January 1999); Growth areas identi fied from planner input and local comprehensive plans.
Future development within extensively developed areas and/or designated growth areas (residential/offi ce/commercial/industrial).
Generalized Future Land Use Maps from local comprehensive plans, local planner input and Water Management Districts.
Extensively-used parks operated for purposes other than conservation and have current protection 3 or are surrounded by brown colored land uses.
County-Owned, State-Owned, and Federally-Owned Lands (based on local knowledge) or lands defined as 180 Recreational on the Level 1 FLUCCS, local planner input and Florida Marine Research Info System (FMRIS) for current protection measures.
`Protection Almost Certain (brown)
Mobile home developments outside of coastal high hazard4, expected to gentrify, or connected to central sewer and water.
Local planner input and current regional hurricane evacuation studies.
Existing development within less densely developed areas, outside of growth areas.
Developed Lands identi fied from WMD existing FLUCCS; Growth areas identified from local planner input, local comprehensive plans and current regional hurricane evacuation studies.
Mobile home development within a coastal high hazard area that is neither anticipated to gentrify nor on central water and sewer.
Local comprehensive plans and current regional hurricane evacuation studies.
Projected future development outside of growth areas could be estate land use on Future Land Use Map.
local planner input
Moderately-used parks operated for purposes other than conservation and have no current protection or are surrounded by red colored land uses.
County-Owned, State-Owned, and Federally-Owned Lands (based on local knowledge) or lands defined as 180 Recreational on the Level 1 FLUCCS, local planner input and FMRIS.
Coastal areas that are extensively developed but are ineligible for beach nourishment funding due to CBRA (or possibly private beaches unless case can be made that they will convert to public)
Flood Insurance Rate Maps for CBRA, local knowledge for beach nourishment.
Undeveloped areas where most of the land will be developed, but a park or refuge is also planned, and the boundaries have not yet been defined so we are unable to designate which areas are brown and which are green; so red is a compromise between.
Local planner input
Agricultural areas where development is not expected, but where there is a history of erecting shore protection structures to protect farmland.
Local planner input
Dredge Spoil Areas likely to continue to receive spoils or be developed, and hence unlikely to convert to tidal wetland as sea level rises
Local planner input
Protection Reasonably Likely (red)
Military Lands in areas where protection is not certain. FLUCCS Level 173
7 December 5, 2005 Sea level Rise in the TCRPC Treasure Coast Region
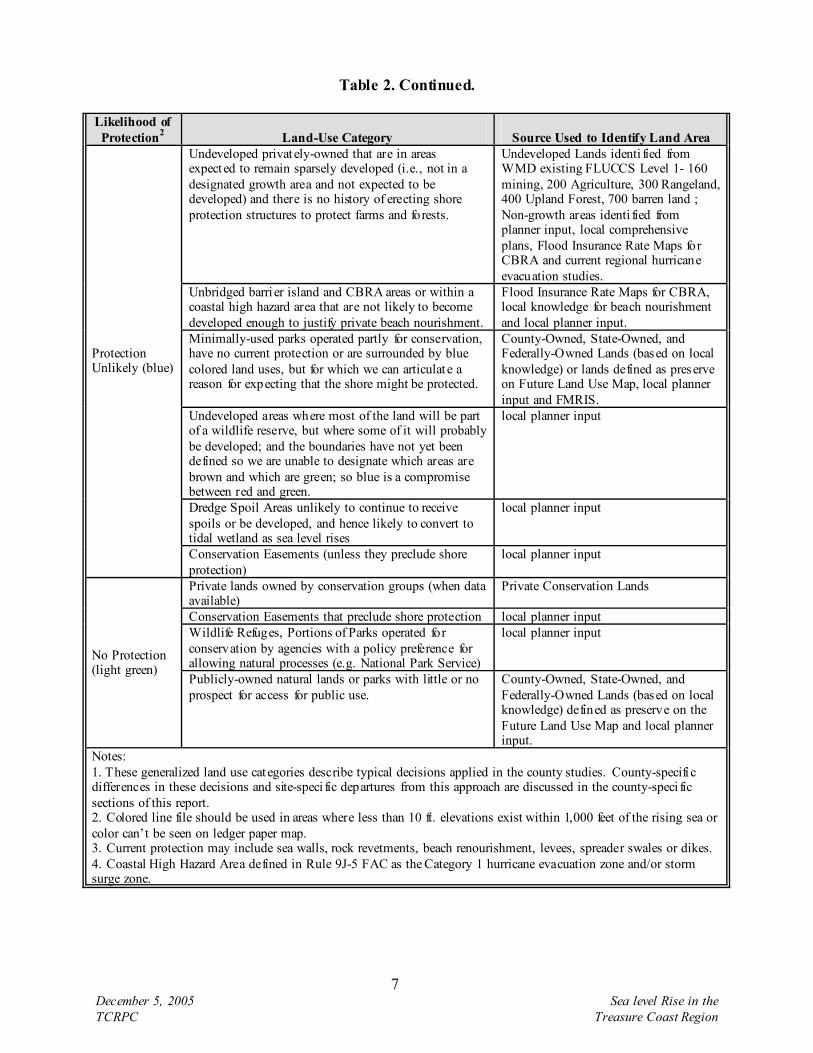
Table 2. Continued.
Likelihood of Protection2
Land-Use Category
Source Used to Identify Land Area
Undeveloped privat ely-owned that are in areas expect ed to remain sparsely developed (i.e., not in a designated growth area and not expected to be developed) and there is no history of erecting shore protection structures to protect farms and forests.
Undeveloped Lands identi fied from WMD existing FLUCCS Level 1- 160 mining, 200 Agriculture, 300 Rangeland, 400 Upland Forest, 700 barren land ; Non-growth areas identi fied from planner input, local comprehensive plans, Flood Insurance Rate Maps for CBRA and current regional hurricane evacuation studies.
Unbridged barri er island and CBRA areas or within a coastal high hazard area that are not likely to become developed enough to justify private beach nourishment.
Flood Insurance Rate Maps for CBRA, local knowledge for beach nourishment and local planner input.
Minimally-used parks operated partly for conservation, have no current protection or are surrounded by blue colored land uses, but for which we can articulat e a reason for expecting that the shore might be protected.
County-Owned, State-Owned, and Federally-Owned Lands (based on local knowledge) or lands defined as preserve on Future Land Use Map, local planner input and FMRIS.
Undeveloped areas where most of the land will be part of a wildlife reserve, but where some of it will probably be developed; and the boundaries have not yet been defined so we are unable to designate which areas are brown and which are green; so blue is a compromise between red and green.
local planner input
Dredge Spoil Areas unlikely to continue to receive spoils or be developed, and hence likely to convert to tidal wetland as sea level rises
local planner input
Protection Unlikely (blue)
Conservation Easements (unless they preclude shore protection)
local planner input
Private lands owned by conservation groups (when data available)
Private Conservation Lands
Conservation Easements that preclude shore protection local planner input Wildlife Refuges, Portions of Parks operated for conservation by agencies with a policy preference for allowing natural processes (e.g. National Park Service)
local planner input
No Protection (light green)
Publicly-owned natural lands or parks with little or no prospect for access for public use.
County-Owned, State-Owned, and Federally-Owned Lands (based on local knowledge) defined as preserve on the Future Land Use Map and local planner input.
Notes: 1. These generalized land use cat egories describe typical decisions applied in the county studies. County-specifi c differences in these decisions and site-speci fic departures from this approach are discussed in the county-speci fic sections of this report. 2. Colored line file should be used in areas where less than 10 ft. elevations exist within 1,000 feet of the rising sea or color can’t be seen on ledger paper map. 3. Current protection may include sea walls, rock revetments, beach renourishment, levees, spreader swales or dikes. 4. Coastal High Hazard Area defined in Rule 9J-5 FAC as the Category 1 hurricane evacuation zone and/or storm surge zone.
8 December 5, 2005 Sea level Rise in the TCRPC Treasure Coast Region
future. Those expectations incorporate state policies and regulations, local concerns, land-use data, and general planning judgment. Generally, the first step in assigning a protection scenario is to determine the general land use categories of the uplands within the study area in a particular county. Land use layers were obtained from GIS information gathered for the Treasure Coast Region by SFRPC. We utilized the best available data sets from federal, state, and county planning agencies. Counties within the Treasure Coast Region use different land use category classifications, but these categories can be summarized as including the following: agricultural, commercial, conservation, industrial, public/recreational and residential. Typically, residential, commercial, recreational and industrial lands were determined to be “almost certain” or “reasonably likely” to be protected. Undeveloped property, including privately owed property, agricultural land, minimally used parks, and dredge spoil areas were generally assigned the “protection unlikely” designation. Public and privately owned conservation areas were identified as “no protection.” We used colors to identify the protection categories on the sea level rise maps as follows: brown - protection almost certain; red - protection reasonably likely; dark blue - protection unlikely; light green - no protection; and, dark green – wetlands. These categories are described in more detail below. Protection Almost Certain (Brown). Coastal lands in the Treasure Coast Region have very high property values, compared with the costs of shore protection. Therefore, most areas that have been developed, as well as undeveloped land in designated growth areas is almost certain to be protected. The following describes how the maps captured this fundamental consideration. Four land-use categories are designated as “protection almost certain.” The first land-use category is existing developed land within extensively developed areas and/or designated growth areas. The second category is future development within extensively developed areas and/or designated growth areas. The developed land and future growth areas include residential, office/commercial and industrial uses. It is understood that every effort will be made to protect highly developed land from saltwater intrusion. This is due to the economic value of these lands and the high population density in these areas. The third land-use category that has been deemed as “protection almost certain” is parks that are used extensively for purposes other than conservation and have current protection or are surrounded by protected lands. Examples of this type of land are parks with highly used launching ramps located on-site. These parks are almost certain to be protected from sea level rise because they exist primarily for recreation and not exclusively for conservation purposes. Finally, mobile home developments outside of coastal high hazard areas connected to central sewer and water were included in this category. Protection Reasonably Likely (Red). Although most coastal lands are almost certain to be protected, there are a number of areas where shore protection is likely, but not certain. Identifying these areas is important, for two reasons: First, if local elected officials were to decide that coastal wetland loss is likely to be too great, these areas would be better candidates for wetland migration than areas depicted in brown. Similarly, private conservancies might consider conservation easements in these areas to ensure the long-term survival of coastal wetlands. Second, if local elected officials concluded that shore protection costs were likely to be too great, these areas are less likely to receive funding for shore protection. These areas will
9 December 5, 2005 Sea level Rise in the TCRPC Treasure Coast Region
probably be protected, but unlike the areas where shore protection is certain, there is at least a plausible reason why shores might not be protected. The land uses within this scenario include less densely developed areas, future development outside of growth areas, extensively developed CBRA coastal areas and private beaches. Moderately used parks used for purposes other than conservation, future development where a park or refuge is also planned, agricultural areas with historical shore protection and military lands where protection is not certain are also included in this approach. As with the previous scenario, it is easy to assume that these mostly privately owned areas are too valuable to abandon. However, because these areas are not extensively developed yet, they have not reached the point of critical mass where it would be inconceivable for policymakers and landowners to allow them to retreat. Protection Unlikely (Dark Blue). Several areas exist in the region where shores seem unlikely to be protected. Identifying these areas is important for at least two reasons: First, the unlikelihood of long-term shore protection implies that people thinking about building structures in such an area must recognize that the land will probably be given up to the sea. Second, environmental planners can reasonably assume that wetlands or beaches will eventually migrate onto these lands. Because there is no expectation of shore protection, conservation easements that ensure long-term wetland migration should be relatively inexpensive. Areas unlikely to be protected are places where lands are probably going to retreat, but where there is no absolute policy against shore protection. Generally, these are areas where land values are low compared with shore protection. In the case of privately owned non-conservation lands, shore protection would not be cost effective compared to the value for the land. Land expected to become part of a nature reserve, but not guaranteed, are also in this category. “Protection unlikely” areas include undeveloped privately-owned lands, un-bridged barrier islands or lightly-developed coastal high hazard areas, minimally-used parks, undeveloped areas where most of the land will be part of wildlife refuge but where development is also planned and conservation easements that preclude shore protection. No Protection (Light Green). The final protection scenario is termed as “no protection.” This includes lands that are certain not to be protected, because they are conservation lands where shore protection is absolutely prohibited. Private lands owned by conservation groups, conservation easements that preclude shore protection; wildlife refuges and parks with a policy preference for natural occurring processes and public lands/parks with little or nor prospect for public use are within this category. Wetlands (Dark Green). Wetlands were also mapped in this project. Most authors have concluded that wetlands could not keep pace with a significant acceleration in sea level rise and thus, that the area of wetlands converted to open water will be much greater than the area of dry land converted to wetlands. Moreover, in areas where dikes protect farmland or structures, all the wetlands could be lost (Titus et al. 1991). The sea level rise maps produced in this study also show water areas in light blue. This category includes the open water of the Atlantic Ocean, coastal estuaries, rivers, lakes, and canals. All
10 December 5, 2005 Sea level Rise in the TCRPC Treasure Coast Region
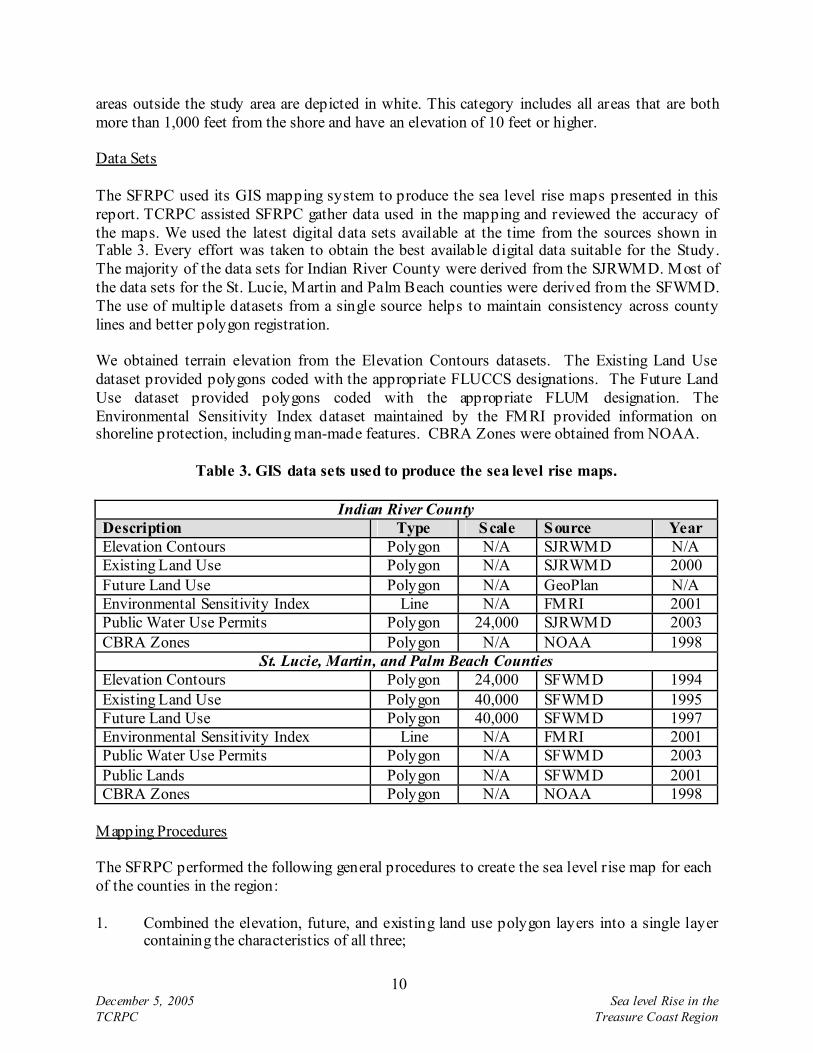
areas outside the study area are depicted in white. This category includes all areas that are both more than 1,000 feet from the shore and have an elevation of 10 feet or higher. Data Sets The SFRPC used its GIS mapping system to produce the sea level rise maps presented in this report. TCRPC assisted SFRPC gather data used in the mapping and reviewed the accuracy of the maps. We used the latest digital data sets available at the time from the sources shown in Table 3. Every effort was taken to obtain the best available digital data suitable for the Study. The majority of the data sets for Indian River County were derived from the SJRWMD. Most of the data sets for the St. Lucie, Martin and Palm Beach counties were derived from the SFWMD. The use of multiple datasets from a single source helps to maintain consistency across county lines and better polygon registration. We obtained terrain elevation from the Elevation Contours datasets. The Existing Land Use dataset provided polygons coded with the appropriate FLUCCS designations. The Future Land Use dataset provided polygons coded with the appropriate FLUM designation. The Environmental Sensitivity Index dataset maintained by the FMRI provided information on shoreline protection, including man-made features. CBRA Zones were obtained from NOAA.
Table 3. GIS data sets used to produce the sea level rise maps.
Indian River County Description Type Scale Source Year Elevation Contours Polygon N/A SJRWMD N/A Existing Land Use Polygon N/A SJRWMD 2000 Future Land Use Polygon N/A GeoPlan N/A Environmental Sensitivity Index Line N/A FMRI 2001 Public Water Use Permits Polygon 24,000 SJRWMD 2003 CBRA Zones Polygon N/A NOAA 1998
St. Lucie, Martin, and Palm Beach Counties Elevation Contours Polygon 24,000 SFWMD 1994 Existing Land Use Polygon 40,000 SFWMD 1995 Future Land Use Polygon 40,000 SFWMD 1997 Environmental Sensitivity Index Line N/A FMRI 2001 Public Water Use Permits Polygon N/A SFWMD 2003 Public Lands Polygon N/A SFWMD 2001 CBRA Zones Polygon N/A NOAA 1998
Mapping Procedures The SFRPC performed the following general procedures to create the sea level rise map for each of the counties in the region: 1. Combined the elevation, future, and existing land use polygon layers into a single layer
containing the characteristics of all three;
11 December 5, 2005 Sea level Rise in the TCRPC Treasure Coast Region
2. Added two fields to the database: ACRES, which was calculated for each polygon; and
SEARISE, which would eventually contain the sea level rise category; 3. Designated the study area by removing all polygons not in the study area. Using
elevation data, we changed the color of all polygons 10 feet and higher to white and the SEARISE field was changed to “Outside Study Area.” In addition, all polygons within 1,000 feet of the coastline were included in the study area, regardless of elevation. The remaining lands were less than 10 feet in elevation and represented the study area;
4. Removed wetlands from the study area by selecting polygons less than 10 feet in
elevation based on FLUCS codes and FLUM designations. The color of these was changed to dark green and their SEARISE field to “Wetlands;”
5. Removed water by selecting polygons less than 10 feet in elevation based on FLUCS
codes and FLUM designations. The color of these was changed to light blue and SEARISE to “Water;”
6. Used the appropriate FLUCS codes and FLUM designations to select the polygons
representing uplands less than 10 feet in elevation that represented the following areas: “Protection Almost Certain” (brown), “Protection Reasonably Likely” (red) and “Protection Unlikely” (dark blue);
7. Defined additional “Protection Almost Certain” (brown) areas based on coastline
characteristics as depicted by the FMRI Environmentally Sensitive Shorelines database. We used the following criteria: any dark blue or red polygon completely surrounded by 1) armored or renourished shore, 2) another brown area, or 3) an area 10 feet or higher in elevation, was deemed to be “Protection Almost Certain” by default and changed to brown;
8. Followed the procedures of the state-wide approach to identify agriculture, conservation
lands, preserves, parks, recreation lands based on FLUCS codes and FLUM designations and labeled them “No Protection” with a light green color;
9. Given the scale of the original datasets, and the regional scope of the Study, 11 x 17 inch
maps were prepared for each county. The maps were then exported in Adobe Acrobat PDF format;
10. Used the GIS software to calculate acreage by Sea Level Rise category for each county
and exported the results to MS Excel files. Local Government Review The contract for this project required local government staff to review the draft sea level rise maps for each county. Local planners are the best authorities to identify whether specific areas of their regions will be protected against sea level rise. The state-wide approach (Table 2)
12 December 5, 2005 Sea level Rise in the TCRPC Treasure Coast Region
recognizes instances where existing land use data formats may not be complete enough to identify a protection scenario for a land area. Local planner input is particularly helpful in determining the future status of currently undeveloped areas. Whether an undeveloped area outside of a growth area will be developed in the future is a determinant of the protection status of the locale. Local planner information is also invaluable in determining whether park areas or conservation lands should be protected against sea level rise. TCRPC planning staff first met with the planning staff of the SFRPC on December 6, 2002 to discuss the data collection, mapping procedures, and analysis of the data. Upon receipt of the first round of draft maps for the project, TCRPC performed an internal review of the maps with regional planners on October 13, 2003. Upon receipt of revised maps, TCRPC arranged a series of individual meetings to solicit input from local government planners in each of the counties in the Treasure Coast Region. The first round of meetings took place In November 2003. Council staff met with planners in Palm Beach County on November 12, 2003; Martin County on November 13, 2003; Indian River County on November 14, 2003; and St. Lucie County on November 25, 2003. The planning directors and key county staff members participated in reviewing the draft sea level rise maps. After the meetings to solicit input from local government planners in 2003, the SWFRPC and EPA modified the mapping procedures for the sea level rise project. This resulted in the creation of a new set of maps for the region. TCRPC received the first draft of the modified maps in 2004. After regional review, these maps were revised again in 2005. The latest revisions of the sea level rise maps were received by TCRPC in June 2005. TCRPC staff scheduled a second round of meetings to get additional input from local government planners. TCRPC staff met with planners in Martin County on August 31, 2005; St. Lucie County on September 1, 2005; Palm Beach County on September 1, 2005; and Indian River County on September 2, 2005. Local government planners provided comments on the state-wide planning approach, draft sea level rise maps, and other coastal management issues. The individual planners that participated in these meetings are identified in the Acknowledgments section of this report. Comments from local government planners are summarized in the Map Analysis section of this report. The sea level rise maps in this report include the modifications recommended by local government planners.
13 December 5, 2005 Sea level Rise in the TCRPC Treasure Coast Region
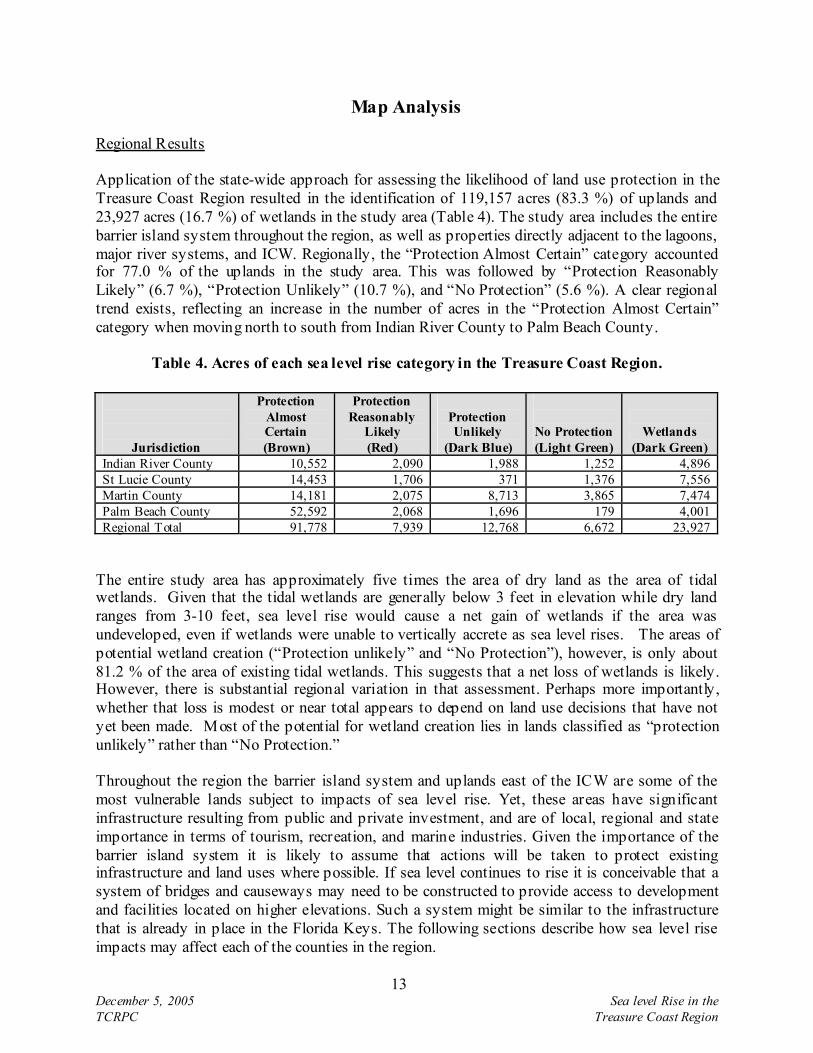
Map Analysis Regional Results Application of the state-wide approach for assessing the likelihood of land use protection in the Treasure Coast Region resulted in the identification of 119,157 acres (83.3 %) of uplands and 23,927 acres (16.7 %) of wetlands in the study area (Table 4). The study area includes the entire barrier island system throughout the region, as well as properties directly adjacent to the lagoons, major river systems, and ICW. Regionally, the “Protection Almost Certain” category accounted for 77.0 % of the uplands in the study area. This was followed by “Protection Reasonably Likely” (6.7 %), “Protection Unlikely” (10.7 %), and “No Protection” (5.6 %). A clear regional trend exists, reflecting an increase in the number of acres in the “Protection Almost Certain” category when moving north to south from Indian River County to Palm Beach County.
Table 4. Acres of each sea level rise category in the Treasure Coast Region.
Jurisdiction
Protection Almost Certain (Brown)
Protection Reasonably
Likely (Red)
Protection Unlikely
(Dark Blue)
No Protection (Light Green)
Wetlands (Dark Green)
Indian River County 10,552 2,090 1,988 1,252 4,896 St Lucie County 14,453 1,706 371 1,376 7,556 Martin County 14,181 2,075 8,713 3,865 7,474 Palm Beach County 52,592 2,068 1,696 179 4,001 Regional Total 91,778 7,939 12,768 6,672 23,927
The entire study area has approximately five times the area of dry land as the area of tidal wetlands. Given that the tidal wetlands are generally below 3 feet in elevation while dry land ranges from 3-10 feet, sea level rise would cause a net gain of wetlands if the area was undeveloped, even if wetlands were unable to vertically accrete as sea level rises. The areas of potential wetland creation (“Protection unlikely” and “No Protection”), however, is only about 81.2 % of the area of existing tidal wetlands. This suggests that a net loss of wetlands is likely. However, there is substantial regional variation in that assessment. Perhaps more importantly, whether that loss is modest or near total appears to depend on land use decisions that have not yet been made. Most of the potential for wetland creation lies in lands classified as “protection unlikely” rather than “No Protection.” Throughout the region the barrier island system and uplands east of the ICW are some of the most vulnerable lands subject to impacts of sea level rise. Yet, these areas have significant infrastructure resulting from public and private investment, and are of local, regional and state importance in terms of tourism, recreation, and marine industries. Given the importance of the barrier island system it is likely to assume that actions will be taken to protect existing infrastructure and land uses where possible. If sea level continues to rise it is conceivable that a system of bridges and causeways may need to be constructed to provide access to development and facilities located on higher elevations. Such a system might be similar to the infrastructure that is already in place in the Florida Keys. The following sections describe how sea level rise impacts may affect each of the counties in the region.
14 December 5, 2005 Sea level Rise in the TCRPC Treasure Coast Region
Indian River County A total of 15,883 acres of uplands and 4,896 acres of wetlands were identified in the Indian River County portion of the study area (Map 1). The “Protection Almost Certain” category accounts for the largest percentage of the uplands (66.4 %) in the study area in Indian River County. The combination of the “Protection Almost Certain” and “Protection Reasonably Likely” categories accounted for about 79.6 % of the uplands in the study area in this county. The upland areas most likely to be affected by sea level rise represent about 4.9 % of the total area of Indian River County. The main areas of impact are expected on the barrier island, on the shorelines of the Indian River Lagoon and Sebastian River, and within islands in the lagoon and river systems. The county and four of the five municipalities in the county have jurisdiction over land use planning in the study area. The affected municipalities include the City of Vero Beach, City of Sebastian, Town of Indian River Shores, and Town of Orchid. Barrier Island. The barrier island in Indian River County is known as Orchid Island. The northern end of Orchid Island is Sebastian Inlet State Park, which is dominated by wetlands. The narrowest part of the island is the stretch just south of the park. Because of its narrow width, this area is the portion of the island that is most susceptible to being breached by a hurricane. The creation of a new inlet in this area would interrupt State Road A1A. Local planners have indicated that they generally expect the highway will be protected. This may be accomplished by closing any new inlet that forms and maintaining a sufficient buffer to protect the integrity of the road. Alternatively, the road could be maintained by a bridge over the new inlet. The narrow strip of land in this area is classified “Protection Reasonably Likely,” indicating that the road would likely be maintained in this area. The largest light green area signifying “No Protection” on the Orchid Island is part of Pelican Island National Wildlife Refuge. The brown area signifying “Protection Almost Certain” south of Pelican Island National Wildlife Refuge is the Town of Orchid. The larger brown area to the south is the Town of Indian River Shores. Between Orchid and Indian River Shores, our maps show communities that are almost certain to be protected interspersed with areas where protection is less likely. The brown areas on the barrier island primarily represent residential areas with significant land value. The extensive brown area on the southern half of the barrier island is primarily residential and has water and sewer service by the City of Vero Beach. Mainland along the Sebastian River. The western shore of the Sebastian River is primarily light green signifying “No Protection.” This area is within the St. Sebastian River Preserve State Park. This is the largest area in the county where the inland migration of wetlands could take place as sea level rises.
Map 1. Anticipated response to sea level rise in Indian River County.
15 December 5, 2005 Sea level Rise in the TCRPC Treasure Coast Region
16 December 5, 2005 Sea level Rise in the TCRPC Treasure Coast Region
The eastern shore of the Sebastian River is primarily red signifying “Protection Reasonably Likely.” This area includes a number of low lying residential communities. Local planners have indicated that the red classification is appropriate in this area. Mainland along the Indian River Lagoon. The northern shore of the lagoon is primarily red signifying “Protection Reasonably Likely” for the areas surrounding and on the outskirts of the City of Sebastian. Local planners have indicated that this classification seems appropriate. South of this area the shoreline of the Indian River Lagoon is primarily brown signifying “Protection Almost Certain.” Much of this area has recently been developed or is in the process of being developed. These new residential areas have well designed drainage systems to help protect the lagoon. The Grand Harbor development and the downtown area of the City of Vero Beach are primarily brown signifying “Protection Almost Certain.” South of the downtown area of the City of Vero Beach is primarily brown. The developed areas east of Indian River Boulevard are very low lying areas that are shown red signifying “Protection Reasonably Likely.” Planner Review. Indian River County planners had the following comments concerning the state-wide approach for identifying likelihood of land use protection (Table 2) and the Indian River County sea level rise map (Map 1):
• The land use in much of the study areas has changed very dramatically in the last 4-5 years. Many areas that were previously vacant are now developed. It would be desirable if the study could be based on more current land use data.
• The area where the barrier island is most likely to be breached is near the north end where it very narrow. If the island is breached it is almost certain that State Road A1A would be maintained through protection of the land or construction of a bridge.
• The extensive area on the southern half of the barrier island is primarily residential and has water and sewer service by the City of Vero Beach. This area was changed from red to brown based on planner input.
• The large light green area on the north end of the barrier island is part of Pelican Island National Wildlife Refuge. This area was changed from dark blue to light green based on planner input.
• The light green area on the west side of the South Prong of the Sebastian River is part of the Sebastian Creek State Preserve. This area was changed from dark blue to light green based on planner input.
• The red areas along the east shore of the South Prong of the Sebastian River and along the west side of the Indian River Lagoon in the northern part of the county are primarily older residential areas. The classification of “Protection Reasonably Likely” is appropriate in these areas.
• Most of the areas north of the Grand Harbor development on the west shore of the Indian River Lagoon are areas that were previously agriculture. Most of these areas have recently been converted or they are in the process of converting to residential. These new residential areas have well designed drainage systems to help protect the lagoon. These areas were changed from dark blue to brown based on planner input.
17 December 5, 2005 Sea level Rise in the TCRPC Treasure Coast Region
• The areas south of Grand Harbor to the downtown area of the City of Vero Beach have been developed recently. These areas were changed from dark blue and red to brown based on planner input.
• The majority of the areas north of the City of Vero Beach on the mainland have been developed recently. These areas were changed from dark blue to brown based on planner input.
• The area south of the downtown area of the City of Vero Beach along the west shore of the Indian River Lagoon heavily developed. The areas west of Indian River Boulevard south to the county line were changed from red to brown based on planner input. The low lying areas east of Indian River Boulevard should remain red.
• The county does not currently have policies specifically dealing with sea level rise. • The county will be updating the comprehensive plan through the EAR process in 2008. • County planners will consider adding new policies dealing with sea level rise in the next
major update to the comprehensive plan.
18 December 5, 2005 Sea level Rise in the TCRPC Treasure Coast Region
St. Lucie County A total of 17,906 acres of uplands and 7,556 acres of wetlands were identified in the St. Lucie County portion of the study area (Map 2). The “Protection Almost Certain” category accounts for the largest percentage (80.7 %) of the uplands in the study area in St. Lucie County. The combination of the “Protection Almost Certain” and “Protection Reasonably Likely” categories accounts for 90.2 % of the uplands in the study area in this county. St. Lucie County has almost no areas classified as “Protection Unlikely,” because most of the agricultural land adjacent to the coastal waterways has already been developed or protected in conservation areas. St. Lucie County has the greatest acreage of wetlands in the four counties examined. This wetland acreage accounts for 31.6 % of the wetlands identified in the regional study area. The main areas classified as “Wetlands” are located along the eastern shoreline of the Indian River Lagoon and in the North Fork of St. Lucie River. Most of these wetland areas have limited or no opportunity for the inland migration as the sea level rises because they are adjacent to developed areas. The upland areas most likely to be affected by sea level rise represent about 4.9 % of the total area of St. Lucie County. The main areas of impact are expected on the barrier island, on the shorelines of the Indian River Lagoon and North Fork of the St. Lucie River, and within islands in the lagoon and river systems. The county and all three of the municipalities in the county have jurisdiction over land use planning in the study area. The affected municipalities include the City of Port St. Lucie, City of Fort Pierce, and Town of St. Lucie Village. Barrier Islands. The barrier islands in St. Lucie are known as North Hutchinson Island north of the Fort Pierce Inlet and South Hutchinson Island south of the inlet. Avalon Beach State Park occurs near the north end of North Hutchinson Island. This park includes the largest area of light green signifying “No Protection” on the barrier Island system in the county. Areas south of the park are primarily low density residential and high rise multifamily buildings. These areas are red signifying “Protection Reasonably Likely” and brown signifying “Protection Almost Certain.” The area near the Inlet is Fort Pierce Inlet State Recreation Area, which also includes some areas of light green signifying “No Protection.” Local government planners noted that the island has numerous narrow areas where it could be breached by a hurricane. If the island is breached at any location it is almost certain that State Road A1A would be maintained through protection of the land or construction of a bridge. Maintenance of the road is important to provide access to recreational facilities and for emergency evacuations. The north end of South Hutchinson Island is connected to a causeway on the south side of the Fort Pierce Inlet. The causeway includes the Smithsonian Institute, U.S. Coast Guard Station, historical museum, and a variety of other commercial and public uses. Local Planners indicate the use of brown signifying “Protection Almost Certain” is appropriate in this area. Residential areas in Fort Pierce extend south along the barrier Island from the inlet. These areas are red and brown. Local Planners indicate that South Hutchinson Island has numerous narrow areas where it could be breached by a hurricane. If the island is breached at any location it is almost certain that State Road A1A would be maintained through protection of the land or construction of a bridge.
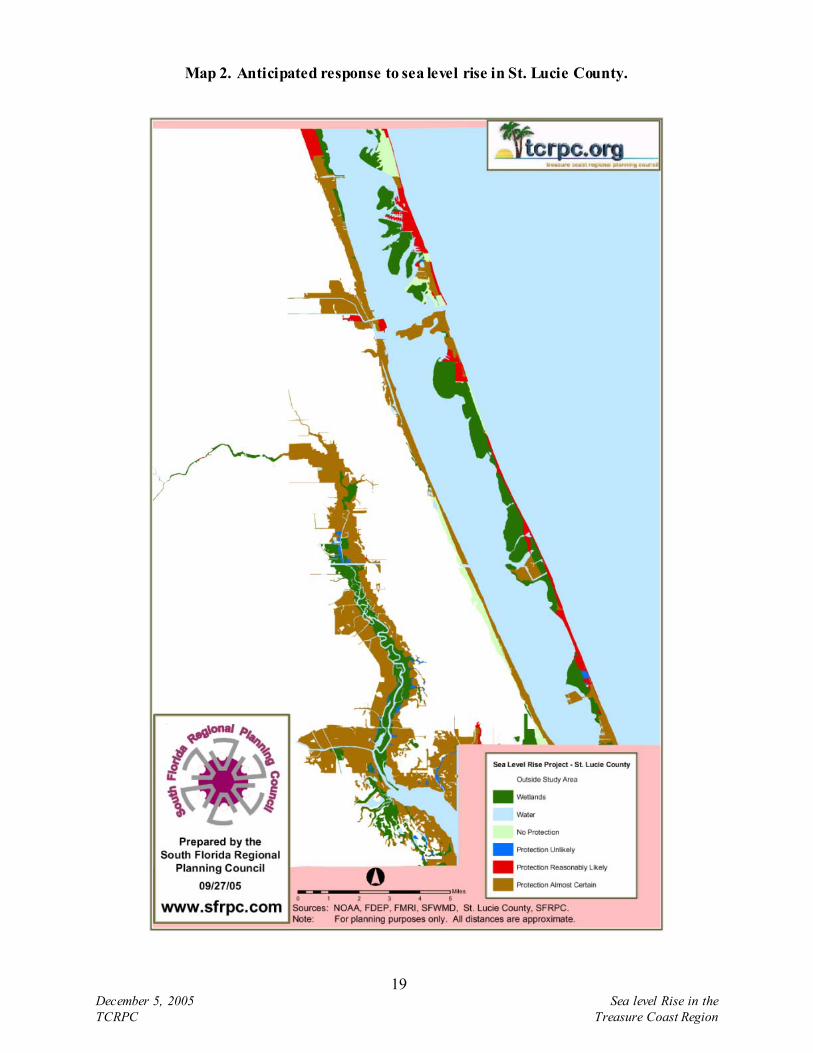
Map 2. Anticipated response to sea level rise in St. Lucie County.
19 December 5, 2005 Sea level Rise in the TCRPC Treasure Coast Region
20 December 5, 2005 Sea level Rise in the TCRPC Treasure Coast Region
However, the land lying east of A1A on the barrier island is very vulnerable. These areas should be considered for relocation in the event of destruction by a hurricane. The central portion of South Hutchinson Island contains the most significant critical facility in St. Lucie County, the FPL St. Lucie Nuclear power plant. This area is brown signifying “Protection Almost Certain.” Local planners have indicated that it is critical that the road be maintained in this area through protection of the land or construction of a bridge. The road is necessary for hurricane evacuation and evacuation in the event of an emergency at the FPL St. Lucie nuclear power plant. The areas to the south of the power plant on South Hutchinson Island are primarily multifamily residential on both sides of State Road A1A. Also, there are two mobile home areas along the lagoon, including Nettles Island which extends into the lagoon. Nettles Island and the areas dominated by high rise developments are shown in brown signifying “Protection Almost Certain.” Local Planners noted that Nettles Island is very low and seems very vulnerable to sea level rise. It is not clear how or if this area will be protected from sea level rise. Mainland along the Indian River Lagoon. The upland areas of the northern shore of the lagoon are primarily red signifying “Protection Reasonably Likely” and brown signifying “Protection Almost Certain.” The northernmost brown area is the Harbor Branch Oceanographic Institution. The red areas north of this area are primarily residential. The brown areas south of Harbor Branch south to Fort Pierce include a variety of commercial, industrial and residential uses. This also includes the historic district of the Town of St. Lucie Village. The most densely populated urban center in the county is the City of Fort Pierce. A portion of the City is classified as “Protection Reasonably Likely,” but much of the downtown area is classified as “Protection Almost Certain.” Critical facilities in the downtown Fort Pierce include the Fort Pierce Municipal Power Plant and the Port of Fort Pierce. The power plant is an older facility that may be replaced in future years. The Port is an under developed facility that is likely to be expanded in future years. Sea level rise issues should play an important role in the future planning of both of these facilities. The western shoreline of the Indian River Lagoon south of Fort Pierce is classified “Protection Almost Certain.” The mapped categories in this area are narrow because the elevations are very steep along this stretch of the lagoon. In spite of relatively high elevation above sea level, the narrow road on the bluff in this area suffered from storm erosion during the recent hurricanes in 2004. The county is actively working to repair the storm damage and armor these areas to prevent erosion in the future. Local planners have indicated that the brown areas signifying “Protection Almost Certain” south of Fort Pierce on the west side of the Indian River Lagoon are appropriate because the county has already made a commitment to protect the shoreline. Mainland along the North Fork of the St. Lucie River. The largest area in the county classified as “Protection Almost Certain” occurs on both sides of the North Fork of the St. Lucie River. This area is primarily residential development in the City of Port St. Lucie. The areas surrounding the northern reaches of this river system have experienced recent residential development. Local planners have indicated that sea level rise may convert some of the fresh
21 December 5, 2005 Sea level Rise in the TCRPC Treasure Coast Region
water wetland systems along the North Fork of the St. Lucie River to estuarine systems. The wetland areas along the river north of about Midway Road are primarily fresh water systems that may be affected. Planner Review. St. Lucie County planners had the following comments concerning the state-wide approach for identifying likelihood of land use protection (Table 2) and the St. Lucie County sea level rise map (Map 2):
• The barrier island has numerous narrow areas where it could be breached by a hurricane. If the island is breached at any location it is almost certain that State Road A1A would be maintained through protection of the land or construction of a bridge. The road is necessary for hurricane evacuation and evacuation in the event of an emergency at the FPL St. Lucie nuclear power plant.
• Nettles Island is very low and seems very vulnerable to sea level rise. It is not clear how or if this area will be protected from sea level rise.
• In general, the land lying east of A1A on the barrier island is very vulnerable. These areas should be considered for relocation in the event of destruction by a hurricane.
• The area in brown on the south side of the Fort Pierce inlet includes the Smithsonian Institute, U.S. Coast Guard Station, historical museum, and a variety of other commercial and public uses. The use of brown signifying “Protection Almost Certain” is appropriate in this area.
• The brown area north of Fort Pierce is the historic district of St. Lucie Village. This area was changed from red to brown based on planner input.
• The shoreline along the west side of the Indian River Lagoon was damaged by erosion from the hurricanes in 2004. The county has made a commitment to protect the shoreline in this area. This area was changed from red to brown based on planner input.
• The county has few places where wetlands will be able to migrate inland as sea level rises. Avalon Beach State Park is one of the largest areas where this may occur.
• Sea level rise may convert some of the fresh water wetland systems along the North Fork of the St. Lucie River to estuarine systems. The wetland areas along the river north of about Midway Road are primarily fresh water systems that may be affected.
• Many of the mangrove systems in the Indian River Lagoon could persist in place as the sea level rises. Management of the impounded mangrove systems for mosquito control may need to be adjusted to compensate for changes in sea level.
• The extensive brown area along the North Fork of the St. Lucie River is primarily residential development in the City of Port St. Lucie. The use of brown signifying “Protection Almost Certain” is appropriate in this area.
• The area at the upper reaches of the North Fork of the St. Lucie River has experienced recent residential development. This area was changed from red to brown based on planner input.
• The county does not currently have policies specifically dealing with sea level rise. • The county will be updating the comprehensive plan through the EAR process in 2007. • County planners will consider adding new policies dealing with sea level rise in the next
major update to the comprehensive plan.
22 December 5, 2005 Sea level Rise in the TCRPC Treasure Coast Region
Martin County A total of 28,834 acres of uplands and 7,474 acres of wetlands were identified in the Martin County portion of the study area. The “Protection Almost Certain” category accounts for 49.2 % of the uplands in the study area in Martin County (Map 3). The combination of the “Protection Almost Certain” and “Protection Reasonably Likely” categories accounts for 56.4 % of the uplands in the study area in this county. Martin County contains the largest acreage of the “Protection Unlikely” category in the four counties examined. Relatively large areas classified as “Wetlands” are located along the shoreline of the Indian River Lagoon. The wetlands in these areas are primarily mangrove forest. The other relatively large areas classified as “Wetlands” occur at the upper reaches of the South Fork of the St. Lucie River, North Fork of the Loxahatchee River, and Northwest Fork of the Loxahatchee River. These wetland systems currently transition from mangrove forests to freshwater forested systems. The upland areas most likely to be affected by sea level rise represent about 7.2 % of the total area of Martin County. The main areas of impact are expected on the barrier islands; shorelines of the Indian River Lagoon, St. Lucie, and Loxahatchee Rivers; and within islands in the lagoon and river systems. The affected municipalities include the City of Stuart, Town of Sewall’s Point, Town of Ocean Breeze Park, and Town of Jupiter Island. Barrier Islands. The barrier islands in Martin County are Hutchinson Island north of the St. Lucie Inlet and Jupiter Island south of the inlet. State Road A1A extends south on Hutchinson Island into Martin County from St. Lucie County. This portion of Martin County is primarily brown signifying “Protection Almost Certain” with dark green identifying wetlands. The developed areas are predominately residential. MacArthur Boulevard extends to a development known as Sailfish Point at the south end of Hutchinson Island. This is an extremely narrow portion of the Barrier Island and the roadway was damaged during the 2004 hurricane season. The county has repaired the road and armored this area to protect it from future storms. Local planners have indicated that the roads on the barrier islands are expected to be maintained in the event of breaching. The roads are important to reach recreational areas and for hurricane evacuation. The entire north end of Jupiter Island consists of the St. Lucie Inlet Preserve State Park and Hobe Sound National Wildlife Refuge. These areas consist primarily of mangrove wetlands and sandy beaches and dunes. The uplands are identified in light green signifying “No Protection.” The narrowest point of Jupiter Island occurs near Peck Lake. Local planners have indicated that if Jupiter Island is breached near Peck Lake, it is likely that the new inlet would remain. This area is part of Hobe Sound National Wildlife Refuge and does not currently have a road. A breach in any other part of Jupiter Island with a road would be repaired and protected.
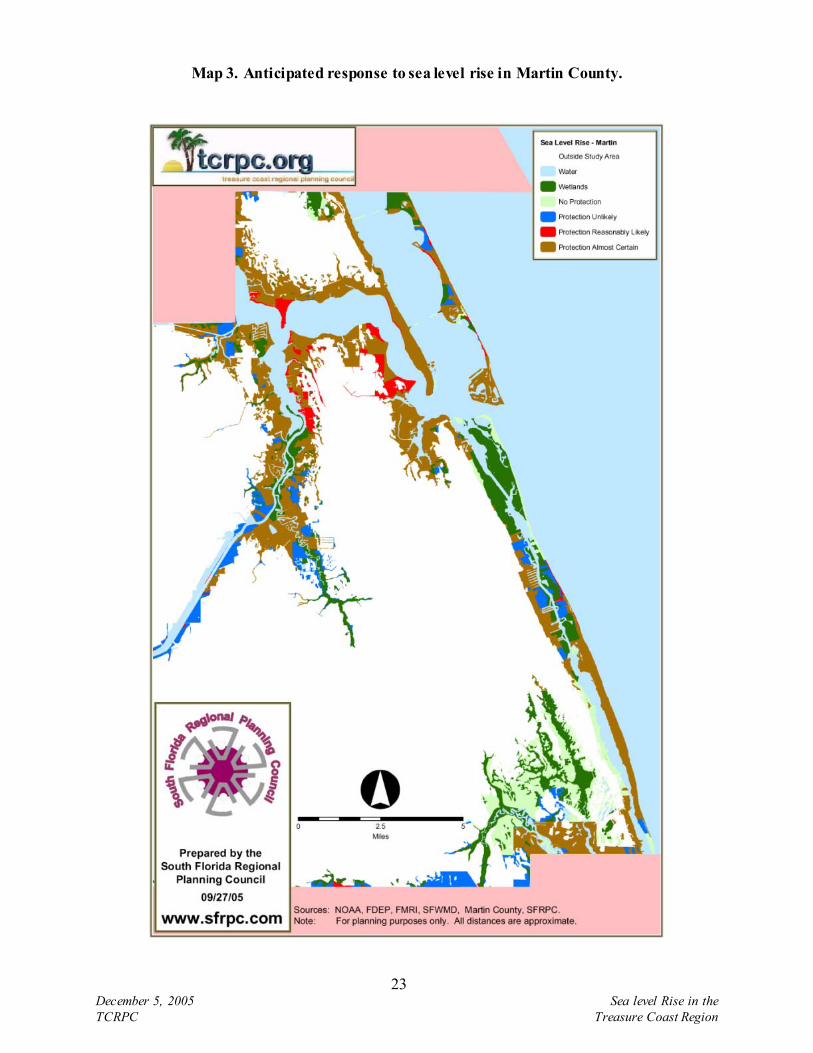
Map 3. Anticipated response to sea level rise in Martin County.
23 December 5, 2005 Sea level Rise in the TCRPC Treasure Coast Region
24 December 5, 2005 Sea level Rise in the TCRPC Treasure Coast Region
Most of the southern portion of Jupiter Island is brown signifying “Protection Almost Certain.” This is primarily a residential area in the Town of Jupiter Island. The light green area at the south end of the island is The Nature Conservancy’s Blowing Rocks Preserve. If this area were to be breached, local planners have indicated that the main road through Jupiter Island would be protected. Mainland along the Indian River Lagoon. The upland areas of the northern shore of the lagoon are primarily brown signifying “Protection Almost Certain.” North of the St. Lucie River these areas include the Town of Ocean Breeze Park and the Town of Sewall’s Point. South of the St. Lucie River, the lagoon shoreline is a brown where the area is dominated by residential development. A large expanse of wetlands occurs on the shore of the lagoon directly west of St. Lucie Inlet State Preserve. This area is part of Seabranch Preserve State Park. Most of the areas on the western shore of the lagoon south of this point are brown signifying “Protection Almost Certain” or dark blue signifying “Protection Unlikely.” Most of the brown represents residential areas with significant infrastructure. The light green areas signifying “No Protection” are uplands associated with Seabranch Preserve State Park and the Hobe Sound National Wildlife Refuge. The very southern segment of the western shore of the lagoon is brown signifying “Protection Almost Certain.” This area is a mix of commercial and residential development. Mainland along the St. Lucie River. The upland areas of the shores of the St. Lucie River are primarily brown signifying “Protection Almost Certain.” This area includes a mix of residential, office, commercial, and marine uses in and near the City of Stuart. This is the most populated area in Martin County. Several of these areas are red signifying “Protection Reasonably Likely.” The southern reaches of the South Fork of the St. Lucie River have extensive fresh water wetland systems. These areas are very susceptible to conversion to a salt water system, which would result in major ecological changes to the natural communities along the river. Mainland along the Loxahatchee River. The North and Northwest Forks of the Loxahatchee River enter Martin County in the extreme southeastern portion of the county. The major expanses of light green signifying “No Protection” and dark green signifying “Wetlands” in this area occur in Jonathan Dickinson State Park. The brown areas to the south of the park are primarily residential. Local planners have indicated that parts of this area currently may be on well and septic tank, but much of this area is slated to be hooked up to public water and wastewater facilities. The Loxahatchee River has extensive freshwater wetlands that may be impacted by sea level rise. The Northwest Fork of the Loxahatchee River is designated as a National Wild and Scenic River (TCRPC 1999, FDEP and SFWMD 2000). The SFWMD and FDEP are currently preparing a restoration plan designed to reduce current levels of salt water intrusion up the river. The SFWMD and COE are also addressing this salt water intrusion issue through the CERP. Options for increasing freshwater flows down the river and placing salinity barriers at critical locations are being evaluated. Planning for sea level rise may be critical in these restoration efforts. Current restoration plans to protect the river from salt water intrusion may reduce the potential for wetland migration up the Northwest Fork of the Loxahatchee River.
25 December 5, 2005 Sea level Rise in the TCRPC Treasure Coast Region
Planner Review. Martin County planners had the following comments concerning the state-wide approach for identifying likelihood of land use protection (Table 2) and the Martin County sea level rise map (Map 3):
• The red and brown areas seem similar enough that a distinction between them may be unwarranted in the report. Both of these areas represent developed areas that will likely be protected. There is value in distinguishing between developed and undeveloped areas.
• The main focus of the report should be identifying all land within the10-foot corridor so that planning issues can focus on concerns related to sea level rise.
• The area at the south end of Jonathan Dickinson Sate Park is primarily single family residential. Parts of this area currently are on well and septic tank, but much of this area is slated to be hooked up to public water and wastewater facilities. This area was changed from red to brown based on planner input.
• There are several areas where the barrier island is extremely narrow and could be breached by a hurricane. If the Island is breached north of the inlet, State Road A1A and the road to Sailfish Point will be maintained. In fact, the road to Sailfish Point was recently repaired and armored after being damaged in the 2004 hurricane season.
• If Jupiter Island is breached near Peck Lake, it is likely that the new inlet would remain. This area is part of Hobe Sound National Wildlife Refuge and does not currently have a road. A breach in any other part of Jupiter Island with a road would be repaired and protected. The roads are important to reach recreational areas and for hurricane evacuation.
• Martin County has already made a significant financial commitment to repair and armor Indian River Drive after it was damaged by erosion in the 2004 hurricane season.
• The Loxahatchee River and South Fork of the St. Lucie River have extensive fresh water wetland systems. These areas are very susceptible to conversion to a salt water system, which would result in major ecological changes.
• The county does not currently have policies specifically dealing with sea level rise. • The county will be updating the comprehensive plan through the EAR process in 2008. • County planners will consider adding new policies dealing with sea level rise in the next
major update to the comprehensive plan.
26 December 5, 2005 Sea level Rise in the TCRPC Treasure Coast Region
Palm Beach County A total of 56,535 acres of uplands and 4,001 acres of wetlands were identified in the Palm Beach County portion of the study area (Map 4). The “Protection Almost Certain” category in this county accounts for about 44.1 % of the uplands in the study area within the region, and 93.0 % of the uplands in the study area in Palm Beach County. The combination of the “Protection Almost Certain” and “Protection Reasonably Likely” categories accounts for 96.7 % of the uplands mapped in this county. The wetlands remaining in the Palm Beach County portion of the study area account for only 16.7 % of the wetlands identified in the region. The county has no significant concentrations of areas classified as “Wetlands,” and there are little or no opportunities for the inland migration of wetlands in Palm Beach County. The upland areas most likely to be affected by sea level rise represent about 4.3 % of the total area of Palm Beach County. The main areas of impact are expected on the barrier islands and areas east of the ICW; shorelines of the Indian River Lagoon, Lake Worth Lagoon and other estuaries; shorelines of the Loxahatchee River; shorelines of several inland waterways; and within islands in the lagoon and river systems. The municipalities that boarder the ICW or Atlantic Ocean have the greatest potential to be affected by sea level rise. These include the following 23 municipalities in Palm Beach County:
• City of Boca Raton • City of Boynton Beach • Town of Briny Breezes • City of Delray Beach • Town of Gulf Stream • Town of Highland Beach • Town of Hypoluxo • Town of Juno Beach • Town of Jupiter • Town of Jupiter Inlet Colony • Town of Lake Park • City of Lake Worth • Town of Lantana • Town of Manalapan • Village of North Palm Beach • Town of Ocean Ridge • Town of Palm Beach • City of Palm Beach Gardens • Town of Palm Beach Shores • City of Riviera Beach • Town of South Palm Beach • Village of Tequesta • City of West Palm Beach

Map 4. Anticipated response to sea level rise in Palm Beach County.
27 December 5, 2005 Sea level Rise in the TCRPC Treasure Coast Region
28 December 5, 2005 Sea level Rise in the TCRPC Treasure Coast Region
Barrier Islands. The barrier islands in Palm Beach County are Jupiter Island north of the Jupiter Inlet, Singer Island north of the Lake Worth Inlet, and Palm Beach Island south of the Lake Worth Inlet. Nearly the entire shoreline along the Atlantic Coast, lagoon systems, and inland waterways of Palm Beach County is developed and classified as “Protection Almost Certain.” An exception just south of the Jupiter Inlet is Carlin Park, which is red signifying “Protection Reasonably Likely.” The barrier island is light green signifying “No Protection” at MacArthur Beach State Park. This is an area where the Barrier Island is very narrow. It would be possible for the Island to be breached at this location without interrupting travel on State Road A1A, which runs on the west side of the island. If the island is breached in the park without affecting State Road A1A, it is likely that the breach would be allowed to remain. However, local planners indicate that the road would be repaired and protected if it is impacted by a hurricane. Peanut Island. The only sizable dark blue area signifying “Protection Unlikely” in the county is Peanut Island, which is located adjacent to the Lake Worth Inlet. Peanut Island is home to a Palm Beach County Park with newly constructed recreational facilities, restored and created fish and wildlife habitat, Palm Beach Maritime Museum, historic former U.S. Coast Guard Station, and dredged material management area used by the Florida Inland Navigation District and the Port of Palm Beach. Local planners have indicated that the dark blue seems appropriate because much of it is used for recreation. The low lying historic structures in the red area on the south side of the island would likely be protected. Mainland along ICW and Lagoon Systems. Nearly the entire length of the county is classified as brown signifying “Protection Almost Certain” on the western shore of the ICW and lagoon systems. This includes a portion of the downtown area of the City of West Palm Beach, the most urbanized portion of the county. This area also includes two main critical facilities, the Port of Palm Beach and FPL Riviera power plant, which are both located on the western shore of Lake Worth Lagoon in the City of Riviera Beach. Sea level rise issues should play an important role in the future planning for these facilities. Inland along the Canal Systems. The sea level rise map for Palm Beach County identifies the areas adjacent to several inland canal systems as brown. These freshwater canals are managed by the SFWMD for flood control purposes. For example, the C-17 canal typically has a discharge elevation set from 8 to 9 feet above sea level; the C-51, C-16, and C-15 canals are typically controlled at from 8.5 to 9.5 feet; and the Hillsborough canal is typically controlled at an elevation from 7.5 to 8.5 feet. These areas were included in the mapping because the discharge elevations of these canals are below 10 feet above sea level. However, the land adjacent to these canal systems is generally above 10 feet in elevation. The mapping procedure that caused these areas to be included in the study area should be evaluated. Similarly, the adequacy of the flood control structures in these canals should also be examined as part of long range planning for sea level rise. Planner Review. Palm Beach County planners had the following comments concerning the state-wide approach for identifying likelihood of land use protection (Table 2) and the Palm Beach County sea level rise map (Map 4):

29 December 5, 2005 Sea level Rise in the TCRPC Treasure Coast Region
• The maps would be more useful if one could zoom in to see more details on a computer. • The maps would be improved if they contained the main roads and municipal boundaries. • The barrier island is very narrow at several locations. If the island is breached it would
likely be repaired and the road would be maintained. The road is very important for hurricane evacuation.
• The dark blue signifying “Protection Unlikely” on much of Peanut Island seems appropriate because much of it is used for recreation. The low lying historic structures on the Peanut Island would likely be protected.
• The county does not currently have policies specifically dealing with sea level rise. • The county will be updating the comprehensive plan through the EAR process in 2009. • County planners will consider adding new policies dealing with sea level rise in the next
major update to the comprehensive plan.
30 December 5, 2005 Sea level Rise in the TCRPC Treasure Coast Region
Discussion Responses to Sea Level Rise Many coastal management, construction, and planning and zoning guidelines can prepare citizens and governments for rising sea levels. The Coastal Zone Management Subgroup of Intergovernmental Panel on Climate Change Response Strategies Working Group (1990) has described the three basic pathways for responding to sea level rise. The strategies of retreat, accommodation and protection are described below: Retreat. This is the strategy of abandoning lands and structures in coastal zones and allowing marine ecosystems to move inland. In this response, there is no effort to protect the land from sea level rise. Governments exercising the retreat option generally prevent development in prone areas, allow development with conditions for abandonment (e.g. rolling easement) and/or withdraw subsidies for construction in danger zones. Governments can restrict development in coastal areas through a variety of policies. These approaches usually include land acquisitions, setbacks, low densities, planning and zoning restrictions on coastal land use, and banning the redevelopment of damaged structures. Accommodation. This strategy allows for land use and occupancy of vulnerable areas to continue, but with no attempts to prevent flooding or inundation. It is a hybrid of retreat and protection, because structures are protected while floodplains and shorelines advance farther inland. Governments favoring accommodation can strengthen flood preparations, prohibit activities that may destroy protective coastal resources and/or deny government flood insurance coverage of inhabitants of vulnerable areas. Strengthened flood preparations may include countering rising seas and high winds through building code requirements, improvement of drainage and education. Like retreat, accommodation requires advance planning by local governments. Local governments must also accept that valuable land may be lost to rising seas. Although accommodation is a common short-term response, it may be less useful in the long run. While it may be practical in some circumstances to maintain habitable homes as wetlands advance onto people’s yards, eventually the wetlands would become inundated and homes would be standing in the water. Protection. This strategy involves using structural, defensive measures to protect the land from the sea, so that land use can continue. Shores can be protected by hard structures such as seawalls, revetments, and dikes, or by soft structural techniques like beach nourishment and elevating land surfaces with fill. Unlike the first two options, protection has a dramatic impact on both the immediate environment and ecosystems beyond the immediate area. The costs to wetlands, unprotected uplands and offshore fisheries must be assessed before protective measures are constructed. Federal Policies and Programs While a few federal policies specifically deal with the problems of sea level rise, a number of policies address the same effects of sea level rise, such as flooding, erosion, and wetland loss.
31 December 5, 2005 Sea level Rise in the TCRPC Treasure Coast Region
These policies are included in the Coastal Zone Management Act, the Coastal Barrier Resources Act, the Clean Water Act and the Rivers and Harbors Act and National Flood Insurance Act. The Coastal Zone Management Act of 1972 is the federal law that created and guides the United States’ coastal management programs. Congress created the CZMA to deal with the threats to the country’s coastal zone caused by increasing and competing demands on the land and water of the zone. The CZMA establishes the coastal management policy of the United States as preserving, protecting, developing, and where possible, restoring or enhancing the resources of the nation's coastal zone by encouraging and assisting the states to exercise to develop and implement their own coastal management programs. Congress also specifically addressed the issue of sea level rise in the Act:
“Because global warming may result in a substantial sea level rise with serious adverse effects in the coastal zone, coastal states must anticipate and plan for such an occurrence.” “The Congress finds and declares that it is the national policy --- the management of coastal development to minimize the loss of life and property caused by improper development in flood-prone, storm surge, geological hazard, and erosion-prone areas and in areas likely to be affected by or vulnerable to sea level rise, land subsidence, and saltwater intrusion, and by the destruction of natural protective features such as beaches, dunes, wetlands, and barrier islands.”
The provisions of the CZMA are realized through the Coastal Zone Management Program (CZMP), which is administered by NOAA. The CZMP is a voluntary federal-state partnership that has provided cost-sharing grants to states to develop and implement their own coastal zone management plans. The CZMP has based eligibility for federal approval of state plans on several factors. Each state’s plan is required to define boundaries of the state’s coastal zone and identify uses within the area to be regulated by the state plan, the criteria for regulations such uses and the guidelines for priorities of uses within the coastal zone. Subsequent to approval of the plan by NOAA, grants are awarded for implementation of the state’s coastal management plan. In addition to providing financial assistance, the CZMP also supports states by offering mediation, technical services and information, and participation in priority state, regional, and local forums. Thirty-four states and territories with federally approved coastal management programs are participants in the CZMP. Almost all of the nation’s shoreline (99.9%) is currently managed by the CZMP. The main effect of the CZMA on the issue of sea level rise is to make state policymakers aware of the matter when they create their own coastal management plans. Another piece of federal legislation that has a bearing on coastal management policies is the Coastal Barrier Resources Act (CBRA), which was enacted in 1982. CBRA was designed to protect barrier islands along the United States coast. Coastal barrier islands are located off of the mainland coast and protect the mainland by receiving the majority of the ocean’s energy contained in winds, waves and tides. Coastal barriers also protect and maintain productive ecosystems that exist within this protective zone. In drafting the law, Congress found that certain actions and programs of the Federal Government have subsidized and permitted development on
32 December 5, 2005 Sea level Rise in the TCRPC Treasure Coast Region
coastal barriers and the result has been the loss of barrier resources, threats to human life, health, and property, and the expenditure of millions of tax dollars each year. CBRA established a Coastal Barrier Resources System, which designated various undeveloped coastal barrier islands for inclusion in the System. The boundaries of the System are contained on maps kept on file by the Department of the Interior. CBRA prohibits various federal actions and policies from occurring on islands within the System. The Act places several restrictions on Federal government spending on expenditures that encourage development or modification of a coastal barrier. No new expenditures or federal assistance can be used on coastal barrier islands for the following projects:
1) The construction or purchase of any structure, appurtenance, facility, or related infrastructure;
2) The construction or purchase of any road, airport, boat landing facility, or other facility
on, or bridge or causeway to, any System unit; and
3) The carrying out of any project to prevent the erosion of, or to otherwise stabilize, any inlet, shoreline, or inshore area, except that such assistance and expenditures may be made available on (certain designated units) for purposes other than encouraging development and, in all units, in cases where an emergency threatens life, land, and property immediately adjacent to that unit.
Notwithstanding the previous restrictions, CBRA does provide exceptions to limitations on a variety of expenditures with the barrier system. These include military and Coast Guard activities; maintenance of federal navigation channels; maintenance of certain publicly owned roads, structures and facilities; scientific research; and non-structural projects for shoreline stabilization that mimics, enhances or restores a natural stabilization system. Non-structural shore erosion control projects usually use bioengineering to create protective vegetative buffers stabilizing stream banks and shorelines and creating near-shore habitats for aquatic species and waterfowl. Another feature of the Act is the prohibition of national flood insurance or HUD assistance to any projects within the barrier system that facilitate an activity that is not consistent with CBRA’s provisions. CBRA is a good start in the prevention of development in areas that will be most affected by the effects of sea level rise. The National Flood Insurance Program (NFIP) is another important component of federal coastal management policy. The NFIP is administered by the Federal Emergency Management Agency (FEMA), with its primary goals being to save lives and reduce future property losses from flooding. The NFIP is a voluntary program based upon a mutual agreement or partnership between the federal government and local communities. This partnership provides that the federal government will make federally backed flood insurance available to home and business owners in communities that agree to adopt and enforce comprehensive floodplain management standards designed to reduce flood damages. NFIP transfers most of the costs of private property flood losses from the taxpayers to people that choose to live within floodplains through insurance premiums and increased construction standards.
33 December 5, 2005 Sea level Rise in the TCRPC Treasure Coast Region
Community response to this requirement involves the adoption of land use, zoning and building code standards that, at a minimum, include the design and construction standards of the NFIP. The minimum NFIP design and construction standards are applicable to all new construction, substantial damages and substantial improvements to existing structures located in Special Flood Hazard Areas or in Special Flood Hazard Areas that have not yet been identified by FEMA. The Special Flood Hazard Areas represent the statistical chance of a 100-year flood occurring in any given year. The 100-year flood has a one-percent chance of occurring in any given year. NFIP imposes stricter requirements on communities in the V-Zones of Flood Insurance Rate Maps. These are locales in coastal high hazard areas located along coastlines that are subject to high water levels, wave action, and erosion from strong storms and hurricanes. The wind and resultant waves and tidal surges associated with these storms cause water of high velocity to sweep over nearby land. Generally, the V-Zone indicates the inland extent of a three-foot breaking wave atop a storm surge. These areas are extremely hazardous to life and property. There are a number of building requirements that NFIP requires for new construction or substantial improvements in coastal high hazard areas to be able to withstand wind and waves. New buildings and improvements must:
• Obtain and maintain the elevation of the bottom of the lowest horizontal structural member of the lowest floor;
• Be located landward of mean high tide and no new construction is allowed over water; • Be elevated so that the bottom of the lowest horizontal structural member of the lowest
floor is at or above the base flood elevation on a pile or column foundation; • Allow the space below the lowest elevated floor to be free of obstruction or must be
enclosed with non-supporting breakaway walls, open lattice-work, or insect screening designing to collapse under wind and water loads without causing damage to structural supports or the elevated structure;
• Not use fill for structural support of buildings; and • Prohibit manmade alteration of sand dunes and mangrove stands that would increase
potential flood damage. As previously noted, the Coastal Barrier Resources Act (CBRA) prohibits new NFIP coverage for new or substantially improved structures in any coastal barrier in the CBRA system. The Clean Water Act of 1972 is another federal law that has an impact on the health of our nation’s coastal areas and wetlands. Sections 404 of the Clean Water Act sets national policy for the discharge of dredged or fill material into the nation’s navigable waters and adjacent wetlands. The Act has even been interpreted to have authority over inland wetlands. Section 404 gives jurisdictional responsibility for issuing dredge permits to the COE. The EPA has responsibility for developing and interpreting the criteria used in permit issuances.
34 December 5, 2005 Sea level Rise in the TCRPC Treasure Coast Region
The Clean Water Act prohibits the discharge of dredged or fill material at a specific site if there is a practicable alternative to the proposed discharge which would have less adverse impact on the aquatic ecosystem or if the discharge will cause or contribute to significant degradation of U.S. waters. Practicable alternatives under the Clean Water Act include activities that do not include a discharge into U.S. waters or discharges into waters other than the specific site requested. Degradation caused to U.S. waters is deemed to be significant adverse effects to human health or welfare, aquatic life stages and ecosystems, ecosystem diversity and productivity, and recreational, aesthetic and economic values. Discharges from established and ongoing farming, ranching and forestry activities are exempt from § 404 provisions. To receive a permit to discharge dredge materials, the applicant must prove to the COE that they have taken steps to avoid wetland impacts where practicable, minimized potential impacts to wetlands and provided compensation for any remaining, unavoidable impacts through activities to restore or create wetlands. States also have a role in § 404 decisions, through State program general permits, water quality certification, or program assumption. An additional federal law that gives the COE additional authority over construction in navigable waters and wetlands is the Rivers and Harbors Act (RHA). Sections 9 & 10 of the Act authorize the COE to regulate the construction of any structure or work within navigable waters of the United States. The types of structures the RHA allows the COE to regulate include the following: wharves, breakwaters, or jetties; bank protection or stabilization projects; permanent mooring structures, vessels, or marinas; intake or outfall pipes; canals; boat ramps; aids to navigation; or other modifications affecting the course, location condition, or capacity of navigable waters. When issuing permits for construction of the aforementioned structures, the COE must consider the following criteria: (1) the public and private need for the activity; (2) reasonable alternative locations and methods; and (3) the beneficial and detrimental effects on the public and private uses to which the area is suited. The COE is also required to consult with the U.S. Fish and Wildlife Service and the National Marine Fisheries Service to protect and conserve wildlife resources. State Policies and Programs As with federal policies, few State policies specifically address the issue of sea level rise. However, State coastal guidelines that cover beach management policies can be used to respond to sea level rise concerns. These policies are included in the Coastal Construction Line Program, the Beach Erosion Control Program, Coastal Building Zone and Strategic Beach Management Plans. The Florida Beach and Shore Preservation Act was enacted by Florida’s legislature to preserve and protect Florida’s beach and dune system. Beaches and dunes are the first line of defense against storms, acting as a buffer between the sea and coastal development. One of the programs authorized by the Beach and Shore Preservation Act to be an essential element in the protection effort is the Coastal Construction Control Line (CCCL) Program (Beach and Shore Preservation Act, Florida Statutes Chapter 161).
35 December 5, 2005 Sea level Rise in the TCRPC Treasure Coast Region
The CCCL Program was designed to protect Florida’s beach and dune system from irresponsible construction that could weaken, damage or destroy the health of the dune system. Structures that are built too close to the sea can inhibit the beach and dune system from its natural recovery processes and can cause localized erosion. Improperly constructed structures are a threat to other nearby coastal structures should they be destroyed by storms. The CCCL Program gives the State the jurisdiction to apply stringent siting and design criteria to construction projects within the control line. The CCCL is not a setback line, but is rather a demarcation line of the State’s authority. The CCCL is marked at the landward limit of coastal areas that are subject to the effects of a 100-year storm surge. While wind and flooding may intrude further inward than the 100-year storm surge area, effects landward of the CCCL are considerably less than within the CCCL. Within the CCCL, the State prohibits the construction or siting of structures that would cause a significant adverse impact to the beach and dune system, result in the destabilization of the system or would destroy marine turtle habitat. To meet these requirements, structures are required to be located a sufficient distance from the beach and frontal dune and must also be sited in a way that does not remove or destroy natural vegetation. The CCCL also requires all structures to be constructed to withstand the wind and water effects of a 100-year storm surge event. This involves creating structures that meet American Society Civil Engineering 7-88 Sect. 6 wind design standard for 110 mph winds and 115mph for the Florida Keys. Water standards include a foundation design to withstand a 100-year storm event--including the effects of surge, waves and scouring. There is no prohibition of rebuilding under the CCCL Program. Due to the effects of erosion, the CCCL Program discourages the construction of rigid coastal armoring (seawalls) and instead encourages property owners’ use of other protection methods, such as foundation modification, structure relocation and dune restoration. Another similar endeavor to regulate coastal construction is the Coastal Building Zone (CBZ). The CBZ was established as part of the Coastal Protection Act of 1985 to protect coastal areas and to protect life and property. The CBZ is similar to the Coastal Construction Line Program in that it is a regulatory jurisdiction, rather than a setback line. The CBZ envelops land from the seasonal high water line to 1500 feet landward of the CCCL. In those areas fronting on the ocean but not included within an established CCCL, the Coastal Building Zone includes the land area seaward of the most landward V-Zone line, as established by NFIP’s flood maps. The V-Zone is an area likely to experience a wave greater than 3 feet high with storm surge or areas within the 100-year storm event used by the CCCL program. Local governments enforce the Coastal Building Zone, as a part of their building codes, rather than by the State. Within the CBZ, new construction is required to meet the Standard Building Code 1997 wind design standard of 110 mph and 115 mph for the Florida Keys. As for water standards, structures are required to meet National Flood Insurance Program requirements or local flood ordinance requirements, whichever are stricter. Foundations must also be designed to withstand a 100-year storm surge. CBZ construction standards are less stringent than CCCL standards. This is due to the fact that NFIP flood maps have lower base flood elevations for 100-year storm events than do CCCL studies.
36 December 5, 2005 Sea level Rise in the TCRPC Treasure Coast Region
Another State effort to protect Florida’s beaches, authorized by the Beach and Shore Preservation Act, is the Beach Erosion Control Program (BECP). The BECP is the primary program that implements the Florida Department of Environmental Protection’s beach management recommendations. The BECP was created to coordinate the efforts of local, state, and federal governments in protecting, preserving and restoring Florida’s coastal resources. One of the activities of this program is the offering of financial assistance to counties, local governments and other special districts for shore protection and preservation efforts. The BECP will provide up to 50 percent of project costs. The mix between federal, state and local funds is different for each project. Beach management activities eligible for funding from the BECP include beach restoration and nourishment activities, project design and engineering studies, environmental studies and monitoring, inlet management planning, inlet sand transfer, dune restoration and protection activities, and other beach erosion prevention related activities. Another endeavor of the BECP is the development and maintenance of a Strategic Beach Management Plan (SMBP) for Florida. The SBMP is a multiyear repair and maintenance strategy to carry out the proper state responsibilities of a comprehensive, long-range, statewide program of beach erosion control; beach preservation, restoration, and nourishment; and storm and hurricane protection. The SBMP is divided into specific beach management plans for Florida’s coastal regions. Local Government Policies All of the counties in the Region have Comprehensive Plans that contain coastal management elements. None of the counties in the region has policies specifically dealing with sea level rise. However, each of the counties has goals, objectives, and policies that are related to sea level rise issues. Some of these objectives most relevant to sea level rise are summarized below: Indian River County Objective 4: Beaches and Dunes. By 1998, all natural functions of the beach and dune system in Indian River County shall be protected and no unmitigated human-related disturbance of the primary dune system shall occur. Objective 5: Limiting Public Expenditures in the Coastal High-Hazard Area. Through 2004, there will be no expansion of infrastructure within the Coastal High Hazard Area other than that which is deemed necessary to maintain existing levels-of-service. Objective 11: Limit Densities in the Coastal High Hazard Area. Through 2020, there will be no increase in the density of land use within the Coastal High Hazard Area. St. Lucie County Objective 7.1.1: Future Development in the Coastal Area. St. Lucie County shall continue to protect the natural resources of the coastal area from adverse impacts caused by future
37 December 5, 2005 Sea level Rise in the TCRPC Treasure Coast Region
development through the implementation and strengthening of existing environmentally related laws and the assignment of appropriate Future Land Use designations. Objective 7.1.5: Beaches and Dunes. St. Lucie County shall provide for the protection and restoration of beaches and dunes. A comprehensive beach and dune management program shall be adopted by 2003 which enhances the natural functioning of the beach-dune system while reducing unnatural disturbances of the primary dune. Objective 7.2.1: The County shall address development and redevelopment in the coastal area in the County’s Hurricane Evacuation Plan. Martin County Objective. Beach and dune and off-shore systems. To develop procedures and standards to protect, enhance and restore beach and dune systems and minimize construction-related impacts Objective. Hazard mitigation and coastal high hazard area. To limit public expenditures in the designated coastal high hazard area to necessary public services in order not to subsidize new development in this area. Objective. Direct population away from coast. Encourage low density land uses within the coastal high hazard area in order to direct population concentrations away from this area. Palm Beach County Objective 1.2: Shoreline Protection. Palm Beach County shall protect, enhance and restore the beaches and dunes through implementation and maintenance of the Palm Beach County Shoreline Protection Plan. Objective 2.2: Public Subsidy of New Coastal Development. Palm Beach County shall not subsidize new or expanded development in the coastal area. Objective 2.3: Development in High Hazard Area. Palm Beach County shall direct population concentrations away from known or predicted coastal high-hazard areas and shall not approve increases in population densities n the coastal high hazard area. Proposed Policies Planners in each of the counties in the Treasure Coast Region indicated a willingness to consider the adoption of policies specifically related to sea level rise. The following policy statements are offered for consideration by local governments in coastal areas: Policy 1: Consider the impact of sea level rise in all land use amendments in coastal areas less than 10 feet in elevation.
38 December 5, 2005 Sea level Rise in the TCRPC Treasure Coast Region
Policy 2: Obtain detailed topographic maps showing one foot contours in the coastal zone to assist in planning for sea level rise. Policy 3: Develop a plan to protect or relocate all critical public facilities that are located in areas projected to be impacted by sea level rise in the next 50 years. Policy 4: Closely monitor updates to sea level rise forecasts and predictions. Policy 5: Develop a sea level rise response plan that specifically identifies the areas where retreat, accommodation and protection will be implemented.
39 December 5, 2005 Sea level Rise in the TCRPC Treasure Coast Region
Conclusions This report is intended to stimulate local government planners and citizens to think about the problem of sea level rise. Although this project covers a timeframe of 200 years, planning for sea level rise should begin now. The sea is already rising and some shores are already eroding. Moreover, an effective response may require a lead time of many decades. If we develop areas where wetland migration is preferred in the long run, it might take a lead time of 50-100 years to relocate the development. Even in areas that we protect, shore protection measures can take decades to plan and implement.
The relevance of planning for sea level rise can also be seen by the events of 2004 hurricane season. The Treasure Coast Region suffered extensive damage from storm surges, wind and erosion. With strong hurricane seasons projected to continue into the future, because of warmer ocean waters, the events of the 2004 hurricane season are likely to reoccur. The rate of development and increase in population in the Treasure Coast Region are other important factors in starting the preliminary stages of planning for sea level rise now. As sea levels continue to rise, much of the currently developed increasingly populated area can be expected to be flooded. Planners must begin to decide which land areas in their counties and municipalities will be protected against sea level rise, and what the cost will be to holding back the sea. Citizens living in these areas must also know the costs associated with protection against sea level rise. The sea level rise maps provided in this report only depict the expected response scenarios to sea level rise based on the best currently available knowledge. Local planners may decide in the future that it will be wise to retreat from lands currently deemed to be protected lands, due to costs and environmental considerations. This project represents the first step in planning for sea level rise in the Treasure Coast Region.
40 December 5, 2005 Sea level Rise in the TCRPC Treasure Coast Region
Literature Cited Bureau of Economic and Business Research. 2005. Projections of Florida population by county,
2004 – 2030. University of Florida, Bureau of Economic and Business Research Bulletin No. 141, Volume 38, No.2.
Coastal Zone Management Subgroup. 1990. Strategies for adaptation to sea level rise.
Intergovernmental Panel on Climate Change Response Strategies Working Group. Ministry of Transport and Public Works, The Hague, Netherlands.
Fiedler, J., F. Mays, and J. Siry, Eds. 2001. Feeling the heat in Florida: Glogal warming on the
local level. Natural Resources Defense Council and Florida Climate Alliance, New York and Orlando.
Florida Department of Environmental Protection and South Florida Water Management District.
2000. Loxahatchee River National Wild and Scenic River management plan, plan update. South Florida Water Management District, West Palm Beach, Florida.
Florida Department of Transportation. 1999. Florida land use, cover and forms classification
system. Third edition. Florida Department of Transportation Surveying and Mapping Office, Geographic Mapping Section, Tallahassee, Florida.
Indian River County. 1998. Indian River County 2020 comprehensive plan. Indian River County,
Vero Beach, Florida. Leatherman, S.P., K. Zhang, and B.C. Douglas. 2000. Sea level rise shown to drive coastal
erosion. EOS Transactions 81: 55-57. Martin County. 1990. Martin County comprehensive growth management plan. Martin County,
Stuart, Florida. Palm Beach County. 1989. Comprehensive plan. Palm Beach County, West Palm Beach, Florida. St. Lucie County. 2002. St. Lucie County comprehensive plan. St. Lucie County, Fort Pierce,
Florida. Titus, J.G. and V.K. Narayanan. 1995. The probability of sea level rise. U.S. Environmental
Protection Agency. Office of Policy, Planning, and Evaluation. EPA-230-R-95-008. Titus, J.G. 1998. Rising seas, coastal erosion and the takings clause: How to save wetlands and
beaches without hurting property owners. Maryland Law Review 57: 1279-1399. Titus, J.G., R.A. Park, S.P. Leatherman, J.R. Weggel, M.S. Greene, P.W. Mausel, S. Brown, C.
Gaunt, M. Trehan, and G. Yohe. 1991. Greenhouse effect and sea level rise: The cost of holding back the sea. Coastal Management 19:171-204.
41 December 5, 2005 Sea level Rise in the TCRPC Treasure Coast Region
Treasure Coast Regional Planning Council. 1995. Strategic Regional Policy Plan. Treasure Coast Regional Planning Council, Stuart, Florida.
Treasure Coast Regional Planning Council. 1999. Loxahatchee River basin wetland planning
project for Palm Beach County. Technical Summary Document, U.S. EPA Cooperative Agreement X994652-94-7, Treasure Coast Regional Planning Council, Stuart, Florida.
Twilley, R.R., E.J. Barron, H.L. Gholz, M.A. Harwell, R.L. Miller, D.J. Reed, J.B. Rose, E.H.
Siemann, R.G. Wetzel, and R.J. Zimmerman. 2001. Confronting Climate Change in the Gulf Coast Region: Prospects for sustaining our ecological heritage. Union of Concerned Scientists, Cambridge, Massachusetts, and Ecological Society of America, Washington, D.C.
Warrick, R.A., C.L. Provost, M.F. Meier, J. Oerlemans, and P.L. Woodworth. 1996. Changes in
sea level. Pp. 359-405 In Climate change 1995: The science of climate change. (J.T. Houghton, L.G. Meira Filho, B.A. Callender, N. Harris, A. Kattenberg and K. Maskell, Eds.). Cambridge University Press, London.
Yohe, G. 1990. The cost of not holding back the sea. Toward a national sample of economic
vulnerability. Coastal Management 18:403-431.