Embed Size (px)
Citation preview
Scottish Diabetes Survey 2016
Scottish Diabetes Survey 2016
Scottish Diabetes Survey Monitoring Group
Scottish Diabetes Survey 2016
2 Scottish Diabetes Survey Monitoring Group
Contents
Table of Contents Contents ............................................................................................................................................................................ 2
Foreword ........................................................................................................................................................................... 5
Executive Summary ........................................................................................................................................................... 6
Prevalence ......................................................................................................................................................................... 8
Incidence ......................................................................................................................................................................... 14
Duration of Diabetes ....................................................................................................................................................... 21
Age and Sex ..................................................................................................................................................................... 22
Mortality ......................................................................................................................................................................... 25
Type of Diabetes ............................................................................................................................................................. 26
Ethnicity .......................................................................................................................................................................... 28
Body Mass Index ............................................................................................................................................................. 31
Glycaemic Control ........................................................................................................................................................... 35
Insulin Pump Use ........................................................................................................................................................ 48
Cardiovascular Risk ......................................................................................................................................................... 50
Blood Pressure ............................................................................................................................................................ 50
Total Cholesterol ......................................................................................................................................................... 65
Smoking Status ................................................................................................................................................................ 74
Complications of Diabetes .............................................................................................................................................. 79
Myocardial Infarction .................................................................................................................................................. 79
Cardiac Revascularisation ........................................................................................................................................... 82
Stroke .......................................................................................................................................................................... 84
Kidney Function and Disease ...................................................................................................................................... 85
Serum Creatinine .................................................................................................................................................... 85
Urinary Microalbuminuria ....................................................................................................................................... 87
End Stage Renal Failure ........................................................................................................................................... 89
Diabetic Eye Screening and Disease............................................................................................................................ 90
Diabetic Retinal Screening ...................................................................................................................................... 90
Foot Complications ..................................................................................................................................................... 96
Foot Ulceration ....................................................................................................................................................... 98
Lower Limb Amputation ....................................................................................................................................... 100
Other Statistics .............................................................................................................................................................. 102
Scottish Diabetes Survey 2016
3 Scottish Diabetes Survey Monitoring Group
My Diabetes My Way ................................................................................................................................................ 102
Scottish Diabetes Research Network (SDRN) Research Register .............................................................................. 104
Care Processes .............................................................................................................................................................. 105
Measure 1 ................................................................................................................................................................. 106
Methodology ......................................................................................................................................................... 106
List of Care processes ............................................................................................................................................ 106
Notes ..................................................................................................................................................................... 106
Measure 2 ................................................................................................................................................................. 108
Methodology ......................................................................................................................................................... 108
Notes ..................................................................................................................................................................... 108
Measure 3 ................................................................................................................................................................. 110
Methodology ......................................................................................................................................................... 110
Notes ..................................................................................................................................................................... 110
Measure 4 ................................................................................................................................................................. 112
Methodology ......................................................................................................................................................... 112
Notes ..................................................................................................................................................................... 112
Measure 5 ................................................................................................................................................................. 113
Methodology ......................................................................................................................................................... 113
Measure 6 ................................................................................................................................................................. 114
Methodology ......................................................................................................................................................... 114
Notes ..................................................................................................................................................................... 114
Measure 7 ................................................................................................................................................................. 115
Methodology ......................................................................................................................................................... 115
Notes ..................................................................................................................................................................... 115
Measure 8 ................................................................................................................................................................. 116
Methodology ......................................................................................................................................................... 116
Notes ..................................................................................................................................................................... 117
Measure 9 ................................................................................................................................................................. 118
Methodology ......................................................................................................................................................... 118
Measure 10 ............................................................................................................................................................... 119
Methodology ......................................................................................................................................................... 119
Notes ..................................................................................................................................................................... 119
Measure 11 ............................................................................................................................................................... 120
Methodology ......................................................................................................................................................... 120
Notes ..................................................................................................................................................................... 120
Scottish Diabetes Survey 2016
4 Scottish Diabetes Survey Monitoring Group
Measure 12 ............................................................................................................................................................... 122
Methodology ......................................................................................................................................................... 122
Notes ..................................................................................................................................................................... 122
Acknowledgements ....................................................................................................................................................... 124
List of Tables ................................................................................................................................................................. 125
List of Figures ................................................................................................................................................................ 131
Appendix 1: SCI-Diabetes Data Sources ........................................................................................................................ 135
Security and Confidentiality ...................................................................................................................................... 135
Data Sources ............................................................................................................................................................. 135
Appendix 2: Comparison with England/ Wales............................................................................................................. 138
Diabetes Prevalence .................................................................................................................................................. 138
Appendix 3: Variability of HbA1c .................................................................................................................................. 139
Appendix 4: Health Board Performance ....................................................................................................................... 140
Scottish Diabetes Survey 2016
5 Scottish Diabetes Survey Monitoring Group
Foreword
This is now the 16th
year of the Scottish Diabetes Survey that describes aspects of diabetes
care in Scotland in December 2016. It contains core information from over 99% of people
diagnosed with diabetes in Scotland, thereby comprehensively describing the work of
patients, carers and health care professionals across all of Scotland. It combines information
from many sources both in hospitals and in the community that provide integrated care
through the managed clinical networks. The data also reflect the influence of Scottish
Government policy, the Scottish Diabetes Group and the third sector such as Diabetes
Scotland.
The information in the survey and previous surveys have been used to describe changes in
diabetes care and outcomes during the last 15 years. These analyses, of the Scottish
Diabetes Research Network Epidemiology Group, have described improved outcomes for
people with Type 1 and Type 2 diabetes during the last 10 years and have been presented
elsewhere at medical meetings and in leading diabetes and other medical journals.
We have identified the need to improve some aspects of diabetes care. There has been
some improvement in Type 1 diabetes control, but there is a real need to build on this and
make more rapid improvement in this. The widespread introduction of insulin pump therapy
should help with this as should the introduction of some Continuous Glucose Monitoring
systems.
Recording of BMI, blood pressure and cholesterol appear to be reduced this period; for blood
pressure and for cholesterol they are the lowest they have been for ten years. It is perhaps
noteworthy that this coincides with the decommissioning of the Quality Outcomes
Framework. The measures of care described for each NHS Board is designed to continue to
provide local managed clinical networks with information to help influence improvement in
these measures.
We expect the leaders and governance teams in each NHS Board to reflect on the
information provided and develop plans to improve the care and outcome for patients with
diabetes in their regions.
John A McKnight Chairman Scottish Diabetes Data Group
Scottish Diabetes Survey 2016
6 Scottish Diabetes Survey Monitoring Group
Executive Summary
This report presents the results of the 2016 Scottish Diabetes Survey. The survey collates
information submitted by all 14 NHS Boards and provides data on the number of people with
diabetes, the effects on their health, and the progress being made to improve the delive ry
and outcomes of care for diabetes. In this survey, we report separately on those with Type 1
and Type 2 diabetes.
In this Scottish Diabetes Survey 2016, we report that:
There were 291,981 people diagnosed with diabetes in Scotland recorded on local
diabetes registers at the end of 2016. This represents 5.4% of the population (Table
1);
Crude prevalence of diabetes ranged from 4.6% to 6.3% across NHS Boards (Table 1);
88.3% (257,728) of all people registered with diabetes had Type 2 diabetes (Table 15);
10.6% of all registered people had Type 1 diabetes. The number of people registered
with Type 1 diabetes increased from 26,294 in 2006 to 30,899 in 2016 (Table 15);
1.1% (3,354) were recorded as having “other” types of diabetes, including maturity
onset diabetes of the young (MODY) and those with unknown diabetes type (Table
15);
Of patients with a recorded BMI, 37.3% with Type 1 diabetes and 31.6% with Type 2
diabetes were overweight (BMI 25-29.9kg/m2), and a further 26% of those with Type 1
diabetes and 55.6% of those with Type 2 diabetes were obese (BMI 30kg/m2 or
above), meaning a total of 63.3% of those with Type 1 diabetes and 87.2% of those
with Type 2 diabetes were above their ideal weight (Tables 22 and 23);
90.3% (Type 1) and 92.8% (Type 2) had an HbA1c recorded in the previous 15 months.
Of these, 24.5% and 58.6% had a result < 58mmol/mol, the target reported in previous
surveys (Tables 25, 26 and 27);
84.9% of those with Type 1 and 91.8% of those with Type 2 diabetes had their blood
pressure recorded in the previous 15 months (Tables 36 and 37). Of these, 45.0% and
32.7% respectively had a systolic blood pressure <130 mmHg and a diastolic blood
pressure ≤80 mmHg (Tables 39 and 41);
Cholesterol was recorded in 86.4% of patients within the previous 15 months, and the
target of ≤ 5 mmol/l was achieved in 69.1% of those with Type 1 and 78.4% of those
with Type 2 diabetes (Tables 45, 46 and 47);
22.9% (Type 1) and 17.2% (Type 2) were current smokers (Table 50 and Table 51);
1,067 (3.5%) of those with Type 1 and 24,977 (9.7%) of those with Type 2 diabetes
have previously had a myocardial infarction, and 2.6% and 7.5% respectively have
undergone cardiac revascularisation (Tables 53 and 55);
437 (1.4%) of those with Type 1 and 1,472 (0.6%) of those with Type 2 diabetes have
a record of having end stage renal failure (Table 62);
85.4% of people with Type 1 or Type 2 diabetes had eye screening in the previous 15
months (Table 63);
Scottish Diabetes Survey 2016
7 Scottish Diabetes Survey Monitoring Group
59.1% of patients with Type 1 diabetes and 73.2% of those with Type 2 had their foot
scores recorded in the previous 15 months (Tables 68 and 69);
350 (1.1%) of those with Type 1 and 1,705 (0.7%) of those with Type 2 diabetes have
a record of having had a major lower limb amputation (Table 72).
Scottish Diabetes Survey 2016
8 Scottish Diabetes Survey Monitoring Group
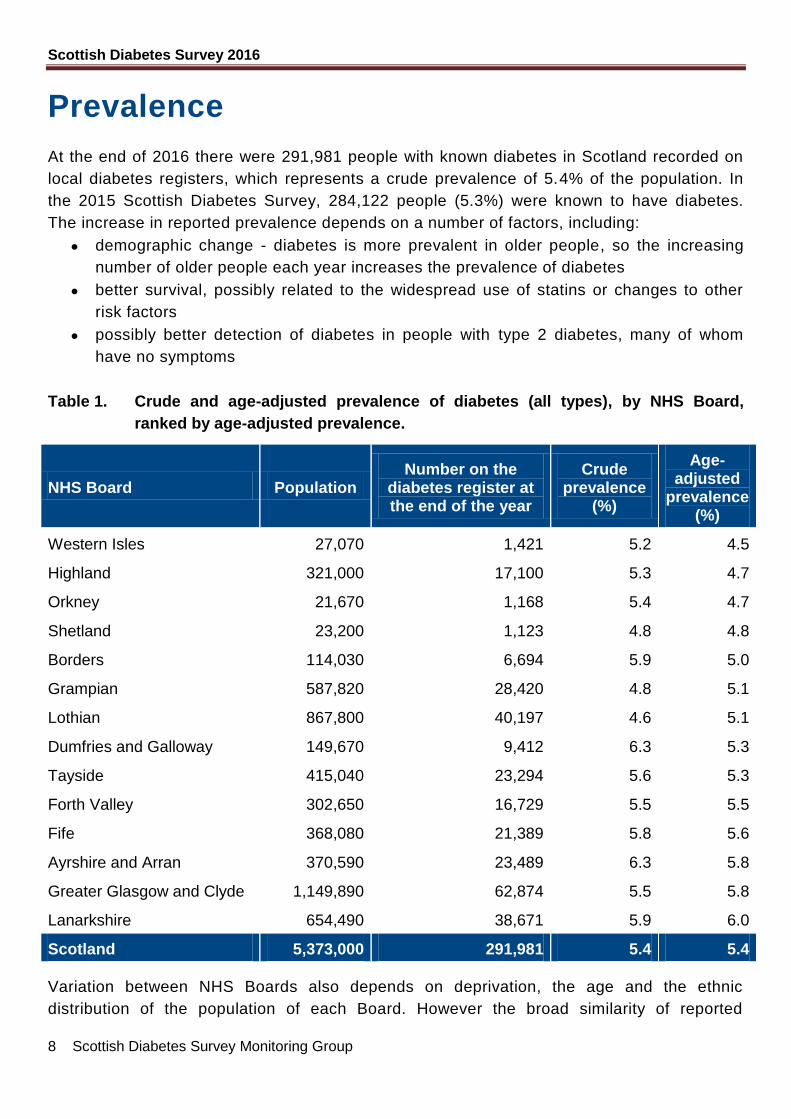
Prevalence
At the end of 2016 there were 291,981 people with known diabetes in Scotland recorded on
local diabetes registers, which represents a crude prevalence of 5.4% of the population. In
the 2015 Scottish Diabetes Survey, 284,122 people (5.3%) were known to have diabetes.
The increase in reported prevalence depends on a number of factors, including:
demographic change - diabetes is more prevalent in older people, so the increasing
number of older people each year increases the prevalence of diabetes
better survival, possibly related to the widespread use of statins or changes to other
risk factors
possibly better detection of diabetes in people with type 2 diabetes, many of whom
have no symptoms
Table 1. Crude and age-adjusted prevalence of diabetes (all types), by NHS Board,
ranked by age-adjusted prevalence.
NHS Board Population Number on the
diabetes register at the end of the year
Crude prevalence
(%)
Age-adjusted
prevalence (%)
Western Isles 27,070 1,421 5.2 4.5
Highland 321,000 17,100 5.3 4.7
Orkney 21,670 1,168 5.4 4.7
Shetland 23,200 1,123 4.8 4.8
Borders 114,030 6,694 5.9 5.0
Grampian 587,820 28,420 4.8 5.1
Lothian 867,800 40,197 4.6 5.1
Dumfries and Galloway 149,670 9,412 6.3 5.3
Tayside 415,040 23,294 5.6 5.3
Forth Valley 302,650 16,729 5.5 5.5
Fife 368,080 21,389 5.8 5.6
Ayrshire and Arran 370,590 23,489 6.3 5.8
Greater Glasgow and Clyde 1,149,890 62,874 5.5 5.8
Lanarkshire 654,490 38,671 5.9 6.0
Scotland 5,373,000 291,981 5.4 5.4
Variation between NHS Boards also depends on deprivation, the age and the ethnic
distribution of the population of each Board. However the broad similarity of reported

Scottish Diabetes Survey 2016
9 Scottish Diabetes Survey Monitoring Group
prevalence, compared to some previous years, gives confidence in the completeness of
recording. The increased prevalence in recent years is likely to be real rather than because
of better reporting.
Table 2. Crude prevalence of diabetes for patients aged 65 and over (all types), by NHS
Board, ranked by prevalence.
NHS Board Age >= 65 (n) Age >= 65 with
Diabetes Prevalence in those
aged >= 65 (%)
Western Isles 6,561 811 12.4
Shetland 4,327 588 13.6
Highland 70,401 9,596 13.6
Orkney 4,814 674 14.0
Borders 26,748 3,962 14.8
Lothian 138,627 20,544 14.8
Dumfries and Galloway 36,341 5,426 14.9
Grampian 100,526 15,159 15.1
Tayside 85,191 13,217 15.5
Forth Valley 55,364 8,793 15.9
Ayrshire and Arran 79,107 12,633 16.0
Fife 72,362 11,586 16.0
Greater Glasgow and Clyde 188,455 30,632 16.3
Lanarkshire 114,174 19,407 17.0
Scotland 982,998 153,028 15.6
Age-adjusted prevalence is based on direct age/sex standardisation using the Scottish
population as the reference population structure. Population figures are based on mid -year
population estimates published by National Records of Scotland. Because of publication
dates, surveys have in each case used population figures for the previous year - so that the
2016 survey uses diabetes data from 2016 but mid-year population estimates from 2015.
This will lead to a very small overestimate of diabetes prevalence.
Differences in prevalence are due to a number of factors. One is age - Type 2 diabetes is
more common in older age groups so the age structure of an area will affect the crude
prevalence. A health board area with an older population wi ll have a higher crude
prevalence; e.g. the crude (unadjusted) prevalence of diabetes in Dumfries & Galloway is
above the Scottish average; however when the figure is adjusted for the age of the
population, the Dumfries & Galloway prevalence is actually lower than the Scottish average.
Other reasons for differences in observed prevalence are given at the start of this section.
Scottish Diabetes Survey 2016
10 Scottish Diabetes Survey Monitoring Group
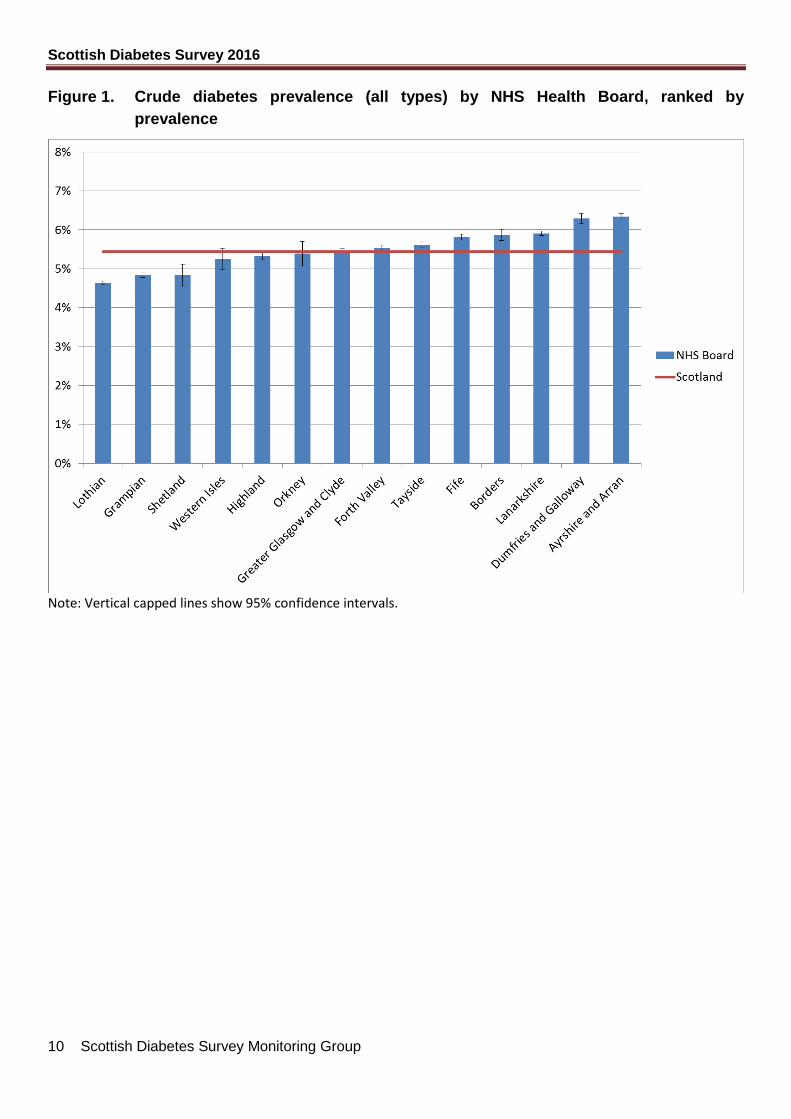
Figure 1. Crude diabetes prevalence (all types) by NHS Health Board, ranked by
prevalence
Note: Vertical capped lines show 95% confidence intervals.
Scottish Diabetes Survey 2016
11 Scottish Diabetes Survey Monitoring Group
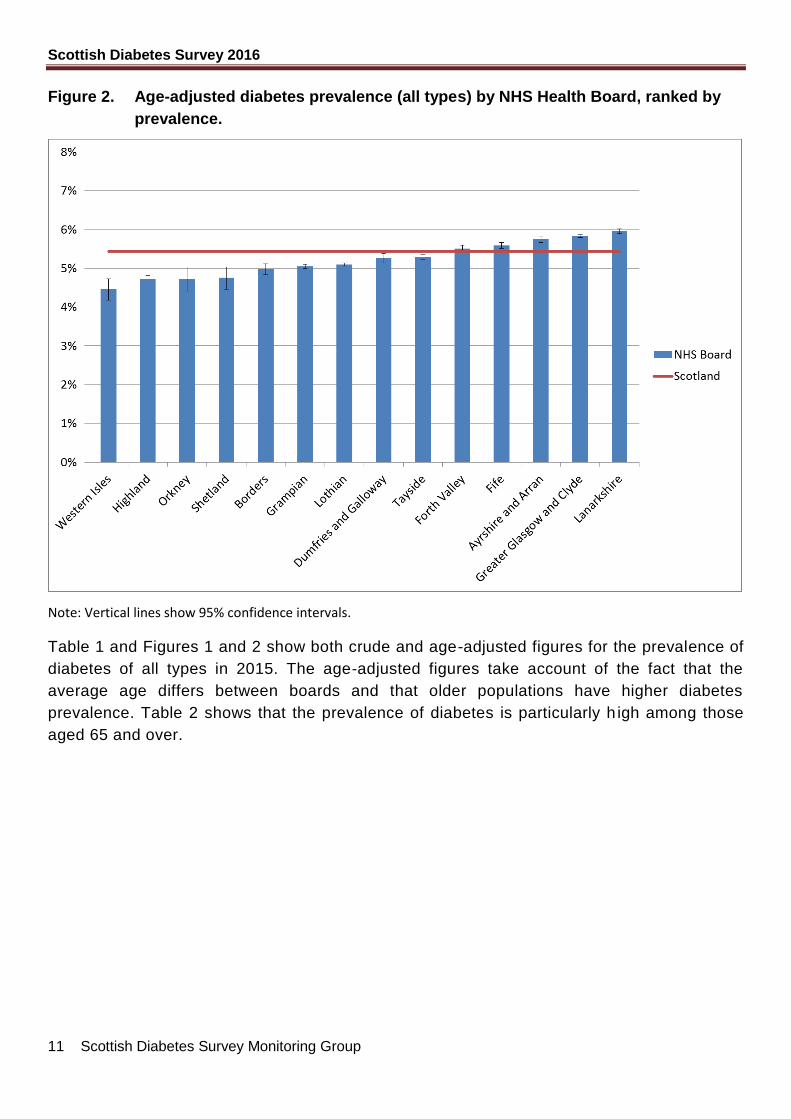
Figure 2. Age-adjusted diabetes prevalence (all types) by NHS Health Board, ranked by
prevalence.
Note: Vertical lines show 95% confidence intervals.
Table 1 and Figures 1 and 2 show both crude and age-adjusted figures for the prevalence of
diabetes of all types in 2015. The age-adjusted figures take account of the fact that the
average age differs between boards and that older populations have higher diabetes
prevalence. Table 2 shows that the prevalence of diabetes is particularly h igh among those
aged 65 and over.
Scottish Diabetes Survey 2016
12 Scottish Diabetes Survey Monitoring Group
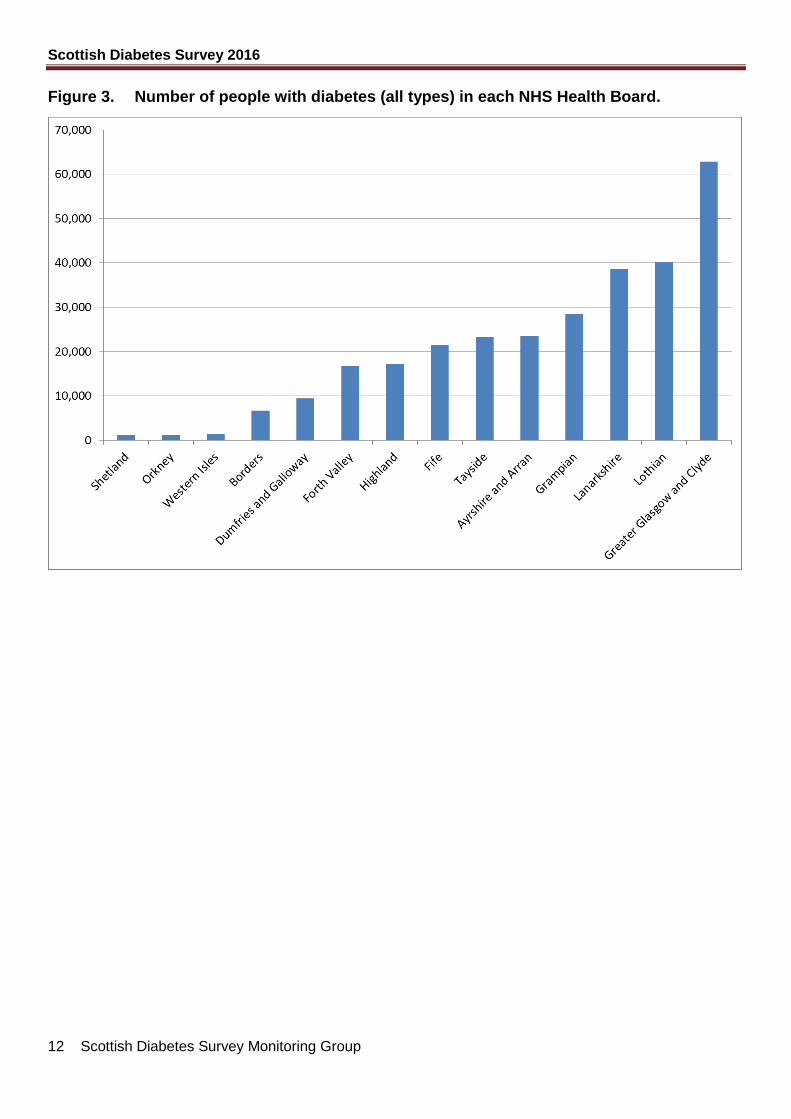
Figure 3. Number of people with diabetes (all types) in each NHS Health Board.
Scottish Diabetes Survey 2016
13 Scottish Diabetes Survey Monitoring Group
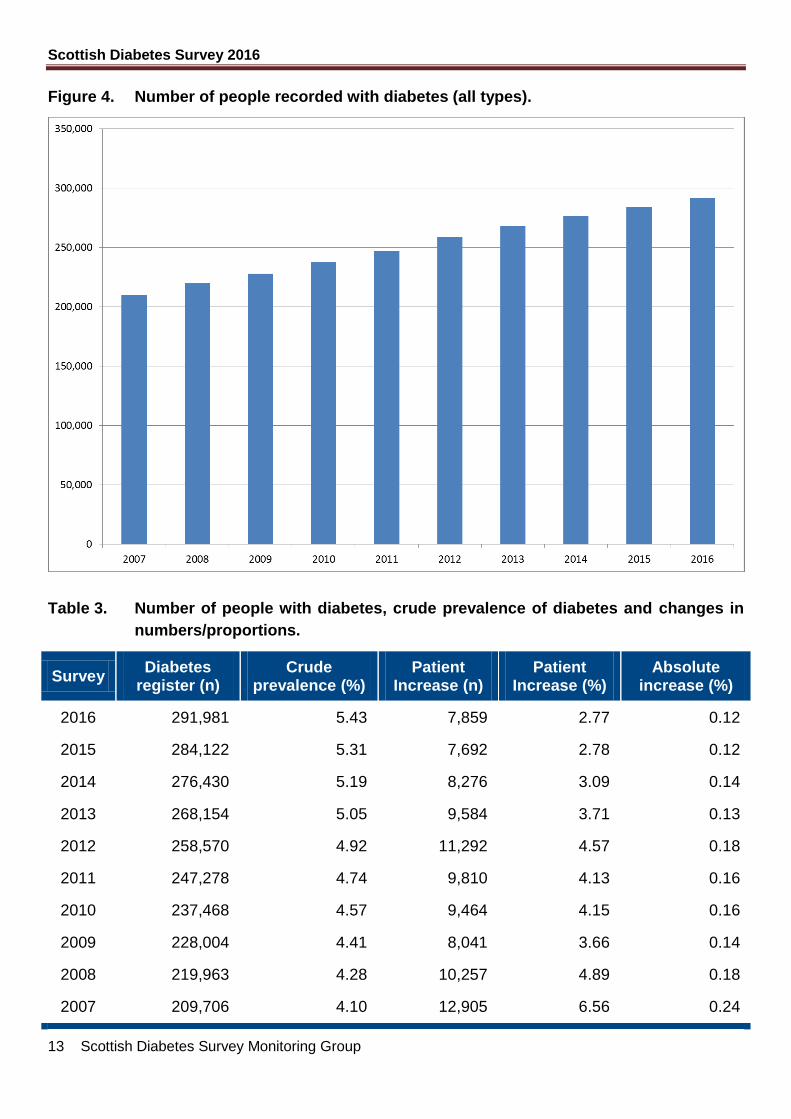
Figure 4. Number of people recorded with diabetes (all types).
Table 3. Number of people with diabetes, crude prevalence of diabetes and changes in
numbers/proportions.
Survey Diabetes
register (n) Crude
prevalence (%) Patient
Increase (n) Patient
Increase (%) Absolute
increase (%)
2016 291,981 5.43 7,859 2.77 0.12
2015 284,122 5.31 7,692 2.78 0.12
2014 276,430 5.19 8,276 3.09 0.14
2013 268,154 5.05 9,584 3.71 0.13
2012 258,570 4.92 11,292 4.57 0.18
2011 247,278 4.74 9,810 4.13 0.16
2010 237,468 4.57 9,464 4.15 0.16
2009 228,004 4.41 8,041 3.66 0.14
2008 219,963 4.28 10,257 4.89 0.18
2007 209,706 4.10 12,905 6.56 0.24
Scottish Diabetes Survey 2016
14 Scottish Diabetes Survey Monitoring Group
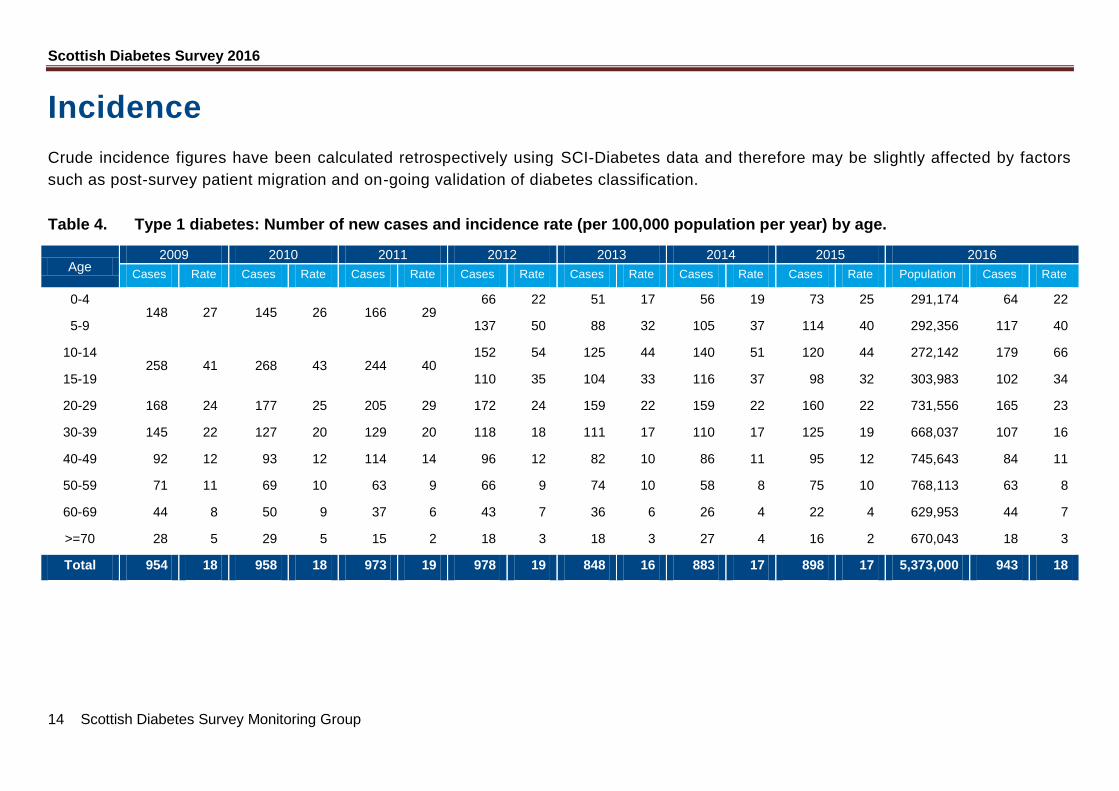
Incidence
Crude incidence figures have been calculated retrospectively using SCI-Diabetes data and therefore may be slightly affected by factors
such as post-survey patient migration and on-going validation of diabetes classification.
Table 4. Type 1 diabetes: Number of new cases and incidence rate (per 100,000 population per year) by age.
Age 2009 2010 2011 2012 2013 2014 2015 2016
Cases Rate Cases Rate Cases Rate Cases Rate Cases Rate Cases Rate Cases Rate Population Cases Rate
0-4 148 27 145 26 166 29
66 22 51 17 56 19 73 25 291,174 64 22
5-9 137 50 88 32 105 37 114 40 292,356 117 40
10-14 258 41 268 43 244 40
152 54 125 44 140 51 120 44 272,142 179 66
15-19 110 35 104 33 116 37 98 32 303,983 102 34
20-29 168 24 177 25 205 29 172 24 159 22 159 22 160 22 731,556 165 23
30-39 145 22 127 20 129 20 118 18 111 17 110 17 125 19 668,037 107 16
40-49 92 12 93 12 114 14 96 12 82 10 86 11 95 12 745,643 84 11
50-59 71 11 69 10 63 9 66 9 74 10 58 8 75 10 768,113 63 8
60-69 44 8 50 9 37 6 43 7 36 6 26 4 22 4 629,953 44 7
>=70 28 5 29 5 15 2 18 3 18 3 27 4 16 2 670,043 18 3
Total 954 18 958 18 973 19 978 19 848 16 883 17 898 17 5,373,000 943 18
Scottish Diabetes Survey 2016
15 Scottish Diabetes Survey Monitoring Group
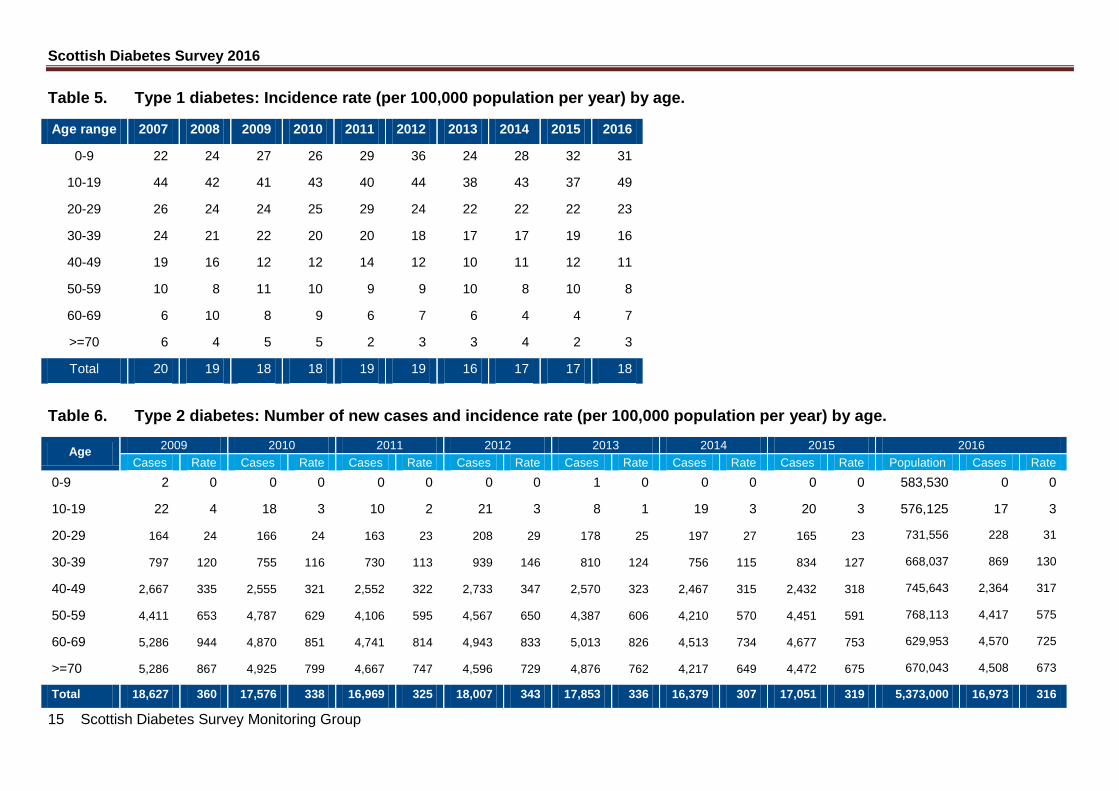
Table 5. Type 1 diabetes: Incidence rate (per 100,000 population per year) by age.
Age range 2007 2008 2009 2010 2011 2012 2013 2014 2015 2016
0-9 22 24 27 26 29 36 24 28 32 31
10-19 44 42 41 43 40 44 38 43 37 49
20-29 26 24 24 25 29 24 22 22 22 23
30-39 24 21 22 20 20 18 17 17 19 16
40-49 19 16 12 12 14 12 10 11 12 11
50-59 10 8 11 10 9 9 10 8 10 8
60-69 6 10 8 9 6 7 6 4 4 7
>=70 6 4 5 5 2 3 3 4 2 3
Total 20 19 18 18 19 19 16 17 17 18
Table 6. Type 2 diabetes: Number of new cases and incidence rate (per 100,000 population per year) by age.
Age 2009 2010 2011 2012 2013 2014 2015 2016
Cases Rate Cases Rate Cases Rate Cases Rate Cases Rate Cases Rate Cases Rate Population Cases Rate
0-9 2 0 0 0 0 0 0 0 1 0 0 0 0 0 583,530 0 0
10-19 22 4 18 3 10 2 21 3 8 1 19 3 20 3 576,125 17 3
20-29 164 24 166 24 163 23 208 29 178 25 197 27 165 23 731,556 228 31
30-39 797 120 755 116 730 113 939 146 810 124 756 115 834 127 668,037 869 130
40-49 2,667 335 2,555 321 2,552 322 2,733 347 2,570 323 2,467 315 2,432 318 745,643 2,364 317
50-59 4,411 653 4,787 629 4,106 595 4,567 650 4,387 606 4,210 570 4,451 591 768,113 4,417 575
60-69 5,286 944 4,870 851 4,741 814 4,943 833 5,013 826 4,513 734 4,677 753 629,953 4,570 725
>=70 5,286 867 4,925 799 4,667 747 4,596 729 4,876 762 4,217 649 4,472 675 670,043 4,508 673
Total 18,627 360 17,576 338 16,969 325 18,007 343 17,853 336 16,379 307 17,051 319 5,373,000 16,973 316
Scottish Diabetes Survey 2016
16 Scottish Diabetes Survey Monitoring Group
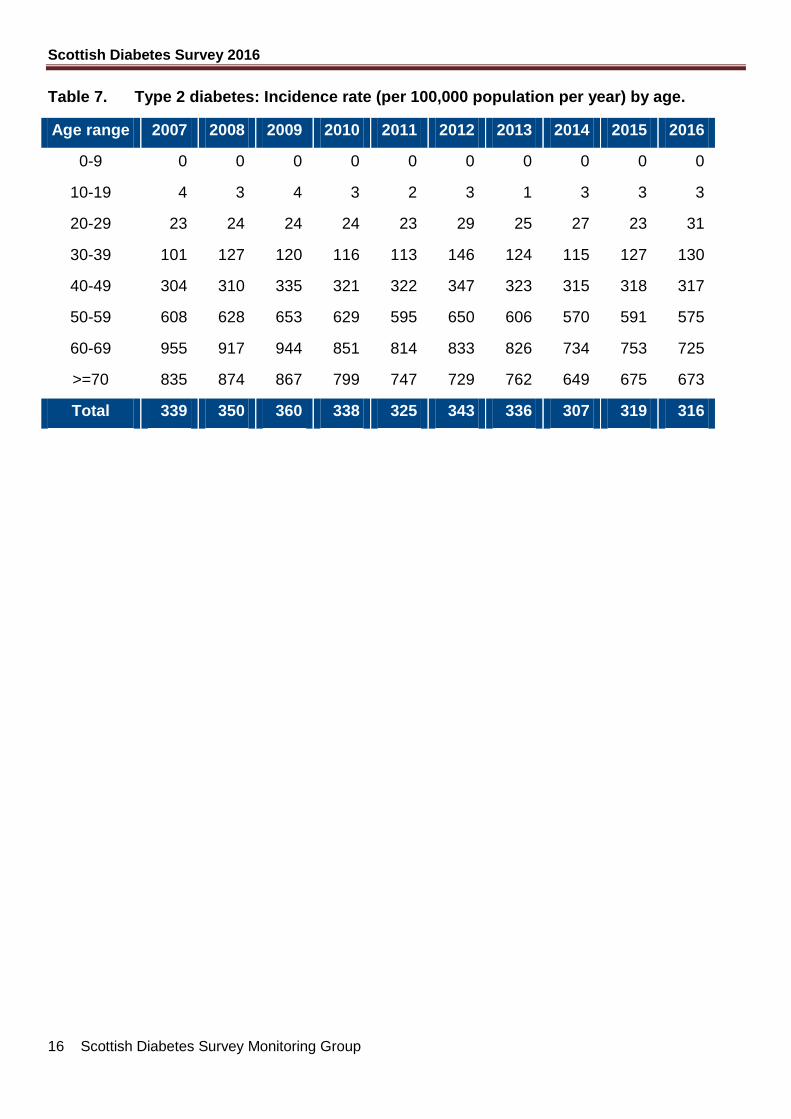
Table 7. Type 2 diabetes: Incidence rate (per 100,000 population per year) by age.
Age range 2007 2008 2009 2010 2011 2012 2013 2014 2015 2016
0-9 0 0 0 0 0 0 0 0 0 0
10-19 4 3 4 3 2 3 1 3 3 3
20-29 23 24 24 24 23 29 25 27 23 31
30-39 101 127 120 116 113 146 124 115 127 130
40-49 304 310 335 321 322 347 323 315 318 317
50-59 608 628 653 629 595 650 606 570 591 575
60-69 955 917 944 851 814 833 826 734 753 725
>=70 835 874 867 799 747 729 762 649 675 673
Total 339 350 360 338 325 343 336 307 319 316
Scottish Diabetes Survey 2016
17 Scottish Diabetes Survey Monitoring Group
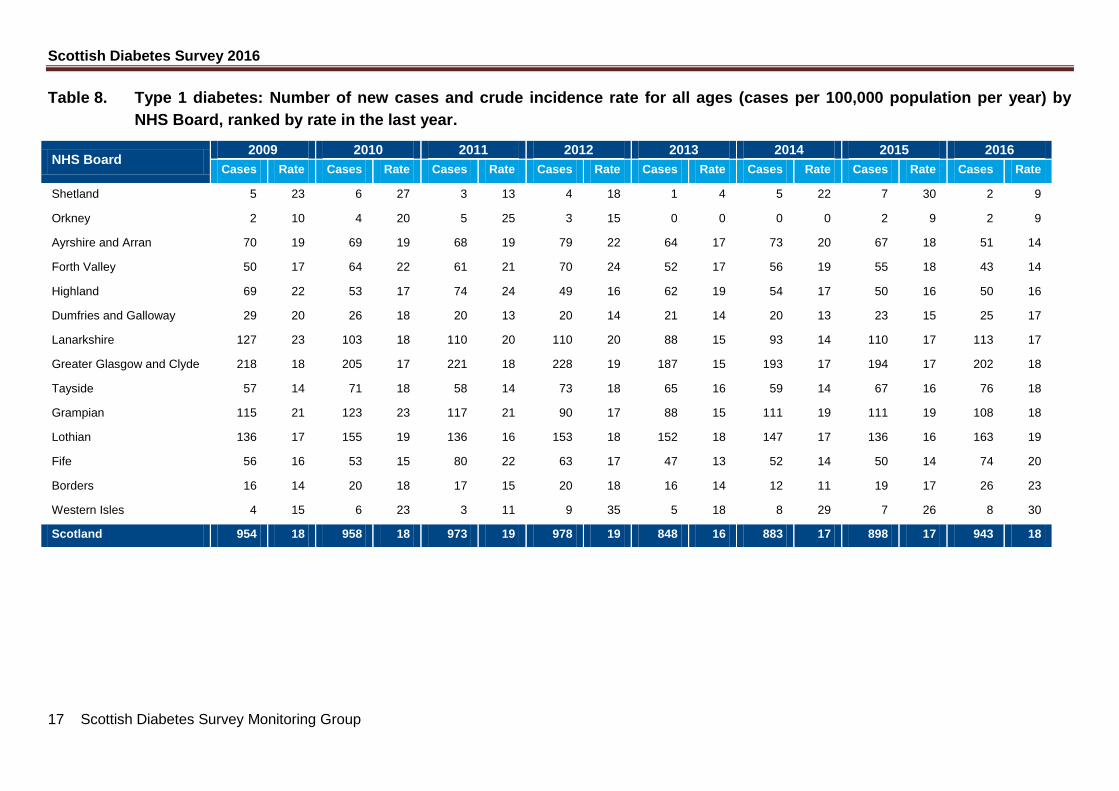
Table 8. Type 1 diabetes: Number of new cases and crude incidence rate for all ages (cases per 100,000 population per year) by
NHS Board, ranked by rate in the last year.
NHS Board 2009 2010 2011 2012 2013 2014 2015 2016
Cases Rate Cases Rate Cases Rate Cases Rate Cases Rate Cases Rate Cases Rate Cases Rate
Shetland 5 23 6 27 3 13 4 18 1 4 5 22 7 30 2 9
Orkney 2 10 4 20 5 25 3 15 0 0 0 0 2 9 2 9
Ayrshire and Arran 70 19 69 19 68 19 79 22 64 17 73 20 67 18 51 14
Forth Valley 50 17 64 22 61 21 70 24 52 17 56 19 55 18 43 14
Highland 69 22 53 17 74 24 49 16 62 19 54 17 50 16 50 16
Dumfries and Galloway 29 20 26 18 20 13 20 14 21 14 20 13 23 15 25 17
Lanarkshire 127 23 103 18 110 20 110 20 88 15 93 14 110 17 113 17
Greater Glasgow and Clyde 218 18 205 17 221 18 228 19 187 15 193 17 194 17 202 18
Tayside 57 14 71 18 58 14 73 18 65 16 59 14 67 16 76 18
Grampian 115 21 123 23 117 21 90 17 88 15 111 19 111 19 108 18
Lothian 136 17 155 19 136 16 153 18 152 18 147 17 136 16 163 19
Fife 56 16 53 15 80 22 63 17 47 13 52 14 50 14 74 20
Borders 16 14 20 18 17 15 20 18 16 14 12 11 19 17 26 23
Western Isles 4 15 6 23 3 11 9 35 5 18 8 29 7 26 8 30
Scotland 954 18 958 18 973 19 978 19 848 16 883 17 898 17 943 18
Scottish Diabetes Survey 2016
18 Scottish Diabetes Survey Monitoring Group
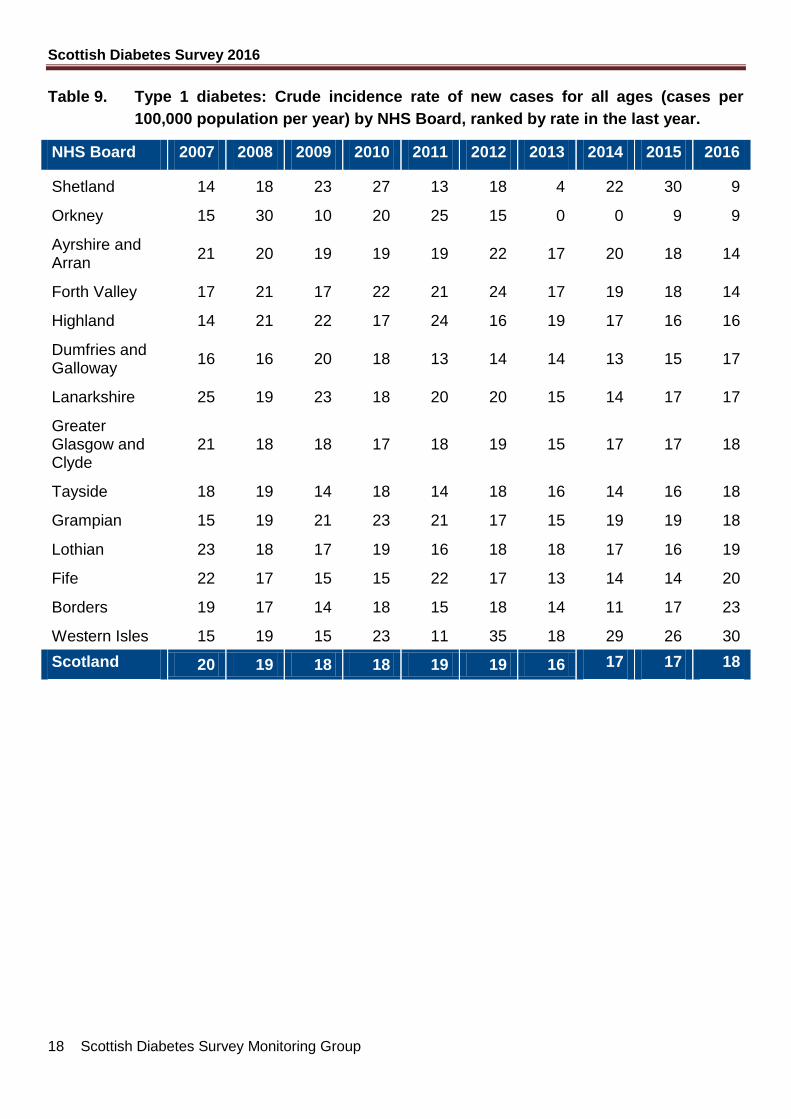
Table 9. Type 1 diabetes: Crude incidence rate of new cases for all ages (cases per
100,000 population per year) by NHS Board, ranked by rate in the last year.
NHS Board 2007 2008 2009 2010 2011 2012 2013 2014 2015 2016
Shetland 14 18 23 27 13 18 4 22 30 9
Orkney 15 30 10 20 25 15 0 0 9 9
Ayrshire and Arran
21 20 19 19 19 22 17 20 18 14
Forth Valley 17 21 17 22 21 24 17 19 18 14
Highland 14 21 22 17 24 16 19 17 16 16
Dumfries and Galloway
16 16 20 18 13 14 14 13 15 17
Lanarkshire 25 19 23 18 20 20 15 14 17 17
Greater Glasgow and Clyde
21 18 18 17 18 19 15 17 17 18
Tayside 18 19 14 18 14 18 16 14 16 18
Grampian 15 19 21 23 21 17 15 19 19 18
Lothian 23 18 17 19 16 18 18 17 16 19
Fife 22 17 15 15 22 17 13 14 14 20
Borders 19 17 14 18 15 18 14 11 17 23
Western Isles 15 19 15 23 11 35 18 29 26 30
Scotland 20 19 18 18 19 19 16 17 17 18
Scottish Diabetes Survey 2016
19 Scottish Diabetes Survey Monitoring Group
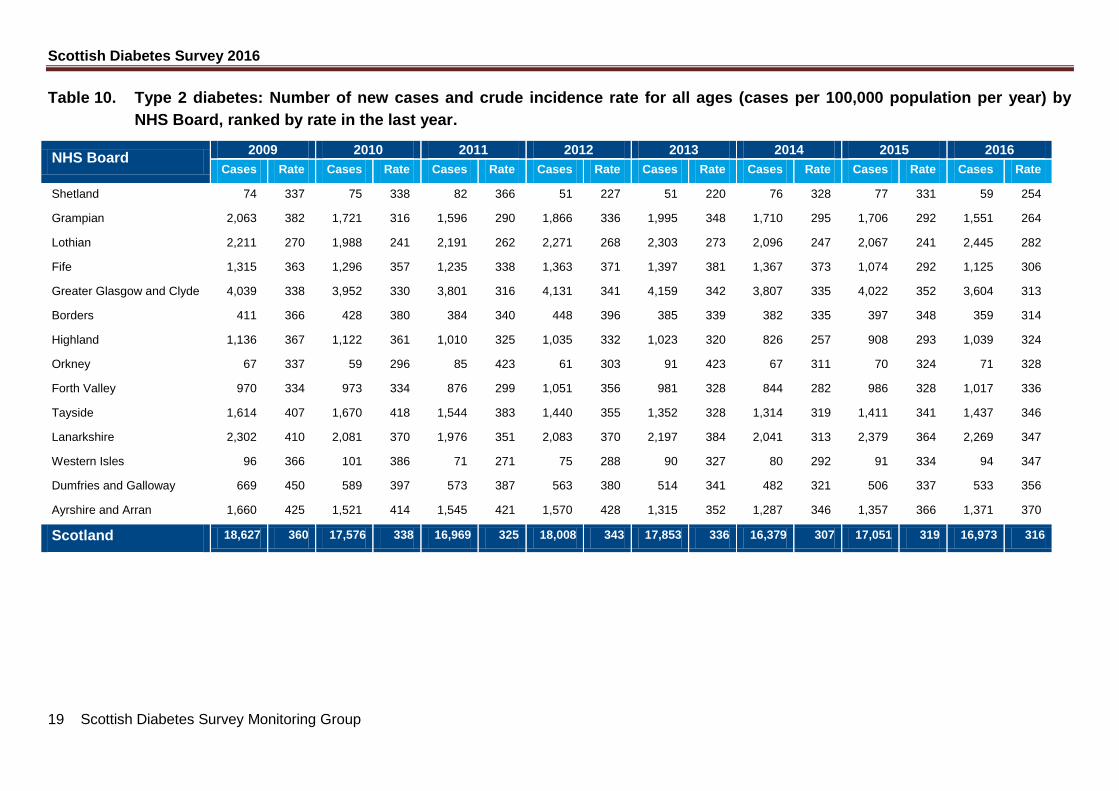
Table 10. Type 2 diabetes: Number of new cases and crude incidence rate for all ages (cases per 100,000 population per year) by
NHS Board, ranked by rate in the last year.
NHS Board 2009 2010 2011 2012 2013 2014 2015 2016
Cases Rate Cases Rate Cases Rate Cases Rate Cases Rate Cases Rate Cases Rate Cases Rate
Shetland 74 337 75 338 82 366 51 227 51 220 76 328 77 331 59 254
Grampian 2,063 382 1,721 316 1,596 290 1,866 336 1,995 348 1,710 295 1,706 292 1,551 264
Lothian 2,211 270 1,988 241 2,191 262 2,271 268 2,303 273 2,096 247 2,067 241 2,445 282
Fife 1,315 363 1,296 357 1,235 338 1,363 371 1,397 381 1,367 373 1,074 292 1,125 306
Greater Glasgow and Clyde 4,039 338 3,952 330 3,801 316 4,131 341 4,159 342 3,807 335 4,022 352 3,604 313
Borders 411 366 428 380 384 340 448 396 385 339 382 335 397 348 359 314
Highland 1,136 367 1,122 361 1,010 325 1,035 332 1,023 320 826 257 908 293 1,039 324
Orkney 67 337 59 296 85 423 61 303 91 423 67 311 70 324 71 328
Forth Valley 970 334 973 334 876 299 1,051 356 981 328 844 282 986 328 1,017 336
Tayside 1,614 407 1,670 418 1,544 383 1,440 355 1,352 328 1,314 319 1,411 341 1,437 346
Lanarkshire 2,302 410 2,081 370 1,976 351 2,083 370 2,197 384 2,041 313 2,379 364 2,269 347
Western Isles 96 366 101 386 71 271 75 288 90 327 80 292 91 334 94 347
Dumfries and Galloway 669 450 589 397 573 387 563 380 514 341 482 321 506 337 533 356
Ayrshire and Arran 1,660 425 1,521 414 1,545 421 1,570 428 1,315 352 1,287 346 1,357 366 1,371 370
Scotland 18,627 360 17,576 338 16,969 325 18,008 343 17,853 336 16,379 307 17,051 319 16,973 316

Scottish Diabetes Survey 2016
20 Scottish Diabetes Survey Monitoring Group
Table 11. Type 2 diabetes: Crude incidence rate for all ages (cases per 100,000 population
per year) by NHS Board, ranked by rate in the last year.
NHS Board 2007 2008 2009 2010 2011 2012 2013 2014 2015 2016
Shetland 238 287 337 338 366 227 220 328 331 254
Grampian 329 336 382 316 290 336 348 295 292 264
Lothian 310 281 270 241 262 268 273 247 241 282
Fife 352 363 363 357 338 371 381 373 292 306
Greater Glasgow
and Clyde 322 348 338 330 316 341 342 335 352 313
Borders 380 384 366 380 340 396 339 335 348 314
Highland 335 348 367 361 325 332 320 257 283 324
Orkney 369 388 337 296 423 303 423 311 324 328
Forth Valley 320 330 334 334 299 356 328 282 328 336
Tayside 350 380 407 418 383 355 328 319 341 346
Lanarkshire 382 371 410 370 351 370 384 313 364 347
Western Isles 323 327 366 386 271 288 327 292 334 347
Dumfries and
Galloway 359 378 450 397 387 380 341 321 337 356
Ayrshire and Arran 390 445 452 414 421 428 352 346 366 370
Scotland 339 350 360 338 325 343 336 307 319 316
Scottish Diabetes Survey 2016
21 Scottish Diabetes Survey Monitoring Group
Duration of Diabetes
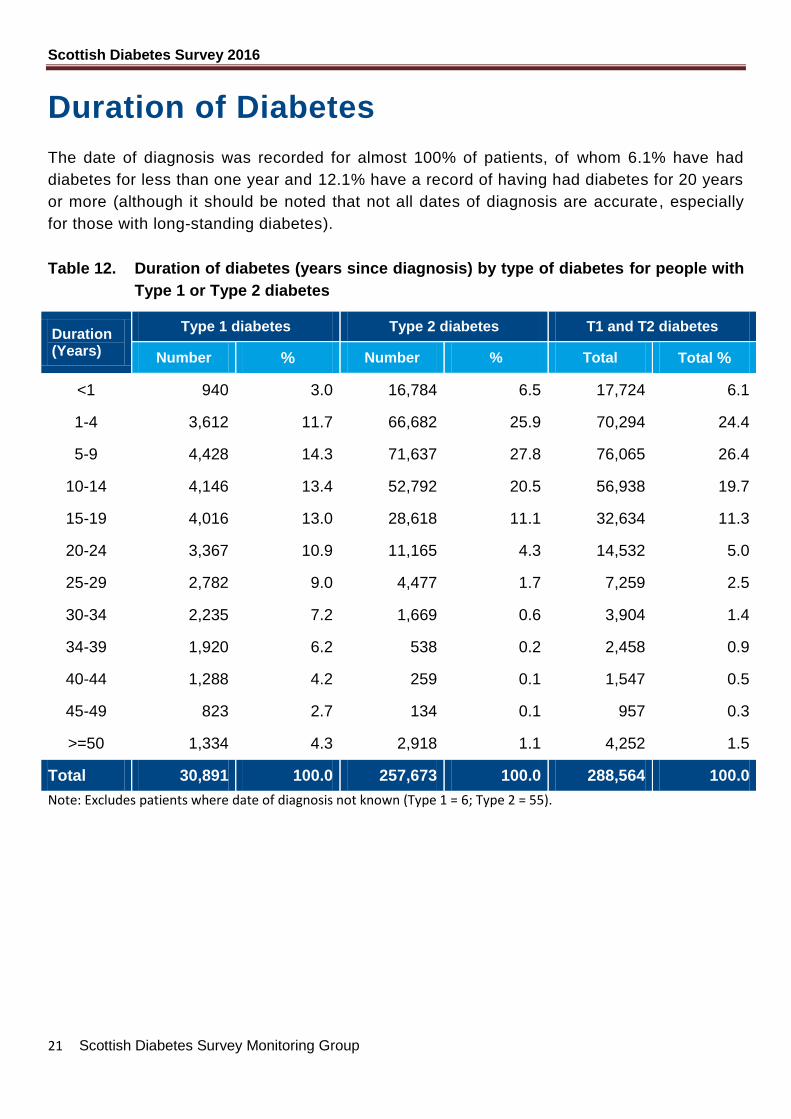
The date of diagnosis was recorded for almost 100% of patients, of whom 6.1% have had
diabetes for less than one year and 12.1% have a record of having had diabetes for 20 years
or more (although it should be noted that not all dates of diagnosis are accurate, especially
for those with long-standing diabetes).
Table 12. Duration of diabetes (years since diagnosis) by type of diabetes for people with
Type 1 or Type 2 diabetes
Duration (Years)
Type 1 diabetes Type 2 diabetes T1 and T2 diabetes
Number % Number % Total Total %
<1 940 3.0 16,784 6.5 17,724 6.1
1-4 3,612 11.7 66,682 25.9 70,294 24.4
5-9 4,428 14.3 71,637 27.8 76,065 26.4
10-14 4,146 13.4 52,792 20.5 56,938 19.7
15-19 4,016 13.0 28,618 11.1 32,634 11.3
20-24 3,367 10.9 11,165 4.3 14,532 5.0
25-29 2,782 9.0 4,477 1.7 7,259 2.5
30-34 2,235 7.2 1,669 0.6 3,904 1.4
34-39 1,920 6.2 538 0.2 2,458 0.9
40-44 1,288 4.2 259 0.1 1,547 0.5
45-49 823 2.7 134 0.1 957 0.3
>=50 1,334 4.3 2,918 1.1 4,252 1.5
Total 30,891 100.0 257,673 100.0 288,564 100.0
Note: Excludes patients where date of diagnosis not known (Type 1 = 6; Type 2 = 55).
Scottish Diabetes Survey 2016
22 Scottish Diabetes Survey Monitoring Group
Age and Sex
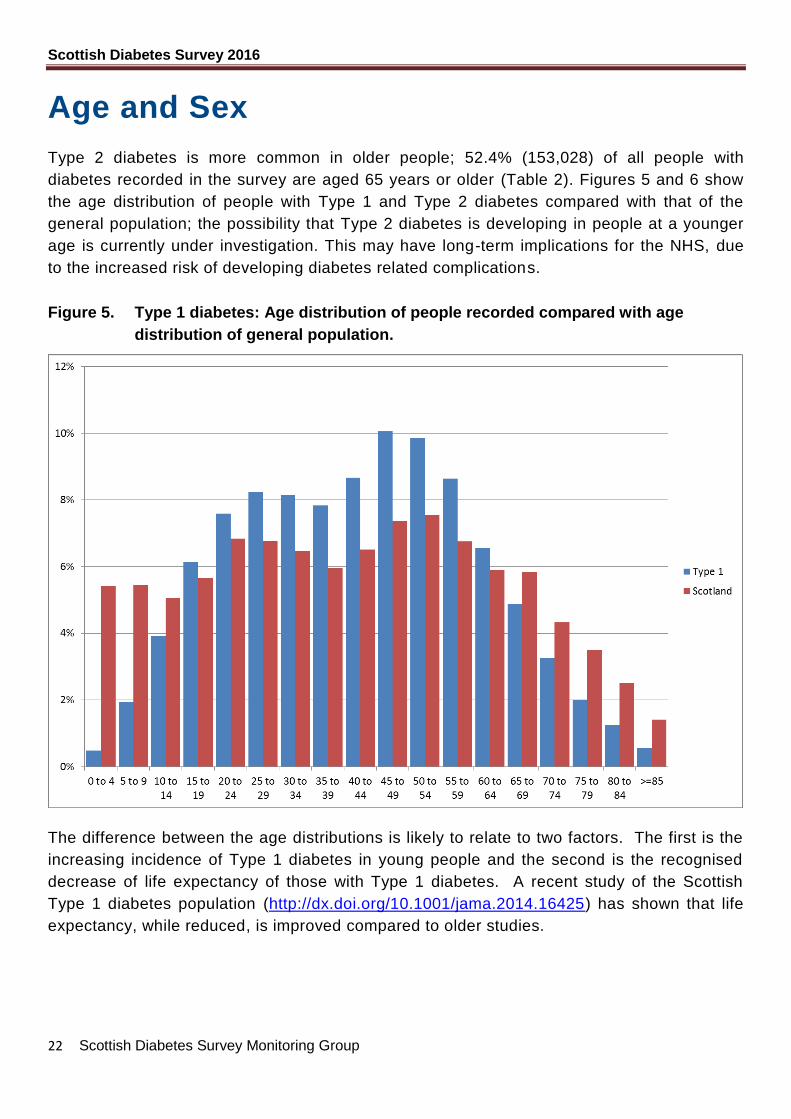
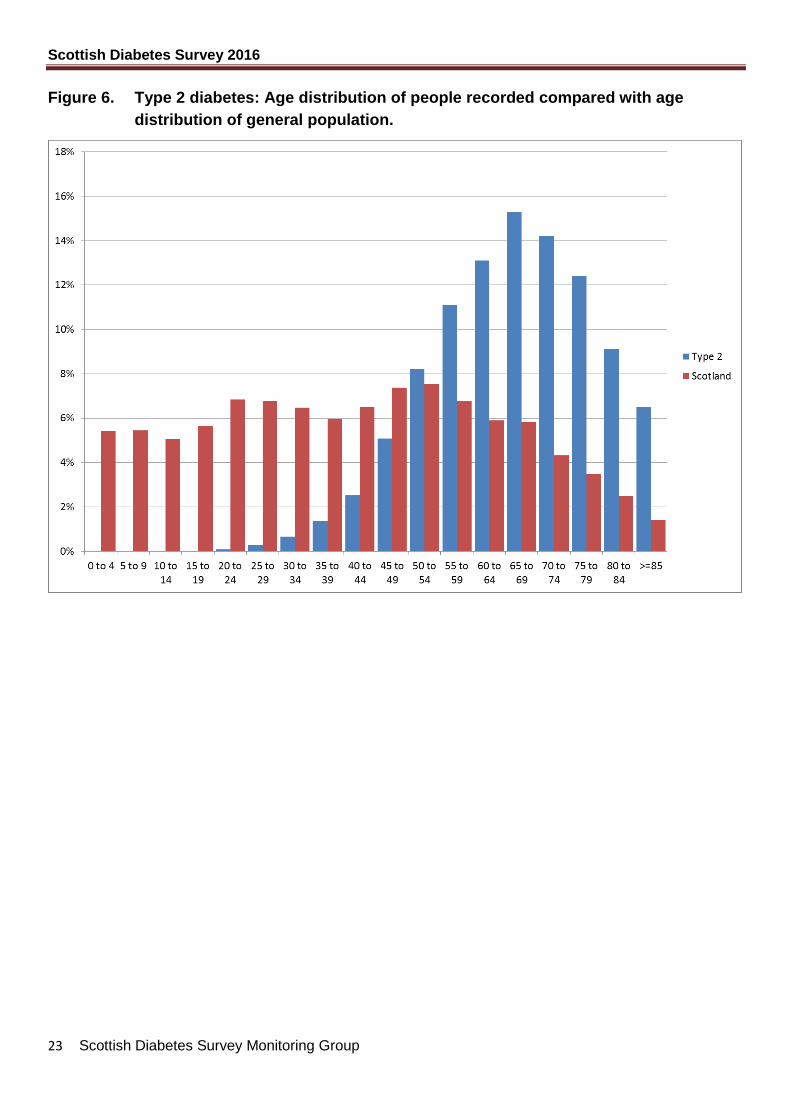
Type 2 diabetes is more common in older people; 52.4% (153,028) of all people with
diabetes recorded in the survey are aged 65 years or older (Table 2). Figures 5 and 6 show
the age distribution of people with Type 1 and Type 2 diabetes compared with that of the
general population; the possibility that Type 2 diabetes is developing in people at a younger
age is currently under investigation. This may have long-term implications for the NHS, due
to the increased risk of developing diabetes related complications.
Figure 5. Type 1 diabetes: Age distribution of people recorded compared with age
distribution of general population.
The difference between the age distributions is likely to relate to two factors. The first is the
increasing incidence of Type 1 diabetes in young people and the second is the recognised
decrease of life expectancy of those with Type 1 diabetes. A recent study of the Scottish
Type 1 diabetes population (http://dx.doi.org/10.1001/jama.2014.16425) has shown that life
expectancy, while reduced, is improved compared to older studies.
Scottish Diabetes Survey 2016
23 Scottish Diabetes Survey Monitoring Group
Figure 6. Type 2 diabetes: Age distribution of people recorded compared with age
distribution of general population.
Scottish Diabetes Survey 2016
24 Scottish Diabetes Survey Monitoring Group
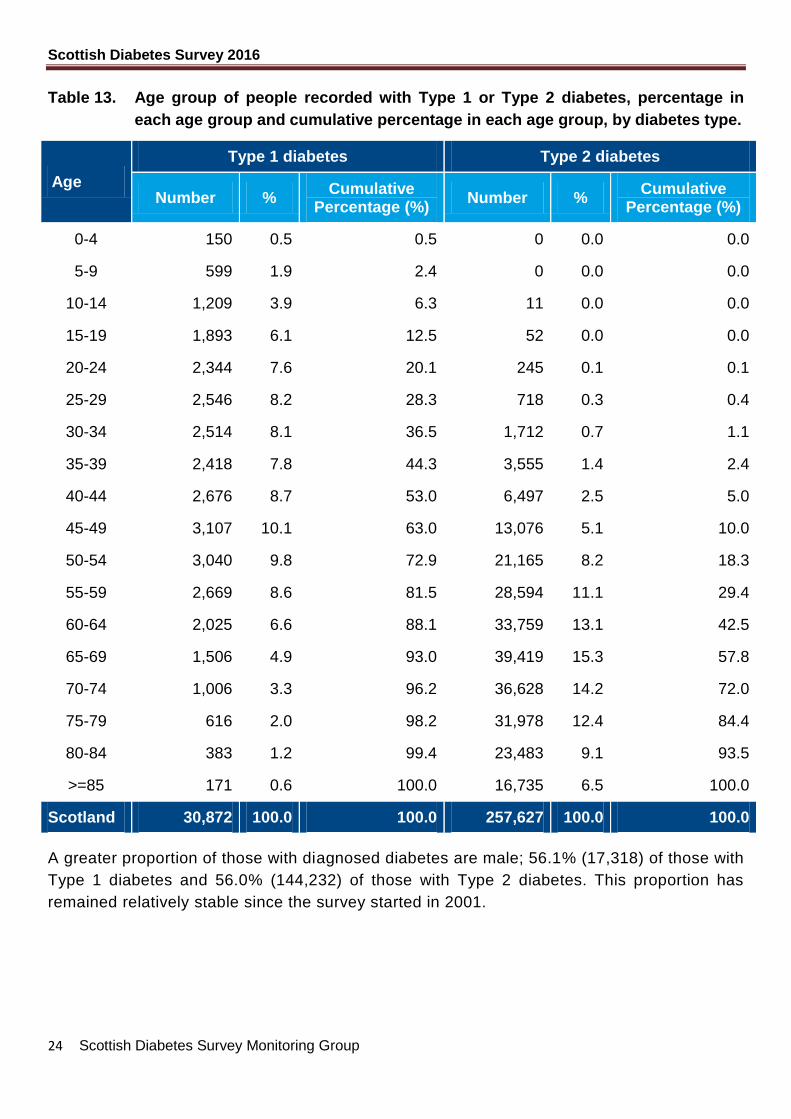
Table 13. Age group of people recorded with Type 1 or Type 2 diabetes, percentage in
each age group and cumulative percentage in each age group, by diabetes type.
Age
Type 1 diabetes Type 2 diabetes
Number % Cumulative
Percentage (%) Number %
Cumulative Percentage (%)
0-4 150 0.5 0.5 0 0.0 0.0
5-9 599 1.9 2.4 0 0.0 0.0
10-14 1,209 3.9 6.3 11 0.0 0.0
15-19 1,893 6.1 12.5 52 0.0 0.0
20-24 2,344 7.6 20.1 245 0.1 0.1
25-29 2,546 8.2 28.3 718 0.3 0.4
30-34 2,514 8.1 36.5 1,712 0.7 1.1
35-39 2,418 7.8 44.3 3,555 1.4 2.4
40-44 2,676 8.7 53.0 6,497 2.5 5.0
45-49 3,107 10.1 63.0 13,076 5.1 10.0
50-54 3,040 9.8 72.9 21,165 8.2 18.3
55-59 2,669 8.6 81.5 28,594 11.1 29.4
60-64 2,025 6.6 88.1 33,759 13.1 42.5
65-69 1,506 4.9 93.0 39,419 15.3 57.8
70-74 1,006 3.3 96.2 36,628 14.2 72.0
75-79 616 2.0 98.2 31,978 12.4 84.4
80-84 383 1.2 99.4 23,483 9.1 93.5
>=85 171 0.6 100.0 16,735 6.5 100.0
Scotland 30,872 100.0 100.0 257,627 100.0 100.0
A greater proportion of those with diagnosed diabetes are male; 56.1% (17,318) of those with
Type 1 diabetes and 56.0% (144,232) of those with Type 2 diabetes. This proportion has
remained relatively stable since the survey started in 2001.
Scottish Diabetes Survey 2016
25 Scottish Diabetes Survey Monitoring Group
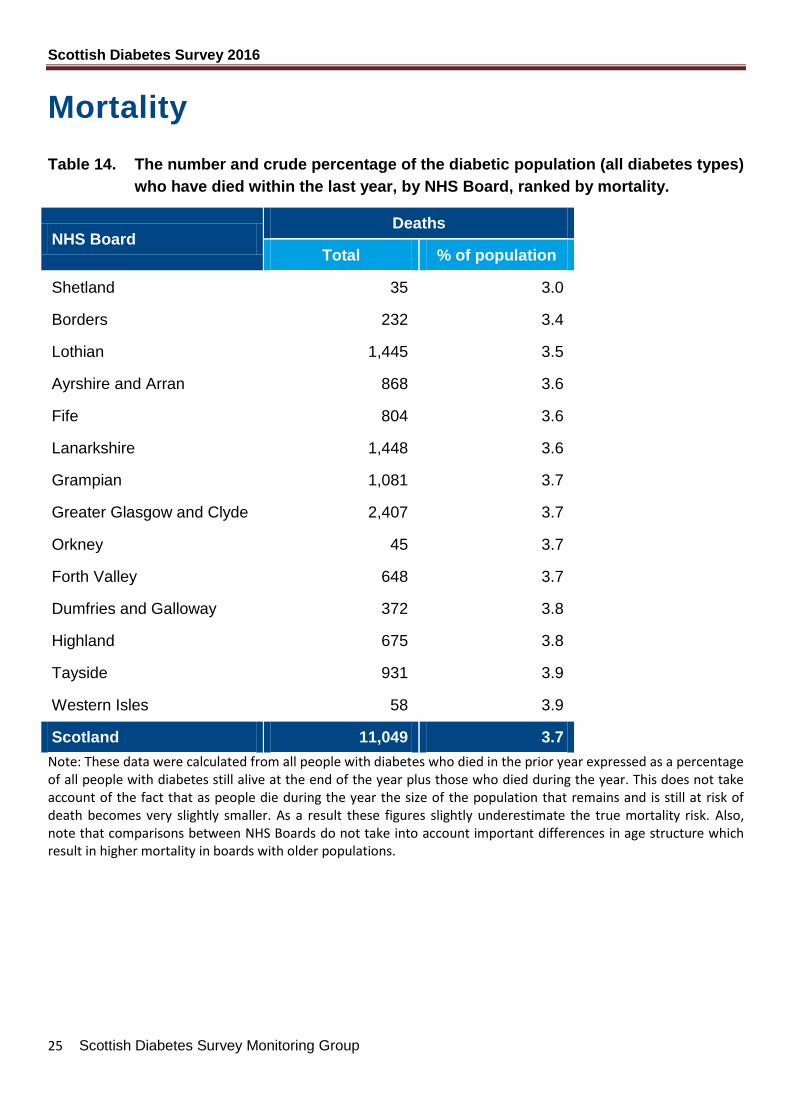
Mortality
Table 14. The number and crude percentage of the diabetic population (all diabetes types)
who have died within the last year, by NHS Board, ranked by mortality.
NHS Board Deaths
Total % of population
Shetland 35 3.0
Borders 232 3.4
Lothian 1,445 3.5
Ayrshire and Arran 868 3.6
Fife 804 3.6
Lanarkshire 1,448 3.6
Grampian 1,081 3.7
Greater Glasgow and Clyde 2,407 3.7
Orkney 45 3.7
Forth Valley 648 3.7
Dumfries and Galloway 372 3.8
Highland 675 3.8
Tayside 931 3.9
Western Isles 58 3.9
Scotland 11,049 3.7
Note: These data were calculated from all people with diabetes who died in the prior year expressed as a percentage of all people with diabetes still alive at the end of the year plus those who died during the year. This does not take account of the fact that as people die during the year the size of the population that remains and is still at risk of death becomes very slightly smaller. As a result these figures slightly underestimate the true mortality risk. Also, note that comparisons between NHS Boards do not take into account important differences in age structure which result in higher mortality in boards with older populations.

Scottish Diabetes Survey 2016
26 Scottish Diabetes Survey Monitoring Group
Type of Diabetes
The majority of registered patients have Type 2 diabetes (257,728 or 88.3%). The proportion
of people with diabetes who have a record of Type 1 diabetes has fallen from 18.2% in 2002
to 10.6% in 2016, probably largely due to more complete recording of data from people with
Type 1 diabetes than Type 2 diabetes in earlier years. However, the absolute number of
patients with Type 1 diabetes continues to increase (22,597 in 2003; 29,261 in 2013 and
30,899 in 2016). This reflects the rising incidence of Type 1 diabetes in children and better
survival over the last 40 years. Other types of diabetes include Maturity Onset Diabetes of
the Young (MODY), gestational diabetes and secondary diabetes.
Figure 7 Proportions of diabetes population by type
Scottish Diabetes Survey 2016
27 Scottish Diabetes Survey Monitoring Group
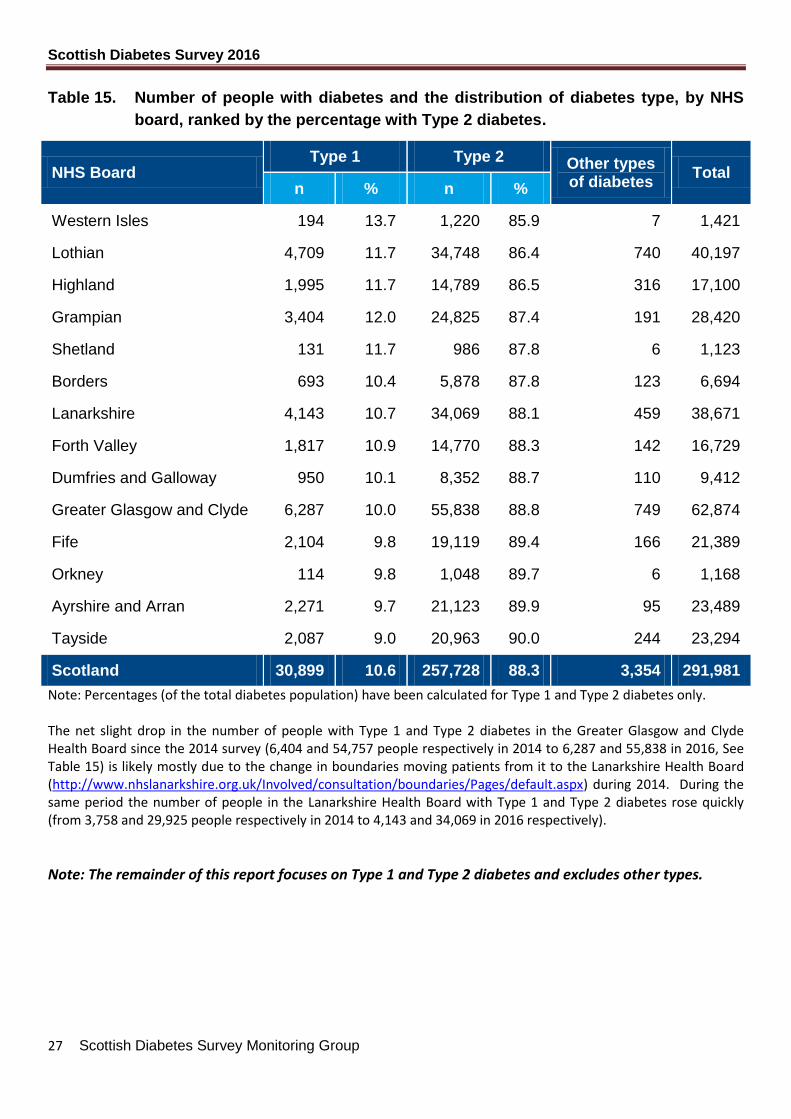
Table 15. Number of people with diabetes and the distribution of diabetes type, by NHS
board, ranked by the percentage with Type 2 diabetes.
NHS Board Type 1 Type 2 Other types
of diabetes Total
n % n %
Western Isles 194 13.7 1,220 85.9 7 1,421
Lothian 4,709 11.7 34,748 86.4 740 40,197
Highland 1,995 11.7 14,789 86.5 316 17,100
Grampian 3,404 12.0 24,825 87.4 191 28,420
Shetland 131 11.7 986 87.8 6 1,123
Borders 693 10.4 5,878 87.8 123 6,694
Lanarkshire 4,143 10.7 34,069 88.1 459 38,671
Forth Valley 1,817 10.9 14,770 88.3 142 16,729
Dumfries and Galloway 950 10.1 8,352 88.7 110 9,412
Greater Glasgow and Clyde 6,287 10.0 55,838 88.8 749 62,874
Fife 2,104 9.8 19,119 89.4 166 21,389
Orkney 114 9.8 1,048 89.7 6 1,168
Ayrshire and Arran 2,271 9.7 21,123 89.9 95 23,489
Tayside 2,087 9.0 20,963 90.0 244 23,294
Scotland 30,899 10.6 257,728 88.3 3,354 291,981
Note: Percentages (of the total diabetes population) have been calculated for Type 1 and Type 2 diabetes only. The net slight drop in the number of people with Type 1 and Type 2 diabetes in the Greater Glasgow and Clyde Health Board since the 2014 survey (6,404 and 54,757 people respectively in 2014 to 6,287 and 55,838 in 2016, See Table 15) is likely mostly due to the change in boundaries moving patients from it to the Lanarkshire Health Board (http://www.nhslanarkshire.org.uk/Involved/consultation/boundaries/Pages/default.aspx) during 2014. During the same period the number of people in the Lanarkshire Health Board with Type 1 and Type 2 diabetes rose quickly (from 3,758 and 29,925 people respectively in 2014 to 4,143 and 34,069 in 2016 respectively).
Note: The remainder of this report focuses on Type 1 and Type 2 diabetes and excludes other types.
Scottish Diabetes Survey 2016
28 Scottish Diabetes Survey Monitoring Group
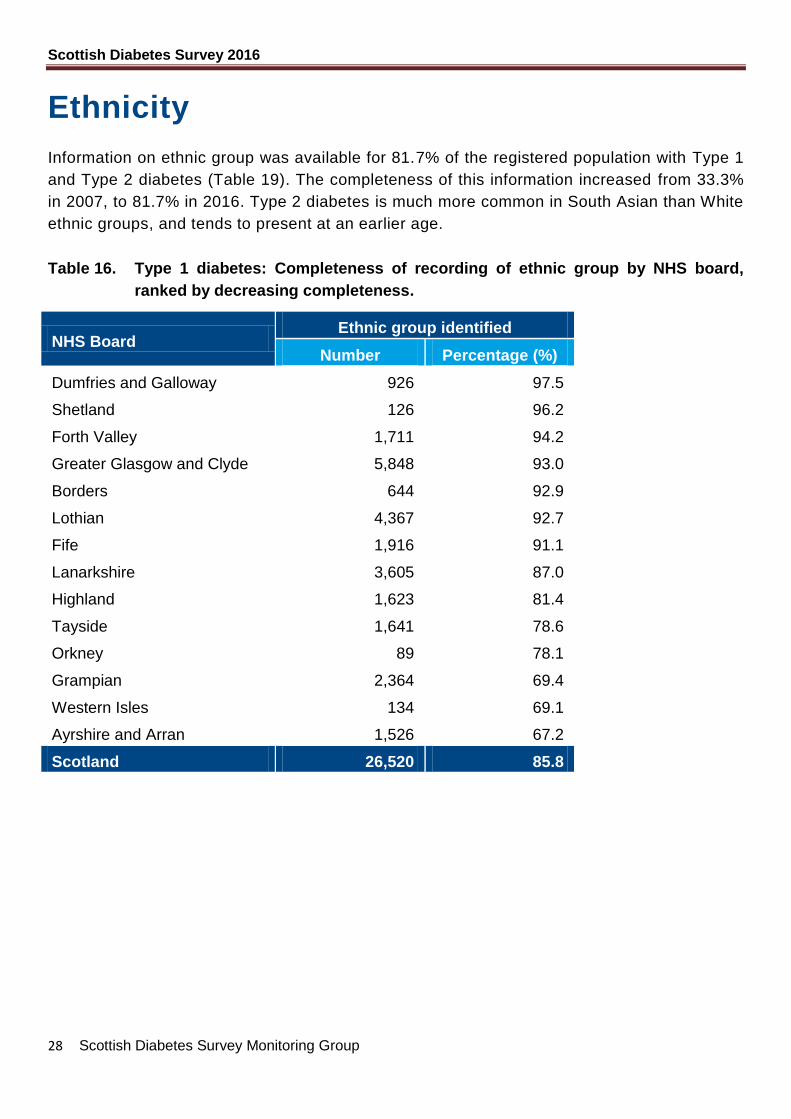
Ethnicity
Information on ethnic group was available for 81.7% of the registered population with Type 1
and Type 2 diabetes (Table 19). The completeness of this information increased from 33.3%
in 2007, to 81.7% in 2016. Type 2 diabetes is much more common in South Asian than White
ethnic groups, and tends to present at an earlier age.
Table 16. Type 1 diabetes: Completeness of recording of ethnic group by NHS board,
ranked by decreasing completeness.
NHS Board Ethnic group identified
Number Percentage (%)
Dumfries and Galloway 926 97.5
Shetland 126 96.2
Forth Valley 1,711 94.2
Greater Glasgow and Clyde 5,848 93.0
Borders 644 92.9
Lothian 4,367 92.7
Fife 1,916 91.1
Lanarkshire 3,605 87.0
Highland 1,623 81.4
Tayside 1,641 78.6
Orkney 89 78.1
Grampian 2,364 69.4
Western Isles 134 69.1
Ayrshire and Arran 1,526 67.2
Scotland 26,520 85.8
Scottish Diabetes Survey 2016
29 Scottish Diabetes Survey Monitoring Group
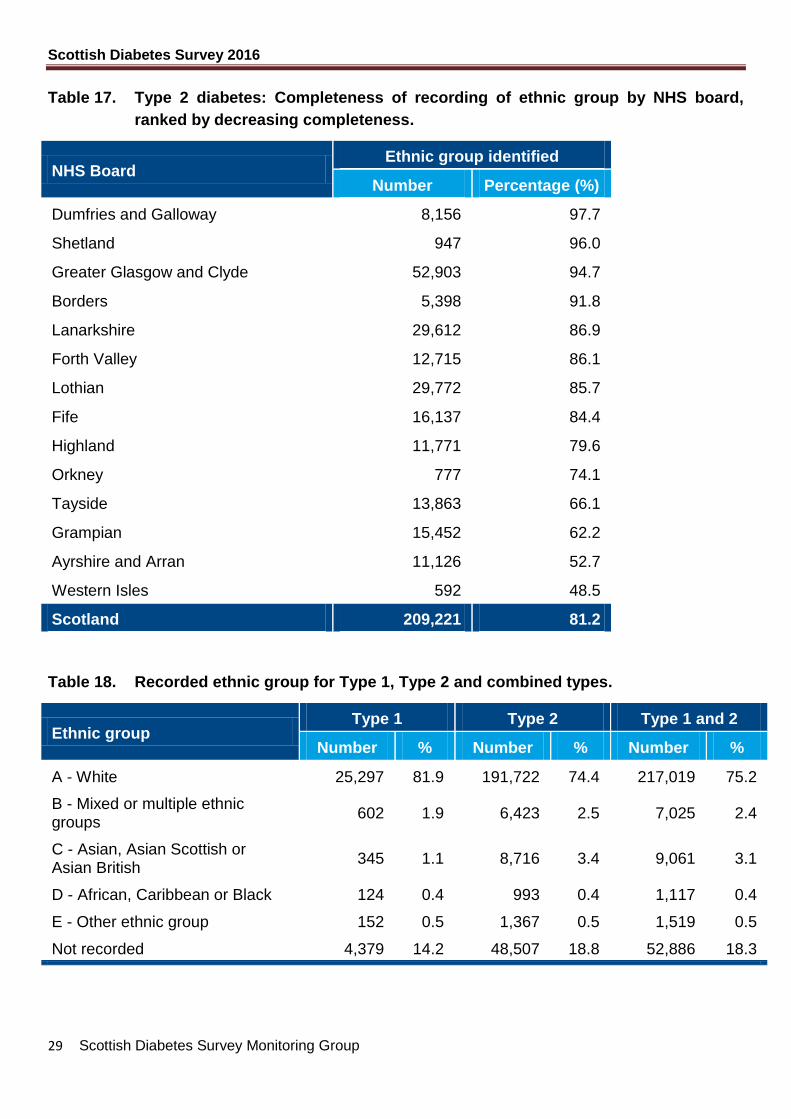
Table 17. Type 2 diabetes: Completeness of recording of ethnic group by NHS board,
ranked by decreasing completeness.
NHS Board Ethnic group identified
Number Percentage (%)
Dumfries and Galloway 8,156 97.7
Shetland 947 96.0
Greater Glasgow and Clyde 52,903 94.7
Borders 5,398 91.8
Lanarkshire 29,612 86.9
Forth Valley 12,715 86.1
Lothian 29,772 85.7
Fife 16,137 84.4
Highland 11,771 79.6
Orkney 777 74.1
Tayside 13,863 66.1
Grampian 15,452 62.2
Ayrshire and Arran 11,126 52.7
Western Isles 592 48.5
Scotland 209,221 81.2
Table 18. Recorded ethnic group for Type 1, Type 2 and combined types.
Ethnic group Type 1 Type 2 Type 1 and 2
Number % Number % Number %
A - White 25,297 81.9 191,722 74.4 217,019 75.2
B - Mixed or multiple ethnic groups
602 1.9 6,423 2.5 7,025 2.4
C - Asian, Asian Scottish or Asian British
345 1.1 8,716 3.4 9,061 3.1
D - African, Caribbean or Black 124 0.4 993 0.4 1,117 0.4
E - Other ethnic group 152 0.5 1,367 0.5 1,519 0.5
Not recorded 4,379 14.2 48,507 18.8 52,886 18.3
Scottish Diabetes Survey 2016
30 Scottish Diabetes Survey Monitoring Group
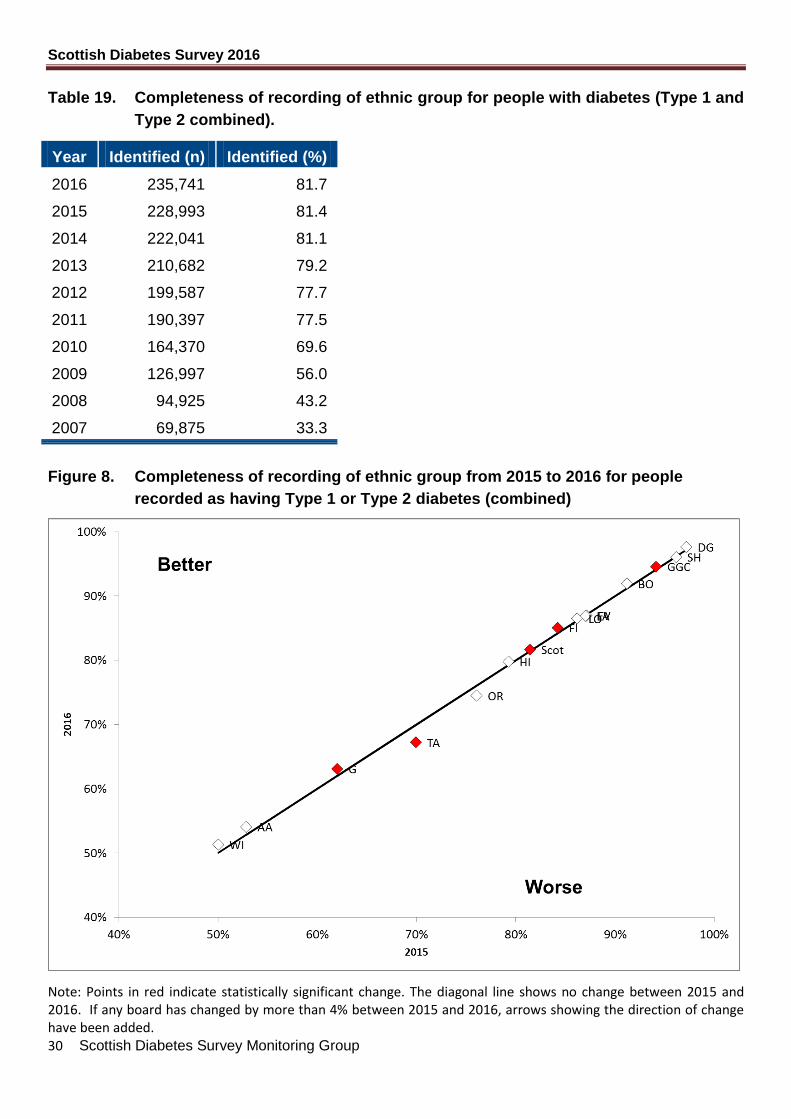
Table 19. Completeness of recording of ethnic group for people with diabetes (Type 1 and
Type 2 combined).
Year Identified (n) Identified (%)
2016 235,741 81.7
2015 228,993 81.4
2014 222,041 81.1
2013 210,682 79.2
2012 199,587 77.7
2011 190,397 77.5
2010 164,370 69.6
2009 126,997 56.0
2008 94,925 43.2
2007 69,875 33.3
Figure 8. Completeness of recording of ethnic group from 2015 to 2016 for people
recorded as having Type 1 or Type 2 diabetes (combined)
Note: Points in red indicate statistically significant change. The diagonal line shows no change between 2015 and 2016. If any board has changed by more than 4% between 2015 and 2016, arrows showing the direction of change have been added.
Scottish Diabetes Survey 2016
31 Scottish Diabetes Survey Monitoring Group
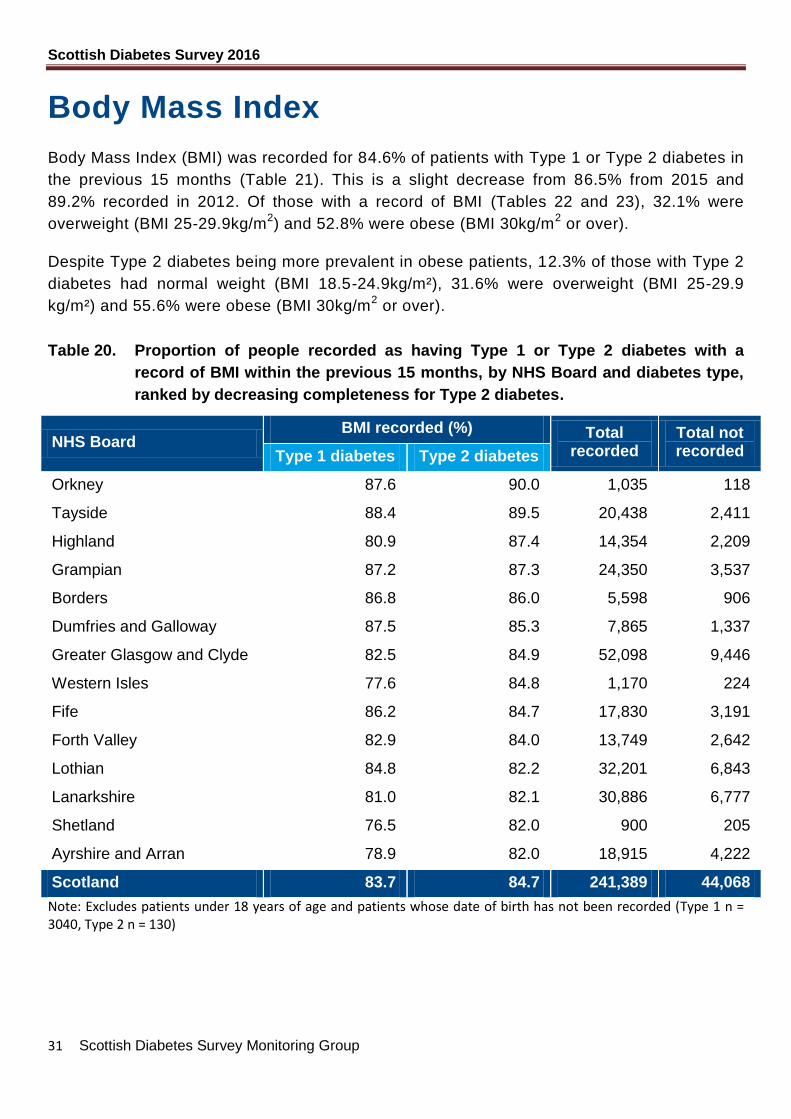
Body Mass Index
Body Mass Index (BMI) was recorded for 84.6% of patients with Type 1 or Type 2 diabetes in
the previous 15 months (Table 21). This is a slight decrease from 86.5% from 2015 and
89.2% recorded in 2012. Of those with a record of BMI (Tables 22 and 23), 32.1% were
overweight (BMI 25-29.9kg/m2) and 52.8% were obese (BMI 30kg/m
2 or over).
Despite Type 2 diabetes being more prevalent in obese patients, 12.3% of those with Type 2
diabetes had normal weight (BMI 18.5-24.9kg/m²), 31.6% were overweight (BMI 25-29.9
kg/m²) and 55.6% were obese (BMI 30kg/m2 or over).
Table 20. Proportion of people recorded as having Type 1 or Type 2 diabetes with a
record of BMI within the previous 15 months, by NHS Board and diabetes type,
ranked by decreasing completeness for Type 2 diabetes.
NHS Board BMI recorded (%) Total
recorded Total not recorded Type 1 diabetes Type 2 diabetes
Orkney 87.6 90.0 1,035 118
Tayside 88.4 89.5 20,438 2,411
Highland 80.9 87.4 14,354 2,209
Grampian 87.2 87.3 24,350 3,537
Borders 86.8 86.0 5,598 906
Dumfries and Galloway 87.5 85.3 7,865 1,337
Greater Glasgow and Clyde 82.5 84.9 52,098 9,446
Western Isles 77.6 84.8 1,170 224
Fife 86.2 84.7 17,830 3,191
Forth Valley 82.9 84.0 13,749 2,642
Lothian 84.8 82.2 32,201 6,843
Lanarkshire 81.0 82.1 30,886 6,777
Shetland 76.5 82.0 900 205
Ayrshire and Arran 78.9 82.0 18,915 4,222
Scotland 83.7 84.7 241,389 44,068
Note: Excludes patients under 18 years of age and patients whose date of birth has not been recorded (Type 1 n = 3040, Type 2 n = 130)
Scottish Diabetes Survey 2016
32 Scottish Diabetes Survey Monitoring Group
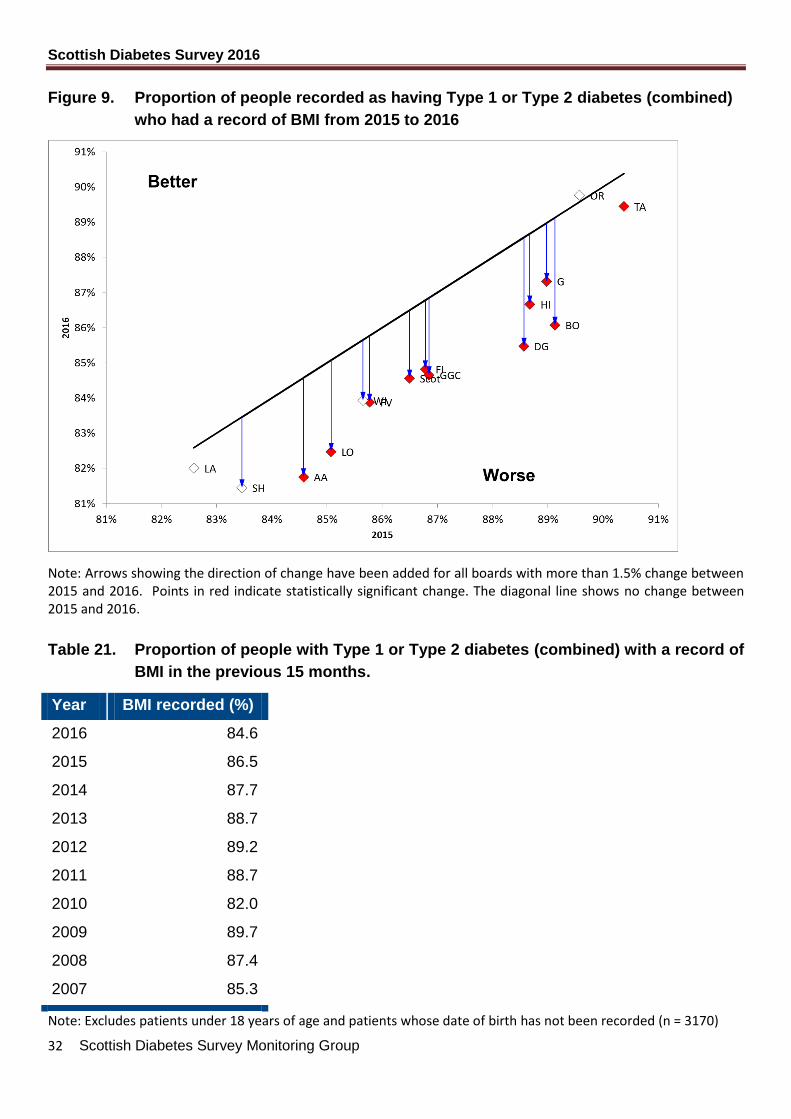
Figure 9. Proportion of people recorded as having Type 1 or Type 2 diabetes (combined)
who had a record of BMI from 2015 to 2016
Note: Arrows showing the direction of change have been added for all boards with more than 1.5% change between 2015 and 2016. Points in red indicate statistically significant change. The diagonal line shows no change between 2015 and 2016.
Table 21. Proportion of people with Type 1 or Type 2 diabetes (combined) with a record of
BMI in the previous 15 months.
Year BMI recorded (%)
2016 84.6
2015 86.5
2014 87.7
2013 88.7
2012 89.2
2011 88.7
2010 82.0
2009 89.7
2008 87.4
2007 85.3
Note: Excludes patients under 18 years of age and patients whose date of birth has not been recorded (n = 3170)
Scottish Diabetes Survey 2016
33 Scottish Diabetes Survey Monitoring Group
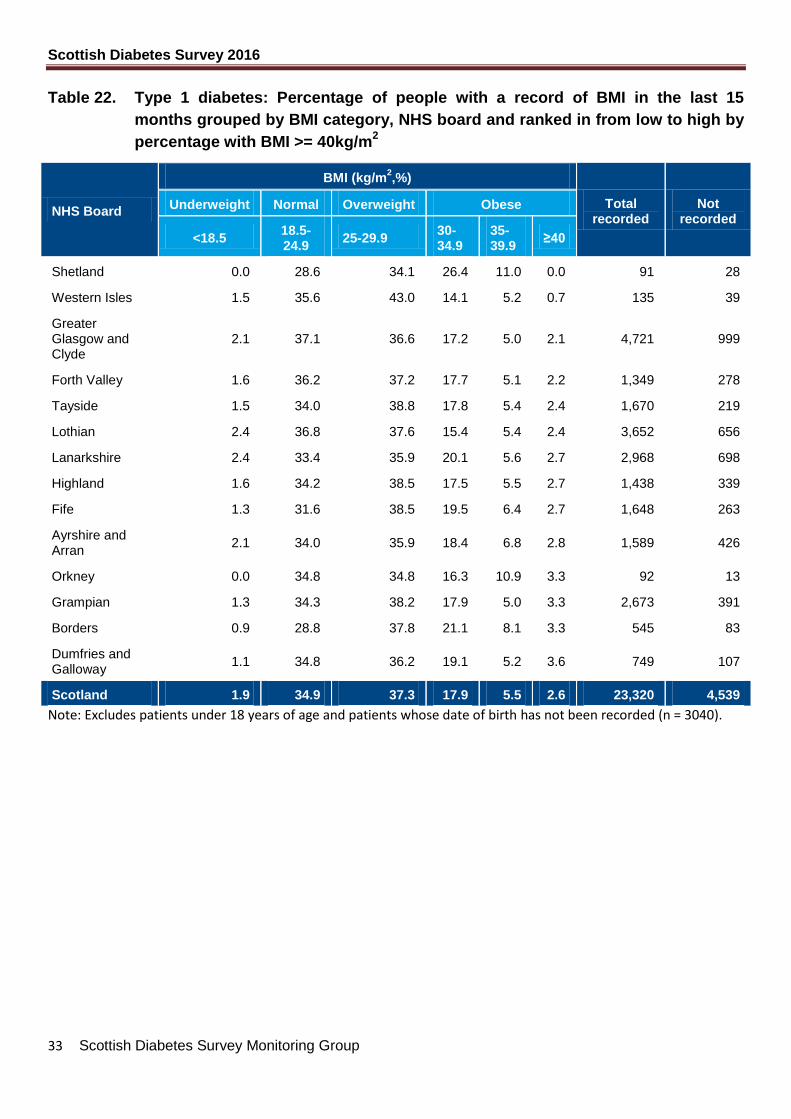
Table 22. Type 1 diabetes: Percentage of people with a record of BMI in the last 15
months grouped by BMI category, NHS board and ranked in from low to high by
percentage with BMI >= 40kg/m2
NHS Board
BMI (kg/m2,%)
Total recorded
Not recorded
Underweight Normal Overweight Obese
<18.5 18.5-24.9
25-29.9 30-34.9
35-39.9
≥40
Shetland 0.0 28.6 34.1 26.4 11.0 0.0 91 28
Western Isles 1.5 35.6 43.0 14.1 5.2 0.7 135 39
Greater Glasgow and Clyde
2.1 37.1 36.6 17.2 5.0 2.1 4,721 999
Forth Valley 1.6 36.2 37.2 17.7 5.1 2.2 1,349 278
Tayside 1.5 34.0 38.8 17.8 5.4 2.4 1,670 219
Lothian 2.4 36.8 37.6 15.4 5.4 2.4 3,652 656
Lanarkshire 2.4 33.4 35.9 20.1 5.6 2.7 2,968 698
Highland 1.6 34.2 38.5 17.5 5.5 2.7 1,438 339
Fife 1.3 31.6 38.5 19.5 6.4 2.7 1,648 263
Ayrshire and Arran
2.1 34.0 35.9 18.4 6.8 2.8 1,589 426
Orkney 0.0 34.8 34.8 16.3 10.9 3.3 92 13
Grampian 1.3 34.3 38.2 17.9 5.0 3.3 2,673 391
Borders 0.9 28.8 37.8 21.1 8.1 3.3 545 83
Dumfries and Galloway
1.1 34.8 36.2 19.1 5.2 3.6 749 107
Scotland 1.9 34.9 37.3 17.9 5.5 2.6 23,320 4,539
Note: Excludes patients under 18 years of age and patients whose date of birth has not been recorded (n = 3040).
Scottish Diabetes Survey 2016
34 Scottish Diabetes Survey Monitoring Group
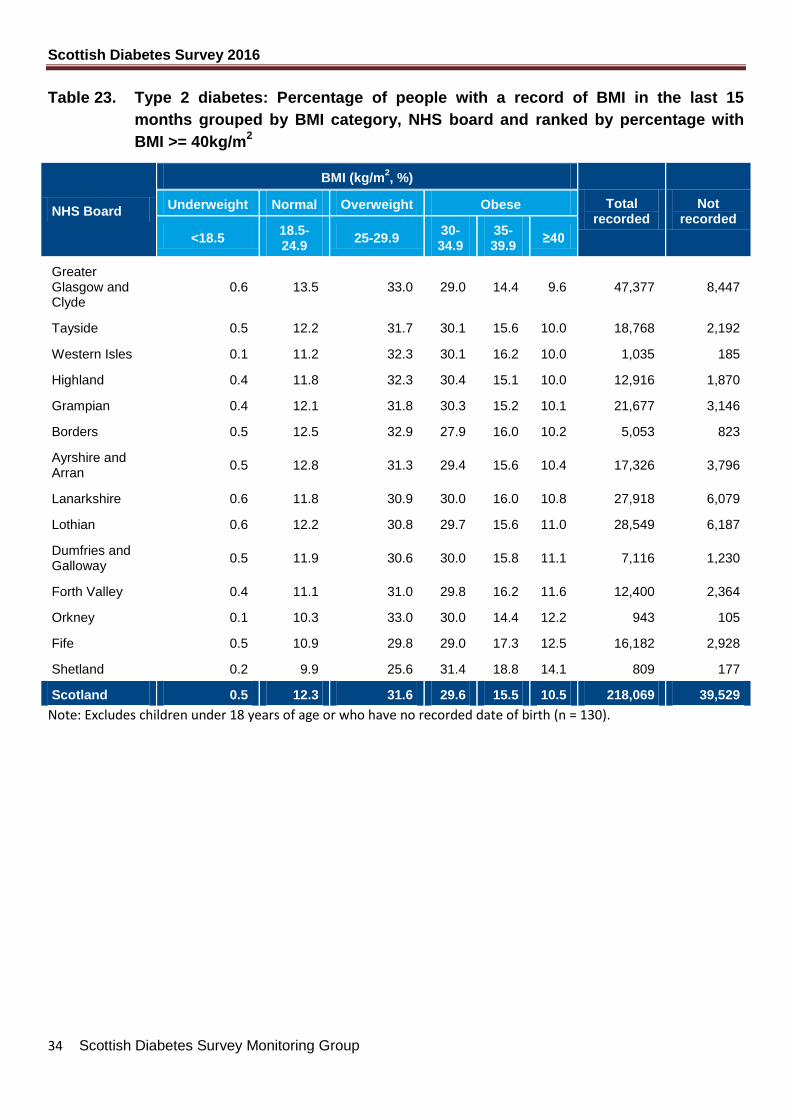
Table 23. Type 2 diabetes: Percentage of people with a record of BMI in the last 15
months grouped by BMI category, NHS board and ranked by percentage with
BMI >= 40kg/m2
NHS Board
BMI (kg/m2, %)
Total recorded
Not recorded
Underweight Normal Overweight Obese
<18.5 18.5-24.9
25-29.9 30-34.9
35-39.9
≥40
Greater Glasgow and Clyde
0.6 13.5 33.0 29.0 14.4 9.6 47,377 8,447
Tayside 0.5 12.2 31.7 30.1 15.6 10.0 18,768 2,192
Western Isles 0.1 11.2 32.3 30.1 16.2 10.0 1,035 185
Highland 0.4 11.8 32.3 30.4 15.1 10.0 12,916 1,870
Grampian 0.4 12.1 31.8 30.3 15.2 10.1 21,677 3,146
Borders 0.5 12.5 32.9 27.9 16.0 10.2 5,053 823
Ayrshire and Arran
0.5 12.8 31.3 29.4 15.6 10.4 17,326 3,796
Lanarkshire 0.6 11.8 30.9 30.0 16.0 10.8 27,918 6,079
Lothian 0.6 12.2 30.8 29.7 15.6 11.0 28,549 6,187
Dumfries and Galloway
0.5 11.9 30.6 30.0 15.8 11.1 7,116 1,230
Forth Valley 0.4 11.1 31.0 29.8 16.2 11.6 12,400 2,364
Orkney 0.1 10.3 33.0 30.0 14.4 12.2 943 105
Fife 0.5 10.9 29.8 29.0 17.3 12.5 16,182 2,928
Shetland 0.2 9.9 25.6 31.4 18.8 14.1 809 177
Scotland 0.5 12.3 31.6 29.6 15.5 10.5 218,069 39,529
Note: Excludes children under 18 years of age or who have no recorded date of birth (n = 130).
Scottish Diabetes Survey 2016
35 Scottish Diabetes Survey Monitoring Group
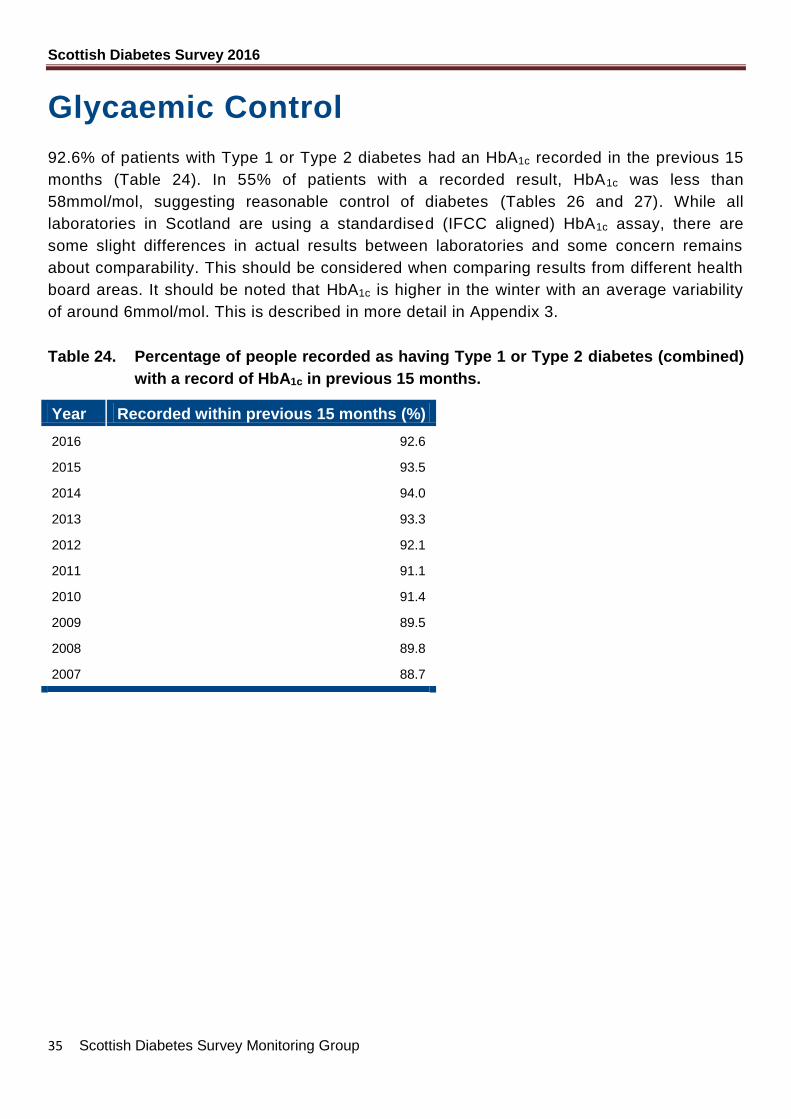
Glycaemic Control
92.6% of patients with Type 1 or Type 2 diabetes had an HbA1c recorded in the previous 15
months (Table 24). In 55% of patients with a recorded result, HbA1c was less than
58mmol/mol, suggesting reasonable control of diabetes (Tables 26 and 27). While all
laboratories in Scotland are using a standardised (IFCC aligned) HbA1c assay, there are
some slight differences in actual results between laboratories and some concern remains
about comparability. This should be considered when comparing results from different health
board areas. It should be noted that HbA1c is higher in the winter with an average variability
of around 6mmol/mol. This is described in more detail in Appendix 3.
Table 24. Percentage of people recorded as having Type 1 or Type 2 diabetes (combined)
with a record of HbA1c in previous 15 months.
Year Recorded within previous 15 months (%)
2016 92.6
2015 93.5
2014 94.0
2013 93.3
2012 92.1
2011 91.1
2010 91.4
2009 89.5
2008 89.8
2007 88.7
Scottish Diabetes Survey 2016
36 Scottish Diabetes Survey Monitoring Group
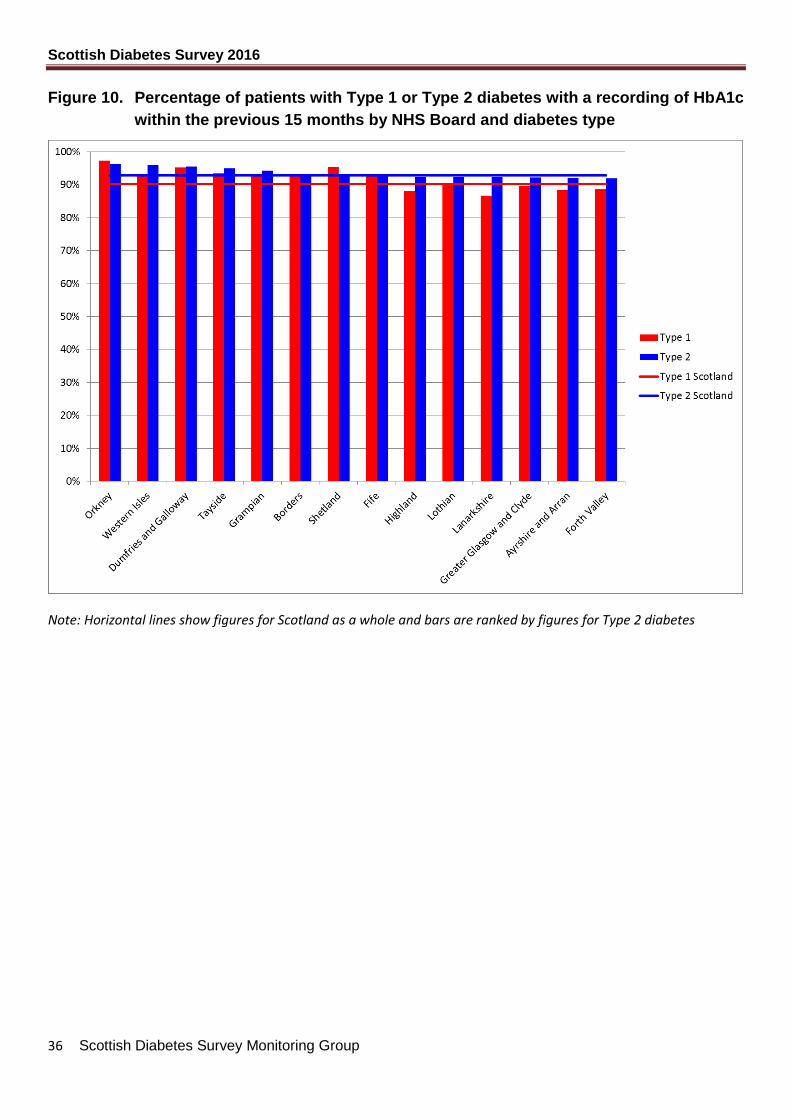
Figure 10. Percentage of patients with Type 1 or Type 2 diabetes with a recording of HbA1c
within the previous 15 months by NHS Board and diabetes type
Note: Horizontal lines show figures for Scotland as a whole and bars are ranked by figures for Type 2 diabetes
Scottish Diabetes Survey 2016
37 Scottish Diabetes Survey Monitoring Group
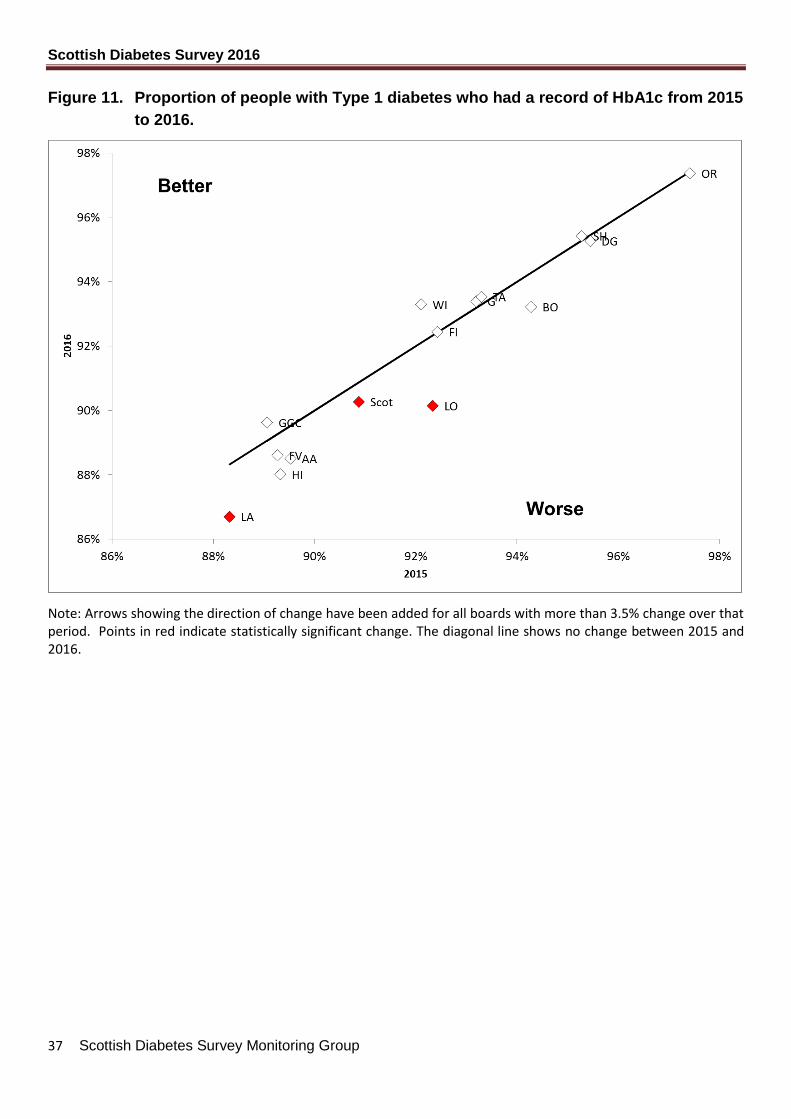
Figure 11. Proportion of people with Type 1 diabetes who had a record of HbA1c from 2015
to 2016.
Note: Arrows showing the direction of change have been added for all boards with more than 3.5% change over that period. Points in red indicate statistically significant change. The diagonal line shows no change between 2015 and 2016.
Scottish Diabetes Survey 2016
38 Scottish Diabetes Survey Monitoring Group
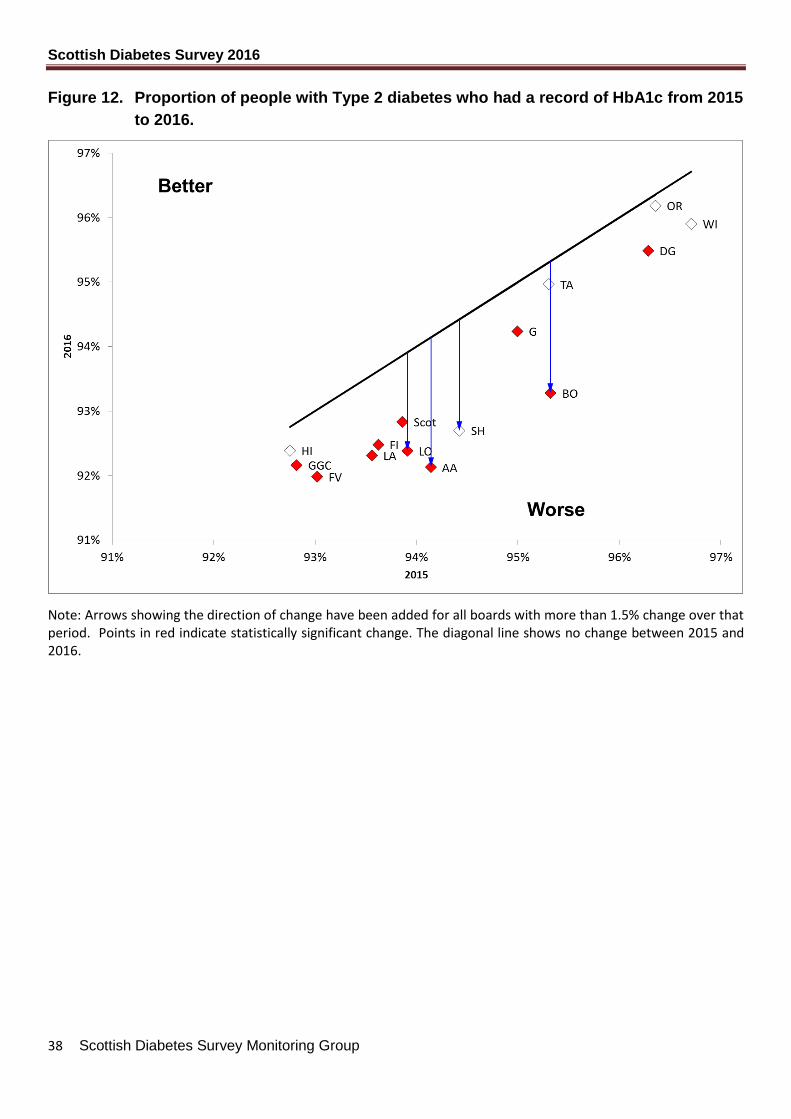
Figure 12. Proportion of people with Type 2 diabetes who had a record of HbA1c from 2015
to 2016.
Note: Arrows showing the direction of change have been added for all boards with more than 1.5% change over that period. Points in red indicate statistically significant change. The diagonal line shows no change between 2015 and 2016.
Scottish Diabetes Survey 2016
39 Scottish Diabetes Survey Monitoring Group
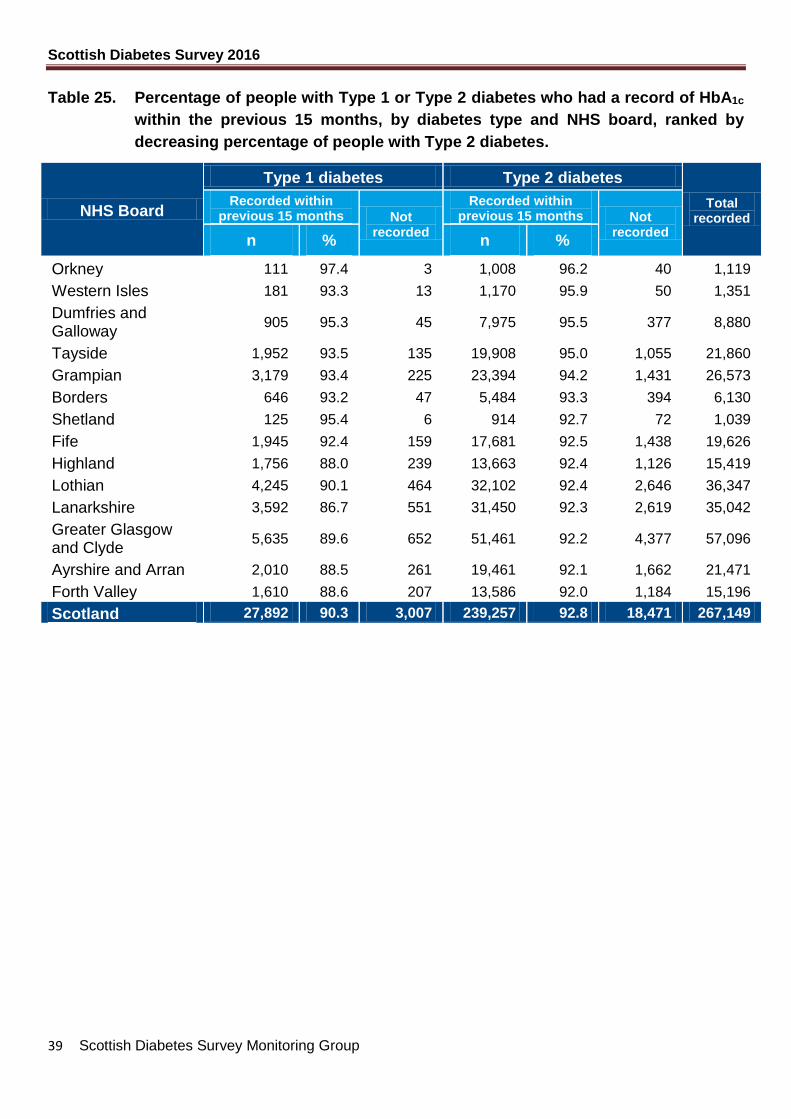
Table 25. Percentage of people with Type 1 or Type 2 diabetes who had a record of HbA1c
within the previous 15 months, by diabetes type and NHS board, ranked by
decreasing percentage of people with Type 2 diabetes.
NHS Board
Type 1 diabetes Type 2 diabetes
Total recorded
Recorded within previous 15 months Not
recorded
Recorded within previous 15 months Not
recorded n % n %
Orkney 111 97.4 3 1,008 96.2 40 1,119
Western Isles 181 93.3 13 1,170 95.9 50 1,351
Dumfries and Galloway
905 95.3 45 7,975 95.5 377 8,880
Tayside 1,952 93.5 135 19,908 95.0 1,055 21,860
Grampian 3,179 93.4 225 23,394 94.2 1,431 26,573
Borders 646 93.2 47 5,484 93.3 394 6,130
Shetland 125 95.4 6 914 92.7 72 1,039
Fife 1,945 92.4 159 17,681 92.5 1,438 19,626
Highland 1,756 88.0 239 13,663 92.4 1,126 15,419
Lothian 4,245 90.1 464 32,102 92.4 2,646 36,347
Lanarkshire 3,592 86.7 551 31,450 92.3 2,619 35,042
Greater Glasgow and Clyde
5,635 89.6 652 51,461 92.2 4,377 57,096
Ayrshire and Arran 2,010 88.5 261 19,461 92.1 1,662 21,471
Forth Valley 1,610 88.6 207 13,586 92.0 1,184 15,196
Scotland 27,892 90.3 3,007 239,257 92.8 18,471 267,149

Scottish Diabetes Survey 2016
40 Scottish Diabetes Survey Monitoring Group
Figure 13. Type 1 diabetes: Percentage of people in each HbA1c category for HbA1c
recorded in the previous 15 months, by NHS Board, ranked by decreasing
percentage with HbA1c under 58 mmol/mol.
Scottish Diabetes Survey 2016
41 Scottish Diabetes Survey Monitoring Group
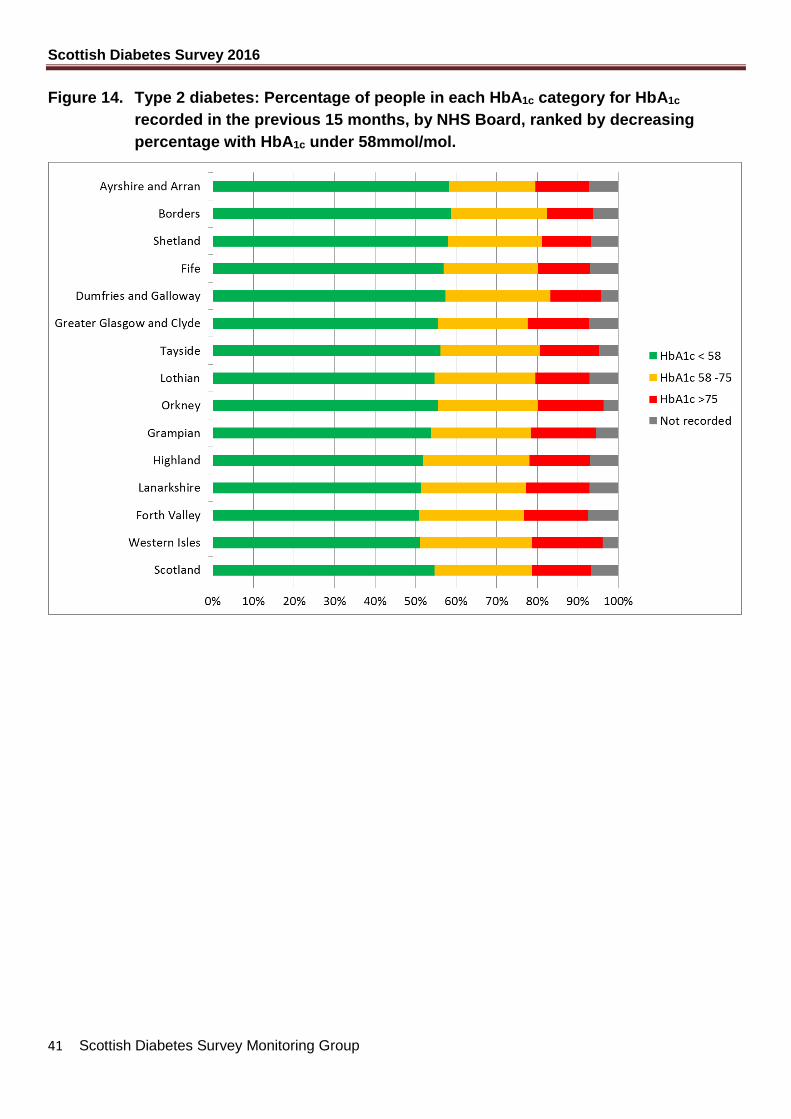
Figure 14. Type 2 diabetes: Percentage of people in each HbA1c category for HbA1c
recorded in the previous 15 months, by NHS Board, ranked by decreasing
percentage with HbA1c under 58mmol/mol.
Scottish Diabetes Survey 2016
42 Scottish Diabetes Survey Monitoring Group
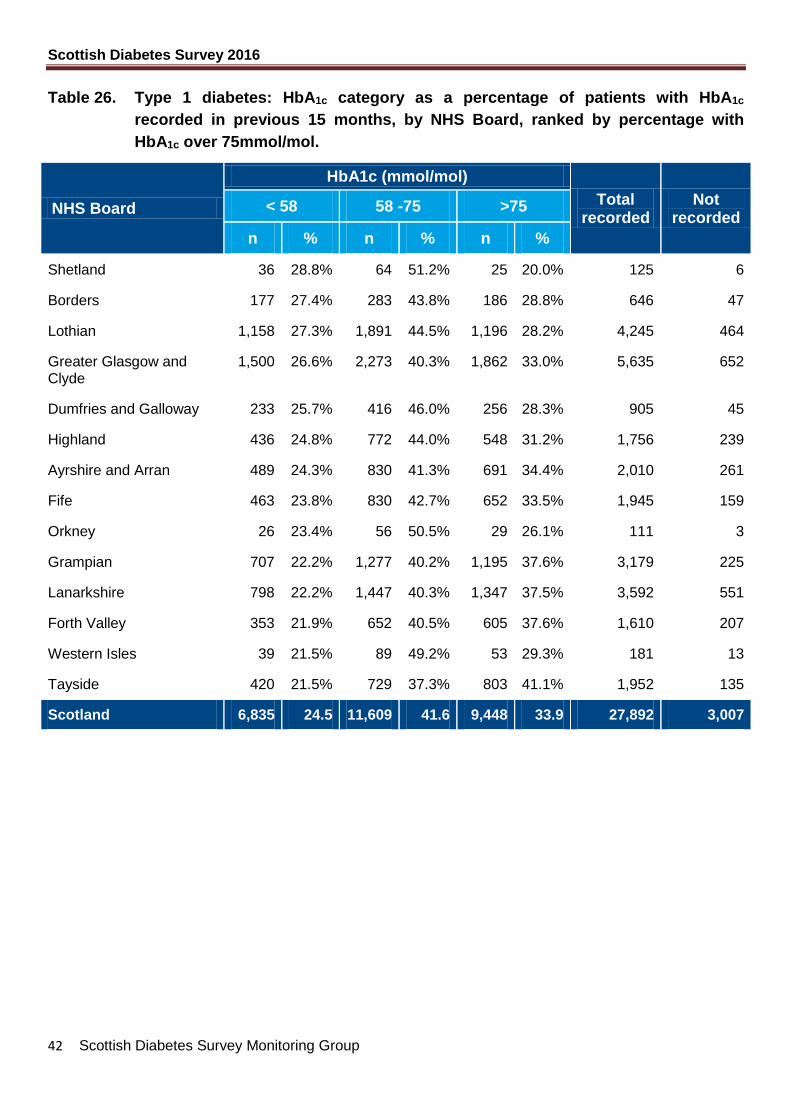
Table 26. Type 1 diabetes: HbA1c category as a percentage of patients with HbA1c
recorded in previous 15 months, by NHS Board, ranked by percentage with
HbA1c over 75mmol/mol.
NHS Board
HbA1c (mmol/mol)
Total recorded
Not recorded
< 58 58 -75 >75
n % n % n %
Shetland 36 28.8% 64 51.2% 25 20.0% 125 6
Borders 177 27.4% 283 43.8% 186 28.8% 646 47
Lothian 1,158 27.3% 1,891 44.5% 1,196 28.2% 4,245 464
Greater Glasgow and Clyde
1,500 26.6% 2,273 40.3% 1,862 33.0% 5,635 652
Dumfries and Galloway 233 25.7% 416 46.0% 256 28.3% 905 45
Highland 436 24.8% 772 44.0% 548 31.2% 1,756 239
Ayrshire and Arran 489 24.3% 830 41.3% 691 34.4% 2,010 261
Fife 463 23.8% 830 42.7% 652 33.5% 1,945 159
Orkney 26 23.4% 56 50.5% 29 26.1% 111 3
Grampian 707 22.2% 1,277 40.2% 1,195 37.6% 3,179 225
Lanarkshire 798 22.2% 1,447 40.3% 1,347 37.5% 3,592 551
Forth Valley 353 21.9% 652 40.5% 605 37.6% 1,610 207
Western Isles 39 21.5% 89 49.2% 53 29.3% 181 13
Tayside 420 21.5% 729 37.3% 803 41.1% 1,952 135
Scotland 6,835 24.5 11,609 41.6 9,448 33.9 27,892 3,007
Scottish Diabetes Survey 2016
43 Scottish Diabetes Survey Monitoring Group
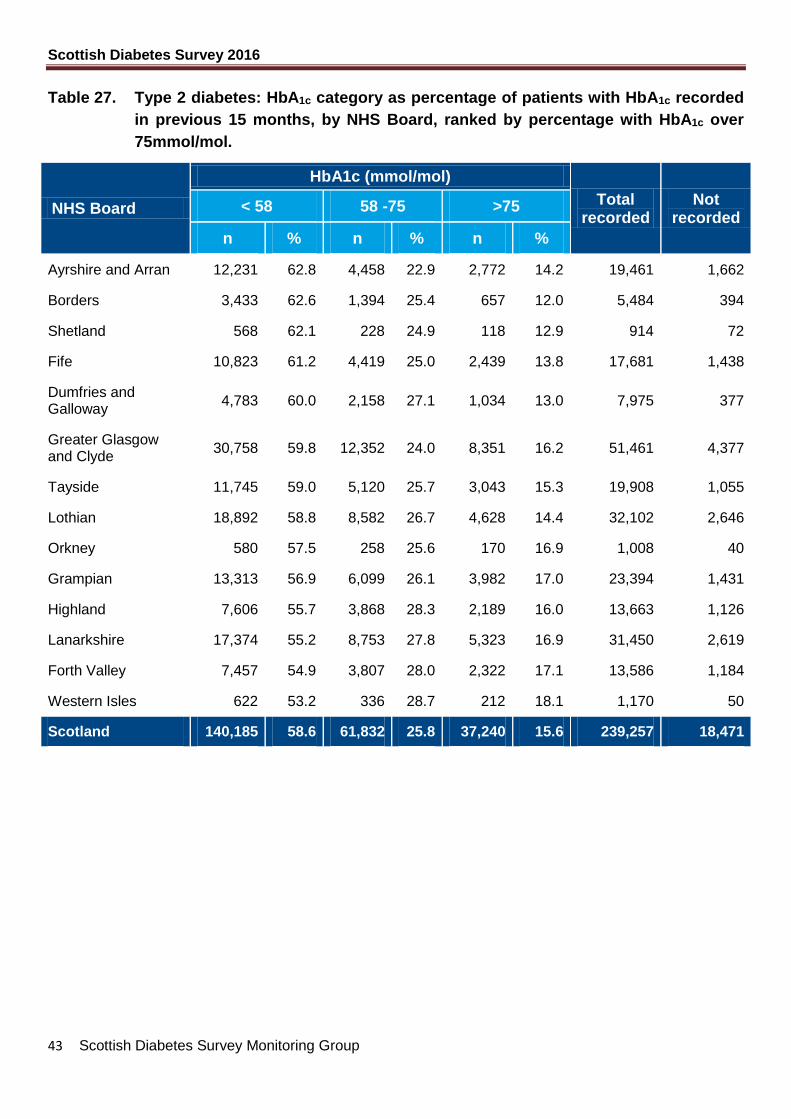
Table 27. Type 2 diabetes: HbA1c category as percentage of patients with HbA1c recorded
in previous 15 months, by NHS Board, ranked by percentage with HbA1c over
75mmol/mol.
NHS Board
HbA1c (mmol/mol)
Total recorded
Not recorded
< 58 58 -75 >75
n % n % n %
Ayrshire and Arran 12,231 62.8 4,458 22.9 2,772 14.2 19,461 1,662
Borders 3,433 62.6 1,394 25.4 657 12.0 5,484 394
Shetland 568 62.1 228 24.9 118 12.9 914 72
Fife 10,823 61.2 4,419 25.0 2,439 13.8 17,681 1,438
Dumfries and Galloway
4,783 60.0 2,158 27.1 1,034 13.0 7,975 377
Greater Glasgow and Clyde
30,758 59.8 12,352 24.0 8,351 16.2 51,461 4,377
Tayside 11,745 59.0 5,120 25.7 3,043 15.3 19,908 1,055
Lothian 18,892 58.8 8,582 26.7 4,628 14.4 32,102 2,646
Orkney 580 57.5 258 25.6 170 16.9 1,008 40
Grampian 13,313 56.9 6,099 26.1 3,982 17.0 23,394 1,431
Highland 7,606 55.7 3,868 28.3 2,189 16.0 13,663 1,126
Lanarkshire 17,374 55.2 8,753 27.8 5,323 16.9 31,450 2,619
Forth Valley 7,457 54.9 3,807 28.0 2,322 17.1 13,586 1,184
Western Isles 622 53.2 336 28.7 212 18.1 1,170 50
Scotland 140,185 58.6 61,832 25.8 37,240 15.6 239,257 18,471
Scottish Diabetes Survey 2016
44 Scottish Diabetes Survey Monitoring Group
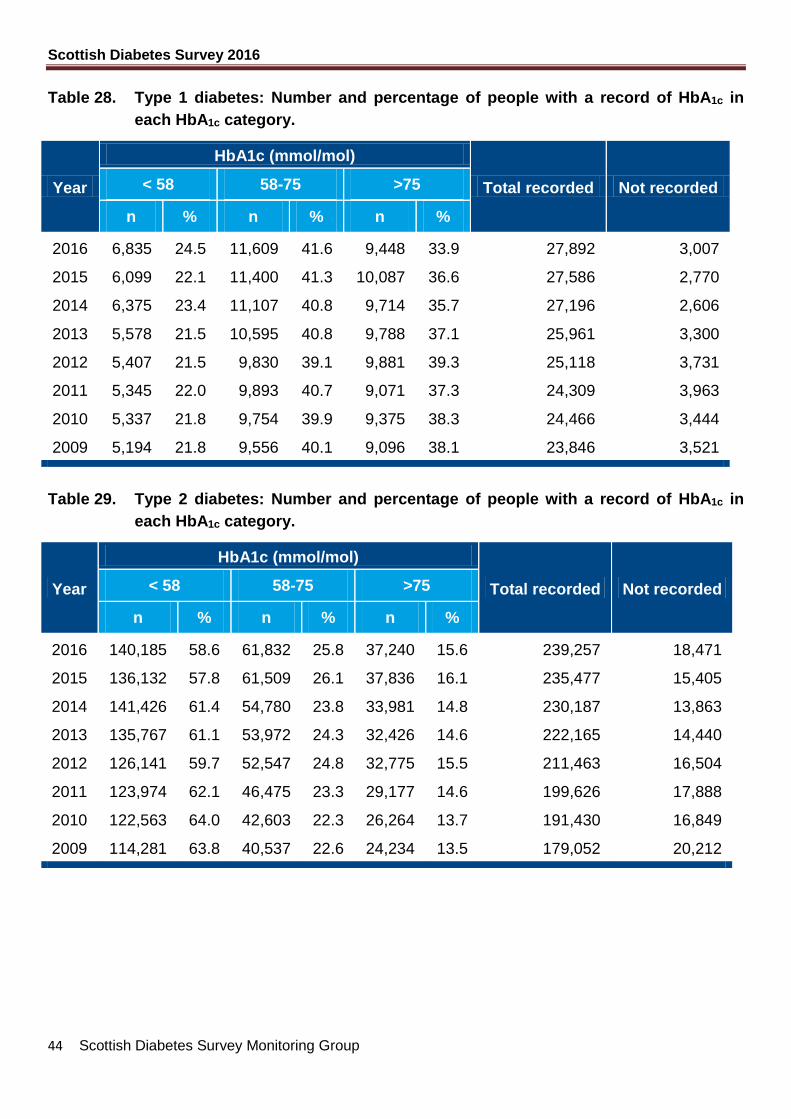
Table 28. Type 1 diabetes: Number and percentage of people with a record of HbA1c in
each HbA1c category.
Year
HbA1c (mmol/mol)
Total recorded Not recorded < 58 58-75 >75
n % n % n %
2016 6,835 24.5 11,609 41.6 9,448 33.9 27,892 3,007
2015 6,099 22.1 11,400 41.3 10,087 36.6 27,586 2,770
2014 6,375 23.4 11,107 40.8 9,714 35.7 27,196 2,606
2013 5,578 21.5 10,595 40.8 9,788 37.1 25,961 3,300
2012 5,407 21.5 9,830 39.1 9,881 39.3 25,118 3,731
2011 5,345 22.0 9,893 40.7 9,071 37.3 24,309 3,963
2010 5,337 21.8 9,754 39.9 9,375 38.3 24,466 3,444
2009 5,194 21.8 9,556 40.1 9,096 38.1 23,846 3,521
Table 29. Type 2 diabetes: Number and percentage of people with a record of HbA1c in
each HbA1c category.
Year
HbA1c (mmol/mol)
Total recorded Not recorded < 58 58-75 >75
n % n % n %
2016 140,185 58.6 61,832 25.8 37,240 15.6 239,257 18,471
2015 136,132 57.8 61,509 26.1 37,836 16.1 235,477 15,405
2014 141,426 61.4 54,780 23.8 33,981 14.8 230,187 13,863
2013 135,767 61.1 53,972 24.3 32,426 14.6 222,165 14,440
2012 126,141 59.7 52,547 24.8 32,775 15.5 211,463 16,504
2011 123,974 62.1 46,475 23.3 29,177 14.6 199,626 17,888
2010 122,563 64.0 42,603 22.3 26,264 13.7 191,430 16,849
2009 114,281 63.8 40,537 22.6 24,234 13.5 179,052 20,212
Scottish Diabetes Survey 2016
45 Scottish Diabetes Survey Monitoring Group
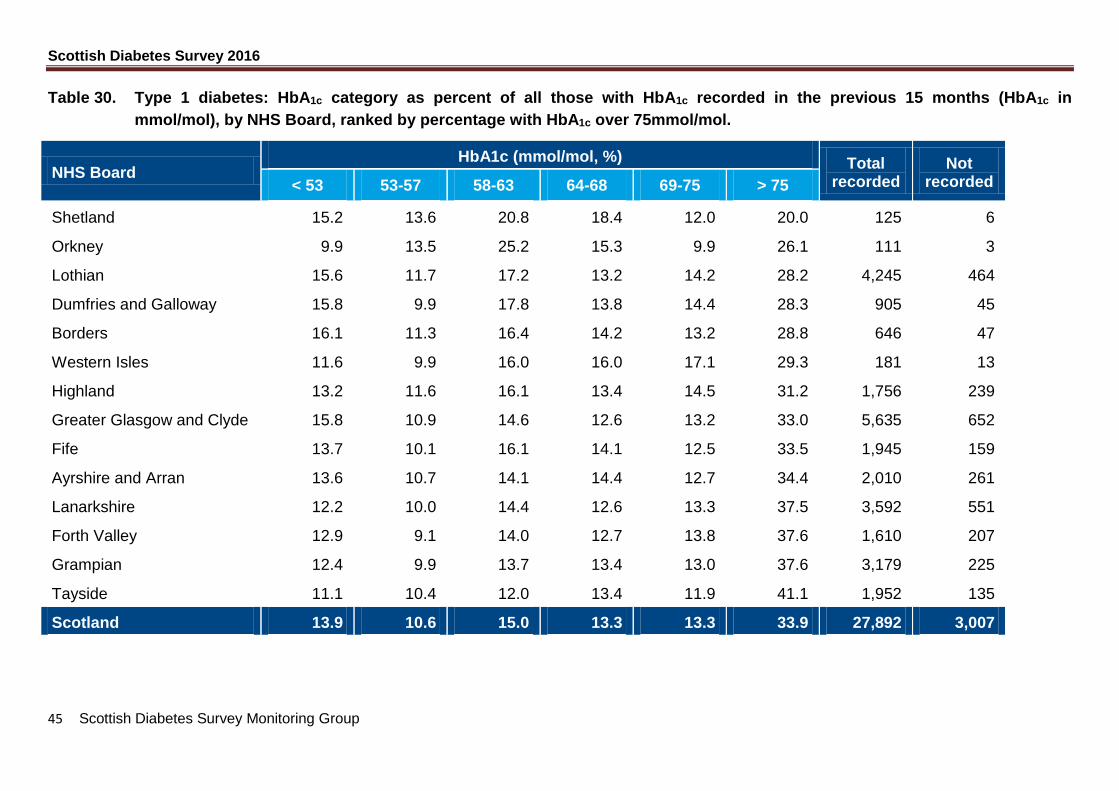
Table 30. Type 1 diabetes: HbA1c category as percent of all those with HbA1c recorded in the previous 15 months (HbA1c in
mmol/mol), by NHS Board, ranked by percentage with HbA1c over 75mmol/mol.
NHS Board HbA1c (mmol/mol, %) Total
recorded Not
recorded < 53 53-57 58-63 64-68 69-75 > 75
Shetland 15.2 13.6 20.8 18.4 12.0 20.0 125 6
Orkney 9.9 13.5 25.2 15.3 9.9 26.1 111 3
Lothian 15.6 11.7 17.2 13.2 14.2 28.2 4,245 464
Dumfries and Galloway 15.8 9.9 17.8 13.8 14.4 28.3 905 45
Borders 16.1 11.3 16.4 14.2 13.2 28.8 646 47
Western Isles 11.6 9.9 16.0 16.0 17.1 29.3 181 13
Highland 13.2 11.6 16.1 13.4 14.5 31.2 1,756 239
Greater Glasgow and Clyde 15.8 10.9 14.6 12.6 13.2 33.0 5,635 652
Fife 13.7 10.1 16.1 14.1 12.5 33.5 1,945 159
Ayrshire and Arran 13.6 10.7 14.1 14.4 12.7 34.4 2,010 261
Lanarkshire 12.2 10.0 14.4 12.6 13.3 37.5 3,592 551
Forth Valley 12.9 9.1 14.0 12.7 13.8 37.6 1,610 207
Grampian 12.4 9.9 13.7 13.4 13.0 37.6 3,179 225
Tayside 11.1 10.4 12.0 13.4 11.9 41.1 1,952 135
Scotland 13.9 10.6 15.0 13.3 13.3 33.9 27,892 3,007
Scottish Diabetes Survey 2016
46 Scottish Diabetes Survey Monitoring Group
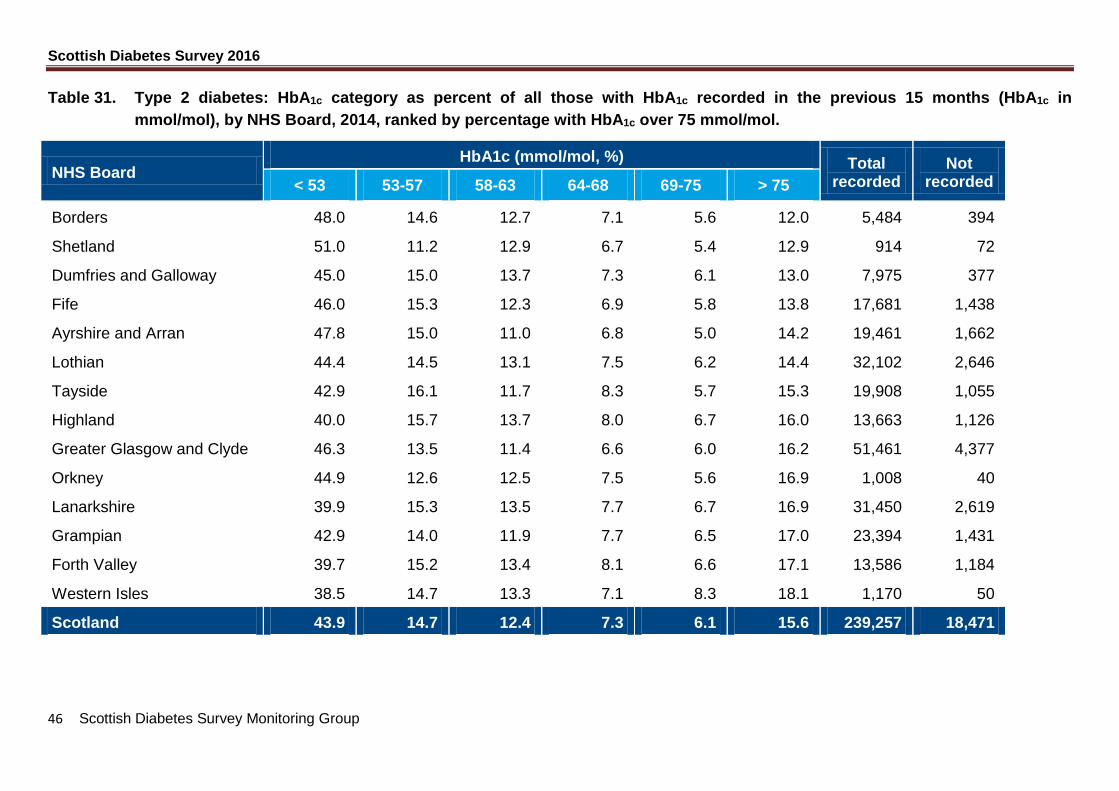
Table 31. Type 2 diabetes: HbA1c category as percent of all those with HbA1c recorded in the previous 15 months (HbA1c in
mmol/mol), by NHS Board, 2014, ranked by percentage with HbA1c over 75 mmol/mol.
NHS Board HbA1c (mmol/mol, %) Total
recorded Not
recorded < 53 53-57 58-63 64-68 69-75 > 75
Borders 48.0 14.6 12.7 7.1 5.6 12.0 5,484 394
Shetland 51.0 11.2 12.9 6.7 5.4 12.9 914 72
Dumfries and Galloway 45.0 15.0 13.7 7.3 6.1 13.0 7,975 377
Fife 46.0 15.3 12.3 6.9 5.8 13.8 17,681 1,438
Ayrshire and Arran 47.8 15.0 11.0 6.8 5.0 14.2 19,461 1,662
Lothian 44.4 14.5 13.1 7.5 6.2 14.4 32,102 2,646
Tayside 42.9 16.1 11.7 8.3 5.7 15.3 19,908 1,055
Highland 40.0 15.7 13.7 8.0 6.7 16.0 13,663 1,126
Greater Glasgow and Clyde 46.3 13.5 11.4 6.6 6.0 16.2 51,461 4,377
Orkney 44.9 12.6 12.5 7.5 5.6 16.9 1,008 40
Lanarkshire 39.9 15.3 13.5 7.7 6.7 16.9 31,450 2,619
Grampian 42.9 14.0 11.9 7.7 6.5 17.0 23,394 1,431
Forth Valley 39.7 15.2 13.4 8.1 6.6 17.1 13,586 1,184
Western Isles 38.5 14.7 13.3 7.1 8.3 18.1 1,170 50
Scotland 43.9 14.7 12.4 7.3 6.1 15.6 239,257 18,471
Scottish Diabetes Survey 2016
47 Scottish Diabetes Survey Monitoring Group
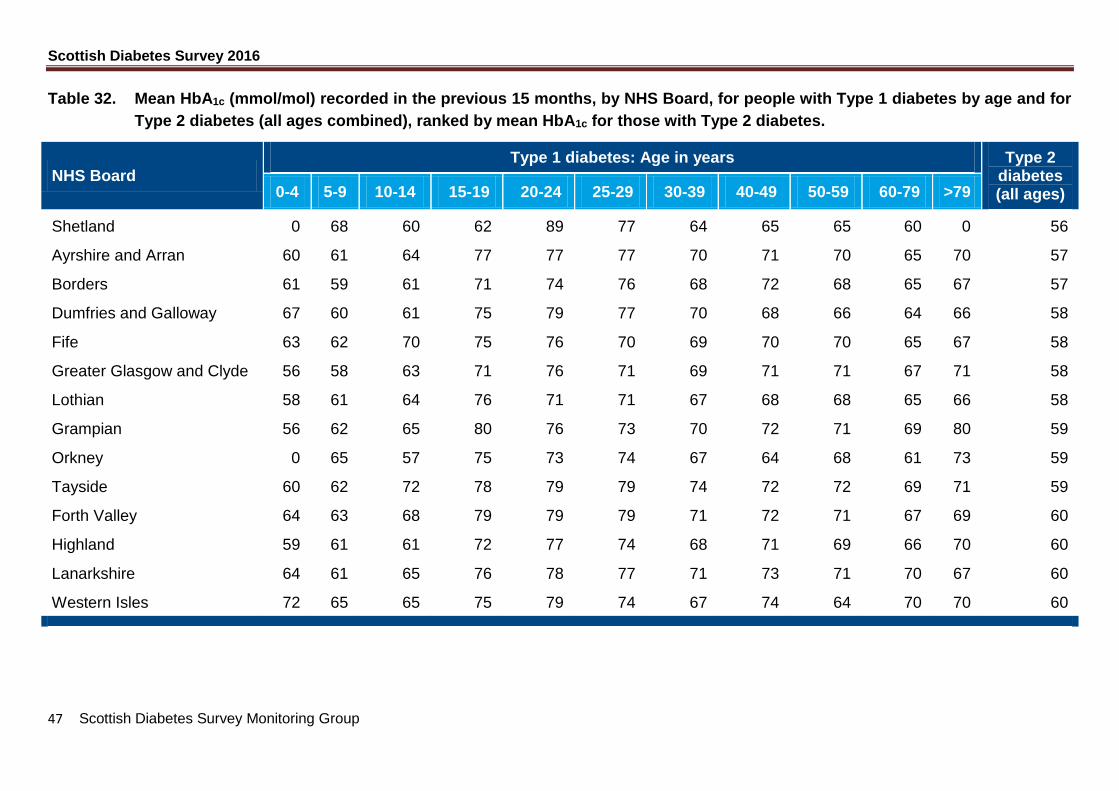
Table 32. Mean HbA1c (mmol/mol) recorded in the previous 15 months, by NHS Board, for people with Type 1 diabetes by age and for
Type 2 diabetes (all ages combined), ranked by mean HbA1c for those with Type 2 diabetes.
NHS Board Type 1 diabetes: Age in years Type 2
diabetes (all ages) 0-4 5-9 10-14 15-19 20-24 25-29 30-39 40-49 50-59 60-79 >79
Shetland 0 68 60 62 89 77 64 65 65 60 0 56
Ayrshire and Arran 60 61 64 77 77 77 70 71 70 65 70 57
Borders 61 59 61 71 74 76 68 72 68 65 67 57
Dumfries and Galloway 67 60 61 75 79 77 70 68 66 64 66 58
Fife 63 62 70 75 76 70 69 70 70 65 67 58
Greater Glasgow and Clyde 56 58 63 71 76 71 69 71 71 67 71 58
Lothian 58 61 64 76 71 71 67 68 68 65 66 58
Grampian 56 62 65 80 76 73 70 72 71 69 80 59
Orkney 0 65 57 75 73 74 67 64 68 61 73 59
Tayside 60 62 72 78 79 79 74 72 72 69 71 59
Forth Valley 64 63 68 79 79 79 71 72 71 67 69 60
Highland 59 61 61 72 77 74 68 71 69 66 70 60
Lanarkshire 64 61 65 76 78 77 71 73 71 70 67 60
Western Isles 72 65 65 75 79 74 67 74 64 70 70 60
Scottish Diabetes Survey 2016
48 Scottish Diabetes Survey Monitoring Group
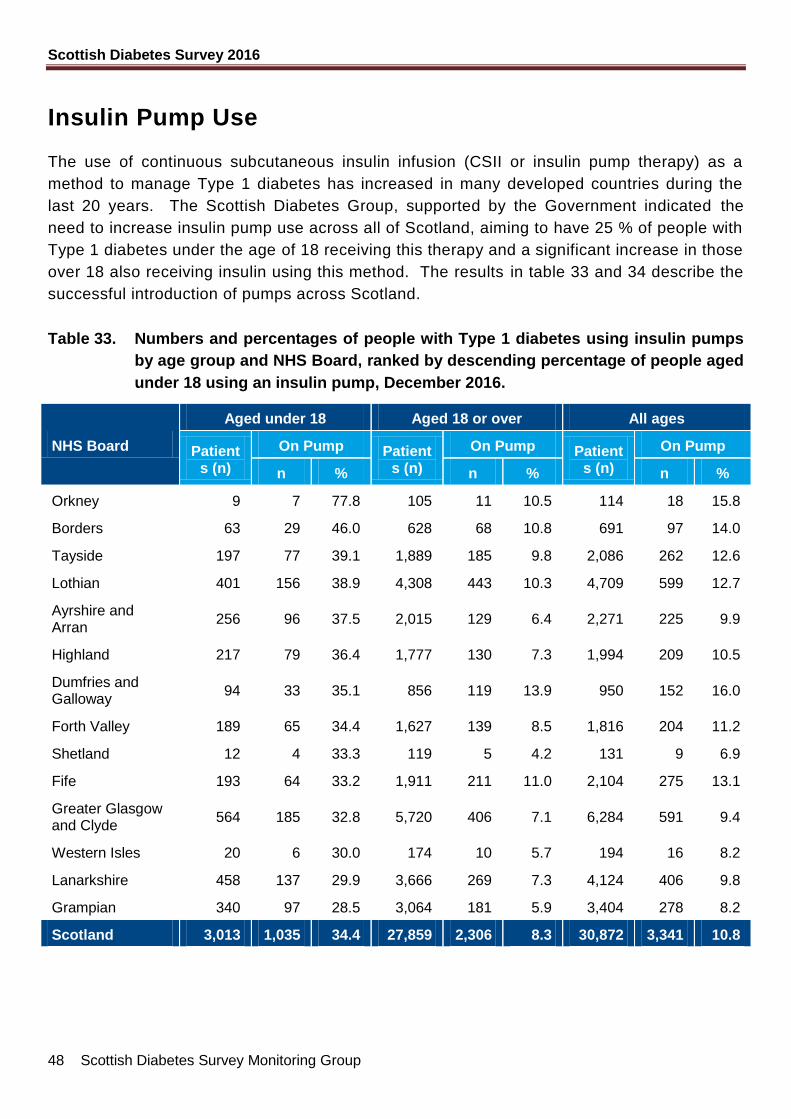
Insulin Pump Use
The use of continuous subcutaneous insulin infusion (CSII or insulin pump therapy) as a
method to manage Type 1 diabetes has increased in many developed countries during the
last 20 years. The Scottish Diabetes Group, supported by the Government indicated the
need to increase insulin pump use across all of Scotland, aiming to have 25 % of people with
Type 1 diabetes under the age of 18 receiving this therapy and a significant increase in those
over 18 also receiving insulin using this method. The results in table 33 and 34 describe the
successful introduction of pumps across Scotland.
Table 33. Numbers and percentages of people with Type 1 diabetes using insulin pumps
by age group and NHS Board, ranked by descending percentage of people aged
under 18 using an insulin pump, December 2016.
NHS Board
Aged under 18 Aged 18 or over All ages
Patients (n)
On Pump Patients (n)
On Pump Patients (n)
On Pump
n % n % n %
Orkney 9 7 77.8 105 11 10.5 114 18 15.8
Borders 63 29 46.0 628 68 10.8 691 97 14.0
Tayside 197 77 39.1 1,889 185 9.8 2,086 262 12.6
Lothian 401 156 38.9 4,308 443 10.3 4,709 599 12.7
Ayrshire and Arran
256 96 37.5 2,015 129 6.4 2,271 225 9.9
Highland 217 79 36.4 1,777 130 7.3 1,994 209 10.5
Dumfries and Galloway
94 33 35.1 856 119 13.9 950 152 16.0
Forth Valley 189 65 34.4 1,627 139 8.5 1,816 204 11.2
Shetland 12 4 33.3 119 5 4.2 131 9 6.9
Fife 193 64 33.2 1,911 211 11.0 2,104 275 13.1
Greater Glasgow and Clyde
564 185 32.8 5,720 406 7.1 6,284 591 9.4
Western Isles 20 6 30.0 174 10 5.7 194 16 8.2
Lanarkshire 458 137 29.9 3,666 269 7.3 4,124 406 9.8
Grampian 340 97 28.5 3,064 181 5.9 3,404 278 8.2
Scotland 3,013 1,035 34.4 27,859 2,306 8.3 30,872 3,341 10.8

Scottish Diabetes Survey 2016
49 Scottish Diabetes Survey Monitoring Group
Table 34. Numbers and percentages of people with Type 1 diabetes using insulin pumps
by age group
Year
Aged under 18 Aged 18 or over All ages
Patients (n) On Pump
Patients (n) On Pump
Patients (n) On Pump
n % n % n %
2016 3013 1035 34.4 27859 2306 8.3 30872 3341 10.8
2015 2950 919 31.2 27379 1948 7.1 30329 2867 9.5
2014 2953 849 28.8 26748 1632 6.1 29701 2481 8.4
2013 2917 659 22.6 26394 1188 4.5 29311 1847 6.3
Scottish Diabetes Survey 2016
50 Scottish Diabetes Survey Monitoring Group
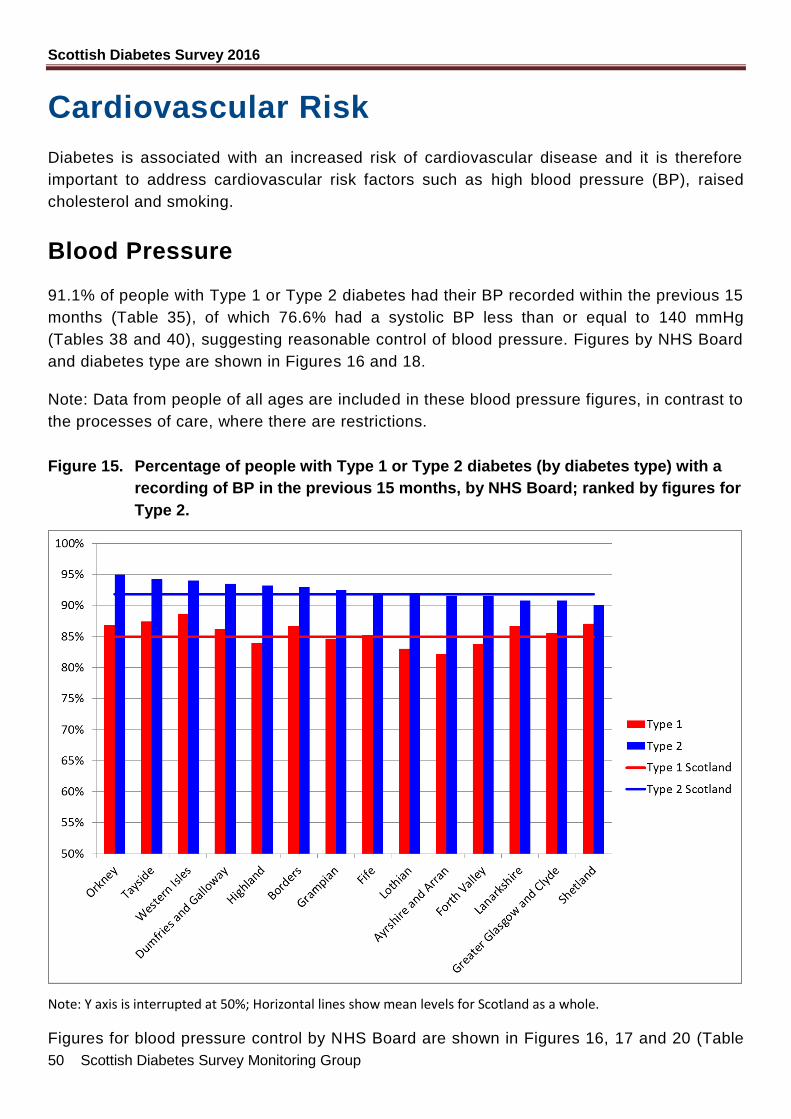
Cardiovascular Risk
Diabetes is associated with an increased risk of cardiovascular disease and it is therefore
important to address cardiovascular risk factors such as high blood pressure (BP), raised
cholesterol and smoking.
Blood Pressure
91.1% of people with Type 1 or Type 2 diabetes had their BP recorded within the previous 15
months (Table 35), of which 76.6% had a systolic BP less than or equal to 140 mmHg
(Tables 38 and 40), suggesting reasonable control of blood pressure. Figures by NHS Board
and diabetes type are shown in Figures 16 and 18.
Note: Data from people of all ages are included in these blood pressure figures, in contrast to
the processes of care, where there are restrictions.
Figure 15. Percentage of people with Type 1 or Type 2 diabetes (by diabetes type) with a
recording of BP in the previous 15 months, by NHS Board; ranked by figures for
Type 2.
Note: Y axis is interrupted at 50%; Horizontal lines show mean levels for Scotland as a whole.
Figures for blood pressure control by NHS Board are shown in Figures 16, 17 and 20 (Table
Scottish Diabetes Survey 2016
51 Scottish Diabetes Survey Monitoring Group
38 and Table 39) for Type 1 diabetes and in Figures 18, 19 and 21 (Table 40 and Table 41)
for Type 2 diabetes.
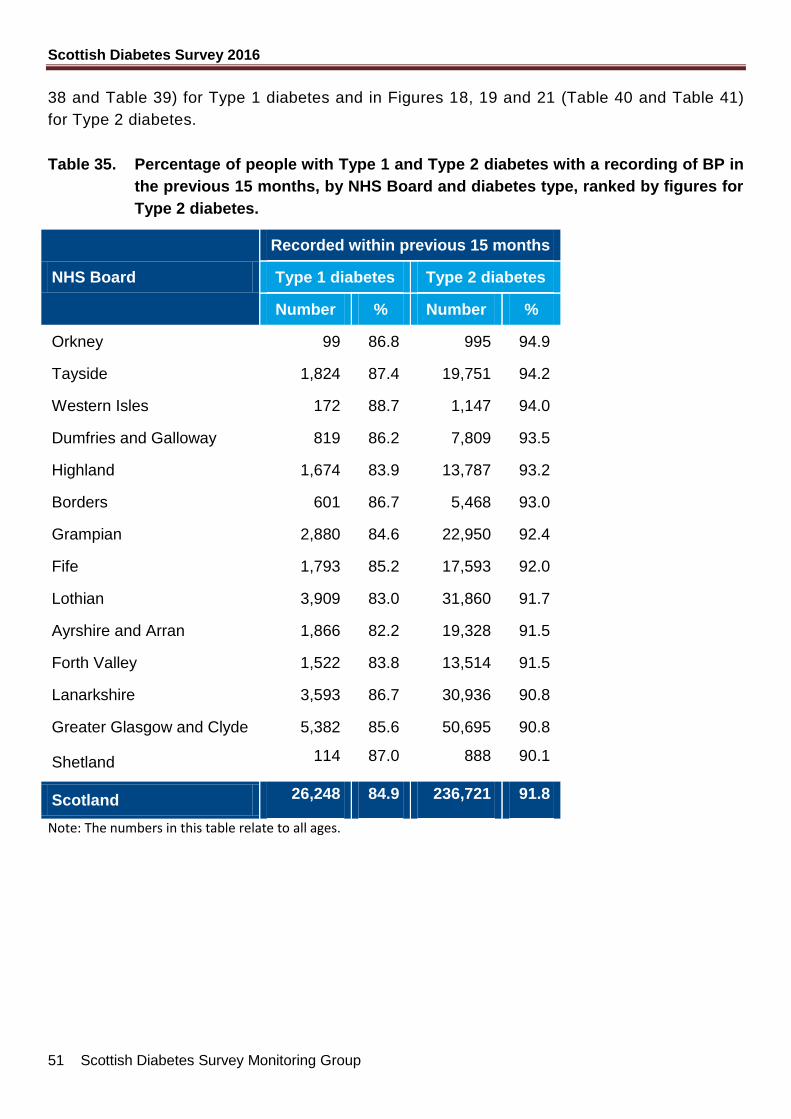
Table 35. Percentage of people with Type 1 and Type 2 diabetes with a recording of BP in
the previous 15 months, by NHS Board and diabetes type, ranked by figures for
Type 2 diabetes.
NHS Board
Recorded within previous 15 months
Type 1 diabetes Type 2 diabetes
Number % Number %
Orkney 99 86.8 995 94.9
Tayside 1,824 87.4 19,751 94.2
Western Isles 172 88.7 1,147 94.0
Dumfries and Galloway 819 86.2 7,809 93.5
Highland 1,674 83.9 13,787 93.2
Borders 601 86.7 5,468 93.0
Grampian 2,880 84.6 22,950 92.4
Fife 1,793 85.2 17,593 92.0
Lothian 3,909 83.0 31,860 91.7
Ayrshire and Arran 1,866 82.2 19,328 91.5
Forth Valley 1,522 83.8 13,514 91.5
Lanarkshire 3,593 86.7 30,936 90.8
Greater Glasgow and Clyde 5,382 85.6 50,695 90.8
Shetland 114 87.0 888 90.1
Scotland 26,248 84.9 236,721 91.8
Note: The numbers in this table relate to all ages.
Scottish Diabetes Survey 2016
52 Scottish Diabetes Survey Monitoring Group
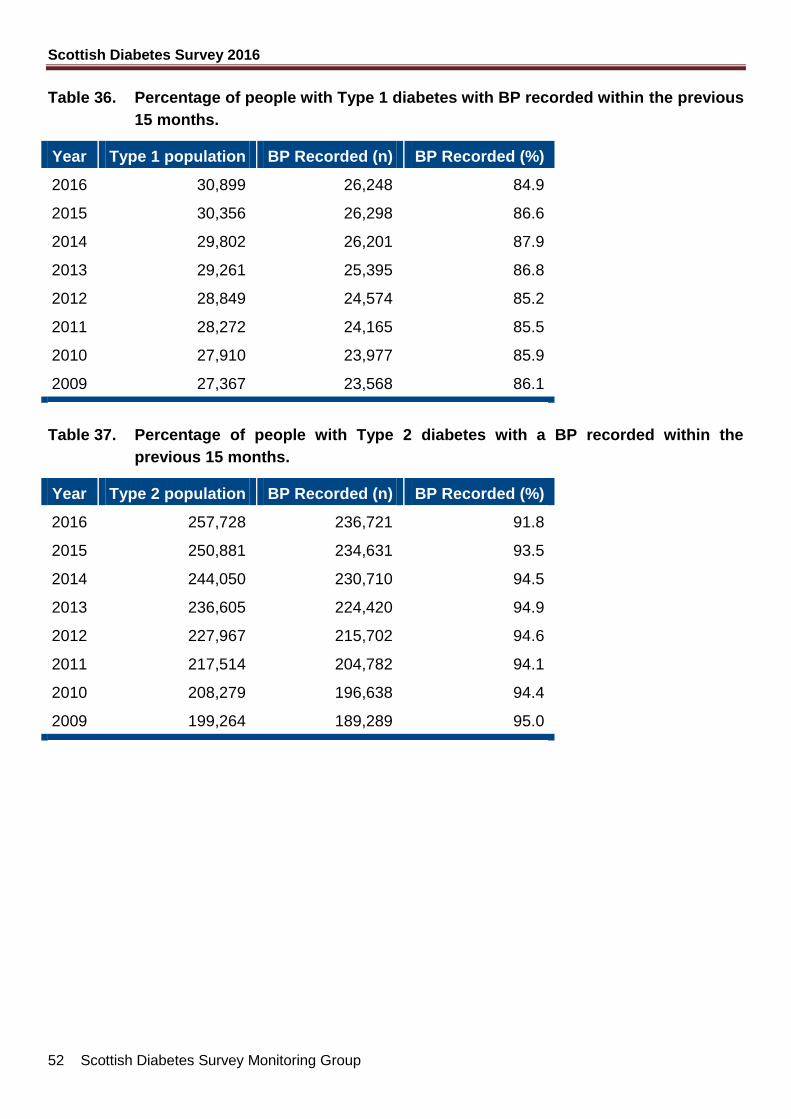
Table 36. Percentage of people with Type 1 diabetes with BP recorded within the previous
15 months.
Year Type 1 population BP Recorded (n) BP Recorded (%)
2016 30,899 26,248 84.9
2015 30,356 26,298 86.6
2014 29,802 26,201 87.9
2013 29,261 25,395 86.8
2012 28,849 24,574 85.2
2011 28,272 24,165 85.5
2010 27,910 23,977 85.9
2009 27,367 23,568 86.1
Table 37. Percentage of people with Type 2 diabetes with a BP recorded within the
previous 15 months.
Year Type 2 population BP Recorded (n) BP Recorded (%)
2016 257,728 236,721 91.8
2015 250,881 234,631 93.5
2014 244,050 230,710 94.5
2013 236,605 224,420 94.9
2012 227,967 215,702 94.6
2011 217,514 204,782 94.1
2010 208,279 196,638 94.4
2009 199,264 189,289 95.0
Scottish Diabetes Survey 2016
53 Scottish Diabetes Survey Monitoring Group
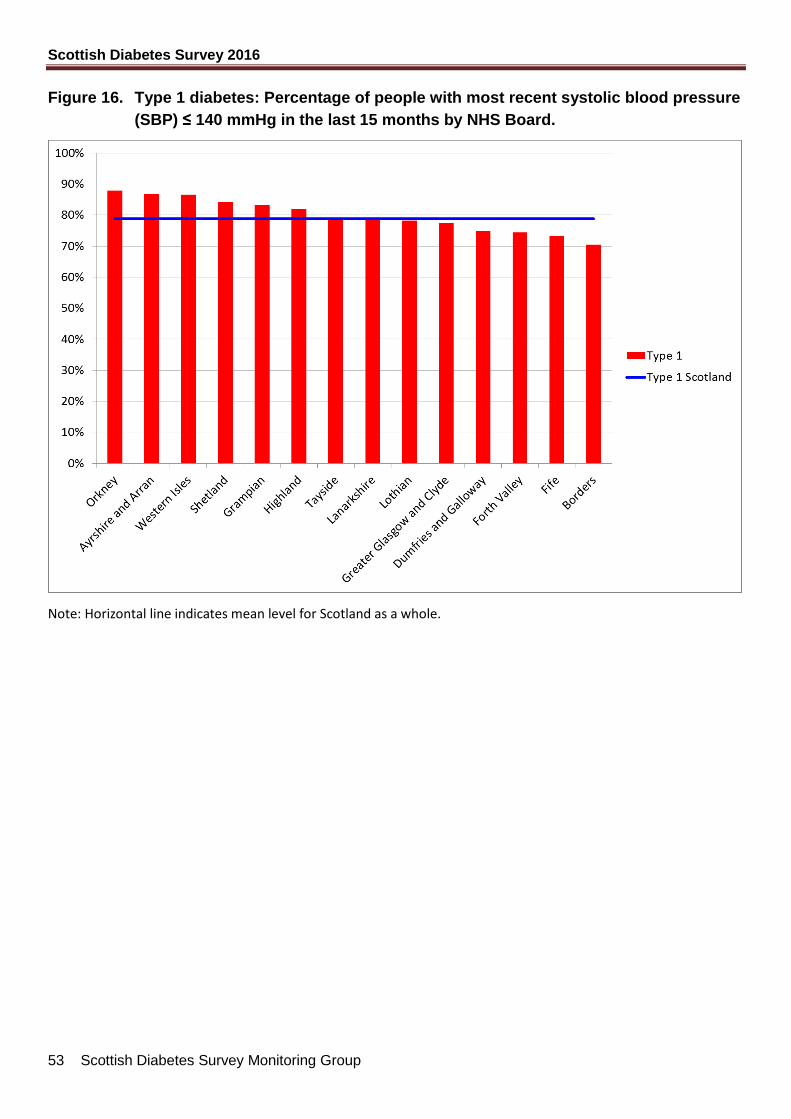
Figure 16. Type 1 diabetes: Percentage of people with most recent systolic blood pressure
(SBP) ≤ 140 mmHg in the last 15 months by NHS Board.
Note: Horizontal line indicates mean level for Scotland as a whole.
Scottish Diabetes Survey 2016
54 Scottish Diabetes Survey Monitoring Group
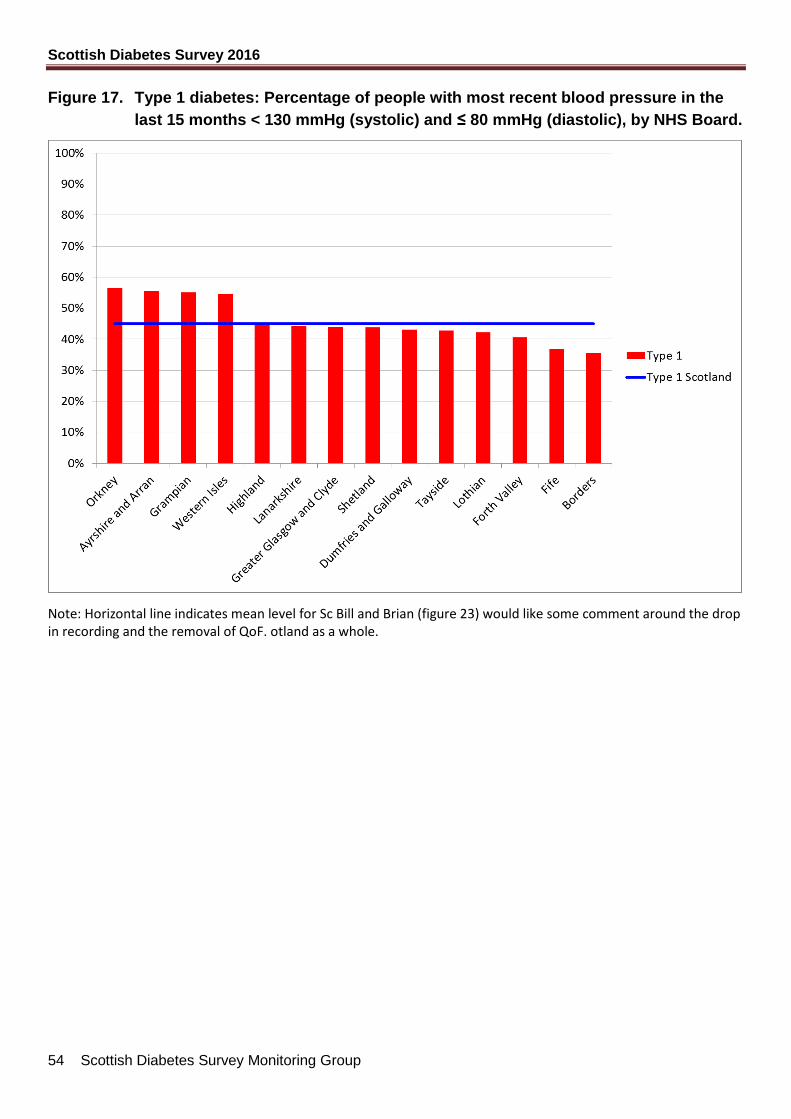
Figure 17. Type 1 diabetes: Percentage of people with most recent blood pressure in the
last 15 months < 130 mmHg (systolic) and ≤ 80 mmHg (diastolic), by NHS Board.
Note: Horizontal line indicates mean level for Sc Bill and Brian (figure 23) would like some comment around the drop in recording and the removal of QoF. otland as a whole.
Scottish Diabetes Survey 2016
55 Scottish Diabetes Survey Monitoring Group
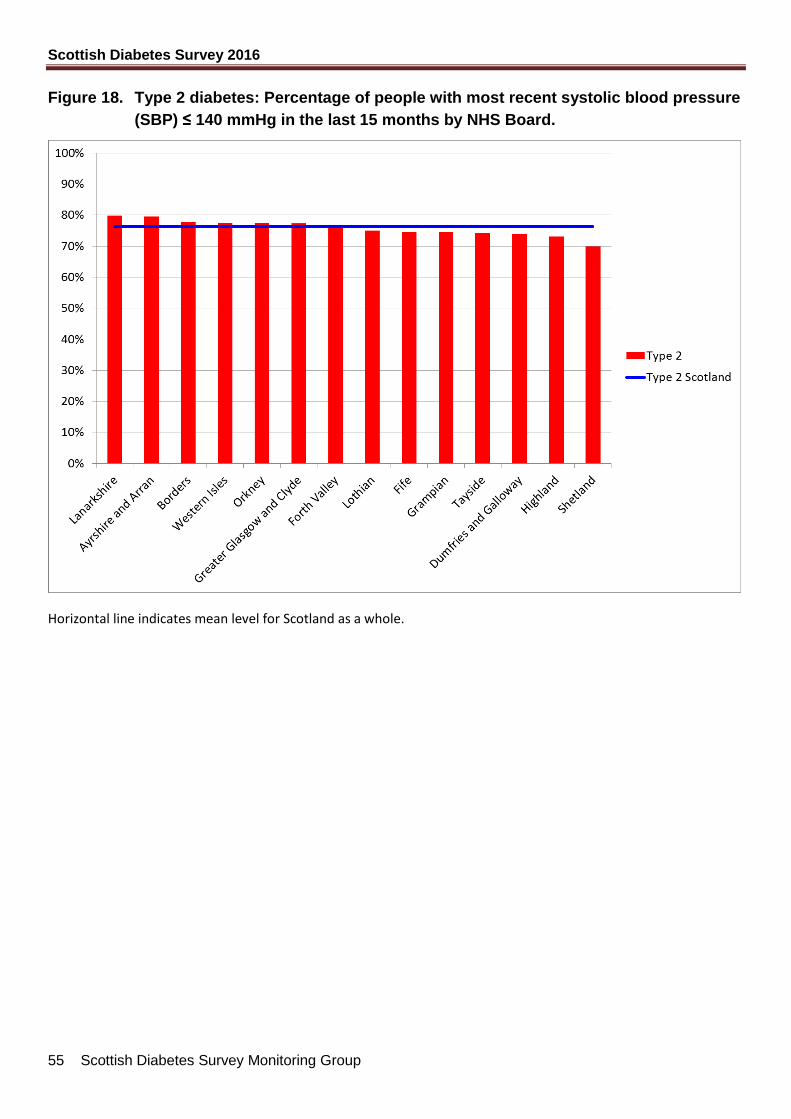
Figure 18. Type 2 diabetes: Percentage of people with most recent systolic blood pressure
(SBP) ≤ 140 mmHg in the last 15 months by NHS Board.
Horizontal line indicates mean level for Scotland as a whole.
Scottish Diabetes Survey 2016
56 Scottish Diabetes Survey Monitoring Group
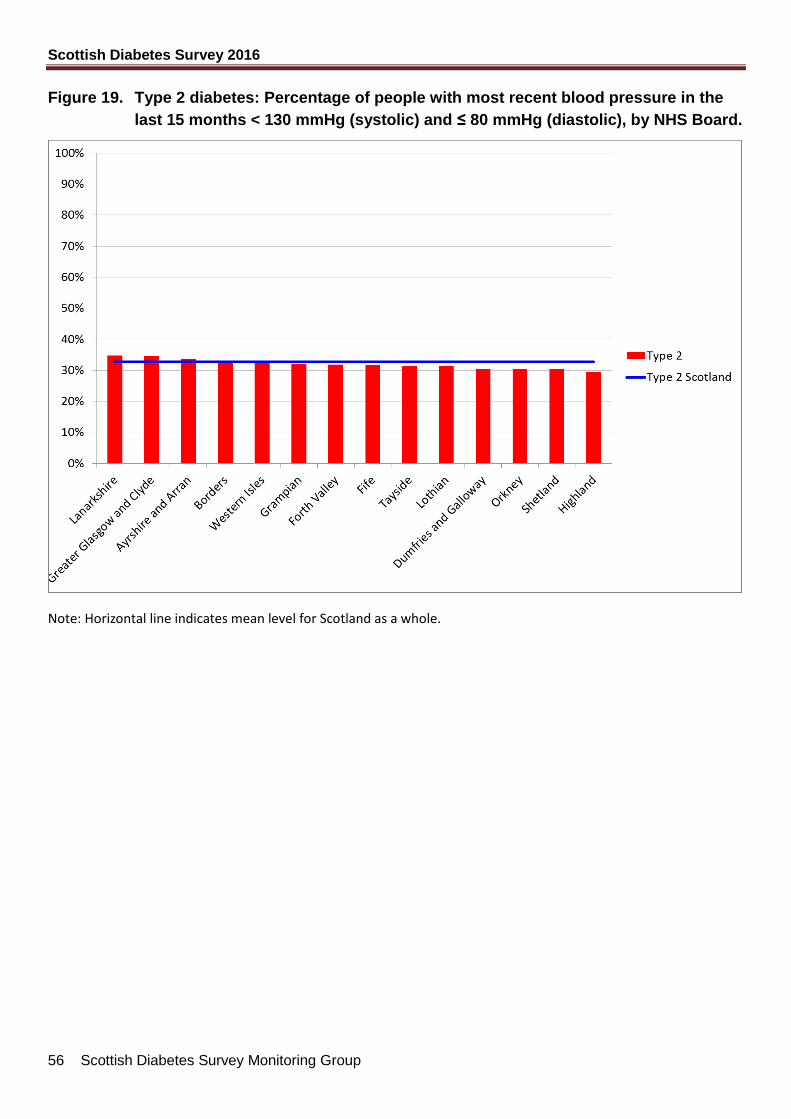
Figure 19. Type 2 diabetes: Percentage of people with most recent blood pressure in the
last 15 months < 130 mmHg (systolic) and ≤ 80 mmHg (diastolic), by NHS Board.
Note: Horizontal line indicates mean level for Scotland as a whole.
Scottish Diabetes Survey 2016
57 Scottish Diabetes Survey Monitoring Group
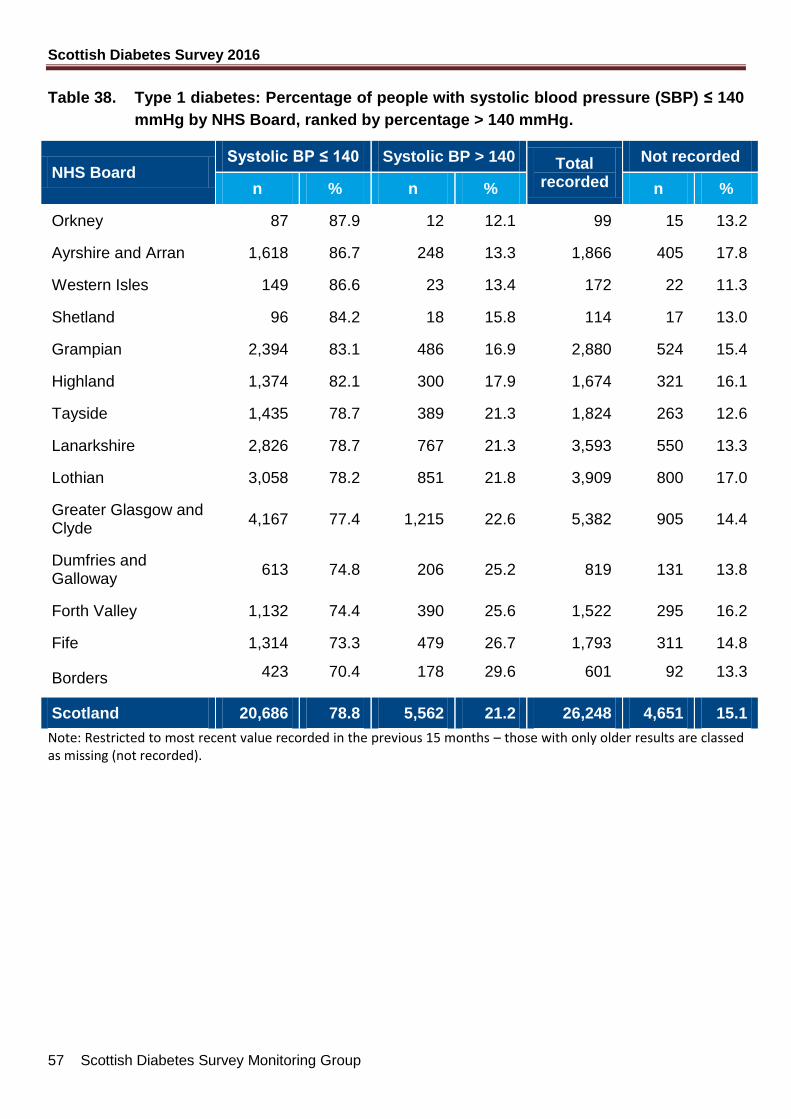
Table 38. Type 1 diabetes: Percentage of people with systolic blood pressure (SBP) ≤ 140
mmHg by NHS Board, ranked by percentage > 140 mmHg.
NHS Board Systolic BP ≤ 140 Systolic BP > 140 Total
recorded
Not recorded
n % n % n %
Orkney 87 87.9 12 12.1 99 15 13.2
Ayrshire and Arran 1,618 86.7 248 13.3 1,866 405 17.8
Western Isles 149 86.6 23 13.4 172 22 11.3
Shetland 96 84.2 18 15.8 114 17 13.0
Grampian 2,394 83.1 486 16.9 2,880 524 15.4
Highland 1,374 82.1 300 17.9 1,674 321 16.1
Tayside 1,435 78.7 389 21.3 1,824 263 12.6
Lanarkshire 2,826 78.7 767 21.3 3,593 550 13.3
Lothian 3,058 78.2 851 21.8 3,909 800 17.0
Greater Glasgow and Clyde
4,167 77.4 1,215 22.6 5,382 905 14.4
Dumfries and Galloway
613 74.8 206 25.2 819 131 13.8
Forth Valley 1,132 74.4 390 25.6 1,522 295 16.2
Fife 1,314 73.3 479 26.7 1,793 311 14.8
Borders 423 70.4 178 29.6 601 92 13.3
Scotland 20,686 78.8 5,562 21.2 26,248 4,651 15.1
Note: Restricted to most recent value recorded in the previous 15 months – those with only older results are classed as missing (not recorded).
Scottish Diabetes Survey 2016
58 Scottish Diabetes Survey Monitoring Group
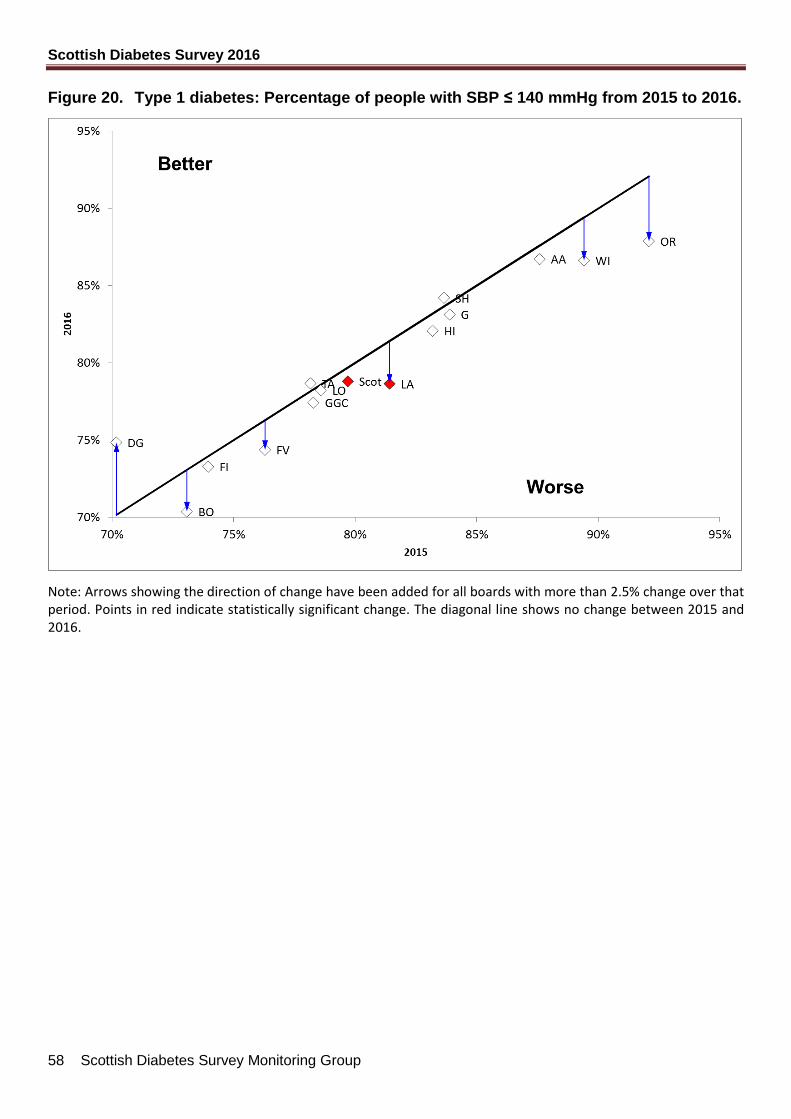
Figure 20. Type 1 diabetes: Percentage of people with SBP ≤ 140 mmHg from 2015 to 2016.
Note: Arrows showing the direction of change have been added for all boards with more than 2.5% change over that period. Points in red indicate statistically significant change. The diagonal line shows no change between 2015 and 2016.
Scottish Diabetes Survey 2016
59 Scottish Diabetes Survey Monitoring Group
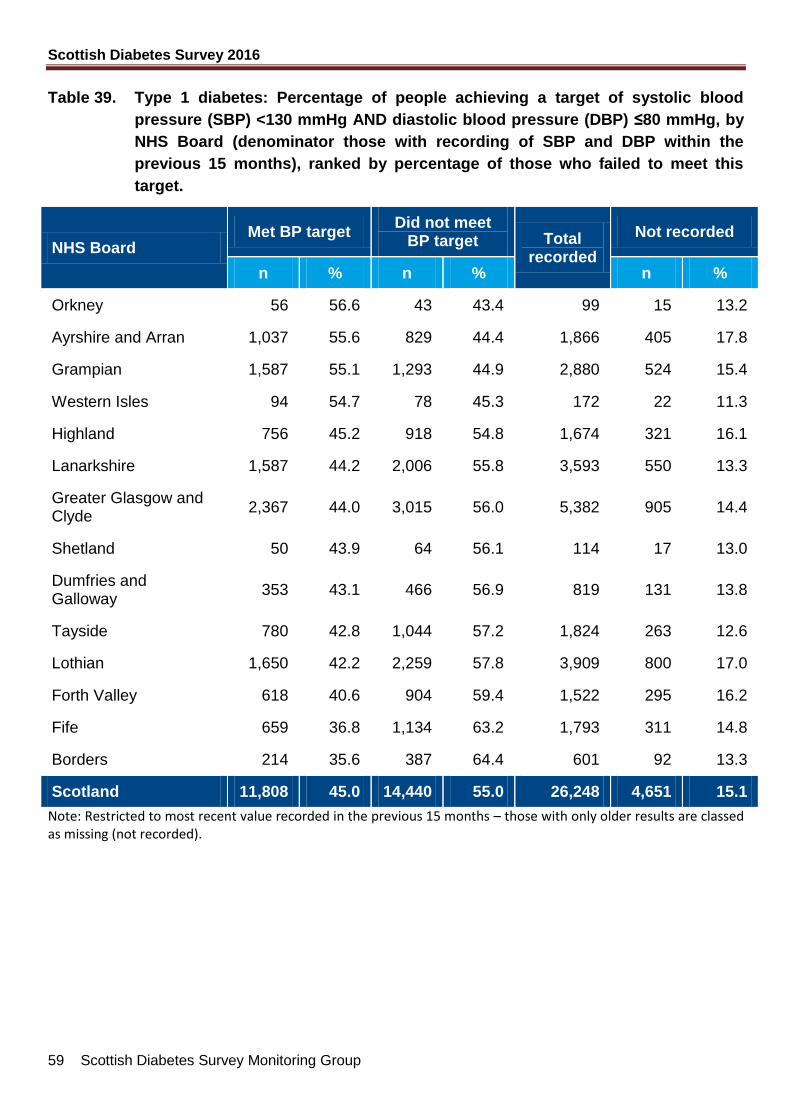
Table 39. Type 1 diabetes: Percentage of people achieving a target of systolic blood
pressure (SBP) <130 mmHg AND diastolic blood pressure (DBP) ≤80 mmHg, by
NHS Board (denominator those with recording of SBP and DBP within the
previous 15 months), ranked by percentage of those who failed to meet this
target.
NHS Board Met BP target
Did not meet BP target Total
recorded
Not recorded
n % n % n %
Orkney 56 56.6 43 43.4 99 15 13.2
Ayrshire and Arran 1,037 55.6 829 44.4 1,866 405 17.8
Grampian 1,587 55.1 1,293 44.9 2,880 524 15.4
Western Isles 94 54.7 78 45.3 172 22 11.3
Highland 756 45.2 918 54.8 1,674 321 16.1
Lanarkshire 1,587 44.2 2,006 55.8 3,593 550 13.3
Greater Glasgow and Clyde
2,367 44.0 3,015 56.0 5,382 905 14.4
Shetland 50 43.9 64 56.1 114 17 13.0
Dumfries and Galloway
353 43.1 466 56.9 819 131 13.8
Tayside 780 42.8 1,044 57.2 1,824 263 12.6
Lothian 1,650 42.2 2,259 57.8 3,909 800 17.0
Forth Valley 618 40.6 904 59.4 1,522 295 16.2
Fife 659 36.8 1,134 63.2 1,793 311 14.8
Borders 214 35.6 387 64.4 601 92 13.3
Scotland 11,808 45.0 14,440 55.0 26,248 4,651 15.1
Note: Restricted to most recent value recorded in the previous 15 months – those with only older results are classed as missing (not recorded).
Scottish Diabetes Survey 2016
60 Scottish Diabetes Survey Monitoring Group
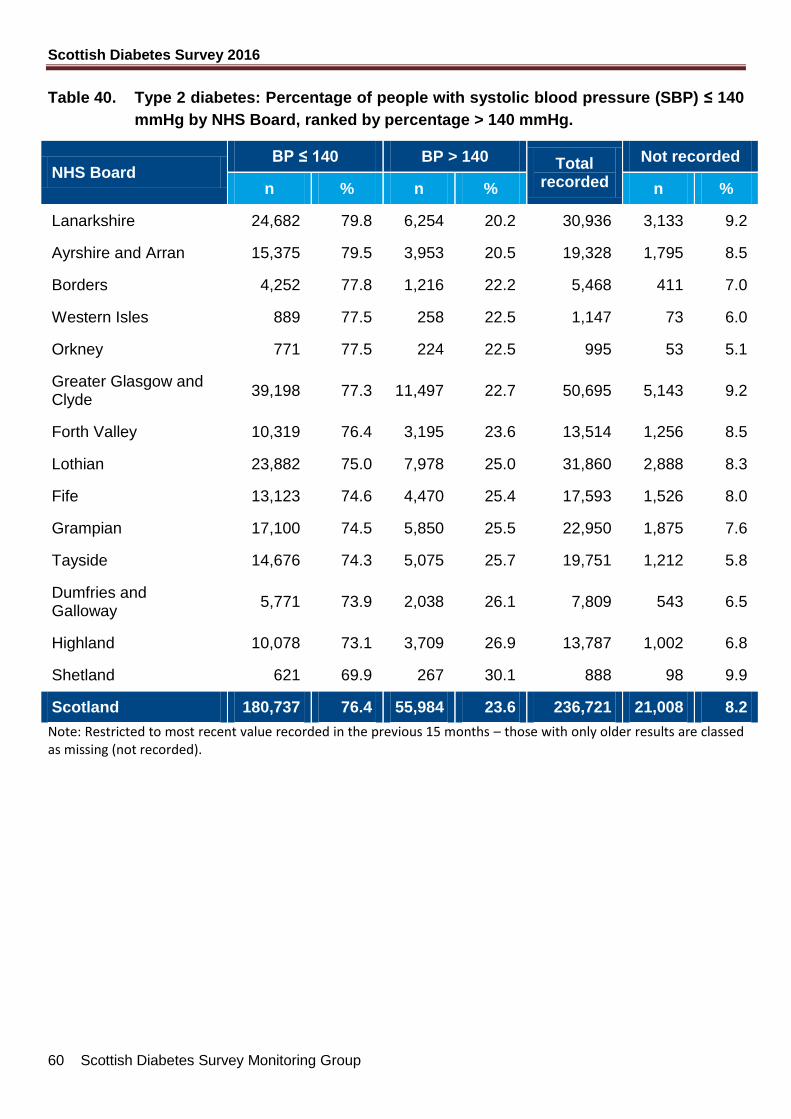
Table 40. Type 2 diabetes: Percentage of people with systolic blood pressure (SBP) ≤ 140
mmHg by NHS Board, ranked by percentage > 140 mmHg.
NHS Board BP ≤ 140 BP > 140 Total
recorded
Not recorded
n % n % n %
Lanarkshire 24,682 79.8 6,254 20.2 30,936 3,133 9.2
Ayrshire and Arran 15,375 79.5 3,953 20.5 19,328 1,795 8.5
Borders 4,252 77.8 1,216 22.2 5,468 411 7.0
Western Isles 889 77.5 258 22.5 1,147 73 6.0
Orkney 771 77.5 224 22.5 995 53 5.1
Greater Glasgow and Clyde
39,198 77.3 11,497 22.7 50,695 5,143 9.2
Forth Valley 10,319 76.4 3,195 23.6 13,514 1,256 8.5
Lothian 23,882 75.0 7,978 25.0 31,860 2,888 8.3
Fife 13,123 74.6 4,470 25.4 17,593 1,526 8.0
Grampian 17,100 74.5 5,850 25.5 22,950 1,875 7.6
Tayside 14,676 74.3 5,075 25.7 19,751 1,212 5.8
Dumfries and Galloway
5,771 73.9 2,038 26.1 7,809 543 6.5
Highland 10,078 73.1 3,709 26.9 13,787 1,002 6.8
Shetland 621 69.9 267 30.1 888 98 9.9
Scotland 180,737 76.4 55,984 23.6 236,721 21,008 8.2
Note: Restricted to most recent value recorded in the previous 15 months – those with only older results are classed as missing (not recorded).
Scottish Diabetes Survey 2016
61 Scottish Diabetes Survey Monitoring Group
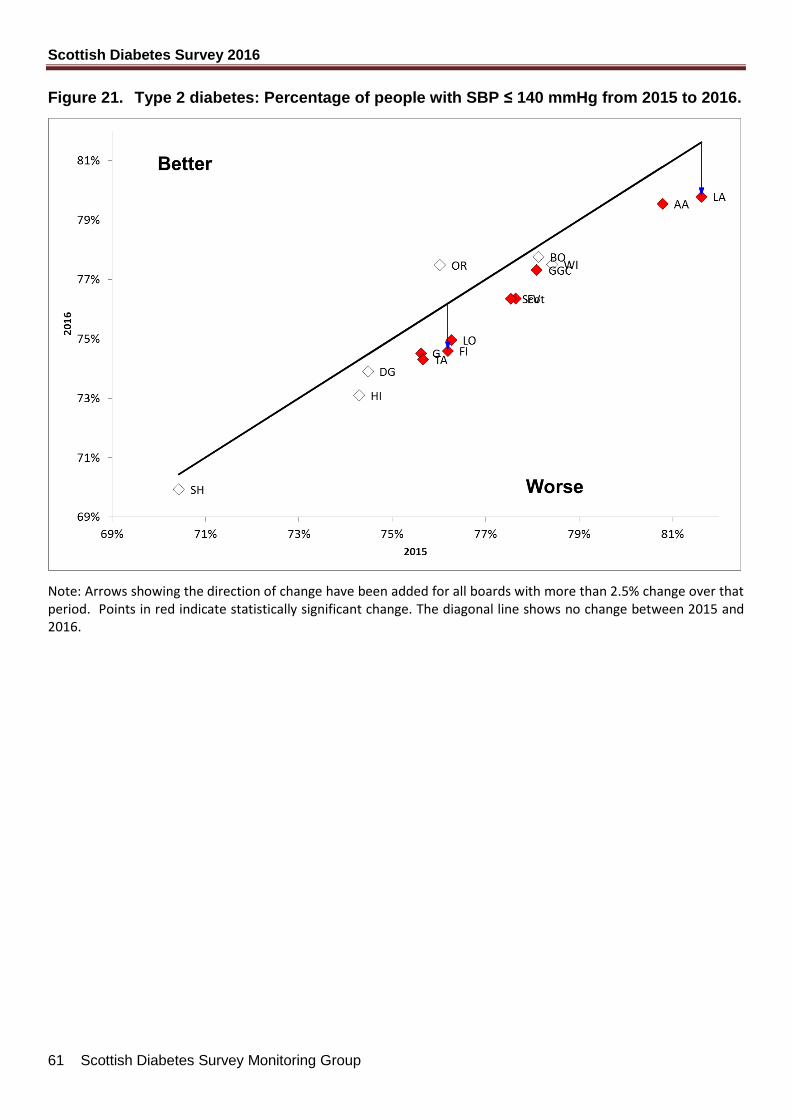
Figure 21. Type 2 diabetes: Percentage of people with SBP ≤ 140 mmHg from 2015 to 2016.
Note: Arrows showing the direction of change have been added for all boards with more than 2.5% change over that period. Points in red indicate statistically significant change. The diagonal line shows no change between 2015 and 2016.
Scottish Diabetes Survey 2016
62 Scottish Diabetes Survey Monitoring Group
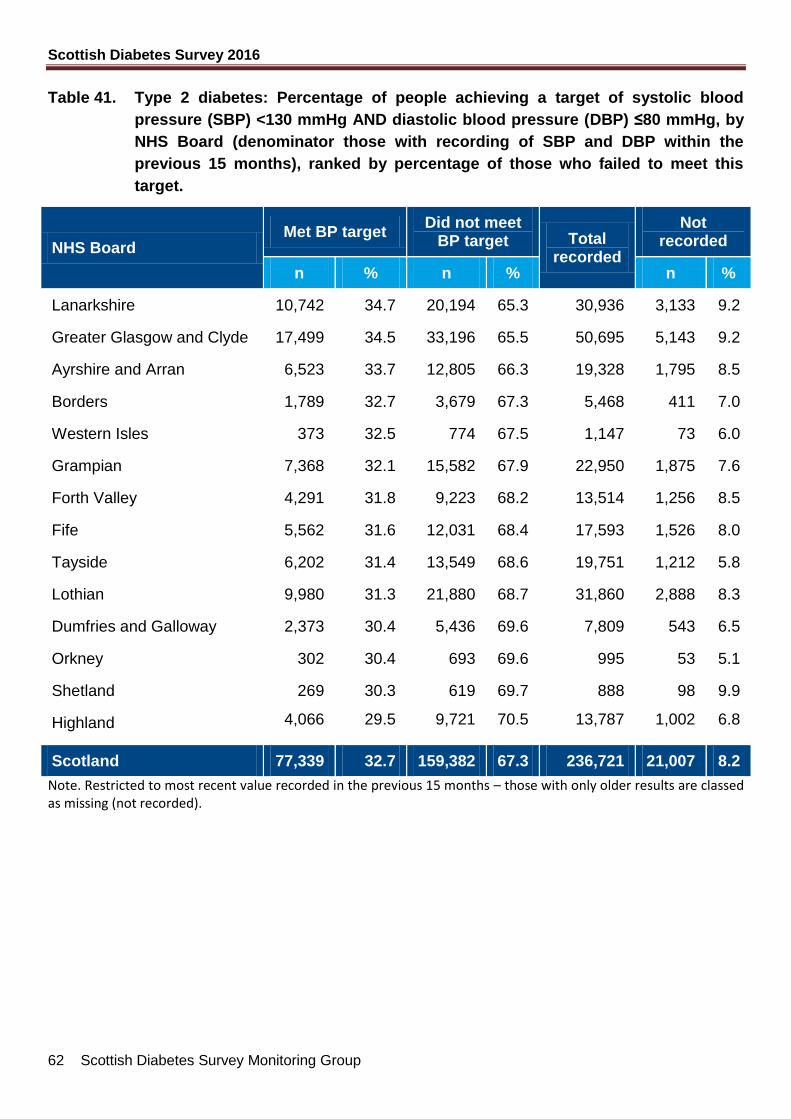
Table 41. Type 2 diabetes: Percentage of people achieving a target of systolic blood
pressure (SBP) <130 mmHg AND diastolic blood pressure (DBP) ≤80 mmHg, by
NHS Board (denominator those with recording of SBP and DBP within the
previous 15 months), ranked by percentage of those who failed to meet this
target.
NHS Board Met BP target
Did not meet BP target Total
recorded
Not recorded
n % n % n %
Lanarkshire 10,742 34.7 20,194 65.3 30,936 3,133 9.2
Greater Glasgow and Clyde 17,499 34.5 33,196 65.5 50,695 5,143 9.2
Ayrshire and Arran 6,523 33.7 12,805 66.3 19,328 1,795 8.5
Borders 1,789 32.7 3,679 67.3 5,468 411 7.0
Western Isles 373 32.5 774 67.5 1,147 73 6.0
Grampian 7,368 32.1 15,582 67.9 22,950 1,875 7.6
Forth Valley 4,291 31.8 9,223 68.2 13,514 1,256 8.5
Fife 5,562 31.6 12,031 68.4 17,593 1,526 8.0
Tayside 6,202 31.4 13,549 68.6 19,751 1,212 5.8
Lothian 9,980 31.3 21,880 68.7 31,860 2,888 8.3
Dumfries and Galloway 2,373 30.4 5,436 69.6 7,809 543 6.5
Orkney 302 30.4 693 69.6 995 53 5.1
Shetland 269 30.3 619 69.7 888 98 9.9
Highland 4,066 29.5 9,721 70.5 13,787 1,002 6.8
Scotland 77,339 32.7 159,382 67.3 236,721 21,007 8.2
Note. Restricted to most recent value recorded in the previous 15 months – those with only older results are classed as missing (not recorded).

Scottish Diabetes Survey 2016
63 Scottish Diabetes Survey Monitoring Group
Table 42. Percentage of people with diabetes (Type 1 and Type 2 combined) with systolic
blood pressure (SBP) ≤ 140 mmHg.
Year Total Systolic BP ≤ 140 (%) Systolic BP > 140 (%) Not recorded (%)
2016 288,627 76.6 23.4% 8.9%
2015 281,237 77.8 22.2% 7.2%
2014 273,852 78.5 21.5% 6.2%
2013 256,866 78.6 21.4% 6.0%
2012 256,816 77.5 22.5% 6.4%
2011 228,948 76.0 24.0% 6.9%
2010 220,615 74.9 25.1% 6.6%
2009 212,857 75.1 24.9% 6.1%
2008 199,650 73.3 26.7% 9.2%
2007 204,166 73.0 27.0% 2.6%
Note: From 2008 onwards, there was a requirement that BP should be in previous 15 months. In 2007, older results could be included if there was no recent result.
Table 43. Type 1 diabetes: Mean BP (mmHg) recorded in previous 15 months in people
aged < 40 years, by NHS Board, ranked by mean systolic BP.
NHS Board Mean systolic BP (mmHg) Mean diastolic BP (mmHg)
Orkney 116 70
Ayrshire and Arran 118 71
Grampian 120 71
Western Isles 120 75
Dumfries and Galloway 122 76
Highland 122 74
Lothian 123 77
Greater Glasgow and Clyde 124 74
Lanarkshire 124 74
Shetland 124 74
Tayside 124 75
Forth Valley 126 76
Borders 127 73
Fife 127 76
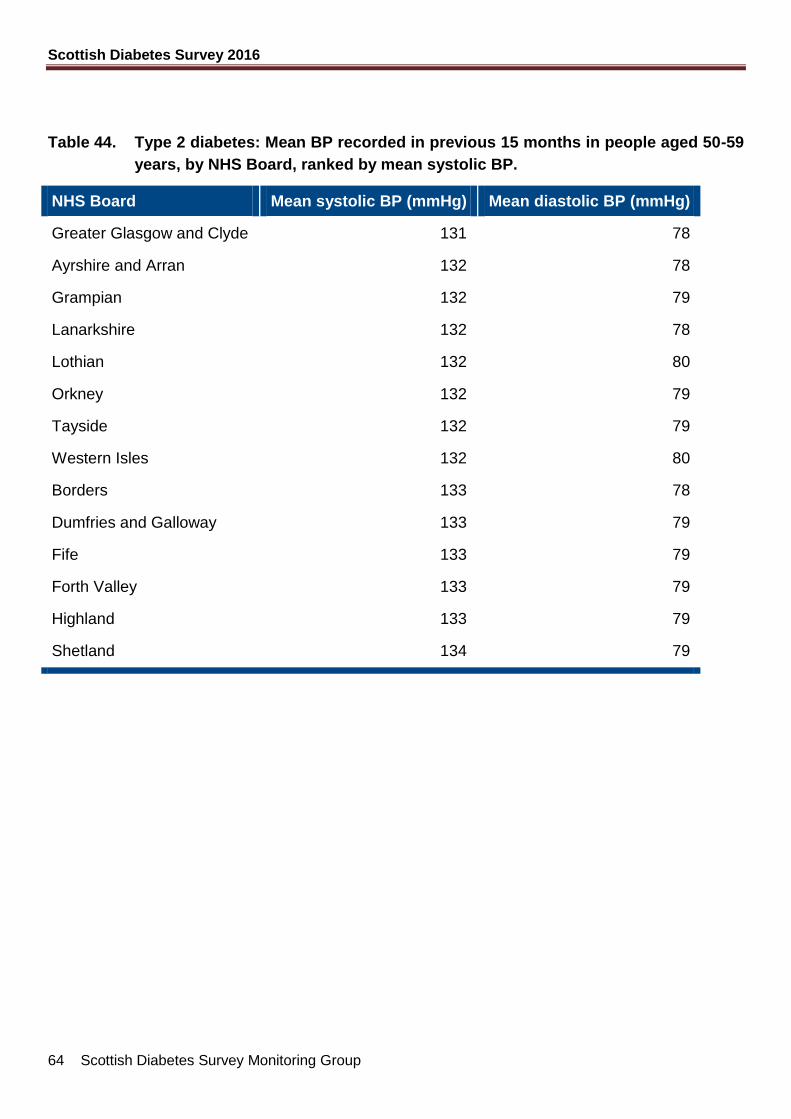
Scottish Diabetes Survey 2016
64 Scottish Diabetes Survey Monitoring Group
Table 44. Type 2 diabetes: Mean BP recorded in previous 15 months in people aged 50-59
years, by NHS Board, ranked by mean systolic BP.
NHS Board Mean systolic BP (mmHg) Mean diastolic BP (mmHg)
Greater Glasgow and Clyde 131 78
Ayrshire and Arran 132 78
Grampian 132 79
Lanarkshire 132 78
Lothian 132 80
Orkney 132 79
Tayside 132 79
Western Isles 132 80
Borders 133 78
Dumfries and Galloway 133 79
Fife 133 79
Forth Valley 133 79
Highland 133 79
Shetland 134 79
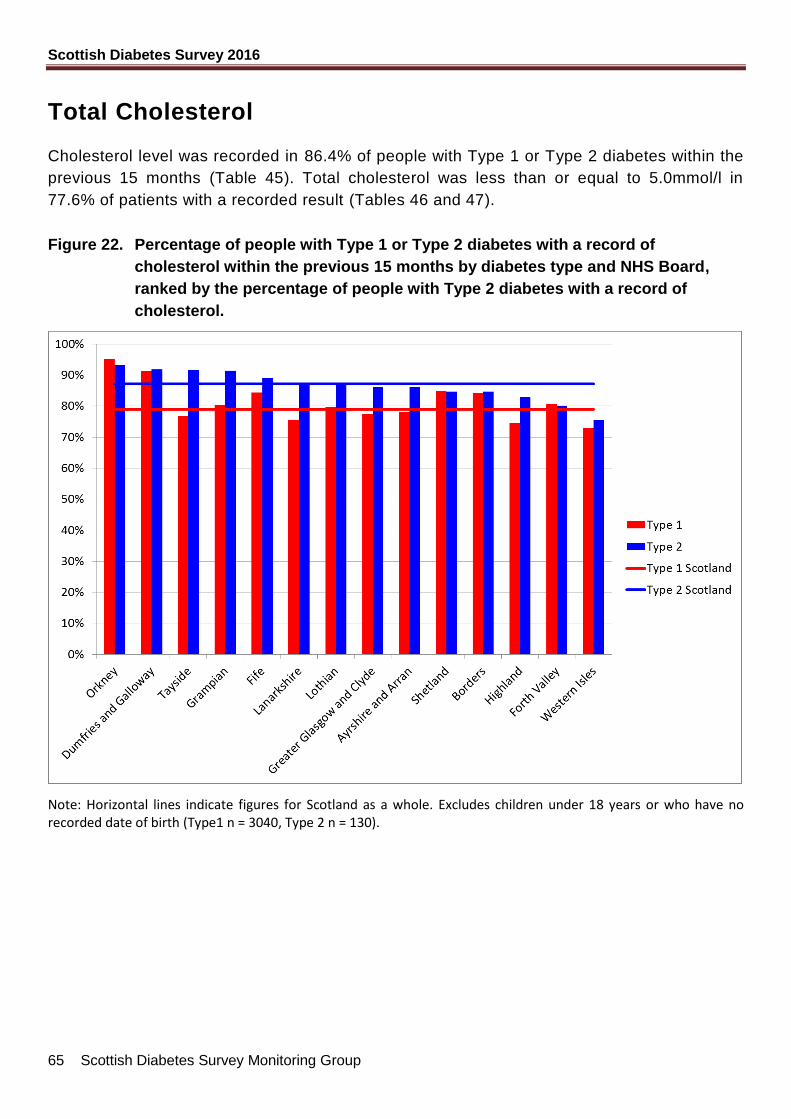
Scottish Diabetes Survey 2016
65 Scottish Diabetes Survey Monitoring Group
Total Cholesterol
Cholesterol level was recorded in 86.4% of people with Type 1 or Type 2 diabetes within the
previous 15 months (Table 45). Total cholesterol was less than or equal to 5.0mmol/l in
77.6% of patients with a recorded result (Tables 46 and 47).
Figure 22. Percentage of people with Type 1 or Type 2 diabetes with a record of
cholesterol within the previous 15 months by diabetes type and NHS Board,
ranked by the percentage of people with Type 2 diabetes with a record of
cholesterol.
Note: Horizontal lines indicate figures for Scotland as a whole. Excludes children under 18 years or who have no recorded date of birth (Type1 n = 3040, Type 2 n = 130).
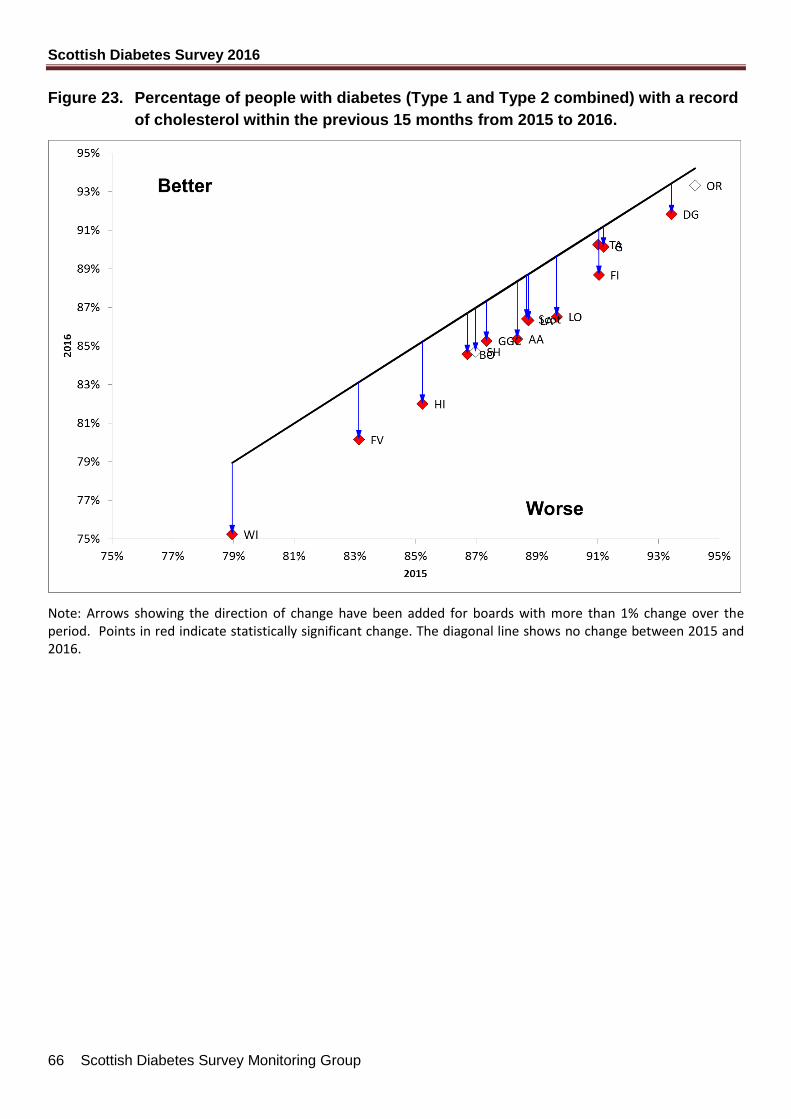
Scottish Diabetes Survey 2016
66 Scottish Diabetes Survey Monitoring Group
Figure 23. Percentage of people with diabetes (Type 1 and Type 2 combined) with a record
of cholesterol within the previous 15 months from 2015 to 2016.
Note: Arrows showing the direction of change have been added for boards with more than 1% change over the period. Points in red indicate statistically significant change. The diagonal line shows no change between 2015 and 2016.
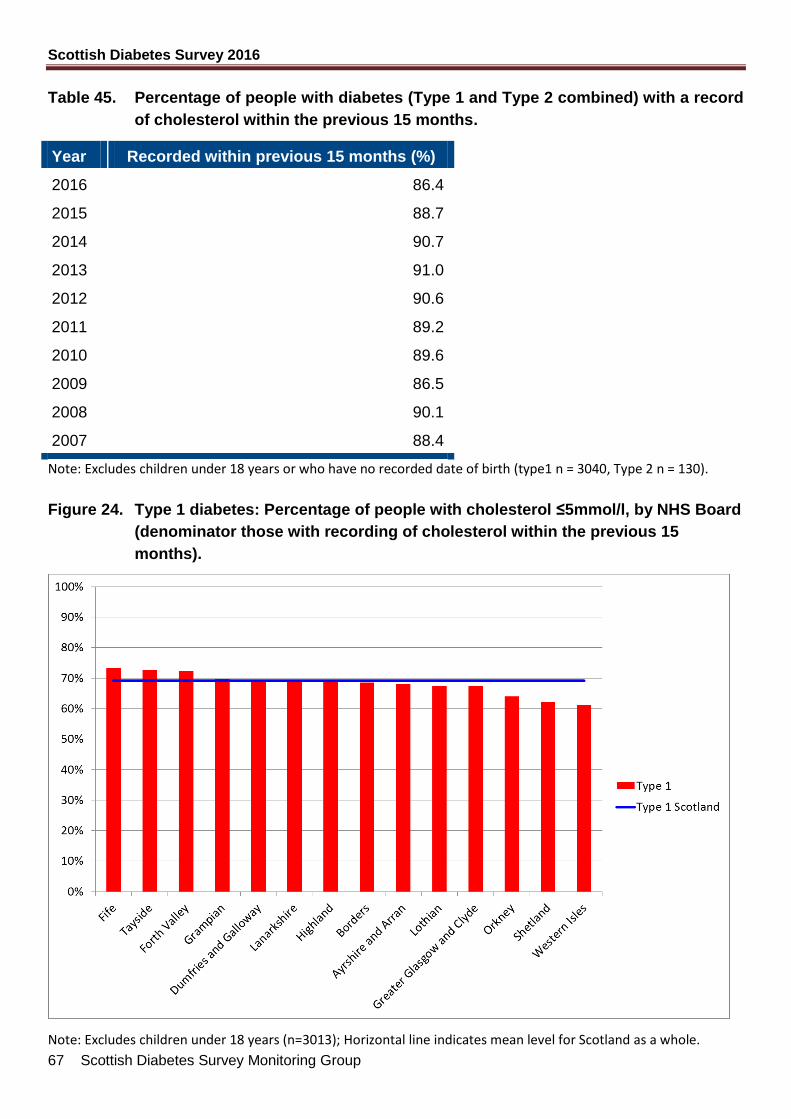
Scottish Diabetes Survey 2016
67 Scottish Diabetes Survey Monitoring Group
Table 45. Percentage of people with diabetes (Type 1 and Type 2 combined) with a record
of cholesterol within the previous 15 months.
Year Recorded within previous 15 months (%)
2016 86.4
2015 88.7
2014 90.7
2013 91.0
2012 90.6
2011 89.2
2010 89.6
2009 86.5
2008 90.1
2007 88.4
Note: Excludes children under 18 years or who have no recorded date of birth (type1 n = 3040, Type 2 n = 130).
Figure 24. Type 1 diabetes: Percentage of people with cholesterol ≤5mmol/l, by NHS Board
(denominator those with recording of cholesterol within the previous 15
months).
Note: Excludes children under 18 years (n=3013); Horizontal line indicates mean level for Scotland as a whole.
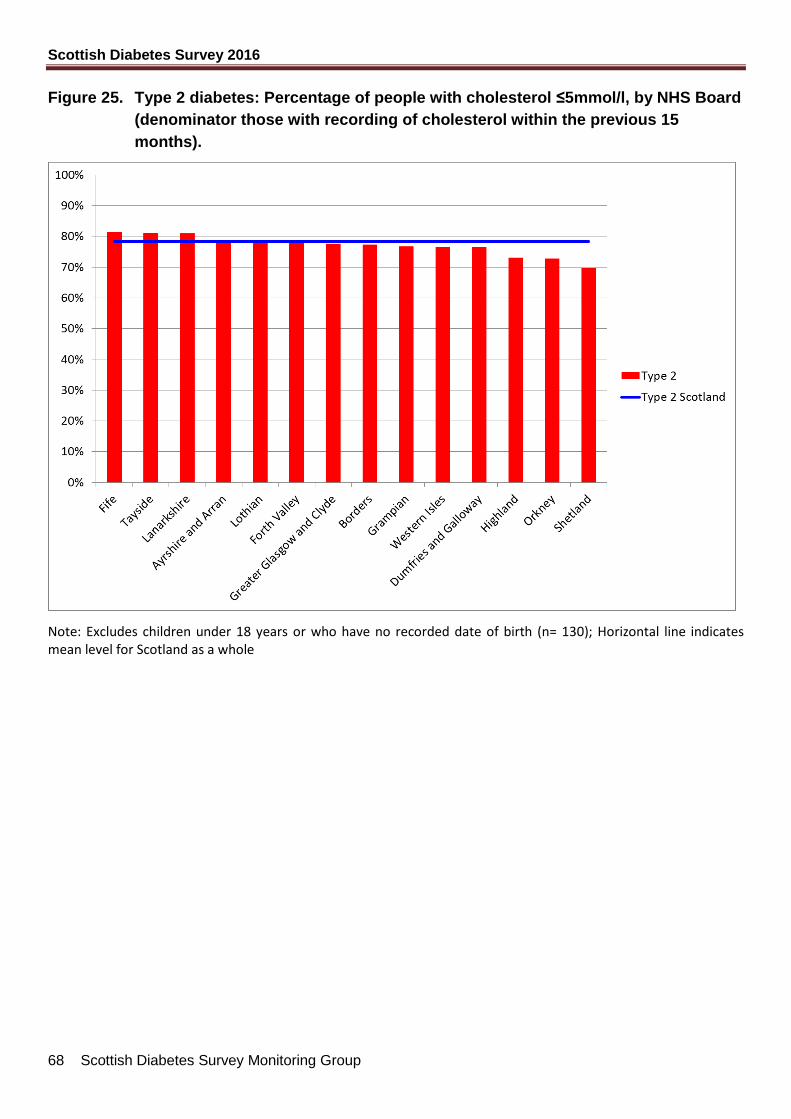
Scottish Diabetes Survey 2016
68 Scottish Diabetes Survey Monitoring Group
Figure 25. Type 2 diabetes: Percentage of people with cholesterol ≤5mmol/l, by NHS Board
(denominator those with recording of cholesterol within the previous 15
months).
Note: Excludes children under 18 years or who have no recorded date of birth (n= 130); Horizontal line indicates mean level for Scotland as a whole
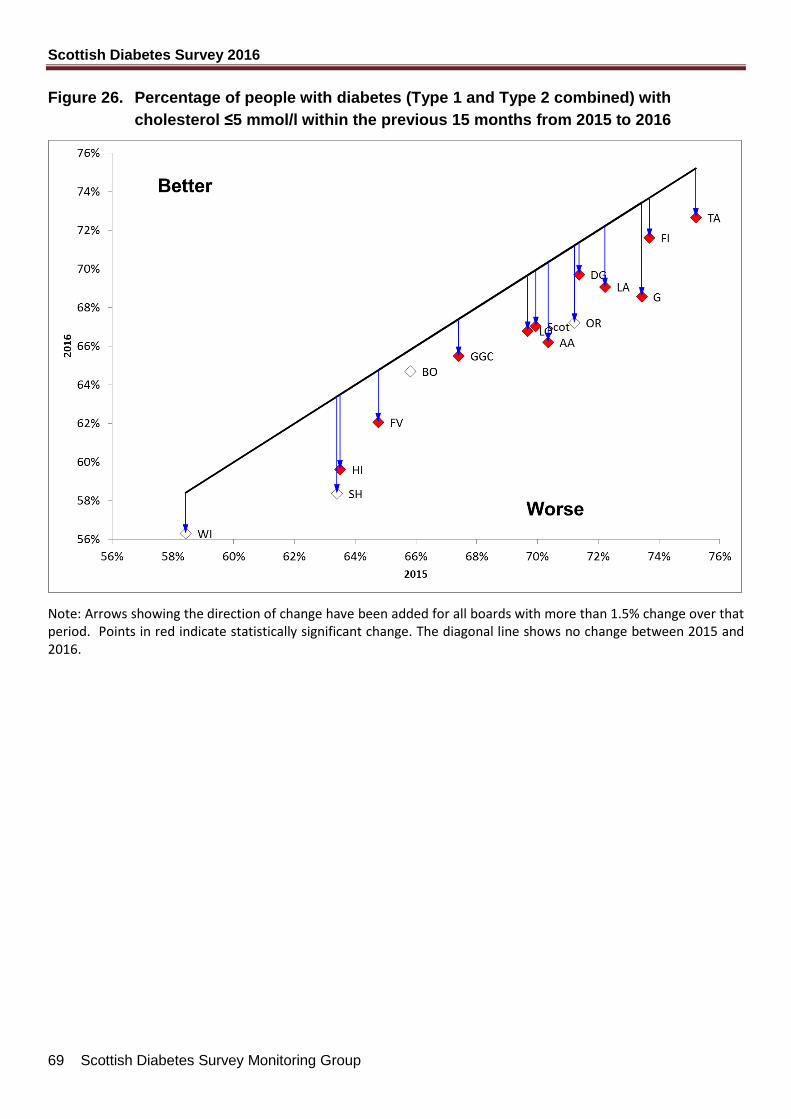
Scottish Diabetes Survey 2016
69 Scottish Diabetes Survey Monitoring Group
Figure 26. Percentage of people with diabetes (Type 1 and Type 2 combined) with
cholesterol ≤5 mmol/l within the previous 15 months from 2015 to 2016
Note: Arrows showing the direction of change have been added for all boards with more than 1.5% change over that period. Points in red indicate statistically significant change. The diagonal line shows no change between 2015 and 2016.
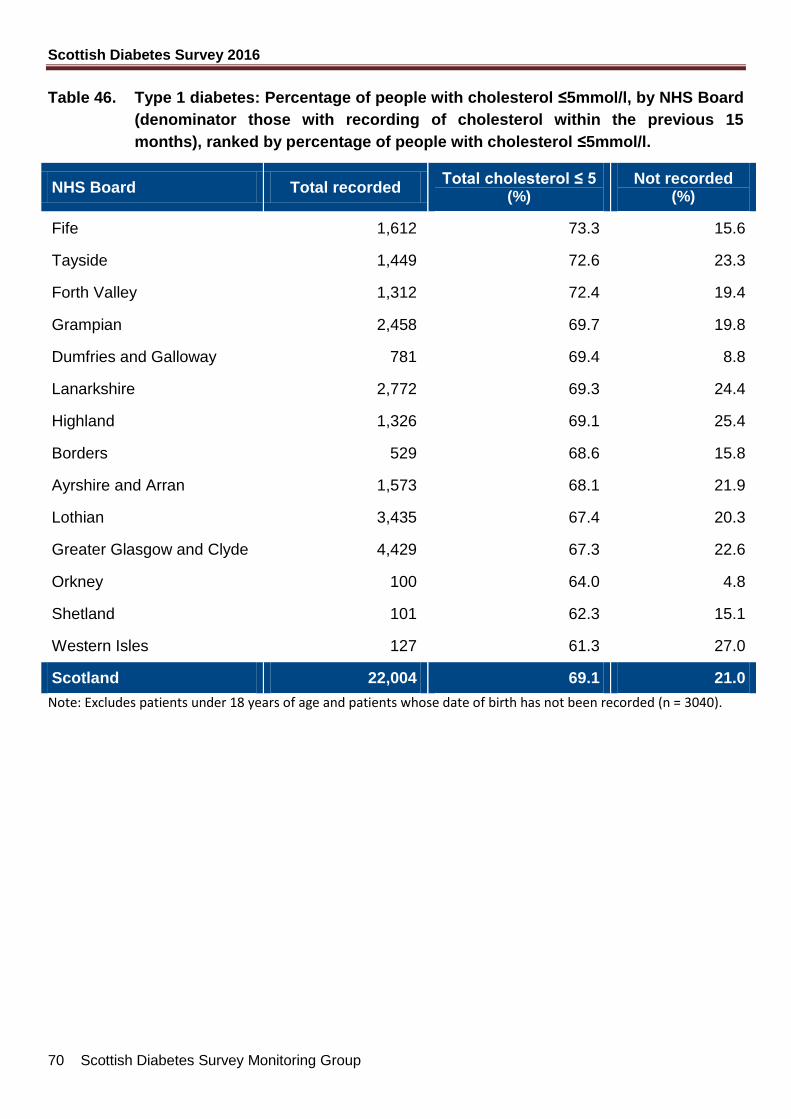
Scottish Diabetes Survey 2016
70 Scottish Diabetes Survey Monitoring Group
Table 46. Type 1 diabetes: Percentage of people with cholesterol ≤5mmol/l, by NHS Board
(denominator those with recording of cholesterol within the previous 15
months), ranked by percentage of people with cholesterol ≤5mmol/l.
NHS Board Total recorded Total cholesterol ≤ 5
(%) Not recorded
(%)
Fife 1,612 73.3 15.6
Tayside 1,449 72.6 23.3
Forth Valley 1,312 72.4 19.4
Grampian 2,458 69.7 19.8
Dumfries and Galloway 781 69.4 8.8
Lanarkshire 2,772 69.3 24.4
Highland 1,326 69.1 25.4
Borders 529 68.6 15.8
Ayrshire and Arran 1,573 68.1 21.9
Lothian 3,435 67.4 20.3
Greater Glasgow and Clyde 4,429 67.3 22.6
Orkney 100 64.0 4.8
Shetland 101 62.3 15.1
Western Isles 127 61.3 27.0
Scotland 22,004 69.1 21.0
Note: Excludes patients under 18 years of age and patients whose date of birth has not been recorded (n = 3040).
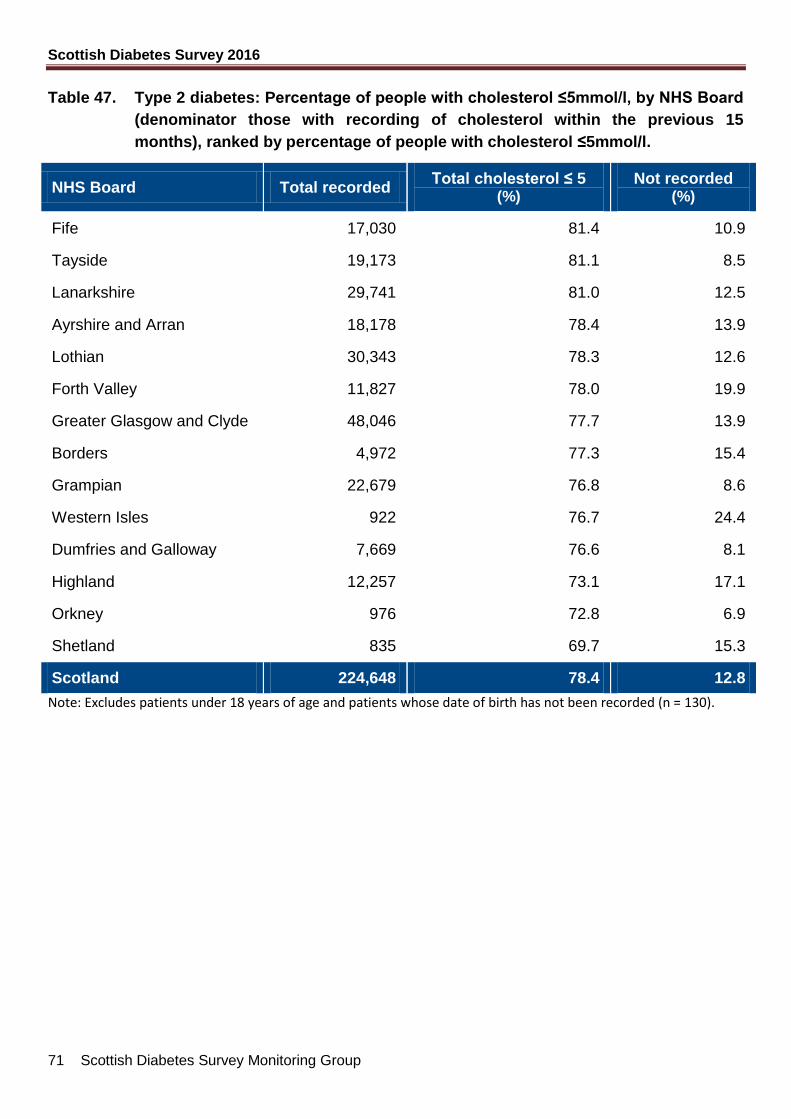
Scottish Diabetes Survey 2016
71 Scottish Diabetes Survey Monitoring Group
Table 47. Type 2 diabetes: Percentage of people with cholesterol ≤5mmol/l, by NHS Board
(denominator those with recording of cholesterol within the previous 15
months), ranked by percentage of people with cholesterol ≤5mmol/l.
NHS Board Total recorded Total cholesterol ≤ 5
(%) Not recorded
(%)
Fife 17,030 81.4 10.9
Tayside 19,173 81.1 8.5
Lanarkshire 29,741 81.0 12.5
Ayrshire and Arran 18,178 78.4 13.9
Lothian 30,343 78.3 12.6
Forth Valley 11,827 78.0 19.9
Greater Glasgow and Clyde 48,046 77.7 13.9
Borders 4,972 77.3 15.4
Grampian 22,679 76.8 8.6
Western Isles 922 76.7 24.4
Dumfries and Galloway 7,669 76.6 8.1
Highland 12,257 73.1 17.1
Orkney 976 72.8 6.9
Shetland 835 69.7 15.3
Scotland 224,648 78.4 12.8
Note: Excludes patients under 18 years of age and patients whose date of birth has not been recorded (n = 130).
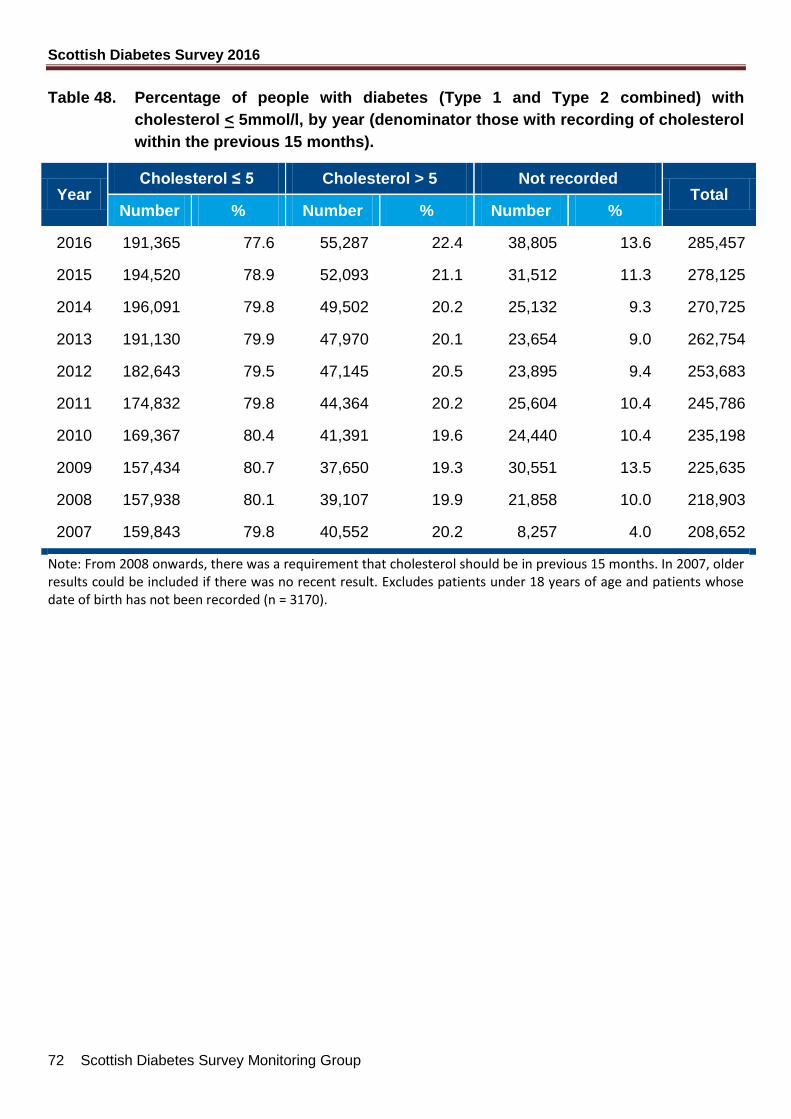
Scottish Diabetes Survey 2016
72 Scottish Diabetes Survey Monitoring Group
Table 48. Percentage of people with diabetes (Type 1 and Type 2 combined) with
cholesterol < 5mmol/l, by year (denominator those with recording of cholesterol
within the previous 15 months).
Year Cholesterol ≤ 5 Cholesterol > 5 Not recorded
Total Number % Number % Number %
2016 191,365 77.6 55,287 22.4 38,805 13.6 285,457
2015 194,520 78.9 52,093 21.1 31,512 11.3 278,125
2014 196,091 79.8 49,502 20.2 25,132 9.3 270,725
2013 191,130 79.9 47,970 20.1 23,654 9.0 262,754
2012 182,643 79.5 47,145 20.5 23,895 9.4 253,683
2011 174,832 79.8 44,364 20.2 25,604 10.4 245,786
2010 169,367 80.4 41,391 19.6 24,440 10.4 235,198
2009 157,434 80.7 37,650 19.3 30,551 13.5 225,635
2008 157,938 80.1 39,107 19.9 21,858 10.0 218,903
2007 159,843 79.8 40,552 20.2 8,257 4.0 208,652
Note: From 2008 onwards, there was a requirement that cholesterol should be in previous 15 months. In 2007, older results could be included if there was no recent result. Excludes patients under 18 years of age and patients whose date of birth has not been recorded (n = 3170).
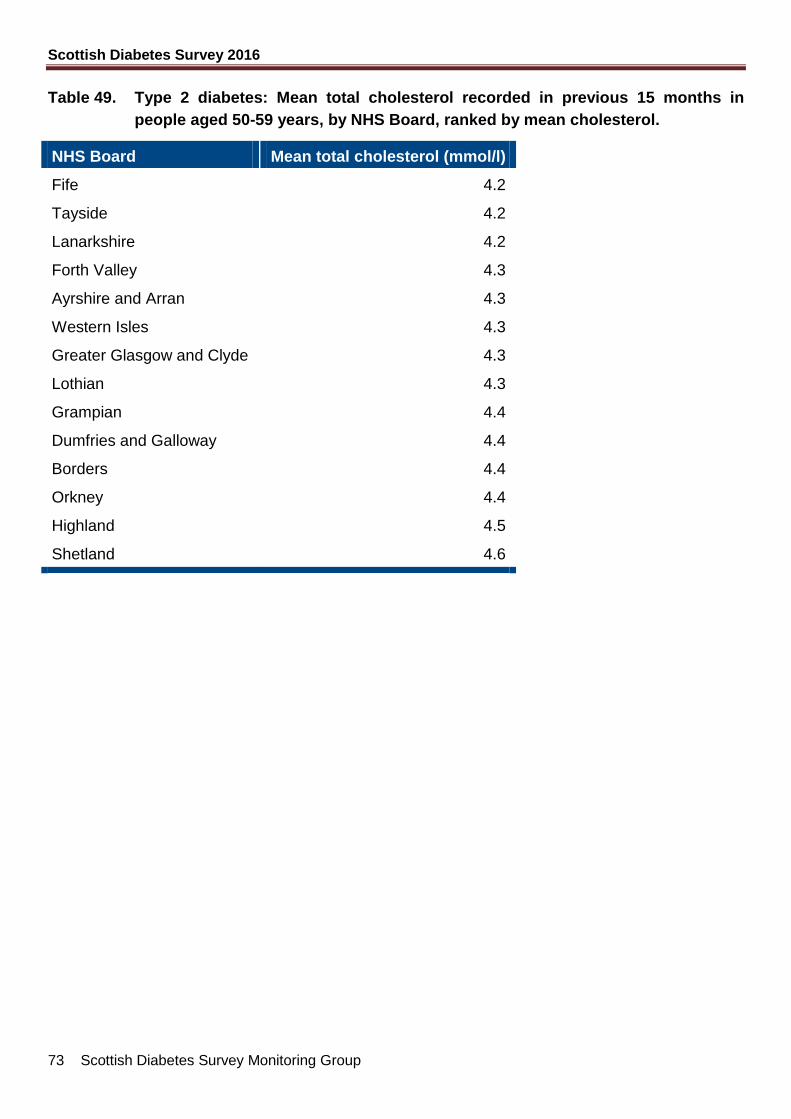
Scottish Diabetes Survey 2016
73 Scottish Diabetes Survey Monitoring Group
Table 49. Type 2 diabetes: Mean total cholesterol recorded in previous 15 months in
people aged 50-59 years, by NHS Board, ranked by mean cholesterol.
NHS Board Mean total cholesterol (mmol/l)
Fife 4.2
Tayside 4.2
Lanarkshire 4.2
Forth Valley 4.3
Ayrshire and Arran 4.3
Western Isles 4.3
Greater Glasgow and Clyde 4.3
Lothian 4.3
Grampian 4.4
Dumfries and Galloway 4.4
Borders 4.4
Orkney 4.4
Highland 4.5
Shetland 4.6

Scottish Diabetes Survey 2016
74 Scottish Diabetes Survey Monitoring Group
Smoking Status
Smoking status was recorded for 78.2% of the diabetic population (Table 52). Tables 50 and
51 show those with a recorded smoking status in the last 15 months. Overall, 17.7% reported
that they currently smoke (22.9% Type 1 and 17.2% Type 2). Figure 27 and Figure 28
graphically show the percentages of the smoking status, including those without a recording,
using the diabetic population as the denominator.
Note: Data from people of all ages are included in these smoking figures.
Figure 27. Type 1 diabetes: Smoking status as a percentage of all those with Type 1
diabetes, by NHS Health Board.
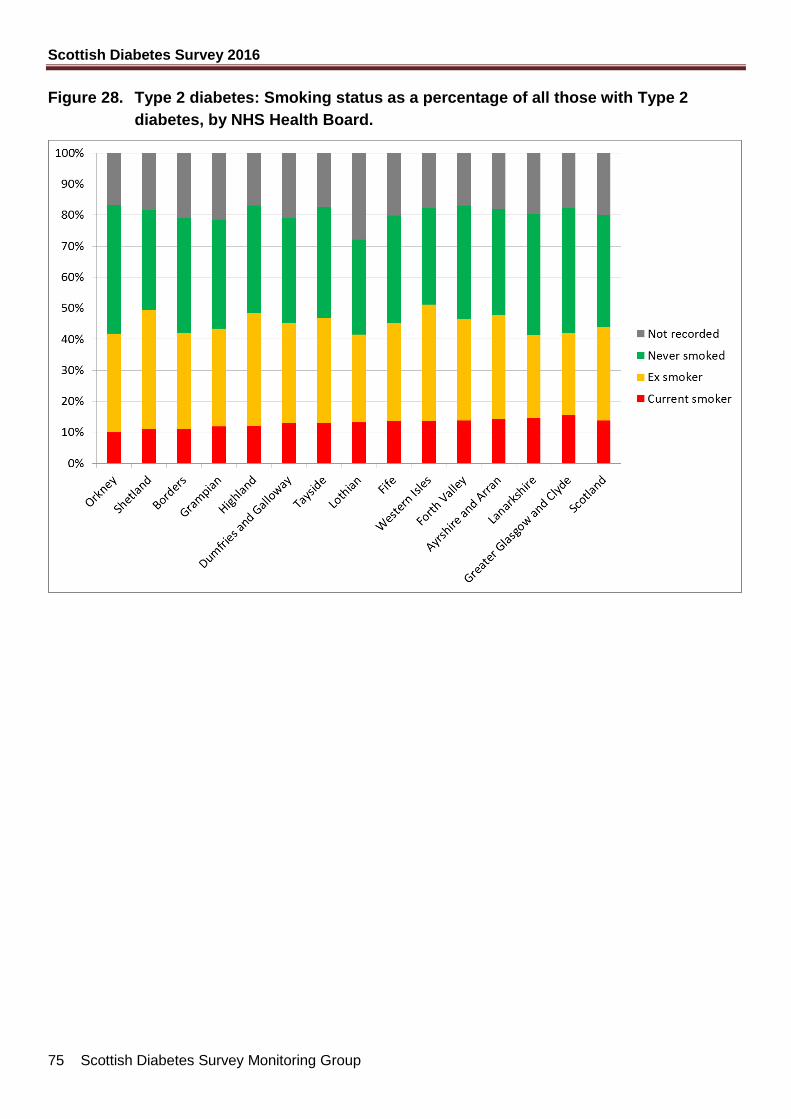
Scottish Diabetes Survey 2016
75 Scottish Diabetes Survey Monitoring Group
Figure 28. Type 2 diabetes: Smoking status as a percentage of all those with Type 2
diabetes, by NHS Health Board.
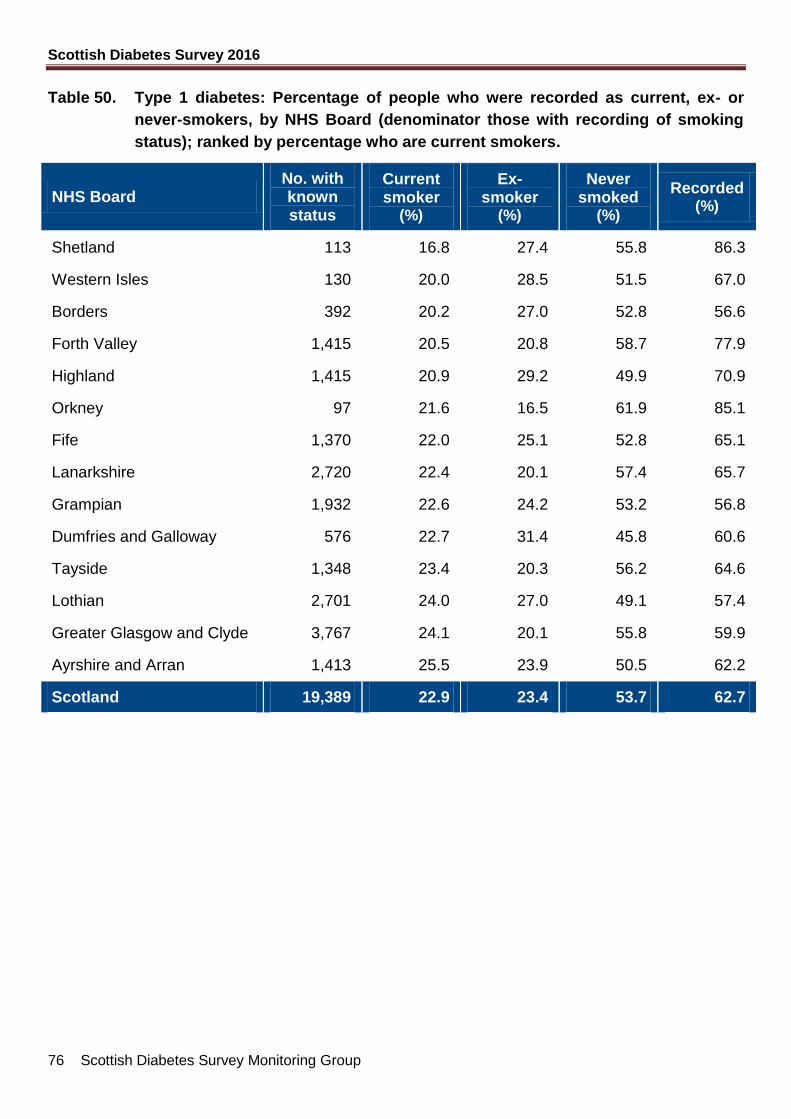
Scottish Diabetes Survey 2016
76 Scottish Diabetes Survey Monitoring Group
Table 50. Type 1 diabetes: Percentage of people who were recorded as current, ex- or
never-smokers, by NHS Board (denominator those with recording of smoking
status); ranked by percentage who are current smokers.
NHS Board No. with known status
Current smoker
(%)
Ex-smoker
(%)
Never smoked
(%)
Recorded
(%)
Shetland 113 16.8 27.4 55.8 86.3
Western Isles 130 20.0 28.5 51.5 67.0
Borders 392 20.2 27.0 52.8 56.6
Forth Valley 1,415 20.5 20.8 58.7 77.9
Highland 1,415 20.9 29.2 49.9 70.9
Orkney 97 21.6 16.5 61.9 85.1
Fife 1,370 22.0 25.1 52.8 65.1
Lanarkshire 2,720 22.4 20.1 57.4 65.7
Grampian 1,932 22.6 24.2 53.2 56.8
Dumfries and Galloway 576 22.7 31.4 45.8 60.6
Tayside 1,348 23.4 20.3 56.2 64.6
Lothian 2,701 24.0 27.0 49.1 57.4
Greater Glasgow and Clyde 3,767 24.1 20.1 55.8 59.9
Ayrshire and Arran 1,413 25.5 23.9 50.5 62.2
Scotland 19,389 22.9 23.4 53.7 62.7
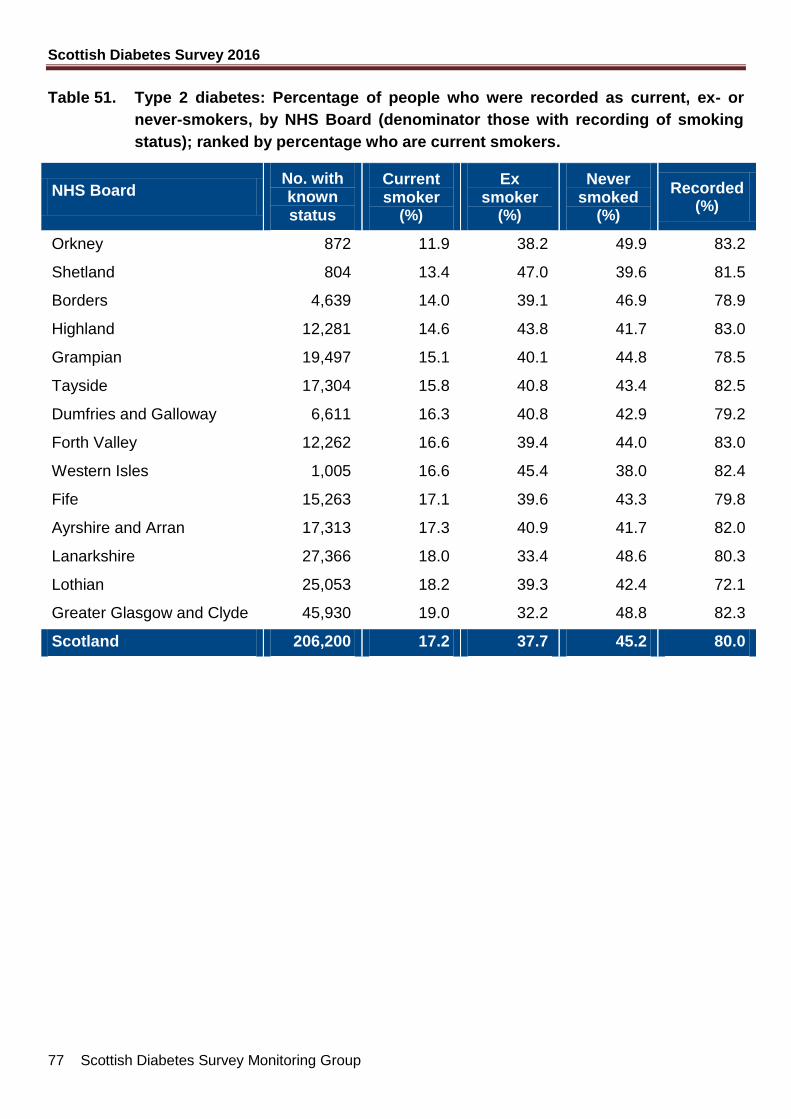
Scottish Diabetes Survey 2016
77 Scottish Diabetes Survey Monitoring Group
Table 51. Type 2 diabetes: Percentage of people who were recorded as current, ex- or
never-smokers, by NHS Board (denominator those with recording of smoking
status); ranked by percentage who are current smokers.
NHS Board No. with known status
Current smoker
(%)
Ex smoker
(%)
Never smoked
(%)
Recorded
(%)
Orkney 872 11.9 38.2 49.9 83.2
Shetland 804 13.4 47.0 39.6 81.5
Borders 4,639 14.0 39.1 46.9 78.9
Highland 12,281 14.6 43.8 41.7 83.0
Grampian 19,497 15.1 40.1 44.8 78.5
Tayside 17,304 15.8 40.8 43.4 82.5
Dumfries and Galloway 6,611 16.3 40.8 42.9 79.2
Forth Valley 12,262 16.6 39.4 44.0 83.0
Western Isles 1,005 16.6 45.4 38.0 82.4
Fife 15,263 17.1 39.6 43.3 79.8
Ayrshire and Arran 17,313 17.3 40.9 41.7 82.0
Lanarkshire 27,366 18.0 33.4 48.6 80.3
Lothian 25,053 18.2 39.3 42.4 72.1
Greater Glasgow and Clyde 45,930 19.0 32.2 48.8 82.3
Scotland 206,200 17.2 37.7 45.2 80.0
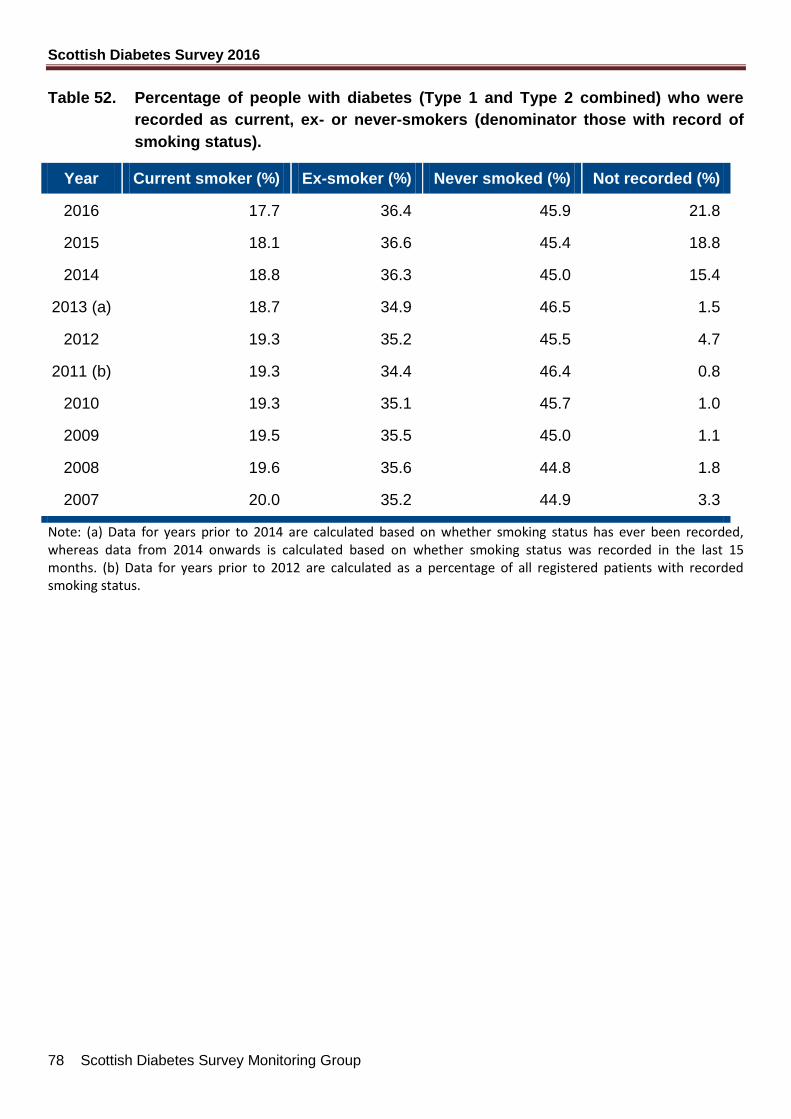
Scottish Diabetes Survey 2016
78 Scottish Diabetes Survey Monitoring Group
Table 52. Percentage of people with diabetes (Type 1 and Type 2 combined) who were
recorded as current, ex- or never-smokers (denominator those with record of
smoking status).
Year Current smoker (%) Ex-smoker (%) Never smoked (%) Not recorded (%)
2016 17.7 36.4 45.9 21.8
2015 18.1 36.6 45.4 18.8
2014 18.8 36.3 45.0 15.4
2013 (a) 18.7 34.9 46.5 1.5
2012 19.3 35.2 45.5 4.7
2011 (b) 19.3 34.4 46.4 0.8
2010 19.3 35.1 45.7 1.0
2009 19.5 35.5 45.0 1.1
2008 19.6 35.6 44.8 1.8
2007 20.0 35.2 44.9 3.3
Note: (a) Data for years prior to 2014 are calculated based on whether smoking status has ever been recorded, whereas data from 2014 onwards is calculated based on whether smoking status was recorded in the last 15 months. (b) Data for years prior to 2012 are calculated as a percentage of all registered patients with recorded smoking status.
Scottish Diabetes Survey 2016
79 Scottish Diabetes Survey Monitoring Group
Complications of Diabetes
The main complications of diabetes include those due to large vessel (arterial) disease:
myocardial infarction (MI) – the commonest cause of death in people with diabetes;
stroke – the risk is increased compared to people without diabetes;
peripheral vascular disease, which can lead to amputations;
And those due to small vessel disease (microangiopathy);
renal disease, which can lead to end-stage renal failure requiring dialysis;
retinopathy – diabetes has been the commonest cause of blindness in people of
working age;
Diabetes also leads to poorer outcomes in pregnancy, but this survey does not include
pregnancy outcomes.
The purpose of retinopathy screening is to detect changes early and intervene to prevent
further deterioration. In this section, the data presented include both screening performance
and recording of prevalent complications.
Myocardial Infarction
26,044 (9.0%) of registered patients have a record of a previous MI (Table 53). Others will
have had an MI but not survived. There have been improvements in recording, increased use
of procedures and better survival following an MI in recent years.
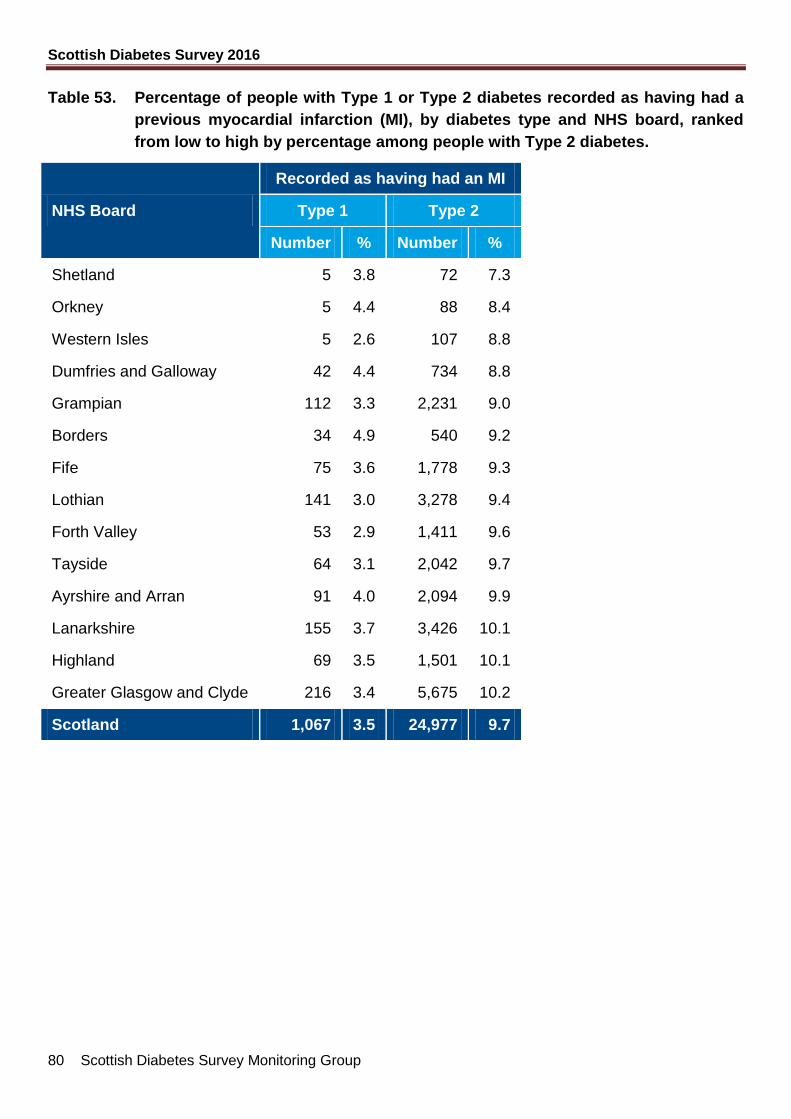
Scottish Diabetes Survey 2016
80 Scottish Diabetes Survey Monitoring Group
Table 53. Percentage of people with Type 1 or Type 2 diabetes recorded as having had a
previous myocardial infarction (MI), by diabetes type and NHS board, ranked
from low to high by percentage among people with Type 2 diabetes.
NHS Board
Recorded as having had an MI
Type 1 Type 2
Number % Number %
Shetland 5 3.8 72 7.3
Orkney 5 4.4 88 8.4
Western Isles 5 2.6 107 8.8
Dumfries and Galloway 42 4.4 734 8.8
Grampian 112 3.3 2,231 9.0
Borders 34 4.9 540 9.2
Fife 75 3.6 1,778 9.3
Lothian 141 3.0 3,278 9.4
Forth Valley 53 2.9 1,411 9.6
Tayside 64 3.1 2,042 9.7
Ayrshire and Arran 91 4.0 2,094 9.9
Lanarkshire 155 3.7 3,426 10.1
Highland 69 3.5 1,501 10.1
Greater Glasgow and Clyde 216 3.4 5,675 10.2
Scotland 1,067 3.5 24,977 9.7
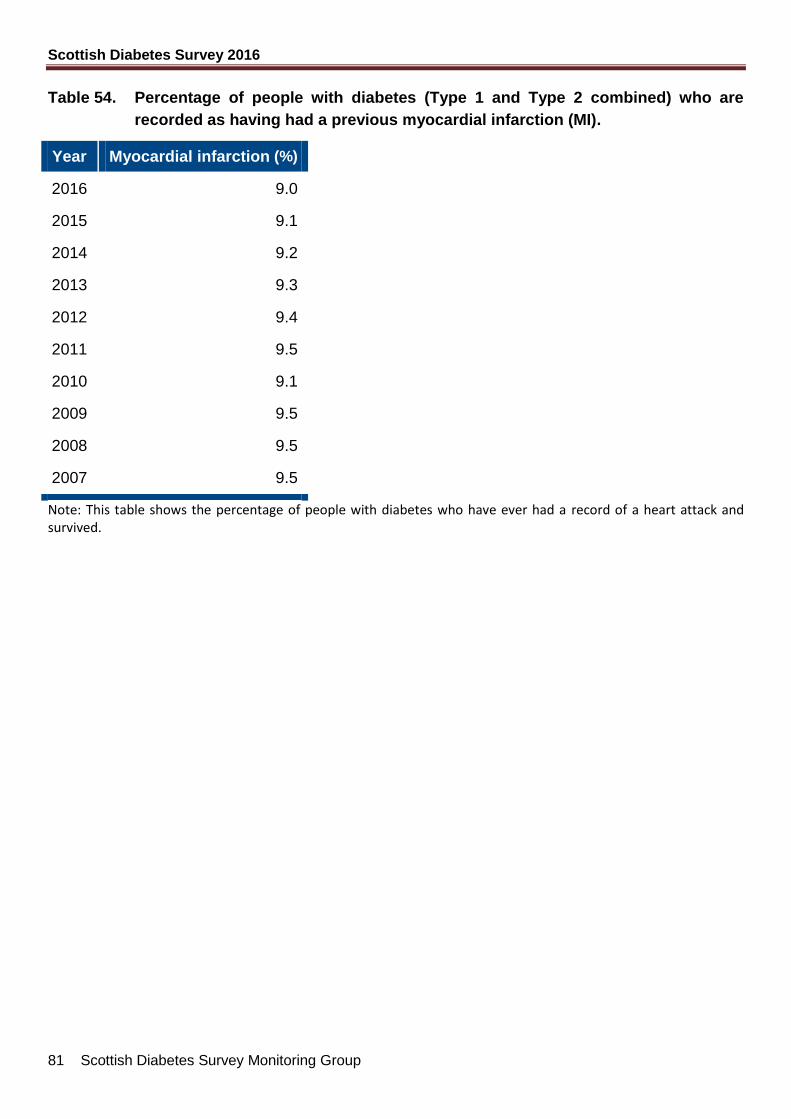
Scottish Diabetes Survey 2016
81 Scottish Diabetes Survey Monitoring Group
Table 54. Percentage of people with diabetes (Type 1 and Type 2 combined) who are
recorded as having had a previous myocardial infarction (MI).
Year Myocardial infarction (%)
2016 9.0
2015 9.1
2014 9.2
2013 9.3
2012 9.4
2011 9.5
2010 9.1
2009 9.5
2008 9.5
2007 9.5
Note: This table shows the percentage of people with diabetes who have ever had a record of a heart attack and survived.

Scottish Diabetes Survey 2016
82 Scottish Diabetes Survey Monitoring Group
Cardiac Revascularisation
20,032 (6.9%) people included in the survey have a record of having undergone cardiac
revascularisation (Table 55), including coronary artery bypass graft (CABG) and
percutaneous transluminal coronary angioplasty (PTCA).
Table 55. Percentage of people with Type 1 or Type 2 diabetes who have a record of
cardiac revascularisation by NHS Board and diabetes type, ranked from low to
high by percentage among people with Type 2 diabetes.
NHS Board
Recorded as having undergone cardiac revascularisation
Type 1 Type 2
Number % Number %
Shetland 4 3.1 56 5.7
Fife 45 2.1 1,177 6.2
Dumfries and Galloway 34 3.6 560 6.7
Forth Valley 37 2.0 992 6.7
Western Isles 5 2.6 84 6.9
Orkney 4 3.5 73 7.0
Ayrshire and Arran 54 2.4 1,528 7.2
Tayside 53 2.5 1,518 7.2
Borders 21 3.0 432 7.3
Lanarkshire 132 3.2 2,563 7.5
Lothian 119 2.5 2,685 7.7
Greater Glasgow and Clyde 152 2.4 4,357 7.8
Highland 56 2.8 1,179 8.0
Grampian 100 2.9 2,012 8.1
Scotland 816 2.6 19,216 7.5
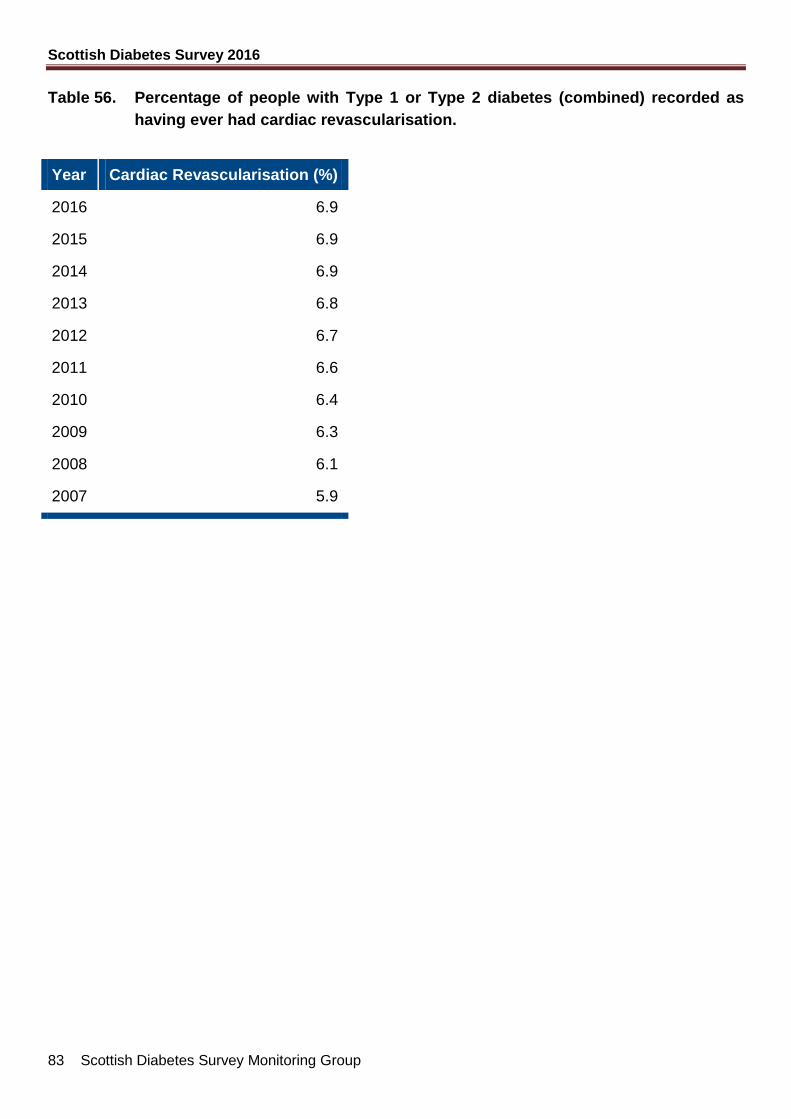
Scottish Diabetes Survey 2016
83 Scottish Diabetes Survey Monitoring Group
Table 56. Percentage of people with Type 1 or Type 2 diabetes (combined) recorded as
having ever had cardiac revascularisation.
Year Cardiac Revascularisation (%)
2016 6.9
2015 6.9
2014 6.9
2013 6.8
2012 6.7
2011 6.6
2010 6.4
2009 6.3
2008 6.1
2007 5.9
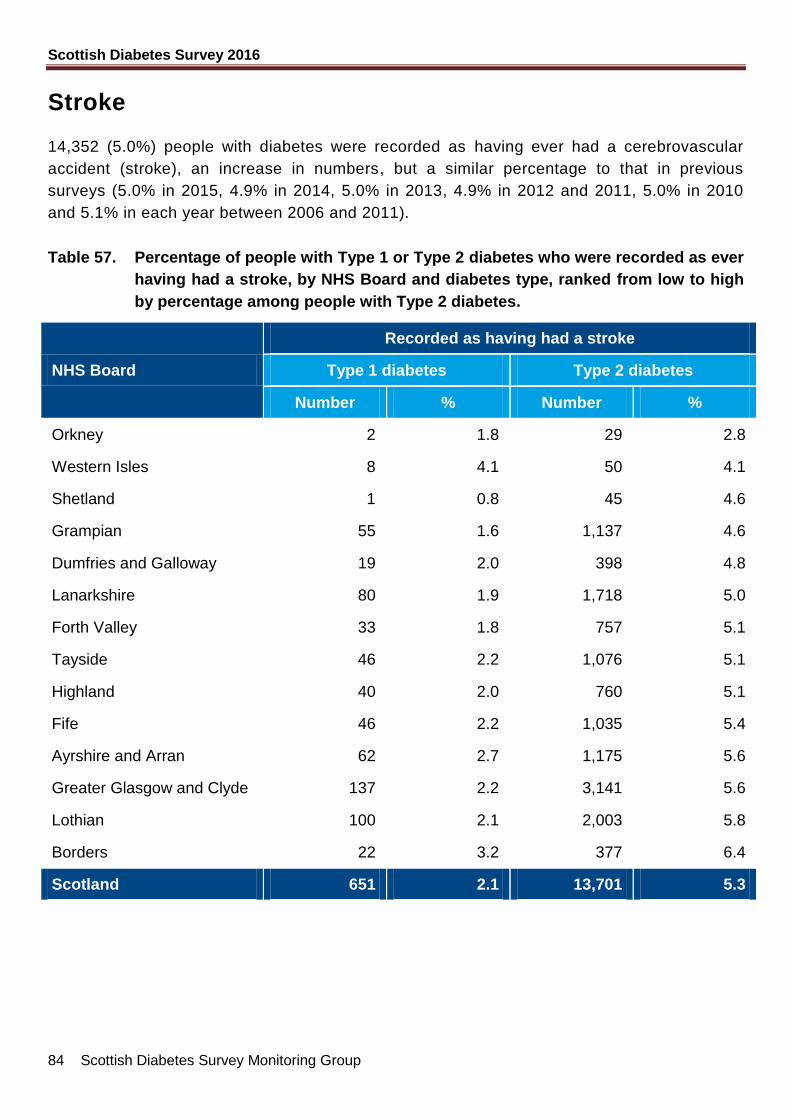
Scottish Diabetes Survey 2016
84 Scottish Diabetes Survey Monitoring Group
Stroke
14,352 (5.0%) people with diabetes were recorded as having ever had a cerebrovascular
accident (stroke), an increase in numbers, but a similar percentage to that in previous
surveys (5.0% in 2015, 4.9% in 2014, 5.0% in 2013, 4.9% in 2012 and 2011, 5.0% in 2010
and 5.1% in each year between 2006 and 2011).
Table 57. Percentage of people with Type 1 or Type 2 diabetes who were recorded as ever
having had a stroke, by NHS Board and diabetes type, ranked from low to high
by percentage among people with Type 2 diabetes.
NHS Board
Recorded as having had a stroke
Type 1 diabetes Type 2 diabetes
Number % Number %
Orkney 2 1.8 29 2.8
Western Isles 8 4.1 50 4.1
Shetland 1 0.8 45 4.6
Grampian 55 1.6 1,137 4.6
Dumfries and Galloway 19 2.0 398 4.8
Lanarkshire 80 1.9 1,718 5.0
Forth Valley 33 1.8 757 5.1
Tayside 46 2.2 1,076 5.1
Highland 40 2.0 760 5.1
Fife 46 2.2 1,035 5.4
Ayrshire and Arran 62 2.7 1,175 5.6
Greater Glasgow and Clyde 137 2.2 3,141 5.6
Lothian 100 2.1 2,003 5.8
Borders 22 3.2 377 6.4
Scotland 651 2.1 13,701 5.3
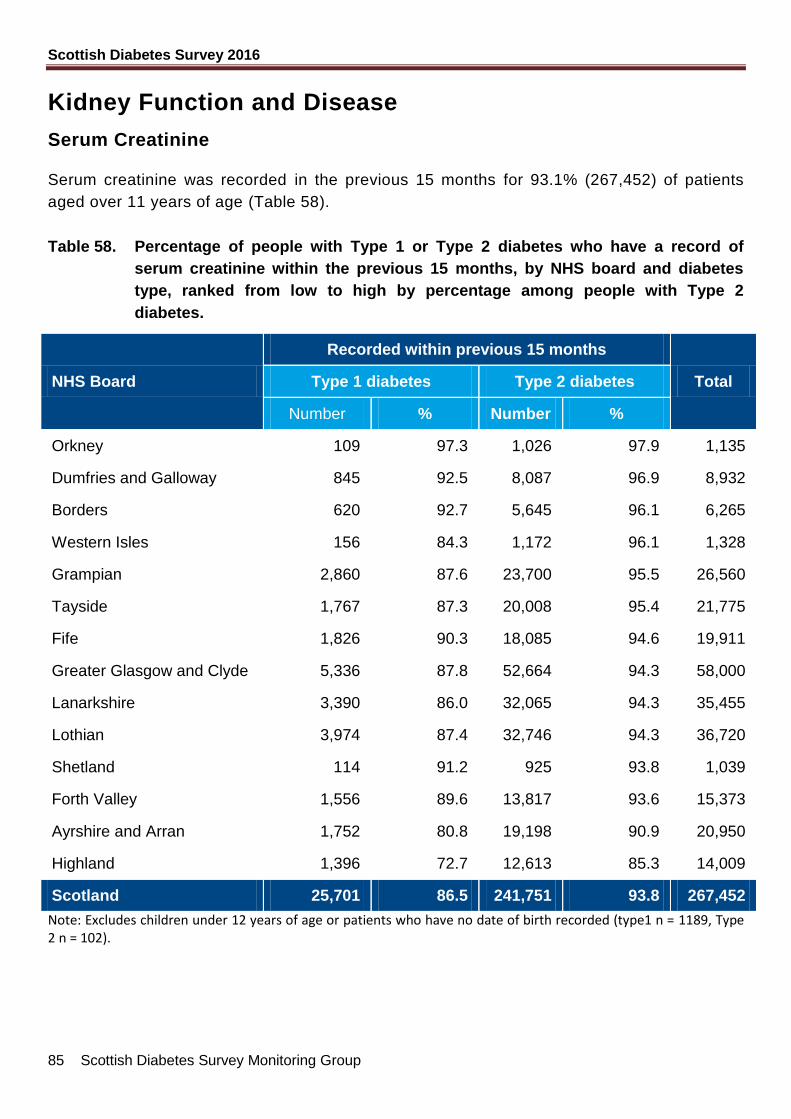
Scottish Diabetes Survey 2016
85 Scottish Diabetes Survey Monitoring Group
Kidney Function and Disease
Serum Creatinine
Serum creatinine was recorded in the previous 15 months for 93.1% (267,452) of patients
aged over 11 years of age (Table 58).
Table 58. Percentage of people with Type 1 or Type 2 diabetes who have a record of
serum creatinine within the previous 15 months, by NHS board and diabetes
type, ranked from low to high by percentage among people with Type 2
diabetes.
NHS Board
Recorded within previous 15 months
Total Type 1 diabetes Type 2 diabetes
Number % Number %
Orkney 109 97.3 1,026 97.9 1,135
Dumfries and Galloway 845 92.5 8,087 96.9 8,932
Borders 620 92.7 5,645 96.1 6,265
Western Isles 156 84.3 1,172 96.1 1,328
Grampian 2,860 87.6 23,700 95.5 26,560
Tayside 1,767 87.3 20,008 95.4 21,775
Fife 1,826 90.3 18,085 94.6 19,911
Greater Glasgow and Clyde 5,336 87.8 52,664 94.3 58,000
Lanarkshire 3,390 86.0 32,065 94.3 35,455
Lothian 3,974 87.4 32,746 94.3 36,720
Shetland 114 91.2 925 93.8 1,039
Forth Valley 1,556 89.6 13,817 93.6 15,373
Ayrshire and Arran 1,752 80.8 19,198 90.9 20,950
Highland 1,396 72.7 12,613 85.3 14,009
Scotland 25,701 86.5 241,751 93.8 267,452
Note: Excludes children under 12 years of age or patients who have no date of birth recorded (type1 n = 1189, Type 2 n = 102).
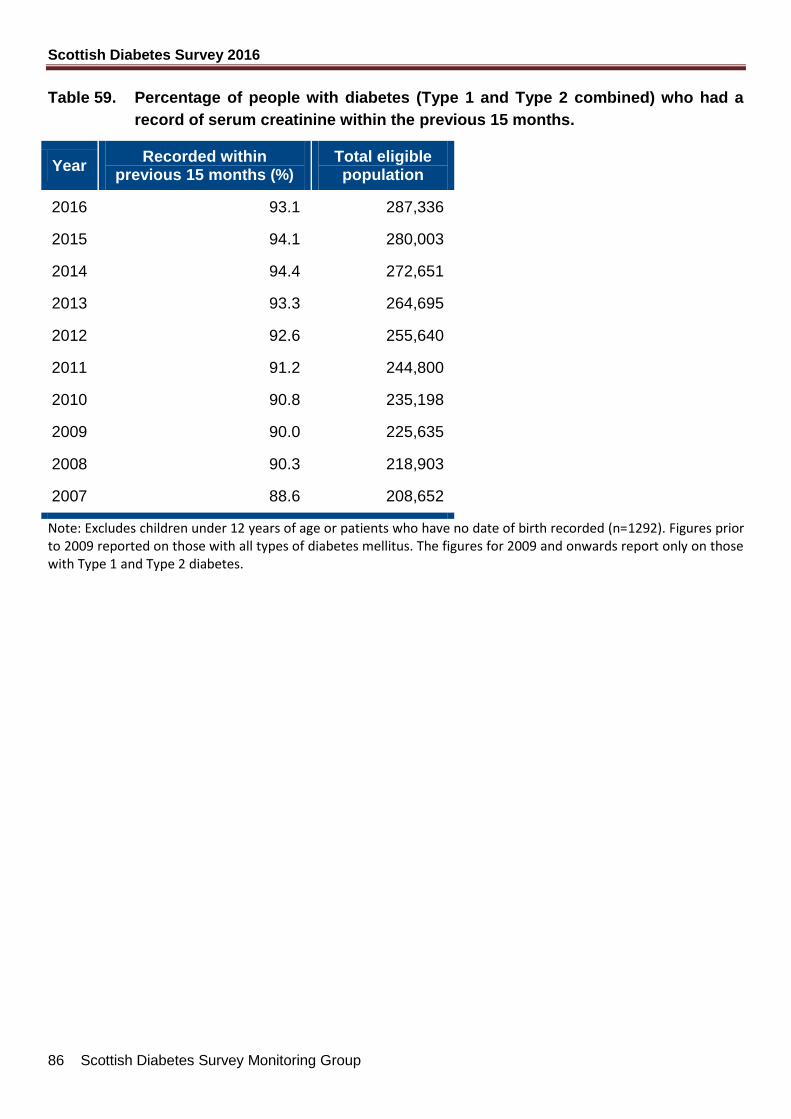
Scottish Diabetes Survey 2016
86 Scottish Diabetes Survey Monitoring Group
Table 59. Percentage of people with diabetes (Type 1 and Type 2 combined) who had a
record of serum creatinine within the previous 15 months.
Year Recorded within
previous 15 months (%) Total eligible population
2016 93.1 287,336
2015 94.1 280,003
2014 94.4 272,651
2013 93.3 264,695
2012 92.6 255,640
2011 91.2 244,800
2010 90.8 235,198
2009 90.0 225,635
2008 90.3 218,903
2007 88.6 208,652
Note: Excludes children under 12 years of age or patients who have no date of birth recorded (n=1292). Figures prior to 2009 reported on those with all types of diabetes mellitus. The figures for 2009 and onwards report only on those with Type 1 and Type 2 diabetes.
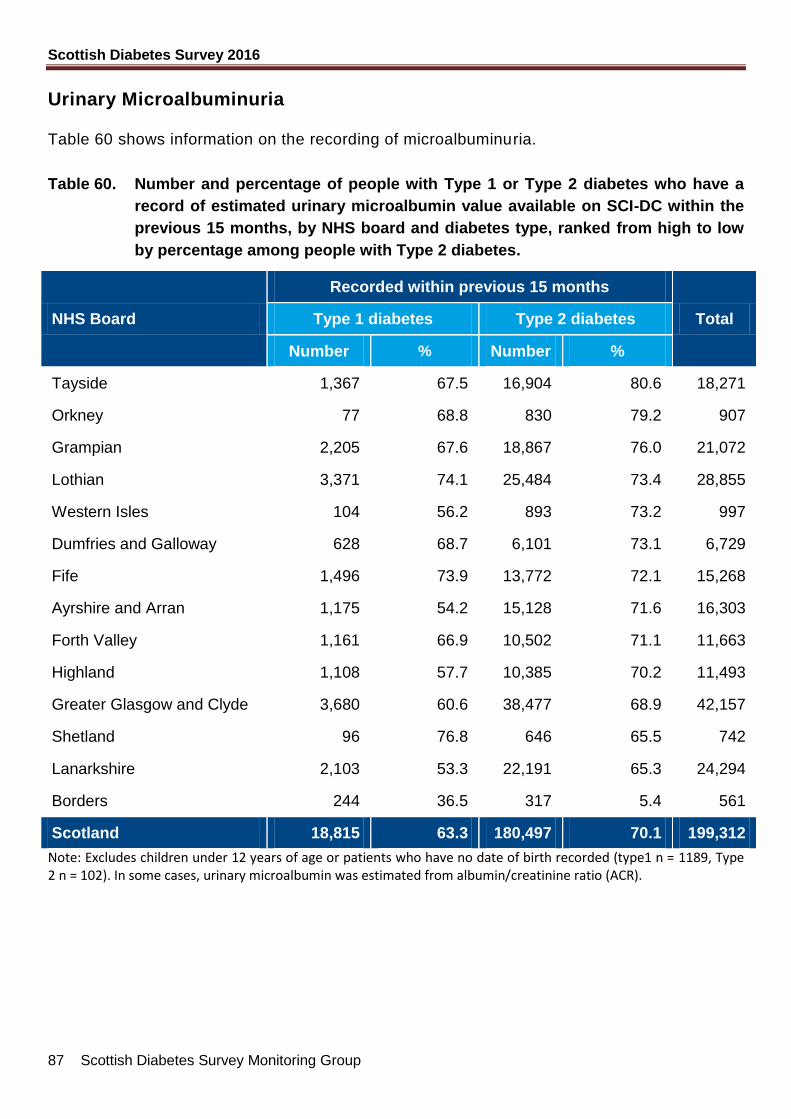
Scottish Diabetes Survey 2016
87 Scottish Diabetes Survey Monitoring Group
Urinary Microalbuminuria
Table 60 shows information on the recording of microalbuminuria.
Table 60. Number and percentage of people with Type 1 or Type 2 diabetes who have a
record of estimated urinary microalbumin value available on SCI-DC within the
previous 15 months, by NHS board and diabetes type, ranked from high to low
by percentage among people with Type 2 diabetes.
NHS Board
Recorded within previous 15 months
Total Type 1 diabetes Type 2 diabetes
Number % Number %
Tayside 1,367 67.5 16,904 80.6 18,271
Orkney 77 68.8 830 79.2 907
Grampian 2,205 67.6 18,867 76.0 21,072
Lothian 3,371 74.1 25,484 73.4 28,855
Western Isles 104 56.2 893 73.2 997
Dumfries and Galloway 628 68.7 6,101 73.1 6,729
Fife 1,496 73.9 13,772 72.1 15,268
Ayrshire and Arran 1,175 54.2 15,128 71.6 16,303
Forth Valley 1,161 66.9 10,502 71.1 11,663
Highland 1,108 57.7 10,385 70.2 11,493
Greater Glasgow and Clyde 3,680 60.6 38,477 68.9 42,157
Shetland 96 76.8 646 65.5 742
Lanarkshire 2,103 53.3 22,191 65.3 24,294
Borders 244 36.5 317 5.4 561
Scotland 18,815 63.3 180,497 70.1 199,312
Note: Excludes children under 12 years of age or patients who have no date of birth recorded (type1 n = 1189, Type 2 n = 102). In some cases, urinary microalbumin was estimated from albumin/creatinine ratio (ACR).
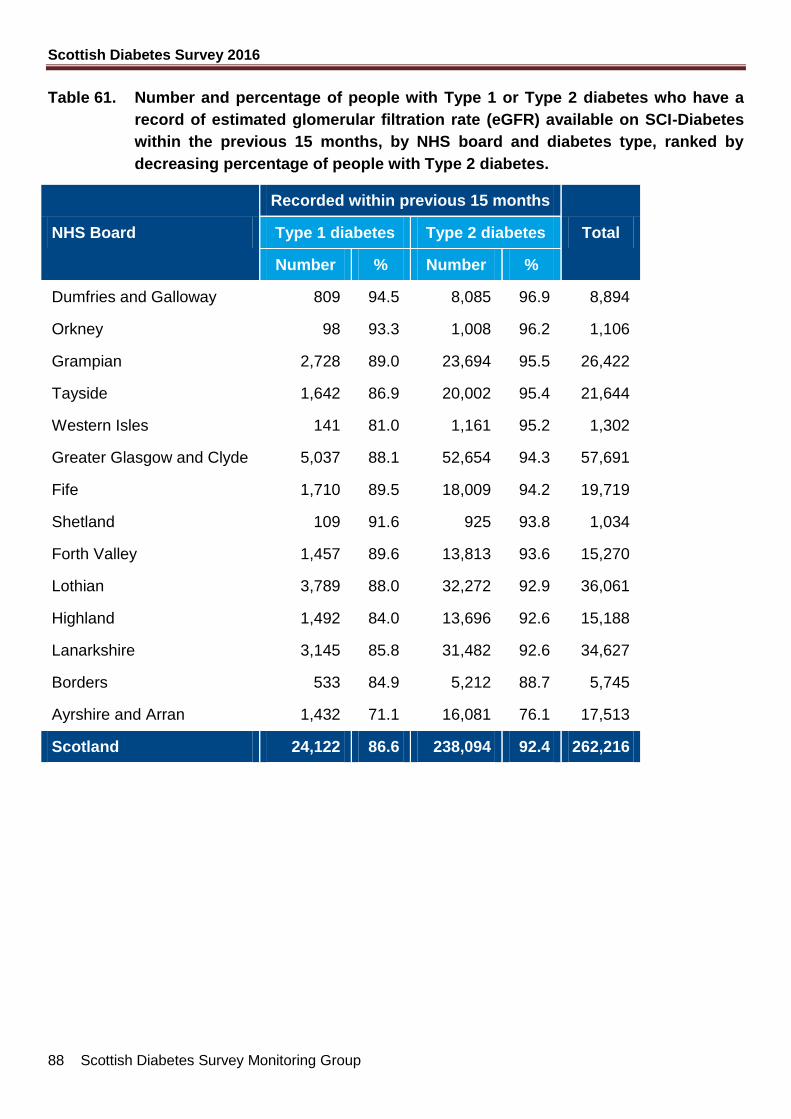
Scottish Diabetes Survey 2016
88 Scottish Diabetes Survey Monitoring Group
Table 61. Number and percentage of people with Type 1 or Type 2 diabetes who have a
record of estimated glomerular filtration rate (eGFR) available on SCI-Diabetes
within the previous 15 months, by NHS board and diabetes type, ranked by
decreasing percentage of people with Type 2 diabetes.
NHS Board
Recorded within previous 15 months
Total Type 1 diabetes Type 2 diabetes
Number % Number %
Dumfries and Galloway 809 94.5 8,085 96.9 8,894
Orkney 98 93.3 1,008 96.2 1,106
Grampian 2,728 89.0 23,694 95.5 26,422
Tayside 1,642 86.9 20,002 95.4 21,644
Western Isles 141 81.0 1,161 95.2 1,302
Greater Glasgow and Clyde 5,037 88.1 52,654 94.3 57,691
Fife 1,710 89.5 18,009 94.2 19,719
Shetland 109 91.6 925 93.8 1,034
Forth Valley 1,457 89.6 13,813 93.6 15,270
Lothian 3,789 88.0 32,272 92.9 36,061
Highland 1,492 84.0 13,696 92.6 15,188
Lanarkshire 3,145 85.8 31,482 92.6 34,627
Borders 533 84.9 5,212 88.7 5,745
Ayrshire and Arran 1,432 71.1 16,081 76.1 17,513
Scotland 24,122 86.6 238,094 92.4 262,216
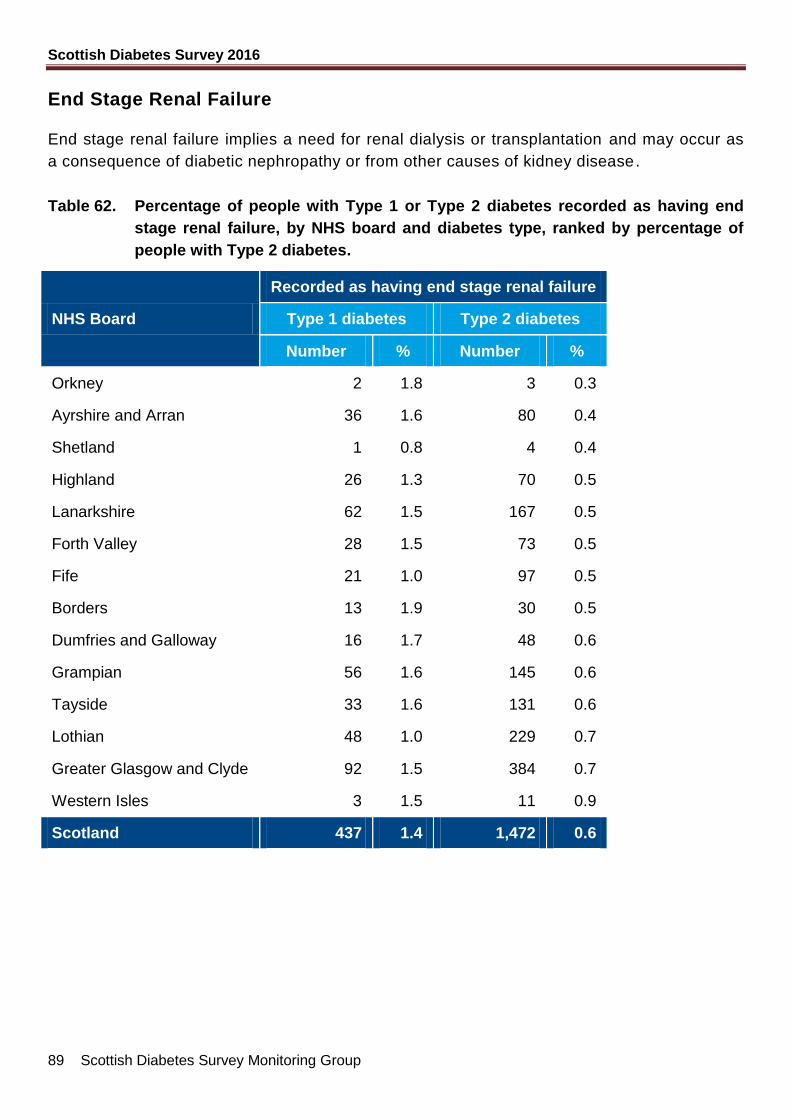
Scottish Diabetes Survey 2016
89 Scottish Diabetes Survey Monitoring Group
End Stage Renal Failure
End stage renal failure implies a need for renal dialysis or transplantation and may occur as
a consequence of diabetic nephropathy or from other causes of kidney disease.
Table 62. Percentage of people with Type 1 or Type 2 diabetes recorded as having end
stage renal failure, by NHS board and diabetes type, ranked by percentage of
people with Type 2 diabetes.
NHS Board
Recorded as having end stage renal failure
Type 1 diabetes Type 2 diabetes
Number % Number %
Orkney 2 1.8 3 0.3
Ayrshire and Arran 36 1.6 80 0.4
Shetland 1 0.8 4 0.4
Highland 26 1.3 70 0.5
Lanarkshire 62 1.5 167 0.5
Forth Valley 28 1.5 73 0.5
Fife 21 1.0 97 0.5
Borders 13 1.9 30 0.5
Dumfries and Galloway 16 1.7 48 0.6
Grampian 56 1.6 145 0.6
Tayside 33 1.6 131 0.6
Lothian 48 1.0 229 0.7
Greater Glasgow and Clyde 92 1.5 384 0.7
Western Isles 3 1.5 11 0.9
Scotland 437 1.4 1,472 0.6
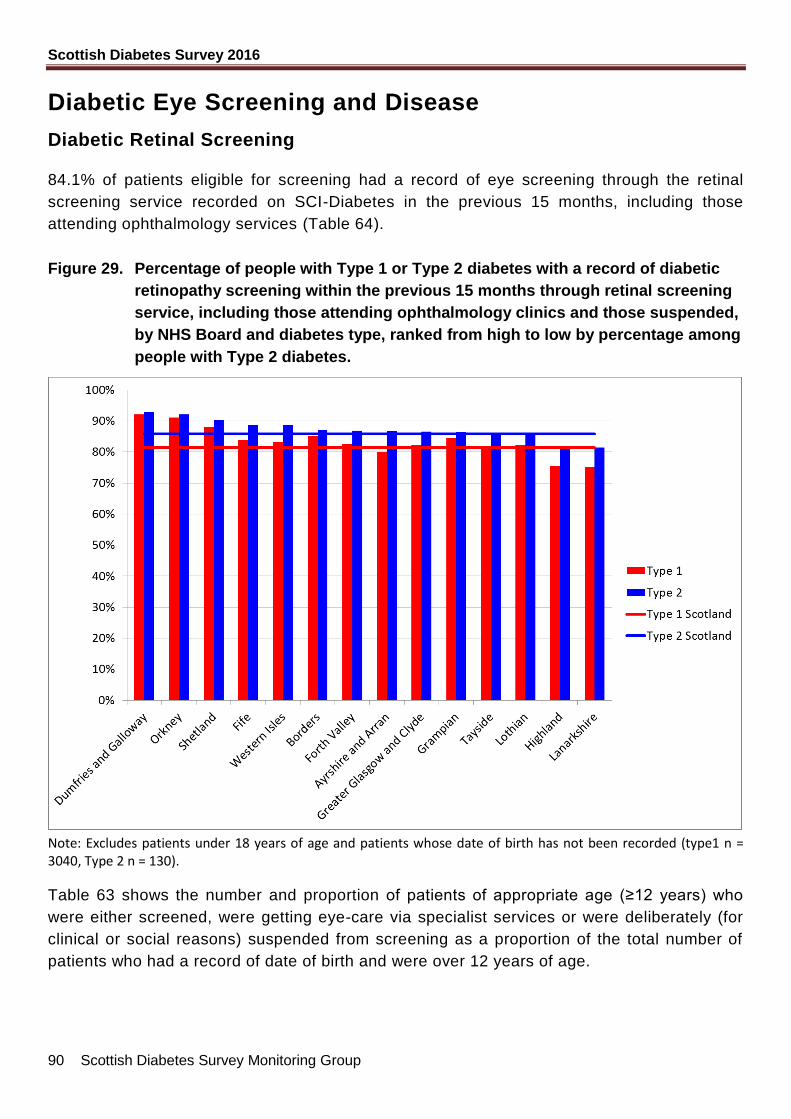
Scottish Diabetes Survey 2016
90 Scottish Diabetes Survey Monitoring Group
Diabetic Eye Screening and Disease
Diabetic Retinal Screening
84.1% of patients eligible for screening had a record of eye screening through the retinal
screening service recorded on SCI-Diabetes in the previous 15 months, including those
attending ophthalmology services (Table 64).
Figure 29. Percentage of people with Type 1 or Type 2 diabetes with a record of diabetic
retinopathy screening within the previous 15 months through retinal screening
service, including those attending ophthalmology clinics and those suspended,
by NHS Board and diabetes type, ranked from high to low by percentage among
people with Type 2 diabetes.
Note: Excludes patients under 18 years of age and patients whose date of birth has not been recorded (type1 n = 3040, Type 2 n = 130).
Table 63 shows the number and proportion of patients of appropriate age (≥12 years) who
were either screened, were getting eye-care via specialist services or were deliberately (for
clinical or social reasons) suspended from screening as a proportion of the total number of
patients who had a record of date of birth and were over 12 years of age.
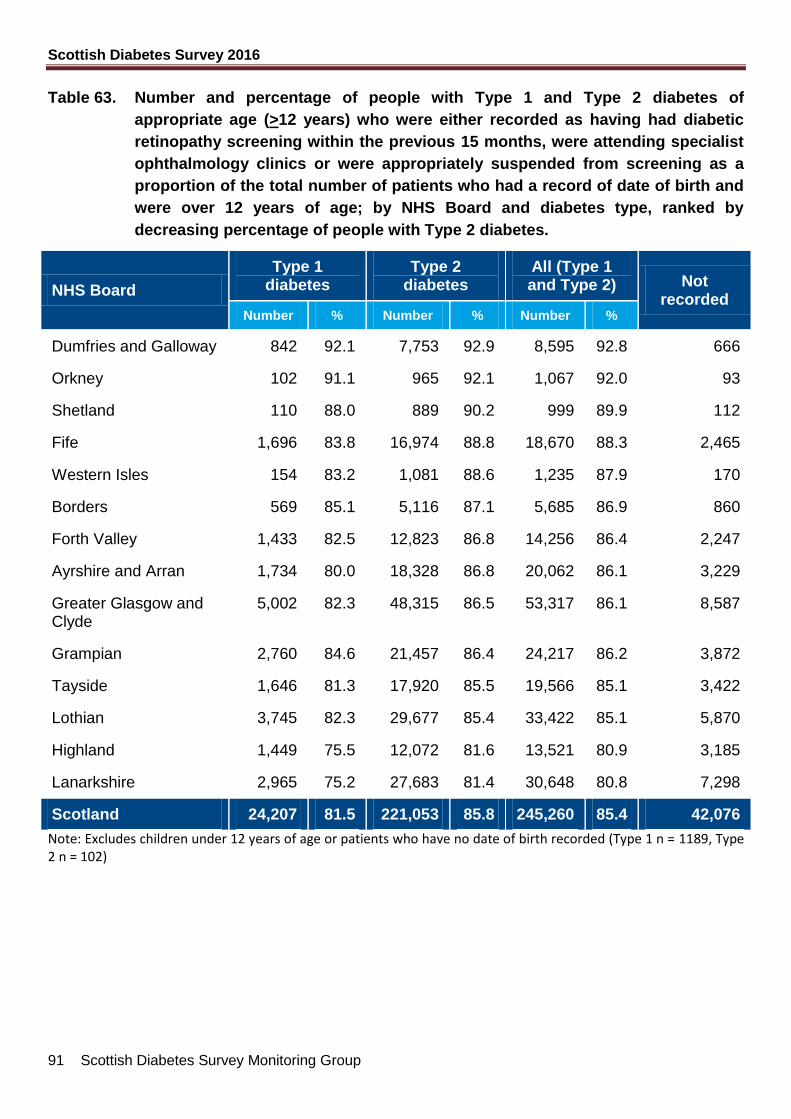
Scottish Diabetes Survey 2016
91 Scottish Diabetes Survey Monitoring Group
Table 63. Number and percentage of people with Type 1 and Type 2 diabetes of
appropriate age (>12 years) who were either recorded as having had diabetic
retinopathy screening within the previous 15 months, were attending specialist
ophthalmology clinics or were appropriately suspended from screening as a
proportion of the total number of patients who had a record of date of birth and
were over 12 years of age; by NHS Board and diabetes type, ranked by
decreasing percentage of people with Type 2 diabetes.
NHS Board
Type 1 diabetes
Type 2 diabetes
All (Type 1 and Type 2) Not
recorded Number % Number % Number %
Dumfries and Galloway 842 92.1 7,753 92.9 8,595 92.8 666
Orkney 102 91.1 965 92.1 1,067 92.0 93
Shetland 110 88.0 889 90.2 999 89.9 112
Fife 1,696 83.8 16,974 88.8 18,670 88.3 2,465
Western Isles 154 83.2 1,081 88.6 1,235 87.9 170
Borders 569 85.1 5,116 87.1 5,685 86.9 860
Forth Valley 1,433 82.5 12,823 86.8 14,256 86.4 2,247
Ayrshire and Arran 1,734 80.0 18,328 86.8 20,062 86.1 3,229
Greater Glasgow and Clyde
5,002 82.3 48,315 86.5 53,317 86.1 8,587
Grampian 2,760 84.6 21,457 86.4 24,217 86.2 3,872
Tayside 1,646 81.3 17,920 85.5 19,566 85.1 3,422
Lothian 3,745 82.3 29,677 85.4 33,422 85.1 5,870
Highland 1,449 75.5 12,072 81.6 13,521 80.9 3,185
Lanarkshire 2,965 75.2 27,683 81.4 30,648 80.8 7,298
Scotland 24,207 81.5 221,053 85.8 245,260 85.4 42,076
Note: Excludes children under 12 years of age or patients who have no date of birth recorded (Type 1 n = 1189, Type 2 n = 102)
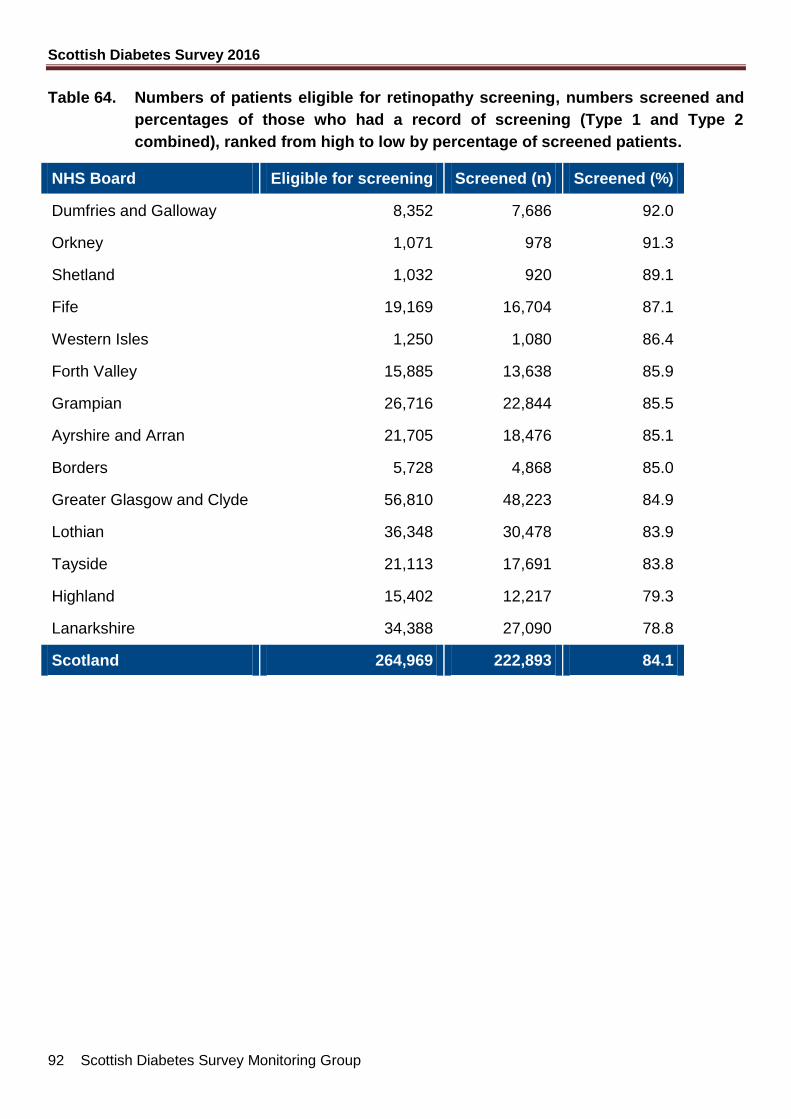
Scottish Diabetes Survey 2016
92 Scottish Diabetes Survey Monitoring Group
Table 64. Numbers of patients eligible for retinopathy screening, numbers screened and
percentages of those who had a record of screening (Type 1 and Type 2
combined), ranked from high to low by percentage of screened patients.
NHS Board Eligible for screening Screened (n) Screened (%)
Dumfries and Galloway 8,352 7,686 92.0
Orkney 1,071 978 91.3
Shetland 1,032 920 89.1
Fife 19,169 16,704 87.1
Western Isles 1,250 1,080 86.4
Forth Valley 15,885 13,638 85.9
Grampian 26,716 22,844 85.5
Ayrshire and Arran 21,705 18,476 85.1
Borders 5,728 4,868 85.0
Greater Glasgow and Clyde 56,810 48,223 84.9
Lothian 36,348 30,478 83.9
Tayside 21,113 17,691 83.8
Highland 15,402 12,217 79.3
Lanarkshire 34,388 27,090 78.8
Scotland 264,969 222,893 84.1
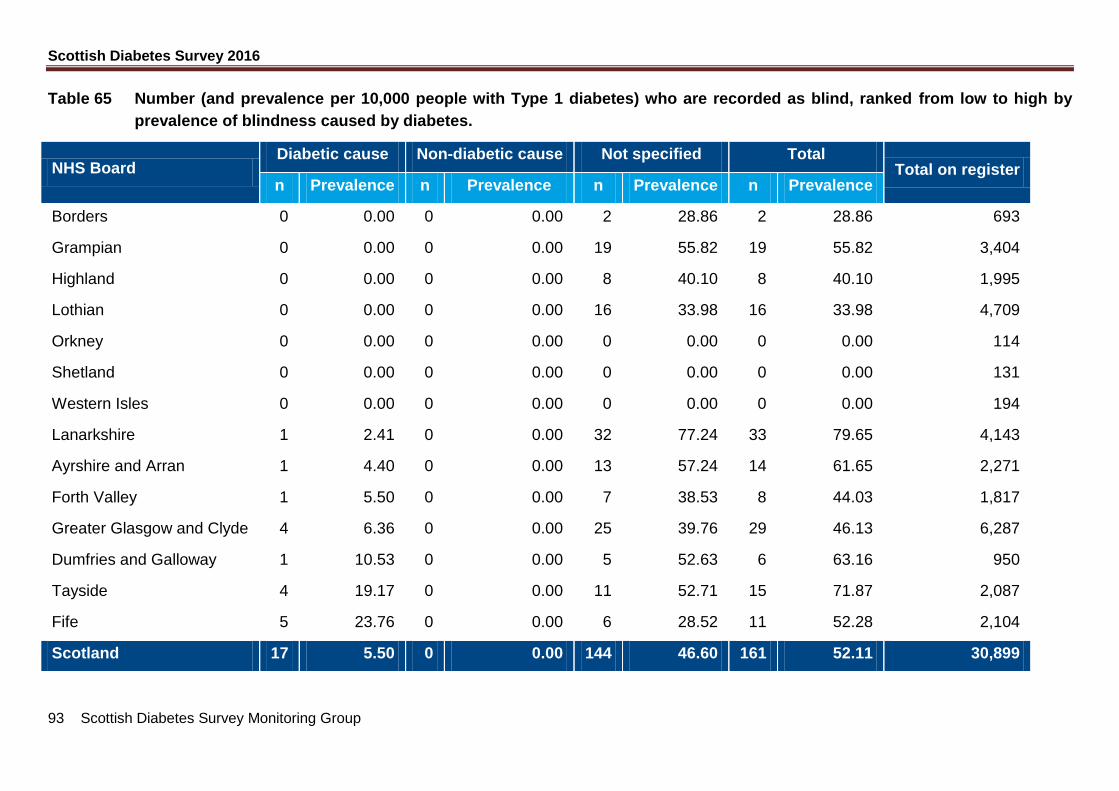
Scottish Diabetes Survey 2016
93 Scottish Diabetes Survey Monitoring Group
Table 65 Number (and prevalence per 10,000 people with Type 1 diabetes) who are recorded as blind, ranked from low to high by
prevalence of blindness caused by diabetes.
NHS Board Diabetic cause Non-diabetic cause Not specified Total
Total on register n Prevalence n Prevalence n Prevalence n Prevalence
Borders 0 0.00 0 0.00 2 28.86 2 28.86 693
Grampian 0 0.00 0 0.00 19 55.82 19 55.82 3,404
Highland 0 0.00 0 0.00 8 40.10 8 40.10 1,995
Lothian 0 0.00 0 0.00 16 33.98 16 33.98 4,709
Orkney 0 0.00 0 0.00 0 0.00 0 0.00 114
Shetland 0 0.00 0 0.00 0 0.00 0 0.00 131
Western Isles 0 0.00 0 0.00 0 0.00 0 0.00 194
Lanarkshire 1 2.41 0 0.00 32 77.24 33 79.65 4,143
Ayrshire and Arran 1 4.40 0 0.00 13 57.24 14 61.65 2,271
Forth Valley 1 5.50 0 0.00 7 38.53 8 44.03 1,817
Greater Glasgow and Clyde 4 6.36 0 0.00 25 39.76 29 46.13 6,287
Dumfries and Galloway 1 10.53 0 0.00 5 52.63 6 63.16 950
Tayside 4 19.17 0 0.00 11 52.71 15 71.87 2,087
Fife 5 23.76 0 0.00 6 28.52 11 52.28 2,104
Scotland 17 5.50 0 0.00 144 46.60 161 52.11 30,899
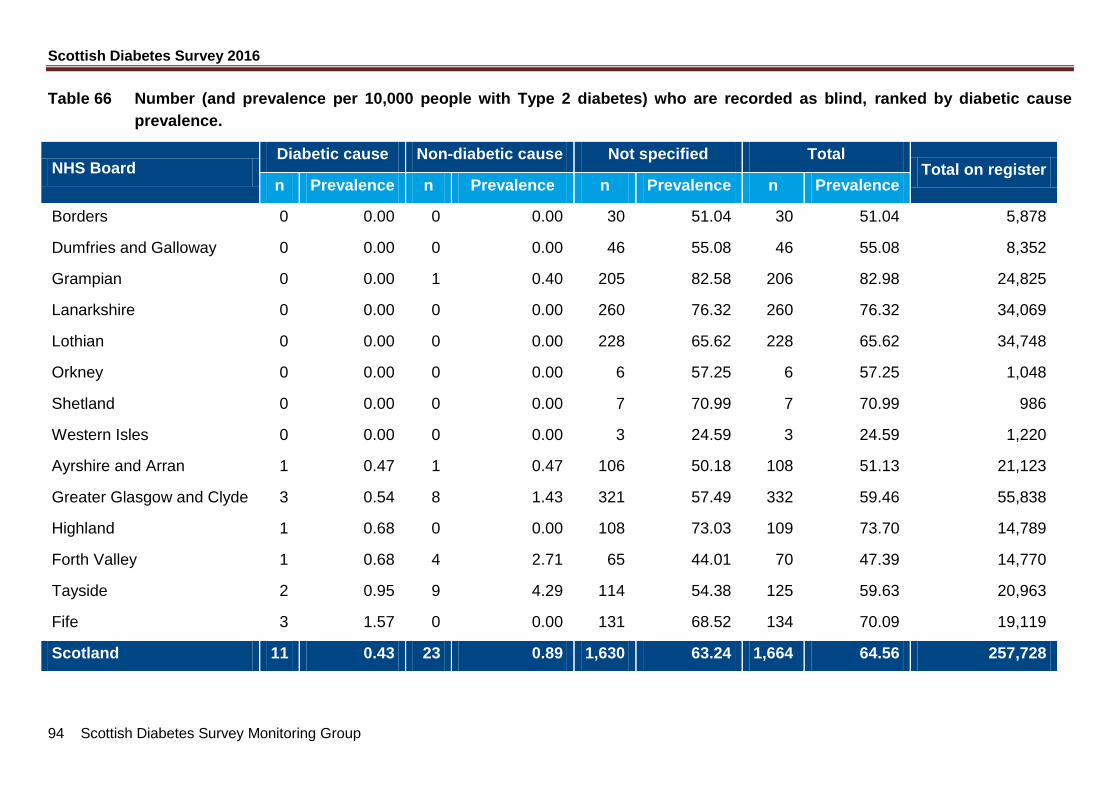
Scottish Diabetes Survey 2016
94 Scottish Diabetes Survey Monitoring Group
Table 66 Number (and prevalence per 10,000 people with Type 2 diabetes) who are recorded as blind, ranked by diabetic cause
prevalence.
NHS Board Diabetic cause Non-diabetic cause Not specified Total
Total on register n Prevalence n Prevalence n Prevalence n Prevalence
Borders 0 0.00 0 0.00 30 51.04 30 51.04 5,878
Dumfries and Galloway 0 0.00 0 0.00 46 55.08 46 55.08 8,352
Grampian 0 0.00 1 0.40 205 82.58 206 82.98 24,825
Lanarkshire 0 0.00 0 0.00 260 76.32 260 76.32 34,069
Lothian 0 0.00 0 0.00 228 65.62 228 65.62 34,748
Orkney 0 0.00 0 0.00 6 57.25 6 57.25 1,048
Shetland 0 0.00 0 0.00 7 70.99 7 70.99 986
Western Isles 0 0.00 0 0.00 3 24.59 3 24.59 1,220
Ayrshire and Arran 1 0.47 1 0.47 106 50.18 108 51.13 21,123
Greater Glasgow and Clyde 3 0.54 8 1.43 321 57.49 332 59.46 55,838
Highland 1 0.68 0 0.00 108 73.03 109 73.70 14,789
Forth Valley 1 0.68 4 2.71 65 44.01 70 47.39 14,770
Tayside 2 0.95 9 4.29 114 54.38 125 59.63 20,963
Fife 3 1.57 0 0.00 131 68.52 134 70.09 19,119
Scotland 11 0.43 23 0.89 1,630 63.24 1,664 64.56 257,728

Scottish Diabetes Survey 2016
95 Scottish Diabetes Survey Monitoring Group
Table 67. Percentage of people with diabetes (Type 1 and Type 2 combined) who were
recorded as having had eye-screening, ophthalmology care or an appropriate
suspension from screening (depending on methodology at the time of the
report).
Year Recorded within previous 15 months (%)
2016 85.4
2015 85.8
2014 86.5
2013 86.8
2012 86.1
2011 85.6
2010 85.1
2009 80.6
2008 71.9
2007 83.6
Note: Excludes children under 12 years or patients who have no date of birth recorded (Type 1 n = 1189, Type 2 n = 102). 2008 data is taken only from digital imaging via Diabetes Retinopathy Screening. In 2007, data from any form of screening was acceptable.
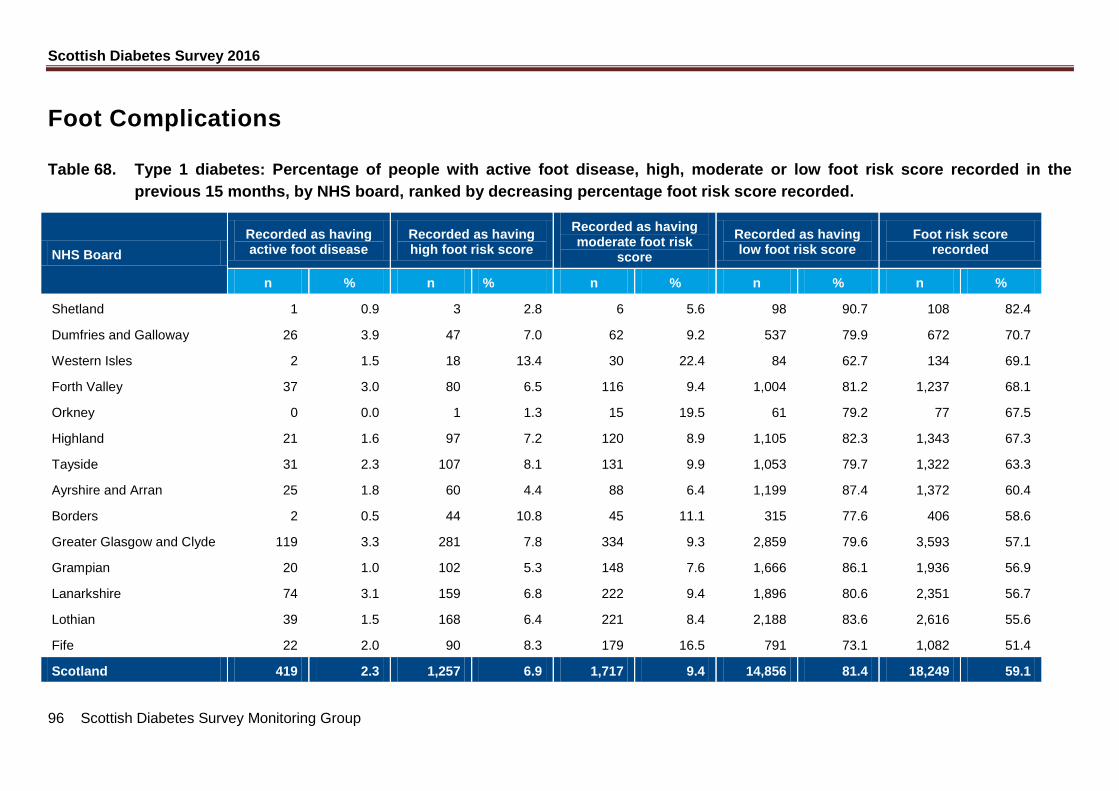
Scottish Diabetes Survey 2016
96 Scottish Diabetes Survey Monitoring Group
Foot Complications
Table 68. Type 1 diabetes: Percentage of people with active foot disease, high, moderate or low foot risk score recorded in the
previous 15 months, by NHS board, ranked by decreasing percentage foot risk score recorded.
NHS Board
Recorded as having active foot disease
Recorded as having high foot risk score
Recorded as having moderate foot risk
score
Recorded as having low foot risk score
Foot risk score recorded
n % n % n % n % n %
Shetland 1 0.9 3 2.8 6 5.6 98 90.7 108 82.4
Dumfries and Galloway 26 3.9 47 7.0 62 9.2 537 79.9 672 70.7
Western Isles 2 1.5 18 13.4 30 22.4 84 62.7 134 69.1
Forth Valley 37 3.0 80 6.5 116 9.4 1,004 81.2 1,237 68.1
Orkney 0 0.0 1 1.3 15 19.5 61 79.2 77 67.5
Highland 21 1.6 97 7.2 120 8.9 1,105 82.3 1,343 67.3
Tayside 31 2.3 107 8.1 131 9.9 1,053 79.7 1,322 63.3
Ayrshire and Arran 25 1.8 60 4.4 88 6.4 1,199 87.4 1,372 60.4
Borders 2 0.5 44 10.8 45 11.1 315 77.6 406 58.6
Greater Glasgow and Clyde 119 3.3 281 7.8 334 9.3 2,859 79.6 3,593 57.1
Grampian 20 1.0 102 5.3 148 7.6 1,666 86.1 1,936 56.9
Lanarkshire 74 3.1 159 6.8 222 9.4 1,896 80.6 2,351 56.7
Lothian 39 1.5 168 6.4 221 8.4 2,188 83.6 2,616 55.6
Fife 22 2.0 90 8.3 179 16.5 791 73.1 1,082 51.4
Scotland 419 2.3 1,257 6.9 1,717 9.4 14,856 81.4 18,249 59.1
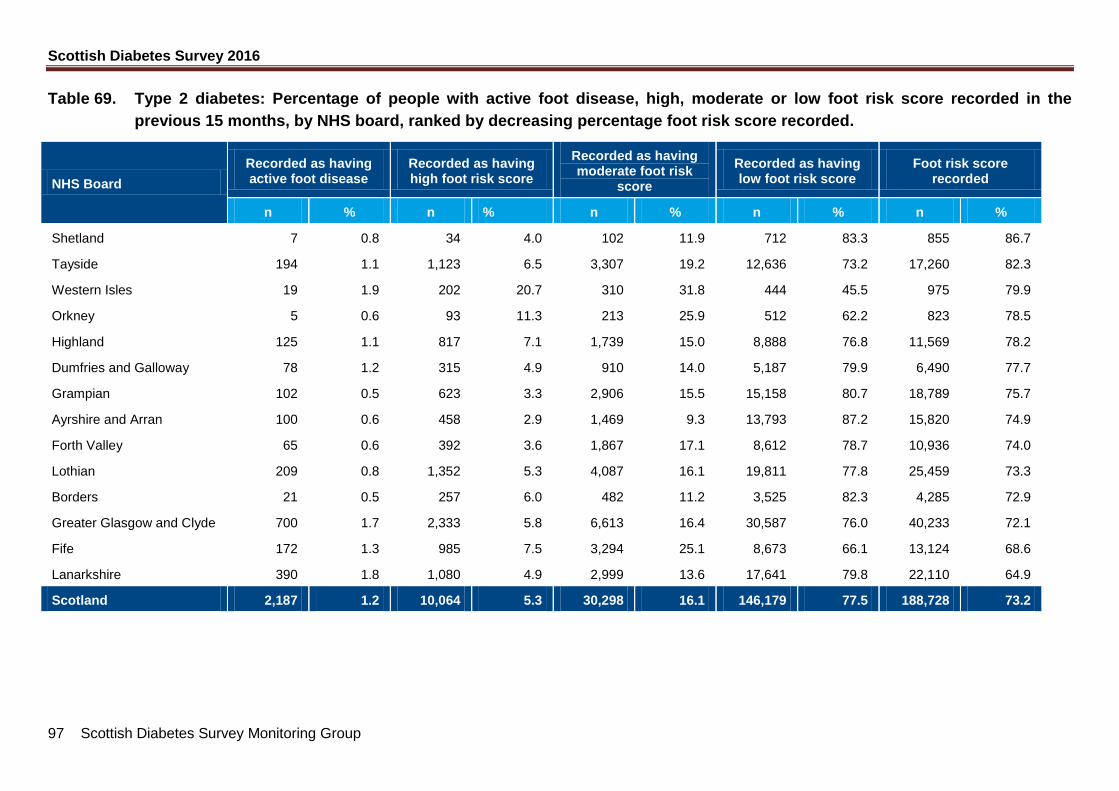
Scottish Diabetes Survey 2016
97 Scottish Diabetes Survey Monitoring Group
Table 69. Type 2 diabetes: Percentage of people with active foot disease, high, moderate or low foot risk score recorded in the
previous 15 months, by NHS board, ranked by decreasing percentage foot risk score recorded.
NHS Board
Recorded as having active foot disease
Recorded as having high foot risk score
Recorded as having moderate foot risk
score
Recorded as having low foot risk score
Foot risk score recorded
n % n % n % n % n %
Shetland 7 0.8 34 4.0 102 11.9 712 83.3 855 86.7
Tayside 194 1.1 1,123 6.5 3,307 19.2 12,636 73.2 17,260 82.3
Western Isles 19 1.9 202 20.7 310 31.8 444 45.5 975 79.9
Orkney 5 0.6 93 11.3 213 25.9 512 62.2 823 78.5
Highland 125 1.1 817 7.1 1,739 15.0 8,888 76.8 11,569 78.2
Dumfries and Galloway 78 1.2 315 4.9 910 14.0 5,187 79.9 6,490 77.7
Grampian 102 0.5 623 3.3 2,906 15.5 15,158 80.7 18,789 75.7
Ayrshire and Arran 100 0.6 458 2.9 1,469 9.3 13,793 87.2 15,820 74.9
Forth Valley 65 0.6 392 3.6 1,867 17.1 8,612 78.7 10,936 74.0
Lothian 209 0.8 1,352 5.3 4,087 16.1 19,811 77.8 25,459 73.3
Borders 21 0.5 257 6.0 482 11.2 3,525 82.3 4,285 72.9
Greater Glasgow and Clyde 700 1.7 2,333 5.8 6,613 16.4 30,587 76.0 40,233 72.1
Fife 172 1.3 985 7.5 3,294 25.1 8,673 66.1 13,124 68.6
Lanarkshire 390 1.8 1,080 4.9 2,999 13.6 17,641 79.8 22,110 64.9
Scotland 2,187 1.2 10,064 5.3 30,298 16.1 146,179 77.5 188,728 73.2
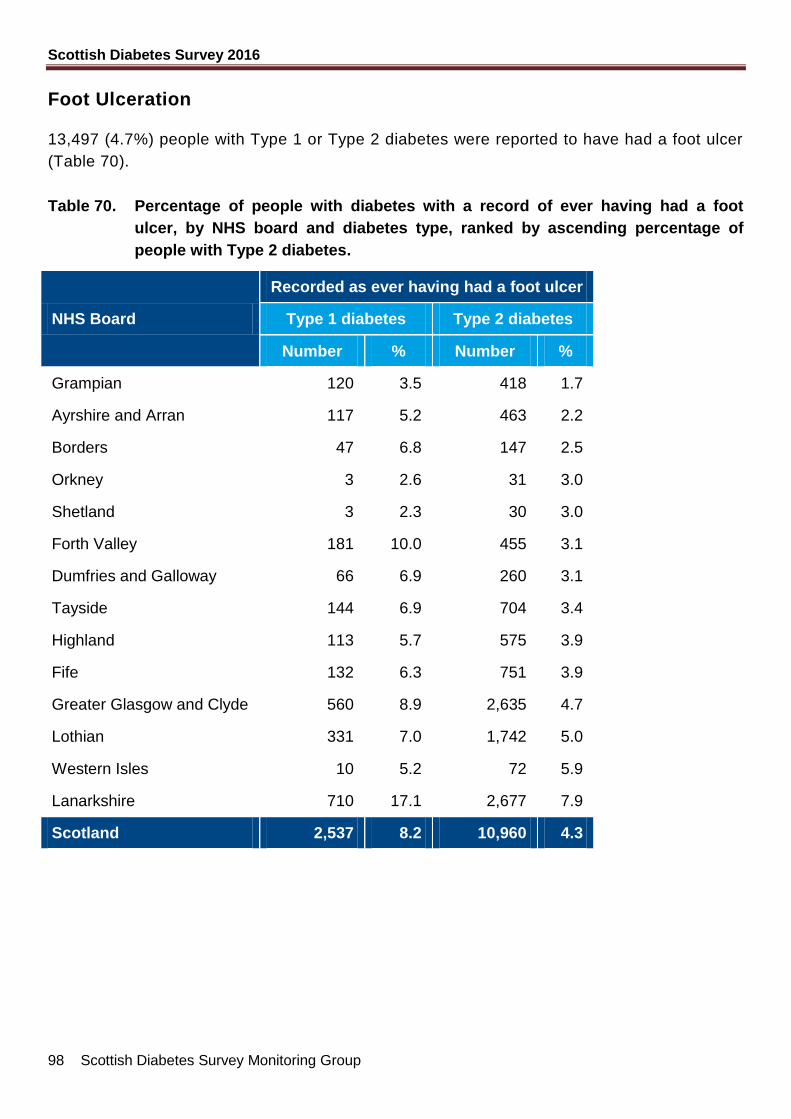
Scottish Diabetes Survey 2016
98 Scottish Diabetes Survey Monitoring Group
Foot Ulceration
13,497 (4.7%) people with Type 1 or Type 2 diabetes were reported to have had a foot ulcer
(Table 70).
Table 70. Percentage of people with diabetes with a record of ever having had a foot
ulcer, by NHS board and diabetes type, ranked by ascending percentage of
people with Type 2 diabetes.
NHS Board
Recorded as ever having had a foot ulcer
Type 1 diabetes Type 2 diabetes
Number % Number %
Grampian 120 3.5 418 1.7
Ayrshire and Arran 117 5.2 463 2.2
Borders 47 6.8 147 2.5
Orkney 3 2.6 31 3.0
Shetland 3 2.3 30 3.0
Forth Valley 181 10.0 455 3.1
Dumfries and Galloway 66 6.9 260 3.1
Tayside 144 6.9 704 3.4
Highland 113 5.7 575 3.9
Fife 132 6.3 751 3.9
Greater Glasgow and Clyde 560 8.9 2,635 4.7
Lothian 331 7.0 1,742 5.0
Western Isles 10 5.2 72 5.9
Lanarkshire 710 17.1 2,677 7.9
Scotland 2,537 8.2 10,960 4.3
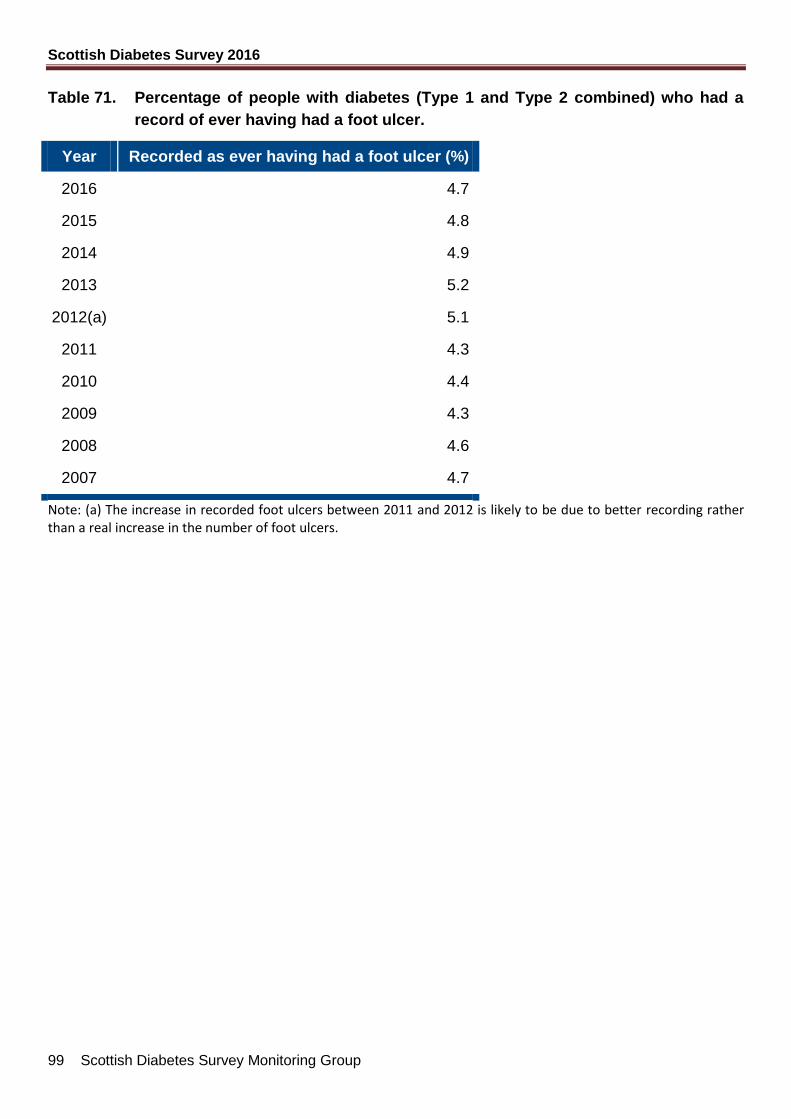
Scottish Diabetes Survey 2016
99 Scottish Diabetes Survey Monitoring Group
Table 71. Percentage of people with diabetes (Type 1 and Type 2 combined) who had a
record of ever having had a foot ulcer.
Year Recorded as ever having had a foot ulcer (%)
2016 4.7
2015 4.8
2014 4.9
2013 5.2
2012(a) 5.1
2011 4.3
2010 4.4
2009 4.3
2008 4.6
2007 4.7
Note: (a) The increase in recorded foot ulcers between 2011 and 2012 is likely to be due to better recording rather than a real increase in the number of foot ulcers.
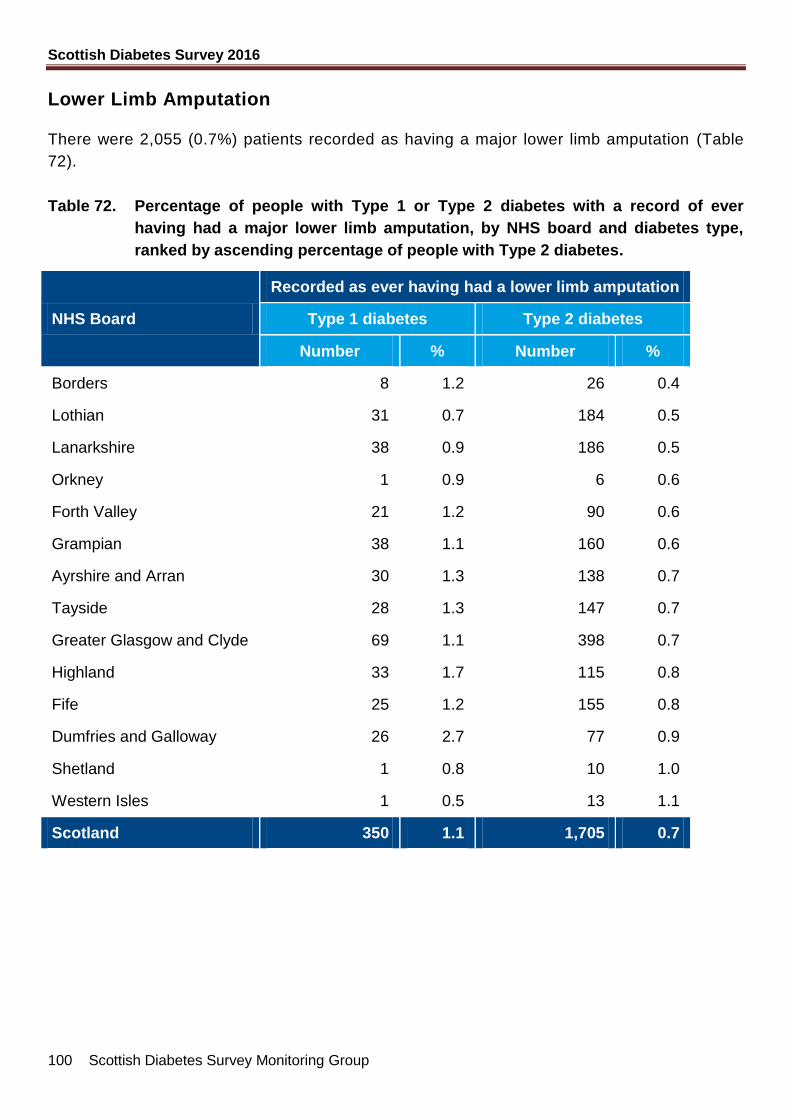
Scottish Diabetes Survey 2016
100 Scottish Diabetes Survey Monitoring Group
Lower Limb Amputation
There were 2,055 (0.7%) patients recorded as having a major lower limb amputation (Table
72).
Table 72. Percentage of people with Type 1 or Type 2 diabetes with a record of ever
having had a major lower limb amputation, by NHS board and diabetes type,
ranked by ascending percentage of people with Type 2 diabetes.
NHS Board
Recorded as ever having had a lower limb amputation
Type 1 diabetes Type 2 diabetes
Number % Number %
Borders 8 1.2 26 0.4
Lothian 31 0.7 184 0.5
Lanarkshire 38 0.9 186 0.5
Orkney 1 0.9 6 0.6
Forth Valley 21 1.2 90 0.6
Grampian 38 1.1 160 0.6
Ayrshire and Arran 30 1.3 138 0.7
Tayside 28 1.3 147 0.7
Greater Glasgow and Clyde 69 1.1 398 0.7
Highland 33 1.7 115 0.8
Fife 25 1.2 155 0.8
Dumfries and Galloway 26 2.7 77 0.9
Shetland 1 0.8 10 1.0
Western Isles 1 0.5 13 1.1
Scotland 350 1.1 1,705 0.7
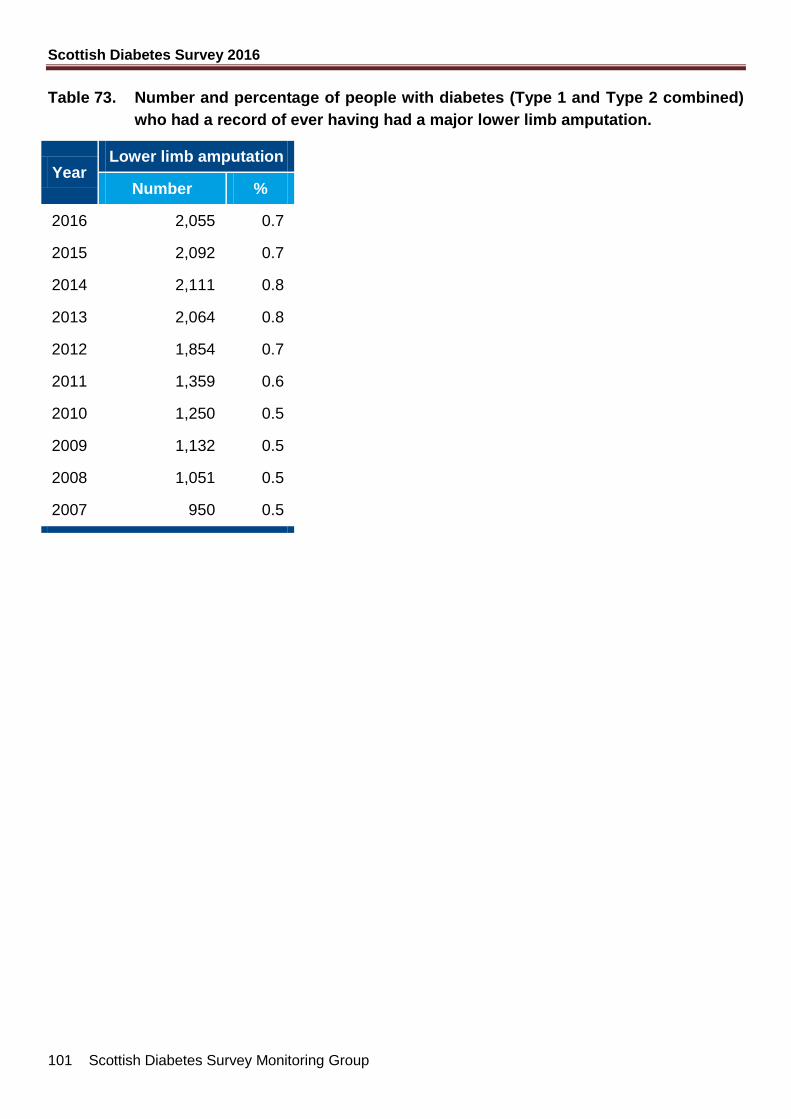
Scottish Diabetes Survey 2016
101 Scottish Diabetes Survey Monitoring Group
Table 73. Number and percentage of people with diabetes (Type 1 and Type 2 combined)
who had a record of ever having had a major lower limb amputation.
Year Lower limb amputation
Number %
2016 2,055 0.7
2015 2,092 0.7
2014 2,111 0.8
2013 2,064 0.8
2012 1,854 0.7
2011 1,359 0.6
2010 1,250 0.5
2009 1,132 0.5
2008 1,051 0.5
2007 950 0.5

Scottish Diabetes Survey 2016
102 Scottish Diabetes Survey Monitoring Group
Other Statistics
My Diabetes My Way
“My Diabetes My Way” (www.mydiabetesmyway.scot.nhs.uk) is the NHS Scotland interactive
diabetes website that helps to support people who have diabetes and their carers. The table
below shows the number of people who had registered to access their own clinical
information using the website by the end of 2016. Records access is a key objective of the
Scottish Diabetes Improvement Plan.
Table 74. Numbers of people with Type 1 and Type 2 diabetes registered to access their
clinical information using the “My Diabetes My Way” website by NHS Board
ordered by decreasing total percentage of registered users.
NHS Board Type 1 Type 2 Total
n Pop. % n Pop. % n Pop. %
Lothian 1,855 4,709 39.4 2,688 34,748 7.7 4,543 39457 11.5
Shetland 35 131 26.7 85 986 8.6 120 1117 10.7
Forth Valley 768 1,817 42.3 928 14,770 6.3 1,696 16587 10.2
Tayside 444 2,087 21.3 1,864 20,963 8.9 2,308 23050 10.0
Greater Glasgow and Clyde
2,021 6,287 32.1 4,071 55,838 7.3 6,092 62125 9.8
Western Isles 38 194 19.6 89 1,220 7.3 127 1414 9.0
Lanarkshire 1,361 4,143 32.9 1,844 34,069 5.4 3,205 38212 8.4
Fife 441 2,104 21.0 1,228 19,119 6.4 1,669 21223 7.9
Dumfries and Galloway
182 950 19.2 409 8,352 4.9 591 9302 6.4
Ayrshire and Arran 421 2,271 18.5 1,039 21,123 4.9 1,460 23394 6.2
Borders 118 693 17.0 287 5,878 4.9 405 6571 6.2
Highland 371 1,995 18.6 580 14,789 3.9 951 16784 5.7
Orkney 34 114 29.8 29 1,048 2.8 63 1162 5.4
Grampian 481 3,404 14.1 544 24,825 2.2 1,025 28229 3.6
Scotland 8,570 30,899 27.7 15,685 257,728 6.1 24,255 288,627 8.4
Note: The above figures show the number of patients who had registered to access their diabetes data at the end of 2016. Registration may be initiated by the patient via the My Diabetes My Way website, or by a clinician using SCI-Diabetes. Following registration, a patient must provide their consent to proceed and verify their email address. At this stage, a username and password are emailed to the patient.
At the end of 2016, 11,840 patients had accessed their results using “My Diabetes My Way”.
During the final 3 months of 2016, a total of 4,750 (40.1% of active users) had logged in,
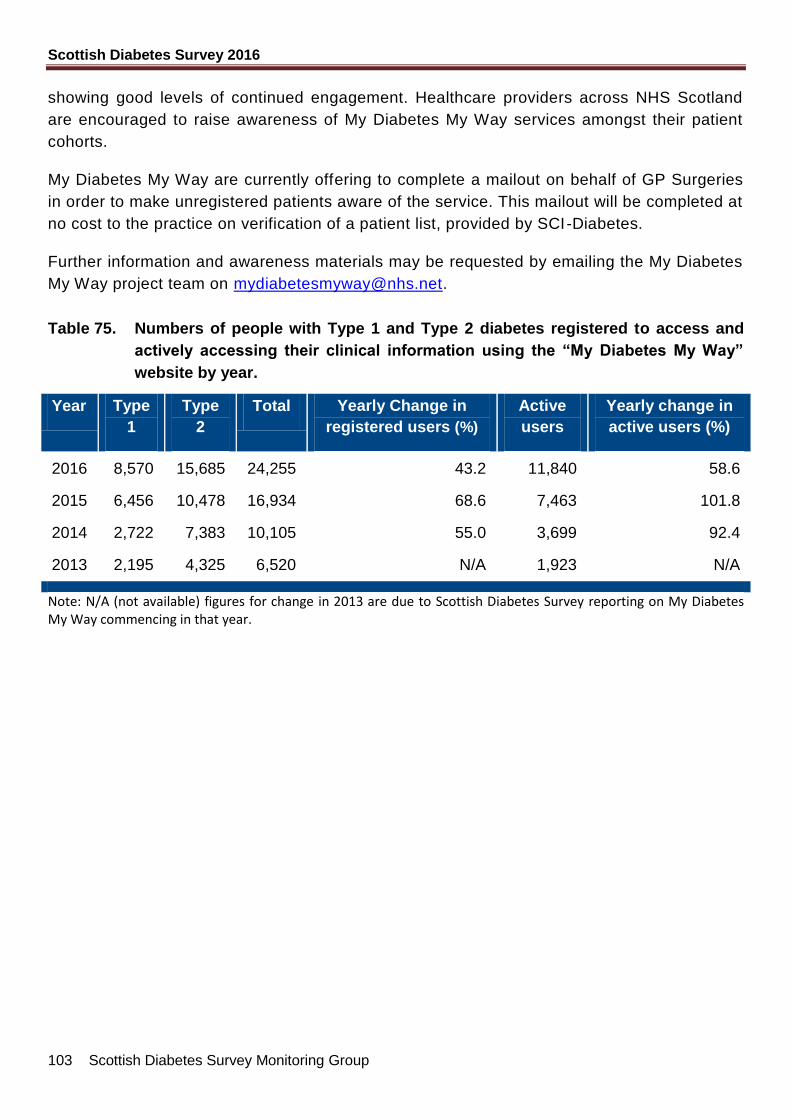
Scottish Diabetes Survey 2016
103 Scottish Diabetes Survey Monitoring Group
showing good levels of continued engagement. Healthcare providers across NHS Scotland
are encouraged to raise awareness of My Diabetes My Way services amongst their patient
cohorts.
My Diabetes My Way are currently offering to complete a mailout on behalf of GP Surgeries
in order to make unregistered patients aware of the service. This mailout will be completed at
no cost to the practice on verification of a patient list, provided by SCI-Diabetes.
Further information and awareness materials may be requested by emailing the My Diabetes
My Way project team on [email protected].
Table 75. Numbers of people with Type 1 and Type 2 diabetes registered to access and
actively accessing their clinical information using the “My Diabetes My Way”
website by year.
Year Type
1
Type
2
Total Yearly Change in
registered users (%)
Active
users
Yearly change in
active users (%)
2016 8,570 15,685 24,255 43.2 11,840 58.6
2015 6,456 10,478 16,934 68.6 7,463 101.8
2014 2,722 7,383 10,105 55.0 3,699 92.4
2013 2,195 4,325 6,520 N/A 1,923 N/A
Note: N/A (not available) figures for change in 2013 are due to Scottish Diabetes Survey reporting on My Diabetes My Way commencing in that year.
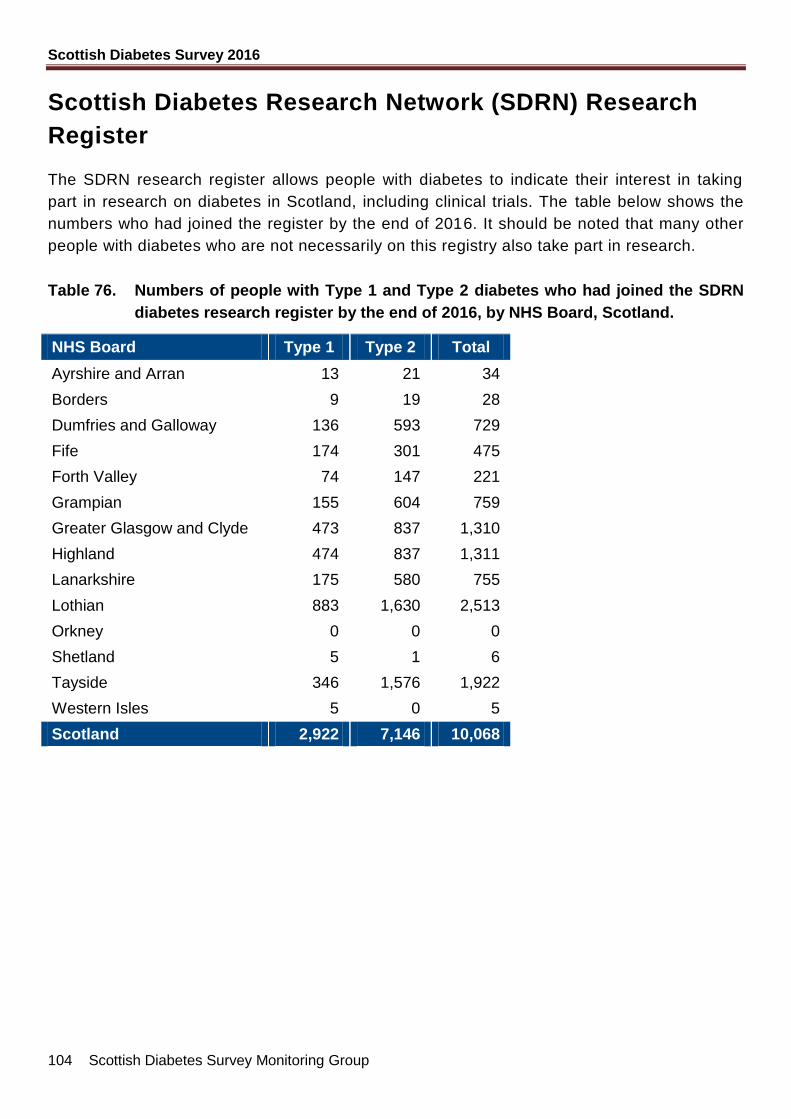
Scottish Diabetes Survey 2016
104 Scottish Diabetes Survey Monitoring Group
Scottish Diabetes Research Network (SDRN) Research
Register
The SDRN research register allows people with diabetes to indicate their interest in taking
part in research on diabetes in Scotland, including clinical trials. The table below shows the
numbers who had joined the register by the end of 2016. It should be noted that many other
people with diabetes who are not necessarily on this registry also take part in research.
Table 76. Numbers of people with Type 1 and Type 2 diabetes who had joined the SDRN
diabetes research register by the end of 2016, by NHS Board, Scotland.
NHS Board Type 1 Type 2 Total
Ayrshire and Arran 13 21 34
Borders 9 19 28
Dumfries and Galloway 136 593 729
Fife 174 301 475
Forth Valley 74 147 221
Grampian 155 604 759
Greater Glasgow and Clyde 473 837 1,310
Highland 474 837 1,311
Lanarkshire 175 580 755
Lothian 883 1,630 2,513
Orkney 0 0 0
Shetland 5 1 6
Tayside 346 1,576 1,922
Western Isles 5 0 5
Scotland 2,922 7,146 10,068
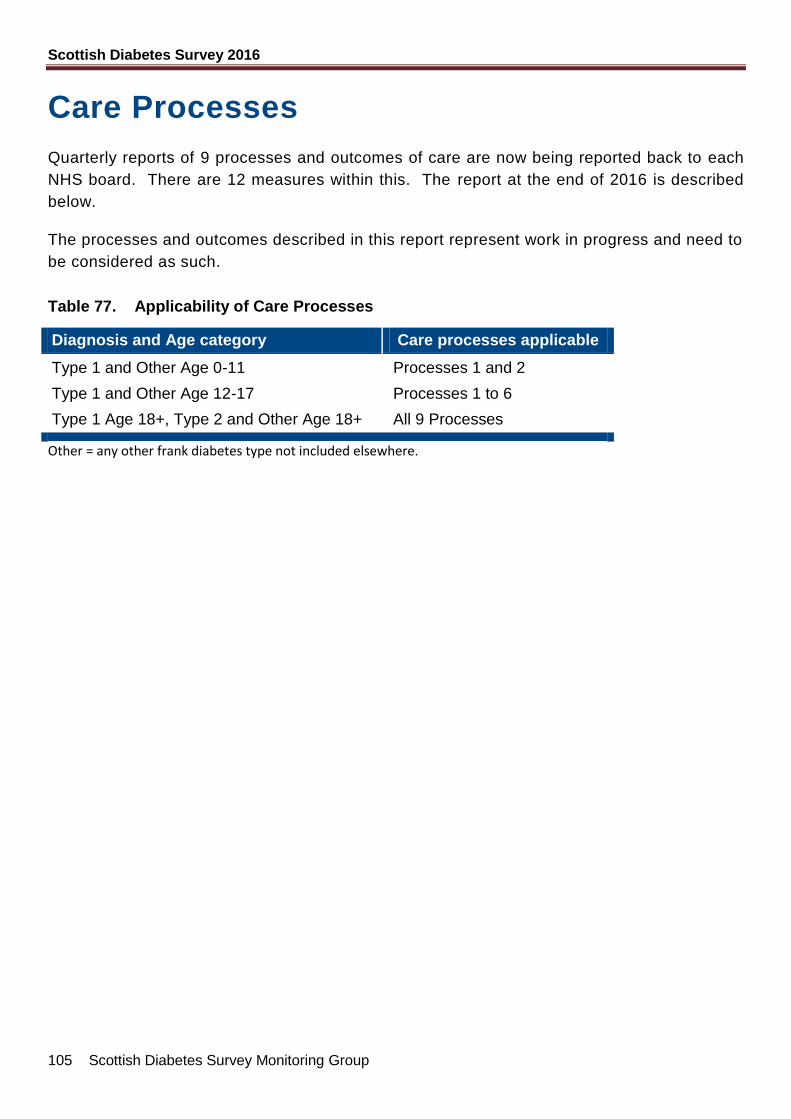
Scottish Diabetes Survey 2016
105 Scottish Diabetes Survey Monitoring Group
Care Processes
Quarterly reports of 9 processes and outcomes of care are now being reported back to each
NHS board. There are 12 measures within this. The report at the end of 2016 is described
below.
The processes and outcomes described in this report represent work in progress and need to
be considered as such.
Table 77. Applicability of Care Processes
Diagnosis and Age category Care processes applicable
Type 1 and Other Age 0-11 Processes 1 and 2
Type 1 and Other Age 12-17 Processes 1 to 6
Type 1 Age 18+, Type 2 and Other Age 18+ All 9 Processes
Other = any other frank diabetes type not included elsewhere.
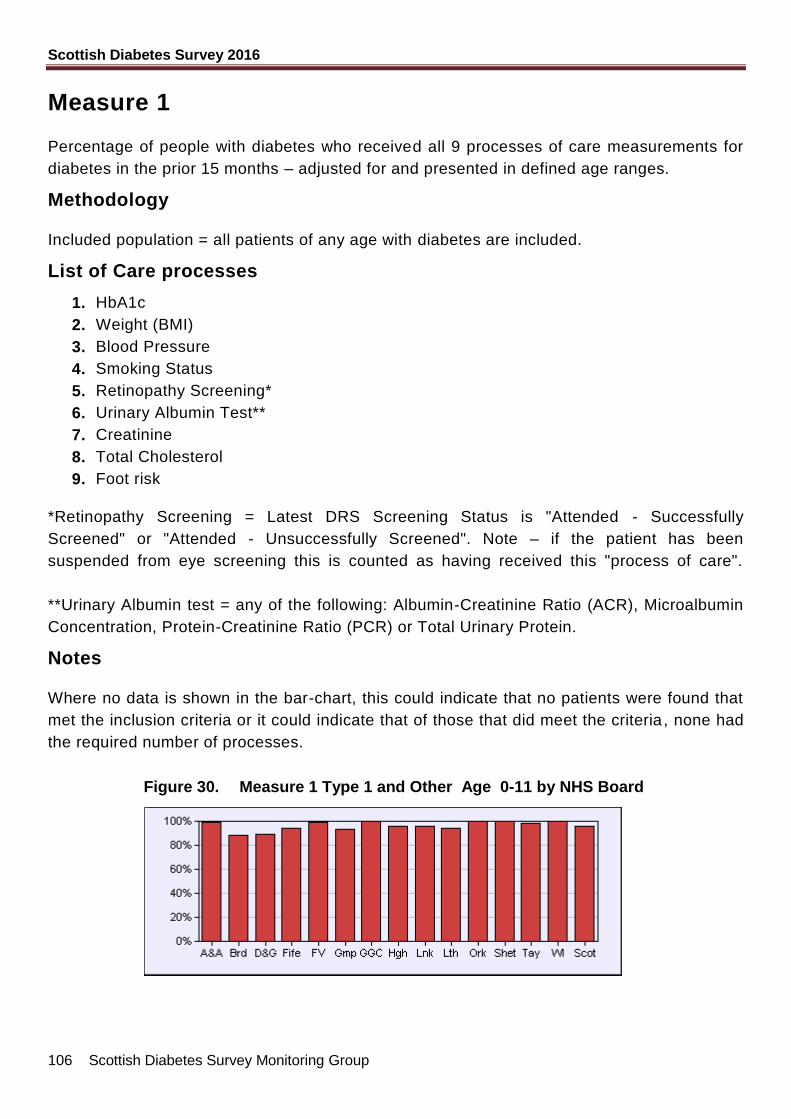
Scottish Diabetes Survey 2016
106 Scottish Diabetes Survey Monitoring Group
Measure 1
Percentage of people with diabetes who received all 9 processes of care measurements for
diabetes in the prior 15 months – adjusted for and presented in defined age ranges.
Methodology
Included population = all patients of any age with diabetes are included.
List of Care processes
1. HbA1c
2. Weight (BMI)
3. Blood Pressure
4. Smoking Status
5. Retinopathy Screening*
6. Urinary Albumin Test**
7. Creatinine
8. Total Cholesterol
9. Foot risk
*Retinopathy Screening = Latest DRS Screening Status is "Attended - Successfully
Screened" or "Attended - Unsuccessfully Screened". Note – if the patient has been
suspended from eye screening this is counted as having received this "process of care".
**Urinary Albumin test = any of the following: Albumin-Creatinine Ratio (ACR), Microalbumin
Concentration, Protein-Creatinine Ratio (PCR) or Total Urinary Protein.
Notes
Where no data is shown in the bar-chart, this could indicate that no patients were found that
met the inclusion criteria or it could indicate that of those that did meet the criteria , none had
the required number of processes.
Figure 30. Measure 1 Type 1 and Other Age 0-11 by NHS Board
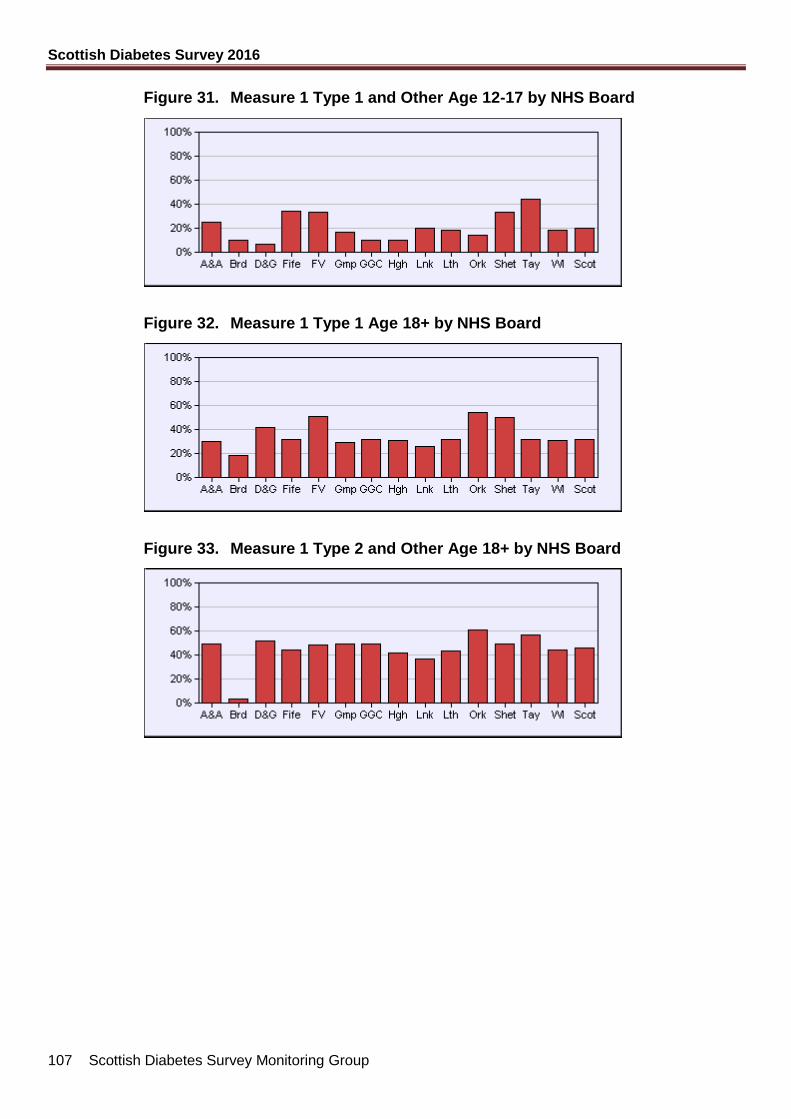
Scottish Diabetes Survey 2016
107 Scottish Diabetes Survey Monitoring Group
Figure 31. Measure 1 Type 1 and Other Age 12-17 by NHS Board
Figure 32. Measure 1 Type 1 Age 18+ by NHS Board
Figure 33. Measure 1 Type 2 and Other Age 18+ by NHS Board
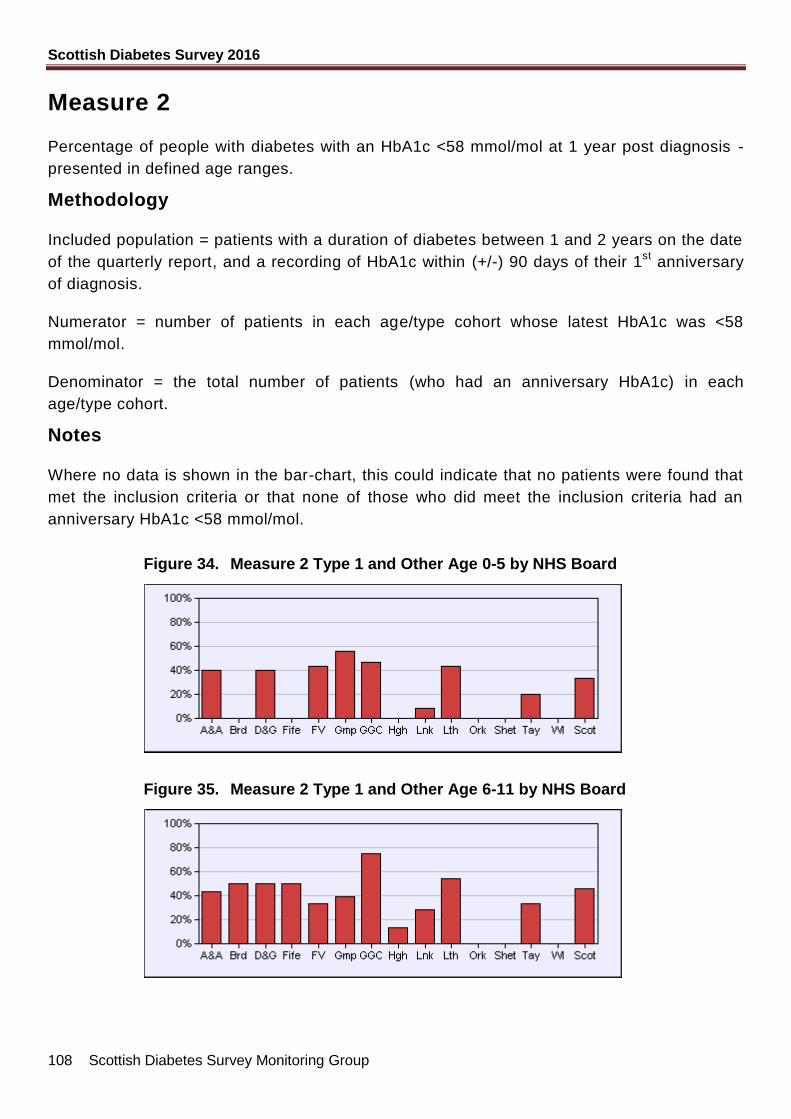
Scottish Diabetes Survey 2016
108 Scottish Diabetes Survey Monitoring Group
Measure 2
Percentage of people with diabetes with an HbA1c <58 mmol/mol at 1 year post diagnosis -
presented in defined age ranges.
Methodology
Included population = patients with a duration of diabetes between 1 and 2 years on the date
of the quarterly report, and a recording of HbA1c within (+/-) 90 days of their 1st
anniversary
of diagnosis.
Numerator = number of patients in each age/type cohort whose latest HbA1c was <58
mmol/mol.
Denominator = the total number of patients (who had an anniversary HbA1c) in each
age/type cohort.
Notes
Where no data is shown in the bar-chart, this could indicate that no patients were found that
met the inclusion criteria or that none of those who did meet the inclusion criteria had an
anniversary HbA1c <58 mmol/mol.
Figure 34. Measure 2 Type 1 and Other Age 0-5 by NHS Board
Figure 35. Measure 2 Type 1 and Other Age 6-11 by NHS Board
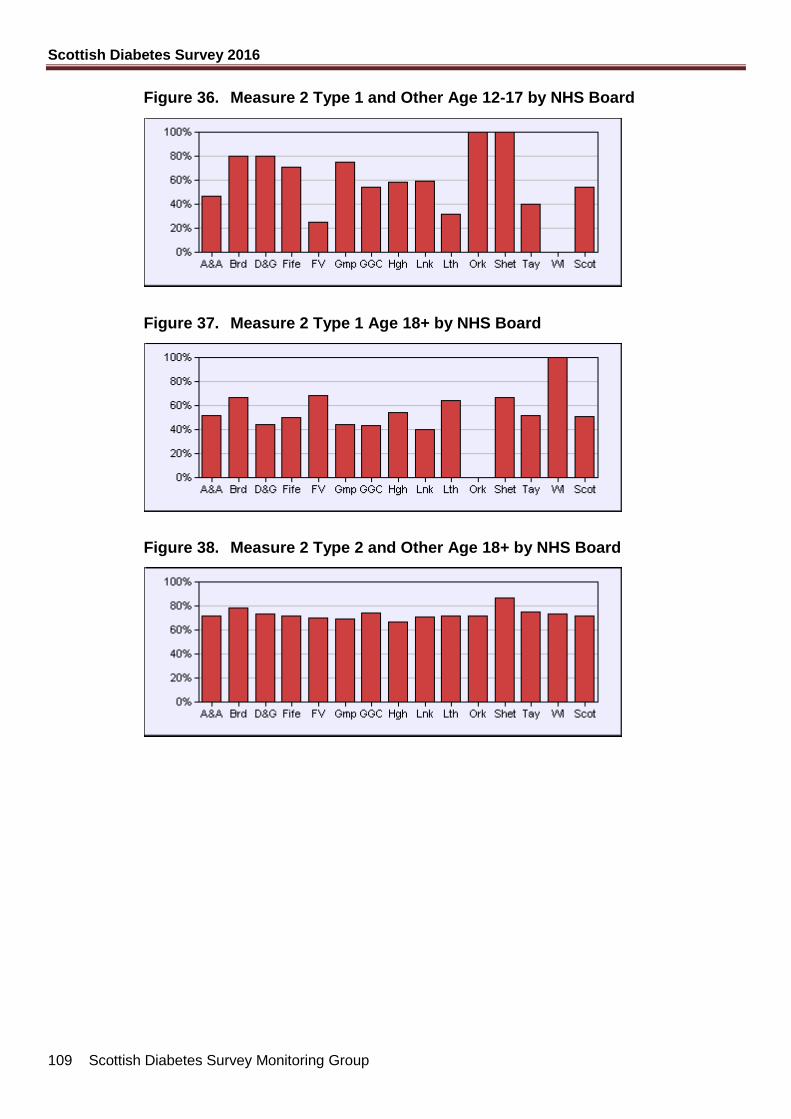
Scottish Diabetes Survey 2016
109 Scottish Diabetes Survey Monitoring Group
Figure 36. Measure 2 Type 1 and Other Age 12-17 by NHS Board
Figure 37. Measure 2 Type 1 Age 18+ by NHS Board
Figure 38. Measure 2 Type 2 and Other Age 18+ by NHS Board
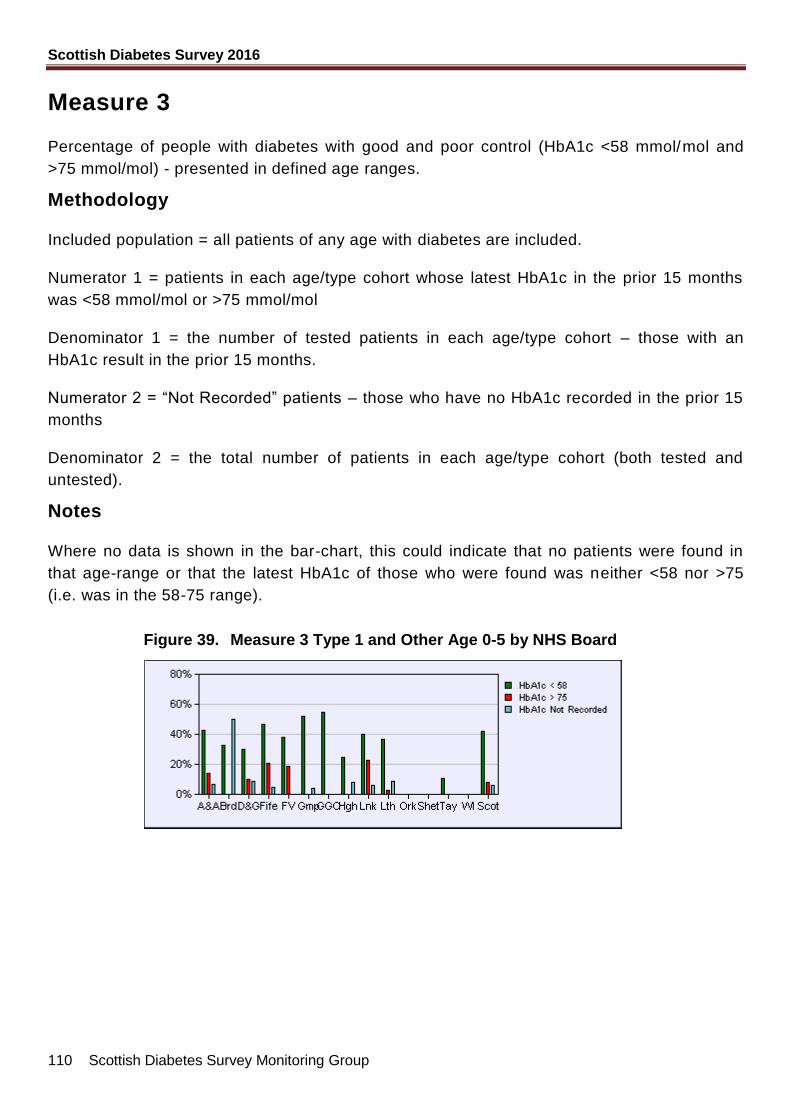
Scottish Diabetes Survey 2016
110 Scottish Diabetes Survey Monitoring Group
Measure 3
Percentage of people with diabetes with good and poor control (HbA1c <58 mmol/mol and
>75 mmol/mol) - presented in defined age ranges.
Methodology
Included population = all patients of any age with diabetes are included.
Numerator 1 = patients in each age/type cohort whose latest HbA1c in the prior 15 months
was <58 mmol/mol or >75 mmol/mol
Denominator 1 = the number of tested patients in each age/type cohort – those with an
HbA1c result in the prior 15 months.
Numerator 2 = “Not Recorded” patients – those who have no HbA1c recorded in the prior 15
months
Denominator 2 = the total number of patients in each age/type cohort (both tested and
untested).
Notes
Where no data is shown in the bar-chart, this could indicate that no patients were found in
that age-range or that the latest HbA1c of those who were found was neither <58 nor >75
(i.e. was in the 58-75 range).
Figure 39. Measure 3 Type 1 and Other Age 0-5 by NHS Board
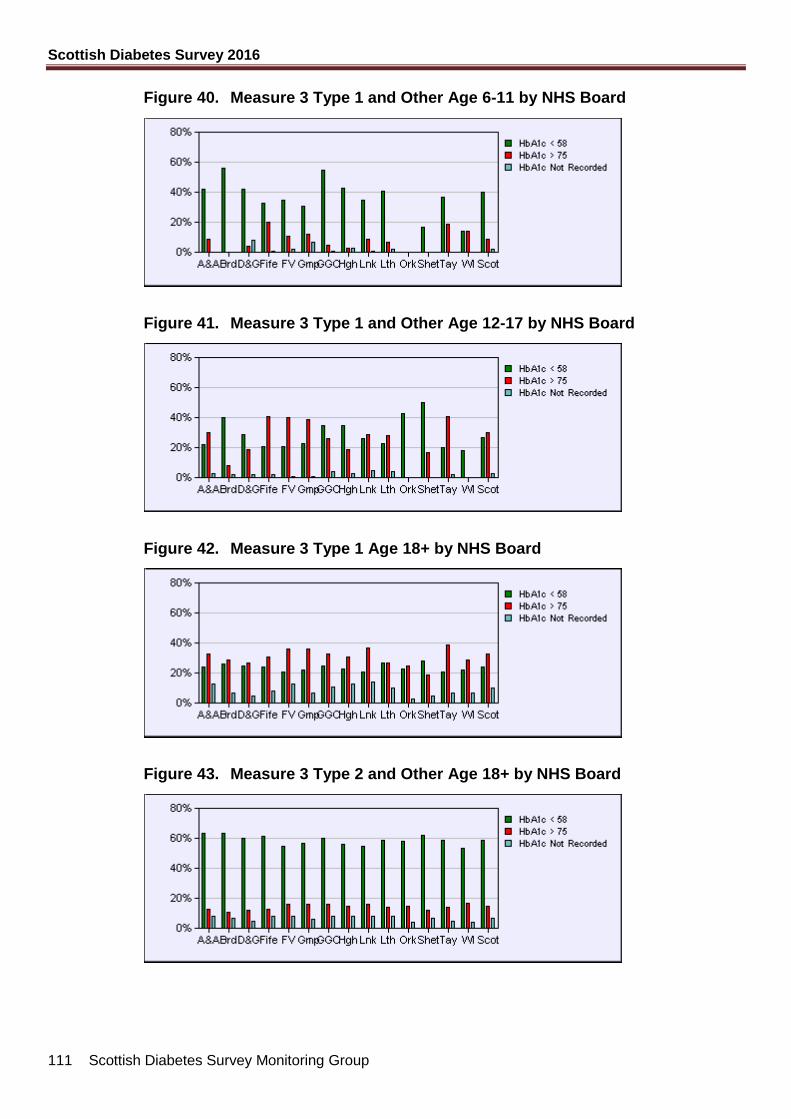
Scottish Diabetes Survey 2016
111 Scottish Diabetes Survey Monitoring Group
Figure 40. Measure 3 Type 1 and Other Age 6-11 by NHS Board
Figure 41. Measure 3 Type 1 and Other Age 12-17 by NHS Board
Figure 42. Measure 3 Type 1 Age 18+ by NHS Board
Figure 43. Measure 3 Type 2 and Other Age 18+ by NHS Board
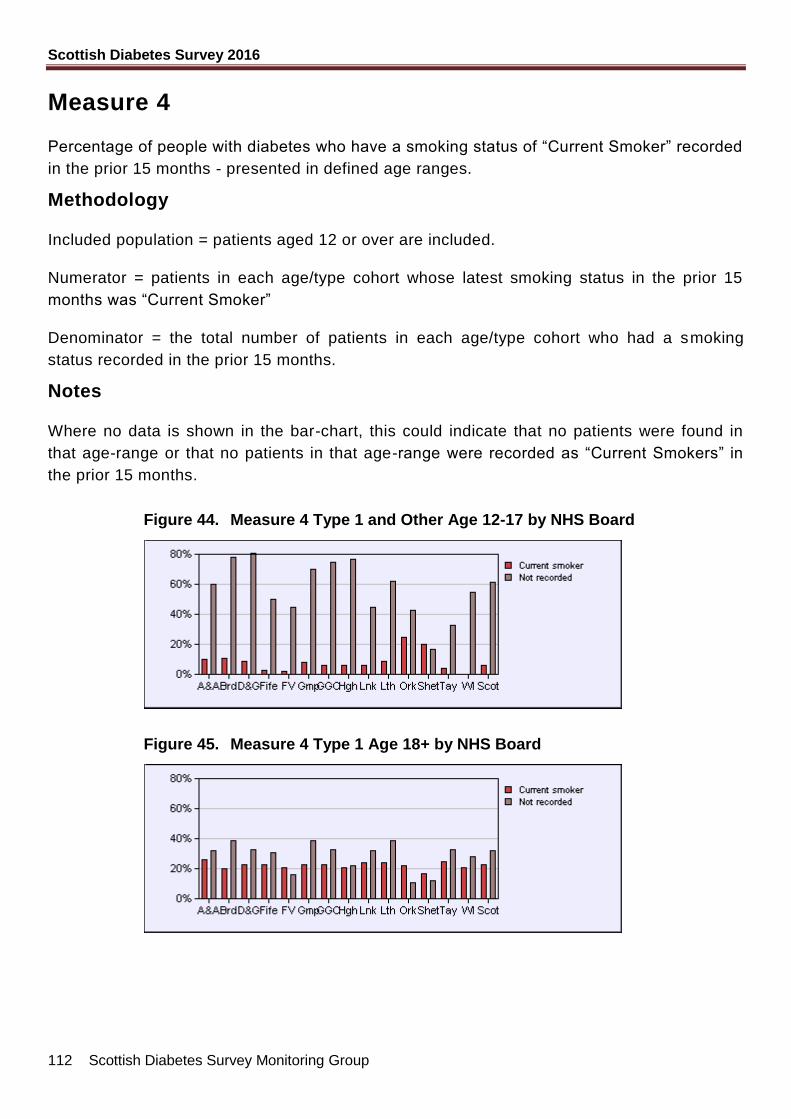
Scottish Diabetes Survey 2016
112 Scottish Diabetes Survey Monitoring Group
Measure 4
Percentage of people with diabetes who have a smoking status of “Current Smoker” recorded
in the prior 15 months - presented in defined age ranges.
Methodology
Included population = patients aged 12 or over are included.
Numerator = patients in each age/type cohort whose latest smoking status in the prior 15
months was “Current Smoker”
Denominator = the total number of patients in each age/type cohort who had a smoking
status recorded in the prior 15 months.
Notes
Where no data is shown in the bar-chart, this could indicate that no patients were found in
that age-range or that no patients in that age-range were recorded as “Current Smokers” in
the prior 15 months.
Figure 44. Measure 4 Type 1 and Other Age 12-17 by NHS Board
Figure 45. Measure 4 Type 1 Age 18+ by NHS Board
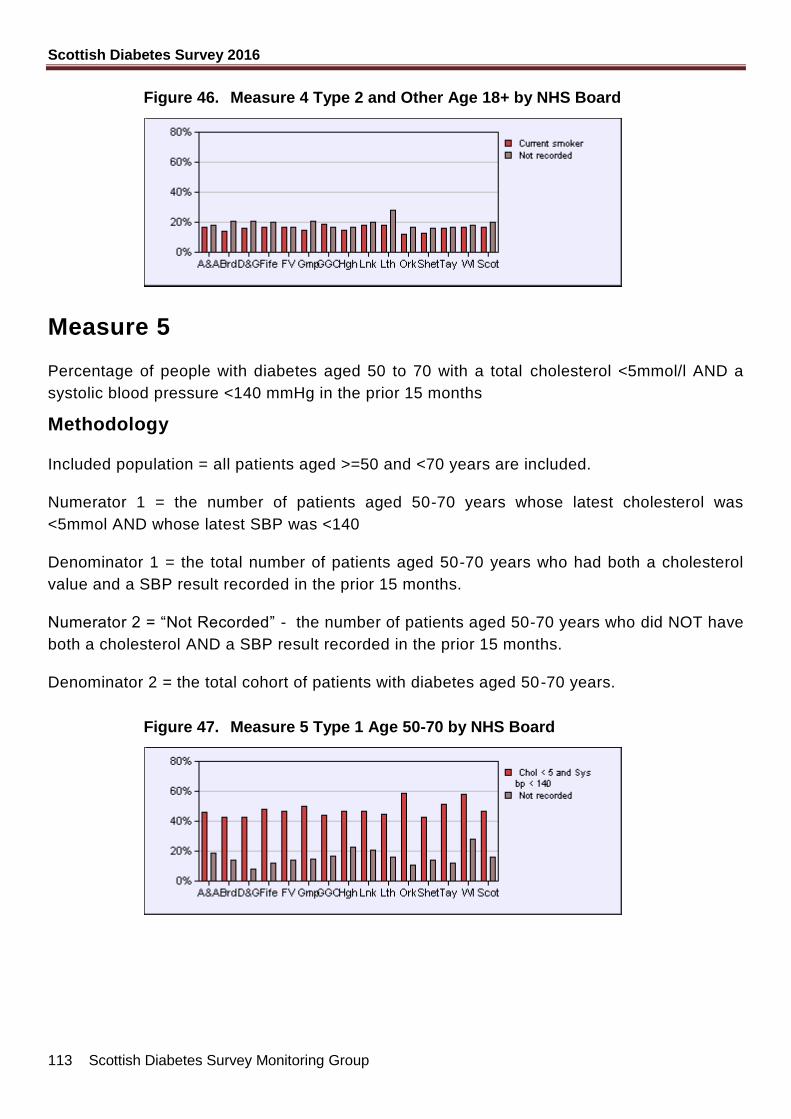
Scottish Diabetes Survey 2016
113 Scottish Diabetes Survey Monitoring Group
Figure 46. Measure 4 Type 2 and Other Age 18+ by NHS Board
Measure 5
Percentage of people with diabetes aged 50 to 70 with a total cholesterol <5mmol/l AND a
systolic blood pressure <140 mmHg in the prior 15 months
Methodology
Included population = all patients aged >=50 and <70 years are included.
Numerator 1 = the number of patients aged 50-70 years whose latest cholesterol was
<5mmol AND whose latest SBP was <140
Denominator 1 = the total number of patients aged 50-70 years who had both a cholesterol
value and a SBP result recorded in the prior 15 months.
Numerator 2 = “Not Recorded” - the number of patients aged 50-70 years who did NOT have
both a cholesterol AND a SBP result recorded in the prior 15 months.
Denominator 2 = the total cohort of patients with diabetes aged 50-70 years.
Figure 47. Measure 5 Type 1 Age 50-70 by NHS Board
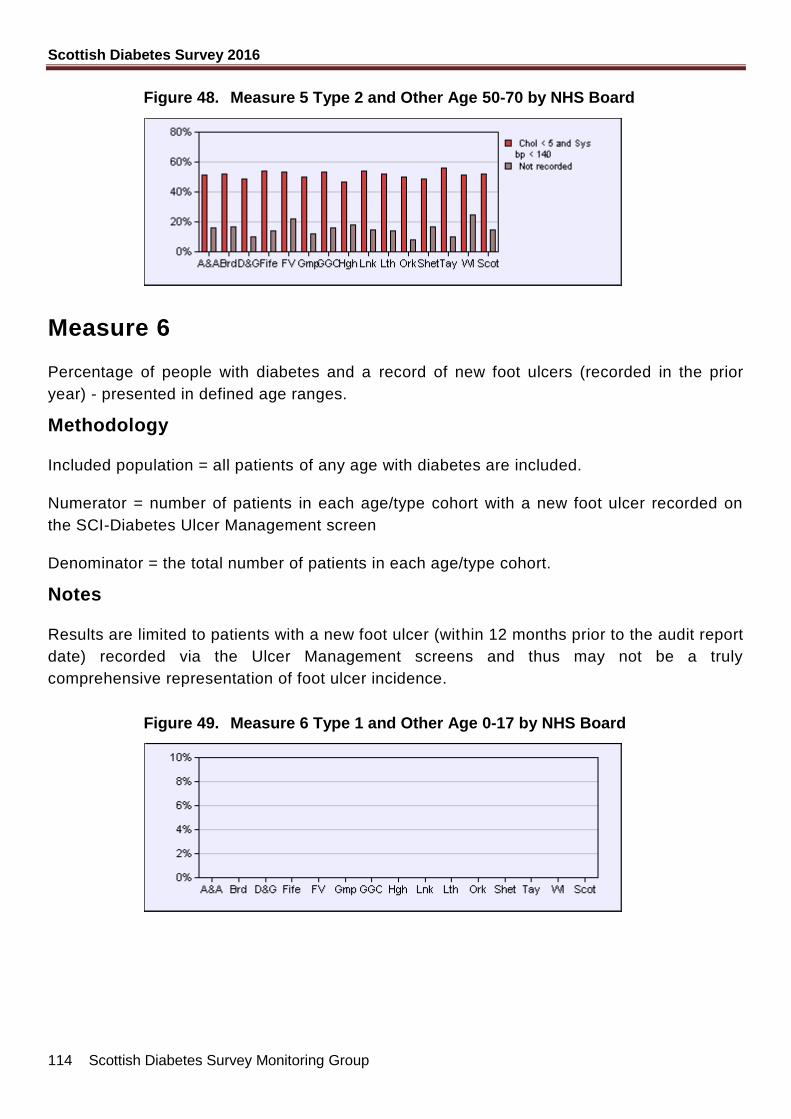
Scottish Diabetes Survey 2016
114 Scottish Diabetes Survey Monitoring Group
Figure 48. Measure 5 Type 2 and Other Age 50-70 by NHS Board
Measure 6
Percentage of people with diabetes and a record of new foot ulcers (recorded in the prior
year) - presented in defined age ranges.
Methodology
Included population = all patients of any age with diabetes are included.
Numerator = number of patients in each age/type cohort with a new foot ulcer recorded on
the SCI-Diabetes Ulcer Management screen
Denominator = the total number of patients in each age/type cohort.
Notes
Results are limited to patients with a new foot ulcer (within 12 months prior to the audit report
date) recorded via the Ulcer Management screens and thus may not be a truly
comprehensive representation of foot ulcer incidence.
Figure 49. Measure 6 Type 1 and Other Age 0-17 by NHS Board
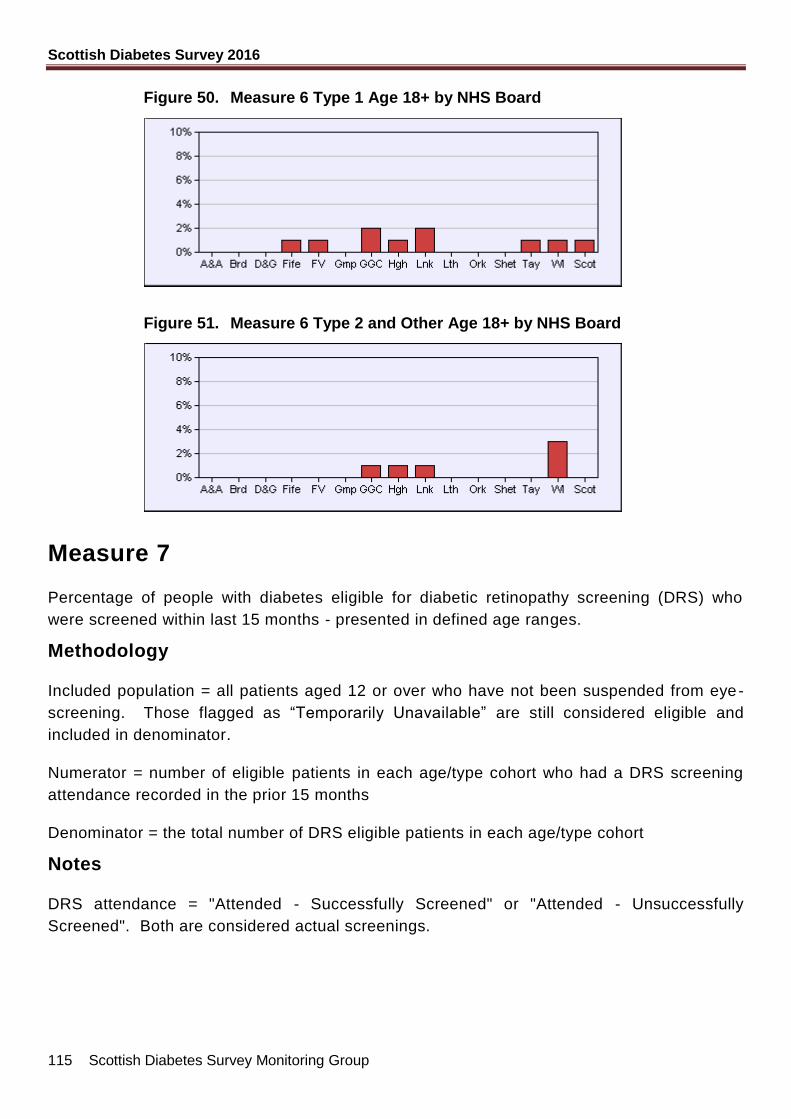
Scottish Diabetes Survey 2016
115 Scottish Diabetes Survey Monitoring Group
Figure 50. Measure 6 Type 1 Age 18+ by NHS Board
Figure 51. Measure 6 Type 2 and Other Age 18+ by NHS Board
Measure 7
Percentage of people with diabetes eligible for diabetic retinopathy screening (DRS) who
were screened within last 15 months - presented in defined age ranges.
Methodology
Included population = all patients aged 12 or over who have not been suspended from eye-
screening. Those flagged as “Temporarily Unavailable” are still considered eligible and
included in denominator.
Numerator = number of eligible patients in each age/type cohort who had a DRS screening
attendance recorded in the prior 15 months
Denominator = the total number of DRS eligible patients in each age/type cohort
Notes
DRS attendance = "Attended - Successfully Screened" or "Attended - Unsuccessfully
Screened". Both are considered actual screenings.
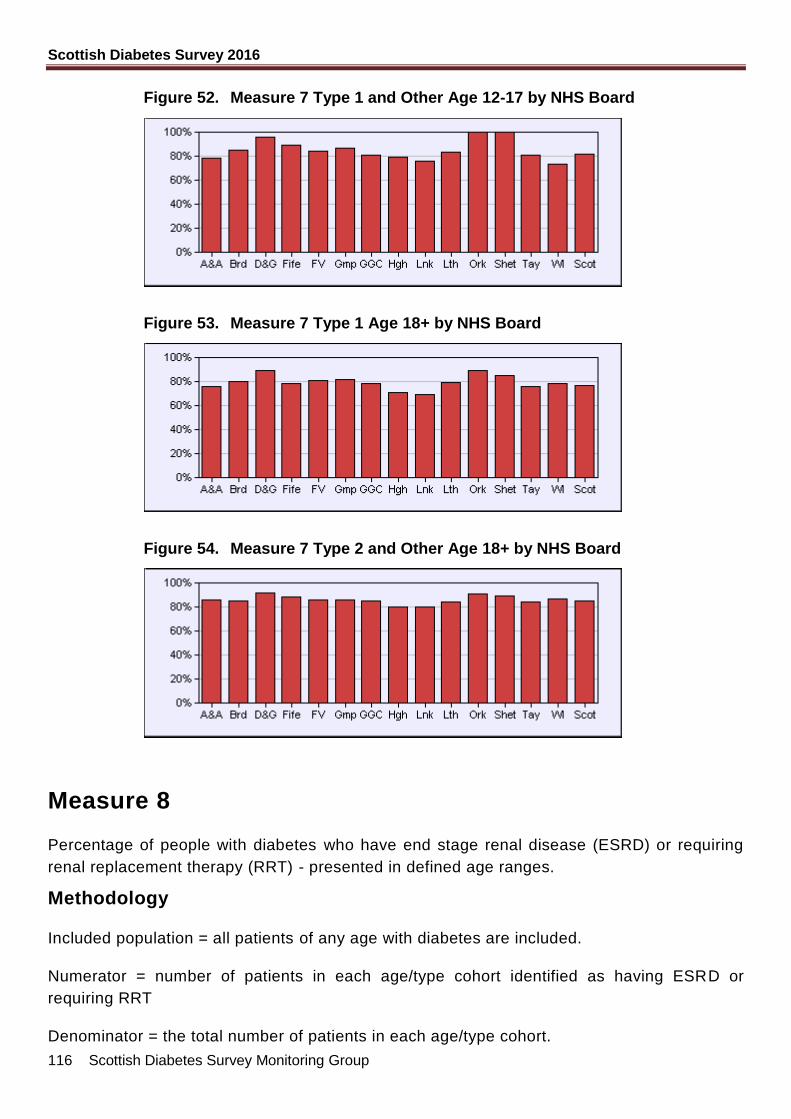
Scottish Diabetes Survey 2016
116 Scottish Diabetes Survey Monitoring Group
Figure 52. Measure 7 Type 1 and Other Age 12-17 by NHS Board
Figure 53. Measure 7 Type 1 Age 18+ by NHS Board
Figure 54. Measure 7 Type 2 and Other Age 18+ by NHS Board
Measure 8
Percentage of people with diabetes who have end stage renal disease (ESRD) or requiring
renal replacement therapy (RRT) - presented in defined age ranges.
Methodology
Included population = all patients of any age with diabetes are included.
Numerator = number of patients in each age/type cohort identified as having ESRD or
requiring RRT
Denominator = the total number of patients in each age/type cohort.
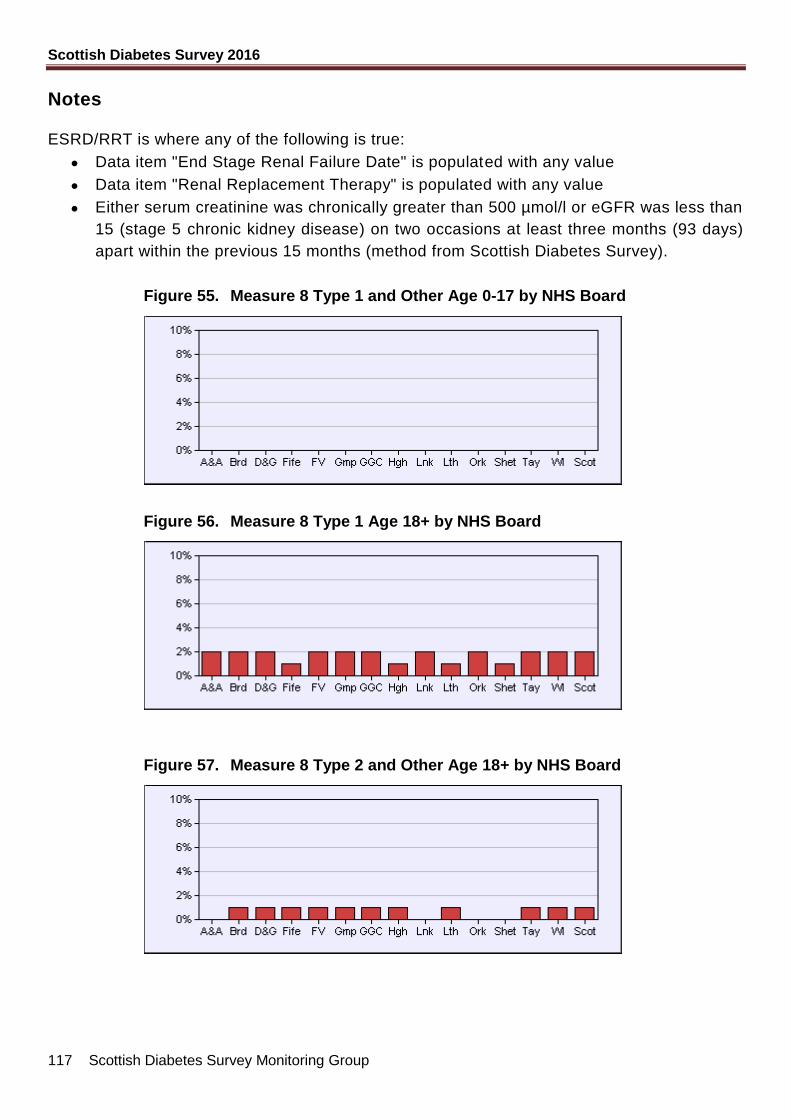
Scottish Diabetes Survey 2016
117 Scottish Diabetes Survey Monitoring Group
Notes
ESRD/RRT is where any of the following is true:
Data item "End Stage Renal Failure Date" is populated with any value
Data item "Renal Replacement Therapy" is populated with any value
Either serum creatinine was chronically greater than 500 µmol/l or eGFR was less than
15 (stage 5 chronic kidney disease) on two occasions at least three months (93 days)
apart within the previous 15 months (method from Scottish Diabetes Survey).
Figure 55. Measure 8 Type 1 and Other Age 0-17 by NHS Board
Figure 56. Measure 8 Type 1 Age 18+ by NHS Board
Figure 57. Measure 8 Type 2 and Other Age 18+ by NHS Board
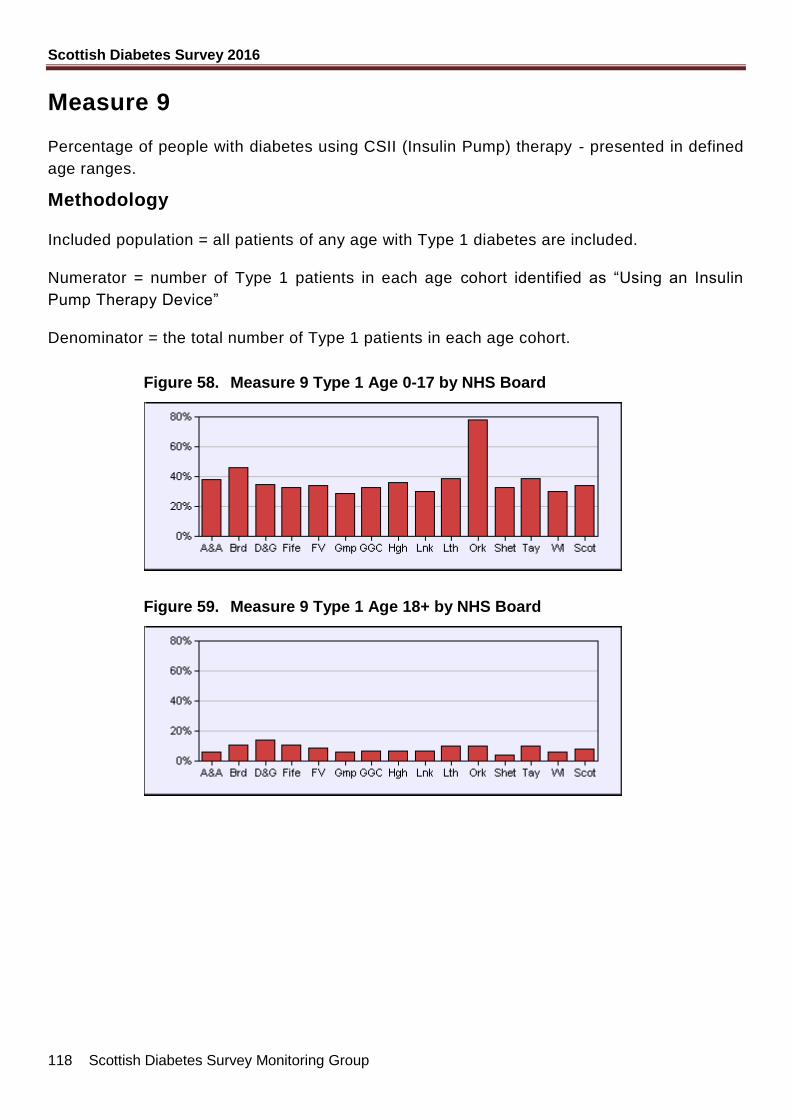
Scottish Diabetes Survey 2016
118 Scottish Diabetes Survey Monitoring Group
Measure 9
Percentage of people with diabetes using CSII (Insulin Pump) therapy - presented in defined
age ranges.
Methodology
Included population = all patients of any age with Type 1 diabetes are included.
Numerator = number of Type 1 patients in each age cohort identified as “Using an Insulin
Pump Therapy Device”
Denominator = the total number of Type 1 patients in each age cohort.
Figure 58. Measure 9 Type 1 Age 0-17 by NHS Board
Figure 59. Measure 9 Type 1 Age 18+ by NHS Board
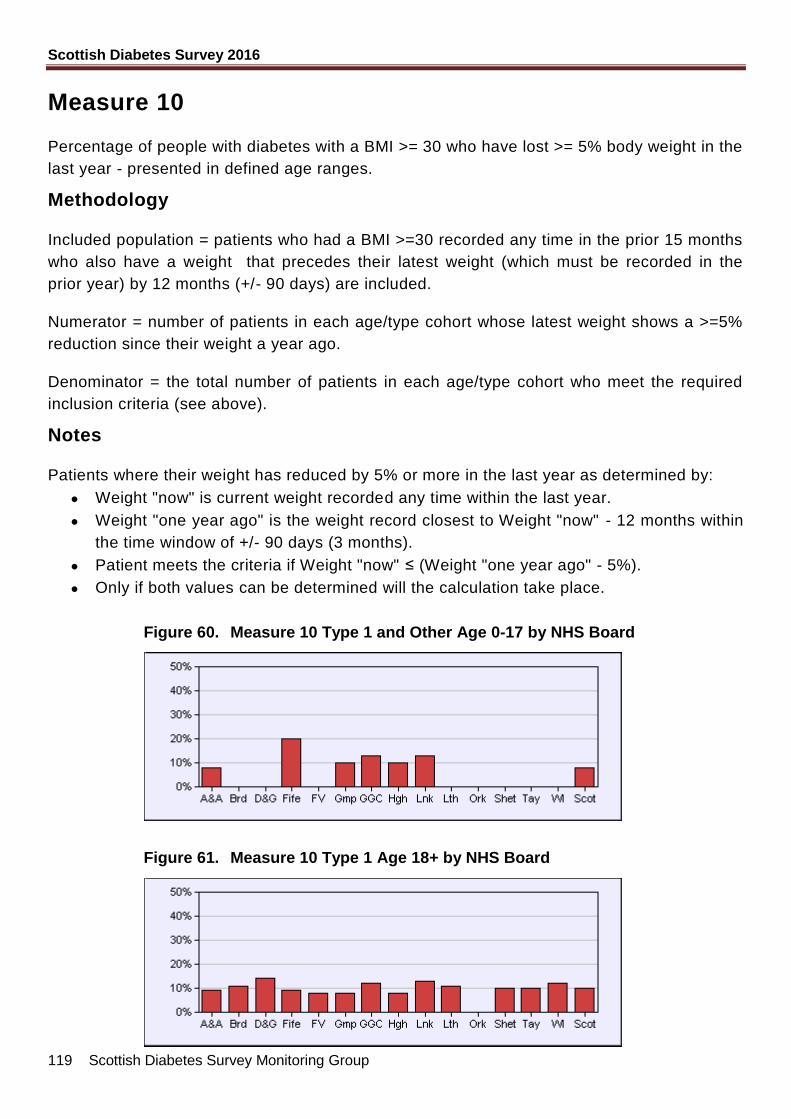
Scottish Diabetes Survey 2016
119 Scottish Diabetes Survey Monitoring Group
Measure 10
Percentage of people with diabetes with a BMI >= 30 who have lost >= 5% body weight in the
last year - presented in defined age ranges.
Methodology
Included population = patients who had a BMI >=30 recorded any time in the prior 15 months
who also have a weight that precedes their latest weight (which must be recorded in the
prior year) by 12 months (+/- 90 days) are included.
Numerator = number of patients in each age/type cohort whose latest weight shows a >=5%
reduction since their weight a year ago.
Denominator = the total number of patients in each age/type cohort who meet the required
inclusion criteria (see above).
Notes
Patients where their weight has reduced by 5% or more in the last year as determined by:
Weight "now" is current weight recorded any time within the last year.
Weight "one year ago" is the weight record closest to Weight "now" - 12 months within
the time window of +/- 90 days (3 months).
Patient meets the criteria if Weight "now" ≤ (Weight "one year ago" - 5%).
Only if both values can be determined will the calculation take place.
Figure 60. Measure 10 Type 1 and Other Age 0-17 by NHS Board
Figure 61. Measure 10 Type 1 Age 18+ by NHS Board
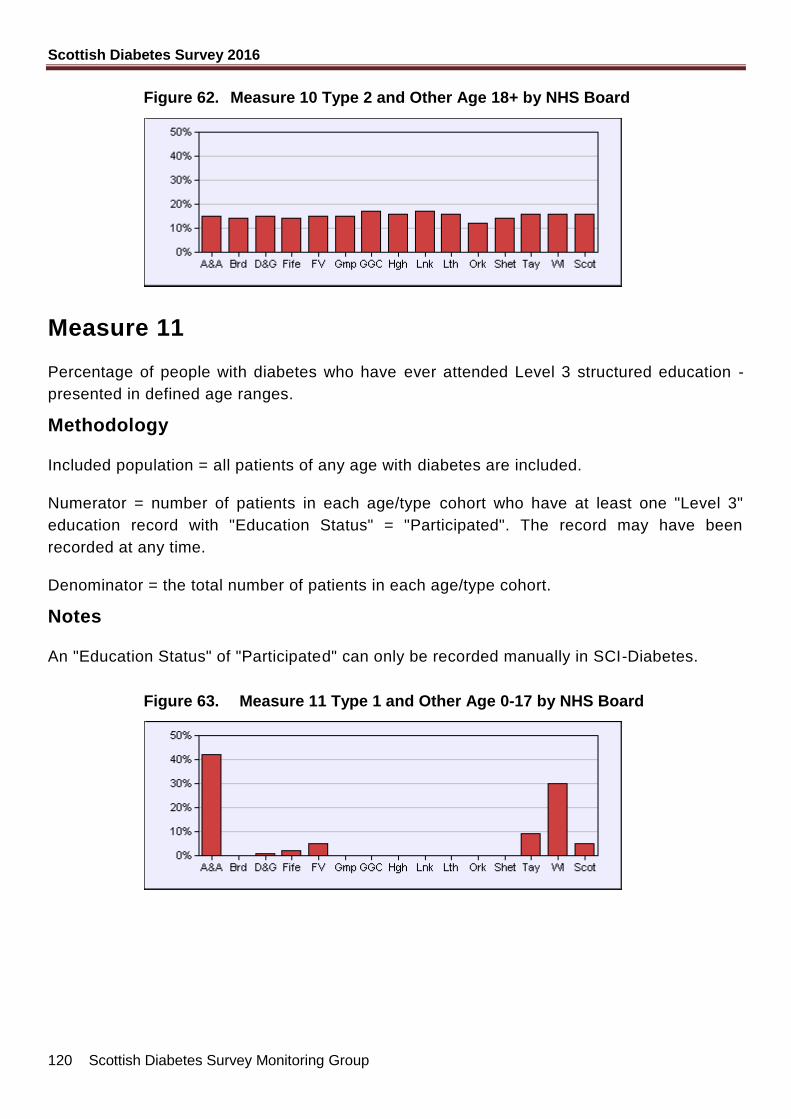
Scottish Diabetes Survey 2016
120 Scottish Diabetes Survey Monitoring Group
Figure 62. Measure 10 Type 2 and Other Age 18+ by NHS Board
Measure 11
Percentage of people with diabetes who have ever attended Level 3 structured education -
presented in defined age ranges.
Methodology
Included population = all patients of any age with diabetes are included.
Numerator = number of patients in each age/type cohort who have at least one "Level 3"
education record with "Education Status" = "Participated". The record may have been
recorded at any time.
Denominator = the total number of patients in each age/type cohort.
Notes
An "Education Status" of "Participated" can only be recorded manually in SCI-Diabetes.
Figure 63. Measure 11 Type 1 and Other Age 0-17 by NHS Board
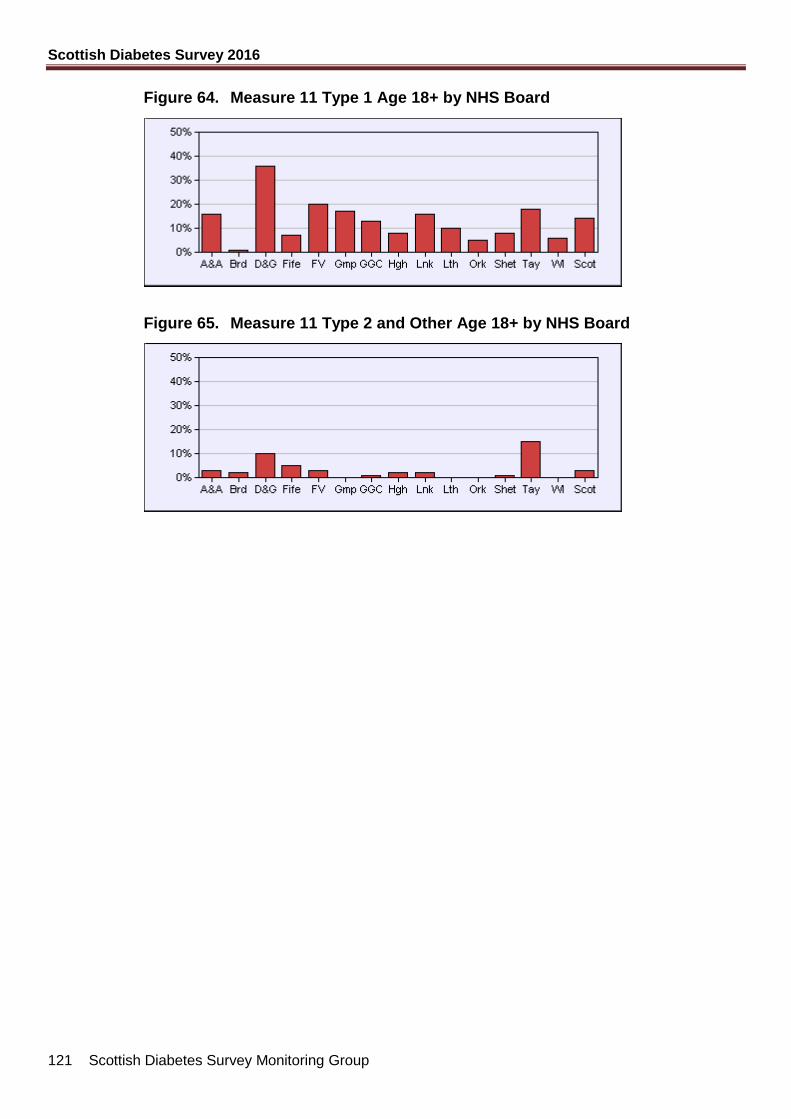
Scottish Diabetes Survey 2016
121 Scottish Diabetes Survey Monitoring Group
Figure 64. Measure 11 Type 1 Age 18+ by NHS Board
Figure 65. Measure 11 Type 2 and Other Age 18+ by NHS Board
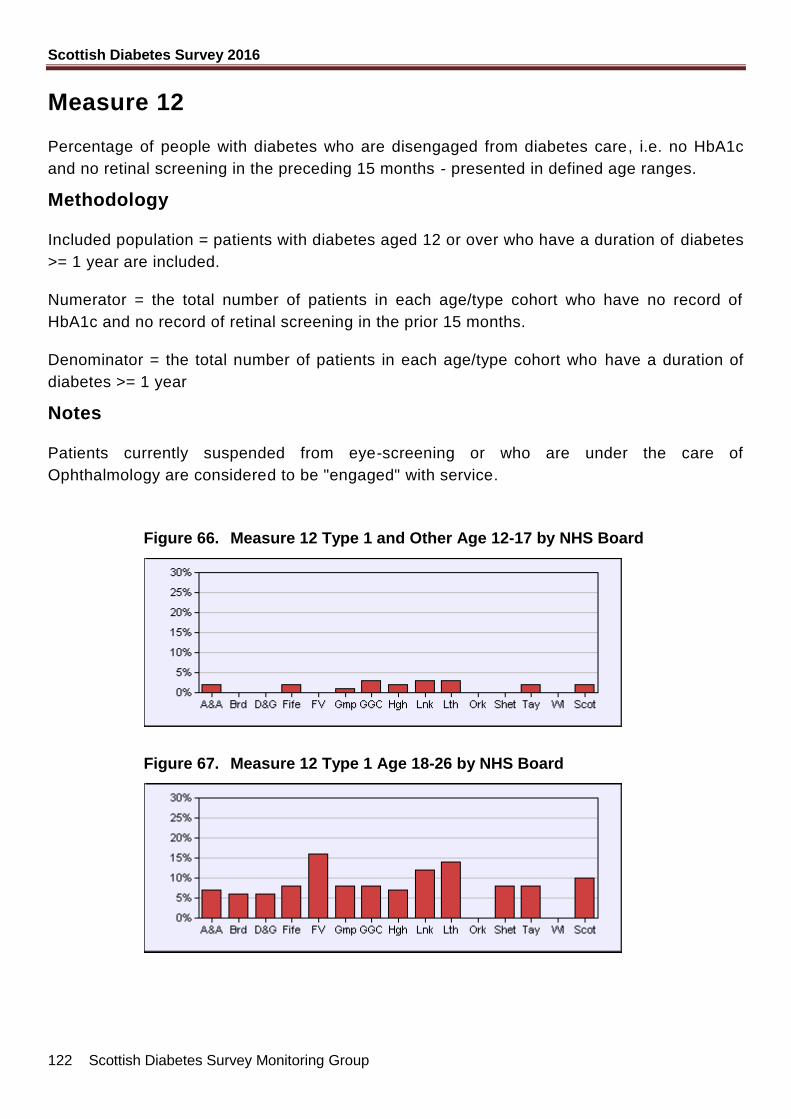
Scottish Diabetes Survey 2016
122 Scottish Diabetes Survey Monitoring Group
Measure 12
Percentage of people with diabetes who are disengaged from diabetes care, i.e. no HbA1c
and no retinal screening in the preceding 15 months - presented in defined age ranges.
Methodology
Included population = patients with diabetes aged 12 or over who have a duration of diabetes
>= 1 year are included.
Numerator = the total number of patients in each age/type cohort who have no record of
HbA1c and no record of retinal screening in the prior 15 months.
Denominator = the total number of patients in each age/type cohort who have a duration of
diabetes >= 1 year
Notes
Patients currently suspended from eye-screening or who are under the care of
Ophthalmology are considered to be "engaged" with service.
Figure 66. Measure 12 Type 1 and Other Age 12-17 by NHS Board
Figure 67. Measure 12 Type 1 Age 18-26 by NHS Board
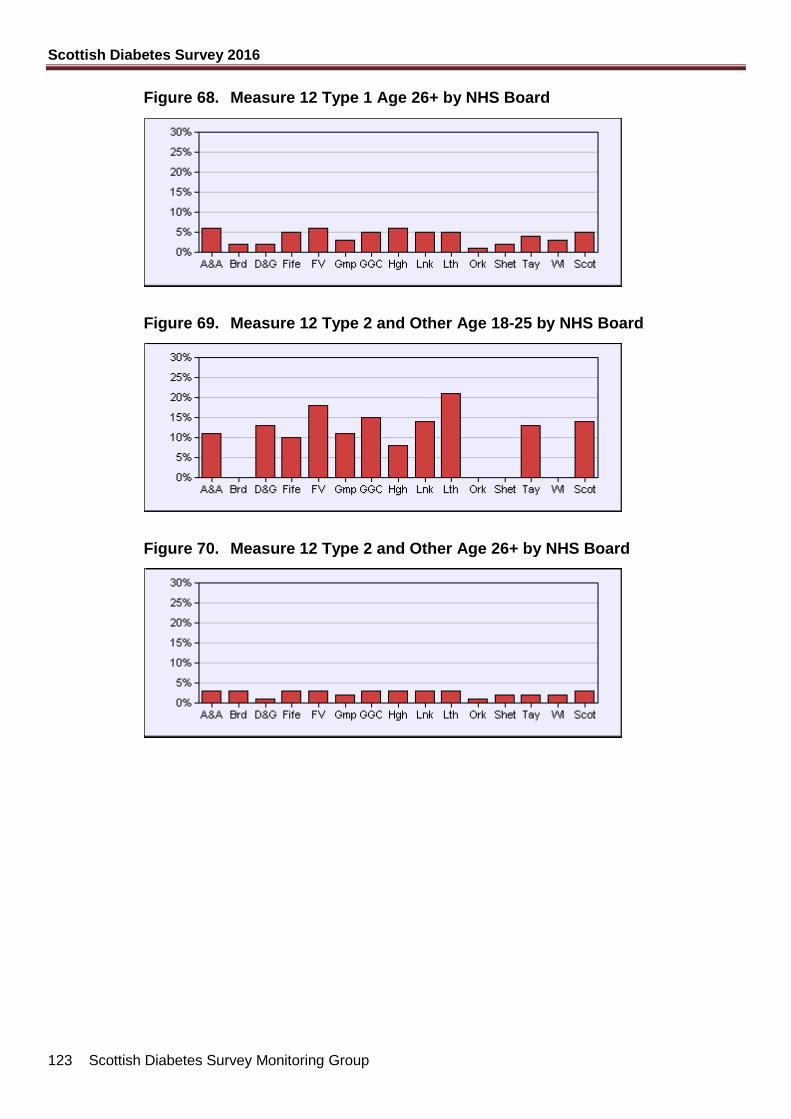
Scottish Diabetes Survey 2016
123 Scottish Diabetes Survey Monitoring Group
Figure 68. Measure 12 Type 1 Age 26+ by NHS Board
Figure 69. Measure 12 Type 2 and Other Age 18-25 by NHS Board
Figure 70. Measure 12 Type 2 and Other Age 26+ by NHS Board
Scottish Diabetes Survey 2016
124 Scottish Diabetes Survey Monitoring Group
Acknowledgements
The data for this survey were provided by the Diabetes Managed Clinical Networks in each
health board, and collated by the SCI-Diabetes Team, and Ritchie McAlpine (Tayside
Diabetes MCN team). Michael Bluett produced the tables and graphs and edited the report.
Dr Colin Fischbacher reviewed the report for sensitive data. The draft report was considered
and approved by Scottish Diabetes Survey Monitoring Group, the members of which are:
Prof John McKnight (Chair)
Dr Louise Bath
Mr Mike Black
Mr Michael Bluett
Prof Helen Colhoun
Dr Scott Cunningham
Dr Fraser Gibb
Dr Brian Kennon
Dr Sam Philip
Dr Stuart Ritchie
Dr Kenneth J Robertson
Dr William Simpson
Diane Smith
Prof Sarah Wild
Dr Nicola Zammitt
Scottish Diabetes Survey 2016
125 Scottish Diabetes Survey Monitoring Group
List of Tables Table 1. Crude and age-adjusted prevalence of diabetes (all types), by NHS Board, ranked by
age-adjusted prevalence.
Table 2. Crude prevalence of diabetes for patients aged 65 and over (all types), by NHS Board,
ranked by prevalence.
Table 3. Number of people with diabetes, crude prevalence of diabetes and changes in
numbers/proportions.
Table 4. Type 1 diabetes: Number of new cases and incidence rate (per 100,000 population
per year) by age.
Table 5. Type 1 diabetes: Incidence rate (per 100,000 population per year) by age.
Table 6. Type 2 diabetes: Number of new cases and incidence rate (per 100,000 population
per year) by age.
Table 7. Type 2 diabetes: Incidence rate (per 100,000 population per year) by age.
Table 8. Type 1 diabetes: Number of new cases and crude incidence rate for all ages (cases
per 100,000 population per year) by NHS Board, ranked by rate in the last year.
Table 9. Type 1 diabetes: Crude incidence rate of new cases for all ages (cases per 100,000
population per year) by NHS Board, ranked by rate in the last year.
Table 10. Type 2 diabetes: Number of new cases and crude incidence rate for all ages (cases
per 100,000 population per year) by NHS Board, ranked by rate in the last year.
Table 11. Type 2 diabetes: Crude incidence rate for all ages (cases per 100,000 population per
year) by NHS Board, ranked by rate in the last year.
Table 12. Duration of diabetes (years since diagnosis) by type of diabetes for people with Type 1
or Type 2 diabetes
Table 13. Age group of people recorded with Type 1 or Type 2 diabetes, percentage in each age
group and cumulative percentage in each age group, by diabetes type.
Table 14. The number and crude percentage of the diabetic population (all diabetes types) who
have died within the last year, by NHS Board, ranked by mortality.
Table 15. Number of people with diabetes and the distribution of diabetes type, by NHS board,
ranked by the percentage with Type 2 diabetes.
Table 16. Type 1 diabetes: Completeness of recording of ethnic group by NHS board, ranked by
decreasing completeness.
Table 17. Type 2 diabetes: Completeness of recording of ethnic group by NHS board, ranked by
Scottish Diabetes Survey 2016
126 Scottish Diabetes Survey Monitoring Group
decreasing completeness.
Table 18. Recorded ethnic group for Type 1, Type 2 and combined types.
Table 19. Completeness of recording of ethnic group for people with diabetes (Type 1 and Type
2 combined).
Table 20. Proportion of people recorded as having Type 1 or Type 2 diabetes with a record of
BMI within the previous 15 months, by NHS Board and diabetes type, ranked by
decreasing completeness for Type 2 diabetes.
Table 21. Proportion of people with Type 1 or Type 2 diabetes (combined) with a record of BMI
in the previous 15 months.
Table 22. Type 1 diabetes: Percentage of people with a record of BMI in the last 15 months
grouped by BMI category, NHS board and ranked in from low to high by percentage
with BMI >= 40kg/m2
Table 23. Type 2 diabetes: Percentage of people with a record of BMI in the last 15 months
grouped by BMI category, NHS board and ranked by percentage with BMI >= 40kg/m2
Table 24. Percentage of people recorded as having Type 1 or Type 2 diabetes (combined) with
a record of HbA1c in previous 15 months.
Table 25. Percentage of people with Type 1 or Type 2 diabetes who had a record of HbA1c
within the previous 15 months, by diabetes type and NHS board, ranked by
decreasing percentage of people with Type 2 diabetes.
Table 26. Type 1 diabetes: HbA1c category as a percentage of patients with HbA1c recorded in
previous 15 months, by NHS Board, ranked by percentage with HbA1c over
75mmol/mol.
Table 27. Type 2 diabetes: HbA1c category as percentage of patients with HbA1c recorded in
previous 15 months, by NHS Board, ranked by percentage with HbA1c over
75mmol/mol.
Table 28. Type 1 diabetes: Number and percentage of people with a record of HbA1c in each
HbA1c category.
Table 29. Type 2 diabetes: Number and percentage of people with a record of HbA1c in each
HbA1c category.
Table 30. Type 1 diabetes: HbA1c category as percent of all those with HbA1c recorded in the
previous 15 months (HbA1c in mmol/mol), by NHS Board, ranked by percentage with
HbA1c over 75mmol/mol.
Table 31. Type 2 diabetes: HbA1c category as percent of all those with HbA1c recorded in the
previous 15 months (HbA1c in mmol/mol), by NHS Board, 2014, ranked by percentage
Scottish Diabetes Survey 2016
127 Scottish Diabetes Survey Monitoring Group
with HbA1c over 75 mmol/mol.
Table 32. Mean HbA1c (mmol/mol) recorded in the previous 15 months, by NHS Board, for
people with Type 1 diabetes by age and for Type 2 diabetes (all ages combined),
ranked by mean HbA1c for those with Type 2 diabetes.
Table 33. Numbers and percentages of people with Type 1 diabetes using insulin pumps by age
group and NHS Board, ranked by descending percentage of people aged under 18
using an insulin pump, December 2016.
Table 34. Numbers and percentages of people with Type 1 diabetes using insulin pumps by age
group
Table 35. Percentage of people with Type 1 and Type 2 diabetes with a recording of BP in the
previous 15 months, by NHS Board and diabetes type, ranked by figures for Type 2
diabetes.
Table 36. Percentage of people with Type 1 diabetes with BP recorded within the previous 15
months.
Table 37. Percentage of people with Type 2 diabetes with a BP recorded within the previous 15
months.
Table 38. Type 1 diabetes: Percentage of people with systolic blood pressure (SBP) ≤ 140
mmHg by NHS Board, ranked by percentage > 140 mmHg.
Table 39. Type 1 diabetes: Percentage of people achieving a target of systolic blood pressure
(SBP) <130 mmHg AND diastolic blood pressure (DBP) ≤80 mmHg, by NHS Board
(denominator those with recording of SBP and DBP within the previous 15 months),
ranked by percentage of those who failed to meet this target.
Table 40. Type 2 diabetes: Percentage of people with systolic blood pressure (SBP) ≤ 140
mmHg by NHS Board, ranked by percentage > 140 mmHg.
Table 41. Type 2 diabetes: Percentage of people achieving a target of systolic blood pressure
(SBP) <130 mmHg AND diastolic blood pressure (DBP) ≤80 mmHg, by NHS Board
(denominator those with recording of SBP and DBP within the previous 15 months),
ranked by percentage of those who failed to meet this target.
Table 42. Percentage of people with diabetes (Type 1 and Type 2 combined) with systolic blood
pressure (SBP) ≤ 140 mmHg.
Table 43. Type 1 diabetes: Mean BP (mmHg) recorded in previous 15 months in people aged <
40 years, by NHS Board, ranked by mean systolic BP.
Table 44. Type 2 diabetes: Mean BP recorded in previous 15 months in people aged 50-59
years, by NHS Board, ranked by mean systolic BP.
Table 45. Percentage of people with diabetes (Type 1 and Type 2 combined) with a record of
Scottish Diabetes Survey 2016
128 Scottish Diabetes Survey Monitoring Group
cholesterol within the previous 15 months.
Table 46. Type 1 diabetes: Percentage of people with cholesterol ≤5mmol/l, by NHS Board
(denominator those with recording of cholesterol within the previous 15 months),
ranked by percentage of people with cholesterol ≤5mmol/l.
Table 47. Type 2 diabetes: Percentage of people with cholesterol ≤5mmol/l, by NHS Board
(denominator those with recording of cholesterol within the previous 15 months),
ranked by percentage of people with cholesterol ≤5mmol/l.
Table 48. Percentage of people with diabetes (Type 1 and Type 2 combined) with cholesterol <
5mmol/l, by year (denominator those with recording of cholesterol within the previous
15 months).
Table 49. Type 2 diabetes: Mean total cholesterol recorded in previous 15 months in people
aged 50-59 years, by NHS Board, ranked by mean cholesterol.
Table 50. Type 1 diabetes: Percentage of people who were recorded as current, ex- or never-
smokers, by NHS Board (denominator those with recording of smoking status); ranked
by percentage who are current smokers.
Table 51. Type 2 diabetes: Percentage of people who were recorded as current, ex- or never-
smokers, by NHS Board (denominator those with recording of smoking status); ranked
by percentage who are current smokers.
Table 52. Percentage of people with diabetes (Type 1 and Type 2 combined) who were
recorded as current, ex- or never-smokers (denominator those with record of smoking
status).
Table 53. Percentage of people with Type 1 or Type 2 diabetes recorded as having had a
previous myocardial infarction (MI), by diabetes type and NHS board, ranked from low
to high by percentage among people with Type 2 diabetes.
Table 54. Percentage of people with diabetes (Type 1 and Type 2 combined) who are recorded
as having had a previous myocardial infarction (MI).
Table 55. Percentage of people with Type 1 or Type 2 diabetes who have a record of cardiac
revascularisation by NHS Board and diabetes type, ranked from low to high by
percentage among people with Type 2 diabetes.
Table 56. Percentage of people with Type 1 or Type 2 diabetes (combined) recorded as having
ever had cardiac revascularisation.
Table 57. Percentage of people with Type 1 or Type 2 diabetes who were recorded as ever
having had a stroke, by NHS Board and diabetes type, ranked from low to high by
percentage among people with Type 2 diabetes.
Table 58. Percentage of people with Type 1 or Type 2 diabetes who have a record of serum
Scottish Diabetes Survey 2016
129 Scottish Diabetes Survey Monitoring Group
creatinine within the previous 15 months, by NHS board and diabetes type, ranked
from low to high by percentage among people with Type 2 diabetes.
Table 59. Percentage of people with diabetes (Type 1 and Type 2 combined) who had a record
of serum creatinine within the previous 15 months.
Table 60. Number and percentage of people with Type 1 or Type 2 diabetes who have a record
of estimated urinary microalbumin value available on SCI-DC within the previous 15
months, by NHS board and diabetes type, ranked from high to low by percentage
among people with Type 2 diabetes.
Table 61. Number and percentage of people with Type 1 or Type 2 diabetes who have a record
of estimated glomerular filtration rate (eGFR) available on SCI-Diabetes within the
previous 15 months, by NHS board and diabetes type, ranked by decreasing
percentage of people with Type 2 diabetes.
Table 62. Percentage of people with Type 1 or Type 2 diabetes recorded as having end stage
renal failure, by NHS board and diabetes type, ranked by percentage of people with
Type 2 diabetes.
Table 63. Number and percentage of people with Type 1 and Type 2 diabetes of appropriate
age (>12 years) who were either recorded as having had diabetic retinopathy
screening within the previous 15 months, were attending specialist ophthalmology
clinics or were appropriately suspended from screening as a proportion of the total
number of patients who had a record of date of birth and were over 12 years of age;
by NHS Board and diabetes type, ranked by decreasing percentage of people with
Type 2 diabetes.
Table 64. Numbers of patients eligible for retinopathy screening, numbers screened and
percentages of those who had a record of screening (Type 1 and Type 2 combined),
ranked from high to low by percentage of screened patients.
Table 65 Number (and prevalence per 10,000 people with Type 1 diabetes) who are recorded
as blind, ranked from low to high by prevalence of blindness caused by diabetes.
Table 66 Number (and prevalence per 10,000 people with Type 2 diabetes) who are recorded
as blind, ranked by diabetic cause prevalence.
Table 67. Percentage of people with diabetes (Type 1 and Type 2 combined) who were
recorded as having had eye-screening, ophthalmology care or an appropriate
suspension from screening (depending on methodology at the time of the report).
Table 68. Type 1 diabetes: Percentage of people with active foot disease, high, moderate or low
foot risk score recorded in the previous 15 months, by NHS board, ranked by
decreasing percentage foot risk score recorded.
Table 69. Type 2 diabetes: Percentage of people with active foot disease, high, moderate or low
foot risk score recorded in the previous 15 months, by NHS board, ranked by
Scottish Diabetes Survey 2016
130 Scottish Diabetes Survey Monitoring Group
decreasing percentage foot risk score recorded.
Table 70. Percentage of people with diabetes with a record of ever having had a foot ulcer, by
NHS board and diabetes type, ranked by ascending percentage of people with Type 2
diabetes.
Table 71. Percentage of people with diabetes (Type 1 and Type 2 combined) who had a record
of ever having had a foot ulcer.
Table 72. Percentage of people with Type 1 or Type 2 diabetes with a record of ever having had
a major lower limb amputation, by NHS board and diabetes type, ranked by ascending
percentage of people with Type 2 diabetes.
Table 73. Number and percentage of people with diabetes (Type 1 and Type 2 combined) who
had a record of ever having had a major lower limb amputation.
Table 74. Numbers of people with Type 1 and Type 2 diabetes registered to access their clinical
information using the “My Diabetes My Way” website by NHS Board ordered by
decreasing total percentage of registered users.
Table 75. Numbers of people with Type 1 and Type 2 diabetes registered to access and actively
accessing their clinical information using the “My Diabetes My Way” website by year.
Table 76. Numbers of people with Type 1 and Type 2 diabetes who had joined the SDRN
diabetes research register by the end of 2016, by NHS Board, Scotland.
Table 77. Applicability of Care Processes
Table 78. Progress towards links from SCI Store to SCI-Diabetes.
Table 79. Progress towards links from Patient Administration Systems to SCI-Diabetes.
Table 80. Comparison of distribution of key risk factors between Scotland and England/Wales
(E&W) by type of diabetes.
Scottish Diabetes Survey 2016
131 Scottish Diabetes Survey Monitoring Group
List of Figures Figure 1. Crude diabetes prevalence (all types) by NHS Health Board, ranked by prevalence
Figure 2. Age-adjusted diabetes prevalence (all types) by NHS Health Board, ranked by
prevalence.
Figure 3. Number of people with diabetes (all types) in each NHS Health Board.
Figure 4. Number of people recorded with diabetes (all types).
Figure 5. Type 1 diabetes: Age distribution of people recorded compared with age distribution of
general population.
Figure 6. Type 2 diabetes: Age distribution of people recorded compared with age distribution of
general population.
Figure 7 Proportions of diabetes population by type
Figure 8. Completeness of recording of ethnic group from 2015 to 2016 for people recorded as
having Type 1 or Type 2 diabetes (combined)
Figure 9. Proportion of people recorded as having Type 1 or Type 2 diabetes (combined) who
had a record of BMI from 2015 to 2016
Figure 10. Percentage of patients with Type 1 or Type 2 diabetes with a recording of HbA1c
within the previous 15 months by NHS Board and diabetes type
Figure 11. Proportion of people with Type 1 diabetes who had a record of HbA1c from 2015 to
2016.
Figure 12. Proportion of people with Type 2 diabetes who had a record of HbA1c from 2015 to
2016.
Figure 13. Type 1 diabetes: Percentage of people in each HbA1c category for HbA1c recorded in
the previous 15 months, by NHS Board, ranked by decreasing percentage with HbA1c
under 58 mmol/mol.
Figure 14. Type 2 diabetes: Percentage of people in each HbA1c category for HbA1c recorded in
the previous 15 months, by NHS Board, ranked by decreasing percentage with HbA1c
under 58mmol/mol.
Figure 15. Percentage of people with Type 1 or Type 2 diabetes (by diabetes type) with a
recording of BP in the previous 15 months, by NHS Board; ranked by figures for Type
2.
Figure 16. Type 1 diabetes: Percentage of people with most recent systolic blood pressure (SBP)
≤ 140 mmHg in the last 15 months by NHS Board.
Scottish Diabetes Survey 2016
132 Scottish Diabetes Survey Monitoring Group
Figure 17. Type 1 diabetes: Percentage of people with most recent blood pressure in the last 15
months < 130 mmHg (systolic) and ≤ 80 mmHg (diastolic), by NHS Board.
Figure 18. Type 2 diabetes: Percentage of people with most recent systolic blood pressure (SBP)
≤ 140 mmHg in the last 15 months by NHS Board.
Figure 19. Type 2 diabetes: Percentage of people with most recent blood pressure in the last 15
months < 130 mmHg (systolic) and ≤ 80 mmHg (diastolic), by NHS Board.
Figure 20. Type 1 diabetes: Percentage of people with SBP ≤ 140 mmHg from 2015 to 2016.
Figure 21. Type 2 diabetes: Percentage of people with SBP ≤ 140 mmHg from 2015 to 2016.
Figure 22. Percentage of people with Type 1 or Type 2 diabetes with a record of cholesterol
within the previous 15 months by diabetes type and NHS Board, ranked by the
percentage of people with Type 2 diabetes with a record of cholesterol.
Figure 23. Percentage of people with diabetes (Type 1 and Type 2 combined) with a record of
cholesterol within the previous 15 months from 2015 to 2016.
Figure 24. Type 1 diabetes: Percentage of people with cholesterol ≤5mmol/l, by NHS Board
(denominator those with recording of cholesterol within the previous 15 months).
Figure 25. Type 2 diabetes: Percentage of people with cholesterol ≤5mmol/l, by NHS Board
(denominator those with recording of cholesterol within the previous 15 months).
Figure 26. Percentage of people with diabetes (Type 1 and Type 2 combined) with cholesterol ≤5
mmol/l within the previous 15 months from 2015 to 2016
Figure 27. Type 1 diabetes: Smoking status as a percentage of all those with Type 1 diabetes, by
NHS Health Board.
Figure 28. Type 2 diabetes: Smoking status as a percentage of all those with Type 2 diabetes, by
NHS Health Board.
Figure 29. Percentage of people with Type 1 or Type 2 diabetes with a record of diabetic
retinopathy screening within the previous 15 months through retinal screening service,
including those attending ophthalmology clinics and those suspended, by NHS Board
and diabetes type, ranked from high to low by percentage among people with Type 2
diabetes
Figure 30. Measure 1 Type 1 and Other Age 0-11 by NHS Board
Figure 34. Measure 2 Type 1 and Other Age 0-5 by NHS Board
Figure 35. Measure 2 Type 1 and Other Age 6-11 by NHS Board
Figure 36. Measure 2 Type 1 and Other Age 12-17 by NHS Board
Scottish Diabetes Survey 2016
133 Scottish Diabetes Survey Monitoring Group
Figure 37. Measure 2 Type 1 Age 18+ by NHS Board
Figure 38. Measure 2 Type 2 and Other Age 18+ by NHS Board
Figure 39. Measure 3 Type 1 and Other Age 0-5 by NHS Board
Figure 40. Measure 3 Type 1 and Other Age 6-11 by NHS Board
Figure 41. Measure 3 Type 1 and Other Age 12-17 by NHS Board
Figure 42. Measure 3 Type 1 Age 18+ by NHS Board
Figure 43. Measure 3 Type 2 and Other Age 18+ by NHS Board
Figure 44. Measure 4 Type 1 and Other Age 12-17 by NHS Board
Figure 45. Measure 4 Type 1 Age 18+ by NHS Board
Figure 46. Measure 4 Type 2 and Other Age 18+ by NHS Board
Figure 47. Measure 5 Type 1 Age 50-70 by NHS Board
Figure 48. Measure 5 Type 2 and Other Age 50-70 by NHS Board
Figure 49. Measure 6 Type 1 and Other Age 0-17 by NHS Board
Figure 50. Measure 6 Type 1 Age 18+ by NHS Board
Figure 51. Measure 6 Type 2 and Other Age 18+ by NHS Board
Figure 52. Measure 7 Type 1 and Other Age 12-17 by NHS Board
Figure 53. Measure 7 Type 1 Age 18+ by NHS Board
Figure 54. Measure 7 Type 2 and Other Age 18+ by NHS Board
Figure 55. Measure 8 Type 1 and Other Age 0-17 by NHS Board
Figure 56. Measure 8 Type 1 Age 18+ by NHS Board
Figure 57. Measure 8 Type 2 and Other Age 18+ by NHS Board
Figure 58. Measure 9 Type 1 Age 0-17 by NHS Board
Figure 59. Measure 9 Type 1 Age 18+ by NHS Board
Figure 60. Measure 10 Type 1 and Other Age 0-17 by NHS Board
Figure 61. Measure 10 Type 1 Age 18+ by NHS Board
Scottish Diabetes Survey 2016
134 Scottish Diabetes Survey Monitoring Group
Figure 62. Measure 10 Type 2 and Other Age 18+ by NHS Board
Figure 63. Measure 11 Type 1 and Other Age 0-17 by NHS Board
Figure 64. Measure 11 Type 1 Age 18+ by NHS Board
Figure 65. Measure 11 Type 2 and Other Age 18+ by NHS Board
Figure 66. Measure 12 Type 1 and Other Age 12-17 by NHS Board
Figure 67. Measure 12 Type 1 Age 18-26 by NHS Board
Figure 68. Measure 12 Type 1 Age 26+ by NHS Board
Figure 69. Measure 12 Type 2 and Other Age 18-25 by NHS Board
Figure 70. Measure 12 Type 2 and Other Age 26+ by NHS Board
Scottish Diabetes Survey 2016
135 Scottish Diabetes Survey Monitoring Group
Appendix 1: SCI-Diabetes Data Sources
SCI-Diabetes is NHS Scotland’s diabetes patient management system. It is used in all
fourteen health boards and holds data on all people with diabetes living in Scotland. Its
purpose is to ensure that patients receive the best possible care for their diabetes by
providing authorised members of the healthcare team with the information they require to
effectively manage their patients.
Security and Confidentiality
SCI-Diabetes is available to members of the NHS Scotland healthcare team within the
confines of the NHS intranet. SCI-Diabetes can only be accessed via a secure connection
and data are never shared with any unauthorised third-parties. Diabetes Managed Clinical
Networks have been set up in all NHS Scotland health boards and they have the
responsibility for managing access to SCI-Diabetes.
Data Sources
SCI-Diabetes is used directly by many professionals, but it also receives data from a variety
of data sources in order to maintain its shared electronic record for diabetes. A breakdown of
the main sources at February 2017 is as follows:
Community Health Index (master patient index)
All ~1,000 general practices across Scotland (EMIS, Vision)
42 hospitals (direct data entry on SCI-Diabetes)
13/14 NHS boards linking to local laboratory data (SCI Store – see below)
National Diabetic Retinopathy Screening (DRS) System (Soarian – migrating to Vector in
March 2017)
Inpatient Management: 5 NHS boards linking to local patient administration system for
admission, discharge and transfer data (TOPAS, TrakCare)
Connected Ward Meters: 1 NHS board linking ward-based blood glucose measurements.
Priority implementation area for national diabetes inpatient management programme
Registration onto the system can be initiated via the primary and secondary care feeds,
registration onto the DRS system or web patient administration forms. As part of the DRS
registration process, primary care users are expected to review their SCI-Diabetes lists
periodically to ensure that all patients eligible for screening are held.
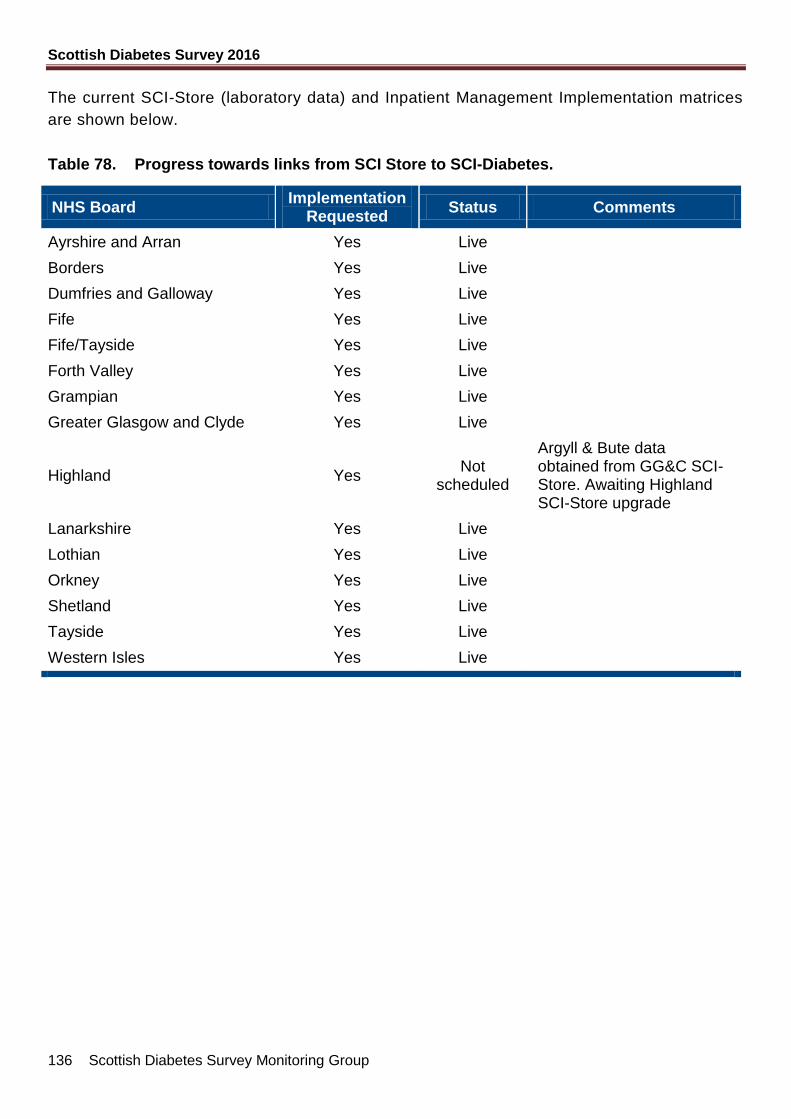
Scottish Diabetes Survey 2016
136 Scottish Diabetes Survey Monitoring Group
The current SCI-Store (laboratory data) and Inpatient Management Implementation matrices
are shown below.
Table 78. Progress towards links from SCI Store to SCI-Diabetes.
NHS Board Implementation
Requested Status Comments
Ayrshire and Arran Yes Live
Borders Yes Live
Dumfries and Galloway Yes Live
Fife Yes Live
Fife/Tayside Yes Live
Forth Valley Yes Live
Grampian Yes Live
Greater Glasgow and Clyde Yes Live
Highland Yes Not
scheduled
Argyll & Bute data obtained from GG&C SCI-Store. Awaiting Highland SCI-Store upgrade
Lanarkshire Yes Live
Lothian Yes Live
Orkney Yes Live
Shetland Yes Live
Tayside Yes Live
Western Isles Yes Live
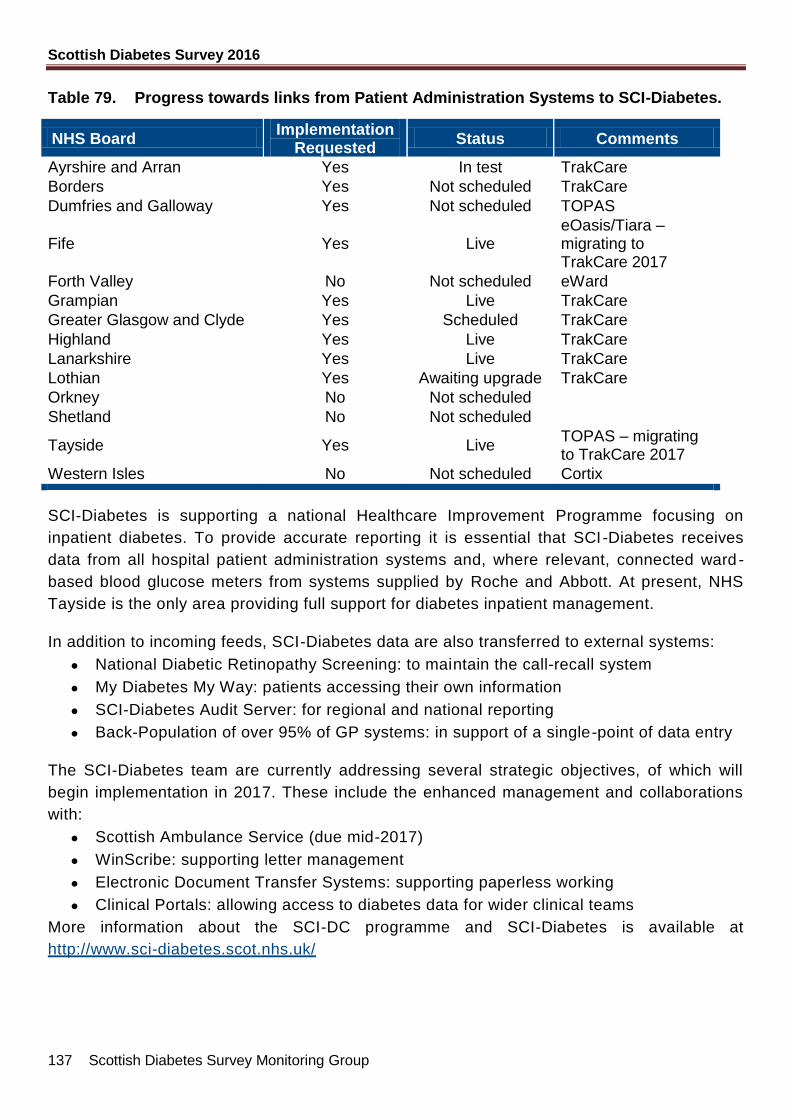
Scottish Diabetes Survey 2016
137 Scottish Diabetes Survey Monitoring Group
Table 79. Progress towards links from Patient Administration Systems to SCI-Diabetes.
NHS Board Implementation
Requested Status Comments
Ayrshire and Arran Yes In test TrakCare
Borders Yes Not scheduled TrakCare
Dumfries and Galloway Yes Not scheduled TOPAS
Fife Yes Live eOasis/Tiara – migrating to TrakCare 2017
Forth Valley No Not scheduled eWard
Grampian Yes Live TrakCare
Greater Glasgow and Clyde Yes Scheduled TrakCare
Highland Yes Live TrakCare
Lanarkshire Yes Live TrakCare
Lothian Yes Awaiting upgrade TrakCare
Orkney No Not scheduled
Shetland No Not scheduled
Tayside Yes Live TOPAS – migrating to TrakCare 2017
Western Isles No Not scheduled Cortix
SCI-Diabetes is supporting a national Healthcare Improvement Programme focusing on
inpatient diabetes. To provide accurate reporting it is essential that SCI-Diabetes receives
data from all hospital patient administration systems and, where relevant, connected ward -
based blood glucose meters from systems supplied by Roche and Abbott. At present, NHS
Tayside is the only area providing full support for diabetes inpatient management.
In addition to incoming feeds, SCI-Diabetes data are also transferred to external systems:
National Diabetic Retinopathy Screening: to maintain the call-recall system
My Diabetes My Way: patients accessing their own information
SCI-Diabetes Audit Server: for regional and national reporting
Back-Population of over 95% of GP systems: in support of a single-point of data entry
The SCI-Diabetes team are currently addressing several strategic objectives, of which will
begin implementation in 2017. These include the enhanced management and collaborations
with:
Scottish Ambulance Service (due mid-2017)
WinScribe: supporting letter management
Electronic Document Transfer Systems: supporting paperless working
Clinical Portals: allowing access to diabetes data for wider clinical teams
More information about the SCI-DC programme and SCI-Diabetes is available at
http://www.sci-diabetes.scot.nhs.uk/
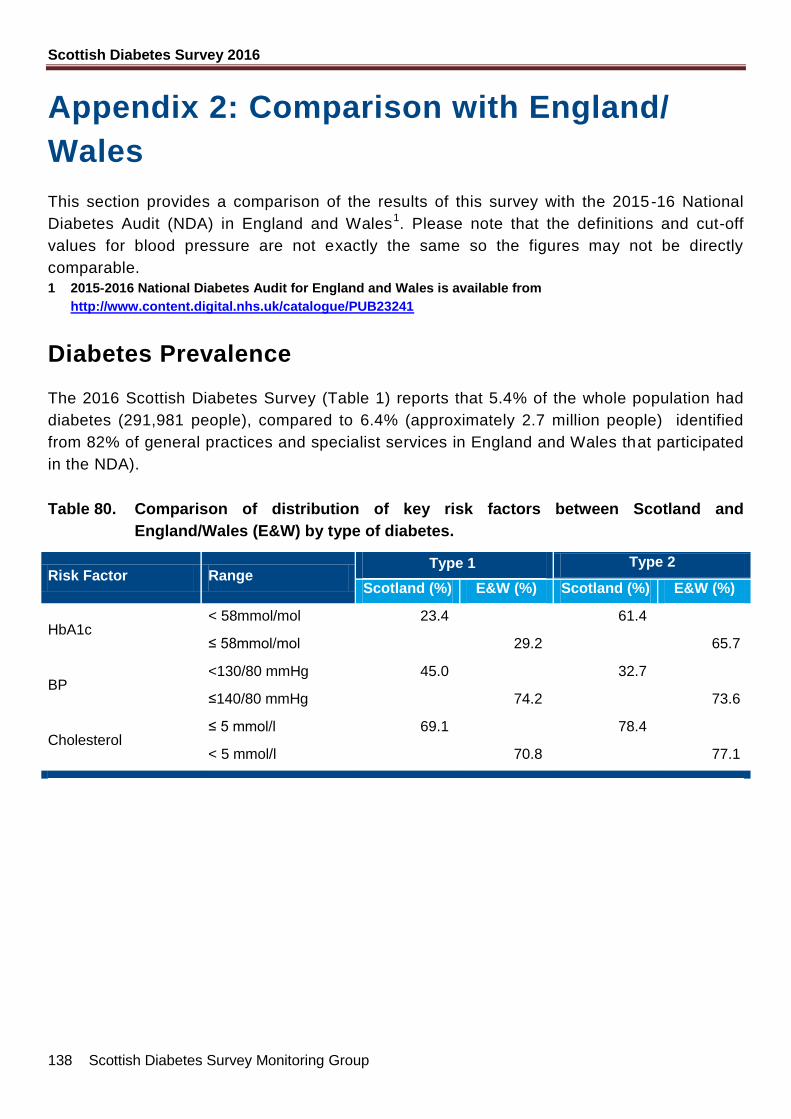
Scottish Diabetes Survey 2016
138 Scottish Diabetes Survey Monitoring Group
Appendix 2: Comparison with England/
Wales
This section provides a comparison of the results of this survey with the 2015-16 National
Diabetes Audit (NDA) in England and Wales1. Please note that the definitions and cut-off
values for blood pressure are not exactly the same so the figures may not be directly
comparable.
1 2015-2016 National Diabetes Audit for England and Wales is available from
http://www.content.digital.nhs.uk/catalogue/PUB23241
Diabetes Prevalence
The 2016 Scottish Diabetes Survey (Table 1) reports that 5.4% of the whole population had
diabetes (291,981 people), compared to 6.4% (approximately 2.7 million people) identified
from 82% of general practices and specialist services in England and Wales that participated
in the NDA).
Table 80. Comparison of distribution of key risk factors between Scotland and
England/Wales (E&W) by type of diabetes.
Risk Factor Range Type 1 Type 2
Scotland (%) E&W (%) Scotland (%) E&W (%)
HbA1c < 58mmol/mol 23.4 61.4
≤ 58mmol/mol 29.2 65.7
BP <130/80 mmHg 45.0 32.7
≤140/80 mmHg 74.2 73.6
Cholesterol ≤ 5 mmol/l 69.1 78.4
< 5 mmol/l 70.8 77.1
Scottish Diabetes Survey 2016
139 Scottish Diabetes Survey Monitoring Group
Appendix 3: Variability of HbA1c
In Scotland laboratory services are provided by 14 separately funded Health Boards from
multiple sites. A range of technologies are used in those various sites, including ion
exchange, affinity chromatography and immunoassay, and historically these assays had not
shown good agreement, even after 2011 when all systems were calibrated against IFCC
standards,. This could give the appearance of significant differences in glycaemic control
between boards. Considerable effort has been made across Scotland, in collaboration with
technology companies, to reduce these discrepancies, and during the course of 2015
methods-specific bias (consistent deviation from all-method mean values) observed in the UK
National External Quality Assurance Scheme (NEQAS) improved considerably, and although
2015 data will still be influenced, data from 2016 onwards should be broadly comparable
across Scottish laboratories
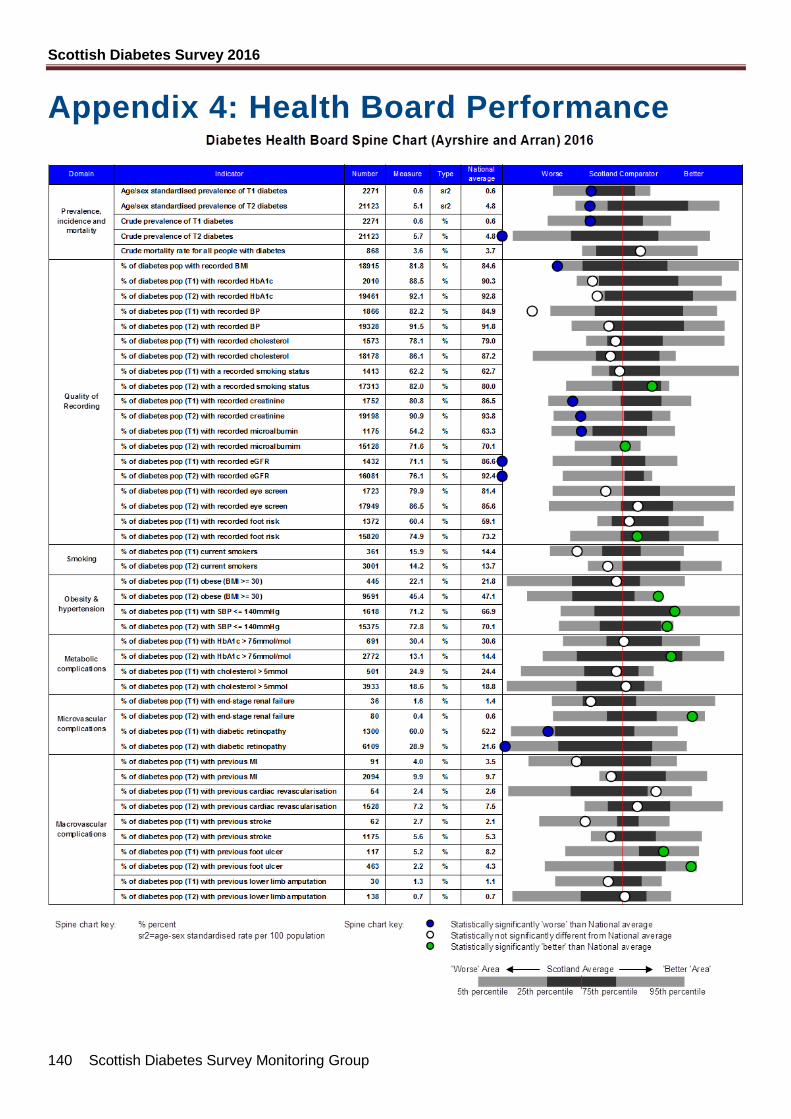
Scottish Diabetes Survey 2016
140 Scottish Diabetes Survey Monitoring Group
Appendix 4: Health Board Performance
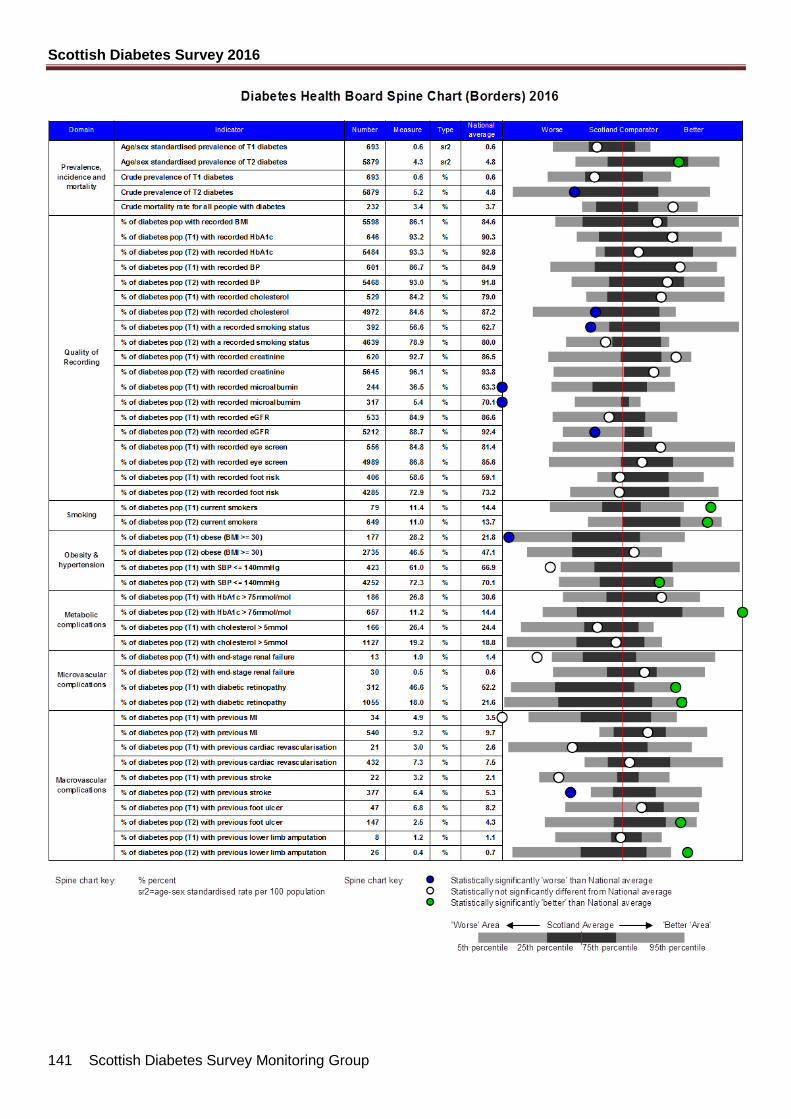
Scottish Diabetes Survey 2016
141 Scottish Diabetes Survey Monitoring Group
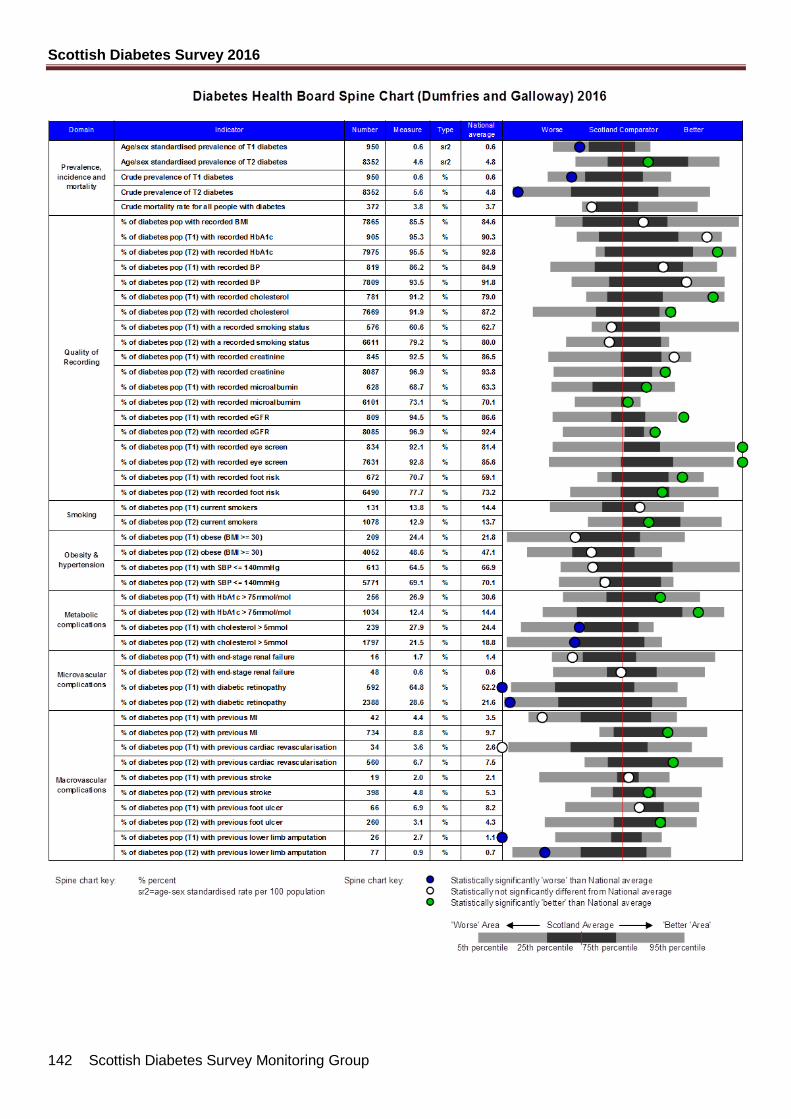
Scottish Diabetes Survey 2016
142 Scottish Diabetes Survey Monitoring Group
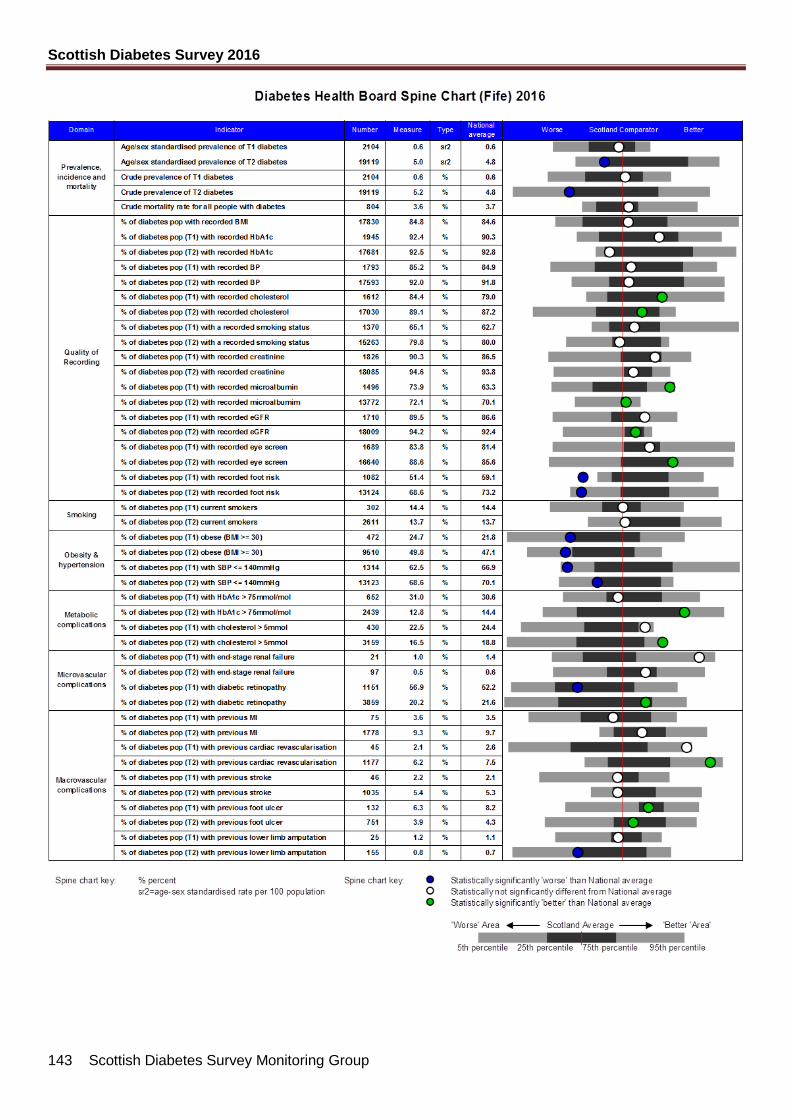
Scottish Diabetes Survey 2016
143 Scottish Diabetes Survey Monitoring Group
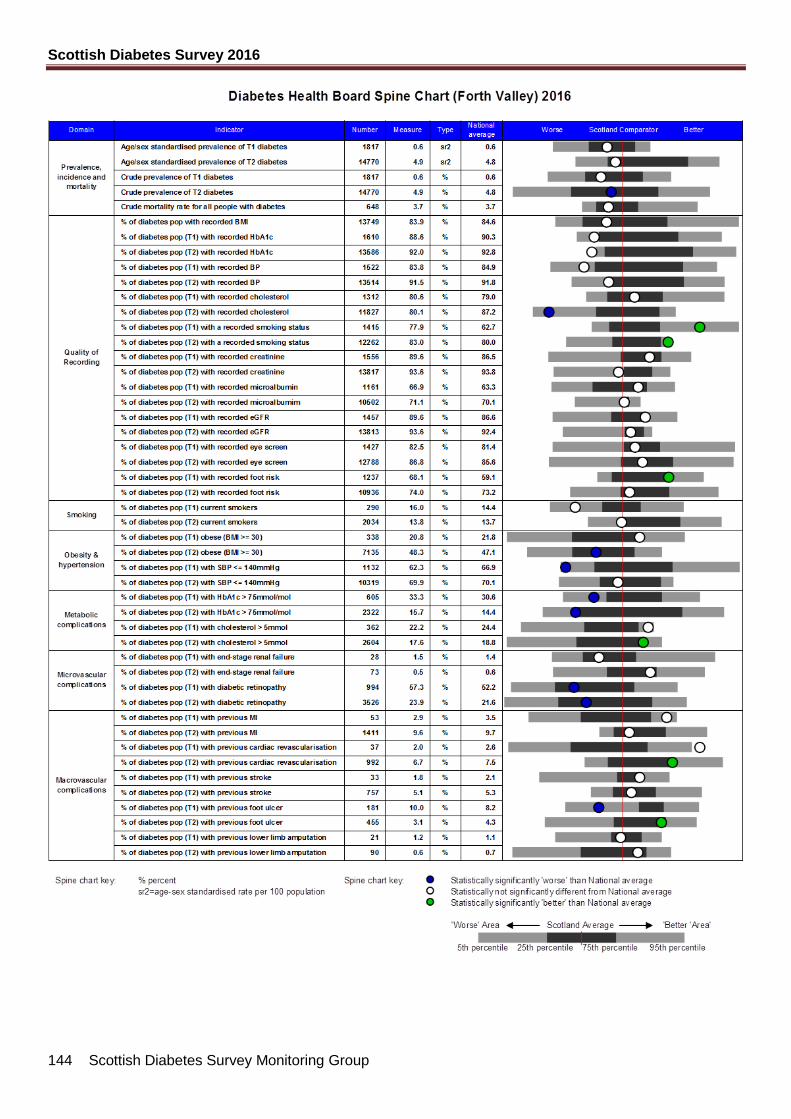
Scottish Diabetes Survey 2016
144 Scottish Diabetes Survey Monitoring Group
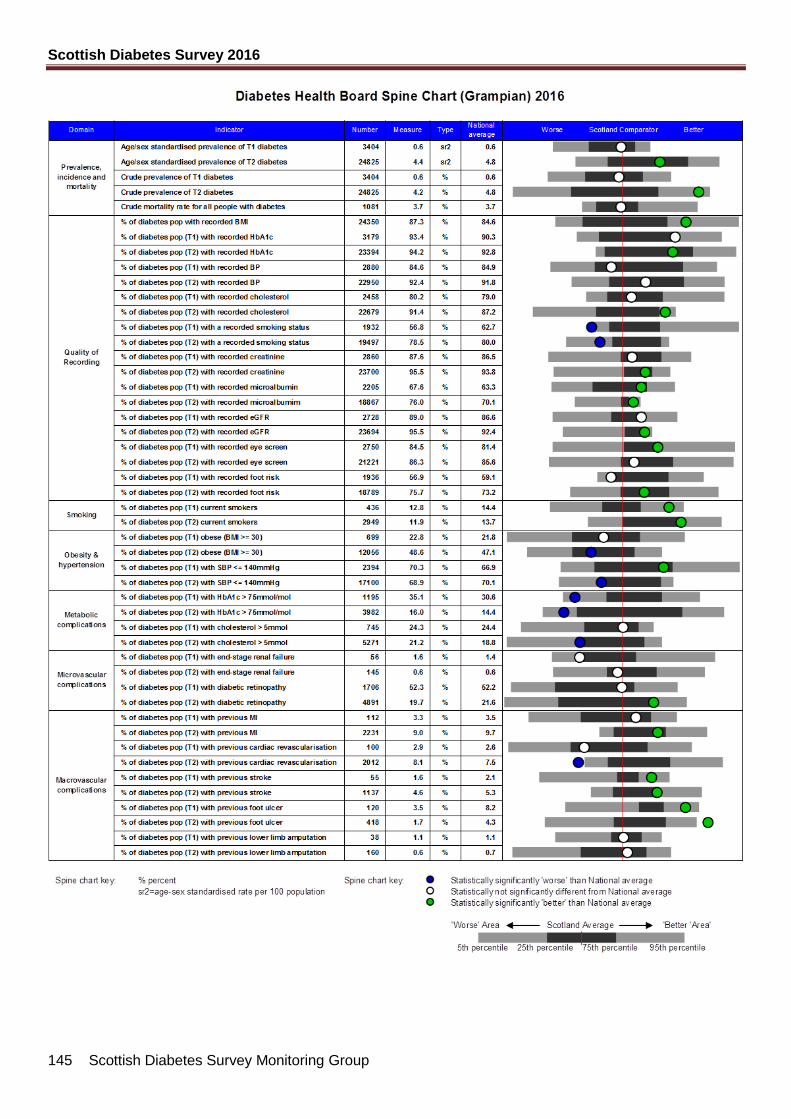
Scottish Diabetes Survey 2016
145 Scottish Diabetes Survey Monitoring Group
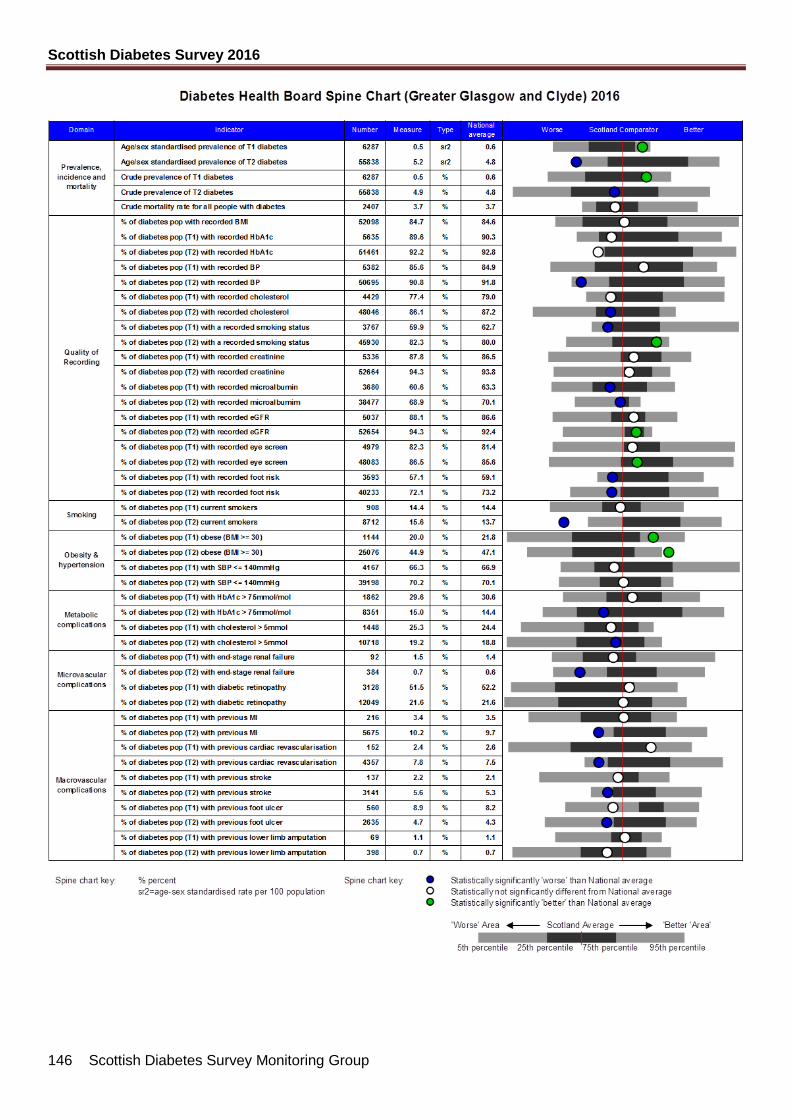
Scottish Diabetes Survey 2016
146 Scottish Diabetes Survey Monitoring Group
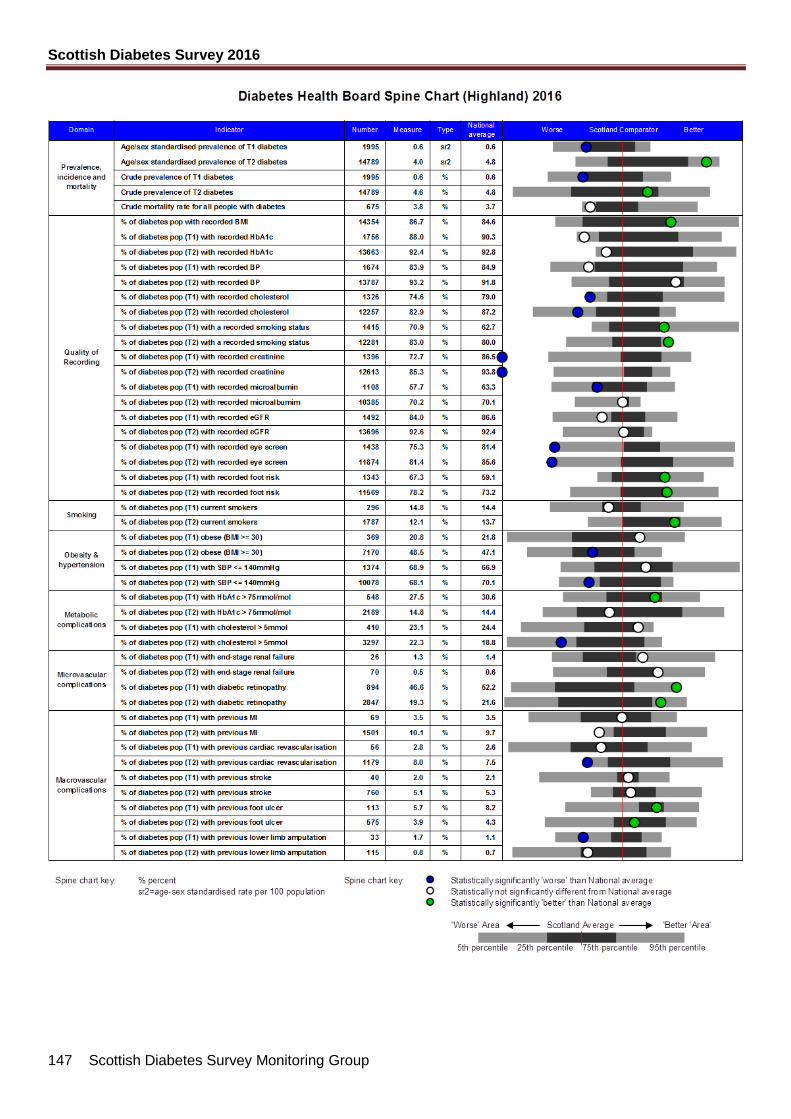
Scottish Diabetes Survey 2016
147 Scottish Diabetes Survey Monitoring Group
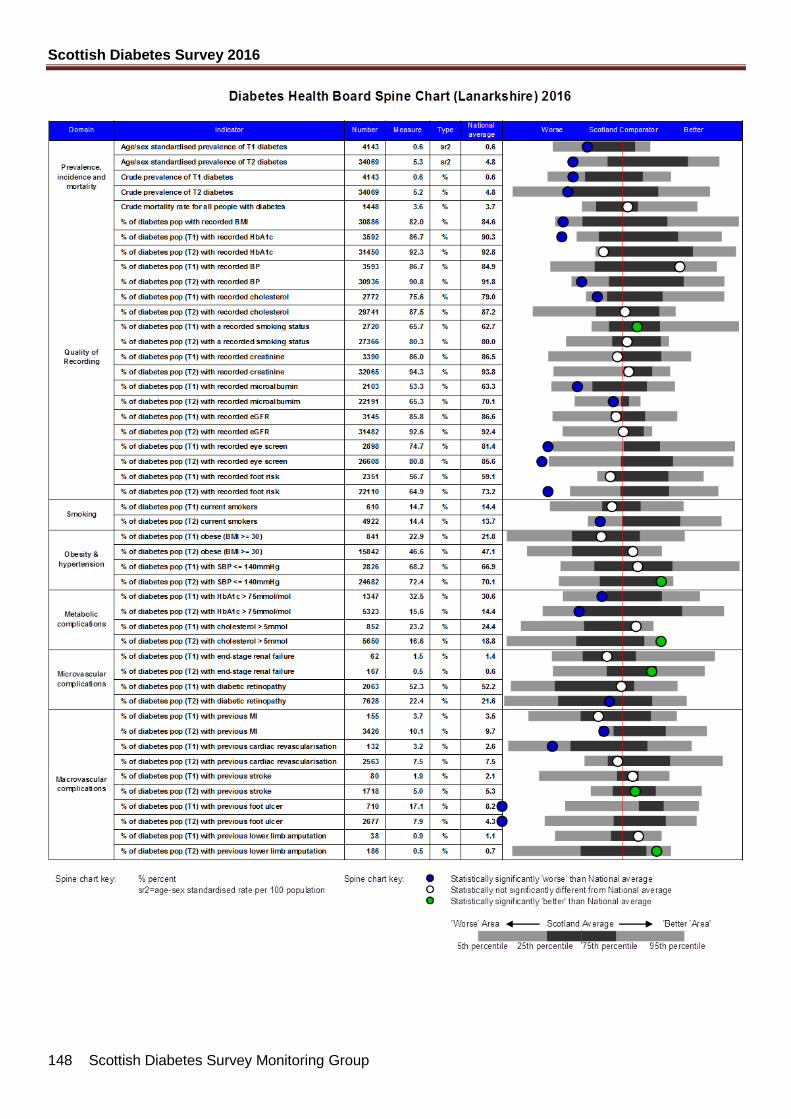
Scottish Diabetes Survey 2016
148 Scottish Diabetes Survey Monitoring Group
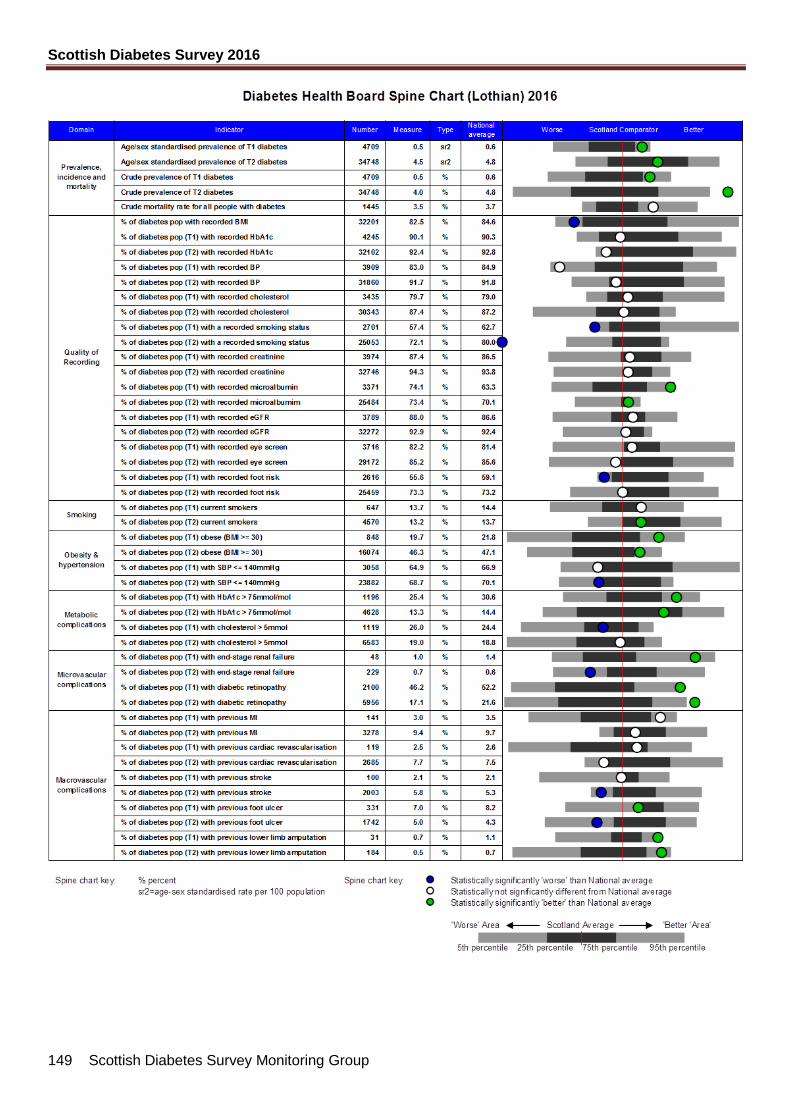
Scottish Diabetes Survey 2016
149 Scottish Diabetes Survey Monitoring Group
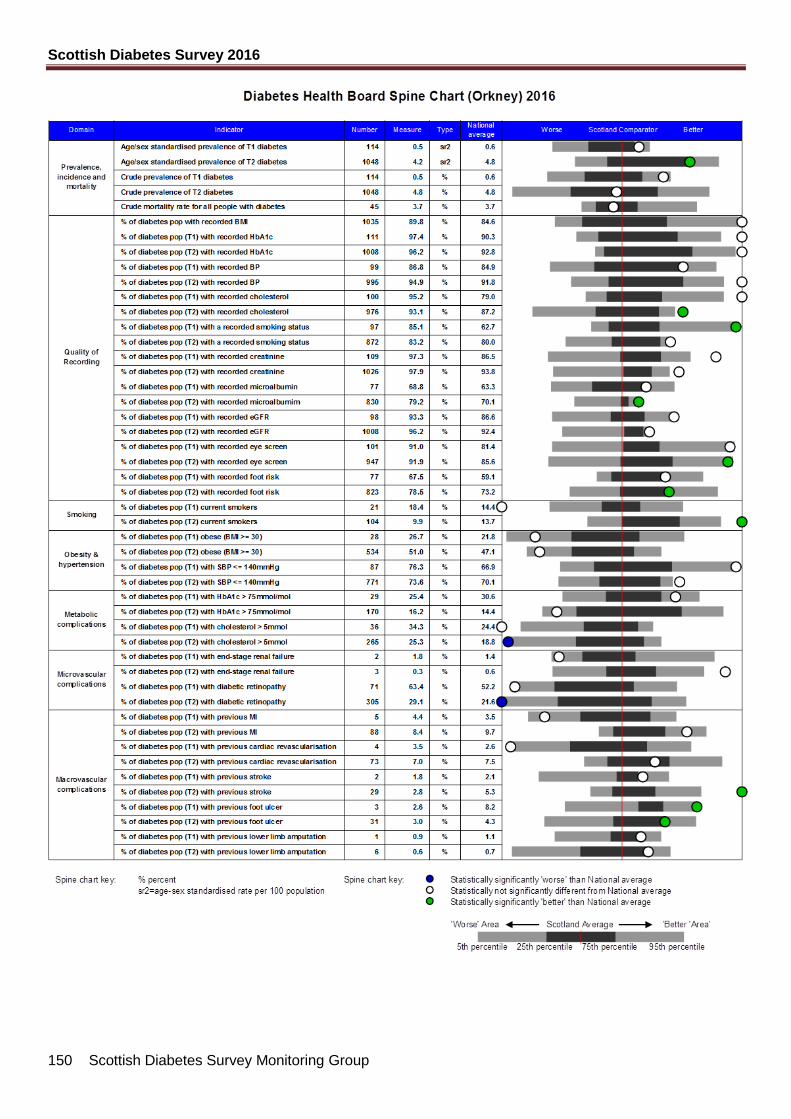
Scottish Diabetes Survey 2016
150 Scottish Diabetes Survey Monitoring Group
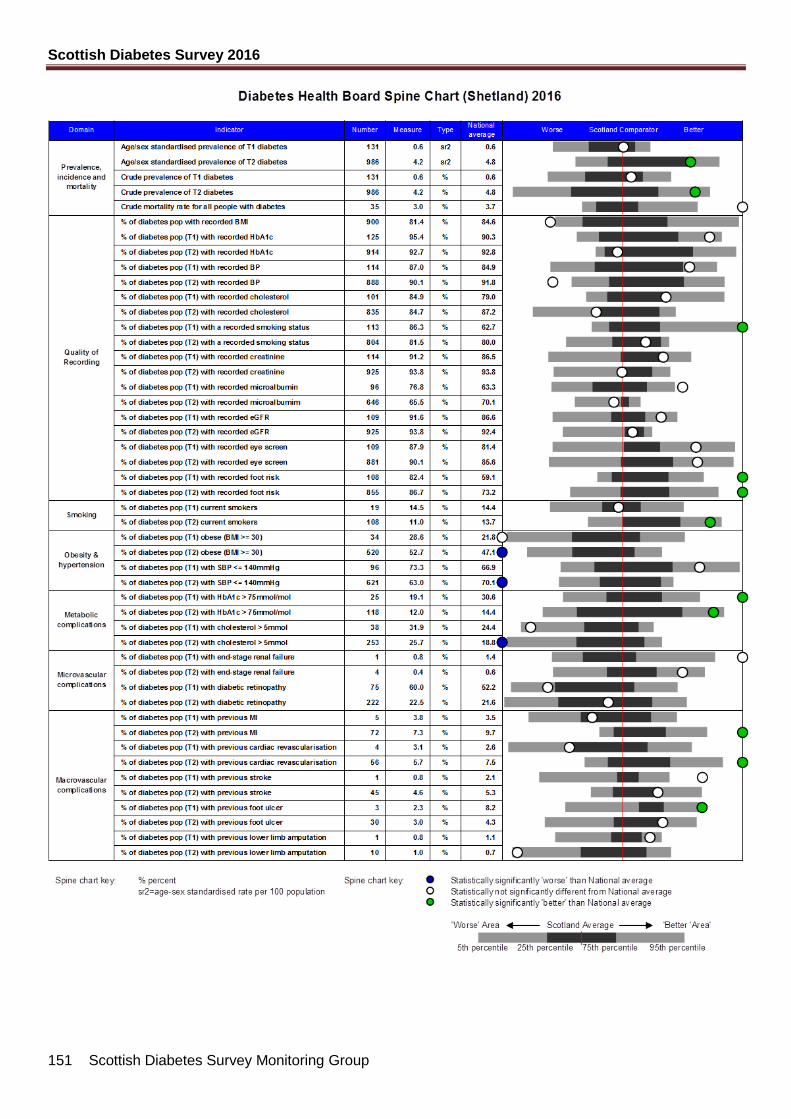
Scottish Diabetes Survey 2016
151 Scottish Diabetes Survey Monitoring Group
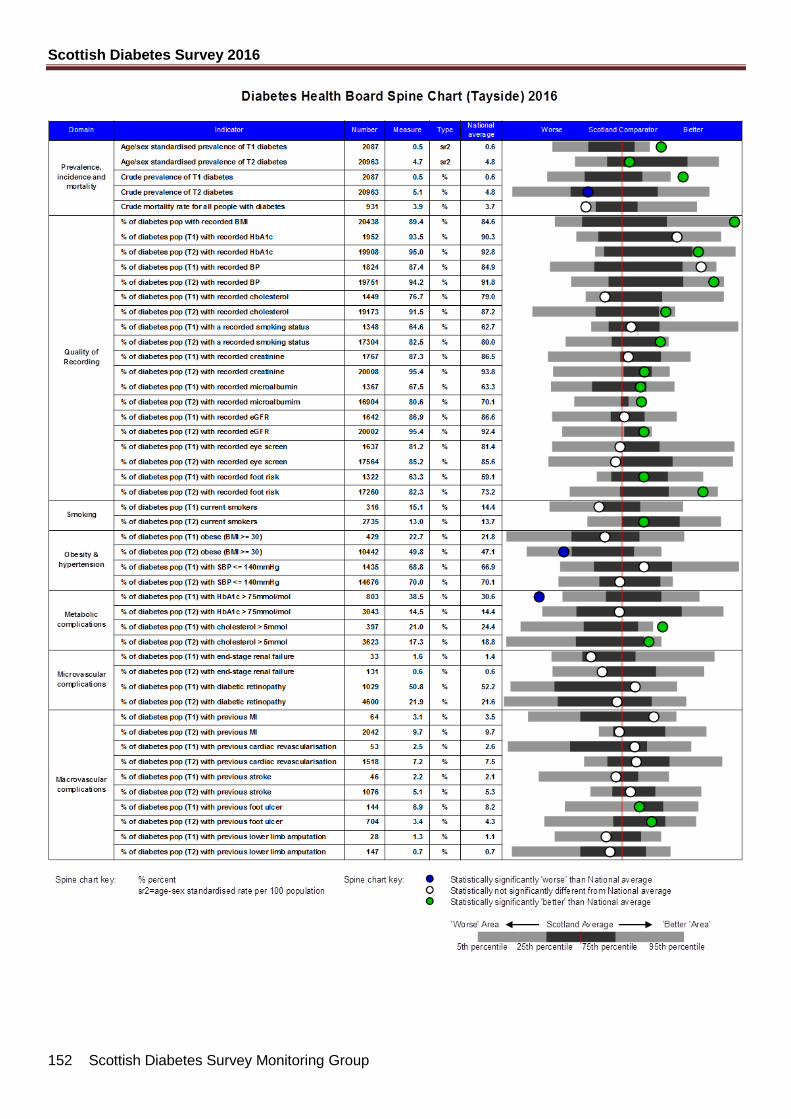
Scottish Diabetes Survey 2016
152 Scottish Diabetes Survey Monitoring Group

Scottish Diabetes Survey 2016
153 Scottish Diabetes Survey Monitoring Group