Embed Size (px)
Citation preview
STATE BOARD OF EDUCATION PERFORMANCE MEASURES
Scott GrotheAccountability Program Manager
October 19, 2011
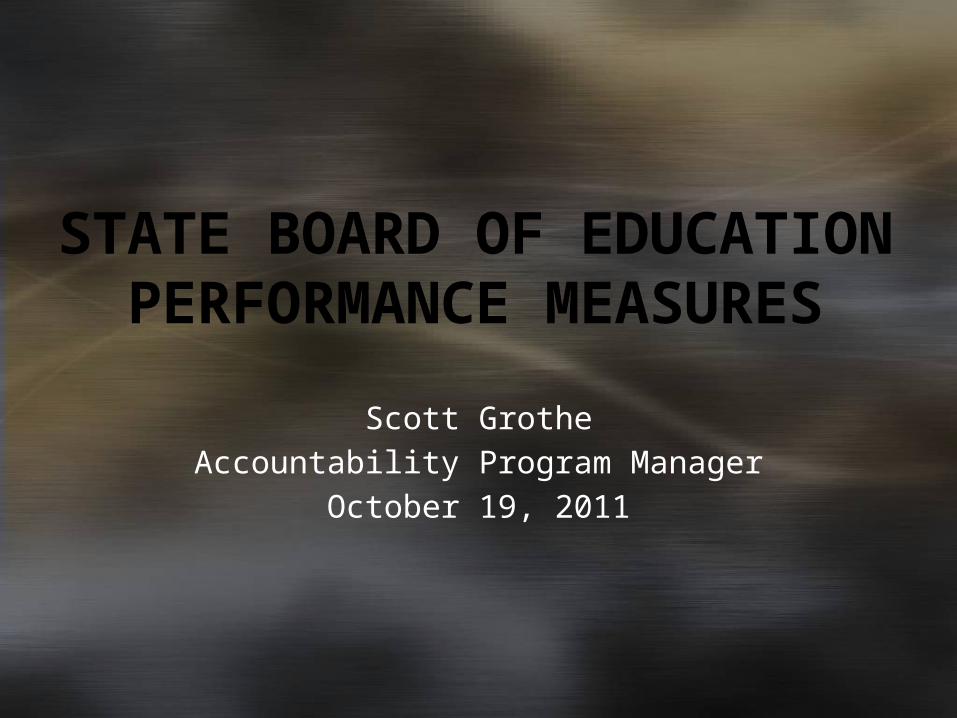
What you’re about to see…
Performance measures from the Board’s Strategic Plan
Performance & profile measures from the DFM Reports
Additional measures requested by the Board IPEDS data No direct Idaho comparisons among Idaho
institutions Peer comparisons for BSU, EITC, ISU LCSC, & U of I
on… Following questions…an additional peer comparison
intended to begin a discussion on efficiency measures that could be used next year
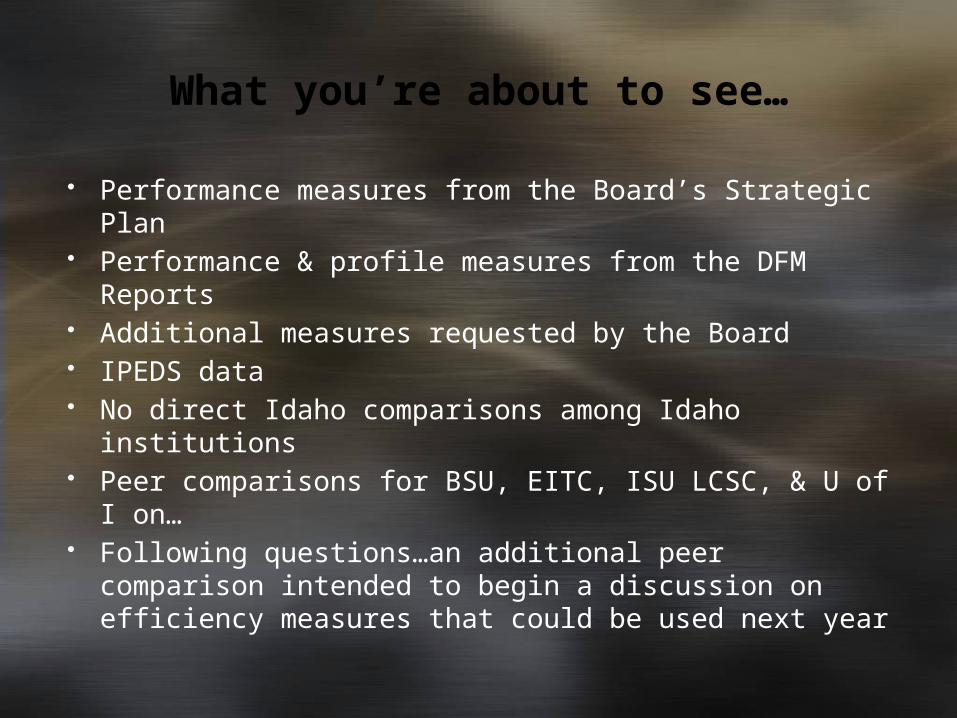
Percent of Idahoans age 25 to 34 who have an Associate’s degree or higher G1OB
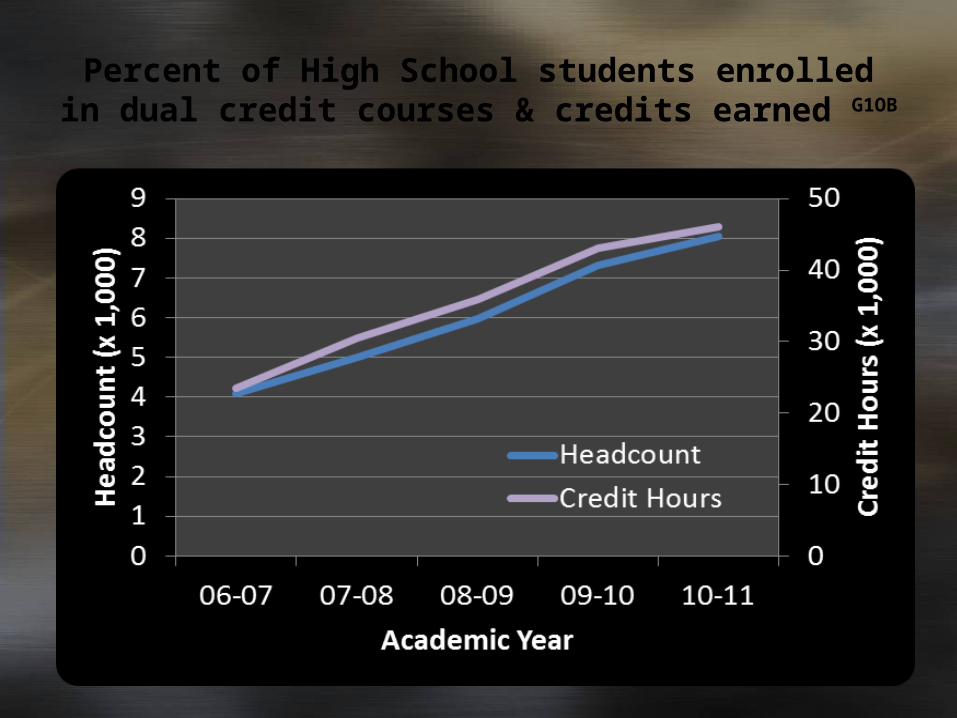
Percent of High School students enrolled in dual credit courses & credits earned G1OB
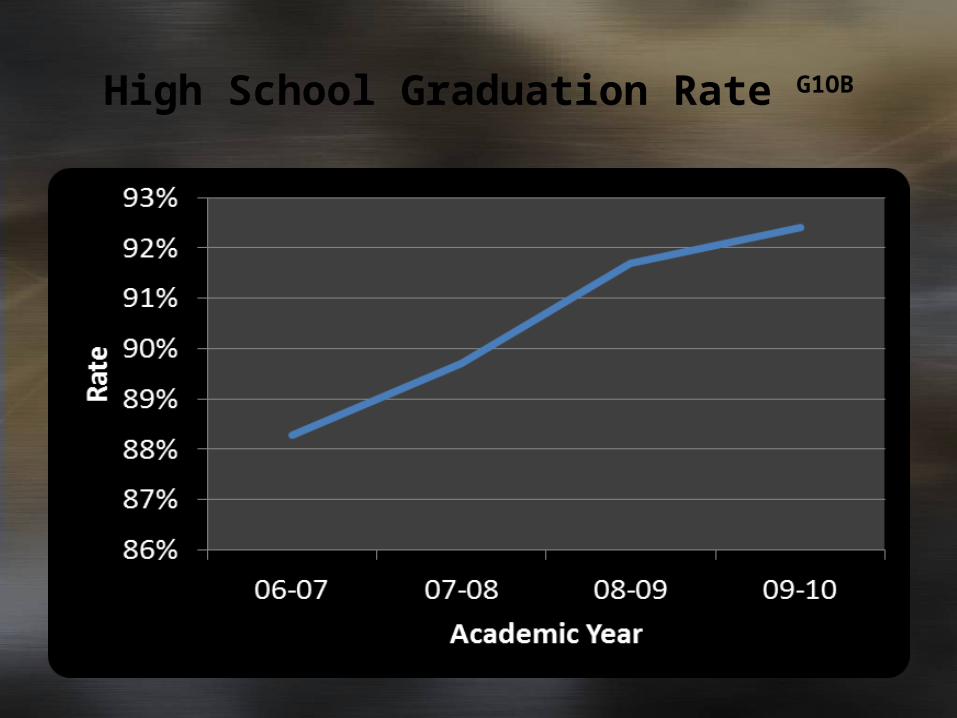
High School Graduation Rate G1OB

Percent of High School graduates who enroll in a postsecondary institution within 12 months of
graduation G1OB
Idaho
US
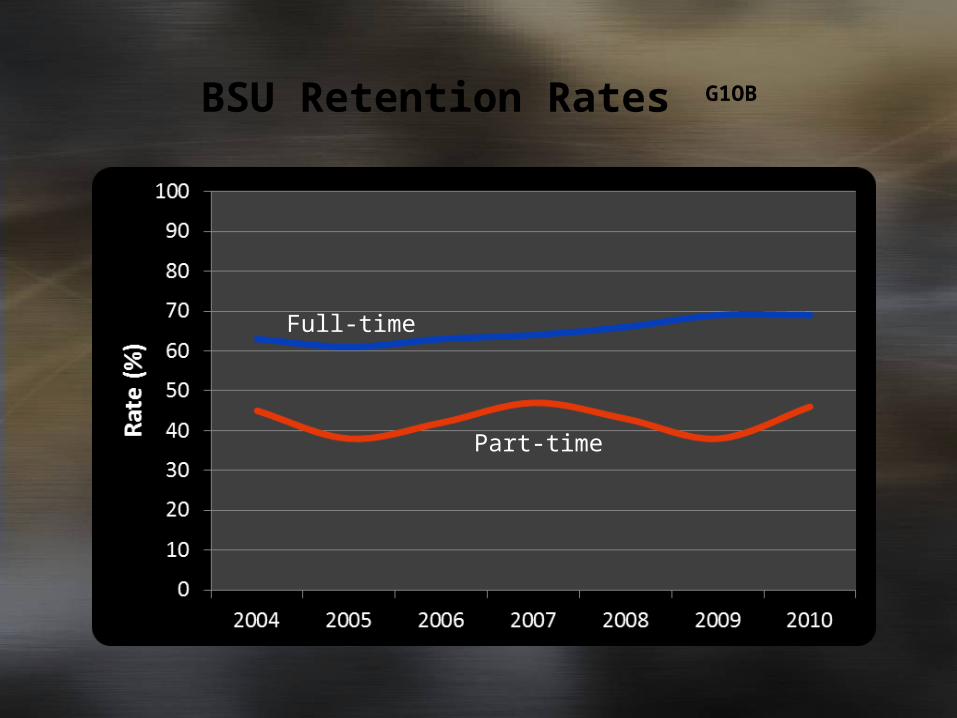
BSU Retention Rates G1OB
Full-time
Part-time
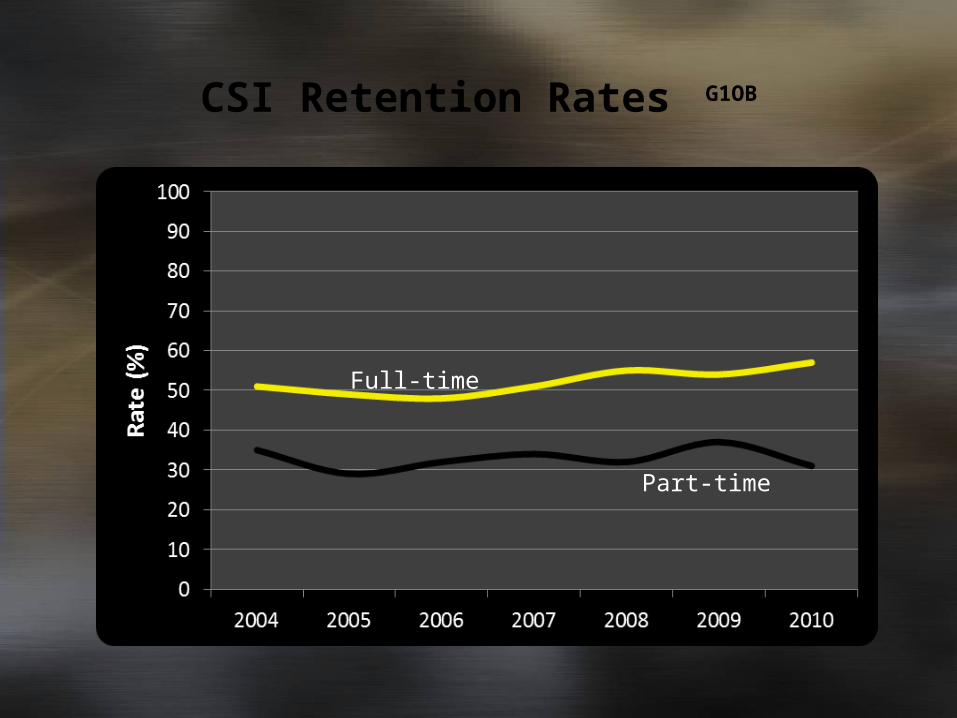
CSI Retention Rates G1OB
Part-time
Full-time
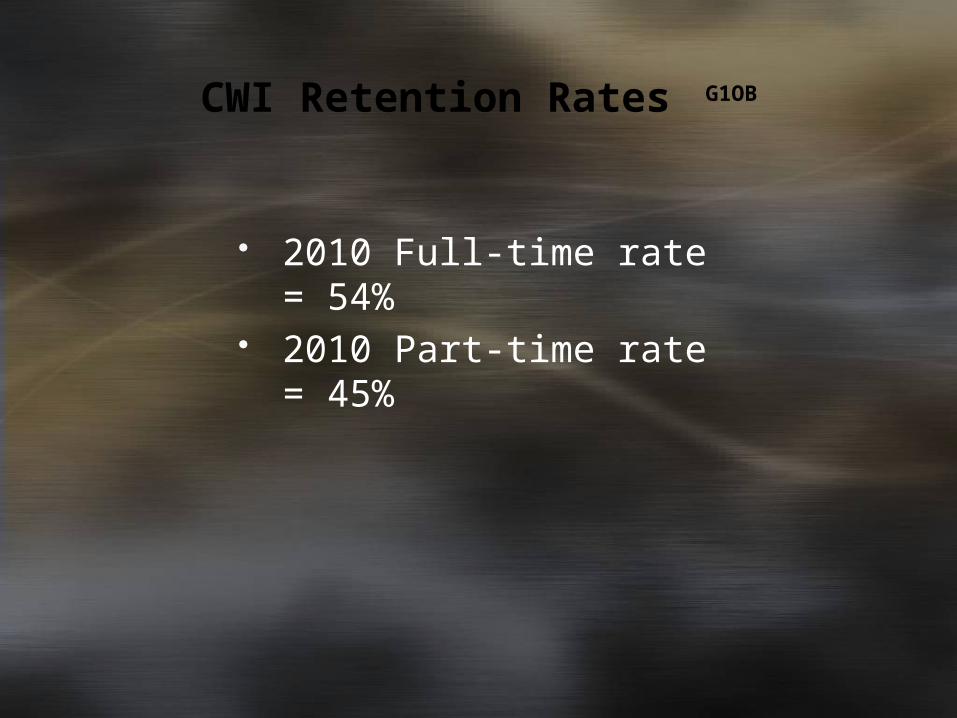
CWI Retention Rates G1OB
2010 Full-time rate = 54%
2010 Part-time rate = 45%

EITC Retention Rates G1OB
Full-time
Part-time
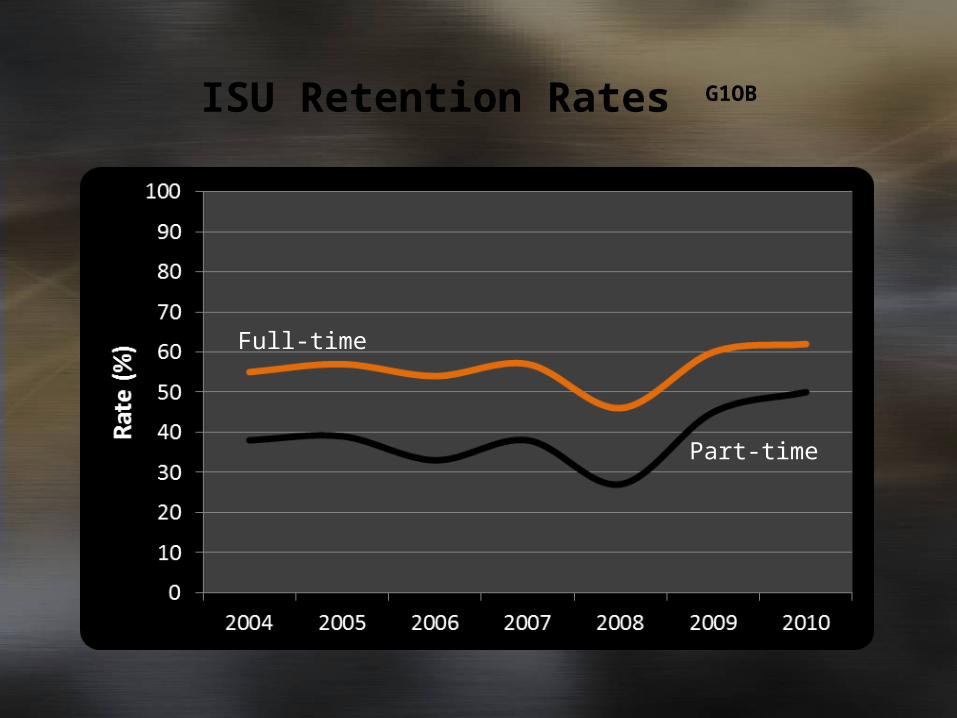
ISU Retention Rates G1OB
Full-time
Part-time

LCSC Retention Rates G1OB
Full-time
Part-time
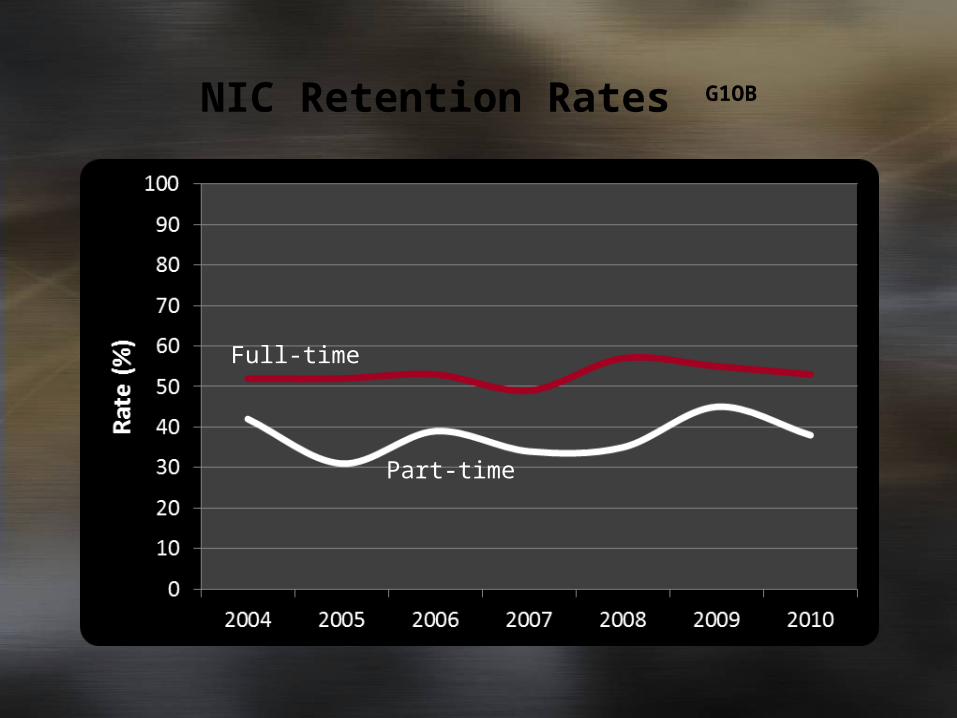
NIC Retention Rates G1OB
Full-time
Part-time
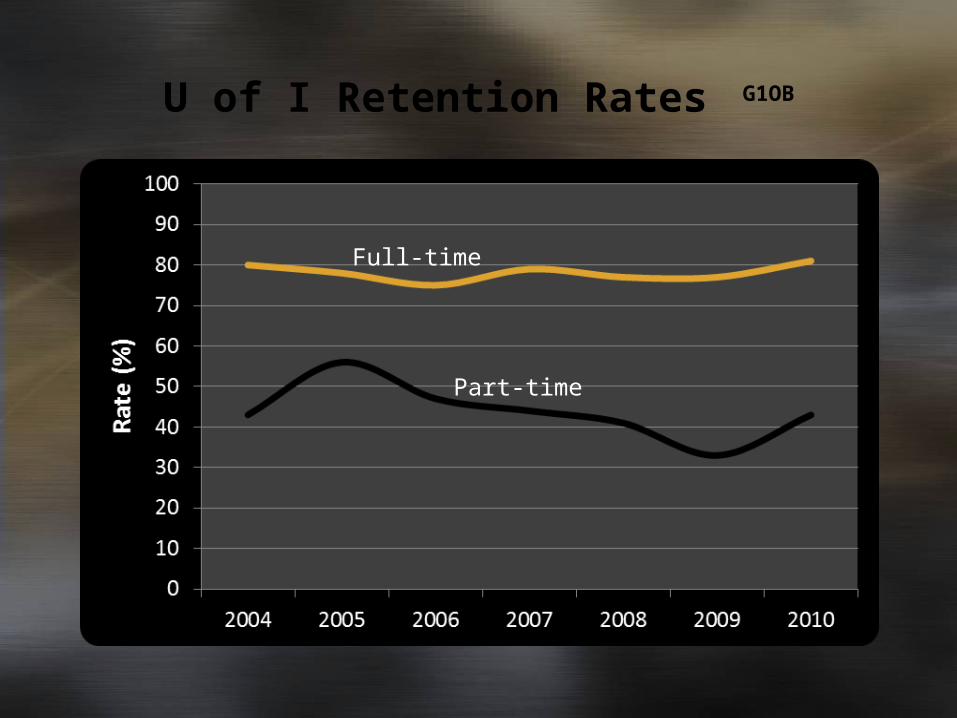
U of I Retention Rates G1OB
Full-time
Part-time
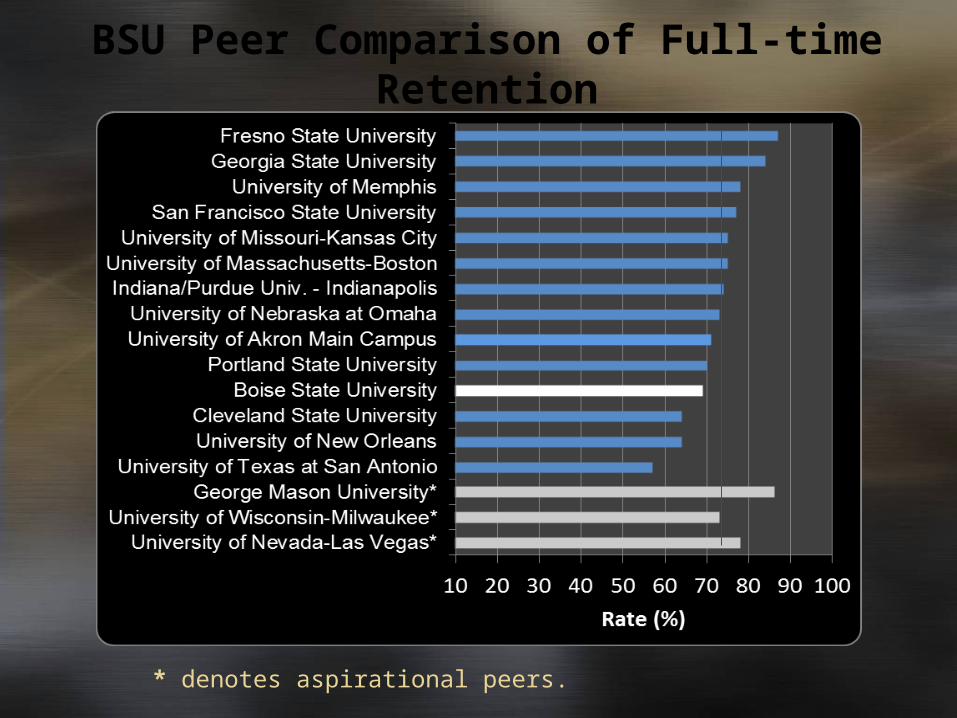
BSU Peer Comparison of Full-time Retention
* denotes aspirational peers.
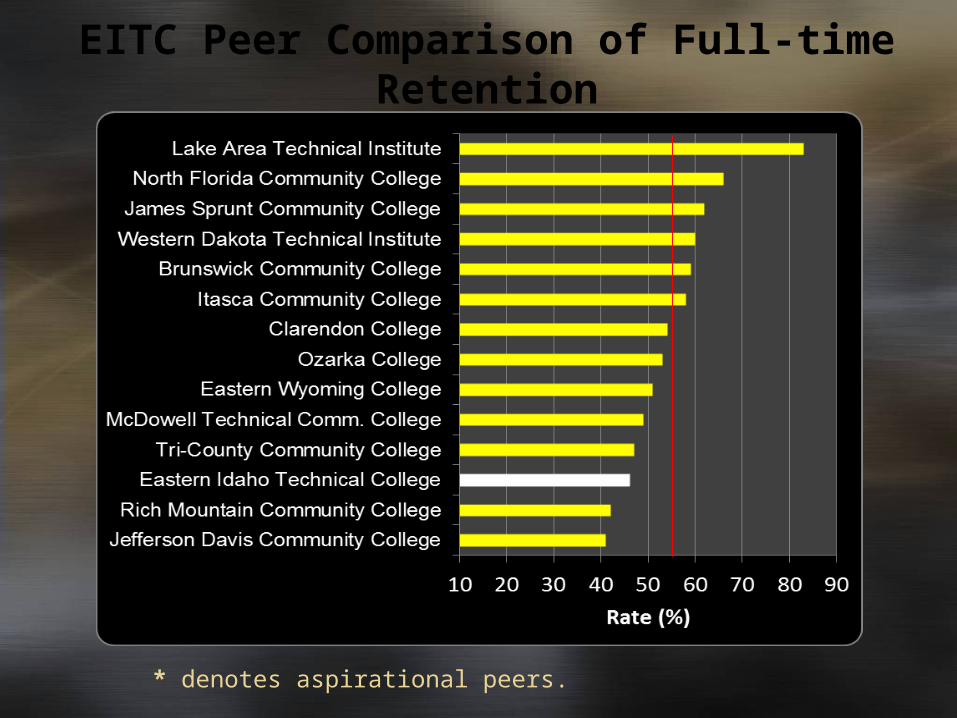
EITC Peer Comparison of Full-time Retention
* denotes aspirational peers.
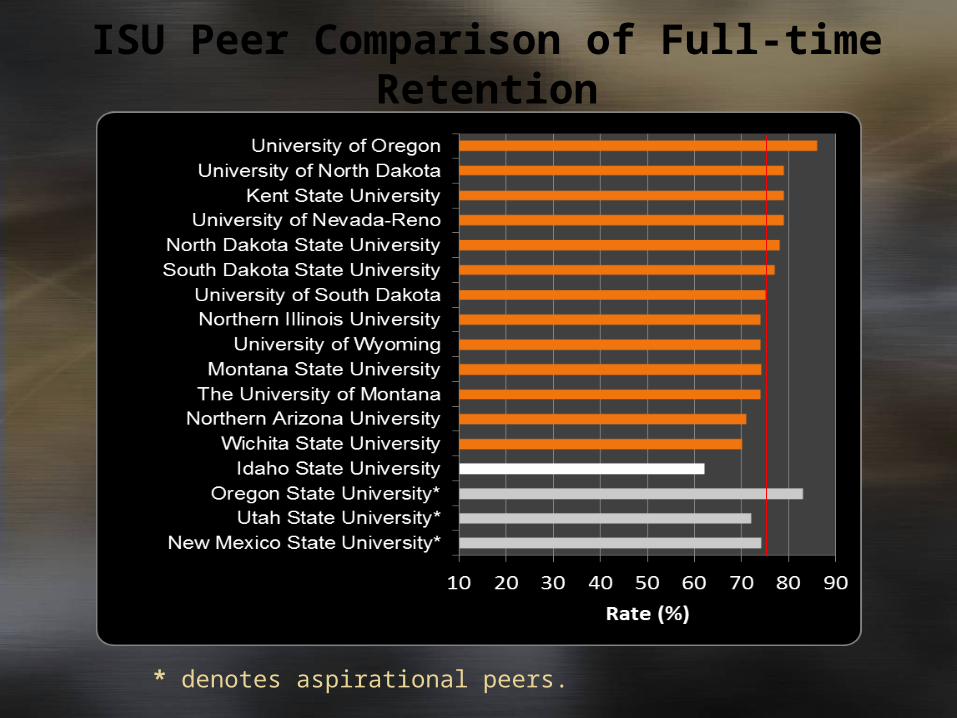
ISU Peer Comparison of Full-time Retention
* denotes aspirational peers.
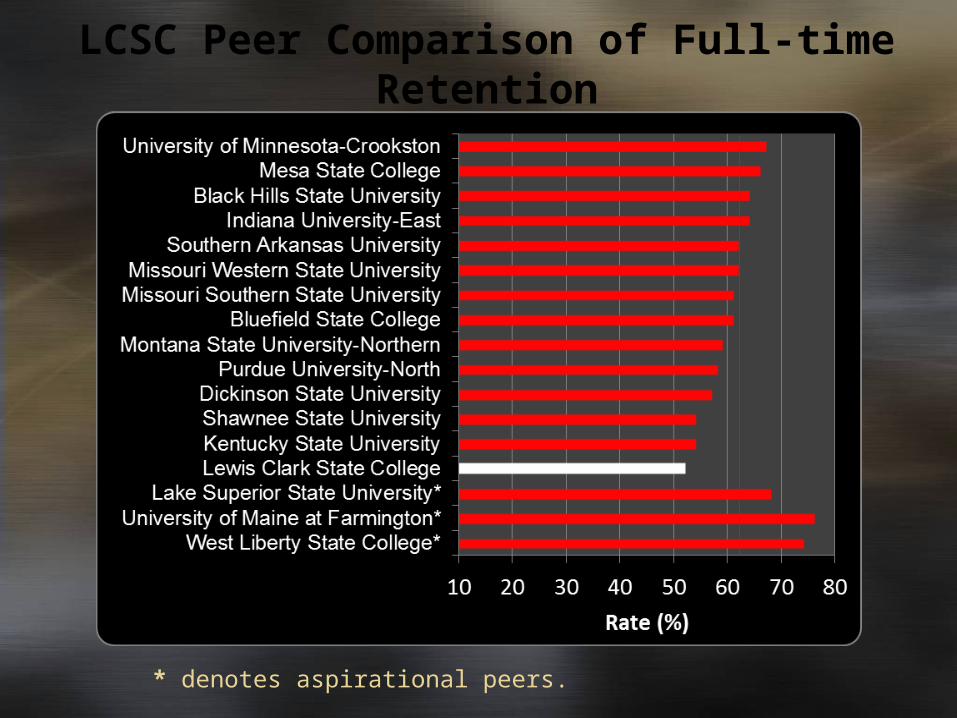
LCSC Peer Comparison of Full-time Retention
* denotes aspirational peers.
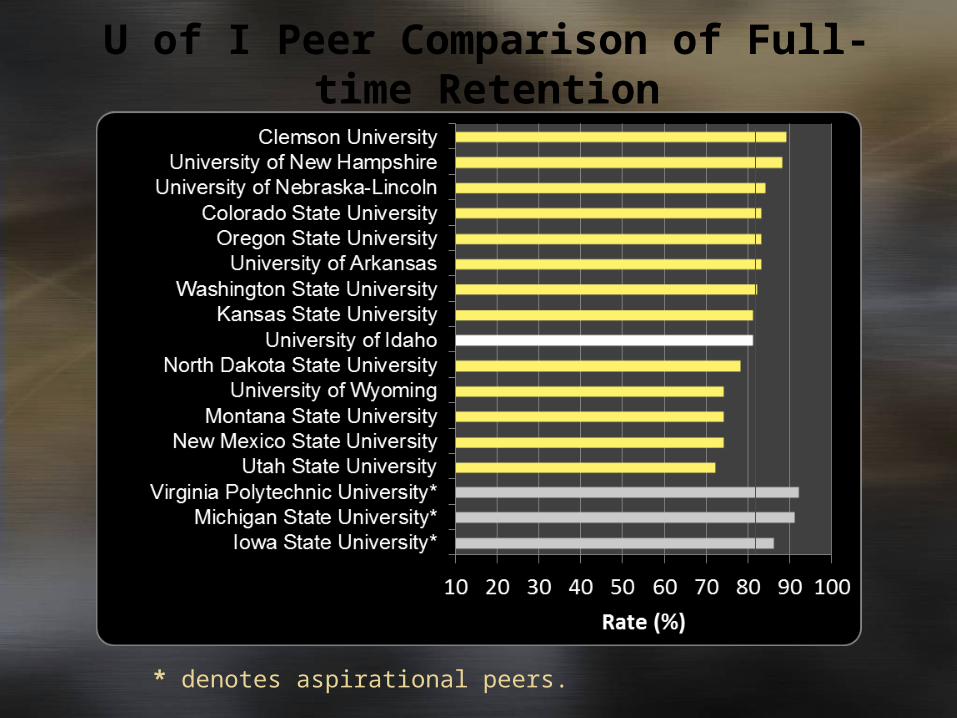
U of I Peer Comparison of Full-time Retention
* denotes aspirational peers.

BSU Degrees & Certificates
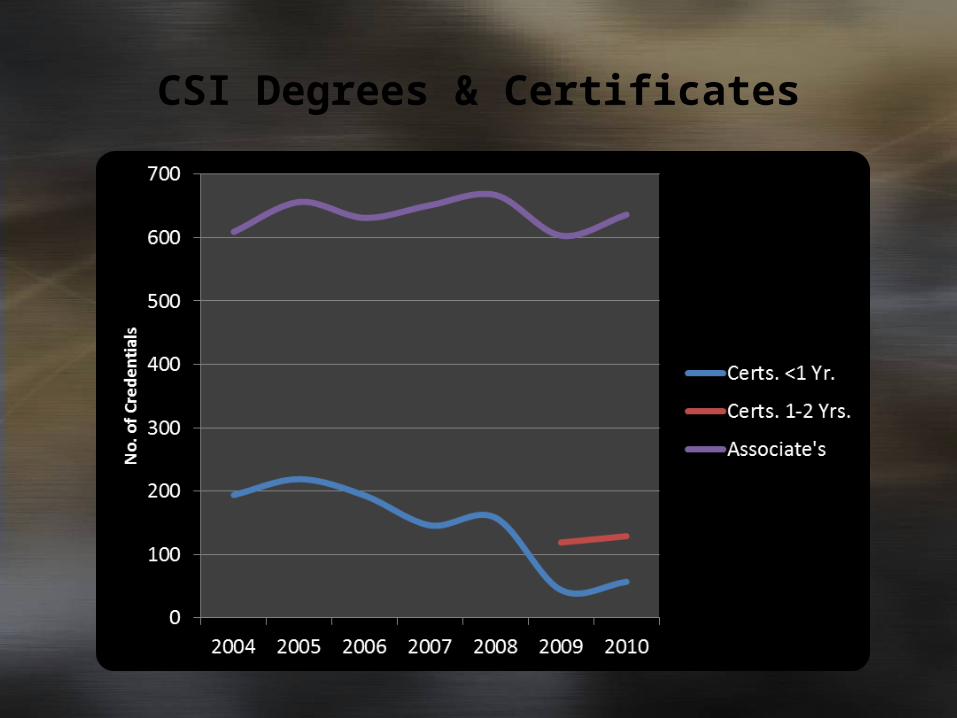
CSI Degrees & Certificates

CWI Degrees & Certificates
For 2010 27 Certificates of < 1 Year 28 Certificates of 1 to 2 Years 146 Associate’s Degrees
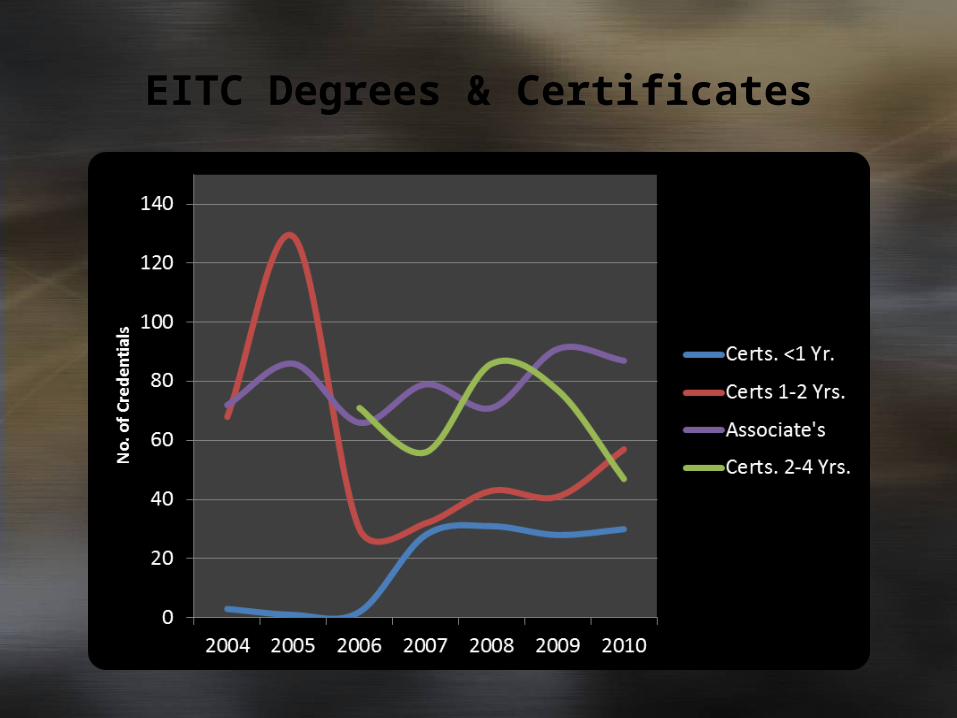
EITC Degrees & Certificates
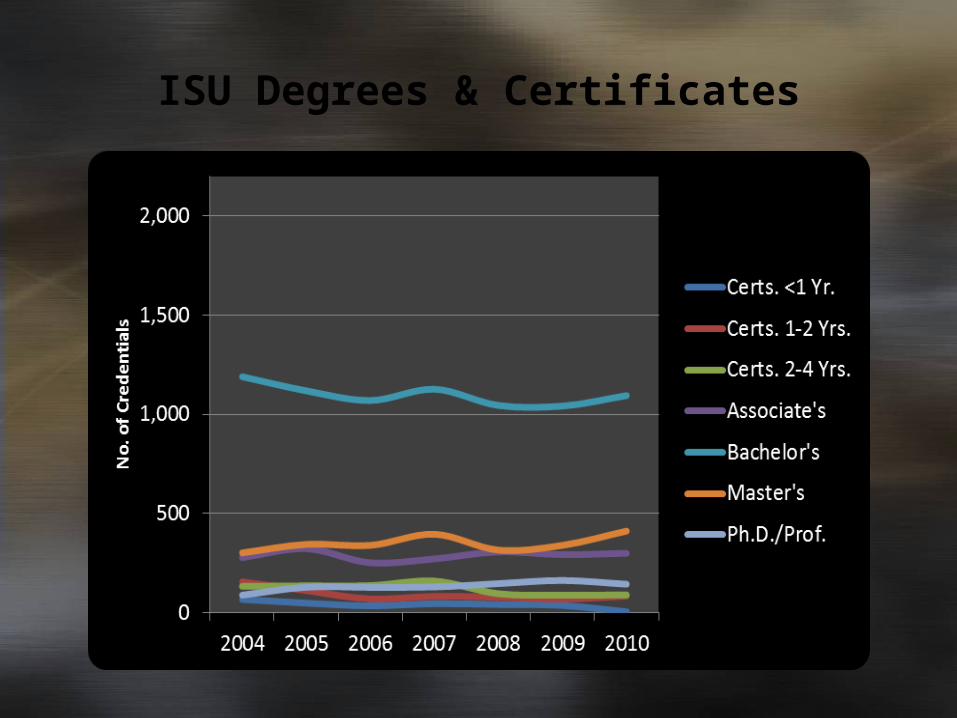
ISU Degrees & Certificates
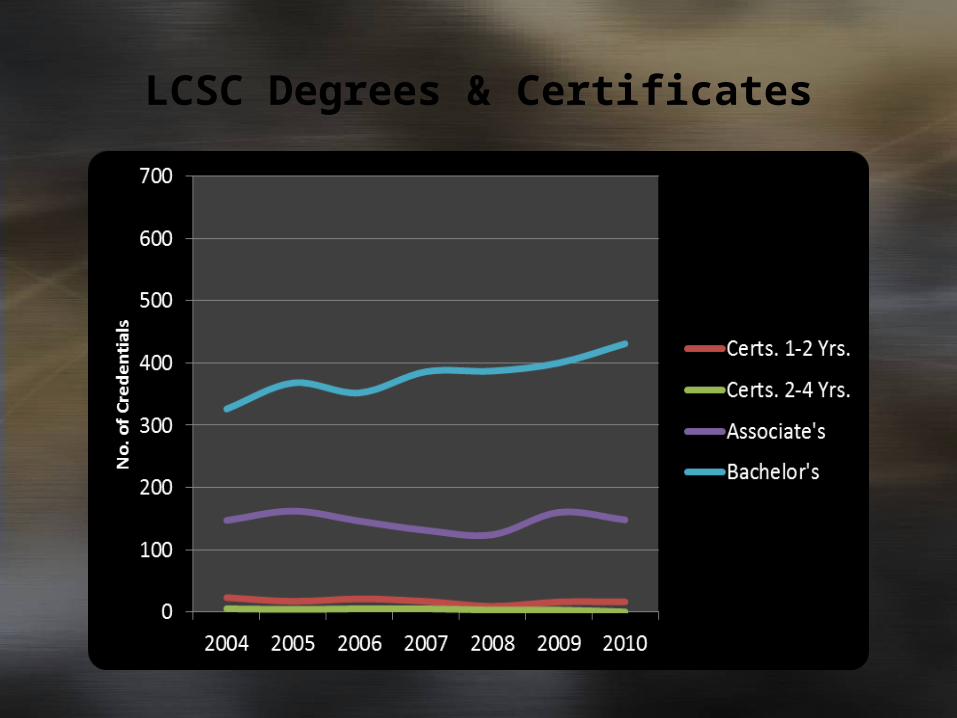
LCSC Degrees & Certificates
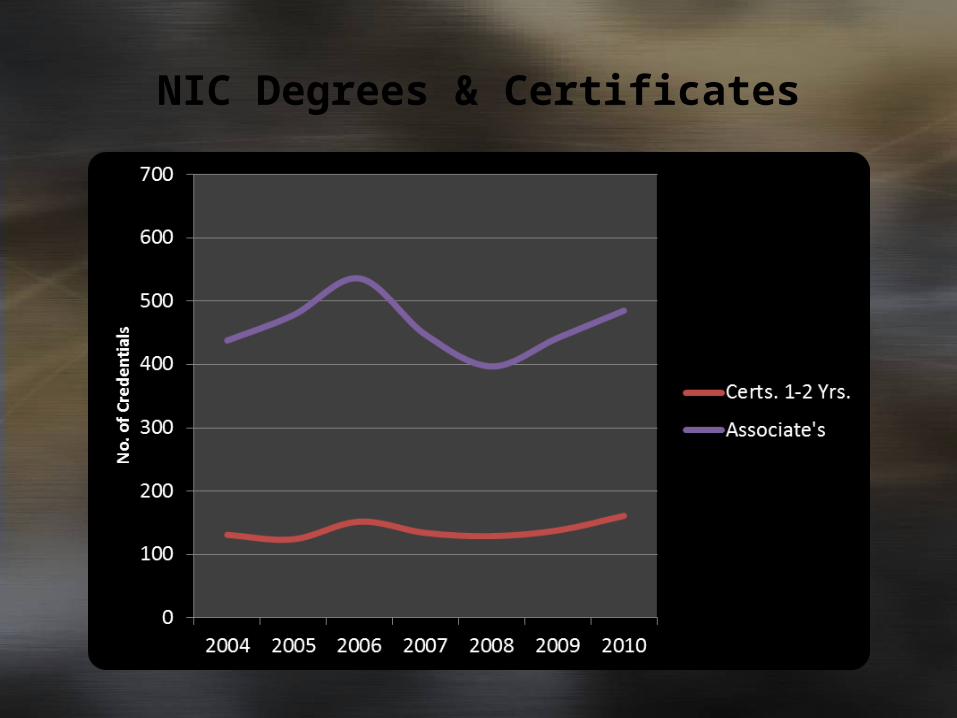
NIC Degrees & Certificates
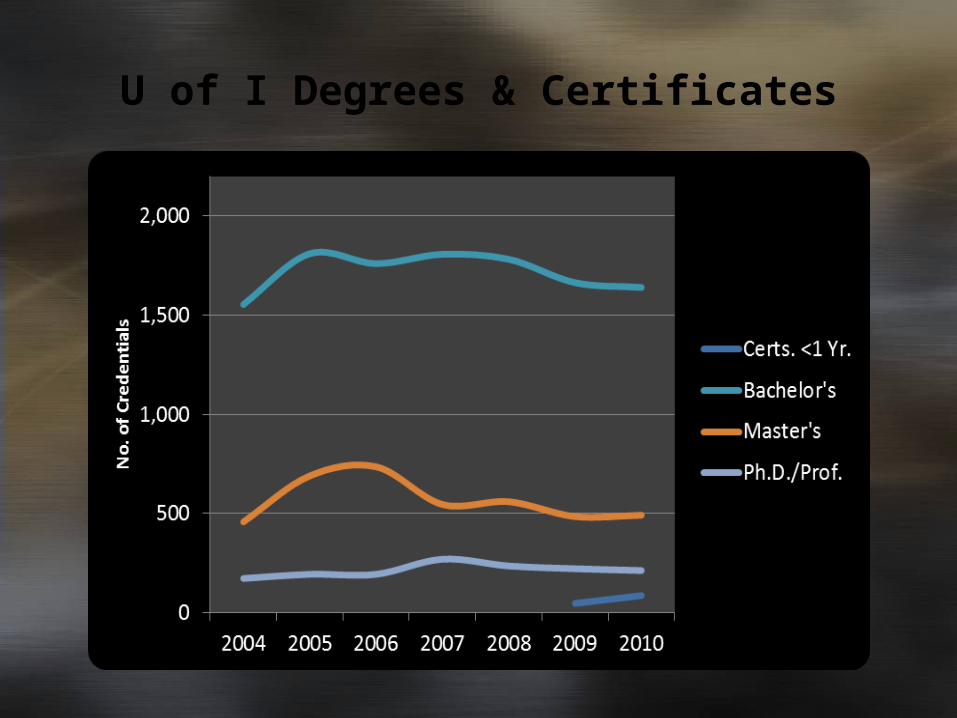
U of I Degrees & Certificates
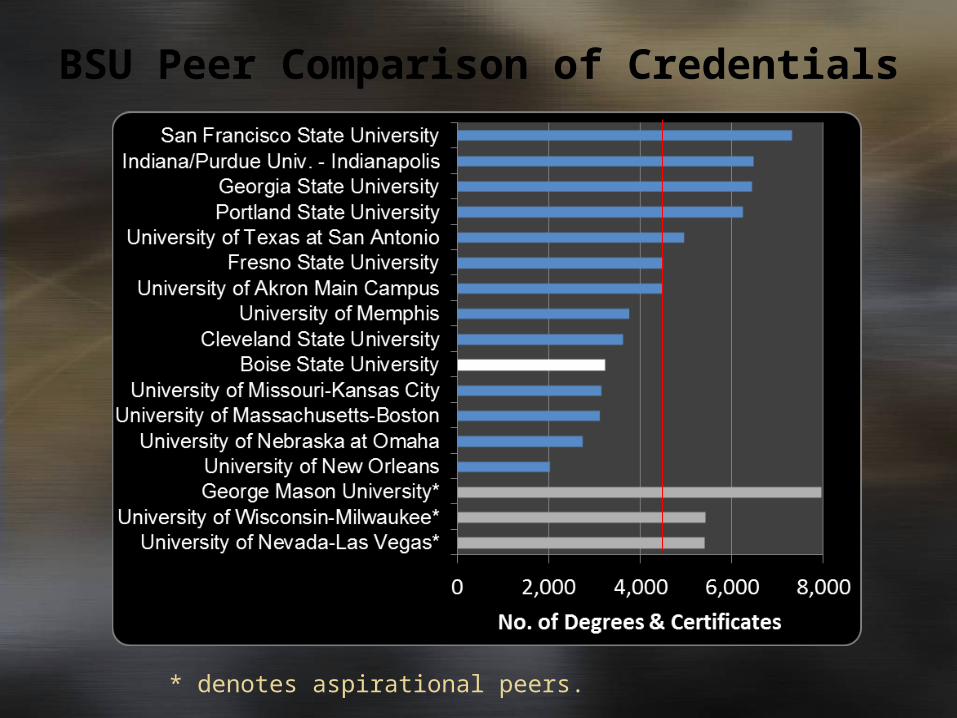
BSU Peer Comparison of Credentials
* denotes aspirational peers.
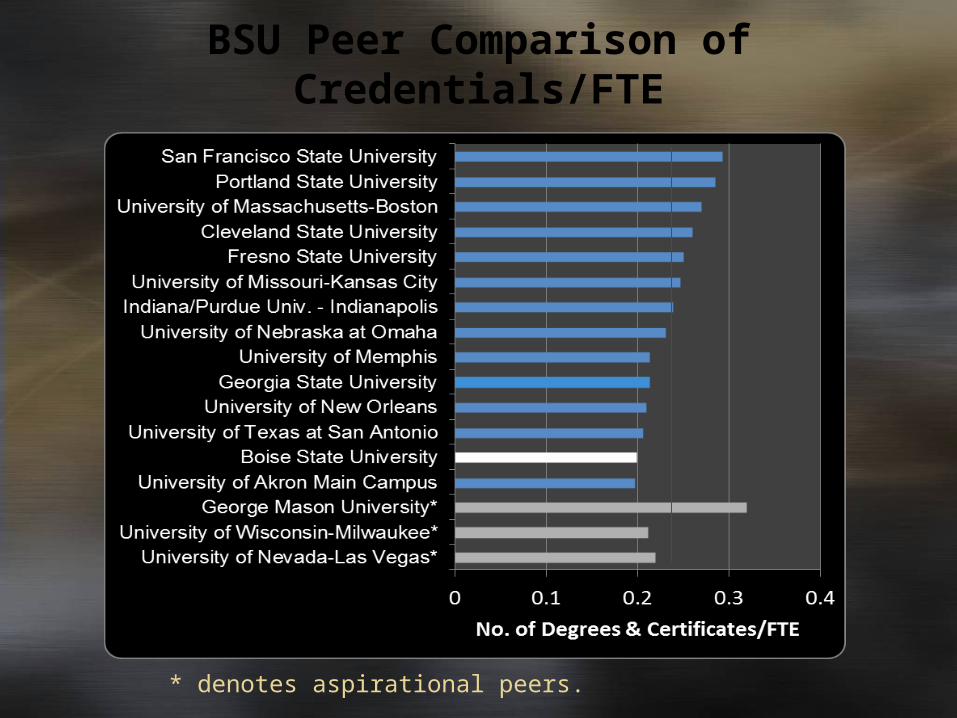
BSU Peer Comparison of Credentials/FTE
* denotes aspirational peers.

EITC Peer Comparison of Credentials
* denotes aspirational peers.
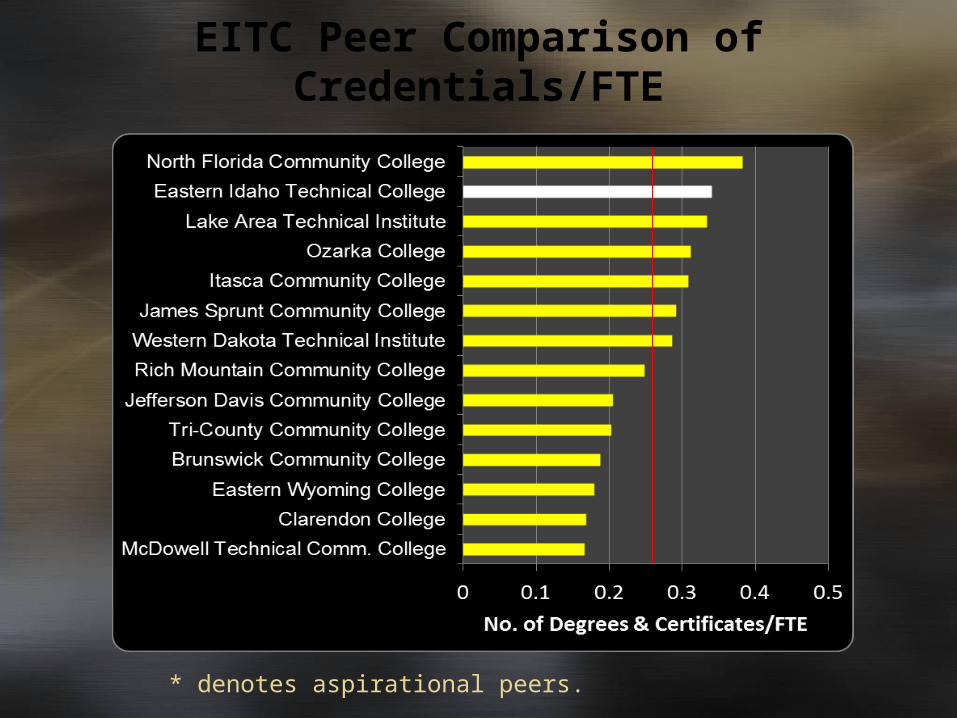
EITC Peer Comparison of Credentials/FTE
* denotes aspirational peers.
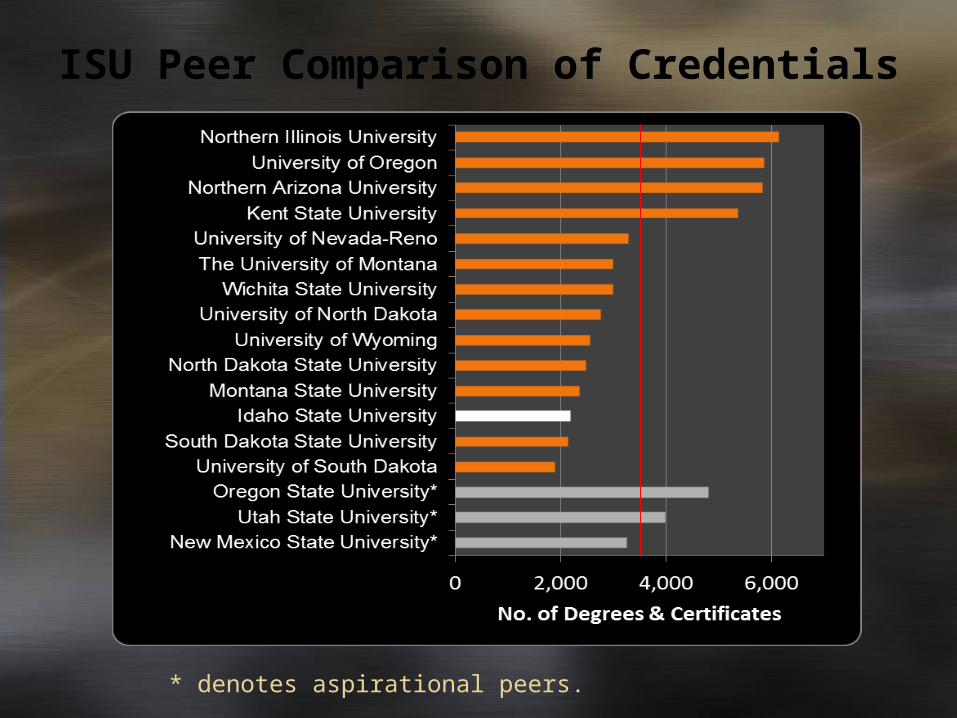
ISU Peer Comparison of Credentials
* denotes aspirational peers.
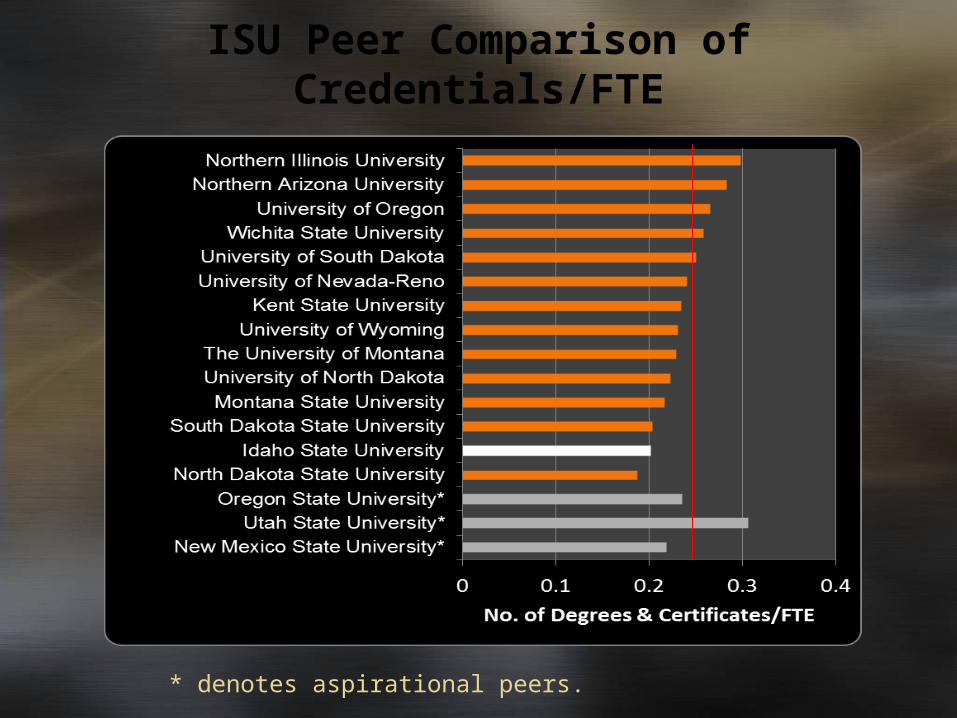
ISU Peer Comparison of Credentials/FTE
* denotes aspirational peers.
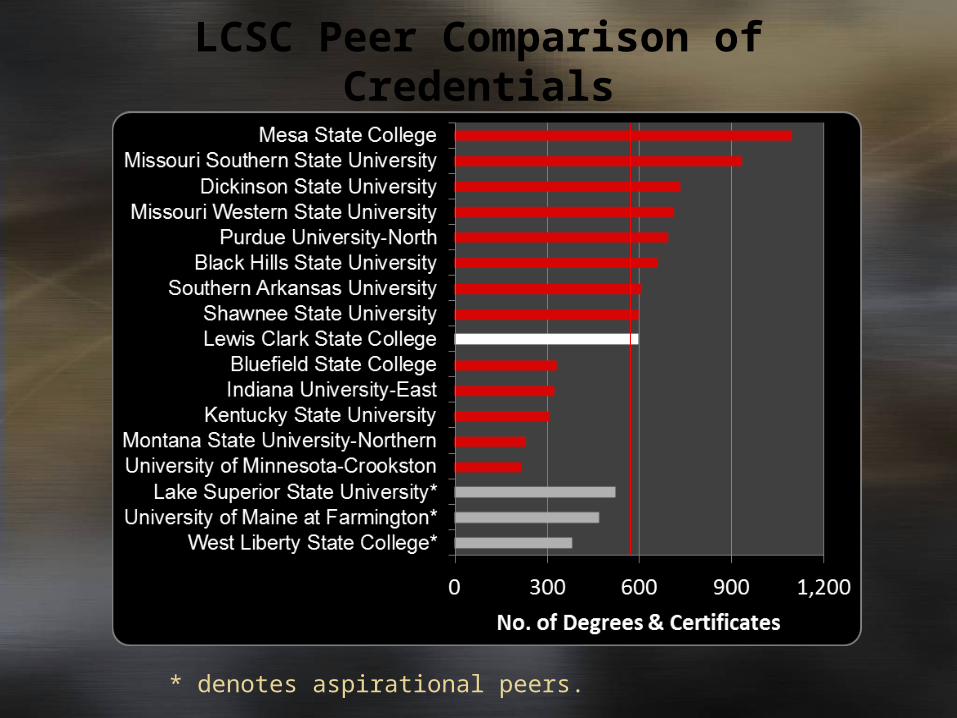
LCSC Peer Comparison of Credentials
* denotes aspirational peers.
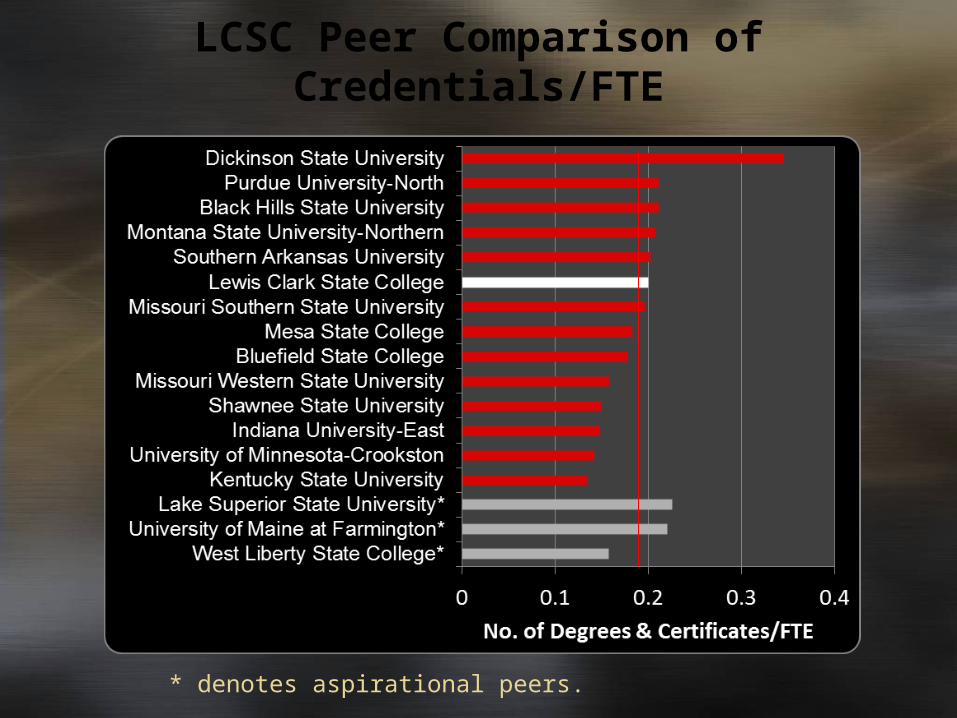
LCSC Peer Comparison of Credentials/FTE
* denotes aspirational peers.
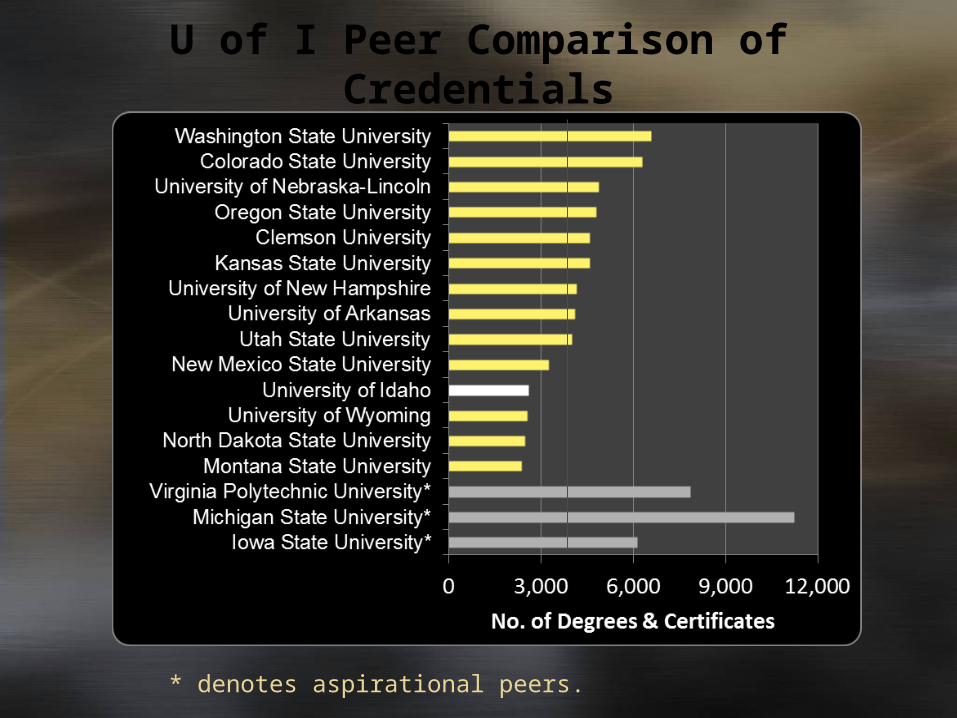
U of I Peer Comparison of Credentials
* denotes aspirational peers.
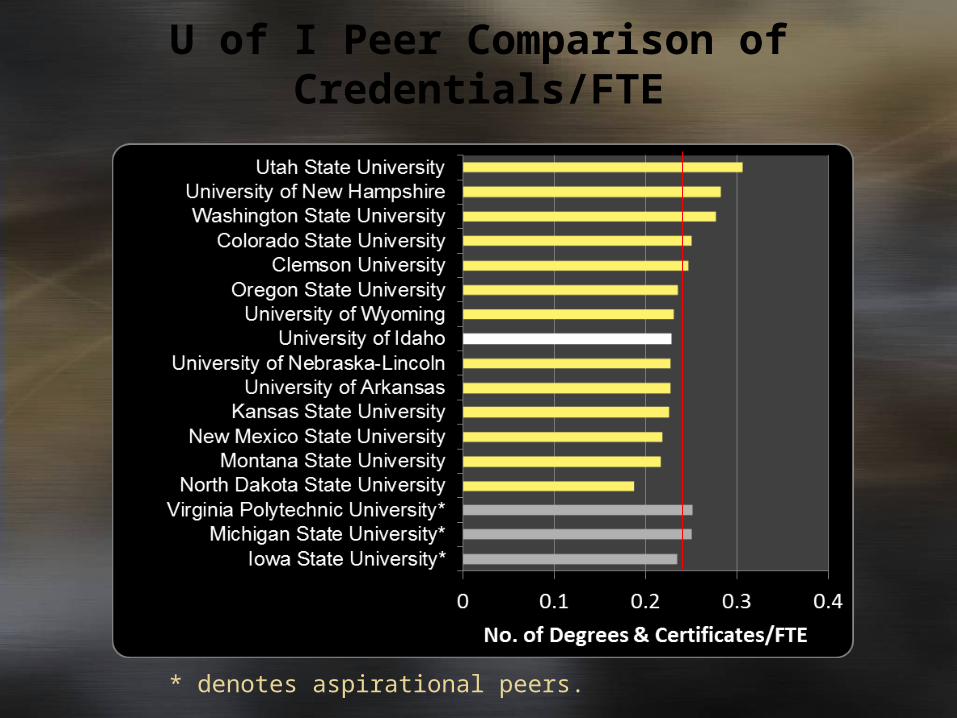
U of I Peer Comparison of Credentials/FTE
* denotes aspirational peers.
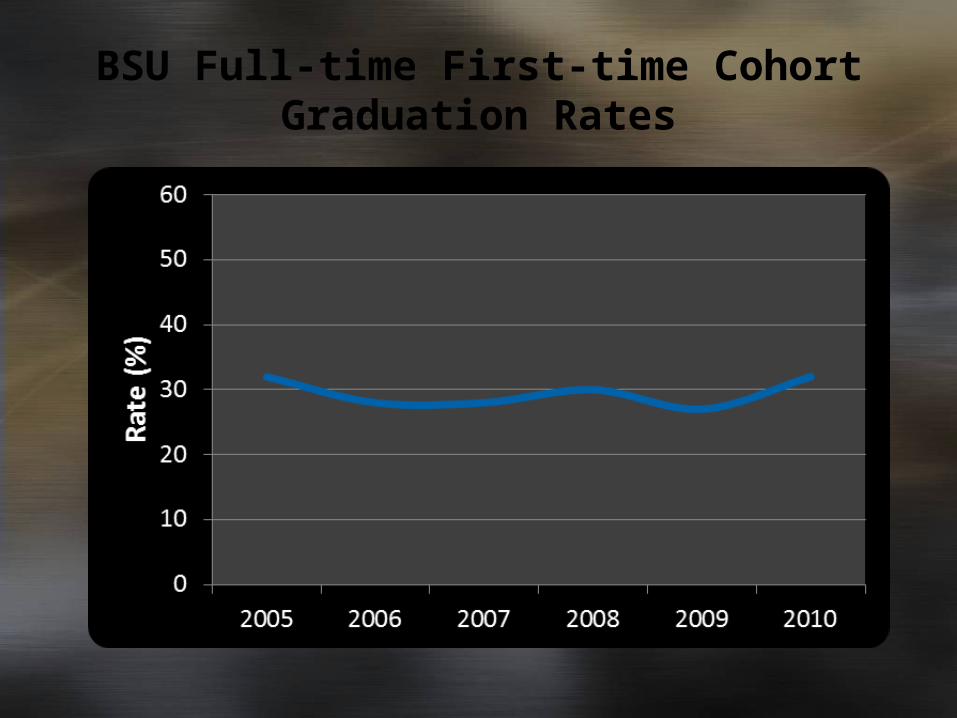
BSU Full-time First-time Cohort Graduation Rates

CSI First-time Full-time Cohort Graduation Rates

EITC First-time Full-time Cohort Graduation Rates
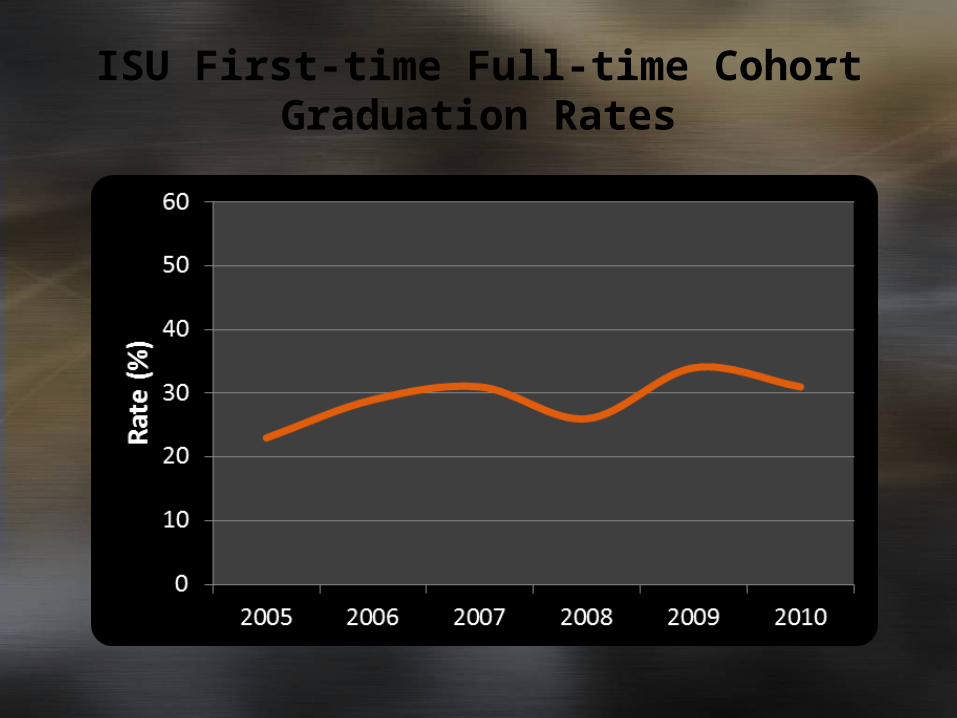
ISU First-time Full-time Cohort Graduation Rates
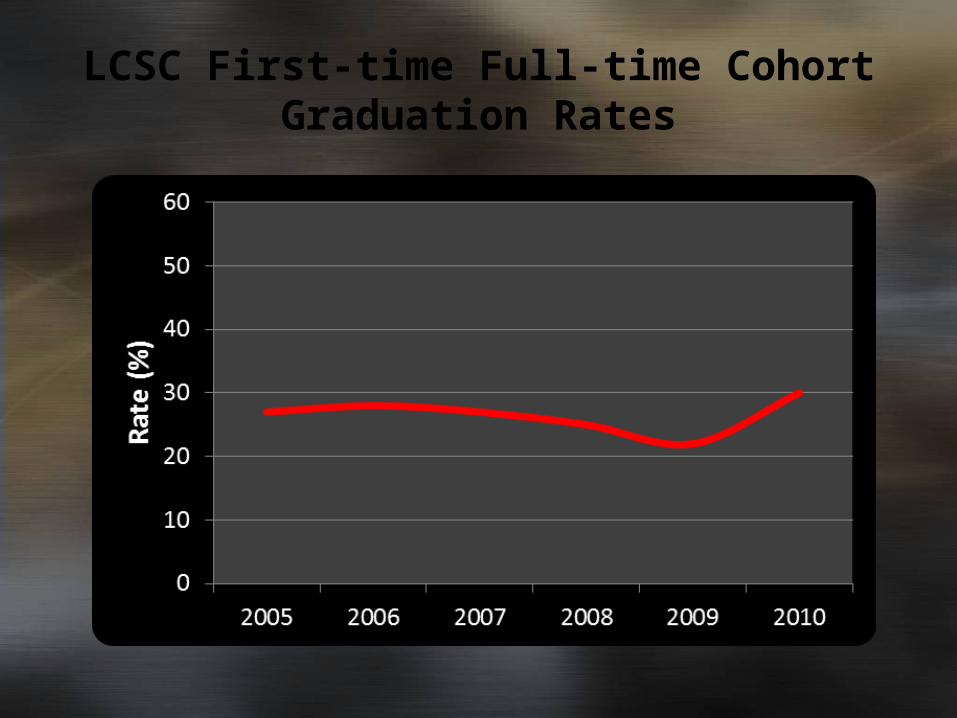
LCSC First-time Full-time Cohort Graduation Rates

NIC First-time Full-time Cohort Graduation Rates
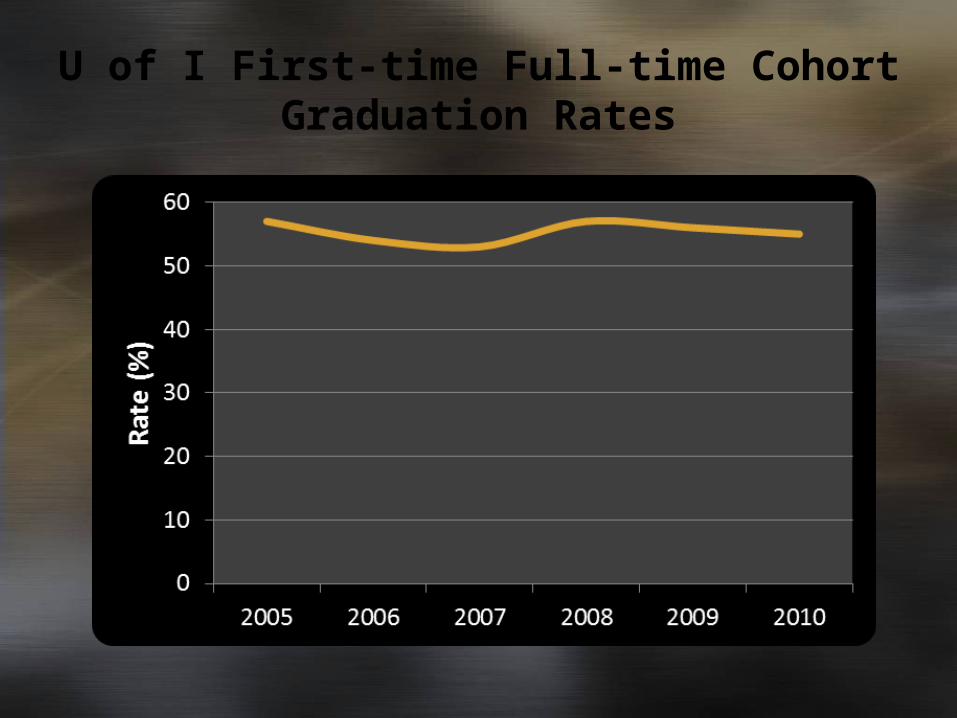
U of I First-time Full-time Cohort Graduation Rates
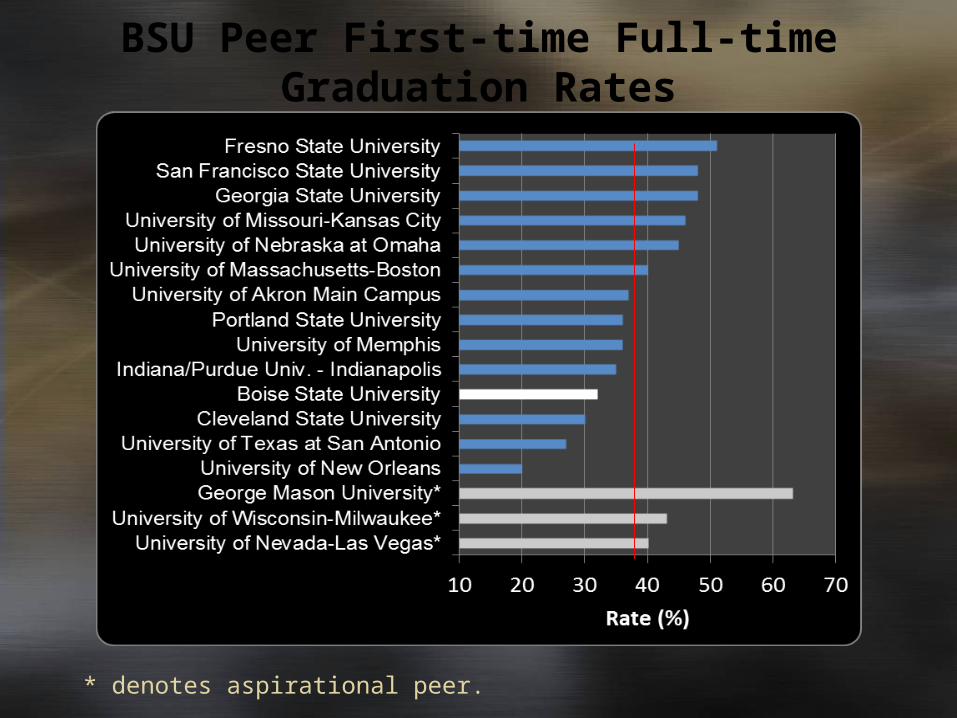
BSU Peer First-time Full-time Graduation Rates
* denotes aspirational peer.

EITC Peer First-time Full-time Graduation Rates
* denotes aspirational peer.
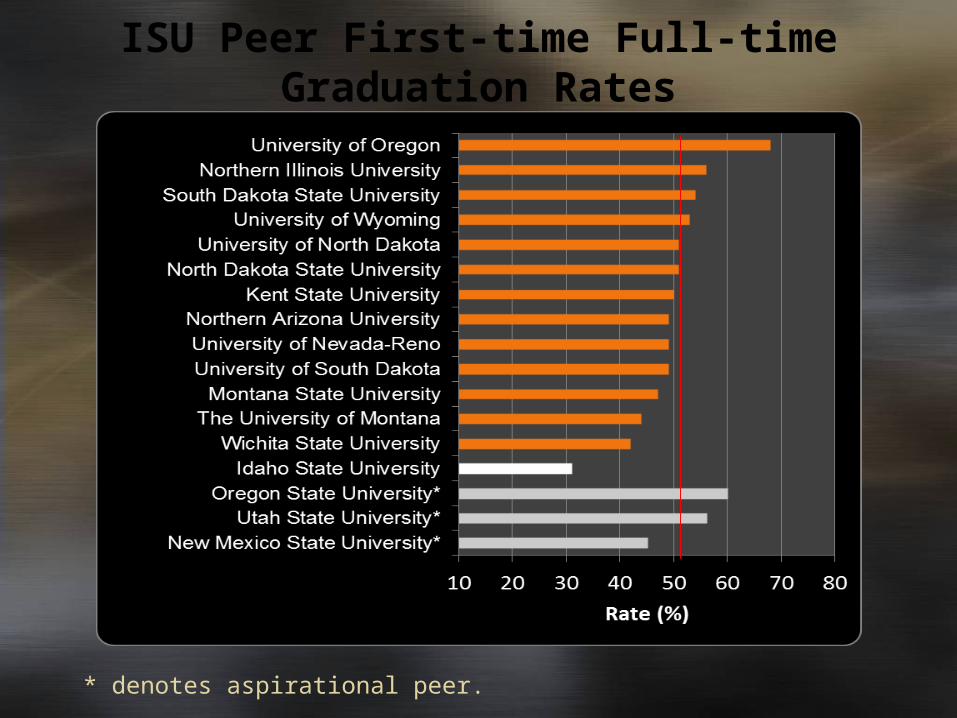
ISU Peer First-time Full-time Graduation Rates
* denotes aspirational peer.
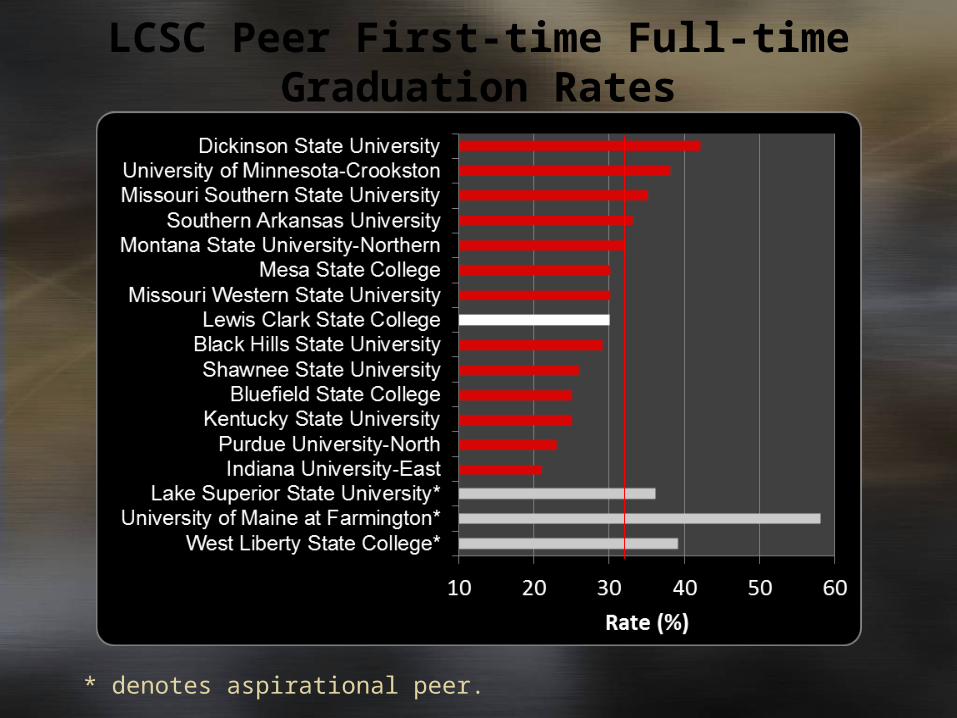
LCSC Peer First-time Full-time Graduation Rates
* denotes aspirational peer.
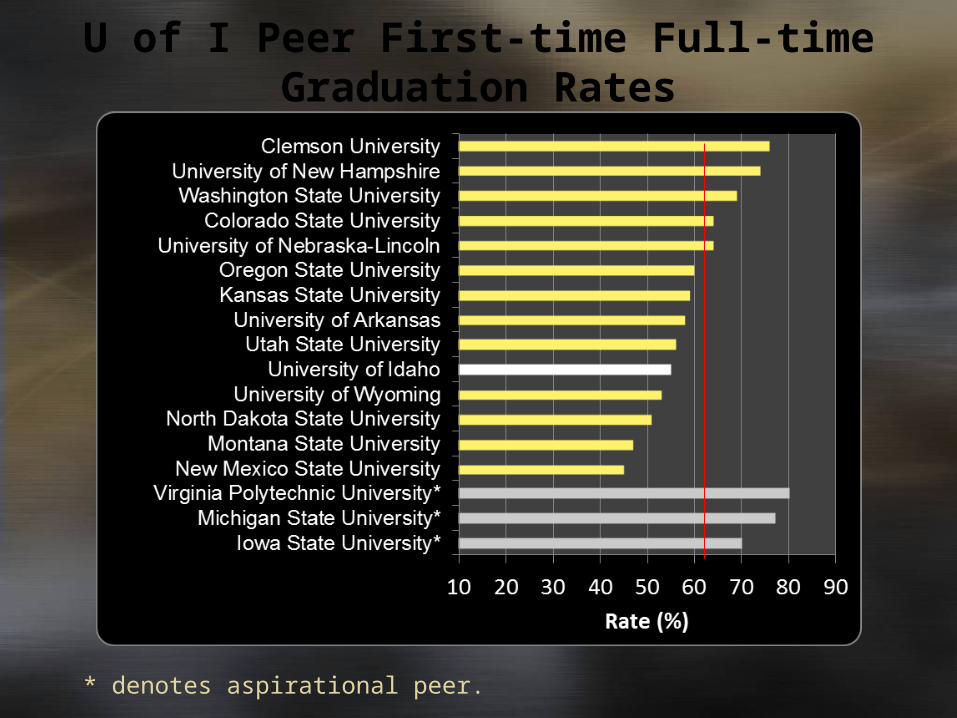
U of I Peer First-time Full-time Graduation Rates
* denotes aspirational peer.
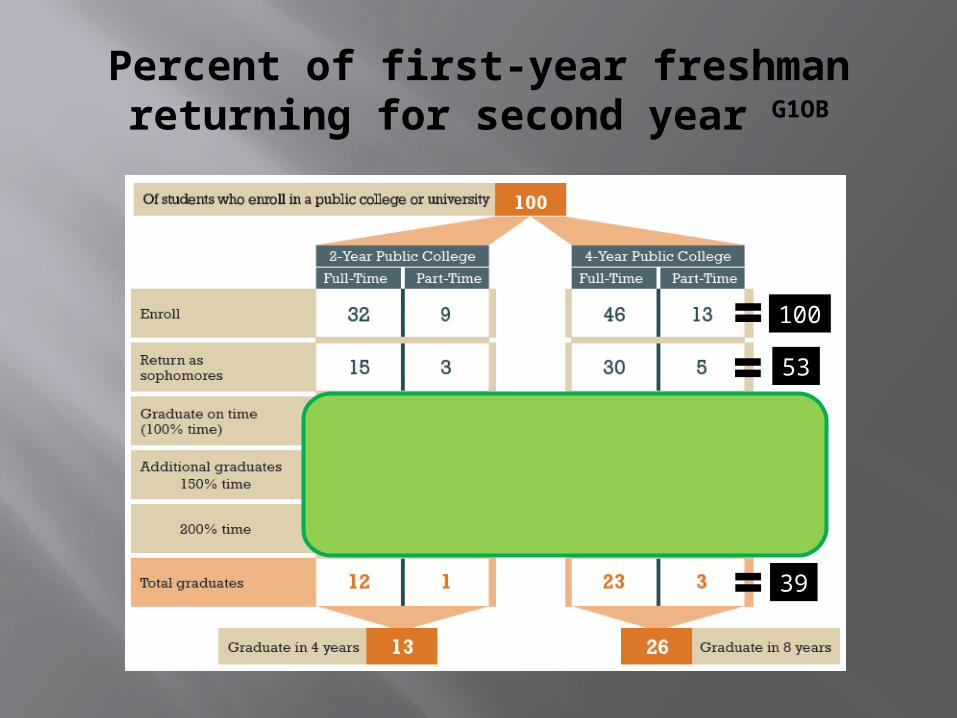
Percent of first-year freshman returning for second year G1OB
100
39
10
16
13
53

Data Quality Campaign Statewide Longitudinal Data System “Elements Met” Checklist G3OB
Element Met?
Operational?
Statewide Student Identifier Yes Yes*
Student-Level Enrollment Data Yes Yes
Student-Level Test Data Yes Yes
Information on Untested Students Yes Yes
Statewide Teacher Identifier with a Teacher-Student Match
Yes Yes
Student-Level Course Completion (transcript) Data Yes Yes
Student-Level SAT, ACT, & Advance Placement Exam Data
Yes Yes
Student-Level Graduation & Dropout Data Yes Yes
Ability to Match Student-level P-12 & Higher Education Data
Yes Yes
A State Data Audit System Yes No*
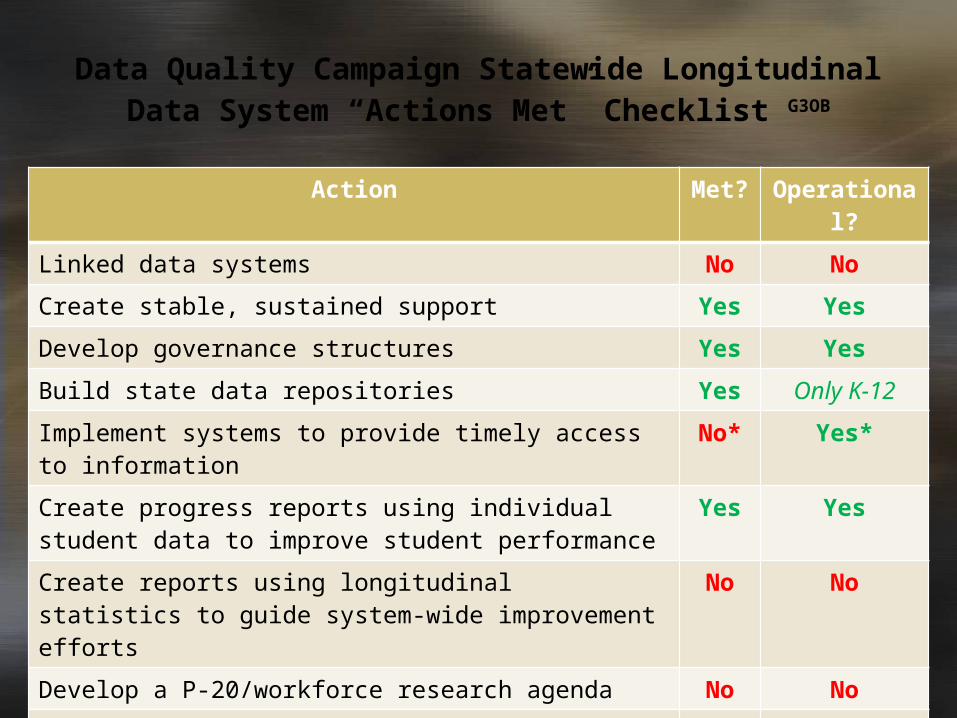
Data Quality Campaign Statewide Longitudinal Data System “Actions Met” Checklist G3OB
Action Met?
Operational?
Linked data systems No No
Create stable, sustained support Yes Yes
Develop governance structures Yes Yes
Build state data repositories Yes Only K-12
Implement systems to provide timely access to information
No* Yes*
Create progress reports using individual student data to improve student performance
Yes Yes
Create reports using longitudinal statistics to guide system-wide improvement efforts
No No
Develop a P-20/workforce research agenda No No
Promote educator professional development & credentialing
No No
Promote strategies to raise awareness of available data
No No

Questions?
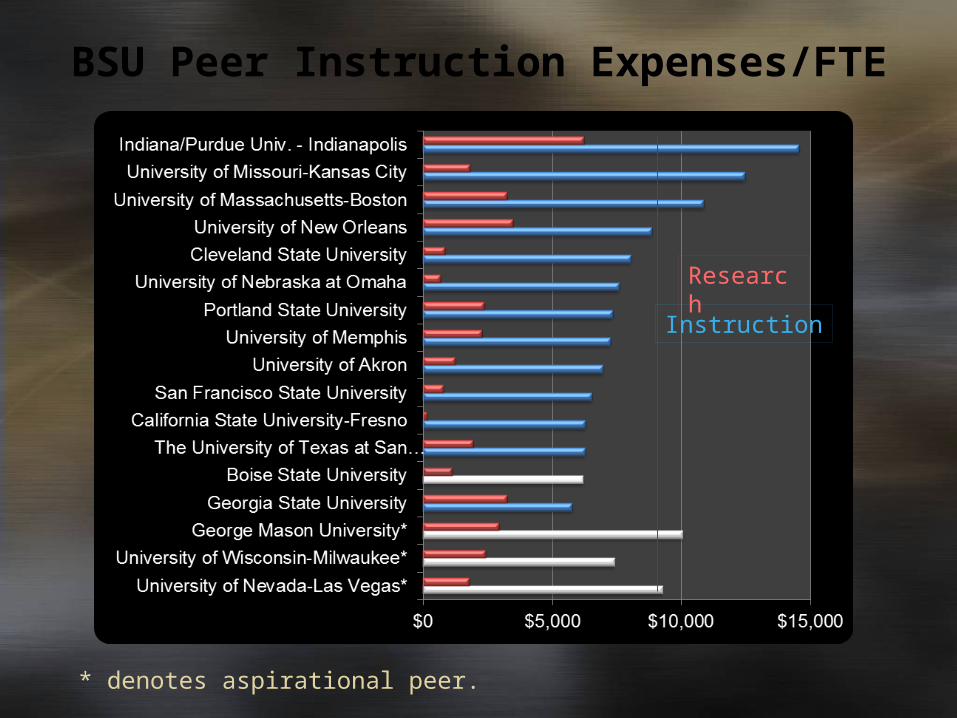
BSU Peer Instruction Expenses/FTE
* denotes aspirational peer.
Instruction
Research

ISU Peer Instruction Expenses/FTE
* denotes aspirational peer.
Instruction
Research
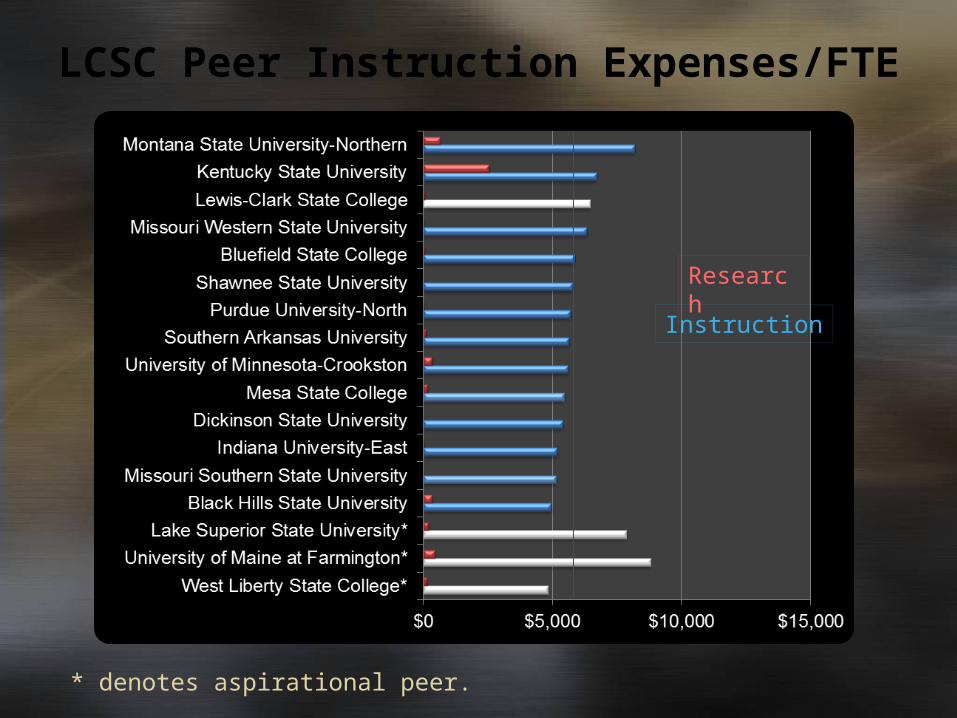
LCSC Peer Instruction Expenses/FTE
* denotes aspirational peer.
Instruction
Research
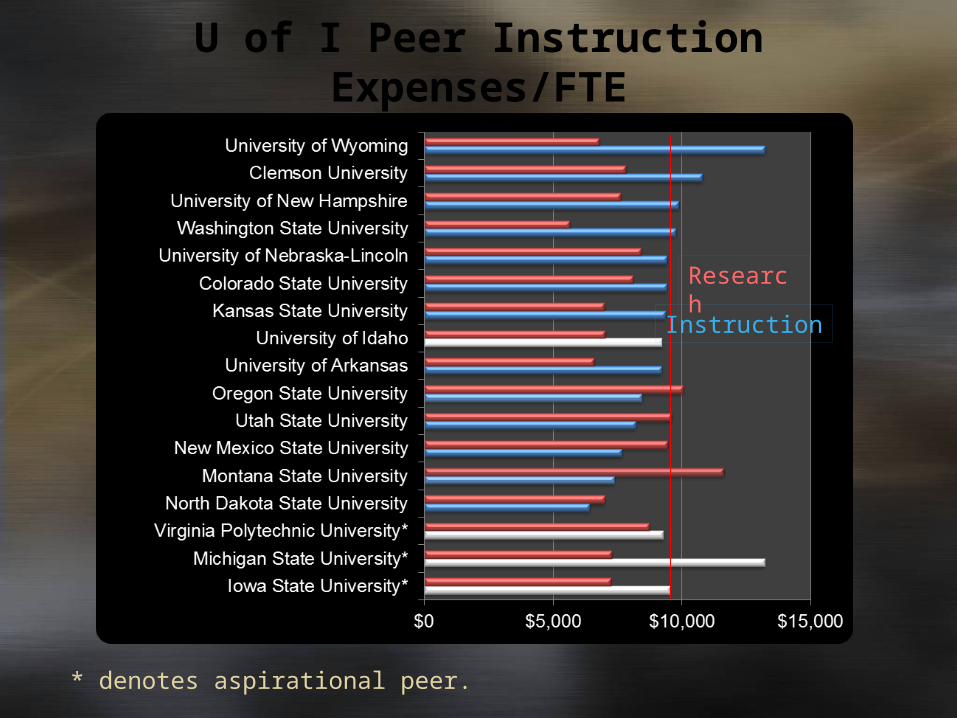
U of I Peer Instruction Expenses/FTE
* denotes aspirational peer.
Instruction
Research