Embed Size (px)
Citation preview
Annals of Library and Information Studies
Vol. 62, September 2015, pp. 145-156
Scientometrics of cereal crops research in India as reflected through Indian
Science Abstracts and CAB Abstracts during 1965-2010
H.K.Tripathia, Jaideep Sharma
band K.C.Garg
c
aSenior Technical Officer, Indian Council of Agricultural Research Library, Pusa Campus, New Delhi 110012,
Email: [email protected] bProfessor, Faculty of Library and Information Science, Indira Gandhi National Open University, MaidanGarhi, New Delhi-110068,
Email: [email protected] cEx-Chief Scientist, CSIR-National Institute of Science Technology and Development Studies, New Delhi 110012,
Email: [email protected]
Received: 30 March 2015; revised: 26 July 2015; accepted 04 August 2015
The paper analyses publication output of India on cereal crops as reflected by its coverage in Indian Science Abstracts
(ISA) and CAB Abstracts during 1965-2010.The analysis indicates that highest number of papers (43.80%) was published
on rice, followed by wheat (24.28%). Agricultural universities and institutions under aegis of Indian Council of Agricultural
Research (ICAR) were most productive. Most of the papers were published in Indian journals with low impact factor. The
highest number of papers was published in Indian Journal of Agricultural Sciences, followed by Indian Journal of
Agronomy, Madras Agricultural Journaland Journal of Maharashtra Agricultural University. Indian Agricultural Research
Institute, New Delhi,Tamil Nadu Agricultural University, Coimbatoreand Punjab Agricultural University,
Ludhianacontributed about 7% of papers each. The major research was focused on ‘genetic and plant breeding’ (28.2%)
followed by ‘agronomic aspects’ (27.9%) and pest, diseases and pest control (19.7%). The authorship pattern reveals that
co-authored papers accounted for 90% of total output. Citation analysis of the study using Google scholar reveals that 57%
of the papers remained uncited and 36.8% papersreceived citations ranging from 1 to 10.Highest number of citations were
received by papers published in Indian Journal of Agronomy(1446), followed by Indian Journal of Agricultural Science
(1211), Euphytica (1109) and Theoretical and Applied Genetics (1000).
Introduction India is basically an agrarian economy with over
two-third of its population living in rural areas which depends on agriculture and related occupations. Agriculture contributes nearly half of the national income and provides employment to about 70 percent of the working population in India. However, now the economy is in a transition phase and is moving towards service economy due to the recent
developments in IT and other sectors such as hospitality and tourism. Crop science is the study of scientific approaches used to improve the quality of crops. It is a multidisciplinary research area that deals with plant breeding and genetics, crop physiology, crop production and management and weed science etc.Crop science, especially cereal crops is an important area of scientific research in the field of agriculture sciences in India. After the green revolution in India in the 1960s, growth in production of cereals havebeen particularly significant. Cereals
can be classified into three groups: wheat, rice and
coarse cereals (maize, sorghum, maize and millets)1.
Several studies dealing with mapping of research
output in different sub-disciplines of agriculture scienceshave been carried out. The present paper is an extension of an earlier study under taken by Tripathi and
Garg11
on Indian crop science research during 2008-
2010 based on the papers indexed in three different databases, viz., Scopus, CABAbstracts and Indian Science Abstracts. The present paper uses a time series data for 1965-2010 in gaps of five years each and is the first study on individual crops reported in literature.
Review of literature
Arunachalam and Umarani2analyzed 11855
publications of agricultural research output of Indian scientists indexed by CAB Abstracts 1998 and found that majority of papers were published on pests,
pathogens and biogenic diseases (1135 papers) and plant production (786 papers). Highest contributions were made by State Agricultural Universities. Indian researchers preferred to publish in journals that originated from UK, USA and India. Majority of
papers were published in non-SCI journals. Garget al3
brought to you by COREView metadata, citation and similar papers at core.ac.uk
provided by Online Publishing @ NISCAIR
146 ANN. LIB. INF. STU., SEPTEMBER 2015
analyzed 16891 papers published by Indian
agricultural scientists indexed by Science Citation
Index Expanded (Web of Science) during 1993-2002
and found that the publication output in the
agricultural sciences was declining since 1998. The
major research focus was on ‘dairy and animal
sciences’ followed by ‘veterinary sciences’.
Agricultural universities and institutes under the aegis
of Indian council of Agricultural Research produced
maximum research output.
Balasubramanian and Ravanan4
analyzed scientific output in agricultural sciences during last 66 years and found that global agricultural research output showed an upward trend. Regarding country-wise
distribution of publications in agricultural research, USA produced the highest number of papers and the most preferred journal was Agriculture Ecosystems and Environment publishing 533 papers. NationalScience Foundation of the US made the
highest contribution. Garget al5
analyzed 32574
papers published by USA, UK, China, India and Brazil in the field of ‘plant genetics and breeding’ research during 2005-2009 and found that USA produced the maximum number of publications followed by China. India produced about 9 per cent of the world publication output. Indian output formed a part of the mainstream science as was seen by the pattern of publication and citation of the research
output. Senthilkumaran and Amudhavalli6examined
literature on spices for the period of 1968 to 2002 with respect to Asia and India using HORT-CD database. The study revealed that India dominates research and development activities on spices in the Asia and Indian Institute of Spices Research, Calicut, is a significant contributor whose scientist tops the list
of prolific authors. Seetharam and Rao7
compared the trends in growth of food science and technology literature produced by CFTRI (Central Food and Technology Research Institute) scientists, Indian food scientists and food scientists of the world during
1950-90. Gargetal8
analyzed 2899 research papers on ‘genetics and heredity’ of Indian scientists indexed by Science Citation Index Expanded (Web of Science) during 1991-2008. The analysis indicates a slow growth in the initial stages and the focus of research
was on molecular genetics. The authors also found that majority of papers were published in journals that originated from Western countries and in journals having impact factor less than one. Academic institutions had the highest number of papers.
Suryanarayana9
analysed global research output in
tobacco and found that the research output decreased
globally after 1987. Tripathiet al10
analysed 1610
scientific papers produced by 18 animal science research institutes of the Indian Council of Agricultural Research (ICAR) during April 2009— March 2010. Authors found that Indian scientists preferred to publish in Indian journals. The major research focus was on breeding and genetics and Indian Veterinary Research Institute published the highest number of papers.
The present paper is an extension of an earlier
study11
on Indian crop science research during 2008- 2010. This paper uses a time series data for 1965- 2010 in gaps of five years each and is the first study on individual crops reported in literature.
Objectives of the study ● To examine the output of different crops in Indian
Science Abstracts (ISA) and CAB Abstracts
databases during 1965-2010in gaps of five years;
● To identify the most prolific institutions in the
field of cereal crops;
● To study the communication behavior of Indian
agriculture scientists as reflected by the country
of publication of papers and their impact factor;
● To identify most prolific authors in the field of
crop sciences;
● To identify the sub-disciplines where the crop
science output is concentrated; and
● To identify most cited papers in the field of crops
sciences.
Methodology Data for the study was collected from Indian
Science Abstracts and CAB Abstracts for the period 1965 to 2010 with five years gaps. Like the previous
study11
, the present analysis is also related to six food
grain crops (wheat, rice, barley, maize, sorghum, millets). To download the data from the two databases Hindi names/common names/botanical names of crops were used as keywords. The keywords used for downloading records are given below:
1. wheat or gahu or Triticumaestivumand India, and
not buckwheat, and not buck wheat,
2. Barley or Jau or Hordeumvulgare, and India 3. Maize or Zea mays or makka or corn, and India,
not Valerinellalocusta
4. Rice or chawal or dhan or paddy or Oryza sativa,
and India, but not rice bean
TRIPATHI et al.: SCIENTOMETRICS OF CEREAL CROPS RESEARCH IN INDIA 147
5. Sorghum or jowar or jwaarie or jondhahlaas or
mutthaari or kora or Sudan grass or millet bloom,
and India
6. Millet or bajra or ragi or Pennisetum, and India,
or Eleusinecoracana, or Setariaitalica; or
Echinochloaesculenta, or Panicummiliaceum
Hard copies of Indian Science Abstracts were used
for data collection for the period 1965-1995 and for
the remaining years electronic version of the database
was used. Downloaded data was entered in MS Excel
format for analysis. Data from CAB Abstracts for
1965-1995 was obtained from CD-ROM version and
the rest from the online version. The following data
elements were downloaded from both databases:
a. Name of the author and his affiliation
b. Title of the paper to identify the subject
c. Name of the journals in which papers were
published
d. Year of publication
Subjects of study reported in the publications were
identified using different keywords from title of the
study. These keywords were chosen from Crop
Science Abstract, Field Crop Science Abstracts, Rice
Abstracts, Maize Abstracts, Wheat Barley and
Triticale Abstract of CABI. Data were sorted on
different variables such as authors and their
affiliations, journals used for publishing research
results and sub-disciplines of research. Journals
indexed by Science Citation Index Expanded (SCIE)
were also identified.To arrive at an accurate picture of
the output in crop sciences, duplicate records from the
downloaded data which dealt with multi-cereal crops
were removed.
Results and discussion
Publication output in different cereal crops in ISA and CABI
databases
Table 1 gives the output of different cereal crops in
the two databases during 1965-2010 in gaps of five
years each. Total number of records downloaded from
Indian Science Abstracts and from CAB Abstracts
were 6202 and 6709 respectively.A total of
2801duplicateand irrelevant records were eliminated
from the downloaded records. Thus, 10,100 records
wereanalyzed. The data presented in Table 1 indicates
that the total output in second block (1990-2010) has
increased almost three times to the output in the first
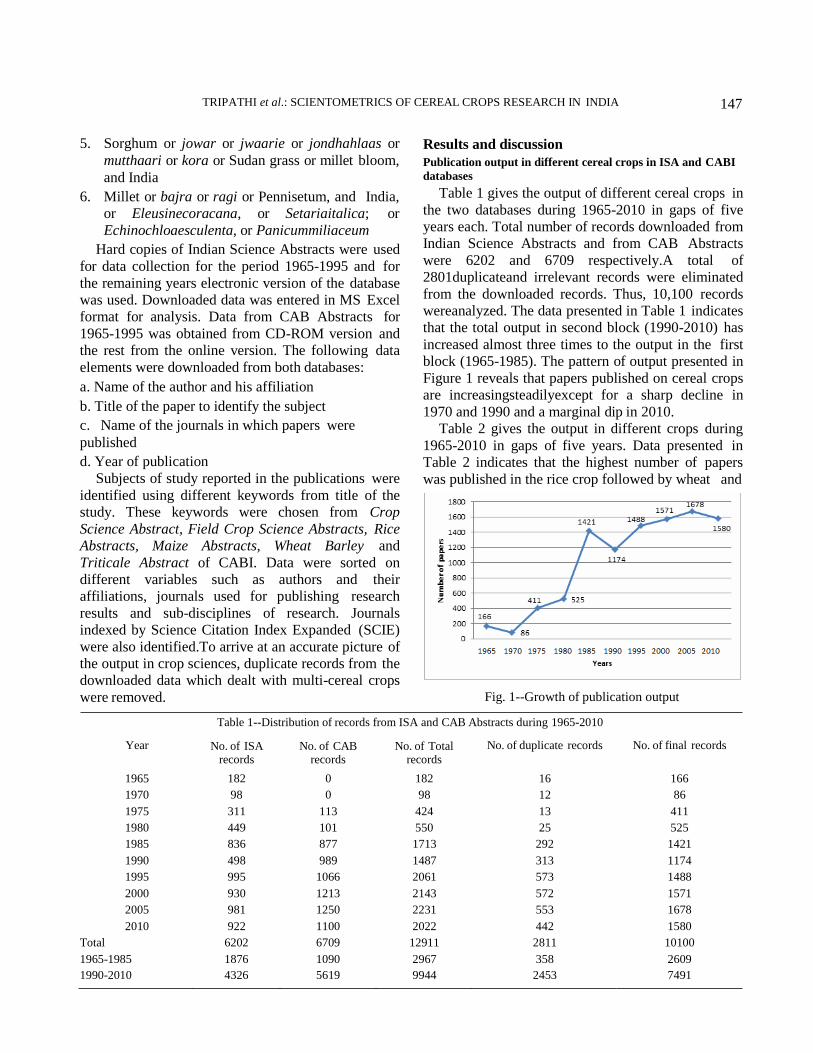
block (1965-1985). The pattern of output presented in
Figure 1 reveals that papers published on cereal crops
are increasingsteadilyexcept for a sharp decline in
1970 and 1990 and a marginal dip in 2010.
Table 2 gives the output in different crops during
1965-2010 in gaps of five years. Data presented in
Table 2 indicates that the highest number of papers
was published in the rice crop followed by wheat and
Fig. 1--Growth of publication output
Table 1--Distribution of records from ISA and CAB Abstracts during 1965-2010
Year No. of ISA records
No. of CAB records
No. of Total records
No. of duplicate records No. of final records
1965 182 0 182 16 166
1970 98 0 98 12 86
1975 311 113 424 13 411
1980 449 101 550 25 525
1985 836 877 1713 292 1421
1990 498 989 1487 313 1174
1995 995 1066 2061 573 1488
2000 930 1213 2143 572 1571
2005 981 1250 2231 553 1678
2010 922 1100 2022 442 1580
Total 6202 6709 12911 2811 10100
1965-1985 1876 1090 2967 358 2609
1990-2010 4326 5619 9944 2453 7491
148 ANN. LIB. INF. STU., SEPTEMBER 2015
Table 2--Distribution of output by cereal crops during 1965-2010 in gaps of five years each
Year
1965
Rice
77
Wheat
25
Maize
22
Barley
9
Sorghum
22
Millets
11
Total output
166
1970 28 32 12 4 8 3 87
1975 184 95 41 19 39 40 418
1980 239 133 56 16 52 47 543
1985 602 353 157 30 178 147 1467
1990 544 295 112 35 148 92 1226
1995 669 354 175 22 177 184 1581
2000 755 434 183 26 141 135 1674
2005 828 463 206 29 153 116 1795
2010 781 389 228 21 128 151 1698
Grand total 4707 2573 1192 211 1046 926 10655**
1965-1985 1130 638 288 78 299 248 2681
1990-2010 3577 1935 904 133 747 678 7974
AI*(1965-1985) 95 99 96 147 114 106 AI* (1990-2010) 102 101 101 84 95 98
*Rounded off to the nearest whole number, **Figure differs from actual figure as several papers belonged to multi-crops.
lowest number of papers was published on barley.
The output on rice and wheat constituted about 68%
of the total output. Remaining 32% papers were
distributed among maize (11%), sorghum (10%) and
millets (9%) and barley (2%) respectively.Pattern of
output during the period 1965-2010 on different crops
indicates that the lowest number of papers on each
cereal crop was produced in the year 1965 and 1970.
In the later period, it increased slowly till 1980 and
almost doubled during 1985 and onwards. An analysis
of outputwas made to examine as to how the emphasis
has changed on different crops during 1965-1990 and
1995-2010 using Activity Index suggested by
Schubert and Braun12
and used by Garget al13.
The
advantage of using activity index over absolute count of publications is that it takes into consideration both the size of the nation/institution as well as the size of the discipline. However, in the present case nation has been replaced with two blocks for which the comparison has been made. Data presented in Table 2 indicates that the activity was higher for coarse
cereals in first block as compared to rice and wheat.
However, the same has changed in the second block
indicating a lower activity for coarse cereals as
compared to rice and wheat. One of the possible
reasons for this may be the emphasis given in green
revolution to increase productivity in rice and wheat
as compared to coarse cereals.
Distribution of output by prolific institutions
The distribution of output by performing sectors
indicates that State Agriculture Universities (SAUs)
and agricultural colleges produced about half
(50.74%) of the total papers. The share of institutions
under the aegis of Indian Council of Agricultural
Research (ICAR) was about one-fourth (25.65%) of
the total output. Thus, these two performing sectors
published about 76% of the total output in crop
science research. Remaining 14% of the output came
from other institutions under the aegis of other
central/state government agencies as well as private
institutions and international institutions.
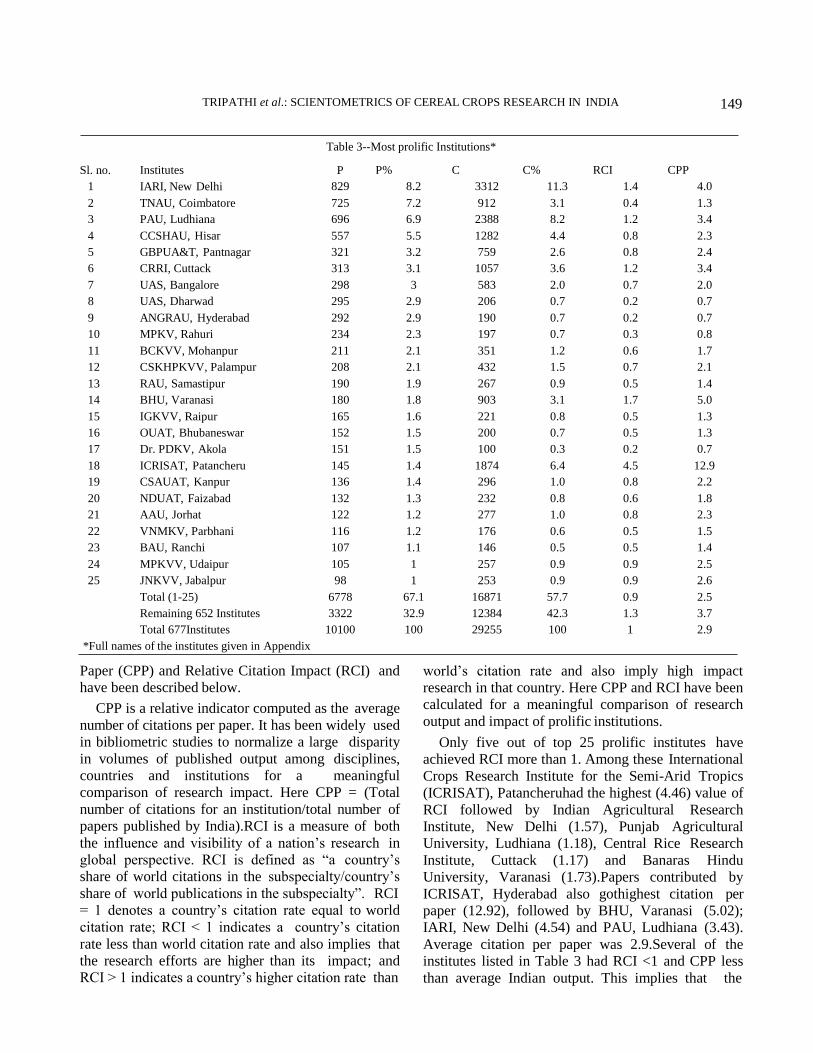
Table 3 presents data on the distribution of output
by prolific institutions. The total output came from
677 institutions located in different parts of India. Of
these 25 prolific institutions listed in Table 3
produced nearly two third of the total output and the
rest 652 institutes produced the remaining output.
Among the prolific institutions, State Agriculture
Universities are the major producers. Indian
Agriculture Research Institute (IARI), the premier
research institute under the aegis of the Indian
Council of Agriculture Research produced about 8%
of the total output and topped the list. The top four
highly productive institutes are Indian Agricultural
Research Institute (IARI), New Delhi, followed by
Tamil Nadu Agricultural University, Coimbatore,
Punjab Agricultural University (Ludhiana) and CCS
Haryana Agricultural University (Hisar). The share of
these four prolific institutions in the total output is
more than one-fifth of the total output.
We also examined the impact of the research
output by these prolific institutions using Citations per
TRIPATHI et al.: SCIENTOMETRICS OF CEREAL CROPS RESEARCH IN INDIA 149
Table 3--Most prolific Institutions*
Sl. no.
1
Institutes
IARI, New Delhi
P
829
P%
8.2
C
3312
C%
11.3
RCI
1.4
CPP
4.0
2 TNAU, Coimbatore 725 7.2 912 3.1 0.4 1.3
3 PAU, Ludhiana 696 6.9 2388 8.2 1.2 3.4
4 CCSHAU, Hisar 557 5.5 1282 4.4 0.8 2.3
5 GBPUA&T, Pantnagar 321 3.2 759 2.6 0.8 2.4
6 CRRI, Cuttack 313 3.1 1057 3.6 1.2 3.4
7 UAS, Bangalore 298 3 583 2.0 0.7 2.0
8 UAS, Dharwad 295 2.9 206 0.7 0.2 0.7
9 ANGRAU, Hyderabad 292 2.9 190 0.7 0.2 0.7
10 MPKV, Rahuri 234 2.3 197 0.7 0.3 0.8
11 BCKVV, Mohanpur 211 2.1 351 1.2 0.6 1.7
12 CSKHPKVV, Palampur 208 2.1 432 1.5 0.7 2.1
13 RAU, Samastipur 190 1.9 267 0.9 0.5 1.4
14 BHU, Varanasi 180 1.8 903 3.1 1.7 5.0
15 IGKVV, Raipur 165 1.6 221 0.8 0.5 1.3
16 OUAT, Bhubaneswar 152 1.5 200 0.7 0.5 1.3
17 Dr. PDKV, Akola 151 1.5 100 0.3 0.2 0.7
18 ICRISAT, Patancheru 145 1.4 1874 6.4 4.5 12.9
19 CSAUAT, Kanpur 136 1.4 296 1.0 0.8 2.2
20 NDUAT, Faizabad 132 1.3 232 0.8 0.6 1.8
21 AAU, Jorhat 122 1.2 277 1.0 0.8 2.3
22 VNMKV, Parbhani 116 1.2 176 0.6 0.5 1.5
23 BAU, Ranchi 107 1.1 146 0.5 0.5 1.4
24 MPKVV, Udaipur 105 1 257 0.9 0.9 2.5
25 JNKVV, Jabalpur 98 1 253 0.9 0.9 2.6
Total (1-25) 6778 67.1 16871 57.7 0.9 2.5
Remaining 652 Institutes 3322 32.9 12384 42.3 1.3 3.7
Total 677Institutes 10100 100 29255 100 1 2.9
*Full names of the institutes given in Appendix
Paper (CPP) and Relative Citation Impact (RCI) and
have been described below.
CPP is a relative indicator computed as the average
number of citations per paper. It has been widely used
in bibliometric studies to normalize a large disparity
in volumes of published output among disciplines,
countries and institutions for a meaningful
comparison of research impact. Here CPP = (Total
number of citations for an institution/total number of
papers published by India).RCI is a measure of both
the influence and visibility of a nation’s research in
global perspective. RCI is defined as “a country’s
share of world citations in the subspecialty/country’s
share of world publications in the subspecialty”. RCI
= 1 denotes a country’s citation rate equal to world
citation rate; RCI < 1 indicates a country’s citation
rate less than world citation rate and also implies that
the research efforts are higher than its impact; and
RCI > 1 indicates a country’s higher citation rate than
world’s citation rate and also imply high impact
research in that country. Here CPP and RCI have been
calculated for a meaningful comparison of research
output and impact of prolific institutions.
Only five out of top 25 prolific institutes have
achieved RCI more than 1. Among these International
Crops Research Institute for the Semi-Arid Tropics
(ICRISAT), Patancheruhad the highest (4.46) value of
RCI followed by Indian Agricultural Research
Institute, New Delhi (1.57), Punjab Agricultural
University, Ludhiana (1.18), Central Rice Research
Institute, Cuttack (1.17) and Banaras Hindu
University, Varanasi (1.73).Papers contributed by
ICRISAT, Hyderabad also gothighest citation per
paper (12.92), followed by BHU, Varanasi (5.02);
IARI, New Delhi (4.54) and PAU, Ludhiana (3.43).
Average citation per paper was 2.9.Several of the
institutes listed in Table 3 had RCI <1 and CPP less
than average Indian output. This implies that the
150 ANN. LIB. INF. STU., SEPTEMBER 2015
impact of research produced by these institutes is not
commensurate with their output.
Communication behavior of Indian crop scientists
This aspect has been examined using two different
parameters. These are (i) publishing country of
journals where the research results were published
and (ii) distribution of output by impact factor of
journals.
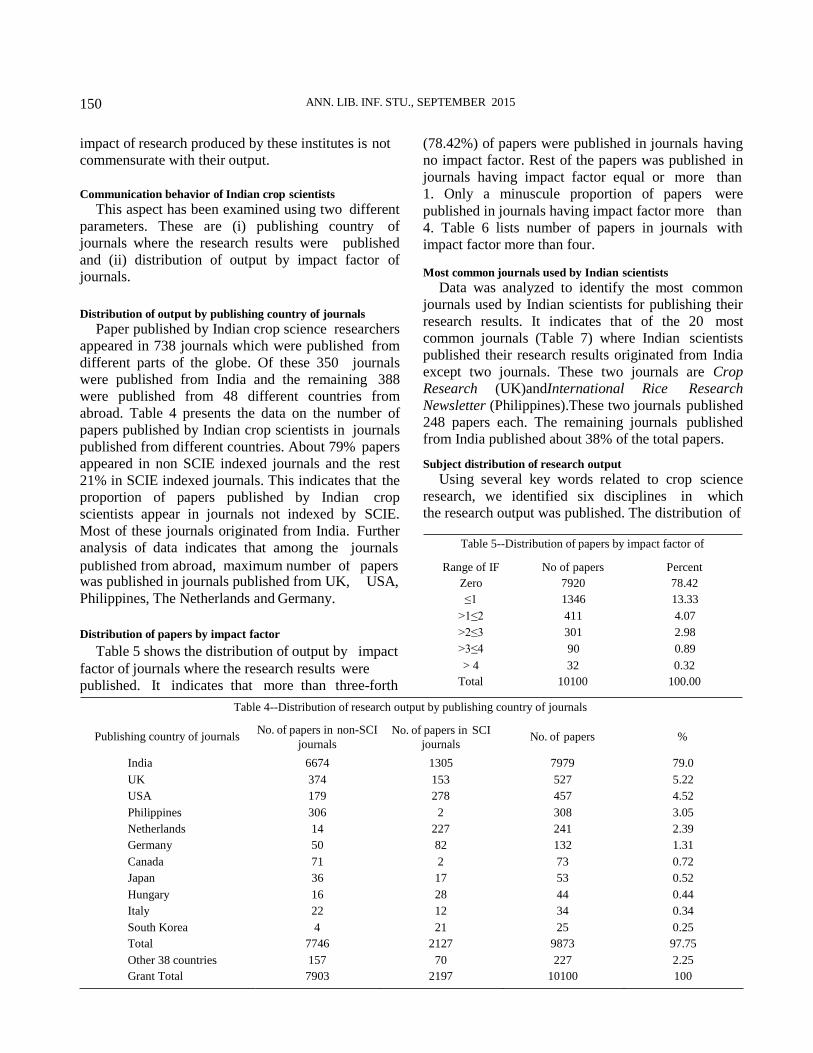
Distribution of output by publishing country of journals
Paper published by Indian crop science researchers
appeared in 738 journals which were published from
different parts of the globe. Of these 350 journals
were published from India and the remaining 388
were published from 48 different countries from
abroad. Table 4 presents the data on the number of
papers published by Indian crop scientists in journals
published from different countries. About 79% papers
appeared in non SCIE indexed journals and the rest
21% in SCIE indexed journals. This indicates that the
proportion of papers published by Indian crop
scientists appear in journals not indexed by SCIE.
Most of these journals originated from India. Further
analysis of data indicates that among the journals
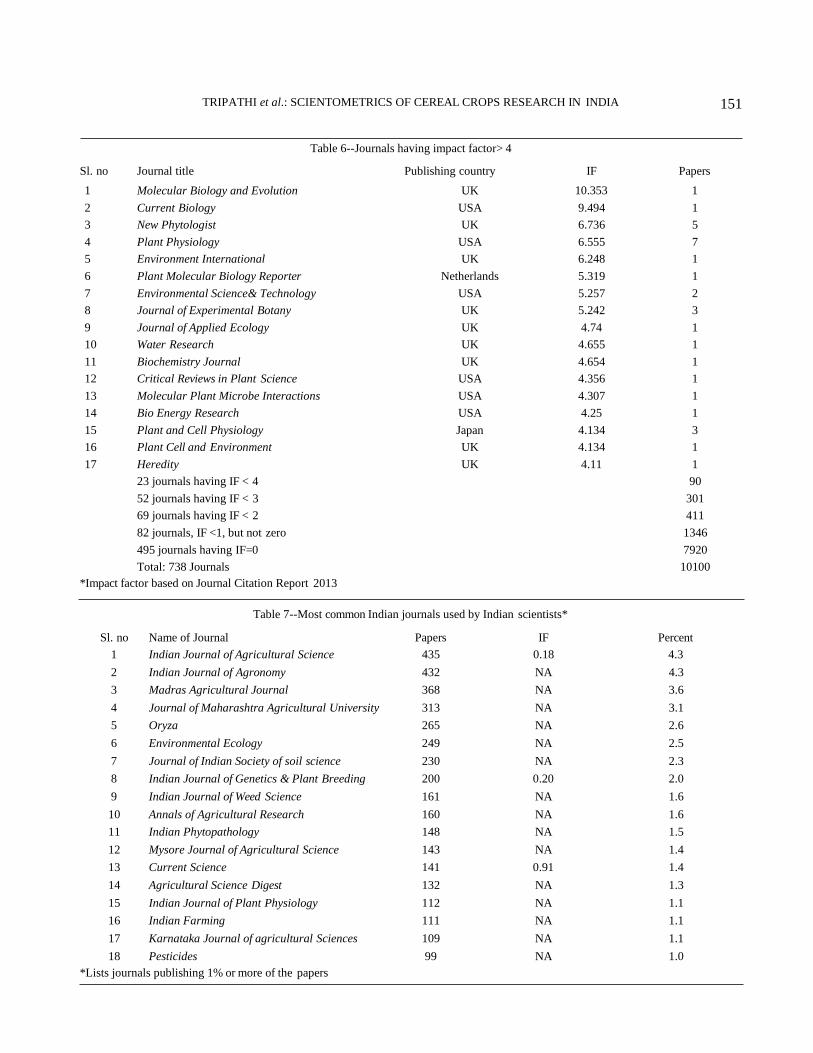
(78.42%) of papers were published in journals having
no impact factor. Rest of the papers was published in
journals having impact factor equal or more than
1. Only a minuscule proportion of papers were
published in journals having impact factor more than
4. Table 6 lists number of papers in journals with
impact factor more than four.
Most common journals used by Indian scientists
Data was analyzed to identify the most common
journals used by Indian scientists for publishing their
research results. It indicates that of the 20 most
common journals (Table 7) where Indian scientists
published their research results originated from India
except two journals. These two journals are Crop
Research (UK)andInternational Rice Research
Newsletter (Philippines).These two journals published
248 papers each. The remaining journals published
from India published about 38% of the total papers.
Subject distribution of research output
Using several key words related to crop science
research, we identified six disciplines in which
the research output was published. The distribution of
Table 5--Distribution of papers by impact factor of
published from abroad, maximum number of papers was published in journals published from UK, USA,
Range of IF
Zero
No of papers
7920
Percent
78.42
Philippines, The Netherlands and Germany. ≤1 1346 13.33
>1≤2 411 4.07
Distribution of papers by impact factor >2≤3 301 2.98
Table 5 shows the distribution of output by impact >3≤4 90 0.89
factor of journals where the research results were
published. It indicates that more than three-forth
> 4 32 0.32
Total 10100 100.00
Table 4--Distribution of research output by publishing country of journals
Publishing country of journals No. of papers in non-SCI
No. of papers in SCI
No. of papers %
India
journals
6674
journals
1305
7979
79.0
UK 374 153 527 5.22
USA 179 278 457 4.52
Philippines 306 2 308 3.05
Netherlands 14 227 241 2.39
Germany 50 82 132 1.31
Canada 71 2 73 0.72
Japan 36 17 53 0.52
Hungary 16 28 44 0.44
Italy 22 12 34 0.34
South Korea 4 21 25 0.25
Total 7746 2127 9873 97.75
Other 38 countries 157 70 227 2.25
Grant Total 7903 2197 10100 100
TRIPATHI et al.: SCIENTOMETRICS OF CEREAL CROPS RESEARCH IN INDIA 151
Table 6--Journals having impact factor> 4
Sl. no
1
Journal title
Molecular Biology and Evolution
Publishing country
UK
IF
10.353
Papers
1
2 Current Biology USA 9.494 1
3 New Phytologist UK 6.736 5
4 Plant Physiology USA 6.555 7
5 Environment International UK 6.248 1
6 Plant Molecular Biology Reporter Netherlands 5.319 1
7 Environmental Science& Technology USA 5.257 2
8 Journal of Experimental Botany UK 5.242 3
9 Journal of Applied Ecology UK 4.74 1
10 Water Research UK 4.655 1
11 Biochemistry Journal UK 4.654 1
12 Critical Reviews in Plant Science USA 4.356 1
13 Molecular Plant Microbe Interactions USA 4.307 1
14 Bio Energy Research USA 4.25 1
15 Plant and Cell Physiology Japan 4.134 3
16 Plant Cell and Environment UK 4.134 1
17 Heredity UK 4.11 1
23 journals having IF < 4 90
52 journals having IF < 3 301
69 journals having IF < 2 411
82 journals, IF <1, but not zero 1346
495 journals having IF=0 7920
Total: 738 Journals 10100
*Impact factor based on Journal Citation Report 2013
Table 7--Most common Indian journals used by Indian scientists*
Sl. no
1
Name of Journal
Indian Journal of Agricultural Science
Papers
435
IF
0.18
Percent
4.3
2 Indian Journal of Agronomy 432 NA 4.3
3 Madras Agricultural Journal 368 NA 3.6
4 Journal of Maharashtra Agricultural University 313 NA 3.1
5 Oryza 265 NA 2.6
6 Environmental Ecology 249 NA 2.5
7 Journal of Indian Society of soil science 230 NA 2.3
8 Indian Journal of Genetics & Plant Breeding 200 0.20 2.0
9 Indian Journal of Weed Science 161 NA 1.6
10 Annals of Agricultural Research 160 NA 1.6
11 Indian Phytopathology 148 NA 1.5
12 Mysore Journal of Agricultural Science 143 NA 1.4
13 Current Science 141 0.91 1.4
14 Agricultural Science Digest 132 NA 1.3
15 Indian Journal of Plant Physiology 112 NA 1.1
16 Indian Farming 111 NA 1.1
17 Karnataka Journal of agricultural Sciences 109 NA 1.1
18 Pesticides 99 NA 1.0
*Lists journals publishing 1% or more of the papers
152 ANN. LIB. INF. STU., SEPTEMBER 2015
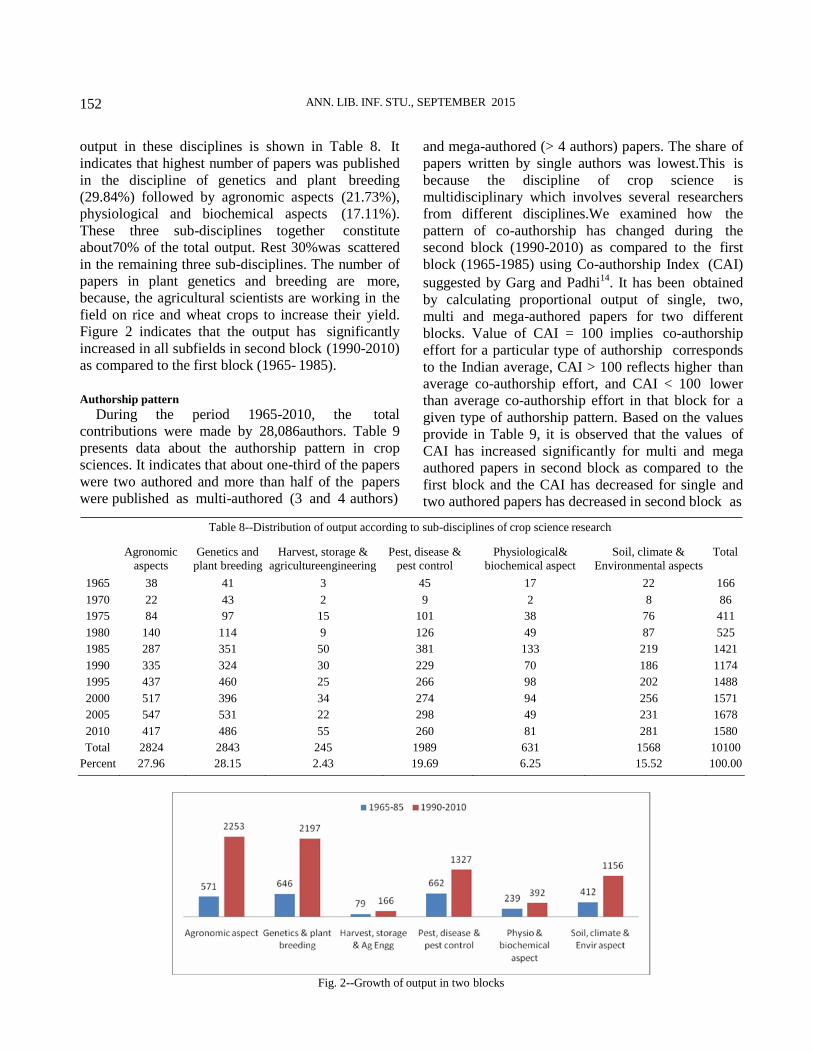
output in these disciplines is shown in Table 8. It
indicates that highest number of papers was published
in the discipline of genetics and plant breeding
(29.84%) followed by agronomic aspects (21.73%),
physiological and biochemical aspects (17.11%).
These three sub-disciplines together constitute
about70% of the total output. Rest 30%was scattered
in the remaining three sub-disciplines. The number of
papers in plant genetics and breeding are more,
because, the agricultural scientists are working in the
field on rice and wheat crops to increase their yield.
Figure 2 indicates that the output has significantly
increased in all subfields in second block (1990-2010)
as compared to the first block (1965- 1985).
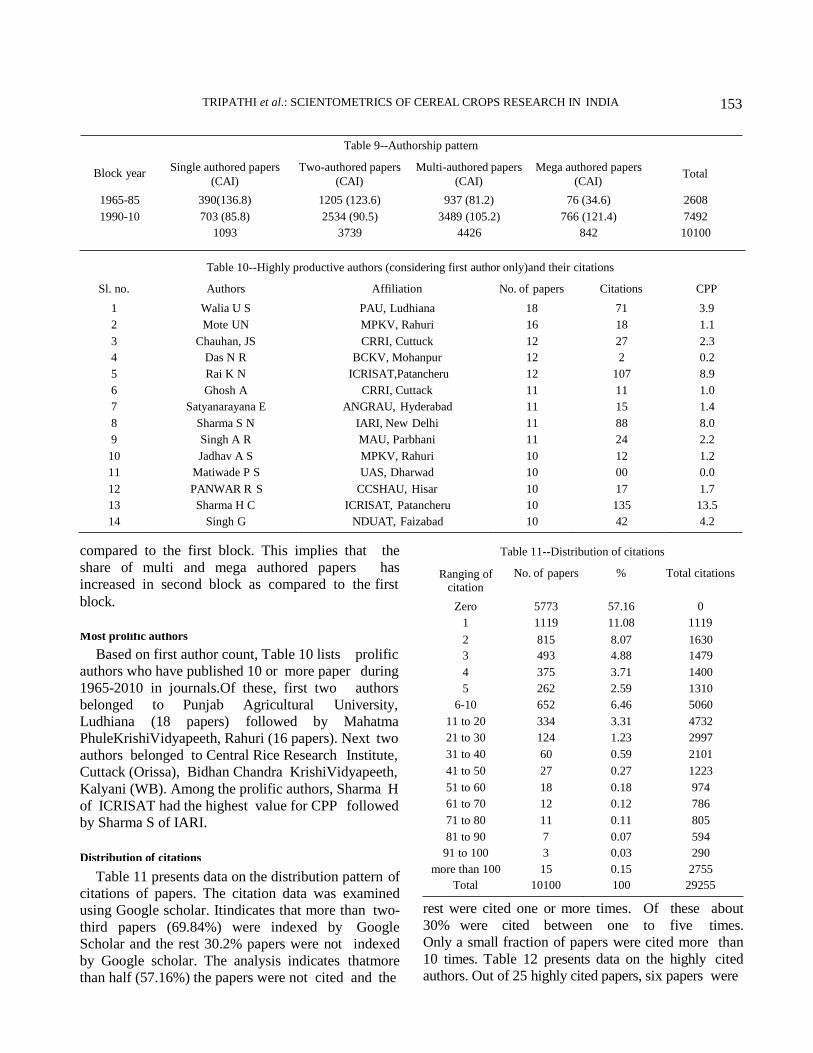
Authorship pattern
During the period 1965-2010, the total
contributions were made by 28,086authors. Table 9
presents data about the authorship pattern in crop
sciences. It indicates that about one-third of the papers
were two authored and more than half of the papers
were published as multi-authored (3 and 4 authors)
and mega-authored (> 4 authors) papers. The share of
papers written by single authors was lowest.This is
because the discipline of crop science is
multidisciplinary which involves several researchers
from different disciplines.We examined how the
pattern of co-authorship has changed during the
second block (1990-2010) as compared to the first
block (1965-1985) using Co-authorship Index (CAI)
suggested by Garg and Padhi14
. It has been obtained
by calculating proportional output of single, two,
multi and mega-authored papers for two different
blocks. Value of CAI = 100 implies co-authorship
effort for a particular type of authorship corresponds
to the Indian average, CAI > 100 reflects higher than
average co-authorship effort, and CAI < 100 lower
than average co-authorship effort in that block for a
given type of authorship pattern. Based on the values
provide in Table 9, it is observed that the values of
CAI has increased significantly for multi and mega
authored papers in second block as compared to the
first block and the CAI has decreased for single and
two authored papers has decreased in second block as
Table 8--Distribution of output according to sub-disciplines of crop science research
Agronomic
aspects
Genetics and
plant breeding
Harvest, storage &
agricultureengineering
Pest, disease &
pest control
Physiological&
biochemical aspect
Soil, climate &
Environmental aspects
Total
1965 38 41 3 45 17 22 166
1970 22 43 2 9 2 8 86
1975 84 97 15 101 38 76 411
1980 140 114 9 126 49 87 525
1985 287 351 50 381 133 219 1421
1990 335 324 30 229 70 186 1174
1995 437 460 25 266 98 202 1488
2000 517 396 34 274 94 256 1571
2005 547 531 22 298 49 231 1678
2010 417 486 55 260 81 281 1580
Total 2824 2843 245 1989 631 1568 10100
Percent 27.96 28.15 2.43 19.69 6.25 15.52 100.00
Fig. 2--Growth of output in two blocks
TRIPATHI et al.: SCIENTOMETRICS OF CEREAL CROPS RESEARCH IN INDIA 153
Table 9--Authorship pattern
Block year Single authored papers Two-authored papers Multi-authored papers Mega authored papers
Total
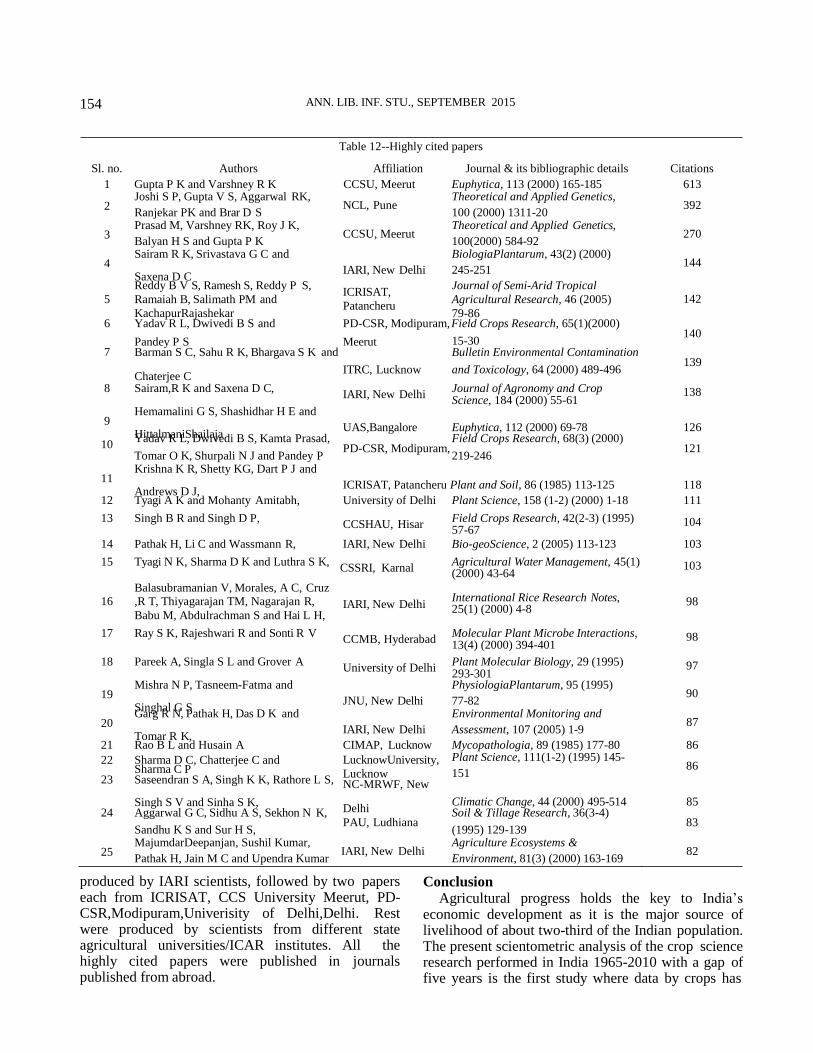
Table 10--Highly productive authors (considering first author only)and their citations
Sl. no.
1
Authors
Walia U S
Affiliation
PAU, Ludhiana
No. of papers
18
Citations
71
CPP
3.9
2 Mote UN MPKV, Rahuri 16 18 1.1
3 Chauhan, JS CRRI, Cuttuck 12 27 2.3
4 Das N R BCKV, Mohanpur 12 2 0.2
5 Rai K N ICRISAT,Patancheru 12 107 8.9
6 Ghosh A CRRI, Cuttack 11 11 1.0
7 Satyanarayana E ANGRAU, Hyderabad 11 15 1.4
8 Sharma S N IARI, New Delhi 11 88 8.0
9 Singh A R MAU, Parbhani 11 24 2.2
10 Jadhav A S MPKV, Rahuri 10 12 1.2
11 Matiwade P S UAS, Dharwad 10 00 0.0
12 PANWAR R S CCSHAU, Hisar 10 17 1.7
13 Sharma H C ICRISAT, Patancheru 10 135 13.5
14 Singh G NDUAT, Faizabad 10 42 4.2
compared to the first block. This implies that the
share of multi and mega authored papers has
increased in second block as compared to the first
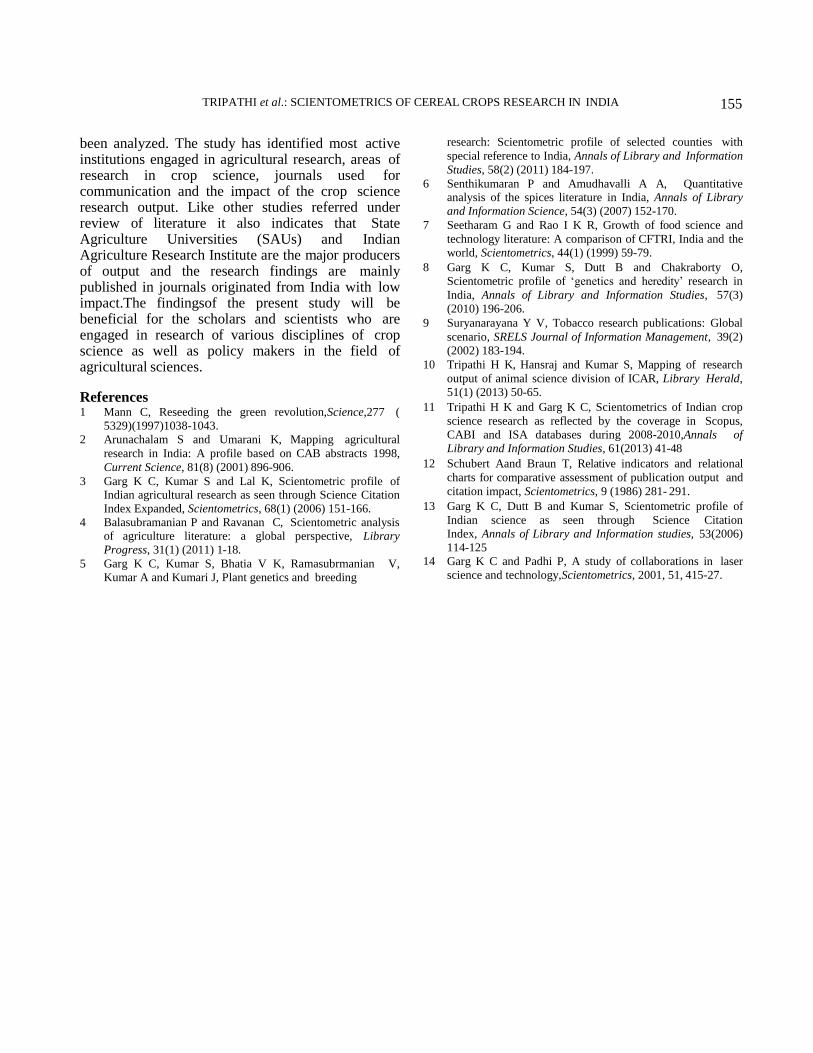
Ranging of
citation
Table 11--Distribution of citations
No. of papers % Total citations
block. Zero 5773 57.16 0
1 1119 11.08 1119
Table 11 presents data on the distribution pattern of
citations of papers. The citation data was examined
using Google scholar. Itindicates that more than two-
third papers (69.84%) were indexed by Google
Scholar and the rest 30.2% papers were not indexed
by Google scholar. The analysis indicates thatmore
than half (57.16%) the papers were not cited and the
Total 10100 100 29255
rest were cited one or more times. Of these about
30% were cited between one to five times.
Only a small fraction of papers were cited more than
10 times. Table 12 presents data on the highly cited
authors. Out of 25 highly cited papers, six papers were
1965-85
(CAI)
390(136.8)
(CAI)
1205 (123.6)
(CAI)
937 (81.2)
(CAI)
76 (34.6)
2608
1990-10 703 (85.8) 2534 (90.5) 3489 (105.2) 766 (121.4) 7492
1093 3739 4426 842 10100
Most prolific authors 2 815 8.07 1630
Based on first author count, Table 10 lists prolific 3 493 4.88 1479
authors who have published 10 or more paper during 4 375 3.71 1400
1965-2010 in journals.Of these, first two authors 5 262 2.59 1310
belonged to Punjab Agricultural University, 6-10 652 6.46 5060
Ludhiana (18 papers) followed by Mahatma 11 to 20 334 3.31 4732
PhuleKrishiVidyapeeth, Rahuri (16 papers). Next two 21 to 30 124 1.23 2997
authors belonged to Central Rice Research Institute, 31 to 40 60 0.59 2101
Cuttack (Orissa), Bidhan Chandra KrishiVidyapeeth, 41 to 50 27 0.27 1223
Kalyani (WB). Among the prolific authors, Sharma H 51 to 60 18 0.18 974
of ICRISAT had the highest value for CPP followed 61 to 70 12 0.12 786
by Sharma S of IARI. 71 to 80 11 0.11 805
81 to 90 7 0.07 594
Distribution of citations 91 to 100 3 0.03 290
more than 100 15 0.15 2755
154 ANN. LIB. INF. STU., SEPTEMBER 2015
Table 12--Highly cited papers
Sl. no. Authors Affiliation Journal & its bibliographic details Citations
1 Gupta P K and Varshney R K CCSU, Meerut Euphytica, 113 (2000) 165-185 613 Joshi S P, Gupta V S, Aggarwal RK,
Ranjekar PK and Brar D S NCL, Pune
Prasad M, Varshney RK, Roy J K,
Balyan H S and Gupta P K CCSU, Meerut
Sairam R K, Srivastava G C and
Saxena D C IARI, New Delhi
Theoretical and Applied Genetics,
100 (2000) 1311-20 392
Theoretical and Applied Genetics,
100(2000) 584-92 270
BiologiaPlantarum, 43(2) (2000)
245-251 144
Reddy B V S, Ramesh S, Reddy P S,
5 Ramaiah B, Salimath PM and
KachapurRajashekar
ICRISAT,
Patancheru
Journal of Semi-Arid Tropical
Agricultural Research, 46 (2005)
79-86
142
6 Yadav R L, Dwivedi B S and PD-CSR, Modipuram, Field Crops Research, 65(1)(2000)
Pandey P S 7 Barman S C, Sahu R K, Bhargava S K and
Meerut 15-30 140
Bulletin Environmental Contamination
Chaterjee C ITRC, Lucknow and Toxicology, 64 (2000) 489-496
139
8 Sairam,R K and Saxena D C, IARI, New Delhi
Journal of Agronomy and Crop Science, 184 (2000) 55-61
Hemamalini G S, Shashidhar H E and
HittalmaniShailaja UAS,Bangalore Euphytica, 112 (2000) 69-78 126
10 Yadav R L, Dwivedi B S, Kamta Prasad, Field Crops Research, 68(3) (2000)
Tomar O K, Shurpali N J and Pandey P PD-CSR, Modipuram,
219-246 121
Krishna K R, Shetty KG, Dart P J and
Andrews D J, ICRISAT, Patancheru Plant and Soil, 86 (1985) 113-125 118
12 Tyagi A K and Mohanty Amitabh, University of Delhi Plant Science, 158 (1-2) (2000) 1-18 111
13 Singh B R and Singh D P, CCSHAU, Hisar
Field Crops Research, 42(2-3) (1995) 57-67
14 Pathak H, Li C and Wassmann R, IARI, New Delhi Bio-geoScience, 2 (2005) 113-123 103
15 Tyagi N K, Sharma D K and Luthra S K, CSSRI, Karnal
Agricultural Water Management, 45(1) (2000) 43-64
Balasubramanian V, Morales, A C, Cruz 16 ,R T, Thiyagarajan TM, Nagarajan R,
Babu M, Abdulrachman S and Hai L H, IARI, New Delhi
International Rice Research Notes, 25(1) (2000) 4-8
17 Ray S K, Rajeshwari R and Sonti R V CCMB, Hyderabad
Molecular Plant Microbe Interactions, 13(4) (2000) 394-401
18 Pareek A, Singla S L and Grover A University of Delhi
Plant Molecular Biology, 29 (1995) 293-301
Mishra N P, Tasneem-Fatma and
Singhal G S JNU, New Delhi
Garg R N, Pathak H, Das D K and
Tomar R K, IARI, New Delhi
PhysiologiaPlantarum, 95 (1995)
77-82 90
Environmental Monitoring and
Assessment, 107 (2005) 1-9 87
21 Rao B L and Husain A CIMAP, Lucknow Mycopathologia, 89 (1985) 177-80 86
22 Sharma D C, Chatterjee C and Sharma C P
23 Saseendran S A, Singh K K, Rathore L S,
LucknowUniversity,
Lucknow NC-MRWF, New
Plant Science, 111(1-2) (1995) 145-
151 86
Singh S V and Sinha S K, 24 Aggarwal G C, Sidhu A S, Sekhon N K, Delhi
Climatic Change, 44 (2000) 495-514 85 Soil & Tillage Research, 36(3-4)
Sandhu K S and Sur H S, PAU, Ludhiana
MajumdarDeepanjan, Sushil Kumar,
Pathak H, Jain M C and Upendra Kumar IARI, New Delhi
(1995) 129-139 83
Agriculture Ecosystems &
Environment, 81(3) (2000) 163-169 82
produced by IARI scientists, followed by two papers each from ICRISAT, CCS University Meerut, PD- CSR,Modipuram,Univerisity of Delhi,Delhi. Rest were produced by scientists from different state agricultural universities/ICAR institutes. All the highly cited papers were published in journals published from abroad.
Conclusion Agricultural progress holds the key to India’s
economic development as it is the major source of livelihood of about two-third of the Indian population. The present scientometric analysis of the crop science research performed in India 1965-2010 with a gap of five years is the first study where data by crops has
2
3
4
138
9
11
104
103
98
97
19
20
25
98
TRIPATHI et al.: SCIENTOMETRICS OF CEREAL CROPS RESEARCH IN INDIA 155
been analyzed. The study has identified most active institutions engaged in agricultural research, areas of research in crop science, journals used for communication and the impact of the crop science research output. Like other studies referred under review of literature it also indicates that State Agriculture Universities (SAUs) and Indian Agriculture Research Institute are the major producers of output and the research findings are mainly published in journals originated from India with low impact.The findingsof the present study will be beneficial for the scholars and scientists who are engaged in research of various disciplines of crop science as well as policy makers in the field of agricultural sciences.
References 1 Mann C, Reseeding the green revolution,Science,277 (
5329)(1997)1038-1043.
2 Arunachalam S and Umarani K, Mapping agricultural
research in India: A profile based on CAB abstracts 1998,
Current Science, 81(8) (2001) 896-906.
3 Garg K C, Kumar S and Lal K, Scientometric profile of Indian agricultural research as seen through Science Citation
Index Expanded, Scientometrics, 68(1) (2006) 151-166.
4 Balasubramanian P and Ravanan C, Scientometric analysis
of agriculture literature: a global perspective, Library
Progress, 31(1) (2011) 1-18.
5 Garg K C, Kumar S, Bhatia V K, Ramasubrmanian V,
Kumar A and Kumari J, Plant genetics and breeding
research: Scientometric profile of selected counties with
special reference to India, Annals of Library and Information
Studies, 58(2) (2011) 184-197.
6 Senthikumaran P and Amudhavalli A A, Quantitative analysis of the spices literature in India, Annals of Library
and Information Science, 54(3) (2007) 152-170.
7 Seetharam G and Rao I K R, Growth of food science and
technology literature: A comparison of CFTRI, India and the
world, Scientometrics, 44(1) (1999) 59-79.
8 Garg K C, Kumar S, Dutt B and Chakraborty O,
Scientometric profile of ‘genetics and heredity’ research in
India, Annals of Library and Information Studies, 57(3)
(2010) 196-206.
9 Suryanarayana Y V, Tobacco research publications: Global
scenario, SRELS Journal of Information Management, 39(2)
(2002) 183-194.
10 Tripathi H K, Hansraj and Kumar S, Mapping of research
output of animal science division of ICAR, Library Herald,
51(1) (2013) 50-65.
11 Tripathi H K and Garg K C, Scientometrics of Indian crop
science research as reflected by the coverage in Scopus,
CABI and ISA databases during 2008-2010,Annals of
Library and Information Studies, 61(2013) 41-48
12 Schubert Aand Braun T, Relative indicators and relational
charts for comparative assessment of publication output and
citation impact, Scientometrics, 9 (1986) 281- 291.
13 Garg K C, Dutt B and Kumar S, Scientometric profile of
Indian science as seen through Science Citation
Index, Annals of Library and Information studies, 53(2006)
114-125
14 Garg K C and Padhi P, A study of collaborations in laser
science and technology,Scientometrics, 2001, 51, 415-27.
156 ANN. LIB. INF. STU., SEPTEMBER 2015
Appendix
Full Name Abbreviations
Indian Agricultural Research Institute, New Delhi IARI
Tamil Nadu Agricultural University, Coimbatore TNAU
Punjab Agricultural University, Ludhiana PAU
CCS Haryana Agricultural University, Hisar CCSHAU
G.B. Pant University of Agriculture and Technology, Pantnagar GBPUA&T
Central Rice Research institute, Cuttack CRRI
University of Agricultural Sciences, Dharwad/Banglore UAS
AcharyaN.G.Ranga Agricultural University, Hyderabad ANGRAU
Mahatma PhuleKrishiVidyapeeth, Rahuri MPKV
Bidhan Chandra KrishiViswavidyalaya, Mohanpur BCKV
CSK Himachal Pradesh KrishiVishvavidyalaya, Palampur CSKHPKV
Rajendra Agricultural University, Samastipur RAU
Banaras Hindu University, Varanasi BHU
Indira Gandhi KrishiVishwavidyalaya, Raipur IGKVV
Orissa University of Agriculture Technology, Bhuvaneshwar OUAT
Dr. PanjabraoDeshmukhKrishiVidyapeeth, Akola PDKV
International Crops Research Institute for the Semi-Arid Tropics, Patancheru ICRISAT
Chandra.Shekar Azad University of Agriculture and Technology, Kanpur CSAUAT
Narendra.Dev University of Agriculture and Technology, Faizabad NDUAT
Assam Agricultural University, Jorhut AAU
VasantraoNaikMarathwadaKrishiVidyapeeth, Parabhani VNMKV
Birsa Agricultural University, Ranchi BAU
MaharanaPratap University of Agriculture &Technology, Udaipur MPUAT
Jawaharlal.NehruKrishiVishwaVidyalaya, Jabalpur JNKVV
National Chemical Laboratory, Pune NCL
ChaudharyCharan Singh University, Meerut CCSU
Project Directorate for Cropping Systems Research, Modipuram PD-CSR
Industrial Toxicology Research Centre, Lucknow ITRC
Central Soil Salinity Research Institute, Karnal CSSRI
Centre for Cellular and Molecular Biology, Hyderabad CCMB
Jawaharlal Nehru University, New Delhi JNU
Central Institute for Medicinal& Aromatic Plants, Lucknow CIMAP
National Centre for Medium Range Weather forecasting, New Delhi NC-MRWF
Indian Council of Agricultural Research, New Delhi ICAR
Marathwada Agricultural University, Parbhani, MAU


![11.[57-69]Price Behaviour of Major Cereal Crops in Bangladesh](https://img.dokumen.tips/doc/110x75/577d1e5a1a28ab4e1e8e556f/1157-69price-behaviour-of-major-cereal-crops-in-bangladesh.jpg)
