Embed Size (px)
Citation preview
Science of The Total Environment Volume 663, 1 May 2019, Pages 610-631 Accepted 22 January 2019, Available online 25 January 2019 https://www.sciencedirect.com/science/article/pii/S0048969719303407 doi: 10.1016/j.scitotenv.2019.01.299
Simulating micro-scale thermal interactions in different building environments for mitigating urban heat islands Soumendu Chatterjee, Ansar Khan, Apurba Dinda, Sk Mithun, Rupali Khatun, Hashem Akbari, Hiroyuki Kusaka, Chandana Mitra, Saad Saleem Bhatti, Quang Van Doan, Yupeng Wang Abstract Tropical cities are more susceptible to the suggested fall outs from projected global warming scenarios as they are located in the Torrid Zone and growing at rapid rates. Therefore, research on the mitigation of urban heat island (UHI) effects in tropical cities has attained much significance and increased immensely over recent years. The UHI mitigation strategies commonly used for temperate cities need to be examined in the tropical context since the mechanism of attaining a surface energy balance in the tropics is quite different from that in the mid-latitudes. The present paper evaluates the performance of four different mitigation strategies to counterbalance the impact of UHI phenomena for climate resilient adaptation in the Kolkata Metropolitan Area (KMA), India. This has been achieved by reproducing the study sites, selected from three different urban morphologies of open low-rise, compact low-rise and mid-rise residential areas, using ENVI-met V 4.0 and simulating the effects of different mitigation strategies- cool pavement, cool roof, added urban vegetation and cool city (a combination of the three former strategies), in reducing the UHI intensity. Simulation results show that at a diurnal scale during summer, the green city model performed best at neighborhood level to reduce air temperature (Ta) by 0.7 °C, 0.8 °C and 1.1 °C, whereas the cool city model was the most effective strategy to reduce physiologically equivalent temperature (PET) by 2.8° – 3.1 °C, 2.2° – 2.8 °C and 2.8° – 2.9 °C in the mid-rise, compact low-rise and open low-rise residential areas, respectively. It was observed that (for all the built environment types) vegetation played the most significant role in determining surface energy balance in the study area, compared to cool roofs and cool pavements. This study also finds that irrespective of building environments, tropical cities are less sensitive to the selected strategies of UHI mitigation than their temperate counter parts, which can be attributed to the difference in magnitude of urbanness. Keywords: Urban micro-climate; UHI mitigation strategies; ENVI-met V 4.0; Cool city model; Physiologically equivalent temperature (PET) 1. Introduction In the wake of high speed urbanization and Global Climate Change (GCC) scenarios, the need for developing strategic plans to mitigate Urban Heat Island (UHI) effects through passive cooling of urban areas has become more urgent, especially for tropical cities (Gago et al., 2013; Kotharkar and Bagade, 2018; He, 2018). The developing countries, most of which are located in the tropics, have urbanized hastily in the last 30 years (1980–2011), at the annual rates between 2% and 6%, and have attained considerably higher levels of urbanization (30–40%) (Chen et al., 2014; Cao et al., 2016). Intensive urbanization has caused impervious surfaces to sprawl. In Brazil, India and China impervious surfaces occupy 0.39%, 1.61% and 1.85% of their respective total land area (Shen et al., 2016). Thermally massive structures installed in the cities absorb, store and re-radiate the extra solar energy per unit area as compared to the green (vegetated) surfaces that dominate their rural surroundings (Wang et al., 2015; Wang and Akbari, 2016; Wang et al., 2016; Chen, 2013). The proportion of latent heat transfer through evaporation reduces due to the increased surface runoff from the impervious surfaces of roads, pavements and buildings (Sodoudi et al., 2015). Delayed
release of heat from the urban structures and impeded transfer of heat from their immediate atmosphere to the outer space maintain warmer conditions in the cities compared to their neighbouring rural or sub-urban areas (Wang et al., 2016). Exacerbated heat stress, owing to overheating of indoor spaces, deteriorates the biophysical thermoregulatory system causing the city's population to suffer from heat stroke, heat syncope, thermal exhaustion and cardiovascular disorders (Fujibe, 2011; Kleerekoper et al., 2012; Rydin et al., 2012). The observed high ambient temperature increases the energy demand for cooling, particularly in cities that experience a tropical climate, where impacts of UHI effects during summer are devastating (Emmanuel et al., 2007; Santamouris, 2014; Nuruzzaman, 2015; Santamouris et al., 2017), but its effects in the high-latitude cities are beneficial to reduce the energy demand for heating purposes (Rajagopalan et al., 2014). The air-conditioning systems themselves release heat and thereby raise the outdoor temperature requiring more energy for cooling in turn (de Schiller and Evans, 1998; Baker et al., 2002). Importantly, tropical cities are reported to be more sensitive to global warming phenomena (Cutter et al., 2014). Being already located in warmer climate any further rise in temperature due to GCC would exert modifying effects on the urban micro- and macro-climate by altering the humidity condition, wind pattern and local ecosystems (Erell et al., 2011; Hathway and Sharples, 2012; Kolokotroni et al., 2012). Thus while the UHI is a globally documented phenomenon, its effects are more crucial for the tropical cities (Gusson and Duarte, 2016), where summers are becoming systematically warmer (Marshall, 2005), but mitigation issues are normally neglected (Rajagopalan et al., 2014). A vast majority of the tropical UHI studies, conducted in the last decade, are devoted to recognize the intensities of such UHI effects, at seasonal and diurnal scales, in large and medium sized cities such as Singapore (Priyadarsini et al., 2008; Jusuf et al., 2007; Ng, 2015; Li and Norford, 2016); Bangkok (Waewsak et al., 2015); Hong Kong (Giridharan et al., 2004; Ng et al., 2012); Beijing (Quan et al., 2014); Shanghai (Yang et al., 2010); Kuala Lumpur (Sani, 1972, Sani, 1986; Sham, 1973, Sham, 1984a, Sham, 1984b, 1986, 1987,1988; Elsayed, 2012; Aflaki et al., 2017; Ramakreshnan et al., 2018); Colombo (Emmanuel and Fernando, 2007a, Emmanuel and Fernando, 2007b; Perera, 2016); Sao Paulo (Cardoso et al., 2017); Rio de Janeiro (Peres et al., 2018); Guwahati (Borbora and Das, 2014); Delhi (Mohan et al., 2012) and elsewhere (Tran et al., 2006; Da Silva et al., 2010; Peng et al., 2012; Wu et al., 2013; Liu et al., 2015). The results obtained from many of these studies, when compared with the findings of similar studies in temperate cities, reveal some of the distinctive features of tropical UHI in terms of its phase and amplitude (Chow and Roth, 2006; Marques et al., 2009; Duarte et al., 2015). Many scholars have reported that hot humid tropical cities receive negative (cool islands), rather than positive, values of surface UHI (SUHI) during pre-monsoon summer days, but the values become significantly positive during nights in summer (Nichol, 1996; Johnson et al., 2005; Johansson and Emmanuel, 2006; Chakraborty et al., 2017; Shastri et al., 2017). In respect of UHI characteristics, the tropical cities are different from the temperate cities which remain warmer during a larger part of the day throughout the year (Van Hove et al., 2015). It has also been observed for many tropical cities that, the UHI intensity maximizes around mid-day (e.g. 2:00–4:00 pm for Sao Paulo; Ferreira et al., 2012) while in temperate region, the largest rural-urban temperature difference is observed a few hours after sunset (e.g. 5:00 pm for Toronto; Wang et al., 2016). It is also important to note that, in general, the UHI effect is less intense in the tropics compared to that in the mid-latitudes and that the cooling effects in tropical climate are modulated largely by wetness (Charabi and Bakhit, 2011; Ojeh et al., 2016). The distinguishing nature of the tropical UHI is attributed to two specific features of surface energy balance (SEB) in the urban areas (Giridharan and Emmanuel, 2018). Firstly, the predominance of direct solar radiation in net all-wave radiation due to high angle of the Sun over the tropics induces excess heating of the urban structures in contrast to the mid-latitudes (Chow and Roth, 2006). Secondly, during the dry season, the tropical areas receive greater amounts of net radiation and the
latent heat transfer remains considerably higher than the sensible heat transfer, while both the conditions reverse when the rainy season sets in (Barradas et al., 1999). The unusual pre-monsoon day-time negative UHI in tropical cities is explained by low vegetal cover in non-urban surroundings that limits the conversion of net insolation into latent heat (Oke, 1980; Emmanuel et al., 2007; Shastri et al., 2017). The shading effects of plants and buildings are also responsible for lowering the temperature in urban locations of the tropics on dry summer days (Jonsson, 2005; Emmanuel, 2005; Johansson and Emmanuel, 2006). Therefore, selection of the most appropriate measure to effectively mitigate tropical UHI will depend on a proper understanding of the SEB mechanisms for this region. Therefore, modeling the relationship between building environment and its surrounding outdoor areas is of critical importance for guiding the urban climate and outdoor thermal comfort (Rizwan et al., 2008). The studies so far which address the UHI mitigation issues through micro-thermal modeling and simulation of urban built environment have been wide-ranging for temperate cities (Rosenfeld et al., 1995; Rizwan et al., 2008; Mirzaei and Haghighat, 2010; Gago et al., 2013; Santamouris, 2012, Santamouris, 2013; Akbari and Kolokotsa, 2016). Cool roof, cool pavement and green coverage have been identified as the most popular well-researched alternatives to moderate temperate UHIs at the diurnal scale (Wang et al., 2015; Estrada et al., 2017). Majority of the tropical UHI studies are, however, oriented towards assessment of UHI magnitude, few of these account for the contributing factors (Roth, 2007; Emmanuel and Steemers, 2018a, Emmanuel and Steemers, 2018b). Model-based research approach towards the mitigation alternatives has rarely been adopted for the tropical cities. In tropical Australia, Miller et al. (2015), assessed the solar gain via roofs of the residential buildings at low-rise compact residential area and the simulation results revealed that application of cool materials (0.9 albedo) could reduce the peak cooling load varyingly between 5% and 35%. For the Mediterranean region, Zinzi and Agnoli (2012) reported that the metallic cool roof was the best solution for saving energy (7%), and that a green roof infrastructure could reduce energy demand by 6.2%. The potential of cool roof technologies in reducing the ambient air temperature has thus been quantitatively investigated in different sub-environments of tropical climate too (Costanzo et al., 2013; Rosado et al., 2014; Dabaieh et al., 2015). While cool roofing strategies could ensure strong energy saving for the temperate cities (30% - 40%) (Taha et al., 1989; Akbari et al., 1999; Levinson et al., 2007; Takebayashi and Moriyama, 2012; Santamouris et al., 2018), they could not produce similarly inspiring results for the cities in the tropical belt. Results obtained through simulation on Singapore revealed that cool roofs were capable of reducing daytime temperatures but little thermal benefit was obtained during night time when UHI was most intensive (Li and Norford, 2016). Built environment is the manifestation of the interactions among climate, buildings and plants (Wong and Chen, 2010). Therefore, studies, at both micro- (urban canopy layer) and macro-scale (urban boundary layer), have been done to explore quantitatively the possibilities of reducing the temperature through green strategies such as street trees, urban parks, green roof and landscaping (Taha et al., 1988; Doick et al., 2014; Duarte and Ferreira, 2016; Gunawardena et al., 2017). Such studies for different environments in tropical and sub-tropical climate settings have yielded contrasting results (Chang et al., 2007; Spangenberg et al., 2008). Shashua-Bar and Hoffman (2004) observed a lowering of the ambient temperature by 1–2.5 °C at 3:00 pm along the tree-fringed streets relative to those without vegetation in Tel-Aviv, Israel. In a similar study Chatzidimitriou et al. (2005) simulated temperature with trees planted along the streets of Thessaloniki, Greece using ENVI-met and reported the reduction of the temperature by a very small amount (<1 °C). They, however, observed a significant lowering of the surface temperature (up to 20 °C) and mean radiant temperature (by >40 °C). The plantation of shading trees improved the thermal comfort significantly in the hot dry climate of Ghardaia, Algeria (Ali-Toudert and Mayer, 2007). Researches have revealed that parks with matured trees have had ameliorating effects on the micro-climate of Kuala Lumpur (Nasir et al., 2015), though such effects remain significant only within 500 m distance from the park boundary (Buyadi et al., 2014).
Evidently, the ameliorative responses of the UHI phenomena to urban vegetation are quite variable across the sub-types of tropical climatic regimes. Cool pavement is another UHI mitigation technology that substantially reduces the surface temperature and, therefore, is often tried in simulation studies (Li et al., 2013; Guntor et al., 2014). In an experimental evaluation of various paving materials, Anting et al. (2017) found that full body porcelain tiles (albedo 0.48) are potential for reducing the peak surface temperature by 6.4 °C in tropical environments, but are not effective for nocturnal cooling. On the other hand, for many cities in mid-latitudes, thermal performance of cool pavements have been superior (Santamouris, 2013; Akbari and Kolokotsa, 2016). The Cool pavement model yielded better results when adopted in combination with additional vegetation coverage (Shahidan et al., 2012; Santamouris et al., 2012). Several other schemes of combining mitigation strategies are successfully adopted in simulations of temperate and sub-tropical urban micro-climates (Noro and Lazzarin, 2015; Wang et al., 2016), such experiments have yet to be undertaken for tropical cities. In India, the cities of Delhi (Mallick et al., 2008; Roy et al., 2011; Mohan et al., 2012, Mohan et al., 2013; Bhan and Saxena, 2014; Singh et al., 2014), Chennai (Lilly Rose and Devadas, 2008; Amirtham et al., 2009) and Mumbai (Kumar et al., 2001; Nair & Hosalikar, 2013; Maral and Mukhopadhyay, 2002; Grover and Singh, 2016) have been well studied where UHIs have been quantified. These studies used long-term temperature records (Mohan et al., 2011), satellite images (Mallick and Rahman, 2012; Sharma and Joshi, 2014), data collected through mobile survey (Jeganathan et al., 2016); and more sophisticatedly, the model-based (e.g. Weather Research and Forecasting) simulation of temperatures (Bhati and Mohan, 2016). Except some micro-scale experiments with commonly used building materials (Kannamma and Sundaram, 2015) and thermal insulators (Kumar and Shekhar, 2015), very few of the UHI studies carried out in India have actually dealt with mitigation strategies emphasizing installation of green surface and introduction of high albedo roofing and paving materials (Kotharkar and Bagade, 2018). Being conditioned by climate type and urban morphologies, performance of the mitigation strategies across building environments needs to be examined in large variety of climatic sub-types of the tropical region. The Kolkata Metropolitan Area (KMA) exhibits certain thermal behavior owing to some characteristic features that distinguishes it from the other topical and Indian cities. Kolkata belongs to the tropical savanna climate (‘Aw’ type as per Köppen's scheme) for which no specific UHI mitigation strategy has yet been investigated. The city has undergone fast and haphazard urban expansion with the dominance of mid-rise and low-rise buildings. The lack of high rise buildings negates the thermal benefits of shading effects and leaves the city open to a direct absorption of the incoming solar radiation. The absence of mitigation strategies for Indian cities has shown a dilemma in implementing climate-sensitive urban planning (i.e. considering the energy demand, thermal comfort, air pollution and urban building architecture etc.). Hence, the present study tests and identifies the resilience and effectiveness of different UHI mitigation strategies, through ENVI-met simulations of the effects of different mitigation strategies - cool pavement, cool roof, and cool city - for the three different urban morphologies of open low-rise, compact low-rise and mid-rise residential areas. For each of the building environments, ENVI-met has been run for the period from 11:00 pm 26th June to 5:00 am 28th June 2017 using meteorological input data obtained from the network of micrometeorological stations with iButton instrument installations. 2. The Kolkata metropolitan area (KMA) With a current population of 14.5 million (Census of India, 2011) and an area of 1886.67 sq. km (2017), the Kolkata metropolitan area (KMA) is the third largest urban agglomerations (UAs) in India. Moreover, it is the largest centre of trade and commerce in eastern India. The city is located about 150 km to the north of the Bay of Bengal right over the Gangetic delta plains (Nath et al., 2015). The KMA possesses a tropical wet and dry climate with mean annual temperature of 24.8 °C; the winter
and summer means being 15 °C and 30 °C, respectively. The dry spell (May–June) of the summer season is often intervened by heat waves that raise the maximum temperature beyond 45 °C. However, the temperature profile of KMA is featured by a great deal of spatial variation. The city receives a total rainfall of 1582 mm annually, >80% of which comes between June and September from the Bay of Bengal branch of the South-West monsoon. The dynamics of land use and land cover (LULC) in the KMA region have always been dominated by faster growth in the peripheries as compared to the transformations in the city proper. The KMA has expanded primarily through conversion of agricultural lands in its rural surroundings. The city has extended contiguously in the south and south-east and the emergence of new townships in a more distributed pattern has induced a detached growth of built-up areas spreading out over a much larger region. The central part of the city is dominated by compact low-rise buildings where spatiality of ill-conditioned urban structures offer more complexities to urban renewal than to develop low-rise, mid-rise or even high-rise buildings in areas surrounding the city core. In the city interior, intensively built-up zones like the central business district (CBD) in Laldighi area, the commercial district of Burra Bazar area and many other such tracts with least sky view factor (SVF) show unmistakable signs of UHI effects, mirroring the reality in other megacities of the country. According to the India Meteorological Department (IMD), Dalhousie Square in the central part of the city records an average of 39 °C temperature during summer while near Howrah, in the western margin of the city the average summer temperature is 35 °C. The National Environmental Engineering Institute (NEERI) has reported a difference of 3°–4 °C in temperature between the city centre and its peripheral areas. However, the Hooghly River plays a positive role in ameliorating the day-time intensity of UHI by facilitating horizontal flow of air over the city. 3. Materials and methods 3.1. Modeling approach A building affects its surrounding buildings thermally by influencing wind flow, access to solar radiation and heat flux. Therefore, the structure of buildings, their relative positions and arrangement over the space, explain the uniqueness of the micro-climate observed in urban neighborhoods. An assessment of the micro-climate around buildings needs an evaluation of heat and mass flows very precisely for a limited domain. For this purpose, numerical approaches are often adopted in solving the equations of mass and energy conservation in a gridded meteorological space. ENVI-met is a prognostic climate model that uses the principles of computational fluid dynamics (CFD) and thermodynamics to measure weather conditions by simulating the interactions among atmosphere, soil, vegetation and buildings at the spatial scale of 0.5–10 m and time steps of <10s. The main 3D atmospheric model extends up to 2500 m above the ground level, and includes a nested 1D boundary model that initializes the boundary conditions for the model. It analyzes a set of physical processes including radiative fluxes, advection-diffusion of heat, exchange of vapour at plant (output from vegetation model) and turbulence. The model solves the non-hydrostatic incompressible Navier-Stokes equation for each grid cell at each time step to compute three-dimensional mean turbulent air flow. Similarly, the distribution of temperature and humidity is achieved by solving the combined advection-diffusion equation where temperatures of the ground surface, roofs and walls define the boundary conditions. In simulating the turbulence produced by buildings and trees, ENVI-met uses a 1.5 order turbulence closure model, as devised by Mellor and Yamada and Mellor (1975). 3.2. Model configuration and environmental conditions This study employs a micro-climate simulation using ENVI-met V 4.0 to evaluate the UHI mitigation strategies in the urban environment of Kolkata mega city in India. Three different building configurations with distinct micro-climates have been modeled and experimental conditions under four different mitigation strategies were compared with reference to the existing situation. The task
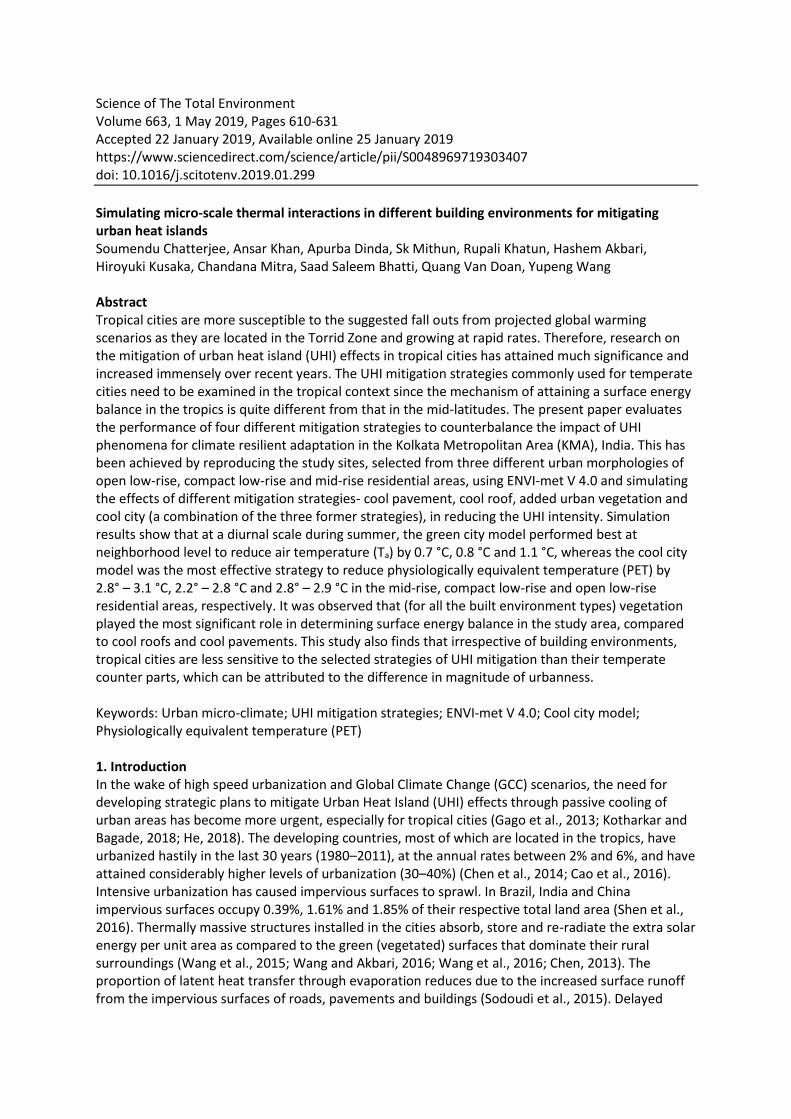
of configuring the model involved four basic steps: (1) selection of simulation sites, (2) setting the basic area for reproduction of the selected sites in ENVI-met platform, (3) defining the mitigation strategies to be tested, and (4) setting up the simulation. 3.2.1. Simulation sites The simulation sites were selected for this experimental study from three different building configurations with distinct urban micro-environments viz. mid-rise, open low-rise and compact low-rise residential buildings, which are called as local climate zones (LCZs) (Table 1) following the scheme of Stewart and Oke (2012) (Fig. 1). Salt Lake City, a satellite town of Kolkata developed between 1958 and 1965 to meet residential needs of the rapidly growing population in the main city of Kolkata, was selected as a representative site for mid-rise residential area. The study site consists of 42 mid-rise residential buildings having an average height of 30 m, wide asphalt roads, occasional occurrence of deciduous trees, and small patches of water bodies (Table 2). The LCZ of open low-rise detached housing units was selected to be in the Dum Dum area located at the northern margin of the city hearth. This area started developing at a later stage only after it was connected with the other parts of the city through metro railway. The selected site represents a residential neighborhood comprising 25 widely spaced concrete buildings with an average height of 15 m. Apart from the asphalt roads, scattered trees and grass covered open spaces occupy a significant portion of land between the houses. The compact low-rise area selected for the present study is the core of the commercial district, Burra Bazar, which is the city's oldest wholesale and retail market. The area has functioned as the largest trade centre in eastern India since last 300 years. The simulation site is characterized by two or three storied over crowded tenements with very old structures, leaving almost no space between the buildings. Numerous festering streets crisscross the neighborhoods before joining with the Mahatma Gandhi Road, the main arterial road of the area. The KMA region is located in the southern part of the state of West Bengal, India which constitutes a portion of the Lower Ganga Plain. Therefore, the study area represents a flat alluvial plain with an imperceptible slope. There is absolutely no difference in terrain and topography between the selected study sites. The River Hooghly flows longitudinally from the North to South dissecting the study area into eastern and western halves. The presence of the river contributes towards a significant cooling effect on the higher ambient air temperature, by reducing temperature up to 1–2 °C during the daytime. The cooling effect, however, does not spread beyond 30 m from the river and is found negligible at 40 m due to the dense development of buildings along the river banks. Table 1. The urban surface characters for each model area.
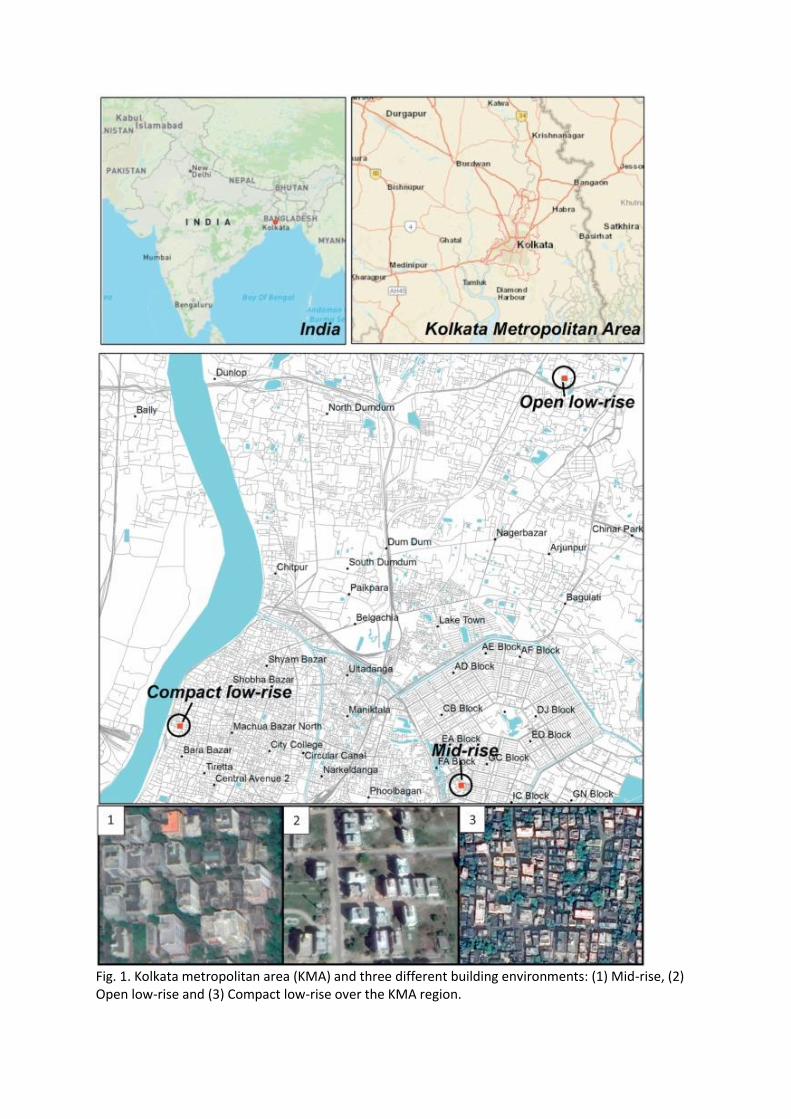
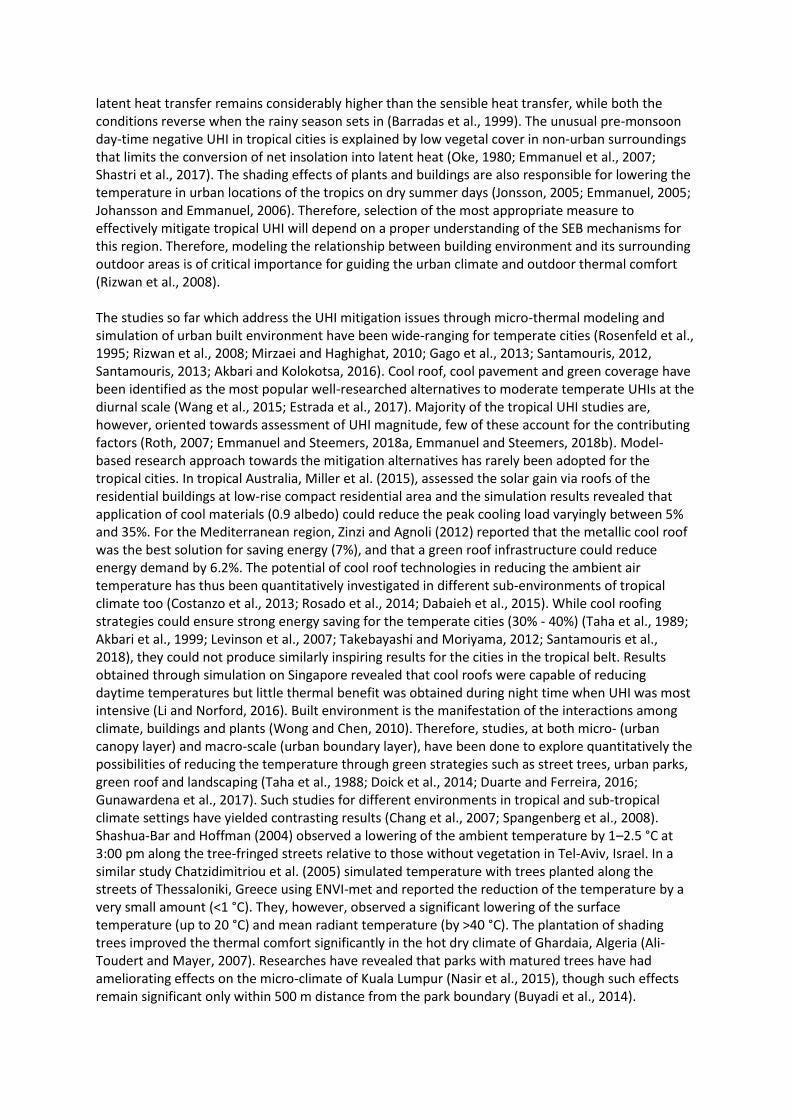
Fig. 1. Kolkata metropolitan area (KMA) and three different building environments: (1) Mid-rise, (2) Open low-rise and (3) Compact low-rise over the KMA region.
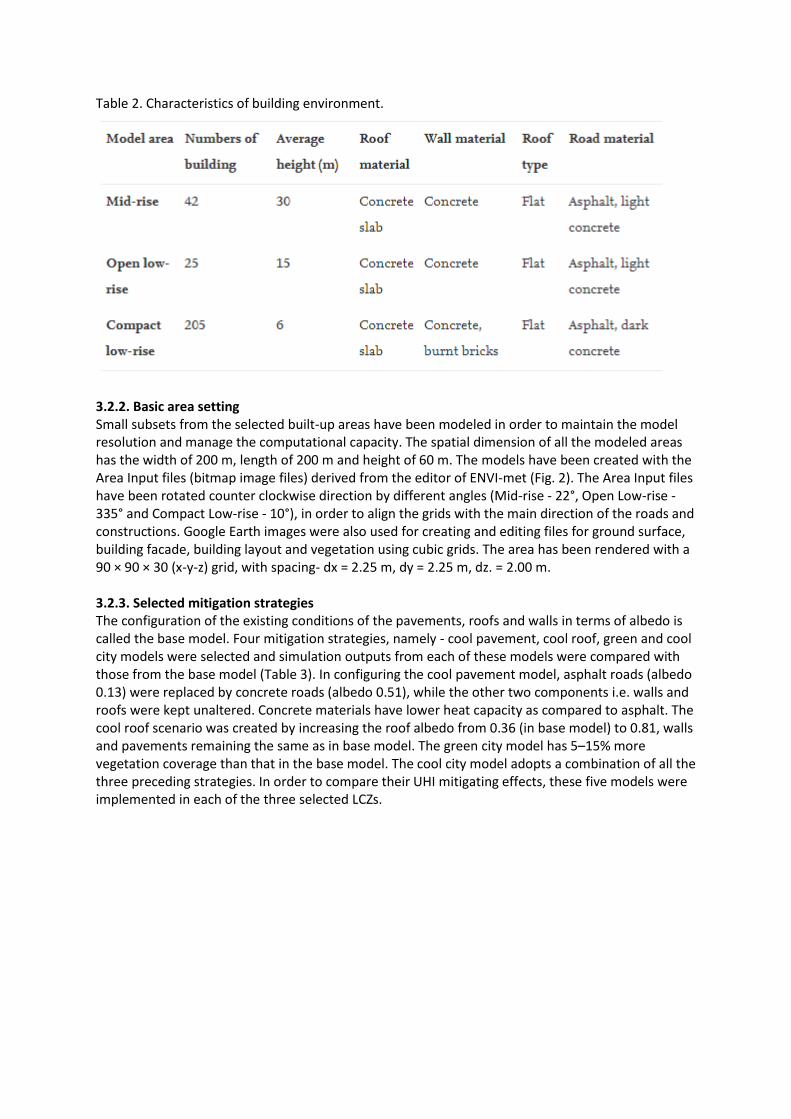
Table 2. Characteristics of building environment.
3.2.2. Basic area setting Small subsets from the selected built-up areas have been modeled in order to maintain the model resolution and manage the computational capacity. The spatial dimension of all the modeled areas has the width of 200 m, length of 200 m and height of 60 m. The models have been created with the Area Input files (bitmap image files) derived from the editor of ENVI-met (Fig. 2). The Area Input files have been rotated counter clockwise direction by different angles (Mid-rise - 22°, Open Low-rise - 335° and Compact Low-rise - 10°), in order to align the grids with the main direction of the roads and constructions. Google Earth images were also used for creating and editing files for ground surface, building facade, building layout and vegetation using cubic grids. The area has been rendered with a 90 × 90 × 30 (x-y-z) grid, with spacing- dx = 2.25 m, dy = 2.25 m, dz. = 2.00 m. 3.2.3. Selected mitigation strategies The configuration of the existing conditions of the pavements, roofs and walls in terms of albedo is called the base model. Four mitigation strategies, namely - cool pavement, cool roof, green and cool city models were selected and simulation outputs from each of these models were compared with those from the base model (Table 3). In configuring the cool pavement model, asphalt roads (albedo 0.13) were replaced by concrete roads (albedo 0.51), while the other two components i.e. walls and roofs were kept unaltered. Concrete materials have lower heat capacity as compared to asphalt. The cool roof scenario was created by increasing the roof albedo from 0.36 (in base model) to 0.81, walls and pavements remaining the same as in base model. The green city model has 5–15% more vegetation coverage than that in the base model. The cool city model adopts a combination of all the three preceding strategies. In order to compare their UHI mitigating effects, these five models were implemented in each of the three selected LCZs.
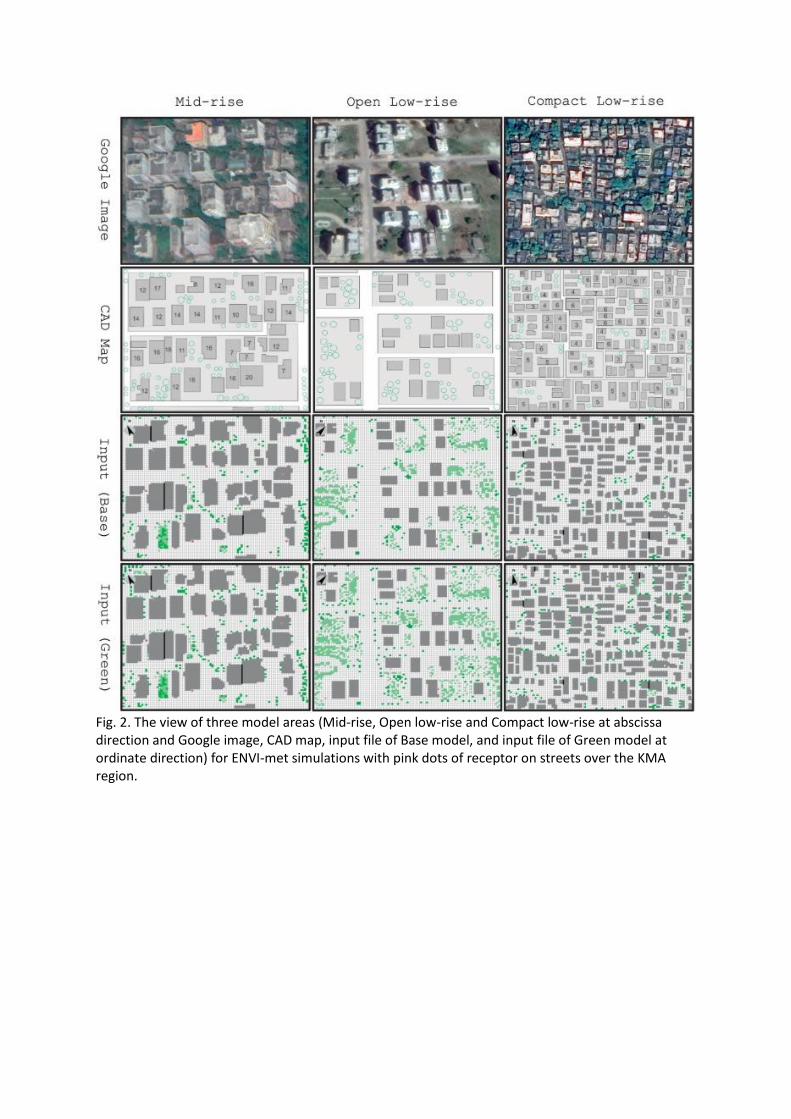
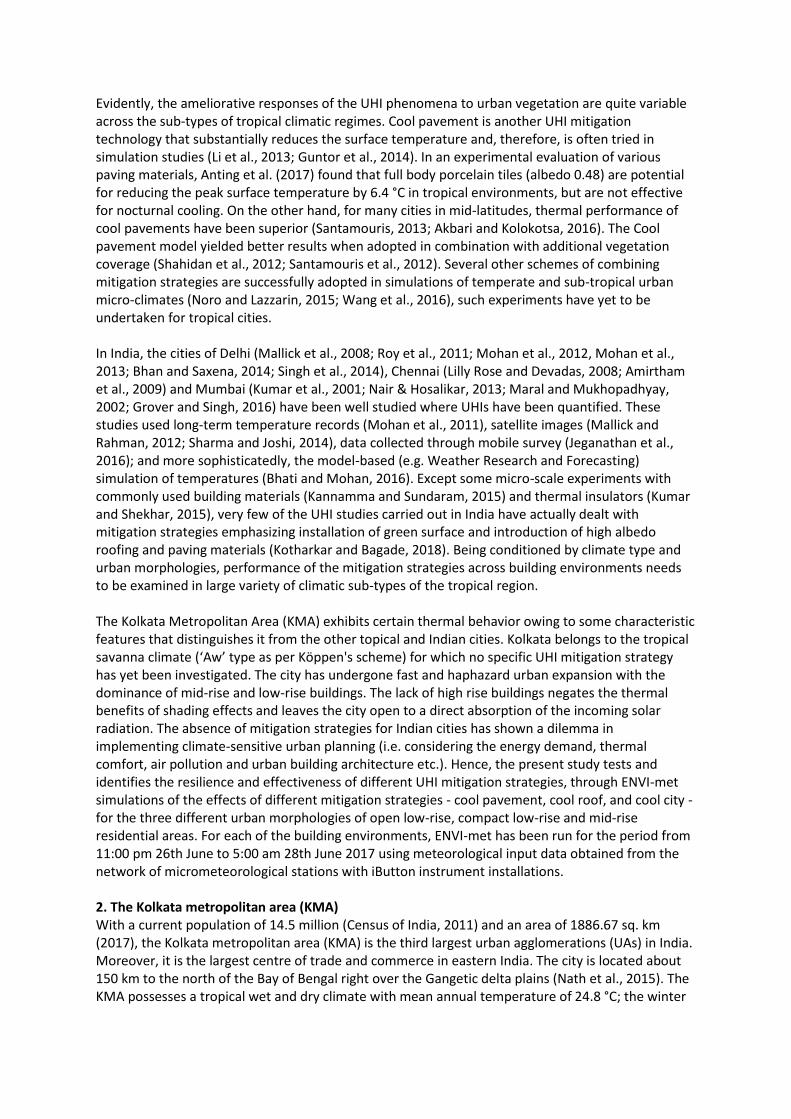
Fig. 2. The view of three model areas (Mid-rise, Open low-rise and Compact low-rise at abscissa direction and Google image, CAD map, input file of Base model, and input file of Green model at ordinate direction) for ENVI-met simulations with pink dots of receptor on streets over the KMA region.
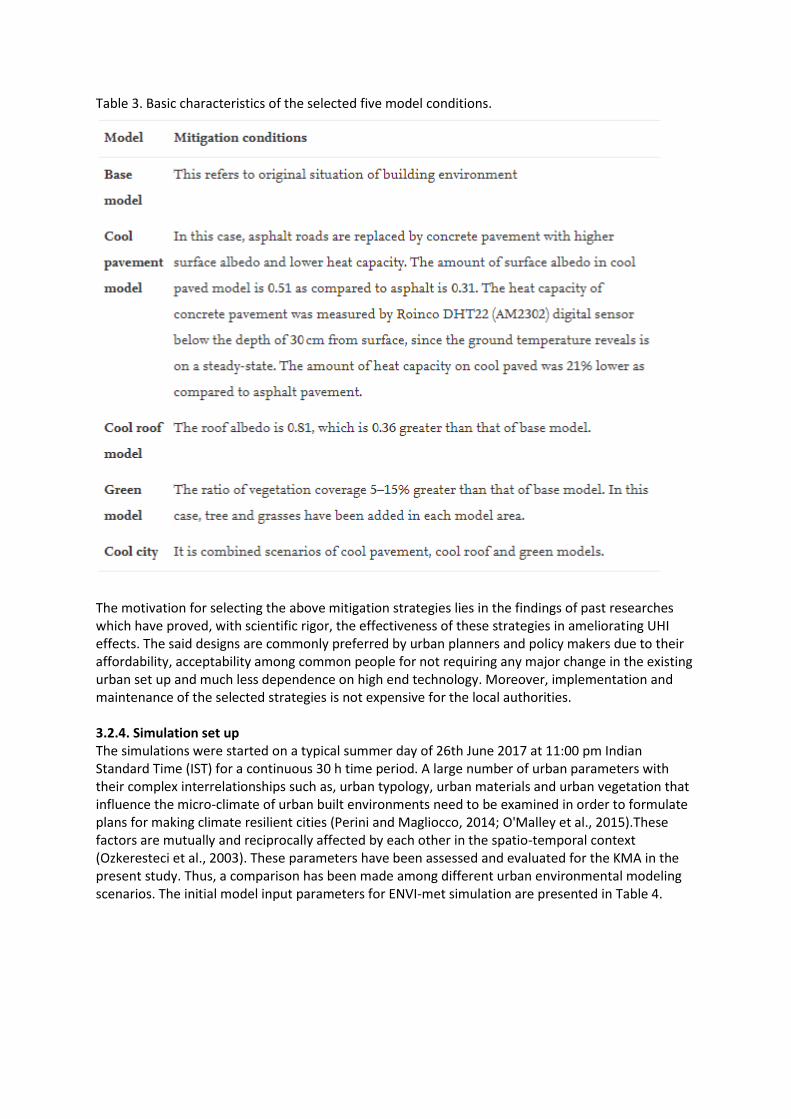
Table 3. Basic characteristics of the selected five model conditions.
The motivation for selecting the above mitigation strategies lies in the findings of past researches which have proved, with scientific rigor, the effectiveness of these strategies in ameliorating UHI effects. The said designs are commonly preferred by urban planners and policy makers due to their affordability, acceptability among common people for not requiring any major change in the existing urban set up and much less dependence on high end technology. Moreover, implementation and maintenance of the selected strategies is not expensive for the local authorities. 3.2.4. Simulation set up The simulations were started on a typical summer day of 26th June 2017 at 11:00 pm Indian Standard Time (IST) for a continuous 30 h time period. A large number of urban parameters with their complex interrelationships such as, urban typology, urban materials and urban vegetation that influence the micro-climate of urban built environments need to be examined in order to formulate plans for making climate resilient cities (Perini and Magliocco, 2014; O'Malley et al., 2015).These factors are mutually and reciprocally affected by each other in the spatio-temporal context (Ozkeresteci et al., 2003). These parameters have been assessed and evaluated for the KMA in the present study. Thus, a comparison has been made among different urban environmental modeling scenarios. The initial model input parameters for ENVI-met simulation are presented in Table 4.
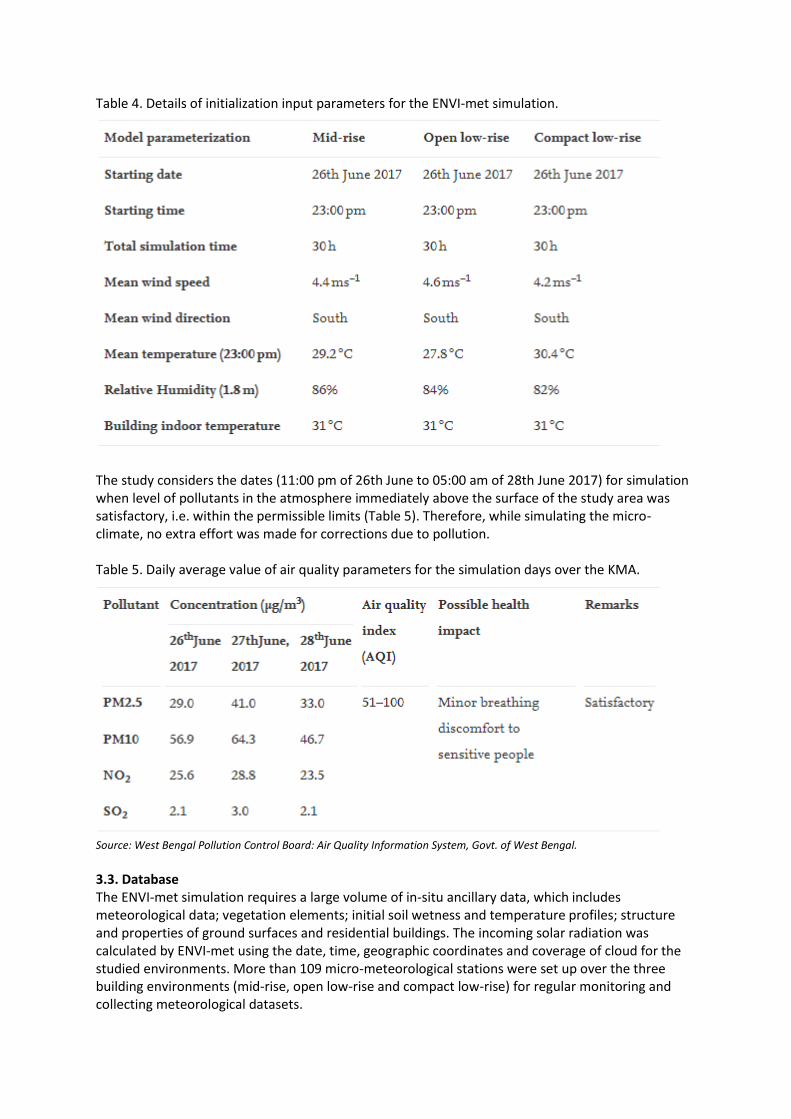
Table 4. Details of initialization input parameters for the ENVI-met simulation.
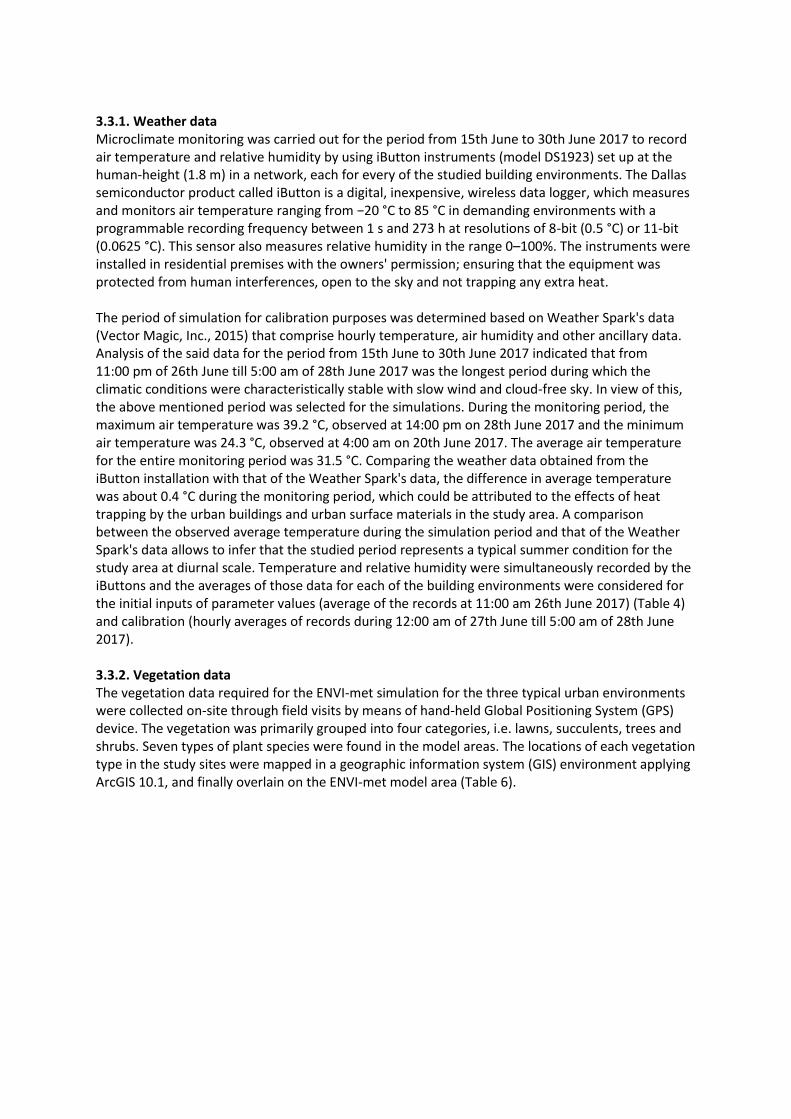
The study considers the dates (11:00 pm of 26th June to 05:00 am of 28th June 2017) for simulation when level of pollutants in the atmosphere immediately above the surface of the study area was satisfactory, i.e. within the permissible limits (Table 5). Therefore, while simulating the micro-climate, no extra effort was made for corrections due to pollution. Table 5. Daily average value of air quality parameters for the simulation days over the KMA.
Source: West Bengal Pollution Control Board: Air Quality Information System, Govt. of West Bengal.
3.3. Database The ENVI-met simulation requires a large volume of in-situ ancillary data, which includes meteorological data; vegetation elements; initial soil wetness and temperature profiles; structure and properties of ground surfaces and residential buildings. The incoming solar radiation was calculated by ENVI-met using the date, time, geographic coordinates and coverage of cloud for the studied environments. More than 109 micro-meteorological stations were set up over the three building environments (mid-rise, open low-rise and compact low-rise) for regular monitoring and collecting meteorological datasets.
3.3.1. Weather data Microclimate monitoring was carried out for the period from 15th June to 30th June 2017 to record air temperature and relative humidity by using iButton instruments (model DS1923) set up at the human-height (1.8 m) in a network, each for every of the studied building environments. The Dallas semiconductor product called iButton is a digital, inexpensive, wireless data logger, which measures and monitors air temperature ranging from −20 °C to 85 °C in demanding environments with a programmable recording frequency between 1 s and 273 h at resolutions of 8-bit (0.5 °C) or 11-bit (0.0625 °C). This sensor also measures relative humidity in the range 0–100%. The instruments were installed in residential premises with the owners' permission; ensuring that the equipment was protected from human interferences, open to the sky and not trapping any extra heat. The period of simulation for calibration purposes was determined based on Weather Spark's data (Vector Magic, Inc., 2015) that comprise hourly temperature, air humidity and other ancillary data. Analysis of the said data for the period from 15th June to 30th June 2017 indicated that from 11:00 pm of 26th June till 5:00 am of 28th June 2017 was the longest period during which the climatic conditions were characteristically stable with slow wind and cloud-free sky. In view of this, the above mentioned period was selected for the simulations. During the monitoring period, the maximum air temperature was 39.2 °C, observed at 14:00 pm on 28th June 2017 and the minimum air temperature was 24.3 °C, observed at 4:00 am on 20th June 2017. The average air temperature for the entire monitoring period was 31.5 °C. Comparing the weather data obtained from the iButton installation with that of the Weather Spark's data, the difference in average temperature was about 0.4 °C during the monitoring period, which could be attributed to the effects of heat trapping by the urban buildings and urban surface materials in the study area. A comparison between the observed average temperature during the simulation period and that of the Weather Spark's data allows to infer that the studied period represents a typical summer condition for the study area at diurnal scale. Temperature and relative humidity were simultaneously recorded by the iButtons and the averages of those data for each of the building environments were considered for the initial inputs of parameter values (average of the records at 11:00 am 26th June 2017) (Table 4) and calibration (hourly averages of records during 12:00 am of 27th June till 5:00 am of 28th June 2017). 3.3.2. Vegetation data The vegetation data required for the ENVI-met simulation for the three typical urban environments were collected on-site through field visits by means of hand-held Global Positioning System (GPS) device. The vegetation was primarily grouped into four categories, i.e. lawns, succulents, trees and shrubs. Seven types of plant species were found in the model areas. The locations of each vegetation type in the study sites were mapped in a geographic information system (GIS) environment applying ArcGIS 10.1, and finally overlain on the ENVI-met model area (Table 6).
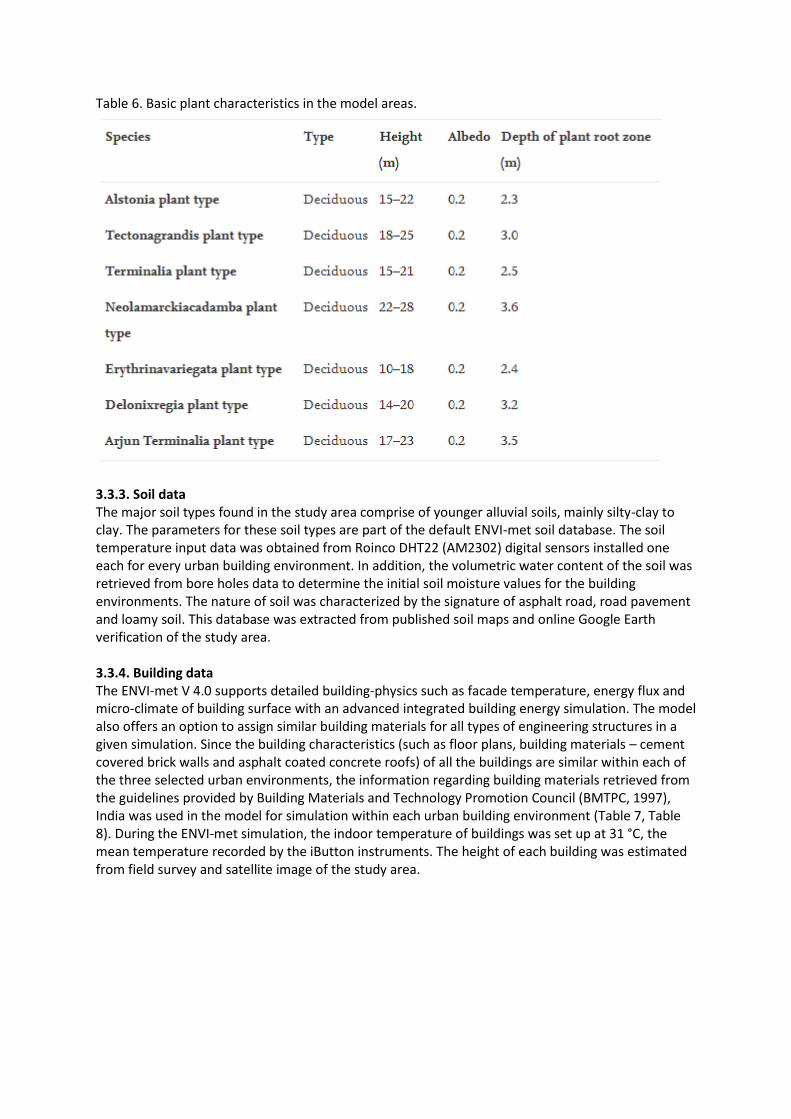
Table 6. Basic plant characteristics in the model areas.
3.3.3. Soil data The major soil types found in the study area comprise of younger alluvial soils, mainly silty-clay to clay. The parameters for these soil types are part of the default ENVI-met soil database. The soil temperature input data was obtained from Roinco DHT22 (AM2302) digital sensors installed one each for every urban building environment. In addition, the volumetric water content of the soil was retrieved from bore holes data to determine the initial soil moisture values for the building environments. The nature of soil was characterized by the signature of asphalt road, road pavement and loamy soil. This database was extracted from published soil maps and online Google Earth verification of the study area. 3.3.4. Building data The ENVI-met V 4.0 supports detailed building-physics such as facade temperature, energy flux and micro-climate of building surface with an advanced integrated building energy simulation. The model also offers an option to assign similar building materials for all types of engineering structures in a given simulation. Since the building characteristics (such as floor plans, building materials – cement covered brick walls and asphalt coated concrete roofs) of all the buildings are similar within each of the three selected urban environments, the information regarding building materials retrieved from the guidelines provided by Building Materials and Technology Promotion Council (BMTPC, 1997), India was used in the model for simulation within each urban building environment (Table 7, Table 8). During the ENVI-met simulation, the indoor temperature of buildings was set up at 31 °C, the mean temperature recorded by the iButton instruments. The height of each building was estimated from field survey and satellite image of the study area.
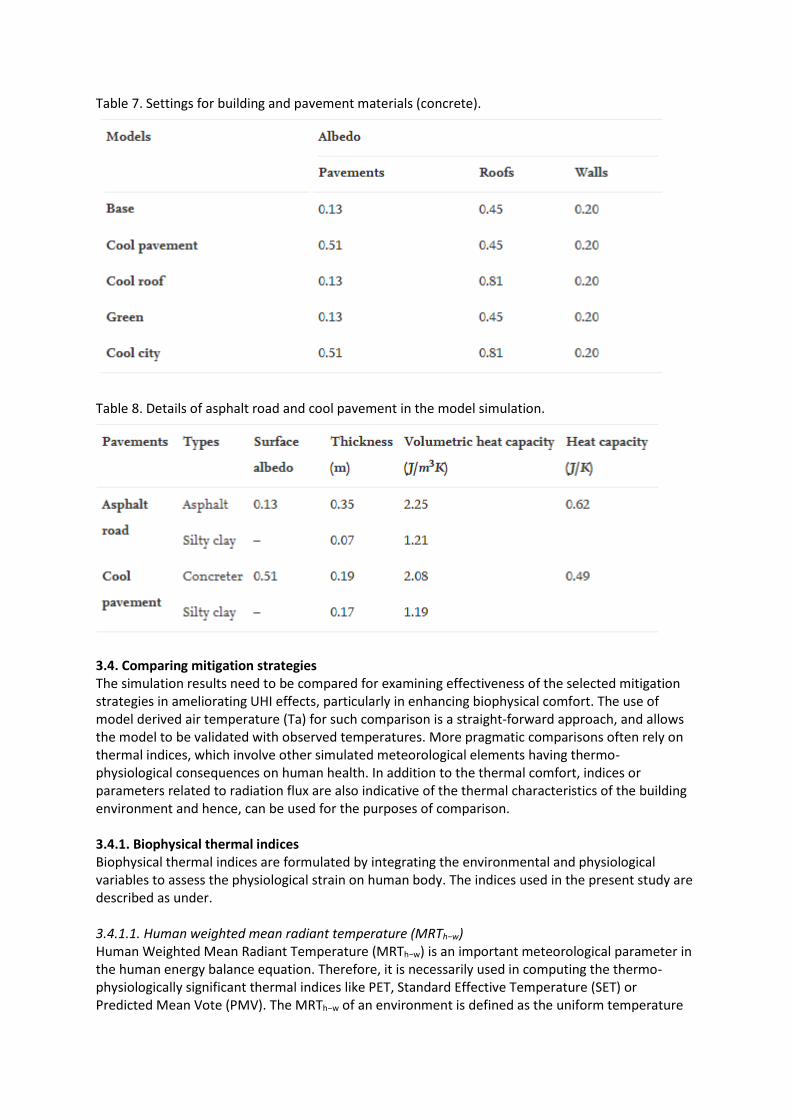
Table 7. Settings for building and pavement materials (concrete).
Table 8. Details of asphalt road and cool pavement in the model simulation.
3.4. Comparing mitigation strategies The simulation results need to be compared for examining effectiveness of the selected mitigation strategies in ameliorating UHI effects, particularly in enhancing biophysical comfort. The use of model derived air temperature (Ta) for such comparison is a straight-forward approach, and allows the model to be validated with observed temperatures. More pragmatic comparisons often rely on thermal indices, which involve other simulated meteorological elements having thermo-physiological consequences on human health. In addition to the thermal comfort, indices or parameters related to radiation flux are also indicative of the thermal characteristics of the building environment and hence, can be used for the purposes of comparison. 3.4.1. Biophysical thermal indices Biophysical thermal indices are formulated by integrating the environmental and physiological variables to assess the physiological strain on human body. The indices used in the present study are described as under. 3.4.1.1. Human weighted mean radiant temperature (MRTh−w) Human Weighted Mean Radiant Temperature (MRTh−w) is an important meteorological parameter in the human energy balance equation. Therefore, it is necessarily used in computing the thermo-physiologically significant thermal indices like PET, Standard Effective Temperature (SET) or Predicted Mean Vote (PMV). The MRTh−w of an environment is defined as the uniform temperature
of an imaginary black enclosure (emission coefficient, e = 1) which results in the same radiation fluxes from the occupant as the actual enclosure. There are a variety of methods for calculating the value of MRTh−w, but RayMan computes it by enumerating the short-wave and long-wave fluxes. The calculation requires the thermal properties and dimensions of the radiating surfaces, in which SVF and posture of the human body are to be given as input. 3.4.1.2. Physiologically equivalent temperature (PET) PET is a bio-meteorological thermal index widely used to demonstrate individual's thermal perception (Mayer and Höppe, 1987; Höppe, 1999; Matzarakis et al., 1999; Ketterer and Matzarakis, 2016). It measures the thermal effects of a complex meteorological condition in developing heat stress on a standard human body in reference to a standardized indoor condition that produces similar stress. PET refers to the equivalent temperature at which, in a typical indoor environment (no sun shine; wind speed = 0.1 m/s; vapour pressure = 12 hPa and air temperature,Ta = mean radiant temperature, MRTh−w), the heat budget in the body of a characteristic individual (age = 40 years; sex = male; weight = 70 kg; work metabolism with light activity = 80 W and clothing = 0.9 clo) is balanced with same core and skin temperatures (Tc and Tsk) as under the outdoor condition being assessed. Computation of PET uses the MEMI (Munich Energy-balance Model for Individuals) proposed by Höppe (1984). 3.4.1.3. Standard effective temperature (SET*) SET* is another comprehensive thermal comfort index based on human energy balance and incorporates all the basic factors of thermal comfort (Gagge et al., 1986). It assumes a standard environment with relative humidity of 50%, wind speed <0.1 m/s and mean radiant temperature is taken equal to the air temperature, and an imaginary occupant of the standard environment with an activity level of 1.0 met and a clothing level of 0.6 clo. SET* is essentially the dry-bulb temperature at which heat loss through the skin of an imaginary occupant of the standard environment is equal to that from a person in the actual environment. Researchers have compared SET* with other indices and established the superiority of SET* in evaluating outdoor environment (Ishii et al., 1988; Kinouchi and Yoshitani, 2001). 3.4.1.4. Predicted mean vote (PMV) Fanger (1972) defined the thermal load at a given activity level, as the difference between metabolic heat production and heat loss by an individual kept under the condition of thermal comfort. The value for thermal comfort is obtained by regressing skin temperature and sweat rate on metabolic rate, for which the data were produced through a climate chamber experiment. Thermal comfort is a function of six key factors, four of them are environmental factors (air temperature, mean radiant temperature, relative humidity and wind speed) and two are personal factors (clothing insulation and metabolic heat rate related to activity level). The thermal load expresses the physiological strain imposed by the environment being assessed. Thus for a given set of values for these six factors, the thermal load on an individual is calculated and plotted against comfort vote and this plot is used to predict the comfort vote from the input values of environmental variables, metabolic rate and clothing insulation. The value thus obtained is a predicted mean vote (PMV), which is appraised on a thermal sensational scale. In this scale, PMV values between −0.5 and 0.5 represent a comfortable condition and the severity of cold sensation increases as the PMV values decreases from −0.5 to −3.5 and beyond, while the intensity of hot sensation increases with values from 0.5 to 3.5 or more.
3.4.2. Thermal parameters The following thermal parameters have been computed for each of the simulations in ENVI-met. 3.4.2.1. Net radiation (Rn) The net radiation (Rn) represents the algebraic sum of all energy fluxes in the form of soil heat (G), sensible heat (H) and latent heat (LE), measured in Wm−2. In the present study, the Rn has been calculated to compare the effects of mitigation strategies on the thermal environment in different morphological settings of the selected urban areas. The computational formula of Rn is.
(1) 3.4.2.2. Thermal radiative power (TRP) The total amount of heat energy radiated from a surface to the surrounding environment is referred to as thermal radiative power (TRP) of the surface. It has been used in this study for comparing the effectiveness of the mitigation measures in ameliorating the UHI effects. The thermal contribution of roofs to the ambient environment is assessed in terms of TRP. The enumeration of TRP relies on the Stefan-Boltzmann law that involves the emissivity of the surface materials, geographical area of the study site and the surface temperature. The computational formula is:
(2) where, ε is emissivity, that takes values between 0.92 and 0.96 for soil, 0.94 for concrete and between 0.94 and 0.98 for asphalt; A is the radiating area (in m); and T denotes the surface temperature (in K). 3.4.3. Urban morphological parameter: sky view factor (SVF) SVF is defined as the ratio between the sky visible from a point in space to the hemisphere centred on the same point. It, therefore, expresses the radiation received by a planar surface as a proportion of that from the entire hemisphere in absence of any obstacle. The SVF serves as an index of urban morphology widely used for comparing thermal conditions in different building environments (Oke, 1980; Unger, 2006). The SVF is calculated according to the following formula.
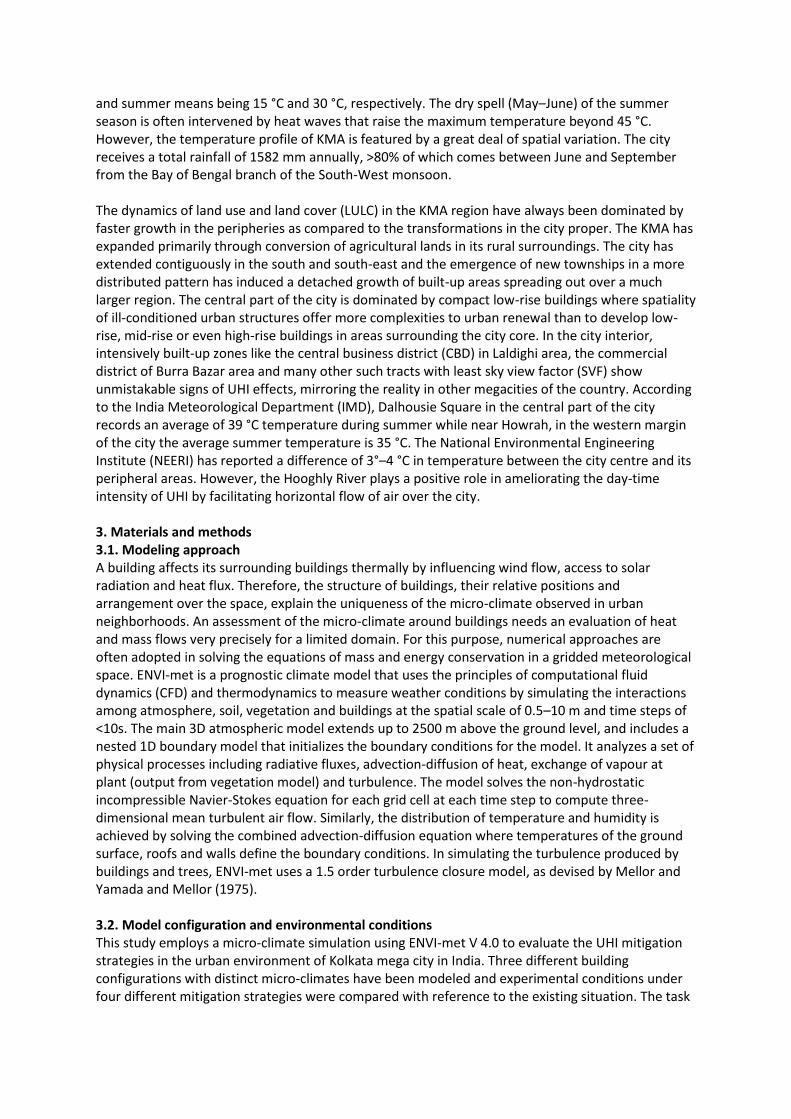
(3) where, αi are the azimuth angles (chosen at 1° interval) and βi are the angles between horizontal area and the obstacle height. The SVF is a dimensionless value ranging between 0 (no sky visible) and 1 (completely visible sky). SVF value is <1 for locations with obstructed visibility of sky due to buildings or trees. The SVF was computed by the RayMan model for the sites of Burra Bazar and Salt Lake in the study area and is represented in Fig. 3.
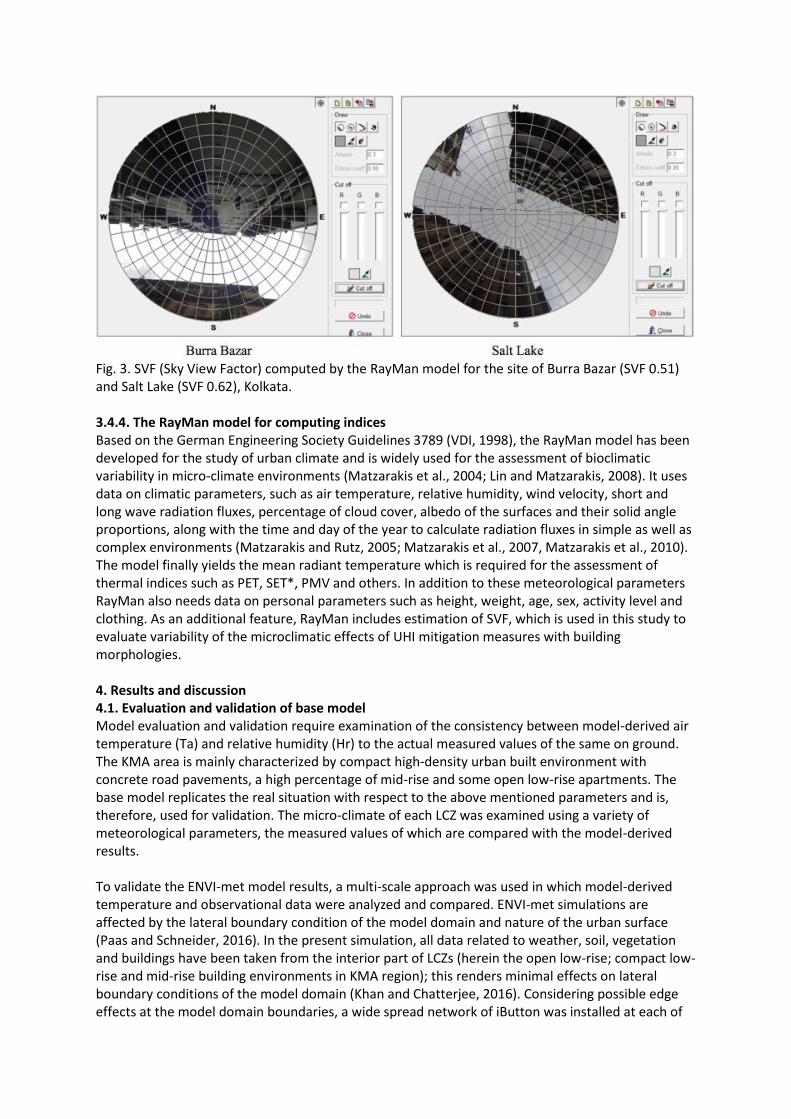
Fig. 3. SVF (Sky View Factor) computed by the RayMan model for the site of Burra Bazar (SVF 0.51) and Salt Lake (SVF 0.62), Kolkata. 3.4.4. The RayMan model for computing indices Based on the German Engineering Society Guidelines 3789 (VDI, 1998), the RayMan model has been developed for the study of urban climate and is widely used for the assessment of bioclimatic variability in micro-climate environments (Matzarakis et al., 2004; Lin and Matzarakis, 2008). It uses data on climatic parameters, such as air temperature, relative humidity, wind velocity, short and long wave radiation fluxes, percentage of cloud cover, albedo of the surfaces and their solid angle proportions, along with the time and day of the year to calculate radiation fluxes in simple as well as complex environments (Matzarakis and Rutz, 2005; Matzarakis et al., 2007, Matzarakis et al., 2010). The model finally yields the mean radiant temperature which is required for the assessment of thermal indices such as PET, SET*, PMV and others. In addition to these meteorological parameters RayMan also needs data on personal parameters such as height, weight, age, sex, activity level and clothing. As an additional feature, RayMan includes estimation of SVF, which is used in this study to evaluate variability of the microclimatic effects of UHI mitigation measures with building morphologies. 4. Results and discussion 4.1. Evaluation and validation of base model Model evaluation and validation require examination of the consistency between model-derived air temperature (Ta) and relative humidity (Hr) to the actual measured values of the same on ground. The KMA area is mainly characterized by compact high-density urban built environment with concrete road pavements, a high percentage of mid-rise and some open low-rise apartments. The base model replicates the real situation with respect to the above mentioned parameters and is, therefore, used for validation. The micro-climate of each LCZ was examined using a variety of meteorological parameters, the measured values of which are compared with the model-derived results. To validate the ENVI-met model results, a multi-scale approach was used in which model-derived temperature and observational data were analyzed and compared. ENVI-met simulations are affected by the lateral boundary condition of the model domain and nature of the urban surface (Paas and Schneider, 2016). In the present simulation, all data related to weather, soil, vegetation and buildings have been taken from the interior part of LCZs (herein the open low-rise; compact low-rise and mid-rise building environments in KMA region); this renders minimal effects on lateral boundary conditions of the model domain (Khan and Chatterjee, 2016). Considering possible edge effects at the model domain boundaries, a wide spread network of iButton was installed at each of
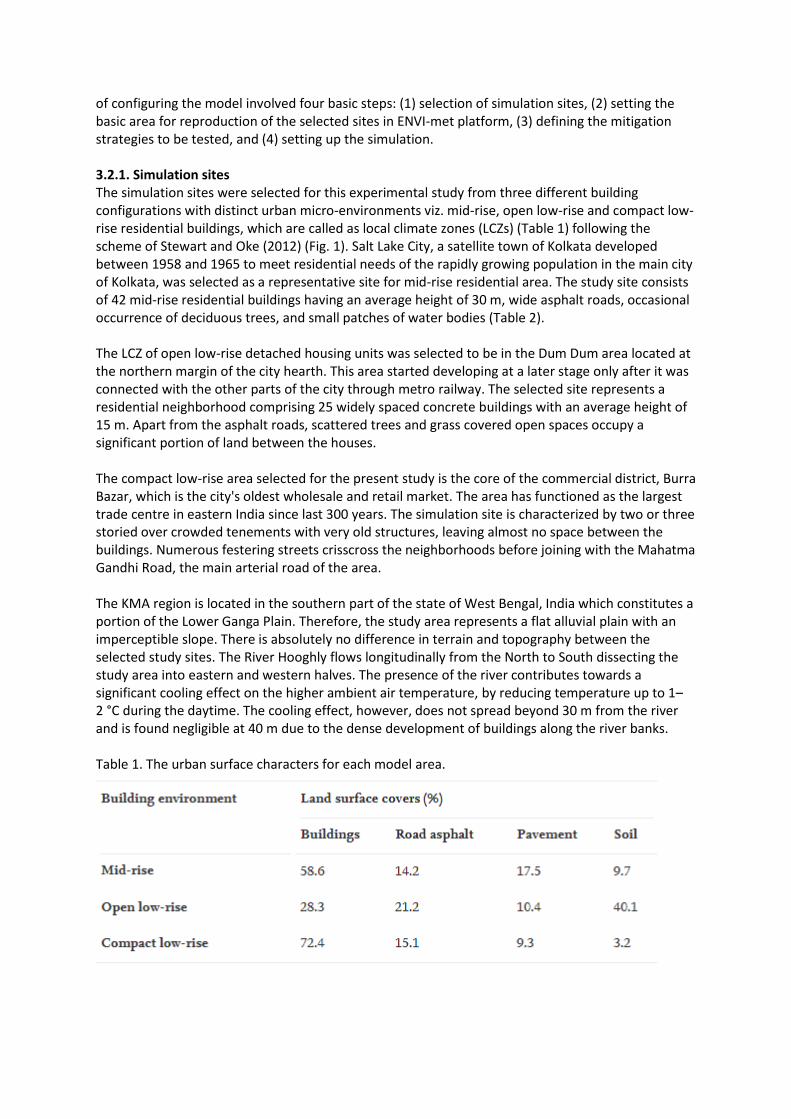
three building environments for the stipulated period. In this regard, a total of 109 site locations (40 installations for open low-rise, 33 installations for compact low-rise, and 36 installations for mid-rise building environment) were selected based on site characteristics and building architecture, on which iButtons were kept with a plastic bracket facing north at 1.8 m (human height) above the ground surface. In order to collect data, we traveled to each iButton location with a laptop computer equipped with 1-wire data software and a cord supplied by embedded data systems was used to connect the computer with the iButton. For global evaluation accuracy, the values of R2 (between observed and model-derived) for the 109 micro-meteorological (temperature and humidity) stations range from 0.70 to 0.80 at three different building environments. As an example, comparison for only one site (station code-C11) for the compact low-rise building environment is reported in Fig. 4 showing the trend of correlation between the model-derived results and the measured data taken from iButton installation at Burra Bazar (compact low-rise) in the KMA. For the purpose of comparison, temperature and humidity data from 3:00 am on 27th June to 3:00 am on 28th June 2017 are used. A high level of statistical agreement was found between the ENVI-met simulations and measured Ta and Hr, which are explicit from the high values of the coefficient of determination (R2) i.e. 0.789 for air temperature and 0.791 for humidity. The model simulation results were underestimated for Taby about 2–3 °C at day-time (12:00 pm–2:00 pm) and by about 1–3 °C at the calm night-time. The relative humidity was somewhat overestimated throughout the course of the simulations. This inconsistency could be attributed to an inappropriate input of model parameters given as weather data, soil data, vegetation data or building data. The simulation period was set for cloud-free atmosphere and for the formulation of long-wave energy flux divergence; it did not include the effect of horizontal long-wave fluxes and vegetation effects. In this case, only the indirect air and surface temperatures were taken into account for model formulation. The value of Ta was underestimated by a maximum of 3 °C during the evening (7:00 pm–9:00 pm), whereas the maximum that the value of Hr was overestimated by 15–20% relative to the actual measurement as recorded at 7:00 pm. These differences could have occurred due to the coarser temporal resolution used for updating the azimuthal position of the sun and the radiation flux from the atmosphere. Nevertheless, except during the evening time (7:00 pm–8:00 pm), the overall performance of the model was quite satisfactory and a much better agreement was found between the model-derived results and the measured field data.
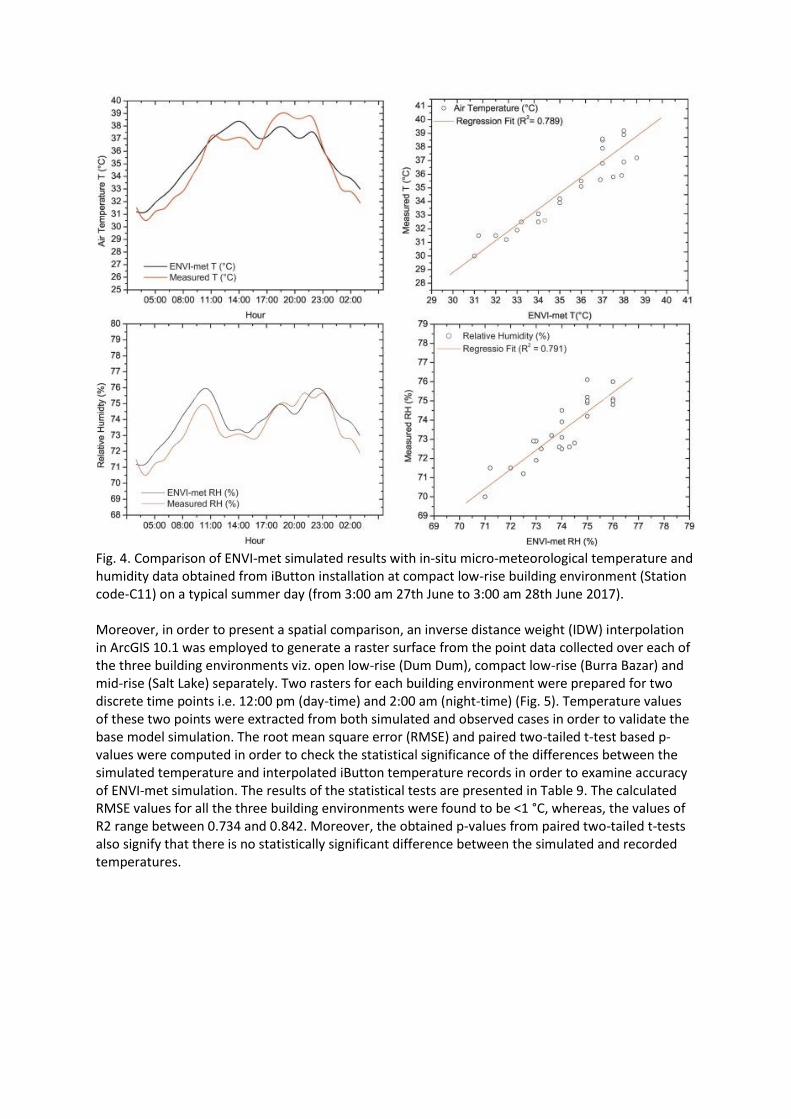
Fig. 4. Comparison of ENVI-met simulated results with in-situ micro-meteorological temperature and humidity data obtained from iButton installation at compact low-rise building environment (Station code-C11) on a typical summer day (from 3:00 am 27th June to 3:00 am 28th June 2017). Moreover, in order to present a spatial comparison, an inverse distance weight (IDW) interpolation in ArcGIS 10.1 was employed to generate a raster surface from the point data collected over each of the three building environments viz. open low-rise (Dum Dum), compact low-rise (Burra Bazar) and mid-rise (Salt Lake) separately. Two rasters for each building environment were prepared for two discrete time points i.e. 12:00 pm (day-time) and 2:00 am (night-time) (Fig. 5). Temperature values of these two points were extracted from both simulated and observed cases in order to validate the base model simulation. The root mean square error (RMSE) and paired two-tailed t-test based p-values were computed in order to check the statistical significance of the differences between the simulated temperature and interpolated iButton temperature records in order to examine accuracy of ENVI-met simulation. The results of the statistical tests are presented in Table 9. The calculated RMSE values for all the three building environments were found to be <1 °C, whereas, the values of R2 range between 0.734 and 0.842. Moreover, the obtained p-values from paired two-tailed t-tests also signify that there is no statistically significant difference between the simulated and recorded temperatures.
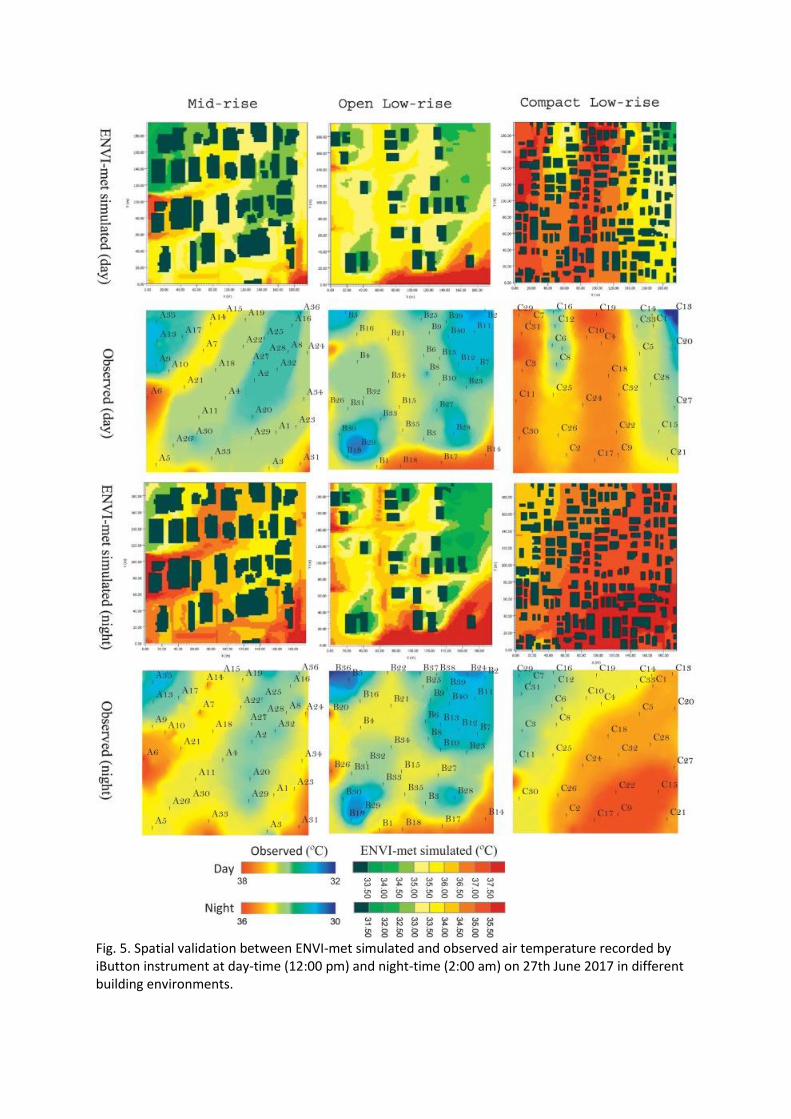
Fig. 5. Spatial validation between ENVI-met simulated and observed air temperature recorded by iButton instrument at day-time (12:00 pm) and night-time (2:00 am) on 27th June 2017 in different building environments.
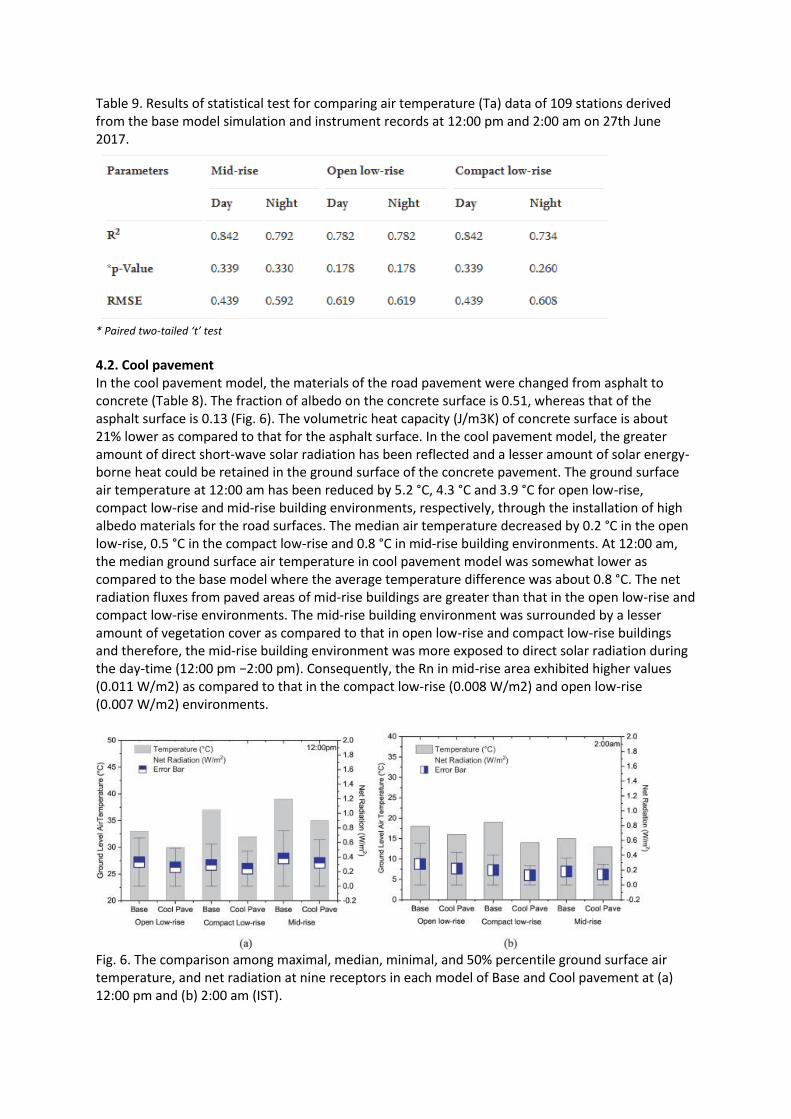
Table 9. Results of statistical test for comparing air temperature (Ta) data of 109 stations derived from the base model simulation and instrument records at 12:00 pm and 2:00 am on 27th June 2017.
* Paired two-tailed ‘t’ test
4.2. Cool pavement In the cool pavement model, the materials of the road pavement were changed from asphalt to concrete (Table 8). The fraction of albedo on the concrete surface is 0.51, whereas that of the asphalt surface is 0.13 (Fig. 6). The volumetric heat capacity (J/m3K) of concrete surface is about 21% lower as compared to that for the asphalt surface. In the cool pavement model, the greater amount of direct short-wave solar radiation has been reflected and a lesser amount of solar energy-borne heat could be retained in the ground surface of the concrete pavement. The ground surface air temperature at 12:00 am has been reduced by 5.2 °C, 4.3 °C and 3.9 °C for open low-rise, compact low-rise and mid-rise building environments, respectively, through the installation of high albedo materials for the road surfaces. The median air temperature decreased by 0.2 °C in the open low-rise, 0.5 °C in the compact low-rise and 0.8 °C in mid-rise building environments. At 12:00 am, the median ground surface air temperature in cool pavement model was somewhat lower as compared to the base model where the average temperature difference was about 0.8 °C. The net radiation fluxes from paved areas of mid-rise buildings are greater than that in the open low-rise and compact low-rise environments. The mid-rise building environment was surrounded by a lesser amount of vegetation cover as compared to that in open low-rise and compact low-rise buildings and therefore, the mid-rise building environment was more exposed to direct solar radiation during the day-time (12:00 pm −2:00 pm). Consequently, the Rn in mid-rise area exhibited higher values (0.011 W/m2) as compared to that in the compact low-rise (0.008 W/m2) and open low-rise (0.007 W/m2) environments.
Fig. 6. The comparison among maximal, median, minimal, and 50% percentile ground surface air temperature, and net radiation at nine receptors in each model of Base and Cool pavement at (a) 12:00 pm and (b) 2:00 am (IST).
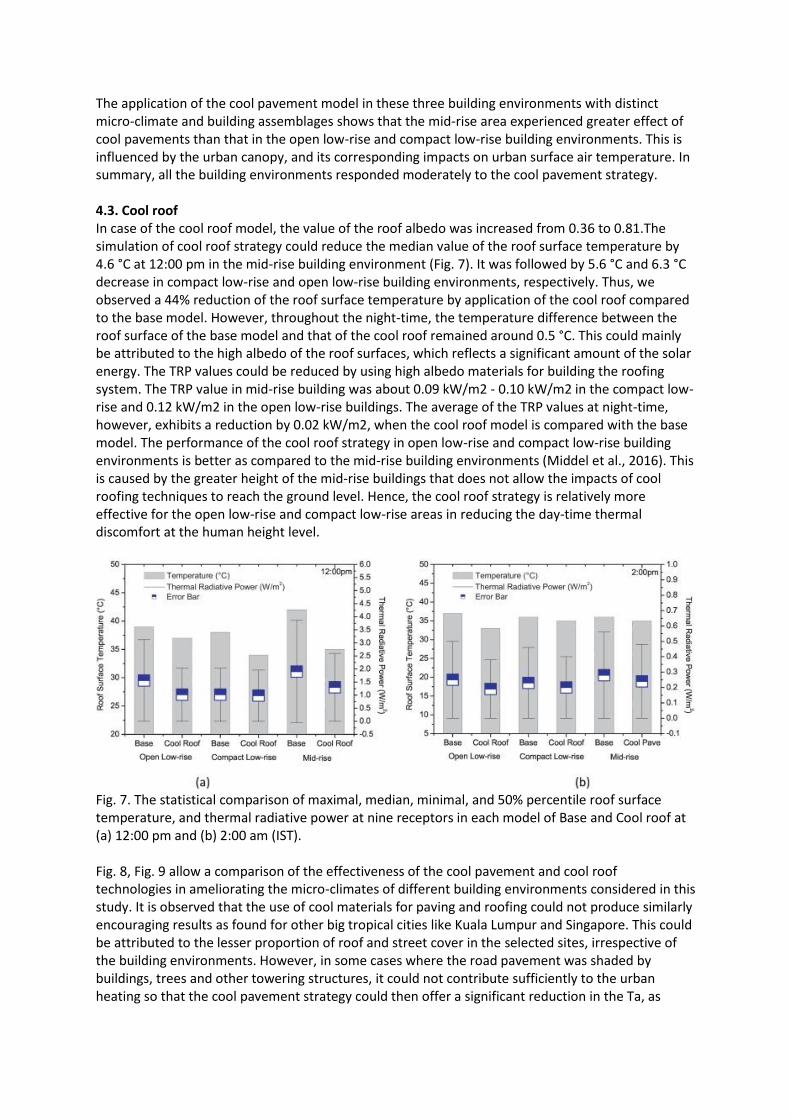
The application of the cool pavement model in these three building environments with distinct micro-climate and building assemblages shows that the mid-rise area experienced greater effect of cool pavements than that in the open low-rise and compact low-rise building environments. This is influenced by the urban canopy, and its corresponding impacts on urban surface air temperature. In summary, all the building environments responded moderately to the cool pavement strategy. 4.3. Cool roof In case of the cool roof model, the value of the roof albedo was increased from 0.36 to 0.81.The simulation of cool roof strategy could reduce the median value of the roof surface temperature by 4.6 °C at 12:00 pm in the mid-rise building environment (Fig. 7). It was followed by 5.6 °C and 6.3 °C decrease in compact low-rise and open low-rise building environments, respectively. Thus, we observed a 44% reduction of the roof surface temperature by application of the cool roof compared to the base model. However, throughout the night-time, the temperature difference between the roof surface of the base model and that of the cool roof remained around 0.5 °C. This could mainly be attributed to the high albedo of the roof surfaces, which reflects a significant amount of the solar energy. The TRP values could be reduced by using high albedo materials for building the roofing system. The TRP value in mid-rise building was about 0.09 kW/m2 - 0.10 kW/m2 in the compact low-rise and 0.12 kW/m2 in the open low-rise buildings. The average of the TRP values at night-time, however, exhibits a reduction by 0.02 kW/m2, when the cool roof model is compared with the base model. The performance of the cool roof strategy in open low-rise and compact low-rise building environments is better as compared to the mid-rise building environments (Middel et al., 2016). This is caused by the greater height of the mid-rise buildings that does not allow the impacts of cool roofing techniques to reach the ground level. Hence, the cool roof strategy is relatively more effective for the open low-rise and compact low-rise areas in reducing the day-time thermal discomfort at the human height level.
Fig. 7. The statistical comparison of maximal, median, minimal, and 50% percentile roof surface temperature, and thermal radiative power at nine receptors in each model of Base and Cool roof at (a) 12:00 pm and (b) 2:00 am (IST). Fig. 8, Fig. 9 allow a comparison of the effectiveness of the cool pavement and cool roof technologies in ameliorating the micro-climates of different building environments considered in this study. It is observed that the use of cool materials for paving and roofing could not produce similarly encouraging results as found for other big tropical cities like Kuala Lumpur and Singapore. This could be attributed to the lesser proportion of roof and street cover in the selected sites, irrespective of the building environments. However, in some cases where the road pavement was shaded by buildings, trees and other towering structures, it could not contribute sufficiently to the urban heating so that the cool pavement strategy could then offer a significant reduction in the Ta, as
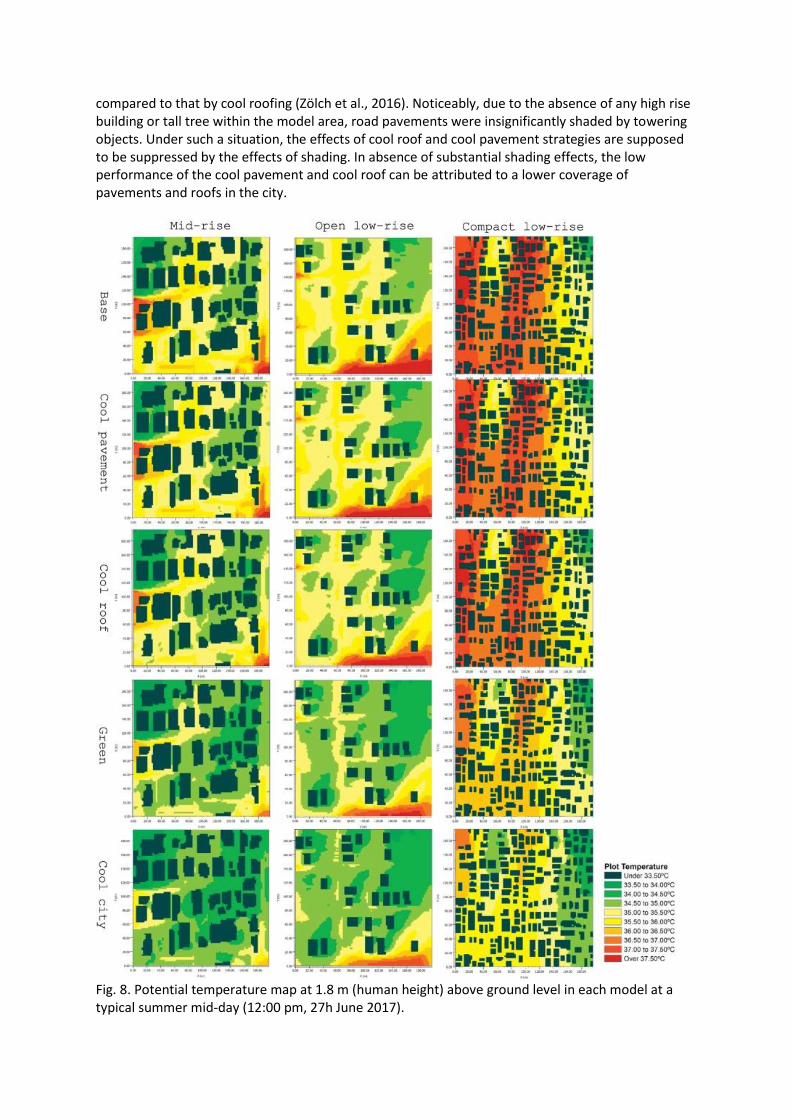
compared to that by cool roofing (Zölch et al., 2016). Noticeably, due to the absence of any high rise building or tall tree within the model area, road pavements were insignificantly shaded by towering objects. Under such a situation, the effects of cool roof and cool pavement strategies are supposed to be suppressed by the effects of shading. In absence of substantial shading effects, the low performance of the cool pavement and cool roof can be attributed to a lower coverage of pavements and roofs in the city.
Fig. 8. Potential temperature map at 1.8 m (human height) above ground level in each model at a typical summer mid-day (12:00 pm, 27h June 2017).
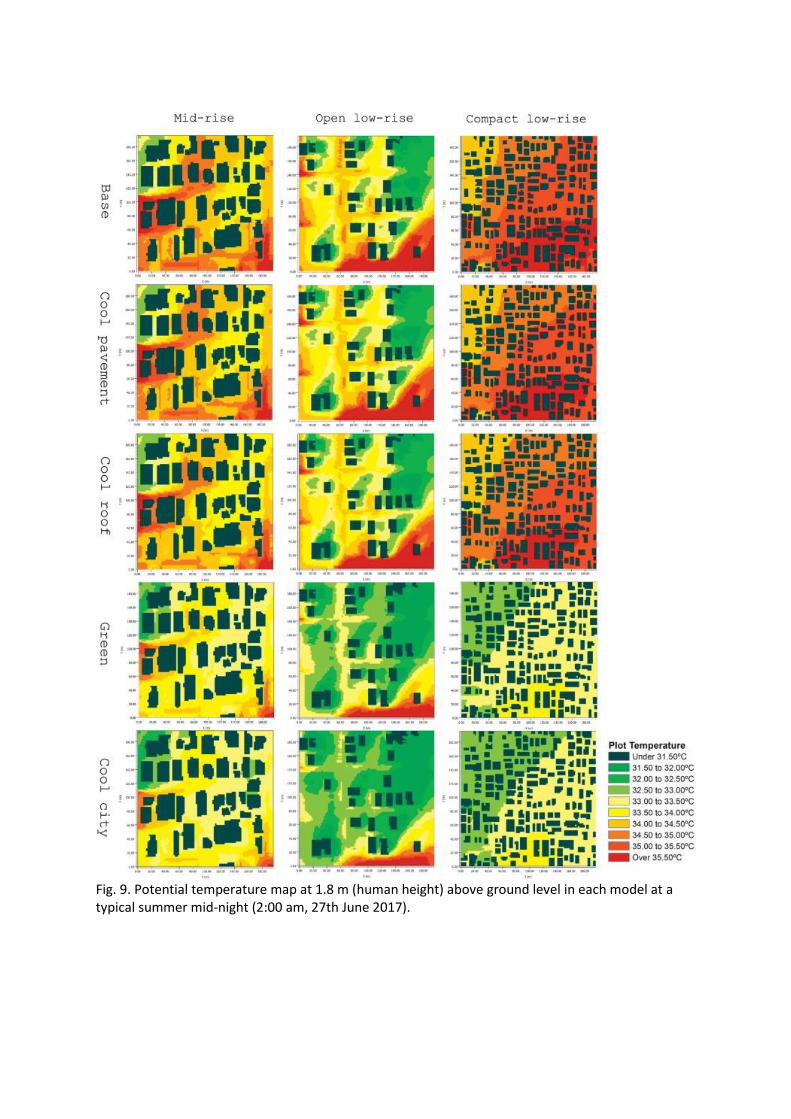
Fig. 9. Potential temperature map at 1.8 m (human height) above ground level in each model at a typical summer mid-night (2:00 am, 27th June 2017).
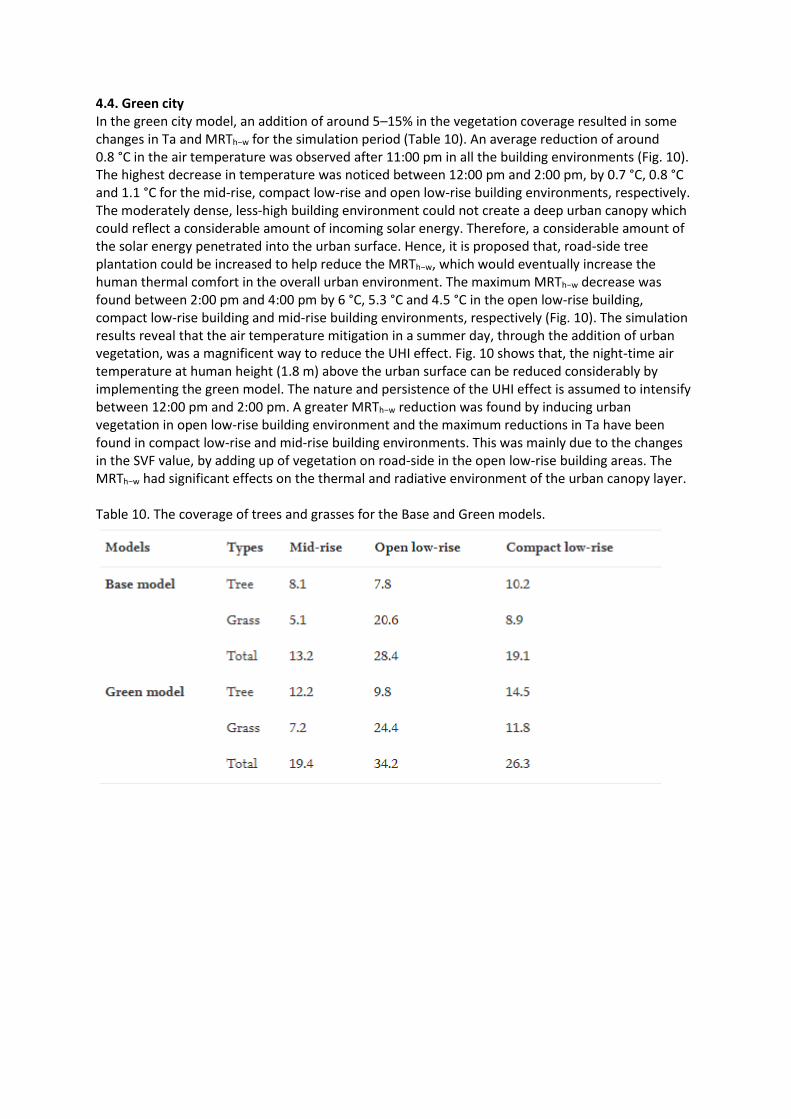
4.4. Green city In the green city model, an addition of around 5–15% in the vegetation coverage resulted in some changes in Ta and MRTh−w for the simulation period (Table 10). An average reduction of around 0.8 °C in the air temperature was observed after 11:00 pm in all the building environments (Fig. 10). The highest decrease in temperature was noticed between 12:00 pm and 2:00 pm, by 0.7 °C, 0.8 °C and 1.1 °C for the mid-rise, compact low-rise and open low-rise building environments, respectively. The moderately dense, less-high building environment could not create a deep urban canopy which could reflect a considerable amount of incoming solar energy. Therefore, a considerable amount of the solar energy penetrated into the urban surface. Hence, it is proposed that, road-side tree plantation could be increased to help reduce the MRTh−w, which would eventually increase the human thermal comfort in the overall urban environment. The maximum MRTh−w decrease was found between 2:00 pm and 4:00 pm by 6 °C, 5.3 °C and 4.5 °C in the open low-rise building, compact low-rise building and mid-rise building environments, respectively (Fig. 10). The simulation results reveal that the air temperature mitigation in a summer day, through the addition of urban vegetation, was a magnificent way to reduce the UHI effect. Fig. 10 shows that, the night-time air temperature at human height (1.8 m) above the urban surface can be reduced considerably by implementing the green model. The nature and persistence of the UHI effect is assumed to intensify between 12:00 pm and 2:00 pm. A greater MRTh−w reduction was found by inducing urban vegetation in open low-rise building environment and the maximum reductions in Ta have been found in compact low-rise and mid-rise building environments. This was mainly due to the changes in the SVF value, by adding up of vegetation on road-side in the open low-rise building areas. The MRTh−w had significant effects on the thermal and radiative environment of the urban canopy layer. Table 10. The coverage of trees and grasses for the Base and Green models.
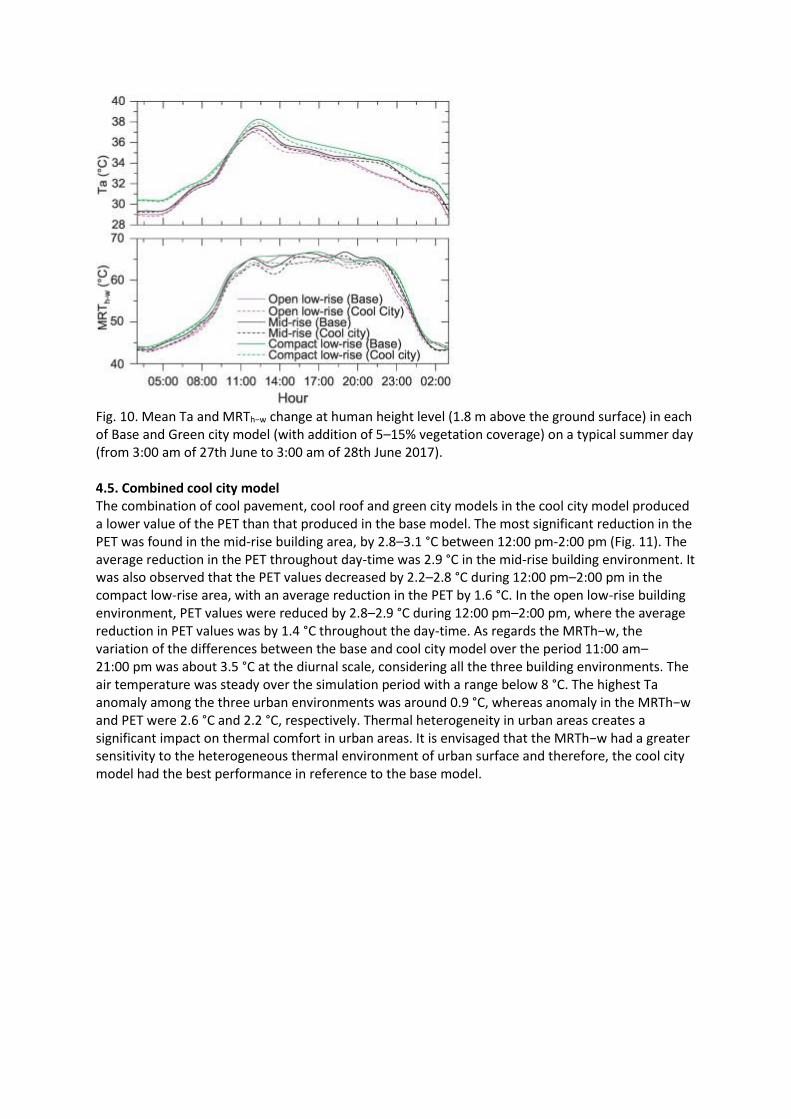
Fig. 10. Mean Ta and MRTh−w change at human height level (1.8 m above the ground surface) in each of Base and Green city model (with addition of 5–15% vegetation coverage) on a typical summer day (from 3:00 am of 27th June to 3:00 am of 28th June 2017). 4.5. Combined cool city model The combination of cool pavement, cool roof and green city models in the cool city model produced a lower value of the PET than that produced in the base model. The most significant reduction in the PET was found in the mid-rise building area, by 2.8–3.1 °C between 12:00 pm-2:00 pm (Fig. 11). The average reduction in the PET throughout day-time was 2.9 °C in the mid-rise building environment. It was also observed that the PET values decreased by 2.2–2.8 °C during 12:00 pm–2:00 pm in the compact low-rise area, with an average reduction in the PET by 1.6 °C. In the open low-rise building environment, PET values were reduced by 2.8–2.9 °C during 12:00 pm–2:00 pm, where the average reduction in PET values was by 1.4 °C throughout the day-time. As regards the MRTh−w, the variation of the differences between the base and cool city model over the period 11:00 am–21:00 pm was about 3.5 °C at the diurnal scale, considering all the three building environments. The air temperature was steady over the simulation period with a range below 8 °C. The highest Ta anomaly among the three urban environments was around 0.9 °C, whereas anomaly in the MRTh−w and PET were 2.6 °C and 2.2 °C, respectively. Thermal heterogeneity in urban areas creates a significant impact on thermal comfort in urban areas. It is envisaged that the MRTh−w had a greater sensitivity to the heterogeneous thermal environment of urban surface and therefore, the cool city model had the best performance in reference to the base model.
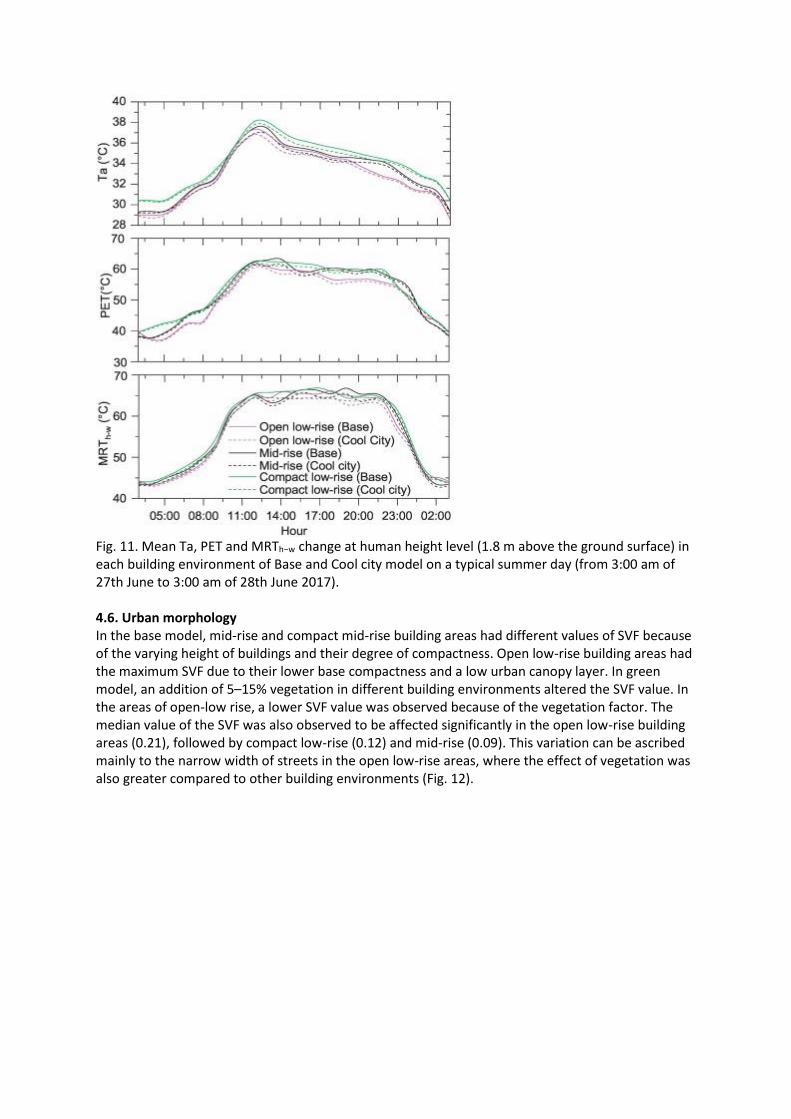
Fig. 11. Mean Ta, PET and MRTh−w change at human height level (1.8 m above the ground surface) in each building environment of Base and Cool city model on a typical summer day (from 3:00 am of 27th June to 3:00 am of 28th June 2017). 4.6. Urban morphology In the base model, mid-rise and compact mid-rise building areas had different values of SVF because of the varying height of buildings and their degree of compactness. Open low-rise building areas had the maximum SVF due to their lower base compactness and a low urban canopy layer. In green model, an addition of 5–15% vegetation in different building environments altered the SVF value. In the areas of open-low rise, a lower SVF value was observed because of the vegetation factor. The median value of the SVF was also observed to be affected significantly in the open low-rise building areas (0.21), followed by compact low-rise (0.12) and mid-rise (0.09). This variation can be ascribed mainly to the narrow width of streets in the open low-rise areas, where the effect of vegetation was also greater compared to other building environments (Fig. 12).
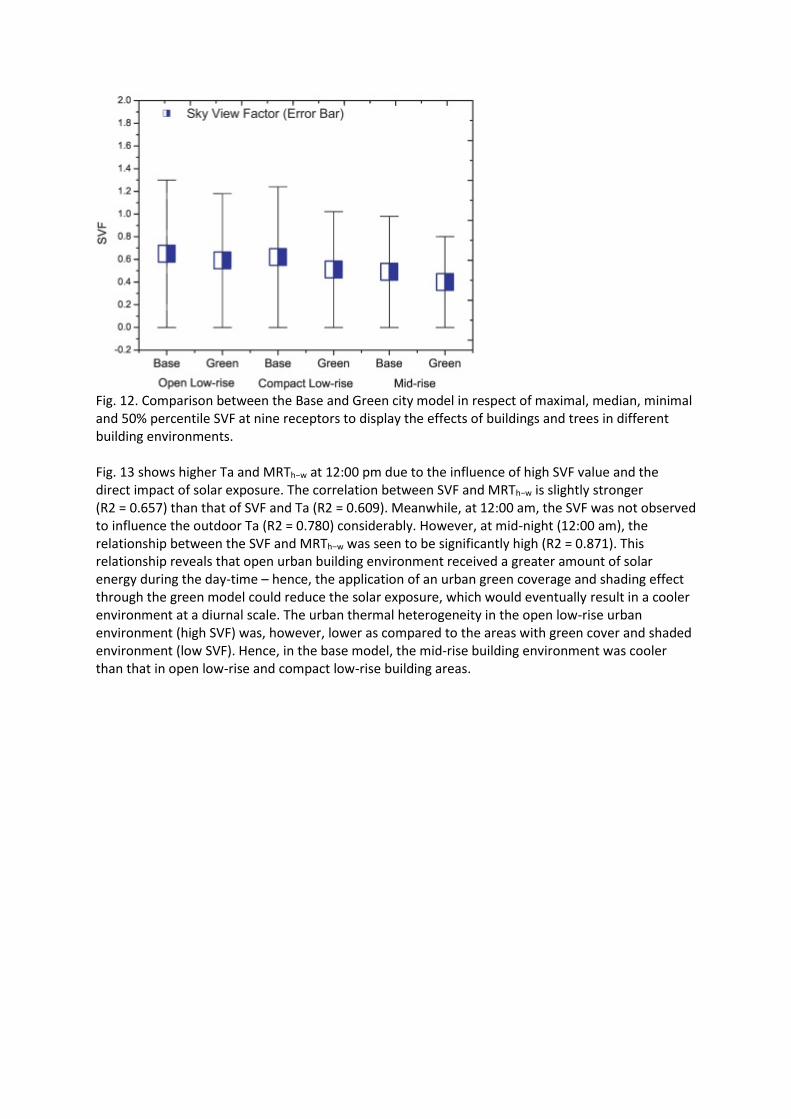
Fig. 12. Comparison between the Base and Green city model in respect of maximal, median, minimal and 50% percentile SVF at nine receptors to display the effects of buildings and trees in different building environments. Fig. 13 shows higher Ta and MRTh−w at 12:00 pm due to the influence of high SVF value and the direct impact of solar exposure. The correlation between SVF and MRTh−w is slightly stronger (R2 = 0.657) than that of SVF and Ta (R2 = 0.609). Meanwhile, at 12:00 am, the SVF was not observed to influence the outdoor Ta (R2 = 0.780) considerably. However, at mid-night (12:00 am), the relationship between the SVF and MRTh−w was seen to be significantly high (R2 = 0.871). This relationship reveals that open urban building environment received a greater amount of solar energy during the day-time – hence, the application of an urban green coverage and shading effect through the green model could reduce the solar exposure, which would eventually result in a cooler environment at a diurnal scale. The urban thermal heterogeneity in the open low-rise urban environment (high SVF) was, however, lower as compared to the areas with green cover and shaded environment (low SVF). Hence, in the base model, the mid-rise building environment was cooler than that in open low-rise and compact low-rise building areas.
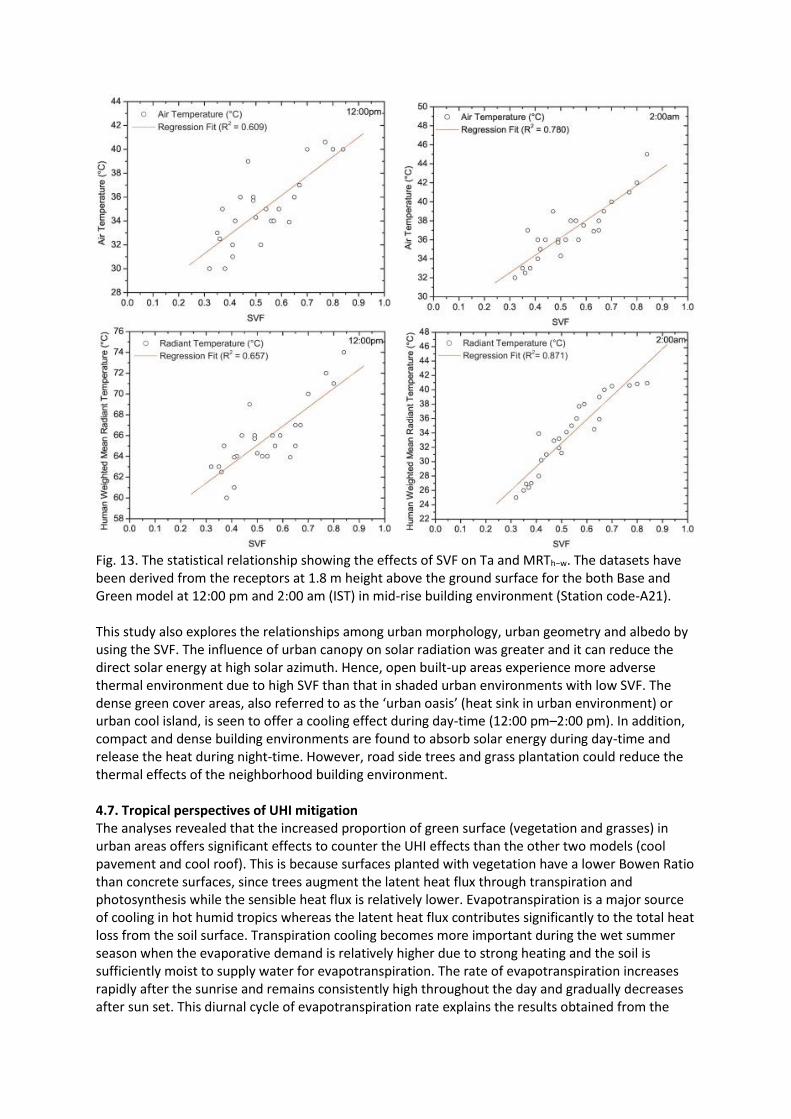
Fig. 13. The statistical relationship showing the effects of SVF on Ta and MRTh−w. The datasets have been derived from the receptors at 1.8 m height above the ground surface for the both Base and Green model at 12:00 pm and 2:00 am (IST) in mid-rise building environment (Station code-A21). This study also explores the relationships among urban morphology, urban geometry and albedo by using the SVF. The influence of urban canopy on solar radiation was greater and it can reduce the direct solar energy at high solar azimuth. Hence, open built-up areas experience more adverse thermal environment due to high SVF than that in shaded urban environments with low SVF. The dense green cover areas, also referred to as the ‘urban oasis’ (heat sink in urban environment) or urban cool island, is seen to offer a cooling effect during day-time (12:00 pm–2:00 pm). In addition, compact and dense building environments are found to absorb solar energy during day-time and release the heat during night-time. However, road side trees and grass plantation could reduce the thermal effects of the neighborhood building environment. 4.7. Tropical perspectives of UHI mitigation The analyses revealed that the increased proportion of green surface (vegetation and grasses) in urban areas offers significant effects to counter the UHI effects than the other two models (cool pavement and cool roof). This is because surfaces planted with vegetation have a lower Bowen Ratio than concrete surfaces, since trees augment the latent heat flux through transpiration and photosynthesis while the sensible heat flux is relatively lower. Evapotranspiration is a major source of cooling in hot humid tropics whereas the latent heat flux contributes significantly to the total heat loss from the soil surface. Transpiration cooling becomes more important during the wet summer season when the evaporative demand is relatively higher due to strong heating and the soil is sufficiently moist to supply water for evapotranspiration. The rate of evapotranspiration increases rapidly after the sunrise and remains consistently high throughout the day and gradually decreases after sun set. This diurnal cycle of evapotranspiration rate explains the results obtained from the
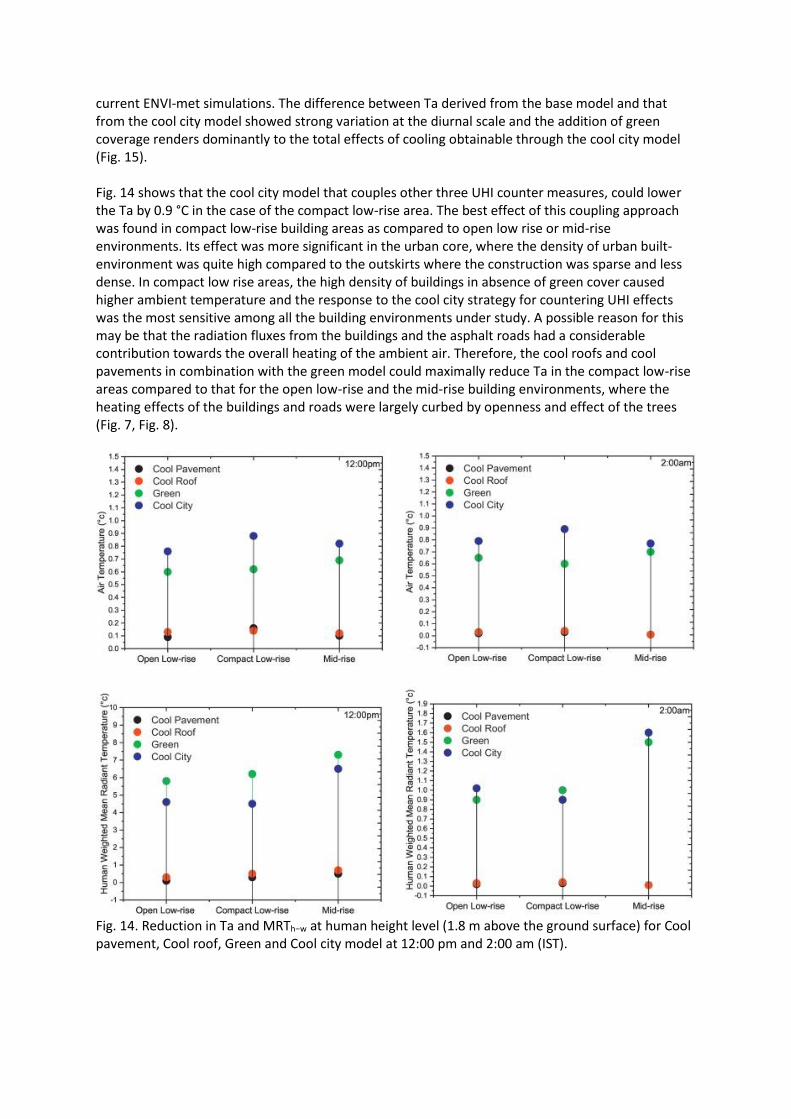
current ENVI-met simulations. The difference between Ta derived from the base model and that from the cool city model showed strong variation at the diurnal scale and the addition of green coverage renders dominantly to the total effects of cooling obtainable through the cool city model (Fig. 15). Fig. 14 shows that the cool city model that couples other three UHI counter measures, could lower the Ta by 0.9 °C in the case of the compact low-rise area. The best effect of this coupling approach was found in compact low-rise building areas as compared to open low rise or mid-rise environments. Its effect was more significant in the urban core, where the density of urban built-environment was quite high compared to the outskirts where the construction was sparse and less dense. In compact low rise areas, the high density of buildings in absence of green cover caused higher ambient temperature and the response to the cool city strategy for countering UHI effects was the most sensitive among all the building environments under study. A possible reason for this may be that the radiation fluxes from the buildings and the asphalt roads had a considerable contribution towards the overall heating of the ambient air. Therefore, the cool roofs and cool pavements in combination with the green model could maximally reduce Ta in the compact low-rise areas compared to that for the open low-rise and the mid-rise building environments, where the heating effects of the buildings and roads were largely curbed by openness and effect of the trees (Fig. 7, Fig. 8).
Fig. 14. Reduction in Ta and MRTh−w at human height level (1.8 m above the ground surface) for Cool pavement, Cool roof, Green and Cool city model at 12:00 pm and 2:00 am (IST).
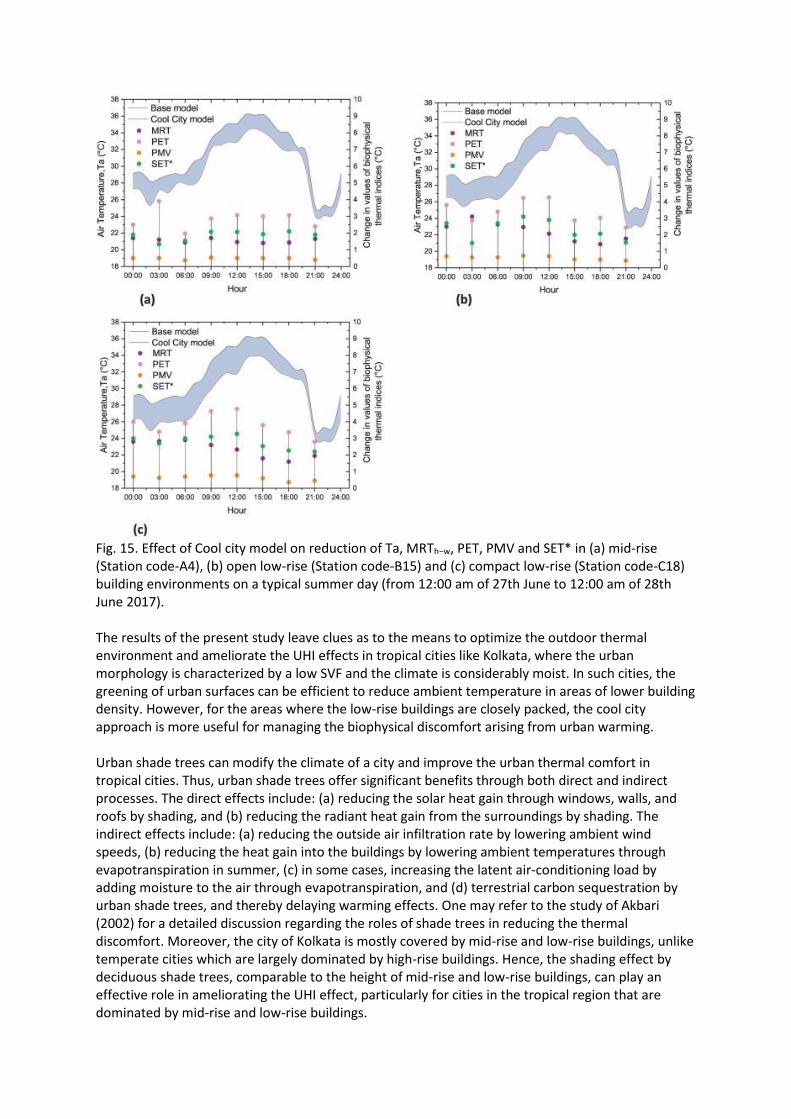
Fig. 15. Effect of Cool city model on reduction of Ta, MRTh−w, PET, PMV and SET* in (a) mid-rise (Station code-A4), (b) open low-rise (Station code-B15) and (c) compact low-rise (Station code-C18) building environments on a typical summer day (from 12:00 am of 27th June to 12:00 am of 28th June 2017). The results of the present study leave clues as to the means to optimize the outdoor thermal environment and ameliorate the UHI effects in tropical cities like Kolkata, where the urban morphology is characterized by a low SVF and the climate is considerably moist. In such cities, the greening of urban surfaces can be efficient to reduce ambient temperature in areas of lower building density. However, for the areas where the low-rise buildings are closely packed, the cool city approach is more useful for managing the biophysical discomfort arising from urban warming. Urban shade trees can modify the climate of a city and improve the urban thermal comfort in tropical cities. Thus, urban shade trees offer significant benefits through both direct and indirect processes. The direct effects include: (a) reducing the solar heat gain through windows, walls, and roofs by shading, and (b) reducing the radiant heat gain from the surroundings by shading. The indirect effects include: (a) reducing the outside air infiltration rate by lowering ambient wind speeds, (b) reducing the heat gain into the buildings by lowering ambient temperatures through evapotranspiration in summer, (c) in some cases, increasing the latent air-conditioning load by adding moisture to the air through evapotranspiration, and (d) terrestrial carbon sequestration by urban shade trees, and thereby delaying warming effects. One may refer to the study of Akbari (2002) for a detailed discussion regarding the roles of shade trees in reducing the thermal discomfort. Moreover, the city of Kolkata is mostly covered by mid-rise and low-rise buildings, unlike temperate cities which are largely dominated by high-rise buildings. Hence, the shading effect by deciduous shade trees, comparable to the height of mid-rise and low-rise buildings, can play an effective role in ameliorating the UHI effect, particularly for cities in the tropical region that are dominated by mid-rise and low-rise buildings.
5. Conclusions In this study, an effort has been made to evaluate the climatological effects of four emerging UHI mitigation strategies on the heterogeneous thermal fields in three building environments (or LCZs) of the KMA region, India. Successful implementation of cool pavement, cool roof and green cover techniques in temperate cities for moderating the UHI effects creates interest in examining the applicability of these methods in tropical contexts since tropical cities are expanding at greater rates and experiencing steady increase in summer temperature while they have been projected to be the worst sufferers of global climate change. ENVI-met V 4.0 offered the platform to replicate the building environments of selected study sites and to simulate the effects of replacing pavements and building roofs with high albedo materials, and increasing the green coverage by introduction of trees in available spaces. The cool pavements in compact low-rise areas had greater thermal effect than that in single open low-rise or mid-rise building environments. The effects of cool roof in the mid-rise building were lower vis-à-vis single open low-rise and compact low-rise built environments. But none of the cool pavement and cool roof strategies could offer any significant contribution to reduce air temperature and biophysical discomfort. The results of the simulations indicated a significant reduction of Ta during the day-time of summer seasons but such a reduction was not substantial during the night-time. It was also found that an increase in the road side tree cover by 5–15% could reduce the Ta and MRTh−w throughout the day and night-time by up to 0.9 °C. The greatest effectiveness of planting trees along the road side was found in the mid-rise building areas. The results also indicated that the urban canopy effects that were created by the compact amalgamation of low-rise to mid-rise buildings along the flow direction of wind, could help in reducing the day-timeTa. It can be concluded that for all the built environment types, the maximum reduction of the ambient temperature could be achieved through implementation of the green city model, whereas, the maximum improvement on the biophysical comfort was achieved through implementation of cool city model. The present results of the model simulations can be applied for mitigating the UHI phenomenon and, hence, could be helpful for policy making and architectural planning in the old as well as in the developing areas of Kolkata. The comparison between results of the present research with those obtained by Wang et al. (2016) from their recent studies in Toronto, Canada, allows examination of relative performance of the mitigation strategies in tropical cities under ‘Aw’ type of climate relative to the cities of the temperate region. The correspondence between the two studies in regard to the chosen strategies of UHI mitigation makes the comparison tenable. The adoption of the cool pavement model with materials having 0.2 more albedo than that was used for the base model could reduce the day-time ground level air temperature by at least 7 °C, considering all the building environments; whereas for Kolkata, the highest reduction was observed to be about 5.2 °C, even though the albedo of the paving materials used for this simulation was higher by 0.5 than the original. However, the night-time cooling effects of the strategy are similar for both the cities. The cool roof strategy was more effective for Toronto in lowering the roof surface temperature by a range of 9.6 °C (in high-rise building environment) to 11.3 °C (in detached building environment) quite alike to the range of only 4.6 °C (in mid-rise residential area) to 6.3 °C (in the compact low-rise) for Kolkata, wherein the albedo of the roofing materials used for the simulations were comparable. A comparison of the implementation of green model strategy in Kolkata and Toronto reveals that, with added vegetation of 5–15% and 10% for Kolkata and Toronto, respectively, reduced the air temperature by 0.5 °C in Kolkata and by 0.6–0.8 °C in Toronto. The maximum reductions in MRT for Toronto and Kolkata were observed to be 6.1–8.3 °C and 4.5–6.0 °C, respectively.
Similar such comparisons were drawn between Kolkata and other cities like Montreal and Padua (Italy) to confirm the difference between tropical and temperate cities in responding to mitigation measures. Evidently, tropical cities are less sensitive to the selected strategies of UHI mitigation than the temperate cities, irrespective of their building environments. This phenomenon can be attributed to the difference in magnitude of their urbaneness. Big compact cities of the temperate countries (mostly developed) contain a larger volume of urban components rather than the cities of the developing countries in the tropics, within equal areas of land. As a result, simulations carried out with replacement of high albedo materials for roofs and pavements for temperate cities adds much higher volume of cooling materials to the building environment, which significantly impact the thermal interactions. While simulating the ambient, pavement surface and roof surface temperatures, the overall albedo of the model domain is greatly increased, resulting in a significant lowering of the temperature. In this study, the anthropogenic heat release and transportation-related heat fluxes were not considered. Indoor building temperature, transmittance and albedo values are variable and diverse even within the urban building environments across the KMA. The ENVI-met model prevents characterization of the vertical walls of the buildings. In spite of these limitations, the model-based simulation of building environments is the most prudent approach towards planning for climate-resilient cities alongside experimenting with mitigation strategies. However, detailed understanding of the energy interactions at the micro-level and improvement of the performance of ENVI-met would not only yield precise and explanatory results but also will aid in successful coupling of the concept of micro-climate zone with the ENVI-met model. Acknowledgements We appreciate insightful suggestions received from Iain Douglas Stewart, Global Cities Institute, University of Toronto, Canada in improving the scientific quality of the article. We greatly appreciate the tremendous support received from the editorial board of the Science of the Total Environment (STOTEN) especially from José Virgílio Matos Figueira Cruz, Associate Editor, in course of the review process that helped to upgrade the manuscript to its present shape. The authors would also like to thank the anonymous reviewers for their constructive comments. This research was supported by the Faculty Research and Personal Development Fund, Presidency University. We thank Nilanjan Dasgupta, Priyank Pravin Patel and Sumit Chakrabarti for comments that greatly improved the manuscript. References Aflaki, A., Mirnezhad, M., Ghaffarianhoseini, A., Ghaffarianhoseini, A., Omrany, H., Wang, Z.H.,
Akbari, H., 2017. Urban heat island mitigation strategies: a state-of-the-art review on Kuala Lumpur, Singapore and Hong Kong. Cities 62, 131–145.
Akbari, H., 2002. Shade trees reduce building energy use and CO2 emissions from power plants. Environ. Pollut. 116, S119–S126.
Akbari, H., Kolokotsa, D., 2016. Three decades of urban heat islands and mitigation technologies research. Energ. Buildings 133, 834–842.
Akbari, H., Konopacki, S., Pomerantz, M., 1999. Cooling energy savings potential of reflective roofs for residential and commercial buildings in the United States. Energy 24 (5), 391–407.
Ali-Toudert, F., Mayer, H., 2007. Effects of asymmetry, galleries, overhanging facades and vegetation on thermal comfort in urban street canyons. Sol. Energy 81 (6), 742–754.
Amirtham, L.R., Devadas, M.D., Perumal, M., 2009. Mapping of micro-urban heat islands and land cover changes: a case in Chennai City, India. Int. J. Clim. Change Impacts Response 1, 71–84.
Anting, N., Din,M.F.M., Iwao, K., Ponraj, M., Jungan, K., Yong, L.Y., Siang, A.J.L.M., 2017. Experimental evaluation of thermal performance of cool pavement material using waste tiles in tropical climate. Energ. Buildings 142, 211–219.
Baker, L.A., Brazel, A.J., Selover, N., Martin, C., McIntyre, N., Steiner, F.R., ... Musacchio, L., 2002. Urbanization and warming of Phoenix (Arizona, USA): impacts, feedbacks and mitigation. Urban Ecosyst. 6 (3), 183–203.
Barradas, V.L., Tejeda-Martínez, A., Jauregui, E., 1999. Energy balance measurements in a suburban vegetated area in Mexico City. Atmos. Environ. 33 (24–25), 4109–4113.
Bhan, S.C., Saxena, R., 2014. Distribution of Temperature Over the National Capital Territory of Delhi. Mausam.
Bhati, S., Mohan, M., 2016. WRF model evaluation for the urban heat island assessment under varying land use/land cover and reference site conditions. Theor. Appl. Climatol. 126 (1–2), 385–400.
BMTPC, 1997. Vulnerability Atlas of India: Earthquake, Windstorm and Flood Hazard Maps and Damaged Risk to Housing. Ministry of Housing and Urban poverty Alleviation, Government of India, First Revision.
Borbora, J., Das, A.K., 2014. Summertime urban heat island study for Guwahati city, India. Sustain. Cities Soc. 11, 61–66.
Buyadi, S.N.A., Mohd, W.M.N.W., Misni, A., 2014. Quantifying green space cooling effects on the urban microclimate using remote sensing and GIS techniques. Proceedings of the XXV International Federation of Surveyors, pp. 1–16.
Cao, C., Lee, X., Liu, S., Schultz, N., Xiao,W., Zhang, M., Zhao, L., 2016. Urban heat islands in China enhanced by haze pollution. Nat. Commun. 7, 12509.
Cardoso, R.D.S., Dorigon, L.P., Teixeira, D.C.F., Amorim, M.C.D.C.T., 2017. Assessment of urban heat islands in small-and mid-sized cities in Brazil. Climate 5 (1), 14.
Chakraborty, T., Sarangi, C., Tripathi, S.N., 2017. Understanding diurnality and interseasonality of a sub-tropical urban heat island. Bound.-Layer Meteorol. 163 (2), 287–309.
Chang, C.R., Li, M.H., Chang, S.D., 2007. A preliminary study on the local cool-island intensity of Taipei city parks. Landsc. Urban Plan. 80 (4), 386–395.
Charabi, Y., Bakhit, A., 2011. Assessment of the canopy urban heat island of a coastal arid tropical city: the case of Muscat, Oman. Atmos. Res. 101 (1–2), 215–227.
Chatzidimitriou, A., Chrissomallidou, N., Yannas, S., 2005. Microclimatic modifications of an urban street in northern Greece. Proceedings of 22nd PLEA Conference, Beirut, Lebanon.
Chen, C.F., 2013. Performance evaluation and development strategies for green roofs in Taiwan: a review. Ecol. Eng. 52, 51–58.
Chen, F., Yang, X., Zhu,W., 2014.WRF simulations of urban heat island under hot-weather synoptic conditions: the case study of Hangzhou City, China. Atmos. Res. 138, 364–377.
Chow,W.T., Roth,M., 2006. Temporal dynamics of the urban heat island of Singapore. Int. J. Climatol. 26 (15), 2243–2260.
Costanzo, V., Evola, G., Gagliano, A., Marletta, L., Nocera, F., 2013. Study on the application of cool paintings for the passive cooling of existing buildings in Mediterranean climates. Adv. Mech. Eng. 5, 413675.
Cutter, S.L., Ash, K.D., Emrich, C.T., 2014. The geographies of community disaster resilience. Glob. Environ. Chang. 29, 65–77.
Da Silva, V.D.P.R., de Azevedo, P.V., Brito, R.S., da Cunha Campos, J.H.B., 2010. Evaluating the urban climate of a typically tropical city of northeastern Brazil. Environ. Monit. Assess. 161 (1–4), 45–59.
Dabaieh, M.,Wanas, O., Hegazy,M.A., Johansson, E., 2015. Reducing cooling demands in a hot dry climate: a simulation study for non-insulated passive cool roof thermal performance in residential buildings. Energ. Buildings 89, 142–152.
Doick, K.J., Peace, A., Hutchings, T.R., 2014. The role of one large greenspace in mitigating London's nocturnal urban heat island. Sci. Total Environ. 493, 662–671.
Duarte, F., Ferreira, A., 2016. Energy harvesting on road pavements: state of the art. Proceedings of the Institution of Civil Engineers. 169, pp. 79–90.
Duarte, D.H., Shinzato, P., dos Santos Gusson, C., Alves, C.A., 2015. The impact of vegetation on urban microclimate to counterbalance built density in a subtropical changing climate. Urban Climate 14, 224–239.
Elsayed, I.S., 2012. Type of gardens that reduce the intensity of an urban heat island. Eur. J. Soc. Sci. 35 (3), 343–356.
Emmanuel, R., 2005. Thermal comfort implications of urbanization in a warm-humid city: the Colombo Metropolitan Region (CMR), Sri Lanka. Build. Environ. 40 (12), 1591–1601.
Emmanuel, R., Fernando, H.J.S., 2007a. Urban heat islands in humid and arid climates: role of urban form and thermal properties in Colombo, Sri Lanka and Phoenix, USA. Clim. Res. 34 (3), 241–251.
Emmanuel, R., Fernando, H.J.S., 2007b. Urban heat islands in humid and arid climates: role of urban form and thermal properties in Colombo, Sri Lanka and Phoenix, USA. Clim. Res. 34 (3), 241–251.
Emmanuel, R., Steemers, K., 2018a. Connecting the Realms of Urban Form, Density and Microclimate.
Emmanuel, R., Steemers, K., 2018b. Connecting the Realms of Urban Form, Density and Microclimate.
Emmanuel, R., Rosenlund, H., Johansson, E., 2007. Urban shading—a design option for the tropics? A study in Colombo, Sri Lanka. Int. J. Climatol. 27 (14), 1995–2004.
Erell, E., David, P., Williamson, T., 2011. City weathers: meteorology and urban design. Climate Science and Urban Design – a historical and comparative study funded by the ESRC under grant RES 062 23 2134 1950–2010. Manchester Architecture Research Centre (MARC) Centre for the History of Science Technology and Medicine (CHSTM), The University of Manchester, pp. 23–24.
Estrada, F., Botzen, W.W., Tol, R.S., 2017. A global economic assessment of city policies to reduce climate change impacts. Nat. Clim. Chang. 7 (6), 403.
Fanger, P.O., 1972. Thermal Comfort: Analysis and Applications in Environmental Engineering. McGraw-Hill, New York.
Ferreira,M.J., de Oliveira, A.P., Soares, J., Codato, G., Bárbaro, E.W., Escobedo, J.F., 2012. Radiation balance at the surface in the city of São Paulo, Brazil: diurnal and seasonal variations. Theor. Appl. Climatol. 107 (1–2), 229–246.
Fujibe, F., 2011. Urban warming in Japanese cities and its relation to climate change monitoring. Int. J. Climatol. 31 (2), 162–173.
Gagge, A.P., Fobelets, A.P., Berglund, L., 1986. A standard predictive index of human response to the thermal environment. ASHRAE Trans.; (United States), 92(CONF- 8606125-).
Gago, E.J., Roldan, J., Pacheco-Torres, R., Ordóñez, J., 2013. The city and urban heat islands: a review of strategies to mitigate adverse effects. Renew. Sust. Energ. Rev. 25, 749–758.
Giridharan, R., Emmanuel, R., 2018. The impact of urban compactness, comfort strategies and energy consumption on tropical urban heat island intensity: a review. Sustainable Cities and Society.
Giridharan, R., Ganesan, S., Lau, S.S.Y., 2004. Daytime urban heat island effect in high-rise and high-density residential developments in Hong Kong. Energ. Buildings 36 (6), 525–534.
Grover, A., Singh, R.B., 2016. Monitoring spatial patterns of land surface temperature and urban heat island for sustainable megacity: a case study of Mumbai, India, using Landsat TM data. Environ. Urban. ASIA 7 (1), 38–54.
Gunawardena, K.R., Wells, M.J., Kershaw, T., 2017. Utilising green and bluespace to mitigate urban heat island intensity. Sci. Total Environ. 584, 1040–1055.
Guntor, N.A., Din,M.F., Ponraj,M., Iwao, K., 2014. Thermal performance of developed coating material as cool pavement material for tropical regions. J. Mater. Civ. Eng. 26, 755–760.
Gusson, C.S., Duarte, D.H., 2016. Effects of built density and urban morphology on urban microclimate-calibration of the model ENVI-met V4 for the subtropical Sao Paulo, Brazil. Proc. Eng. 169, 2–10.
Hathway, E.A., Sharples, S., 2012. The interaction of rivers and urban form in mitigating the Urban Heat Island effect: a UK case study. Build. Environ. 58, 14–22.
He, B.J., 2018. Potentials of meteorological characteristics and synoptic conditions to mitigate urban heat island effects. Urban Climate 24, 26–33.
Höppe, P., 1984. Die energiebilanz des menschen. vol. 49. UniversitatMunchen, MeteorologischesInstitut.
Höppe, P., 1999. The physiological equivalent temperature–a universal index for the biometeorological assessment of the thermal environment. Int. J. Biometeorol. 43 (2), 71–75.
Ishii, A., Katayama, T., Shiotsuki, Y., Yoshimizu, H., Abe, Y., 1988. Experimental study on comfort sensation of people in the outdoor environment. J. Archit. Planning Environ. Eng. 386, p28–p37.
Jeganathan, A., Andimuthu, R., Prasannavenkatesh, R., Kumar, D.S., 2016. Spatial variation of temperature and indicative of the urban heat island in Chennai Metropolitan Area, India. Theor. Appl. Climatol. 123 (1–2), 83–95.
Johansson, E., Emmanuel, R., 2006. The influence of urban design on outdoor thermal comfort in the hot, humid city of Colombo, Sri Lanka. Int. J. Biometeorol. 51 (2), 119–133.
Johnson, H., Kovats, R.S.,McGregor, G., Stedman, J., Gibbs,M.,Walton, H., 2005. The impact of the 2003 heat wave on daily mortality in England and Wales and the use of rapid weekly mortality estimates. Euro Surveill. 10 (7), 168–171.
Jonsson, P., 2005. Urban climate and air quality in tropical cities. (PhD Thesis). Earth Sciences Centre, Göteborg University, Göteborg.
Jusuf, S.K.,Wong, N.H., Hagen, E., Anggoro, R., Hong, Y., 2007. The influence of land use on the urban heat island in Singapore. Habitat Int. 31 (2), 232–242.
Kannamma, D., Sundaram, A.M., 2015. Significance of Microclimatic Study in Urban Canyons Towards Ambient Urban Space Design.
Ketterer, C., Matzarakis, A., 2016. Mapping the physiologically equivalent temperature in urban areas using artificial neural network. Landsc. Urban Plan. 150, 1–9.
Khan, A., Chatterjee, S., 2016. Numerical simulation of urban heat island intensity under urban–suburban surface and reference site in Kolkata, India. Model. Earth Syst. Environ. 2 (2), 71.
Kinouchi, T., Yoshitani, J., 2001, December. Simulation of the urban heat island in Tokyo with future possible increases of anthropogenic heat, vegetation cover and water surface. Proceedings of 2001 International Symposium on Environmental Hydraulics (6pp).
Kleerekoper, L., Van Esch, M., Salcedo, T.B., 2012. How to make a city climate-proof, addressing the urban heat island effect. Resour. Conserv. Recycl. 64, 30–38.
Kolokotroni, M., Ren, X., Davies, M., Mavrogianni, A., 2012. London's urban heat island: Impact on current and future energy consumption in office buildings. Energy Build. 47, 302–311.
Kotharkar, R., Bagade, A., 2018. Local climate zone classification for Indian cities: a case study of Nagpur. Urban Climate 24, 369–392.
Kumar, D., Shekhar, S., 2015. Statistical analysis of land surface temperature-vegetation indexes relationship through thermal remote sensing. Ecotoxicol. Environ. Saf. 121, 39–44. https://doi.org/10.1016/j.ecoenv.2015.07.004.
Kumar, S., Prasad, T., Sashidharan, N.V., Nair, S.K., 2001. Heat island intensities over Brihan Mumbai on a cold winter and hot summer night. Mausam 52 (4), 703–708.
Levinson, R., Akbari, H., Reilly, J.C., 2007. Cooler tile-roofed buildings with near-infrared reflective non-white coatings. Build. Environ. 42 (7), 2591–2605.
Li, X.X., Norford, L.K., 2016. Evaluation of cool roof and vegetations in mitigating urban heat island in a tropical city, Singapore. Urban Climate 16, 59–74.
Li, X., Zhou, W., Ouyang, Z., 2013. Relationship between land surface temperature and spatial pattern of greenspace: what are the effects of spatial resolution? Landsc. Urban Plan. 114, 1–8.
Lilly Rose, A., Devadas, M.D., 2008. Assessing the intensity of urban heat island effect in the hot humid city of Chennai. Int. J. Des. Manuf. Technol.
Lin, T.P., Matzarakis, A., 2008. Tourism climate and thermal comfort in Sun Moon Lake, Taiwan. Int. J. Biometeorol. 52 (4), 281–290.
Liu, J., Mooney, H., Hull, V., Davis, S.J., Gaskell, J., Hertel, T., ... Li, S., 2015. Systems integration for global sustainability. Science 347 (6225), 1258832.
Mallick, J., Rahman, A., 2012. Impact of population density on the surface temperature and micro-climate of Delhi. Curr. Sci. 1708–1713.
Mallick, Javed, K., Y., Bharath, B.D., 2008. Estimation of land surface temperature over Delhi using Landsat-7 ETM+. J. Ind. Geophys. Union 12, 131–140.
Maral, S.G.,Mukhopadhyay, T., 2002. Signal of urban heat island (UHI) effect: a case study of Mumbai metropolitan region. Mausam 66 (4), 729–740.
Marques, Filho, Karam, Edson, Miranda, Hugo G., Franca, André, Ricardo, Jose, 2009. Rio de Janeiro's Tropical Urban Climate. News Letter of the Internation Association of Urban Climate (IAUC). 32.
Marshall, J., 2005. Environmental Health: Megacity, Mega Mess. Matzarakis, A., Rutz, F., 2005. Application of RayMan for tourism and climate investigations. Ann.
Meteorol. 41 (2), 631–636. Matzarakis, A., Mayer, H., Iziomon, M.G., 1999. Applications of a universal thermal index:
physiological equivalent temperature. Int. J. Biometeorol. 43 (2), 76–84. Matzarakis, A., De Freitas, C.R., Scott, D., 2004. Advances in Tourism Climatology.
MeteorologischesInstitut der Universität. Matzarakis, A., Matuschek, O., Neumcke, R., Rutz, F., Zalloom, M., 2007. Climate change scenarios
and tourism-how to handle and operate with data. Dev. Tourism Climatol. 240–245. Matzarakis, A., Rutz, F., Mayer, H., 2010. Modeling radiation fluxes in simple and complex
environments: basics of the RayMan model. Int. J. Biometeorol. 54 (2), 131–139. Mayer, H., Höppe, P., 1987. Thermal comfort of man in different urban environments. Theor. Appl.
Climatol. 38 (1), 43–49. Middel, A., Selover, N., Hagen, B., Chhetri, N., 2016. Impact of shade on outdoor thermal comfort—a
seasonal field study in Tempe, Arizona. Int. J. Biometeorol. 60 (12), 1849–1861. Miller, R.W., Hauer, R.J.,Werner, L.P., 2015. Urban Forestry: Planning and Managing Urban
Greenspaces. Waveland press. Mirzaei, P.A., Haghighat, F., 2010. Approaches to study urban heat island–abilities and limitations.
Build. Environ. 45 (10), 2192–2201. Mohan, M., Kandya, A., Battiprolu, A., 2011. Urban heat island effect over national capital region of
India: a study using the temperature trends. J. Environ. Prot. 2 (04), 465. Mohan, M., Kikegawa, Y., Gurjar, B.R., Bhati, S., Kandya, A., Ogawa, K., 2012. Urban heat island
assessment for a tropical urban airshed in India. Atmos. Climate Sci. 2 (2), 127–138. Mohan, M., Kikegawa, Y., Gurjar, B.R., Bhati, S., Kolli, N.R., 2013. Assessment of urban heat island
effect for different land use–land cover from micrometeorological measurements and remote sensing data for megacity Delhi. Theor. Appl. Climatol. 112 (3–4), 647–658.
Nair, S., Hosalikar, K.S., 2013. Trends in surface temperature variability over Mumbai. Mausam 64 (2), 251–264.
Nasir, R.A., Ahmad, S.S., Zain-Ahmed, A., Ibrahim, N., 2015. Adapting human comfort in an urban area: the role of tree shades towards urban regeneration. Procedia Soc. Behav. Sci. 170, 369–380.
Nath, S.K., Adhikari, M.D., Devaraj, N., Maiti, S.K., 2015. Seismic vulnerability and risk assessment of Kolkata City, India. Nat. Hazards Earth Syst. Sci. 15 (6), 1103.
Ng, Y.X., 2015. A study of urban heat island using “Local Climate Zones”–the case of Singapore. Brit. J. Environ. Climate Chang. 5 (2), 116–133.
Ng, E., Chen, L., Wang, Y., Yuan, C., 2012. A study on the cooling effects of greening in a high-density city: an experience from Hong Kong. Build. Environ. 47, 256–271.
Nichol, J.E., 1996. High-resolution surface temperature patterns related to urban morphology in a tropical city: a satellite-based study. J. Appl. Meteorol. 35 (1), 135–146.
Noro,M., Lazzarin, R., 2015. Urban heat island in Padua, Italy: simulation analysis and mitigation strategies. Urban Climate 14, 187–196.
Nuruzzaman, M., 2015. Urban heat island: causes, effects and mitigation measures—a review. Int. J. Environ. Monit. Anal. 3 (2), 67–73.
Ojeh, V.N., Balogun, A.A., Okhimamhe, A.A., 2016. Urban-rural temperature differences in Lagos. Climate 4 (2), 29.
Oke, T.R., 1980. Climatic impacts of urbanization. Interactions of Energy and Climate. Springer, Dordrecht, pp. 339–361.
O'Malley, C., Piroozfar, P., Farr, E.R., Pomponi, F., 2015. Urban Heat Island (UHI) mitigating strategies: a case-based comparative analysis. Sustain. Cities Soc. 19, 222–235.
Ozkeresteci, I., Crewe, K., Brazel, A.J., Bruse, M., 2003. Use and evaluation of the ENVI-met model for environmental design and planning: an experiment on linear parks. Proceedings of the 21st International Cartographic Conference (ICC), Durban, South Africa, pp. 10–16.
Paas, B., Schneider, C., 2016. A comparison of model performance between ENVI-met and Austal2000 for particulate matter. Atmos. Environ. 145, 392–404.
Peng, C., Jin, X., Wong, K.C., Shi, M., Liò, P., 2012. Collective human mobility pattern from taxi trips in urban area. PLoS One 7 (4), e34487.
Perera, N.G.R., 2016. Climate-sensitive Urban Public Space: A Sustainable Approach to Urban Heat Island Mitigation in Colombo, Sri Lanka.
Peres, deFaria L., de Lucena, A.J., RotunnoFilho, O.C., de Almeida França, J.R., 2018. The urban heat island in Rio de Janeiro, Brazil, in the last 30 years using remote sensing data. Int. J. Appl. Earth Obs. Geoinf. 64, 104–116.
Perini, K., Magliocco, A., 2014. Effects of vegetation, urban density, building height, and atmospheric conditions on local temperatures and thermal comfort. Urban For. Urban Green. 13 (3), 495–506.
Priyadarsini, R., Hien, W.N., David, C.K.W., 2008. Microclimatic modeling of the urban thermal environment of Singapore to mitigate urban heat island. Sol. Energy 82 (8), 727–745.
Quan, J., Chen, Y., Zhan,W.,Wang, J., Voogt, J.,Wang, M., 2014. Multi-temporal trajectory of the urban heat island centroid in Beijing, China based on a Gaussian volume model. Remote Sens. Environ. 149, 33–46.
Rajagopalan, P., Lim, K.C., Jamei, E., 2014. Urban heat island and wind flow characteristics of a tropical city. Sol. Energy 107, 159–170.
Ramakreshnan, L., Aghamohammadi, N., Fong, C.S., Ghaffarianhoseini, A., Ghaffarianhoseini, A., Wong, L.P., ... Sulaiman, N.M., 2018. A critical review of urban heat island phenomenon in the context of greater Kuala Lumpur, Malaysia. Sustainable Cities and Society.
Rizwan, A.M., Dennis, L.Y., Chunho, L.I.U., 2008. A review on the generation, determination and mitigation of Urban Heat Island. J. Environ. Sci. 20 (1), 120–128.
Rosado, P.J., Faulkner, D., Sullivan, D.P., Levinson, R., 2014. Measured temperature reductions and energy savings from a cool tile roof on a central California home. Energ. Buildings 80, 57–71.
Rosenfeld, A.H., Akbari, H., Bretz, S., Fishman, B.L., Kurn, D.M., Sailor, D., Taha, H., 1995. Mitigation of urban heat islands: materials, utility programs, updates. Energ. Buildings 22 (3), 255–265.
Roth,M., 2007. Review of urban climate research in (sub) tropical regions. Int. J. Climatol. 27 (14), 1859–1873.
Roy, S.S., Singh, R.B., Kumar, M., 2011. An analysis of local spatial temperature patterns in the Delhi Metropolitan Area. Phys. Geogr. 32 (2), 114–138.
Rydin, Y., Bleahu, A., Davies,M., Dávila, J.D., Friel, S., De Grandis, G., ... Lai, K.M., 2012. Shaping cities for health: complexity and the planning of urban environments in the 21st century. Lancet 379 (9831), 2079–2108.
Sani, S., 1972. Some aspects of urban micro-climate in Kuala Lumpur West Malaysia. Akademika 1 (1).
Sani, S., 1986. Temperatures in Kualalumpur and the Merging Klang Valley Conurbation, Project Report Prepared for UNESCO Malaysia.
Santamouris, M., 2012. Advances in Building Energy Research. vol. 1. Earthscan. Santamouris, M., 2013. Energy in urban buildings citizenship. FórumPatrimônio:
AmbienteConstruído e PatrimônioSustentável 4 (1). Santamouris, M., 2014. Cooling the cities–a review of reflective and green roof mitigation
technologies to fight heat island and improve comfort in urban environments. Sol. Energy 103, 682–703.
Santamouris, M., Xirafi, F., Gaitani, N., Spanou, A., Saliari, M., Vassilakopoulou, K., 2012. Improving the microclimate in a dense urban area using experimental and theoretical techniques—the case of Marousi, Athens. Int. J. Vent. 11 (1), 1–16.
Santamouris, M., Ding, L., Fiorito, F., Oldfield, P., Osmond, P., Paolini, R., ... Synnefa, A., 2017. Passive and active cooling for the outdoor built environment—analysis and assessment of the cooling potential of mitigation technologies using performance data from 220 large scale projects. Sol. Energy 154, 14–33.
Santamouris, M., Haddad, S., Saliari, M., Vasilakopoulou, K., Synnefa, A., Paolini, R., ... Fiorito, F., 2018. On the energy impact of urban heat island in Sydney: climate and energy potential of mitigation technologies. Energ. Buildings 166, 154–164.
de Schiller, S., Evans, J.M., 1998. Sustainable urban development: design guidelines for warm humid cities. Urban Des. Int. 3 (4), 165–184.
Shahidan,M.F., Jones, P.J., Gwilliam, J., Salleh, E., 2012. An evaluation of outdoor and building environment cooling achieved through combination modification of trees with ground materials. Build. Environ. 58, 245–257.
Sham, S., 1973. Observations on the effect of a city's form and function on temperature patterns: a case of Kuala Lumpur. J. Trop. Geogr. 36, 60–65.
Sham, S., 1984a. The structure of the Kuala Lumpur urban heat island and its application in air quality management and planning. Urbanization and eco-development: with special reference to Kuala Lumpur. Institute of Advance Studies, Ed., University of Malaya.
Sham, S., 1984b. Urban development and changing patierns of night time temperatures in the Kuala lumpur-petaling Jaya area Malaysia. J. Teknol. 5 (1), 27–35.
Sham, S., 1986. Application of climatology to urban planning and building design in Malaysia. Sumber 2, 63–79.
Sham, S., 1987. Urbanization and the atmospheric environment in the low tropics: experiences from the Kelang valley region Malaysia.
Sham, S., 1988. Meterological Factors in Air Quality Monitoring, Assessment and Management with Special Reference to Urban Areas in the Low Tropics.
Sharma, R., Joshi, P.K., 2014. Identifying seasonal heat islands in urban settings of Delhi (India) using remotely sensed data—an anomaly based approach. Urban Climate 9, 19–34.
Shashua-Bar, L., Hoffman, M.E., 2004. Quantitative evaluation of passive cooling of the UCL microclimate in hot regions in summer, case study: urban streets and courtyards with trees. Build. Environ. 39 (9), 1087–1099.
Shastri, H., Barik, B., Ghosh, S., Venkataraman, C., Sadavarte, P., 2017. Flip flop of day-night and summer-winter surface urban heat island intensity in India. Sci. Rep. 7, 40178.
Shen, H., Huang, L., Zhang, L., Wu, P., Zeng, C., 2016. Long-term and fine-scale satellite monitoring of the urban heat island effect by the fusion of multi-temporal and multi-sensor remote sensed data: A 26-year case study of the city of Wuhan in China. Remote Sens. Environ. 172, 109–125.
Singh, R.B., Grover, A., Zhan, J., 2014. Inter-seasonal variations of surface temperature in the urbanized environment of Delhi using Landsat thermal data. Energy 7 (3), 1811–1828.
Sodoudi, S., Shahmohamadi, P., Vollack, K., Cubasch, U., Che-Ani, A.I., 2015. Mitigating the urban heat island effect in megacity Tehran. Adv. Meteorol. 2014. https://doi.org/10.1155/2014/547974.
Spangenberg, J., Shinzato, P., Johansson, E., Duarte, D., 2008. Simulation of the influence of vegetation on microclimate and thermal comfort in the city of São Paulo. Revista da SociedadeBrasileira de Arborização Urbana 3 (2), 1–19.
Taha, H., Akbari, H., Rosenfeld, A., Huang, J., 1988. Residential cooling loads and the urban heat island—the effects of albedo. Build. Environ. 23 (4), 271–283.
Taha, H., Akbari, H., Rosenfeld, A., 1989. Vegetation Canopy Micro-climate: A Field-project in Davis, California.
Takebayashi, H., Moriyama, M., 2012. Relationships between the properties of an urban street canyon and its radiant environment: introduction of appropriate urban heat island mitigation technologies. Sol. Energy 86 (9), 2255–2262.
Tran, H., Uchihama, D., Ochi, S., Yasuoka, Y., 2006. Assessment with satellite data of the urban heat island effects in Asian mega cities. Int. J. Appl. Earth Obs. Geoinf. 8 (1), 34–48.
Unger, J., 2006. Modeling of the annual mean maximum urban heat island using 2D and 3D surface parameters. Clim. Res. 30 (3), 215–226.
Van Hove, L.W.A., Jacobs, C.M.J., Heusinkveld, B.G., Elbers, J.A., Van Driel, B.L., Holtslag, A.A.M., 2015. Temporal and spatial variability of urban heat island and thermal comfort within the Rotterdam agglomeration. Build. Environ. 83, 91–103.
VDI, 1998. Methods for the Human-biometeorological Evaluation of Climate and Air Quality for Urban and Regional Planning. Part I: Climate. VDI Guideline 3787. Part 2. Beuth, Berlin.
Vector Magic, Inc, 2015. WeatherSpark website. weatherspark.com. Waewsak, J., O-Thong, S., Sungkharak, K., Arifwidodo, S., Chandrasiri, O., 2015. International
conference on alternative energy in developing countries and emerging economies urban heat island and household energy consumption in Bangkok, Thailand. Energy Procedia 79, 189–194. https://doi.org/10.1016/j.egypro.2015.11.461.
Wang, Y., Akbari, H., 2016. Analysis of urban heat island phenomenon and mitigation solutions evaluation for Montreal. Sustain. Cities Soc. 26, 438–446.
Wang, Y., Berardi, U., Akbari, H., 2015. The urban heat island effect in the city of Toronto. Proc. Eng. 118, 137–144.
Wang, Y., Berardi, U., Akbari, H., 2016. Comparing the effects of urban heat island mitigation strategies for Toronto, Canada. Energ. Buildings 114, 2–19.
Wong, N.H., Chen, Y., 2010. The role of urban greenery in high-density cities. Designing High-density Cities for Social and Environmental Sustainability, pp. 227–262.
Wu, H., Sun, Y., Shi,W., Chen, X., Fu, D., 2013. Examining the satellite-detected urban land use spatial patterns using multidimensional fractal dimension indices. Remote Sens. 5 (10), 5152–5172.
Yamada, T., Mellor, G., 1975. A simulation of the Wangara atmospheric boundary layer data. J. Atmos. Sci. 32 (12), 2309–2329.
Yang, X.C., Zhang, Y.L., Ding, M.J., Liu, L.S., Wang, Z.F., Gao, D.W., 2010. Observational evidence of the impact of vegetation cover on surface air temperature change in China. Chin. J. Geophys. 53 (2), 261–269.
Zinzi, M., Agnoli, S., 2012. Cool and green roofs. An energy and comfort comparison between passive cooling and mitigation urban heat island techniques for residential buildings in the Mediterranean region. Energ. Buildings 55, 66–76.
Zölch, T., Maderspacher, J., Wamsler, C., Pauleit, S., 2016. Using green infrastructure for urban climate-proofing: An evaluation of heat mitigation measures at the microscale. Urban For. Urban Green. 20, 305–316.