Embed Size (px)
Citation preview
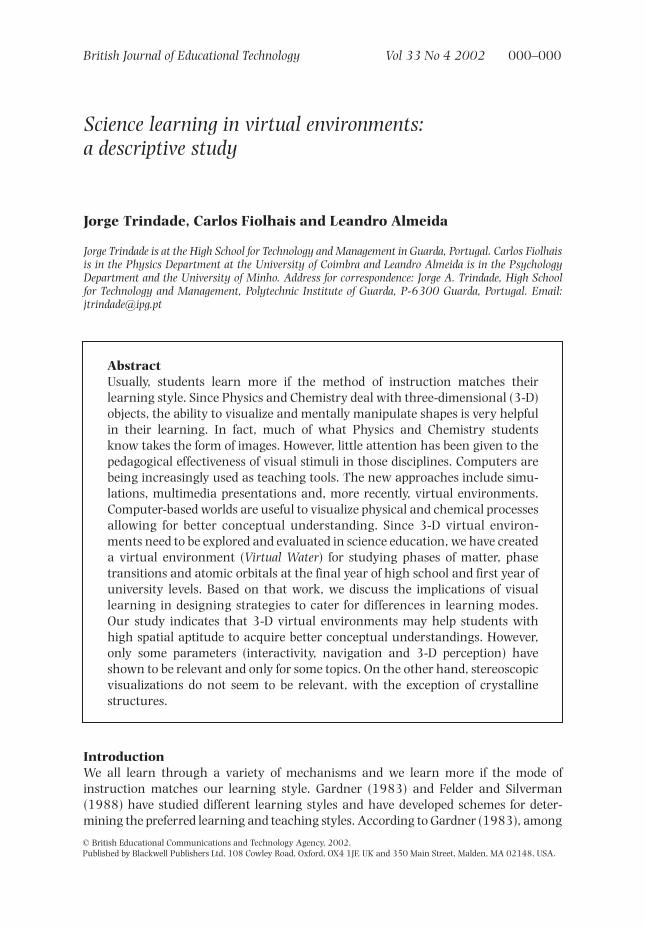
British Journal of Educational Technology Vol 33 No 4 2002 000–000
© British Educational Communications and Technology Agency, 2002.Published by Blackwell Publishers Ltd, 108 Cowley Road, Oxford, OX4 1JF, UK and 350 Main Street, Malden, MA 02148, USA.
Science learning in virtual environments: a descriptive study
Jorge Trindade, Carlos Fiolhais and Leandro Almeida
Jorge Trindade is at the High School for Technology and Management in Guarda, Portugal. Carlos Fiolhaisis in the Physics Department at the University of Coimbra and Leandro Almeida is in the PsychologyDepartment and the University of Minho. Address for correspondence: Jorge A. Trindade, High Schoolfor Technology and Management, Polytechnic Institute of Guarda, P-6300 Guarda, Portugal. Email:[email protected]
AbstractUsually, students learn more if the method of instruction matches theirlearning style. Since Physics and Chemistry deal with three-dimensional (3-D)objects, the ability to visualize and mentally manipulate shapes is very helpfulin their learning. In fact, much of what Physics and Chemistry students know takes the form of images. However, little attention has been given to thepedagogical effectiveness of visual stimuli in those disciplines. Computers arebeing increasingly used as teaching tools. The new approaches include simu-lations, multimedia presentations and, more recently, virtual environments.Computer-based worlds are useful to visualize physical and chemical processesallowing for better conceptual understanding. Since 3-D virtual environ-ments need to be explored and evaluated in science education, we have createda virtual environment (Virtual Water) for studying phases of matter, phasetransitions and atomic orbitals at the final year of high school and first year ofuniversity levels. Based on that work, we discuss the implications of visuallearning in designing strategies to cater for differences in learning modes.Our study indicates that 3-D virtual environments may help students withhigh spatial aptitude to acquire better conceptual understandings. However,only some parameters (interactivity, navigation and 3-D perception) haveshown to be relevant and only for some topics. On the other hand, stereoscopicvisualizations do not seem to be relevant, with the exception of crystallinestructures.
IntroductionWe all learn through a variety of mechanisms and we learn more if the mode ofinstruction matches our learning style. Gardner (1983) and Felder and Silverman(1988) have studied different learning styles and have developed schemes for deter-mining the preferred learning and teaching styles. According to Gardner (1983), among

the various natural learning styles the visual-spatial style is prominent (ie, understand-ing the world through the eyes and expressing ideas through graphical arts).
Felder and Silverman (1988) have developed a scheme which classifies the learningstyles preferred by engineering teachers and students into five groups (sensory/intuitive, visual/verbal, inductive/deductive, active/reflective, sequential/global). Theyconcluded that, in general, the teaching style of most teachers does not match thelearning style of most students: students learn better from processes which are sensory,visual, inductive, and active, while lectures tend to be verbal, deductive, and passive.
Visual-spatial aptitude is the ability to form and control a mental image. On the otherhand, visual-spatial understanding is the ability to juxtapose, manipulate, and orientan object mentally and to create mind structures from written and verbal directions. It has been subdivided into two parts: spatial orientation, concerning the awareness or appreciation of spatial relations and image constancy; and spatial visualization,concerning mental manipulations into other visual patterns (Lord, 1985).
The visual-spatial aptitude has been strongly linked to academic mastery of several sciences. For example, when perceptual-spatial tests have been given to 64 eminent scientists they all showed superior scores in visual-spatial accuracy (Roe,1952). Siemonhowski and MacKnight (1971) gave a series of spatial tests to a groupof college undergraduates (half of them were science majors, while the other half werein non-science, liberal arts courses). They found that not only was the science groupscore much higher on the visual-spatial measures but also that they performedsignificantly better than their liberal arts colleagues. Since then, spatial aptitude hasbeen identified in good students of Physics (Pallrand and Seeber, 1984) and Chemistry(Baker and Taylor, 1972).
Visual-spatial learners may dislike traditional schooling because of its overemphasis onlecturing, rote memorization, drill and practice exercises. Various authors have alertededucators to the need for student’s involvement other than simply listening to lecturesor reading books (Roe, 1952; Arnheim, 1969; Baker and Taylor, 1972; Pallrand andSeeber, 1984; Lord, 1985, 1987; Mathewson, 1999).
Motivated by these problems, we have built a virtual reality program to support thestudy of some concepts of Physics and Chemistry at the final year high school and firstyear university levels—Virtual Water. We have tested the software with students, look-ing for the relationship between visual-spatial ability and conceptual understanding.
Imagery in scienceImagery experiments focus on generating new scientific facts by means of mentalimages, propositional processes or both (Miller, 1996; Resnick, 1983). Many physicistsused imaginary worlds to get new insights: Maxwell’s demon, Einstein’s train andHeisenberg’s microscope have become part of the teaching of thermodynamics, specialrelativity and quantum mechanics, respectively. Others examples are Galileo’s thought
2 British Journal of Educational Technology Vol 33 No 4 2002
© British Educational Communications and Technology Agency, 2002.

experiment on falling bodies of different weights, Faraday’s visualization of lines of forcesurrounding charged objects and magnetic poles, Kekulé’s dream of the cyclic structureof benzene and Gamow’s tale about swimming in a pool of water and alcohol molecules(Gamow and Stannard, 1999). The refinement of mental experiments is supported by external graphical representations (Reiner, 1998). If visual-spatial cognition is sofundamental in science, it should also be important in teaching science. Unlike theformal manipulations so often used in teaching, thought experiments capitalize onthe human capacity for imagery and allow learners to see dynamic processes andtherefore to construct more perfect and more permanent understandings.
Imagery in Physics and Chemistry teaching may be justified for several reasons:
a) First of all, its sensorial directness.b) Imagery “experiments” are likely to play a major role in strategies to discard
previous misconceptions.c) Using images, a teacher is “talking science”, ie, emphasizes relevant concepts and
principles.
In Quantum Physics and Chemistry the need for visualizing invisible entities presentsa problem in high school and college teaching. Current models used to visualize themicroscopic world have proven to be too difficult for students. In fact, scientists usemolecular dynamics to explain chemical kinetics, gas laws, and reaction equilibrium,and orbitals to describe the electronic “clouds” in atoms and molecules, but studentshave problems relating the macroscopic observations to the underlying molecular andatomic behavior.
There are a variety of areas in which students’ misconceptions are produced in thestudy of quantal phenomena. Students have only seen 2-D representations and someof them are unable to visualize a scientific model in 3-D. Difficulties arise sometimesfrom an inability to mentally rotate the 3-D model, a lack of depth perception, or alimited sense of perspective. A student who is not a visual learner or has problemsthinking in 3-D is clearly at disadvantage.
Computer technologies for visualizationGraphics is one of the major outputs of modern computer technologies. Indeed, staticand dynamic representations provide a powerful language tool when words and gesturesare poor. Markham (1998) argued that graphical simulations, which accompany experi-mental activities, allow for mental imagery and associative knowledge. The followingeffective strategies have been found for teaching students with visual-spatial aptitudes(Silverman, 1998):
– Use computers to present visual materials.– Use visual aids, such as overhead projection.– Emphasize creativity, imagination, new insights and new approaches rather than
passive learning. – Group together gifted visual-spatial learners.
Science learning in virtual environments 3
© British Educational Communications and Technology Agency, 2002.

– Use manipulative materials to allow hands-on experience. – Have students discover their own methods of problem solving. – Avoid rote memorization, using inductive approaches. – Find out what students have already learned before teaching them new facts.– Emphasize mastery of higher-level concepts rather than perfection of simpler concepts.– Engage students in independent studies or group projects which involve problem-
finding and problem-solving. – Allow students to construct, draw and create visual representations.
Advances in computer technology have lead to various high-quality educational toolsincluding interactive programs, multimedia presentations and, more recently, virtualreality. Virtual reality is a computer interface characterized by a high degree of im-mersion, plausibility, and interaction, making the user believe that he is actually insidethe artificial environment. In a perfect virtual environment, a user would be completelyunable to determine whether he is experiencing a computer simulation or the “realthing”. Although the concept of virtual reality has been around for over thirty years,only recently have advances in hardware and software brought this technology towithin the reach of ordinary researchers and users. High-quality solutions are not yetaffordable.
Virtual environmentsVirtual environments, based on 3-D graphics, may facilitate the formation of con-ceptual models since they provide the capabilities to develop applications addressinghigher skills. There are three main factors contributing to that:
1. Immersion—virtual environments may represent, in visible and manipulable forms,concepts which are intangible in real world. These activities enable students toexperience phenomena themselves rather than through the eyes of a teacher or atextbook writer.
2. Interaction—educators have always asserted that a student must interact with an environment in order to learn. When interactive systems are used in learning,students move from passive observers to active thinkers. Interactions with objectsof a virtual environment provide an effective and meaningful response.
3. Engagement—the experience and the empowerment brought to students by virtualenvironments is unique. Learners can control the computer to do their bidding insophisticated ways, and may be intrigued by well designed virtual environments.
Static visuals have been studied by Gabel and Bunce (cited by Williamson and Abraham,1995), who reported increased understanding at all levels. However, they fail to depictthe dynamic nature of many chemical and physical processes (for example, phases ofmatter and phase transitions). Positive effects using animations were reported by Zeidlerand McIntosh (cited by Williamson and Abraham, 1995), when coupled with conceptualchange strategies, by Williamson and Abrahm (1995), who analysed the effects ofcomputer animations on the mental models of college Chemistry students, and byEscalada and Zollman (1977), who investigated the effects of interactive digital videoin a Physics classroom.
4 British Journal of Educational Technology Vol 33 No 4 2002
© British Educational Communications and Technology Agency, 2002.

Goal of present workMore research has been called for to explore the relationship between instructionalstrategies via visual learning platforms and cognitive processing (Crosby and Iding,1997). And several pilot studies have been performed to examine virtual reality’spotential in education:
– ScienceSpace (www.vetl.uh.edu/ScienceSpace/ScienceSpace.html) is a series of virtualenvironments to assess the potential impact of virtual reality in science education(Physics, Chemistry and Biology);
– VriChEL (www.engin.umich.edu/labs/vrichel/) is a virtual environment to exploreChemical Engineering;
– Chemistry World (www.hitl.washington.edu/projects/learning_center/) is a virtualenvironment in Chemistry. Some of them are under development or evaluation.
Although the results point to some usefulness of virtual environments, recognition ofwhat is essential and how it can be exploited is still missing.
Learning style, particularly the visual-spatial learning style, should be an interestingfactor for improving virtual environments. Virtual environments should clarify thedifference between spatial learners and the others.
Our study was designed to address two questions:
a) How students who do not have very strong backgrounds in Physics and Chemistry,but have high spatial aptitudes (reasoning and comprehension abilities), respond tovirtual environments with and without stereoscopic visualization?
b) Does the conceptual understanding acquired with virtual reality vary with spatialaptitude?
In our opinion, the criteria for selecting the sample (pattern of low grades and in-dications of high spatial aptitude) should help to better understand whether the use of3-D virtual environments, which stimulate space reasoning, benefits the students withpotential for higher achievement. A similar procedure was used by Williamson andAbraham to study the influence of computational animations in the understanding of atomic and molecular models in college students of Chemistry (Williamson andAbraham, 1995).
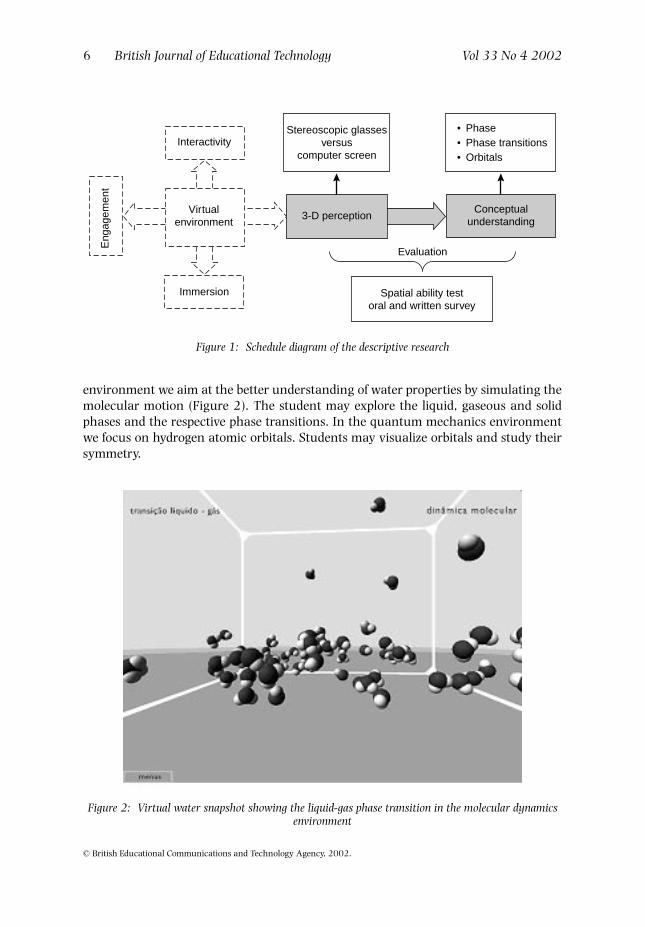
In this work we want to analyse whether 3-D virtual environments are more useful for students with higher spatial reasoning and comprehension abilities. Since virtualenvironments are characterized by immersion, interactivity and 3-D perception, we areparticularly interested in correlating 3-D perception with conceptual understanding.We did a comparative study between stereoscopic virtual environments (using appro-priate glasses) and virtual environments restricted to the screen. Figure 1 showsschematically the relations between our variables.
Our program, Virtual Water, deals with molecular dynamics and atomic orbitals, at the final year high school and first year university levels. In the molecular dynamics
Science learning in virtual environments 5
© British Educational Communications and Technology Agency, 2002.
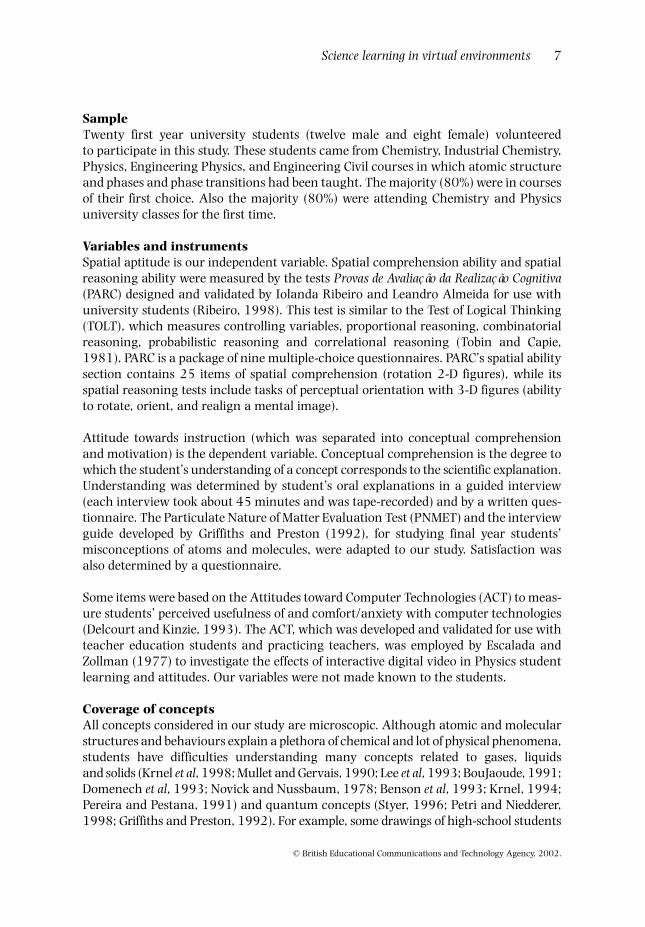
environment we aim at the better understanding of water properties by simulating themolecular motion (Figure 2). The student may explore the liquid, gaseous and solidphases and the respective phase transitions. In the quantum mechanics environmentwe focus on hydrogen atomic orbitals. Students may visualize orbitals and study theirsymmetry.
6 British Journal of Educational Technology Vol 33 No 4 2002
© British Educational Communications and Technology Agency, 2002.
Figure 1: Schedule diagram of the descriptive research
Interactivity
Virtualenvironment
Immersion
Eng
agem
ent
Stereoscopic glassesversus
computer screen
3-D perceptionConceptual
understanding
Evaluation
Spatial ability testoral and written survey
PhasePhase transitionsOrbitals
•••
Figure 2: Virtual water snapshot showing the liquid-gas phase transition in the molecular dynamicsenvironment
SampleTwenty first year university students (twelve male and eight female) volunteered to participate in this study. These students came from Chemistry, Industrial Chemistry,Physics, Engineering Physics, and Engineering Civil courses in which atomic structureand phases and phase transitions had been taught. The majority (80%) were in coursesof their first choice. Also the majority (80%) were attending Chemistry and Physicsuniversity classes for the first time.
Variables and instrumentsSpatial aptitude is our independent variable. Spatial comprehension ability and spatialreasoning ability were measured by the tests Provas de Avaliação da Realização Cognitiva(PARC) designed and validated by Iolanda Ribeiro and Leandro Almeida for use withuniversity students (Ribeiro, 1998). This test is similar to the Test of Logical Thinking(TOLT), which measures controlling variables, proportional reasoning, combinatorialreasoning, probabilistic reasoning and correlational reasoning (Tobin and Capie,1981). PARC is a package of nine multiple-choice questionnaires. PARC’s spatial abilitysection contains 25 items of spatial comprehension (rotation 2-D figures), while itsspatial reasoning tests include tasks of perceptual orientation with 3-D figures (abilityto rotate, orient, and realign a mental image).
Attitude towards instruction (which was separated into conceptual comprehensionand motivation) is the dependent variable. Conceptual comprehension is the degree towhich the student’s understanding of a concept corresponds to the scientific explanation.Understanding was determined by student’s oral explanations in a guided interview(each interview took about 45 minutes and was tape-recorded) and by a written ques-tionnaire. The Particulate Nature of Matter Evaluation Test (PNMET) and the interviewguide developed by Griffiths and Preston (1992), for studying final year students’misconceptions of atoms and molecules, were adapted to our study. Satisfaction wasalso determined by a questionnaire.
Some items were based on the Attitudes toward Computer Technologies (ACT) to meas-ure students’ perceived usefulness of and comfort/anxiety with computer technologies(Delcourt and Kinzie, 1993). The ACT, which was developed and validated for use withteacher education students and practicing teachers, was employed by Escalada andZollman (1977) to investigate the effects of interactive digital video in Physics studentlearning and attitudes. Our variables were not made known to the students.
Coverage of conceptsAll concepts considered in our study are microscopic. Although atomic and molecularstructures and behaviours explain a plethora of chemical and lot of physical phenomena,students have difficulties understanding many concepts related to gases, liquids and solids (Krnel et al, 1998; Mullet and Gervais, 1990; Lee et al, 1993; BouJaoude, 1991;Domenech et al, 1993; Novick and Nussbaum, 1978; Benson et al, 1993; Krnel, 1994;Pereira and Pestana, 1991) and quantum concepts (Styer, 1996; Petri and Niedderer,1998; Griffiths and Preston, 1992). For example, some drawings of high-school students
Science learning in virtual environments 7
© British Educational Communications and Technology Agency, 2002.

show different forms of particles for different states of matter: gas molecules are round,molecules of liquids have irregular forms, molecules of solids are shown as cubes(Haidar and Abraham, 1991, cited by Krnel et al, 1998). Other studies have shownmisconceptions of high school students related to the shape, size, weight, and animismof atoms (Griffiths and Preston, 1992).
ProceduresTraditional learning requires students to master symbolic systems before they mayunderstand content. Our expectation was that by allowing students decide about howtheir “world” was to appear, and then having them visit their virtual environment,would help students who do not do very well with a symbol-oriented pedagogy.
First we evaluated students’ spatial ability: they were given the PARC test for spatialability. The subsequent interview included a translation of the problem into the micro-world and a raising of hypotheses to be tested. Before entering the simulation, they hadto respond to several questions and were given the opportunity to modify their responsesafter the virtual exploration. The Statistical Package for the Social Sciences (SPSS version10 for Windows) was used for data analysis.
Results and discussionThe grade point averages of our Physics and Chemistry students lie between values of 11 and 16 (out of 20), with an average of 13.5, a median of 13.0 and standarddeviation of 1.5. Concerning software, our sample students have a good knowledge ofcommon computer applications (spreadsheets, word processor, browsers, etc) as well as with pedagogical software, eg, Interactive Physics, from Knowledge Revolution, andCreative Physics, from Stewart Software. None of the students had used virtual realitybefore the study. Regarding their spatial aptitude, spatial comprehension is more homo-geneous than spatial reasoning, with 3⁄ 4 of the data over 19 (first quartile), and an uppermedian (20). Spatial reasoning is less homogeneous, with 3⁄ 4 of the data lower than 20,and a median of 16 (Figure 3).
With the Wilcoxon test we intend to detect differences between conceptual comprehensionwithout the software and using the two visualization processes. For this purpose, theresults from conceptual comprehension about phases, phase transitions and orbitalswere analysed.
Figure 4 shows histograms concerning water phases. For both visualization methodsthe distribution curves deviate slightly to the right, with equal negative values (averagesof –1.2 and standard deviation of 0.81), which denotes better results with equipmentand software. In fact, the results of the Wilcoxon test denote that the differencesbetween conceptual comprehension with screen and stereoscopic views are statisticallysignificant (p , 0.05).
Concerning phase transitions, the histograms (Figure 5) also present negative values,denoting better results with the software, the stereoscopic view showing advantage
8 British Journal of Educational Technology Vol 33 No 4 2002
© British Educational Communications and Technology Agency, 2002.

(high absolute average). In effect, the results of the Wilcoxon test indicate that thesedifferences are statistically significant (p , 0.05).
For conceptual comprehension orbitals the results are different. Although the dis-tribution curves (Figure 6) for screen and stereoscopic view indicate negatives averagevalues (–0.5 and –1.0 respectively), the Wilcoxon tests denote that these differences arenot statistically significant.
Science learning in virtual environments 9
© British Educational Communications and Technology Agency, 2002.
Figure 3: Box plots for spatial aptitude
26
24
22
20
18
16
14
12
Spa
tial a
ptitu
de
N = 20Spat. comprehension
20Spat. reasoning
± standard deviation
± standard error
Median
Figure 4: Water phases—histograms showing the differences between: a) results before software useand results with screen visualization; b) and results before software use and results with visualization
through stereoscopic glasses
12
10
8
6
4
2
0
Num
ber
of s
tude
nts
12
10
8
6
4
2
0
Num
ber
of s
tude
nts
–3.0 –2.0 –1.0 0.0
Before software use—visualization with screen
Before software use—visualization with glasses
Std. Dev = 0.81Mean = –1.2N = 20.00
Std. Dev = 0.81Mean = –1.2N = 20.00
–3.0 –2.0 –1.0 0.0

These results are consistent with Spearman correlations between spatial aptitude(spatial comprehension and spatial reasoning) and conceptual comprehension, for the two visualization forms. Table 1 show the results (values in brackets indicate thesignificance level).
Correlations exist between spatial aptitude and conceptual comprehension of phasesand phase transitions, but not with orbitals, for both forms of visualization. The statisticalsignificance level is 5%, except for spatial ability and phase transitions correlations forboth forms of visualization, which is higher (1%).
10 British Journal of Educational Technology Vol 33 No 4 2002
© British Educational Communications and Technology Agency, 2002.
Figure 5: Water phase transitions—histograms showing the differences between: a) results beforesoftware use and results with screen visualization; b) and results before software use and results with
visualization through stereoscopic glasses
12
10
8
6
4
2
0
12
10
8
6
4
2
0
Num
ber
of s
tude
nts
Num
ber
of s
tude
nts
–3.0 –2.0 –1.0 0.0 1.0 –3.0 –2.0 –1.0 0.0 1.0
Before software use—visualization with screen
Before software use—visualization with glasses
Std. Dev = 1.03Mean = –1.0N = 20.00
Std. Dev = 1.07Mean = –1.1N = 20.00
Figure 6: Orbitals—histograms showing the differences between: a) results before software use andresults with screen visualization; b) and results before software use and results with visualization
through stereoscopic glasses
12
10
8
6
4
2
0
Num
ber
of s
tude
nts
Num
ber
of s
tude
nts
–3.0 –2.0 –1.0 0.0 1.0
Before software use—visualization with screen
Before software use—visualization with glasses
Std. Dev = 1.23Mean = –0.5N = 20.00
Std. Dev = 1.36Mean = –1.0N = 20.00
12
10
8
6
4
2
0–3.0–4.0 –2.0 –1.0 0.0 1.0
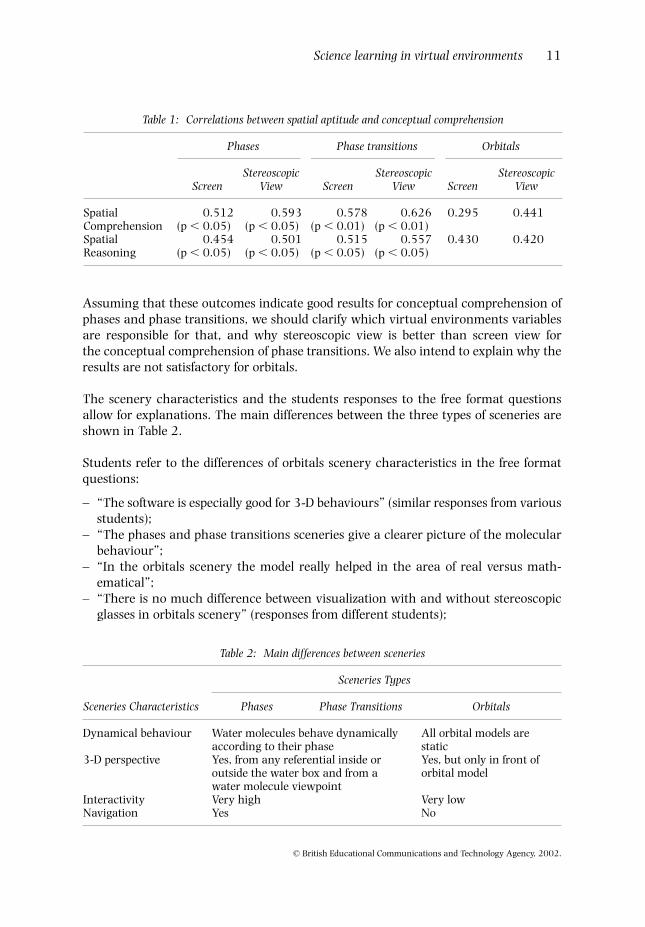
Assuming that these outcomes indicate good results for conceptual comprehension ofphases and phase transitions, we should clarify which virtual environments variablesare responsible for that, and why stereoscopic view is better than screen view for the conceptual comprehension of phase transitions. We also intend to explain why theresults are not satisfactory for orbitals.
The scenery characteristics and the students responses to the free format questionsallow for explanations. The main differences between the three types of sceneries areshown in Table 2.
Students refer to the differences of orbitals scenery characteristics in the free formatquestions:
– “The software is especially good for 3-D behaviours” (similar responses from variousstudents);
– “The phases and phase transitions sceneries give a clearer picture of the molecularbehaviour”;
– “In the orbitals scenery the model really helped in the area of real versus math-ematical”;
– “There is no much difference between visualization with and without stereoscopicglasses in orbitals scenery” (responses from different students);
Science learning in virtual environments 11
© British Educational Communications and Technology Agency, 2002.
Table 1: Correlations between spatial aptitude and conceptual comprehension
Phases Phase transitions Orbitals
Stereoscopic Stereoscopic StereoscopicScreen View Screen View Screen View
Spatial 0.512 0.593 0.578 0.626 0.295 0.441Comprehension (p , 0.05) (p , 0.05) (p , 0.01) (p , 0.01)Spatial 0.454 0.501 0.515 0.557 0.430 0.420Reasoning (p , 0.05) (p , 0.05) (p , 0.05) (p , 0.05)
Table 2: Main differences between sceneries
Sceneries Types
Sceneries Characteristics Phases Phase Transitions Orbitals
Dynamical behaviour Water molecules behave dynamically All orbital models are according to their phase static
3-D perspective Yes, from any referential inside or Yes, but only in front ofoutside the water box and from a orbital modelwater molecule viewpoint
Interactivity Very high Very lowNavigation Yes No

– “The stereoscopic view is more useful for phases and phase transitions” (similarresponses from different students).
In order to understand these results we proceed with the analysis of virtual environment(proof) and conceptual comprehension (dependent) variables, identifying correlationsbetween them.
We obtained three series of data concerning comprehension without software, withsoftware and screen visualization, and with software and stereoscopic view (Table 3).For comprehension with software (with the two visualization processes) we obtained ahigher average than for comprehension without software. Conceptual comprehensionof orbitals showed the lowest averages, while phases and phase transitions yielded similaraverages.
Concerning phases and phase transitions after software use, 3⁄ 4 of the results are above4 with 2 units of amplitude. Phase transitions have the lowest amplitude variation forconceptual comprehension without software.
These results confirm the existence of an association between spatial aptitude andconceptual comprehension only for phases and phase transitions. For phase transitionswe have noted a special association with spatial ability. Since in a virtual environment,learning occurs in 3-D space, we suspect that technical differences between the phasesand orbitals sceneries (for example, lack of some navigation features in the orbitalsscenery) might have cancelled out any advantages arising from high spatial ability.
Concerning visualization (Table 4), the average is higher than 4 in all parameters,except immersion with screen (which is not surprising). For stereoscopic view theaverages are all higher than for visualization with screen, except for 3-D perception(which is smaller, strangely) and interactivity (which is equal).
As shown in Figure 7 all boxes plots have 3⁄ 4 of the data higher than 4, except fornavigation with screen, for which the results are almost all equal to 4, and forimmersion with screen, for which 3⁄ 4 of the data are under 4.
12 British Journal of Educational Technology Vol 33 No 4 2002
© British Educational Communications and Technology Agency, 2002.
Table 3: Averages and standard deviations for conceptual comprehension
Phases Phase Transitions Orbitals
Without Stereo Without Stereo Without Stereo software Screen glasses software Screen glasses software Screen glasses
Average* 3.15 4.30 4.30 3.20 4.20 4.30 2.10 3.55 4.05Standard 0.93 0.66 0.57 0.70 0.62 0.80 1.25 0.94 0.60deviation
* out of 5

In fact, a computer with a screen (window on world, in virtual reality terminology) is not an immersive system. In an authentic immersive system the user should have the perception of being inside a scenery, which appears according to our movements(eg, it shows a new scene when the head is moved). Research conducted by Byrne(www.hitl.washington.edu/projects/learning_center/) on the use of virtual reality asan educational tool in Chemistry (Chemistry World) has indicated that immersion isnot an important variable in learning through virtual environments, in contrast tointeractivity. Regarding 3-D perception by stereo glasses we have verified, throughstudents opinions, that it is useful for observing complex structures (like the structureof ice) and some dynamical behaviours (like phase transitions).
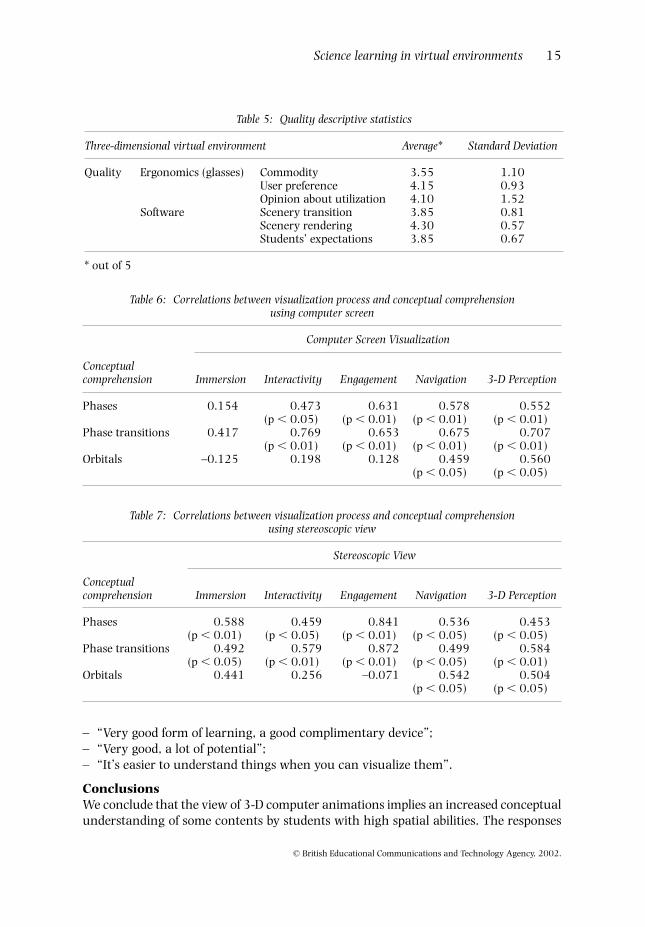
These results agree with the quality parameter variables (Table 5). Results on glassesergonomics show that students have a favourable opinion about their use (average of4.1 and standard deviation of 1.52), according to user preference variable (average of4.15 and standard deviation of 0.93), in spite of the lower average about commodity(average of 3.55 and standard deviation of 1.1). The high values of standard deviationsin opinion about utilization and commodity help to understand this result.
We are particularly interested in the associations between visualization processes andconceptual comprehension. With respect to the screen (Table 6) there are significantcorrelations between conceptual comprehension of all subjects and visualization processparameters, except immersion. Lower correlation values (p , 0.05) exist for conceptualcomprehension of phases and interactivity and 3-D perception. Concerning orbitals, for which conceptual comprehension results were not good enough, correlation withnavigation and 3-D perception was the only significant one found.
In relation to stereoscopic visualization (Table 7), we found strong correlations betweenimmersion, engagement and phases, and, on the other hand, interactivity, engagement,3-D perception and phase transitions. For the remaining variables we found significant
Science learning in virtual environments 13
© British Educational Communications and Technology Agency, 2002.
Table 4: Descriptive statistics of the visualization processes
Three-dimensional virtual environment Average* Standard Deviation
Visualization Process Screen Immersion 3.70 0.86Interactivity 4.25 0.64Engagement 4.35 0.67Navigation 4.10 0.553-D perception 4.30 0.66
Stereo glasses Immersion 4.35 0.75Interactivity 4.25 0.64Engagement 4.40 0.68Navigation 4.20 0.623-D perception 4.15 0.59
* out of 5

statistical correlations of 5%, except for immersion, interactivity, engagement andconceptual comprehension of orbitals.
In response to the free format questions the students said that:
– “This visualization will stay with me”;– “This experience will stay in memory much longer than any notes or lectures”
(similar responses);
14 British Journal of Educational Technology Vol 33 No 4 2002
© British Educational Communications and Technology Agency, 2002.
Figure 7: Box plots for the two visualization processes: a) visualization with screen; b) visualizationwith stereo glasses
± standard deviation
± standard error
Median
± standard deviation
± standard error
Median
Outside value
Far outside value
6
5
4
3
2
1
6.0
5.0
4.0
3.0
2.0
1.0
Pro
cess
of v
isua
lizat
ion
Pro
cess
of v
isua
lizat
ion *
*
3
*
N = 20immersion
20interactivity
20engagement
20navigation
203-D perception
Parameters of visualization
N = 20immersion
20interactivity
20engagement
20navigation
203-D perception
Parameters of visualization
– “Very good form of learning, a good complimentary device”;– “Very good, a lot of potential”;– “It’s easier to understand things when you can visualize them”.
ConclusionsWe conclude that the view of 3-D computer animations implies an increased conceptualunderstanding of some contents by students with high spatial abilities. The responses
Science learning in virtual environments 15
© British Educational Communications and Technology Agency, 2002.
Table 5: Quality descriptive statistics
Three-dimensional virtual environment Average* Standard Deviation
Quality Ergonomics (glasses) Commodity 3.55 1.10User preference 4.15 0.93Opinion about utilization 4.10 1.52
Software Scenery transition 3.85 0.81Scenery rendering 4.30 0.57Students’ expectations 3.85 0.67
* out of 5
Table 6: Correlations between visualization process and conceptual comprehension using computer screen
Computer Screen Visualization
Conceptualcomprehension Immersion Interactivity Engagement Navigation 3-D Perception
Phases 0.154 0.473 0.631 0.578 0.552(p , 0.05) (p , 0.01) (p , 0.01) (p , 0.01)
Phase transitions 0.417 0.769 0.653 0.675 0.707(p , 0.01) (p , 0.01) (p , 0.01) (p , 0.01)
Orbitals –0.125 0.198 0.128 0.459 0.560(p , 0.05) (p , 0.05)
Table 7: Correlations between visualization process and conceptual comprehension using stereoscopic view
Stereoscopic View
Conceptualcomprehension Immersion Interactivity Engagement Navigation 3-D Perception
Phases 0.588 0.459 0.841 0.536 0.453(p , 0.01) (p , 0.05) (p , 0.01) (p , 0.05) (p , 0.05)
Phase transitions 0.492 0.579 0.872 0.499 0.584(p , 0.05) (p , 0.01) (p , 0.01) (p , 0.05) (p , 0.01)
Orbitals 0.441 0.256 –0.071 0.542 0.504(p , 0.05) (p , 0.05)

after observing Virtual Water were in general more accurate, more complete, and showeda better conceptual understanding than the previous responses given by the same stu-dents. The concepts which have shown to be better understood were those associatedwith phases and phase transitions (which had more interactivity). Interactivity, navigationand 3-D perception were the more influential visualization parameters for those concepts.
The main strength which we have found in virtual reality is, not surprisingly, the abilityto visualize situations which can not be seen otherwise and, moreover, to immerse thestudent within them. A photo or movie may show students the internal geometry ofice, but only virtual reality allows them to enter inside and observe it from any view-point. An animation could illustrate the mechanism of solid-liquid phase transition, butvirtual reality provides students with a much stronger sense of “being there”. Studentsreported an increased motivation for the formalism behind molecular dynamics afterhaving explored the 3-D motion and its relations to the physical properties.
However, stereoscopic visualization does not seem to contribute much to conceptualunderstanding. In spite of some sense of immersion provided by the stereoscopic view,results for screen and stereoscopic glasses were almost identical. The single stereoscopicfeature which most students seemed to really appreciate was the 3-D structure of theice structure. They generally reported that this gave them a more tangible grasp of a solid state structure. One of the values of virtual reality is precisely its ability to givesubstance to abstract concepts. As one student said, “when I work on a physics orchemistry problem for an hour, all I have to show for my efforts is a number, whichdoesn’t always mean anything to me. This program gave me a chance to see watermolecules behaviour for the first time”.
Our findings will be non-generalisable without a method for evaluating the impact onlearning, a work that goes beyond this descriptive study. We present some suggestionsfor further research: test students with lower reasoning ability; use more complexanimations; examine other areas of Physics and Chemistry; examine long-term retentionof concepts; and examine transferability of concepts to other subjects.
AcknowledgementsThe authors thank Prof. Dr Victor Gil, from the Chemistry Department of the Universityof Coimbra, for his valuable suggestions, and Prof. Dr José Carlos Teixeira, from theMathematics Department of the same University, for his technical advice. We alsowish to acknowledge the contribution of all the students that collaborated in thisresearch. This research was supported in part by the Portuguese Foundation forScience and Technology (project PRAXIS/FIS/14188/1998).
ReferencesArnheim R (1969) Visual Thinking University of California Press, Berkeley.Baker S and Taylor L (1972) The relationship of visualization skill to achievement in freshman
chemistry Journal of Chemical Education 49 775–777.Benson D, Wittrock M and Baur M (1993) Student’s preconceptions of the nature of gases Journal
of Research in Science Education 30 587–597.
16 British Journal of Educational Technology Vol 33 No 4 2002
© British Educational Communications and Technology Agency, 2002.

Boujaoude S (1991) A study of the nature of students’ understanding about the concept ofburning Journal of Research in Science Teaching 28 689–704.
Crosby M and Iding M (1997) The influence of a multimedia physics tutor and user differenceson the development of scientific knowledge Computers and Education 29 127–136.
Delcourt M and Kinzie M (1993) Computer technologies in teacher education: the measurementof attitudes and self-efficacy Journal of Research and Development in Education 27 35–41.
Domenech A, Casasus E and Domenech M (1993) The classical concept of mass: theoreticaldifficulties and students’ definition International Journal of Science Education 15 163–173.
Escalada L and Zollman D (1977) An investigation on the effects of using interactive digital videoin a physics classroom on student learning and attitudes Journal of Research in Science Teaching34 467–489.
Felder R and Silverman L (1988) Learning and teaching styles in engineering education Journalof Engineering Education 78 674–681.
Gamow G and Stannard R (1999) The New World of Mr Tompkins Cambridge University Press,Cambridge.
Gardner H (1983) Frames of Mind: The Theory of Multiple Intelligences Basic Books, Cambridge.Griffiths A and Preston K (1992) Grade-12 students’ misconceptions relating to fundamental
characteristics of atoms and molecules Journal of Research in Science Teaching 29 611–628.Haidar A and Abraham M (1991) A comparison of applied and theoretical knowledge of
concepts based on the particulate nature of matter Journal of Research in Science Teaching 28919–938.
Krnel D (1994) Understanding the structure of matter Pedagoska Obzorja (Slovenia) 9 20–32.Krnel D, Watson R and Glazar S (1998) Survey of research related to the development of the
concept of ‘matter’ International Journal of Science Education 20 257–289.Lee O, Eichinger D, Anderson C, Berkheimer G and Blakeslee T (1993) Changing middle school
students’ conceptions of matter and molecules Journal of Research in Science Teaching 30 249–270.Lord T (1985) Enhancing the visuo-spatial aptitude of students Journal of Research in Science
Teaching 22 395–405.Lord T (1987) Spatial teaching The Science Teacher 54 32–34.Markham U (1998) The Elements of Visualization Element, Boston. Mathewson J (1999) Visual-spatial thinking: an aspect of science overlooked by educators
Scientific Education 83 33–54.Miller A (1996) Insights of Genius: Imagery and Creativity in Science and Art Copernicus, New York.Mullet E and Gervais H (1990) Distinction between the concept of weight and mass in high
school students International Journal of Science Education 72 217–226.Novick S and Nussbaum J (1978) Junior high school pupils’ understanding of the particulate
nature of matter: an interview study Science Education 62 273–281.Pallrand G and Seeber F (1984) Spatial abilities and achievement in introductory physics Journal
of Research in Science Teaching 21 507–516.Pereira M and Pestana M (1991) Pupils’ representations of models of water International Journal
of Science Education 13 313–319.Petri J and Niedderer H (1998) A learning pathway in high-school level quantum atomic physics
International Journal of Science Education 20 1075–1088.Reiner M (1998) Thought experiments and collaborative learning in physics International Journal
of Science Education 20 1043–1058.Resnick J (1983) Mathematics and science learning: a new conception Science 220 477–478.Ribeiro I (1998) Mudanças no Desempenho e na Estrutura das Aptidões Universidade do Minho,
Braga.Roe S (1952) A psychologist examines 64 eminent scientists Scientific American 187 21–22.Siemonhowski F and MacKnight F (1971) Spatial cognition, success prognosticator in college
science courses Journal of College Science Teacher 1 56–59.Silverman L (1998) Effective Techniques for Teaching Highly Gifted Visual-Spatial Learners
[Online]. Available HTTP: www.gifteddevelopment.com /Articles/EffectiveTechniques.html
Science learning in virtual environments 17
© British Educational Communications and Technology Agency, 2002.

SPSS Inc (1997) SPSS Base 7.5 Windows User’s Guide SPSS Inc, Chicago.Styer D (1996) Common misconceptions regarding quantum mechanics American Journal Physics
64 31–36.Tobin K and Capie W (1981) The development and validation of a group test of logical thinking
Educational and Psychological Measurement 41 413–423.Williamson V and Abraham M (1995) The effects of computer animation on the particulate mental
models of college chemistry students Journal of Research in Science Teaching 32 521–534.
18 British Journal of Educational Technology Vol 33 No 4 2002
© British Educational Communications and Technology Agency, 2002.