Embed Size (px)
Citation preview
1
Widener University School of Engineering
Comparison of Dry-Pack and Overpour Methods for Foundation Underpinning
4/27/2015
Senior Project Team No: 9
Team Members:
Anthony Lemus, Civil Engineering, Team Leader
David Millili, Civil Engineering
Andrew Roth, Civil Engineering
Eric Moreau, Civil Engineering
Faculty Advisor:
Prof. Xiaochao Tang, Ph.D.
Industry Advisors:
Mr. Nick Cirilli, Project Supporter
Senior Projects Coordinator:
Prof. Art Kalemkarian
2
Directory Senior Project AY 2014-2015
Team No: 9 Date Submitted: 4/27/15
Project Title: Comparison of Dry-Pack and Overpour Methods for Foundation Underpinning
Team Leader:
Name: Anthony Lemus Major: Civil Engineering
Email: [email protected] Cell: 323-333-0797
Team Members (for each):
Name: David Millili Major: Civil Engineering
Email: [email protected] Cell: 609-502-3111
Name: Andrew Roth Major: Civil Engineering
Email: [email protected] Cell: 443-786-9376
Name: Eric Moreau Major: Civil Engineering
Email: [email protected] Cell: 845-558-8326
Faculty Advisor(s):
Name: Xiaochao Tang Ph.D. Major: Civil Engineering
Industry Advisor(s):
Name: Nick Cirilli Major: Civil Engineering
Email: [email protected] Cell: 610-613-3455
Business Name: Cirilli Associates
Business Address: 1489 Baltimore Pike,
Springfield, PA 19064
Sponsor(s):
Name: Nick Cirilli Major: Civil Engineering
Email: [email protected] Cell: 610-613-3455
Business Name: Cirilli Associates
Business Address: 1489 Baltimore Pike,
Springfield, PA 19064
Sponsor(s):
Name: Jim Olshefsky Major: N/A
Email: [email protected] Cell: 1-610-832-9714
3
Business Name: ASTM International Project Grants
Business Address: 100 Barr Harbor Drive, PO Box C700
West Conshohocken, PA 19428-2959, USA
4
Disclaimer
This report was generated by Senior Project Team 9, Comparison of Dry-Pack and
Overpour Methods for Foundation Underpinning, academic year 2014-2015, a group of
engineering students at Widener University. It is primarily a record of an educational project
conducted by these students as a part of the curriculum requirements for a Bachelor of Science
degree in engineering. Widener University makes no representation that the material contained in
this report is error free or complete in all respects. Further, the University, its employees and
students make no recommendation for the use of said material and take no responsibility for such
usage. Thus, persons or organizations that choose to use said material do so at their own risk.
5
Executive Summary
Shallow foundation underpinning involves building a new footing underneath an existing
foundation while creating and maintaining bearing contact between both footings. Sufficient
bearing contact is crucial to effectively transfer the superstructure load to the new foundation.
The objective of this project was to compare the relatively new and untested Overpour method to
the performance of the current industry common practice, Dry-Pack method. Overpour is
considered successful if its performance in bearing contact, time, labor, shrinkage and
consistency is equivalent or better than the Dry-Pack method. Two sets of foundation systems
were built to mimic the respective Dry-Pack and Overpour foundation underpinning. The design
of the existing foundations was based on typical wall footings as provided by the
recommendations of the industrial advisors along with literature research. Both methods were
conducted and evaluated by applying quasi-static loads on full scale, 3-ft foundation sections.
Bearing contact was assessed between new and existing foundations through four types of
sensors. A soil layer was constructed at the base of each foundation to assess the load-carrying
capacity of the foundation systems while providing some flexural freedom. With the additional
soil layer, the ultimate bearing capacity was reached before any localized foundation failures
occurred. From all defined criteria of success, it is evident that Overpour is equivalent if not
better than Dry-Pack in terms of load-carrying capacity under the specific loading conditions.
Overpour surpassed Dry-Pack performances in reduction of labor, time efficiency and
consistency. Overpour was equivalent to Dry-Pack in regards to bearing contact and shrinkage.
Considering the conditions of the experiment and the outcome of the results, the Overpour
method is deemed a more optimal process for foundation underpinning.
6
Table of Contents
Directory ......................................................................................................................................... 2
Disclaimer ....................................................................................................................................... 4
Executive Summary ........................................................................................................................ 5
Table of Contents ............................................................................................................................ 6
List of Figures ................................................................................................................................. 9
List of Tables ................................................................................................................................ 11
Introduction ................................................................................................................................... 12
Experimental Design ..................................................................................................................... 15
Replication of Field Conditions ................................................................................................ 15
Loading ..................................................................................................................................... 15
Performance .............................................................................................................................. 16
Bearing Contact .................................................................................................................... 16
Workability ........................................................................................................................... 16
Time Consumption................................................................................................................ 17
Consistency ........................................................................................................................... 17
Shrinkage .............................................................................................................................. 17
Capture/Camera Setup .............................................................................................................. 19
Conditions ................................................................................................................................. 19
Failures ...................................................................................................................................... 19
7
Design ....................................................................................................................................... 20
Dry-Pack/Overpour: Consistency ......................................................................................... 20
Dry-Pack/Overpour: Existing Foundations........................................................................... 20
Testing Box: .......................................................................................................................... 21
Soil Layer: ............................................................................................................................. 23
Dry-Pack: New Foundation .................................................................................................. 24
Overpour: New Foundation .................................................................................................. 25
Sensors: LVDTs .................................................................................................................... 26
Sensors: Pressure Cell ........................................................................................................... 27
Sensors: LDC1000EVM ....................................................................................................... 27
Sensors: MTS Actuator ......................................................................................................... 27
ASTM Standards ....................................................................................................................... 28
Cylinders ................................................................................................................................... 28
Alternative Designs ................................................................................................................... 28
Displacement/Pressure/Load ..................................................................................................... 29
Experimental Procedures .............................................................................................................. 30
Existing Foundation .................................................................................................................. 30
Testing Box ............................................................................................................................... 33
Dry-Pack Method ...................................................................................................................... 37
Dry-Pack Test ........................................................................................................................... 39
8
Overpour Method ...................................................................................................................... 40
Overpour Test ........................................................................................................................... 41
Test Cylinders ........................................................................................................................... 42
Results and Analysis ..................................................................................................................... 44
Conclusion .................................................................................................................................... 51
Recommendations ......................................................................................................................... 52
List of References ......................................................................................................................... 54
Acknowledgements ....................................................................................................................... 55
Appendices .................................................................................................................................... 56
9
List of Figures
Figure 1: Foundation Underpinning.............................................................................................. 12
Figure 2: Load Transfer Rollers (located in blue) ........................................................................ 16
Figure 3: Existing Foundation Design .......................................................................................... 21
Figure 4: Testing Box Design ....................................................................................................... 22
Figure 5: Dry-Pack Foundation System Design ........................................................................... 25
Figure 6: Overpour Foundation System Design ........................................................................... 26
Figure 7: Shows the formwork assemble process ......................................................................... 30
Figure 8: Shows the interior 2” x 4” lumber installation .............................................................. 31
Figure 9: The layout of the 4” lag screws ..................................................................................... 31
Figure 10: The method of creating a rough surface for the foundation ........................................ 32
Figure 11: Rebar setup and layout ................................................................................................ 32
Figure 12: Concrete mixing and placement .................................................................................. 33
Figure 13: The construction of the test box base .......................................................................... 34
Figure 14: 4” x 4” post legs are attached to base .......................................................................... 34
Figure 15: Wall construction process ........................................................................................... 35
Figure 16: The window side wall under construction ................................................................... 35
Figure 17: Shows the plastic lining and the trash cans of soil ...................................................... 36
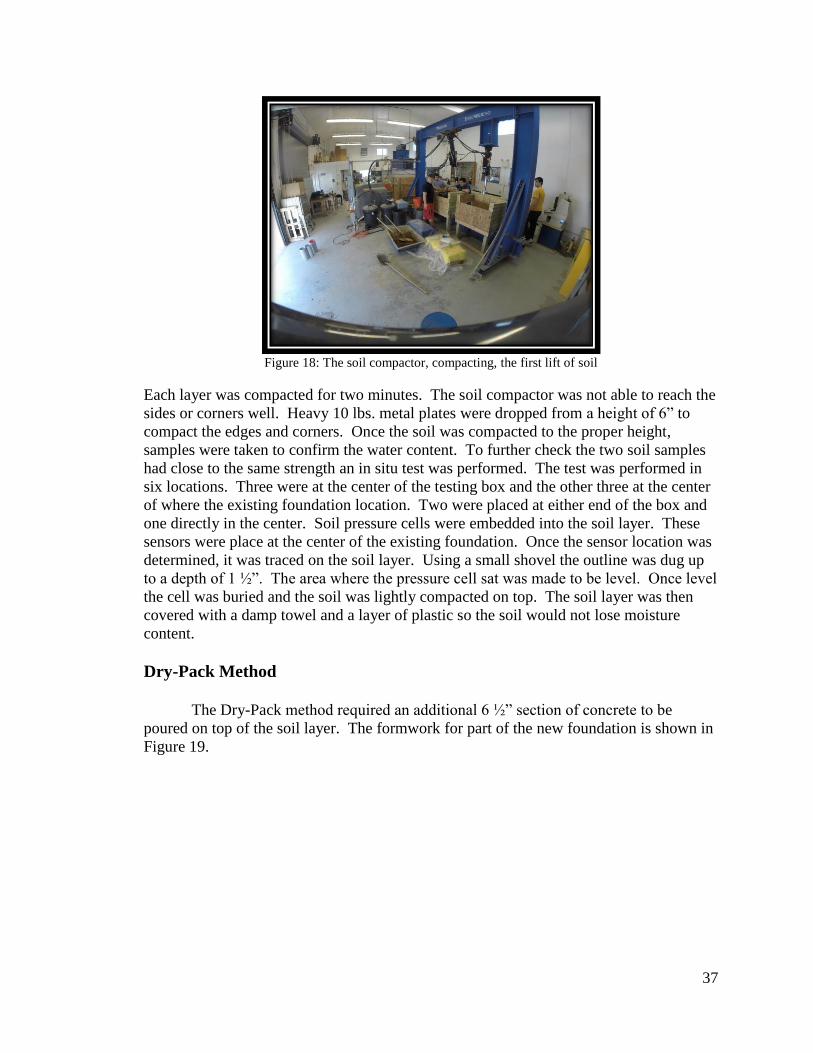
Figure 18: The soil compactor, compacting, the first lift of soil .................................................. 37
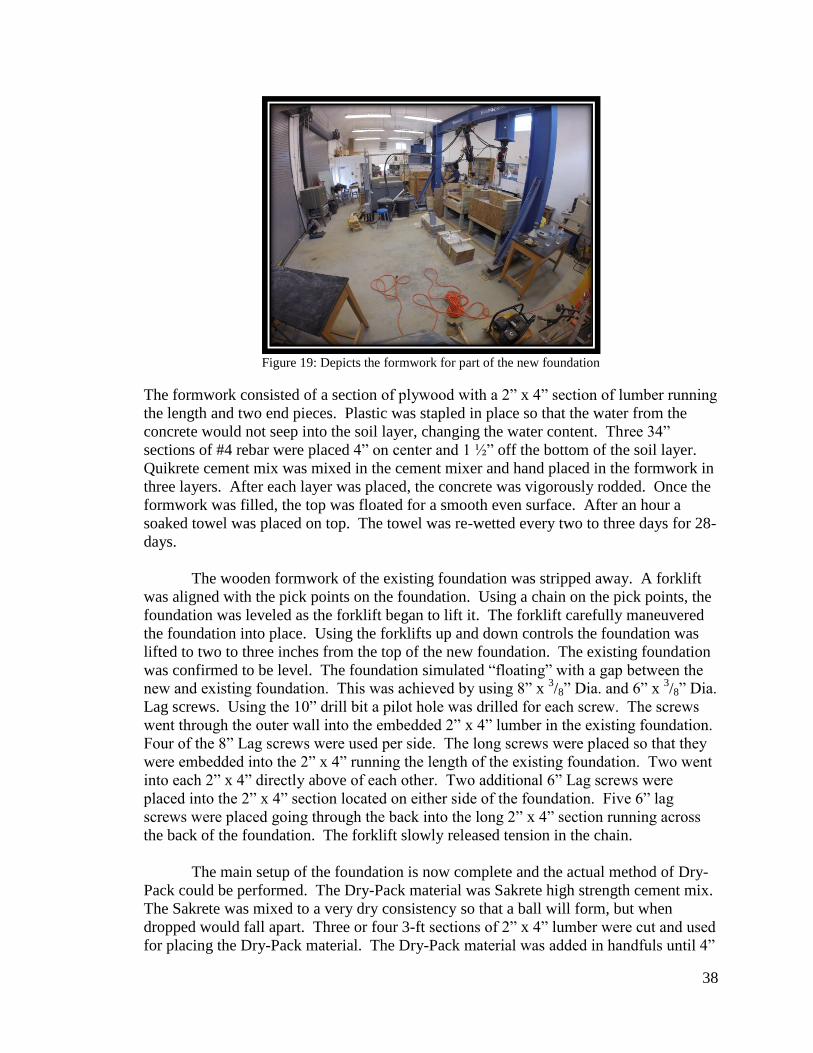
Figure 19: Depicts the formwork for part of the new foundation ................................................. 38
10
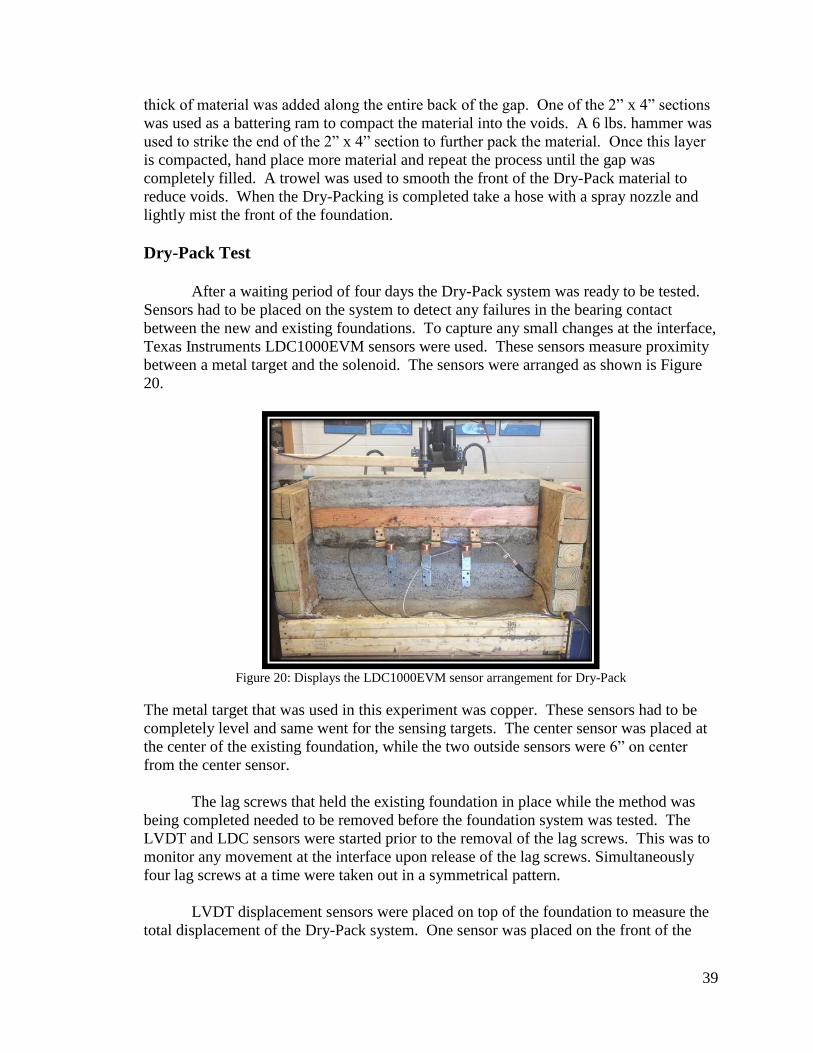
Figure 20: Displays the LDC1000EVM sensor arrangement for Dry-Pack ................................. 39
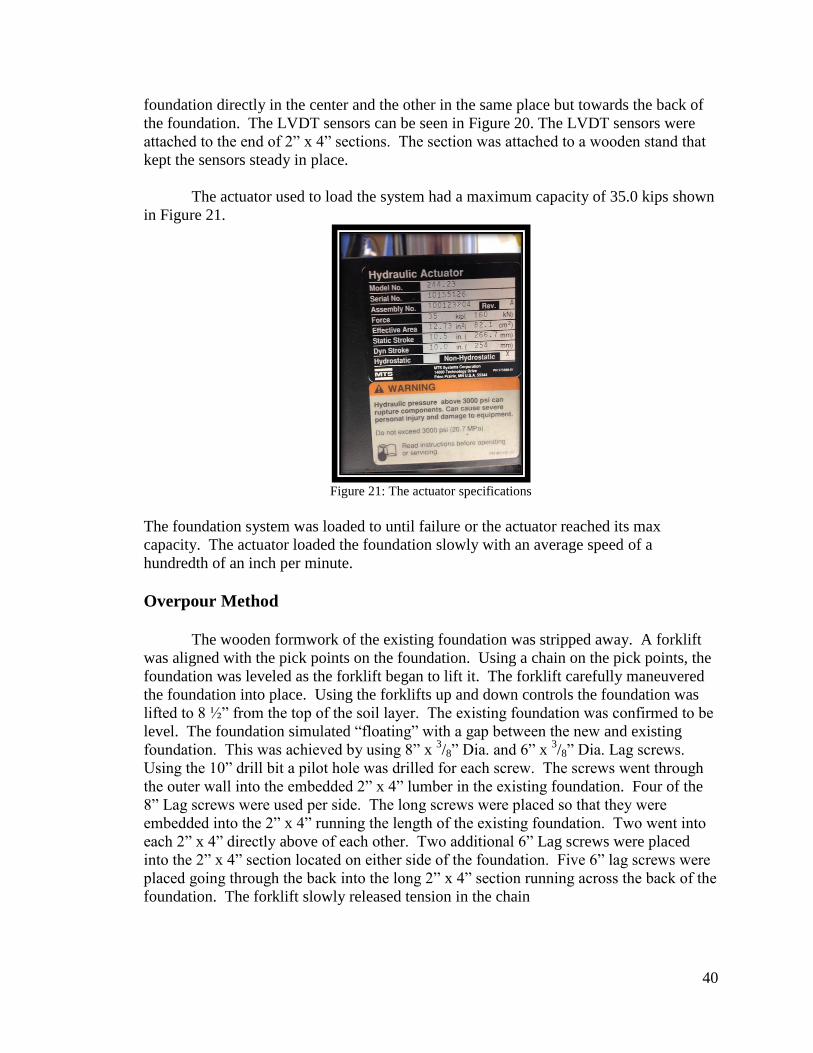
Figure 21: The actuator specifications .......................................................................................... 40
Figure 22: Depicts the hopper used for the Overpour method...................................................... 41
Figure 23: Displays the LDC1000EVM sensor arrangement for Overpour ................................. 42
Figure 24: The testing machine for the concrete test cylinders .................................................... 43
Figure 25: Load vs. Deflection as measured by the MTS Actuator sensors ................................. 44
Figure 26: Proximity vs. Time as measured by the LDC1000EVM Module sensors .................. 46
Figure 27: Pressure vs. Deflection as measured by the Pressure Cell and LDVT sensors ........... 47
11
List of Tables
Table 1: Average in-situ strength values as recorded by a lightweight deflectometer in ksi ....... 48
Table 2: 28-Day Existing Foundation Compression Test Cylinders ............................................ 48
Table 3: 28-Day Dry-Pack Material ............................................................................................. 49
Table 4: 7-Day Dry-Pack Composite Material ............................................................................. 49
Table 5: 7-Day Overpour Composite Material ............................................................................. 49
Table 6: General Project Results................................................................................................... 50
12
Introduction
When foundations of currently erected buildings settle excessively or at uneven rates over
the course of time, the structural integrity of the building is at jeopardy. When this occurs, an
engineering and construction firm is hired to evaluate and repair the failing foundation. One
methodology for fixing the issue of failing foundations is the process of underpinning. “In
construction, underpinning is the process of strengthening and stabilizing the foundation of an
existing building or other structure.” 1 For shallow foundation underpinning, it typically involves
construction a new shallow foundation below the existing foundation. Underpinning foundations
can be defined as:
Underpinning is the process of modifying an existing foundation system
by extending it to or into subsurface strata that is deeper and more stable than the
near surface soil that supports the existing foundation system. This is done to
provide vertical support that is not present in the existing design. Methods of
underpinning include the construction of footings, stem walls or driven pilings.
Many of the houses that forensic engineers and repair contractors are
asked to evaluate were constructed with foundations that are inadequate for the
conditions existing on site. Because of the lack of suitable land, homes are often
built on marginal land that has insufficient bearing capacity to support the
substantial weight of a structure. In addition, there are many areas of the country
where the near surface soils consist predominantly of expansive clays that shrink
and swell as their moisture content changes. As a result, underpinning is required
to extend the foundation support to depths that provide greater bearing capacity
and/or are less affected by climate, soil conditions and/or homeowner’s actions.
This underpinning, if properly designed and installed, provides the basis to lift the
structure to a more acceptable elevation and provides vertical support to prevent
the underpinned area from settling.4
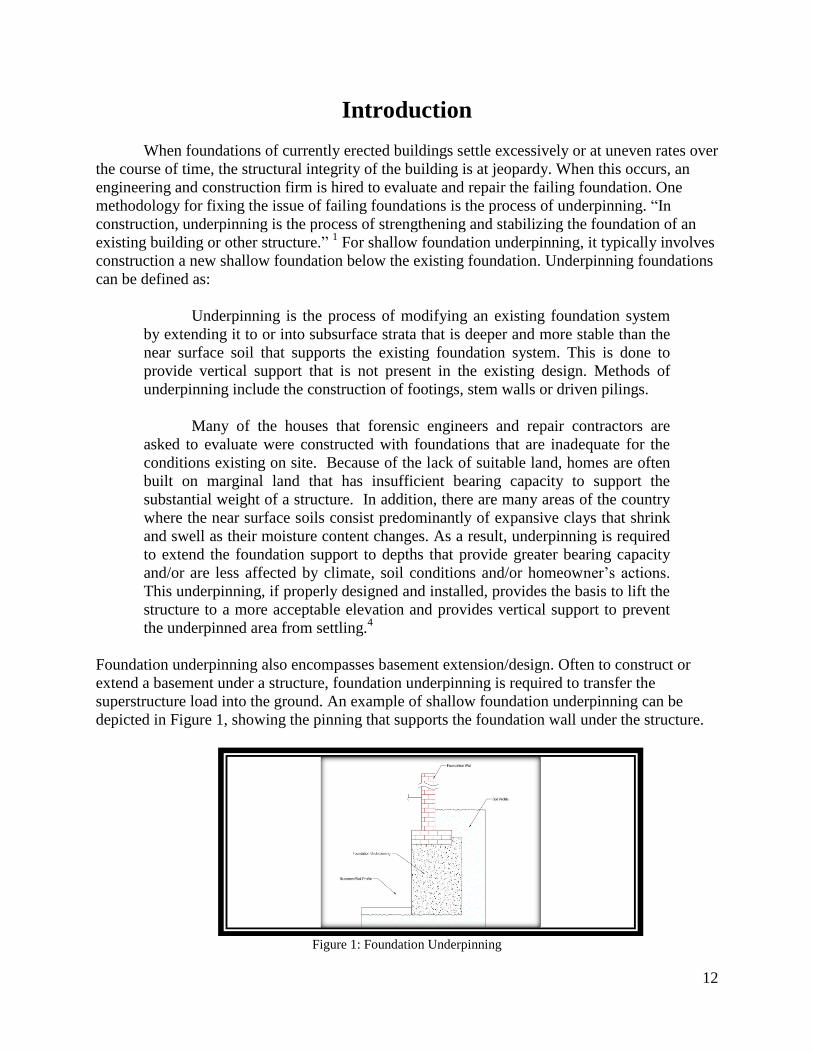
Foundation underpinning also encompasses basement extension/design. Often to construct or
extend a basement under a structure, foundation underpinning is required to transfer the
superstructure load into the ground. An example of shallow foundation underpinning can be
depicted in Figure 1, showing the pinning that supports the foundation wall under the structure.
Figure 1: Foundation Underpinning
13
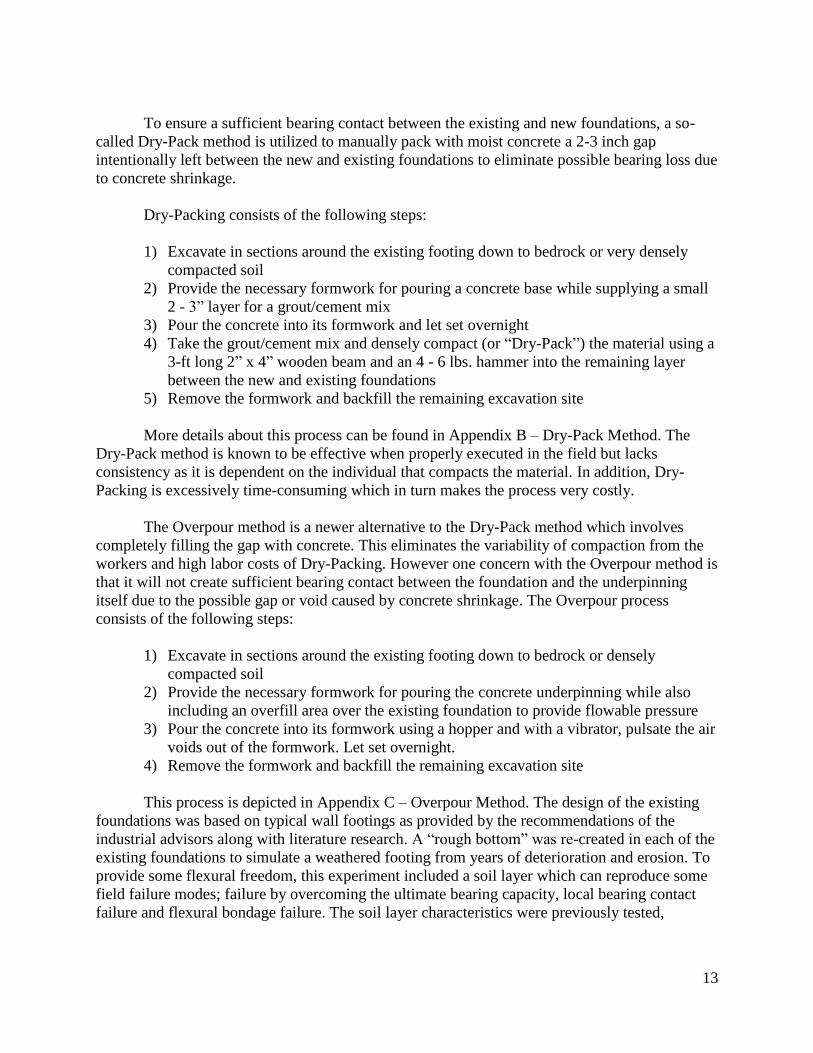
To ensure a sufficient bearing contact between the existing and new foundations, a so-
called Dry-Pack method is utilized to manually pack with moist concrete a 2-3 inch gap
intentionally left between the new and existing foundations to eliminate possible bearing loss due
to concrete shrinkage.
Dry-Packing consists of the following steps:
1) Excavate in sections around the existing footing down to bedrock or very densely
compacted soil
2) Provide the necessary formwork for pouring a concrete base while supplying a small
2 - 3” layer for a grout/cement mix
3) Pour the concrete into its formwork and let set overnight
4) Take the grout/cement mix and densely compact (or “Dry-Pack”) the material using a
3-ft long 2” x 4” wooden beam and an 4 - 6 lbs. hammer into the remaining layer
between the new and existing foundations
5) Remove the formwork and backfill the remaining excavation site
More details about this process can be found in Appendix B – Dry-Pack Method. The
Dry-Pack method is known to be effective when properly executed in the field but lacks
consistency as it is dependent on the individual that compacts the material. In addition, Dry-
Packing is excessively time-consuming which in turn makes the process very costly.
The Overpour method is a newer alternative to the Dry-Pack method which involves
completely filling the gap with concrete. This eliminates the variability of compaction from the
workers and high labor costs of Dry-Packing. However one concern with the Overpour method is
that it will not create sufficient bearing contact between the foundation and the underpinning
itself due to the possible gap or void caused by concrete shrinkage. The Overpour process
consists of the following steps:
1) Excavate in sections around the existing footing down to bedrock or densely
compacted soil
2) Provide the necessary formwork for pouring the concrete underpinning while also
including an overfill area over the existing foundation to provide flowable pressure
3) Pour the concrete into its formwork using a hopper and with a vibrator, pulsate the air
voids out of the formwork. Let set overnight.
4) Remove the formwork and backfill the remaining excavation site
This process is depicted in Appendix C – Overpour Method. The design of the existing
foundations was based on typical wall footings as provided by the recommendations of the
industrial advisors along with literature research. A “rough bottom” was re-created in each of the
existing foundations to simulate a weathered footing from years of deterioration and erosion. To
provide some flexural freedom, this experiment included a soil layer which can reproduce some
field failure modes; failure by overcoming the ultimate bearing capacity, local bearing contact
failure and flexural bondage failure. The soil layer characteristics were previously tested,
14
documented and known before any experimentation took place. These soil layer characteristics
can be found within Appendix D.
Both methods were conducted and evaluated by applying quasi-static load tests on full
scale, three-foot foundation sections. The loading device for this experiment was a 35.0 kip
maximum capacity linear actuator and was the only loading device applied to the replicated
foundations. Any necessary and present ASTM Standard procedures were followed throughout
the experiment but there is a lack of ASTM procedures on this topic. Additional 4” cylinders
were produced and loaded until failure using a Concrete Compression Machine rated for 400.0
kips. Four types of sensors were utilized during the experiment. Bearing contact was assessed
between the new and existing foundations through three relative displacement non-contact
sensors. Three types of additional sensors provided quantitative data on (2) absolute
displacement and (1) stress distribution.
Coverage of the entire experiment was captured through video footage along with
photographs documenting major events in the experiment. A “window” was produced in the test
housing to provide some visual clarification that bearing contact was being created during the
two processes.
Due to the lack of tests comparing the two methods, this project will assess the bearing
contact, time, labor, and strength performance of the Overpour method in contrast to the industry
common practice of Dry-Packing. If the Overpour method exhibits an equivalent or better
performance than the Dry-Pack method, the Overpour method would be implemented into
construction practices to help reduce project costs and increase the efficiency of underpinning.
These experiments are laboratory based only and will not be conducted in field but will attempt
to accommodate and reproduce some field conditions.
The objective of this project is to evaluate two methods of underpinning to determine if
Overpour is equivalently effective or better in creating and maintaining bearing contact between
foundations. The objectives can be summarized:
1.) Simulate the Overpour and Dry-Pack methods for foundation underpinning in
controlled reinforced plywood boxes
2.) Simulate a predetermined soil layer to allow flexural bending within tests.
3.) Test the foundations and underpinnings while measuring the displacements of the
existing foundations using electronic sensors.
4.) Evaluate and compare the results of the experiment in order to determine if the Over-
pour method is as or more effective at creating/maintaining bearing contact.
5.) Perform ASTM standard tests on the cement/concrete mixes used in the experiment
including slump cone, compression cylinder and the four point bending test.
15
Experimental Design
This experiment was determined from deliberating the minimum requirements and
specifications set forth by the industrial advisors, project advisor, ASTM Standard Procedures
and the project team. The scope of the project does not include replicating all conditions that can
be present in the field. These experiments are laboratory based only and were not conducted in
the field but attempted to accommodate and reproduce some field conditions. The underpinning
tests were not loaded until failure/rupture. The systems were loaded to the capacity of the linear
actuator used in the experiment; 35.0 kips. Had failure occurred during the steadily climbing
loading condition, records were being kept from both visual observation and quantitative data
recorded by four types of sensors.
Replication of Field Conditions
The overall goal of providing field conditions is to maintain a controlled environment
while also producing some settings that will give insight as to the type of failures, if any, which
would occur in the field. The overall conditions that were met were precisely determined,
experimented and maintained. The field conditions that were replicated for this experiment
included:
1. 6 ¾” complete soil layer for flexural freedom with a tolerance of a ± ¼”
2. Steel I-Beam supported the testing apparatus, recreating “densely compacted
soil/bedrock”
3. Typical 3-ft section of foundation wall, as per conditions of the procedures of
underpinning
4. Material properties were kept consistent with that of the field properties as provided by
the industrial advisors.
5. Hopper was built for the Overpour method
All subsequent conditions can be found further explained in their respective sections.
Loading
Both methods were conducted and evaluated by applying quasi-static load tests, or
steadily increasing loads. The loading device for this experiment was a 35.0 kip rated linear
actuator and was the only loading device applied to the replicated foundations. The loading rate
for both foundations was approximately 0.01 in/min. This loading condition was applied through
10” long, dual parallel, transfer rollers with 6” on center attached to the underside of the actuator
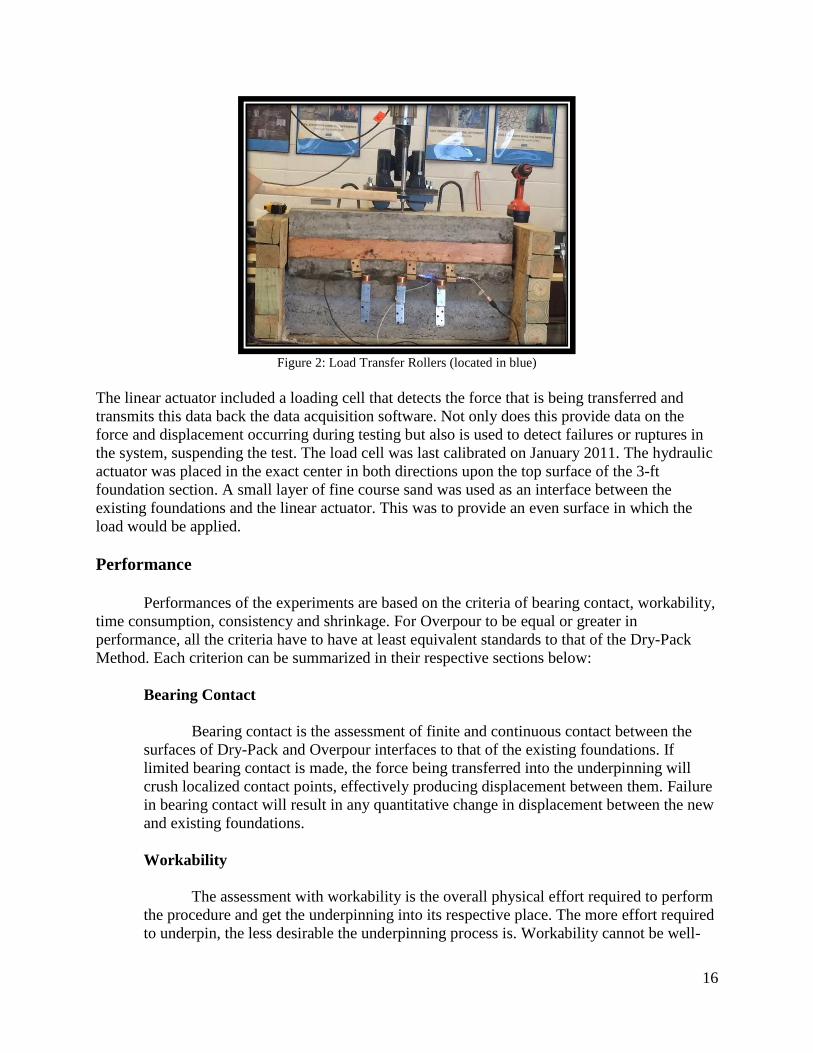
load head. This can be seen in Figure 2 below.
16
Figure 2: Load Transfer Rollers (located in blue)
The linear actuator included a loading cell that detects the force that is being transferred and
transmits this data back the data acquisition software. Not only does this provide data on the
force and displacement occurring during testing but also is used to detect failures or ruptures in
the system, suspending the test. The load cell was last calibrated on January 2011. The hydraulic
actuator was placed in the exact center in both directions upon the top surface of the 3-ft
foundation section. A small layer of fine course sand was used as an interface between the
existing foundations and the linear actuator. This was to provide an even surface in which the
load would be applied.
Performance
Performances of the experiments are based on the criteria of bearing contact, workability,
time consumption, consistency and shrinkage. For Overpour to be equal or greater in
performance, all the criteria have to have at least equivalent standards to that of the Dry-Pack
Method. Each criterion can be summarized in their respective sections below:
Bearing Contact
Bearing contact is the assessment of finite and continuous contact between the
surfaces of Dry-Pack and Overpour interfaces to that of the existing foundations. If
limited bearing contact is made, the force being transferred into the underpinning will
crush localized contact points, effectively producing displacement between them. Failure
in bearing contact will result in any quantitative change in displacement between the new
and existing foundations.
Workability
The assessment with workability is the overall physical effort required to perform
the procedure and get the underpinning into its respective place. The more effort required
to underpin, the less desirable the underpinning process is. Workability cannot be well-
17
defined quantitatively but only through personal experience; i.e. the working teams
overall required physical activity during the procedure of the underpinning.
Time Consumption
A key element in the success of the project is the overall time consumption of
each underpinning procedure. The general purpose of this experiment is to save project
costs. Project costs are directly related to the time consumption of the underpinning. If
the Overpour method is faster while producing the same bearing results of the Dry-Pack
method, Overpour can save on manual labor project costs. Time was taken from the
moment the procedure began (concrete/cement mixing) until the moment the procedure
ended (vibration/compaction finish).
Consistency
Consistency of the method was also a factor in performance. Dry-Packing relies
on an individual’s physical ability to compact a section of underpinning. This produces a
variety of variables; the energy, strength, number of individuals assisting, consistency of
the material, size of hammer, length of board, speed and ability of the filling the gap.
Overpour, however, relies solely on the pressure that is provided by the additional
pouring of concrete beyond the height foundation walls and vibration to eliminate and
control air voids. It is in this case that Overpour produces fewer variables than Dry-
Packing does. All variables ultimately will affect bearing contact however.
Shrinkage
The curing process of concrete/cement products will result in a change of volume.
Concrete will shrink depending on the conditions of the water-to-cement ratio and the
conditions that are present during the curing process. This shrinkage in both methods can
produce significant changes in displacement between the interfaces ultimately allowing
the foundations to further deflect. Further deflection beyond 1/64”, as described by the
industrial advisors, is subjection to failure as an underpinning procedure. Shrinkage for
this experiment only includes the materials that are used at the interfaces of the existing
foundations of the underpinning. Shrinkages not included for performance comparison
are the existing foundations themselves and the newly poured foundation of the Dry-
Packing procedure.
The shrinkage performance for this experiment cannot be physically measured for
either method due to limited availability between the interfaces and due to the pressure
being applied internally to the Overpour method. The pressure provided by the Overpour
method makes it extremely difficult to distinguish the difference between shrinkage and
movement of concrete downward filling gaps. It is for these reasons that shrinkage will
be determined theoretically for both methods in the y-direction, using a 10 year period.
Shrinkage characteristics of concrete can be defined:
18
Shrinkage strains are dependent on the relative humidity and are
largest for relative humidities of 40% or less. The magnitude of shrinkage
strains also depends on the composition of the concrete mix and the type
of cement used. The hardened cement paste shrinks, whereas the aggregate
acts to restrain shrinkage. Thus, the larger the fraction of the total volume
of the concrete that is made up of hydrated cement paste, the greater the
shrinkage. An increase in the water/cementitious materials ratio or the
total cement content reduces the volumes of aggregates, thus reducing the
restraint of shrinkage by the aggregate. Also, more finely ground cements
have a large surface area per unit volume, and thus, there is more absorbed
water to be lost during shrinkage. There is less shrinkage in concrete made
with quartz or granite aggregates that with sandstone aggregates because
quartz and granite have a higher modulus of elasticity.
Drying Shrinkage occurs as the moisture diffuses out of the
concrete. As a result, the exterior shrinks more rapidly than the interior.
This leads to tensile stresses in the outer skin of the concrete and
compressive stresses in the interior. For large member, the ratio of volume
to surface area increases, resulting in less shrinkage because there is more
moist concrete to restrain the shrinkage. Shrinkage also develops more
slowly in large members. Autogenous shrinkage occurs without the loss of
moisture due to hydration reactions inside the cement matrix. In earlier
studies this was considered to be a very small portion of the total
shrinkage, but with a greater use of high-performance concrete
(water/cement ratio below 0.40), autogenous shrinkage may constitute a
more significant percentage of the total shrinkage.
In a structure, the shrinkage strains will tend to be less for the
following reasons:
1) The ratio of volume to surface area will generally be large.
2) A structure is built in stages, and some of the shrinkage is
dissipated before adjacent stages are completed.
3) The reinforcement restrains the development of the shrinkage.
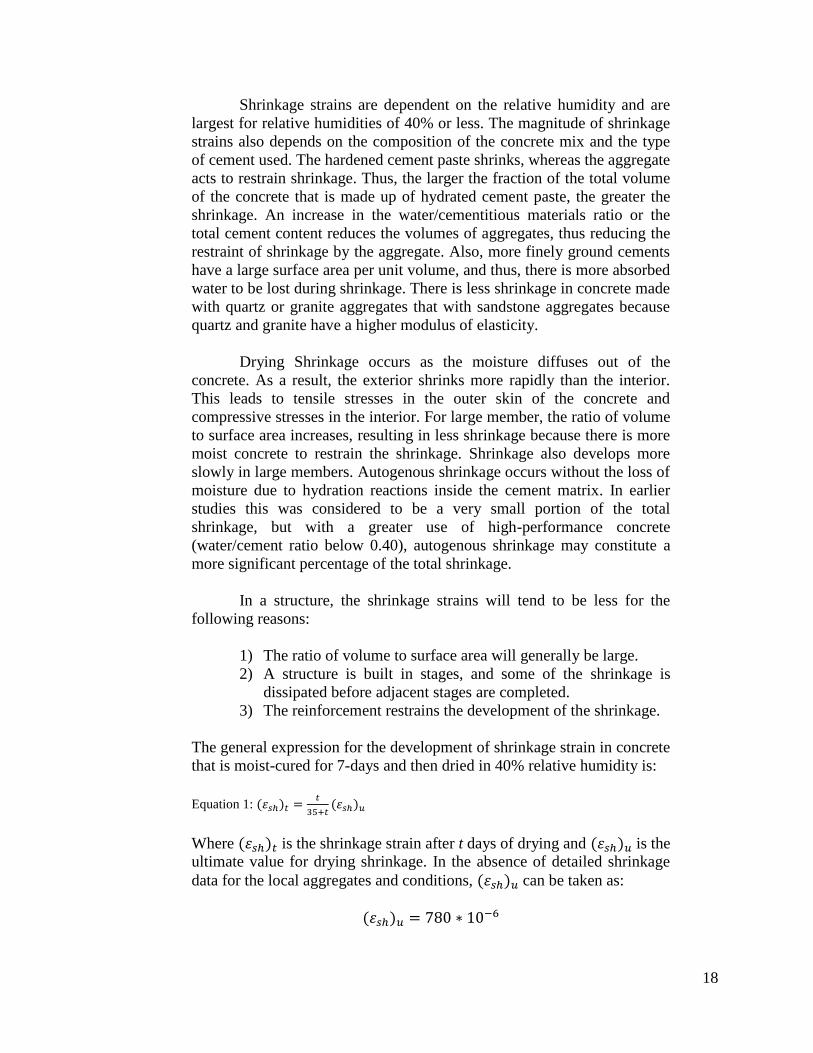
The general expression for the development of shrinkage strain in concrete
that is moist-cured for 7-days and then dried in 40% relative humidity is:
Equation 1: (𝜀𝑠ℎ)𝑡 =𝑡
35+𝑡(𝜀𝑠ℎ)𝑢
Where (𝜀𝑠ℎ)𝑡 is the shrinkage strain after t days of drying and (𝜀𝑠ℎ)𝑢 is the
ultimate value for drying shrinkage. In the absence of detailed shrinkage
data for the local aggregates and conditions, (𝜀𝑠ℎ)𝑢 can be taken as:
(𝜀𝑠ℎ)𝑢 = 780 ∗ 10−6
19
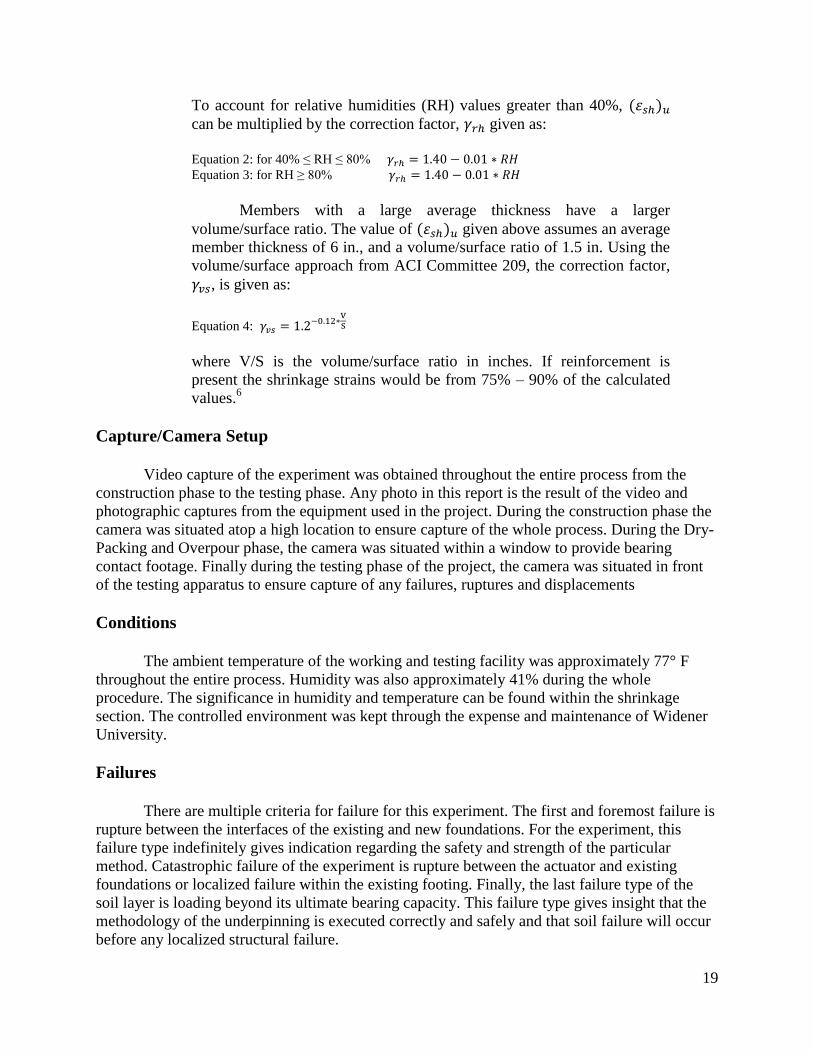
To account for relative humidities (RH) values greater than 40%, (𝜀𝑠ℎ)𝑢
can be multiplied by the correction factor, 𝛾𝑟ℎ given as:
Equation 2: for 40% ≤ RH ≤ 80% 𝛾𝑟ℎ = 1.40 − 0.01 ∗ 𝑅𝐻
Equation 3: for RH ≥ 80% 𝛾𝑟ℎ = 1.40 − 0.01 ∗ 𝑅𝐻
Members with a large average thickness have a larger
volume/surface ratio. The value of (𝜀𝑠ℎ)𝑢 given above assumes an average
member thickness of 6 in., and a volume/surface ratio of 1.5 in. Using the
volume/surface approach from ACI Committee 209, the correction factor,
𝛾𝑣𝑠, is given as:
Equation 4: 𝛾𝑣𝑠 = 1.2−0.12∗V
S
where V/S is the volume/surface ratio in inches. If reinforcement is
present the shrinkage strains would be from 75% – 90% of the calculated
values.6
Capture/Camera Setup
Video capture of the experiment was obtained throughout the entire process from the
construction phase to the testing phase. Any photo in this report is the result of the video and
photographic captures from the equipment used in the project. During the construction phase the
camera was situated atop a high location to ensure capture of the whole process. During the Dry-
Packing and Overpour phase, the camera was situated within a window to provide bearing
contact footage. Finally during the testing phase of the project, the camera was situated in front
of the testing apparatus to ensure capture of any failures, ruptures and displacements
Conditions
The ambient temperature of the working and testing facility was approximately 77° F
throughout the entire process. Humidity was also approximately 41% during the whole
procedure. The significance in humidity and temperature can be found within the shrinkage
section. The controlled environment was kept through the expense and maintenance of Widener
University.
Failures
There are multiple criteria for failure for this experiment. The first and foremost failure is
rupture between the interfaces of the existing and new foundations. For the experiment, this
failure type indefinitely gives indication regarding the safety and strength of the particular
method. Catastrophic failure of the experiment is rupture between the actuator and existing
foundations or localized failure within the existing footing. Finally, the last failure type of the
soil layer is loading beyond its ultimate bearing capacity. This failure type gives insight that the
methodology of the underpinning is executed correctly and safely and that soil failure will occur
before any localized structural failure.
20
Design
The design of the existing foundations, new foundations, soil layer and testing box were
held fundamental to the project’s success. This section will describe the entire design of the
project including the location of sensors, arrangement of the foundations and respective layers
beneath.
Dry-Pack/Overpour: Consistency
Consistency for this project can be defined into two subdivisions; consistency of
the quality of work, as previously discussed, and consistency of the material. The
consistency of material that was used for Dry-Packing procedures can be defined with a
lower water-to-cement ratio: For Dry-Pack the overall texture was the goal for the
material design; that is, a handful of clumped material would crumble when dropped
from shoulder height. For Overpour, the material consistency would resemble that of
flowable concrete; that is a handful of clumped material would putty when dropped from
shoulder height. These textures were a recommendation based on the Industrial Advisors
expertise on the individual procedures. From creating these textures and consistencies it
was determined that the water content per respective procedure was:
Dry-Packing (60 lb. bag of Sakrete):
Water-content = 8.03%
Water/cement ratio) = 0.45
Overpour (80 lb. bag of Quikrete):
Water-content = 9.03%
Water/cement ratio = 0.30
Existing/New Foundation (80 lb. bag of Quikrete):
Water-content = 7.68%
Water/cement ratio = 0.26
These were the designs and consistencies used for the materials of the experiment
Dry-Pack/Overpour: Existing Foundations
The Dry-Pack and Overpour existing foundations were made simultaneously
using the exact same methodology. Both sections resembled a 3’ x 16” x 12” section of
unearthed foundation with a rough, weathered bottom from years of deterioration. The
foundation can be seen below in Figure 3.
21
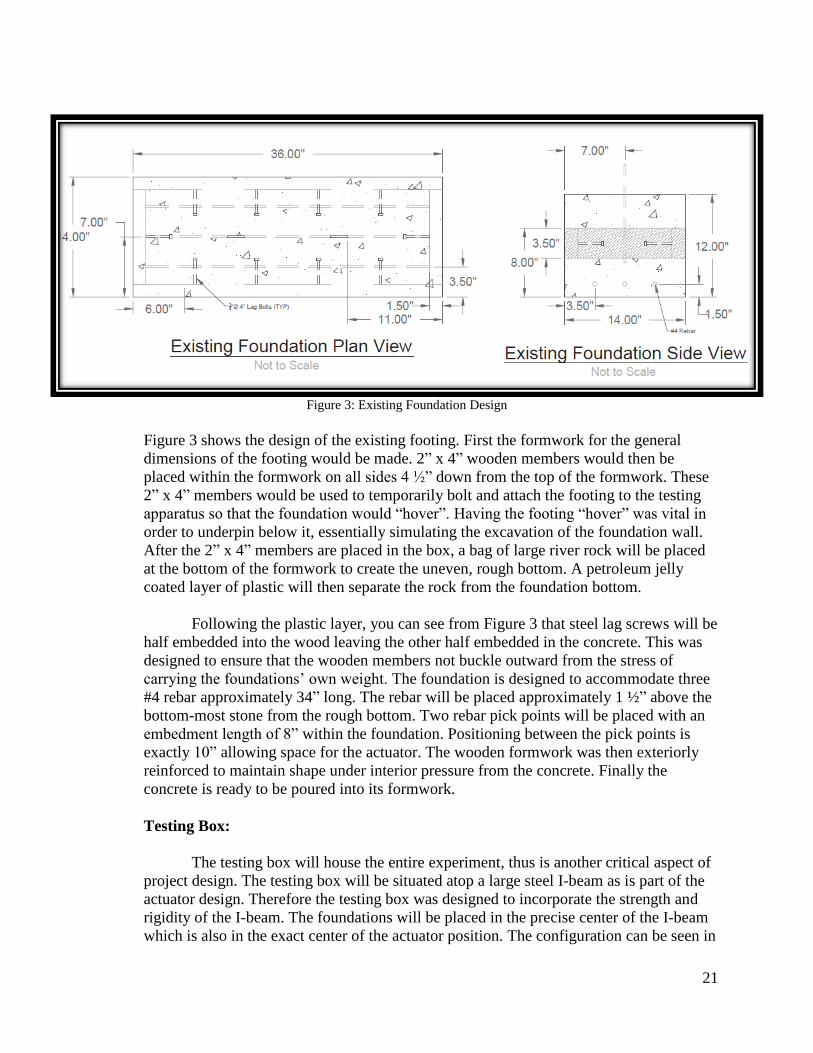
Figure 3: Existing Foundation Design
Figure 3 shows the design of the existing footing. First the formwork for the general
dimensions of the footing would be made. 2” x 4” wooden members would then be
placed within the formwork on all sides 4 ½” down from the top of the formwork. These
2” x 4” members would be used to temporarily bolt and attach the footing to the testing
apparatus so that the foundation would “hover”. Having the footing “hover” was vital in
order to underpin below it, essentially simulating the excavation of the foundation wall.
After the 2” x 4” members are placed in the box, a bag of large river rock will be placed
at the bottom of the formwork to create the uneven, rough bottom. A petroleum jelly
coated layer of plastic will then separate the rock from the foundation bottom.
Following the plastic layer, you can see from Figure 3 that steel lag screws will be
half embedded into the wood leaving the other half embedded in the concrete. This was
designed to ensure that the wooden members not buckle outward from the stress of
carrying the foundations’ own weight. The foundation is designed to accommodate three
#4 rebar approximately 34” long. The rebar will be placed approximately 1 ½” above the
bottom-most stone from the rough bottom. Two rebar pick points will be placed with an
embedment length of 8” within the foundation. Positioning between the pick points is
exactly 10” allowing space for the actuator. The wooden formwork was then exteriorly
reinforced to maintain shape under interior pressure from the concrete. Finally the
concrete is ready to be poured into its formwork.
Testing Box:
The testing box will house the entire experiment, thus is another critical aspect of
project design. The testing box will be situated atop a large steel I-beam as is part of the
actuator design. Therefore the testing box was designed to incorporate the strength and
rigidity of the I-beam. The foundations will be placed in the precise center of the I-beam
which is also in the exact center of the actuator position. The configuration can be seen in
22
Figure 4. The I-beam will provide the load support and vertical stabilization but due to
the width of the foundations, the box design will have to include additional supports to
prevent rotation and lateral stabilization. Two testing boxes were built side-by-side and
designed to be easily removed and relocated since only one fully functioning actuator
was present. The design of the testing box is specifically to meet the conditions present at
the Widener University testing facility.
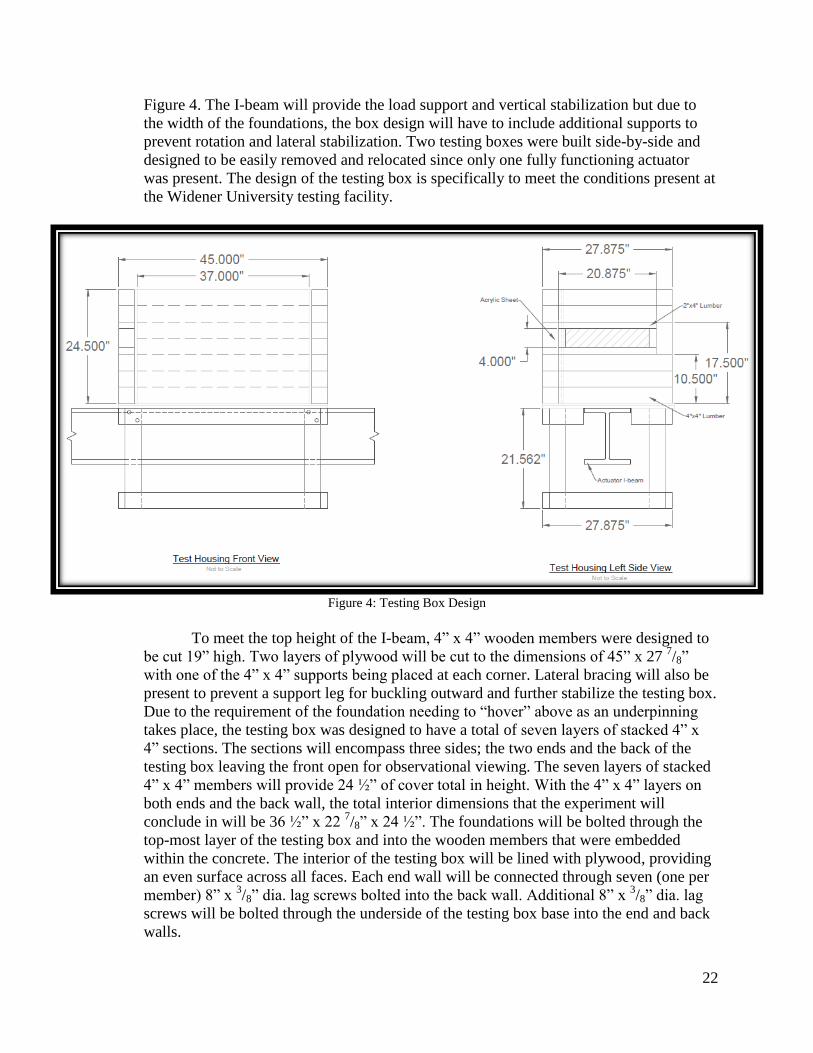
Figure 4: Testing Box Design
To meet the top height of the I-beam, 4” x 4” wooden members were designed to
be cut 19” high. Two layers of plywood will be cut to the dimensions of 45” x 27 7/8”
with one of the 4” x 4” supports being placed at each corner. Lateral bracing will also be
present to prevent a support leg for buckling outward and further stabilize the testing box.
Due to the requirement of the foundation needing to “hover” above as an underpinning
takes place, the testing box was designed to have a total of seven layers of stacked 4” x
4” sections. The sections will encompass three sides; the two ends and the back of the
testing box leaving the front open for observational viewing. The seven layers of stacked
4” x 4” members will provide 24 ½” of cover total in height. With the 4” x 4” layers on
both ends and the back wall, the total interior dimensions that the experiment will
conclude in will be 36 ½” x 22 7/8” x 24 ½”. The foundations will be bolted through the
top-most layer of the testing box and into the wooden members that were embedded
within the concrete. The interior of the testing box will be lined with plywood, providing
an even surface across all faces. Each end wall will be connected through seven (one per
member) 8” x 3/8” dia. lag screws bolted into the back wall. Additional 8” x
3/8” dia. lag
screws will be bolted through the underside of the testing box base into the end and back
walls.
23
The testing box includes a viewing window within an end side. This window will
provide visual confirmation of bearing contact made during the procedure of the
underpinnings. The testing box is designed to provide 4” of viewing space between the
interfaces of the existing foundations and the underpinning. The limits of the window will
begin at 10 ½” to 17 ½” from the bottom of the plywood base. The window will be lined
with 2” x 4” members to provide some internal structural support. The left and right sides
of the window will be constructed with a 4” x 4” member that is twice the width of a
normal layer, essentially creating a viewing window that is a total of two layers thick.
The interior plywood lining will then be cut out to the extents of the 4” x 4” members.
Two ¼” sheets of Acrylic will then be cut the dimensions of the plywood section
removed, but leaving ¼” change in length and width to provide ease of placement.
Finally, to further laterally stabilize the testing box, small 4” x 4” sections will be
attached to either exterior end walls with bolts attaching into the steel I-beam. Figure 4
depicts the layout for the window design and the testing box.
With two actuators present in the laboratory, the testing boxes were originally
designed to be permanent installations until testing was completed. However, due to one
malfunctioning actuator, the testing boxes were required to be easily moved and
dismantled so that the next testing box could be moved into place. Both testing boxes
were constructed simultaneously and built identically with the exact same methods.
Soil Layer:
The soil layer encompassed using a previous senior project conducted at Widener
University. This project gave extensive insight to the characteristics of a soil layer and an
abundance of material to use for the experiment. All data referenced from the soil layer
report can be found in Appendix D. The previously conducted experiment for the soil
layer can be described as well graded clayey gravel. It was found that the optimum
moisture content of the soil layer was 12.0% with an average allowable bearing capacity
of 848.31 psf. The dry density of the soil layer was approximately 116.2 lb./ft3 with
unconfined compressive and shear strengths of 6.85 and 3.425 psi respectively. For the
testing box, it was decided that a 6 ¾” layer of the soil, with a tolerance of ± ¼”, will be
sufficient to allow some flexural freedom. Using the interior dimensions of the testing
box, 36 ½” x 22 7/8” x 6 ¾”, the total volume was calculated for two soil layers; one for
each box. The volume and weight calculations for the soil layers can be found in
Equations 2 and 3:
(36.5∗22.875∗6.75)∗2
1728= 6.52 𝑐𝑢𝑏𝑖𝑐 𝑓𝑒𝑒𝑡 Eq. (2)
6.52 𝑐𝑓 ∗ 116.2 𝑝𝑐𝑓 = 757.97 𝑙𝑏𝑠. ≈ 900.00 𝑙𝑏𝑠. Eq. (3)
Equation 2 represents the volume of soil required for two testing boxes with
known interior dimensions. From this calculation, 6.52 ft3 of soil is required to obtain a 6
¾” soil layer for both testing boxes. With a known dry density of 116.2 lb./ft3, Equation 3
shows the total weight of required soil for two testing boxes; 757.97 lbs. This value was
24
increased to 900.00 lbs. to ensure an excess of quantity produced. Equation 4 shows the
calculation for the weight of water required to obtain 12.0% moisture content for the total
amount of soil.
900.00 ∗ 0.12 = 108.00 𝑙𝑏𝑠. Eq. (4)
From Equation 4, the weight of water required to obtain the optimum moisture
content of 12.0% as defined from the soil layer report was calculated to be 108.00 lbs.
This optimum moisture content is used only to provide the greatest compaction for the
experiment. To evenly and efficiently compact the layers of soil, a large industrial
vibration compactor will be used for both testing boxes. To provide compaction in the
ends and corners of the testing box, the soil will be compressed manually by impacting
the locations with a 10 lb. weight. After compaction is achieved, in-situ testing will be
performed on the soil layers in 6 locations; I-beam center/left/right and testing box
center/left/right. This will ensure similar strength characteristics of the soil. The ASTM
Standard Sand Cone Test will also be performed to measure the unit weight of the soil.
Dry-Pack: New Foundation
The general dry packing procedures follow:
1.) Excavate in sections around the existing footing down to bedrock or very
densely compacted soil
2.) Provide the necessary formwork for pouring a concrete base while
supplying a small 2 - 3” layer for grout/cement mix
3.) Pour the concrete into its formwork and let set overnight
4.) Take the grout/cement mix and densely compact (or “Dry-Pack”) the
material using an 3-ft long 2” x 4” wooden beam and an 4 - 6 lb. hammer
into the remaining layer between the new and existing foundations
5.) Remove the formwork backfill the remaining excavation site.
The Dry-Pack new foundation was designed to mimic the dimensions of existing
foundation as would be done in the field. Therefore the new foundation dimensions will
be 36 ½” x 16” x 6 ½”. This will provide exact coverage of load transfer from the
existing foundations to the new foundations. An addition 2” of clearance was provided
between the new and existing foundations for the Dry-Packing procedure. The new
foundation will be casted inside the built testing box atop the soil layer with the existing
foundation above set in place. The new foundation will also be reinforced using #4 rebar
with 1 ½” of clearance from the soil layer and 4” on center from rebar to rebar. The rebar
will be 34” long so that adequate coverage can be achieved around the reinforcement.
Taking advantage of the interior testing box dimensions, construction of one wall will be
necessary to produce the new foundation formwork. The formwork will consist of a 36
½” x 6 ½” section of plywood with three 6 ½” x 2” x 4” member reinforcements to
maintain shape. The concrete will cure for approximately 3-days before the Dry-Packing
procedure begins. The new foundation can be seen in Figure 5:
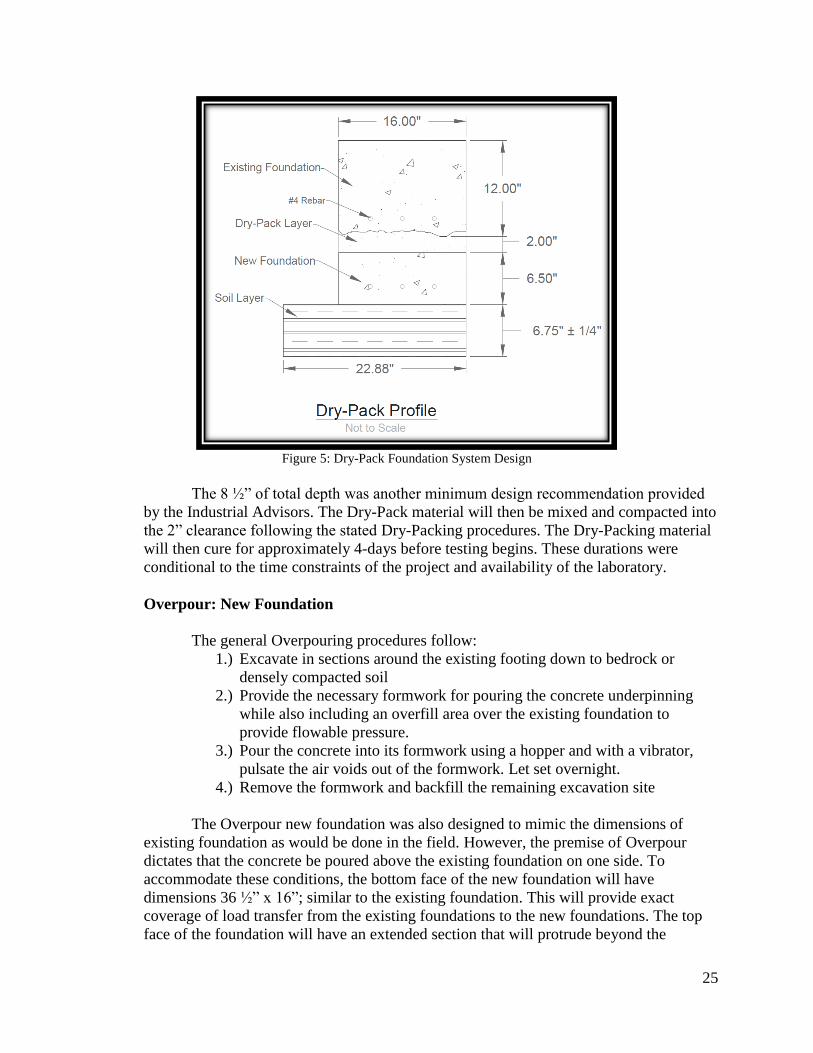
25
Figure 5: Dry-Pack Foundation System Design
The 8 ½” of total depth was another minimum design recommendation provided
by the Industrial Advisors. The Dry-Pack material will then be mixed and compacted into
the 2” clearance following the stated Dry-Packing procedures. The Dry-Packing material
will then cure for approximately 4-days before testing begins. These durations were
conditional to the time constraints of the project and availability of the laboratory.
Overpour: New Foundation
The general Overpouring procedures follow:
1.) Excavate in sections around the existing footing down to bedrock or
densely compacted soil
2.) Provide the necessary formwork for pouring the concrete underpinning
while also including an overfill area over the existing foundation to
provide flowable pressure.
3.) Pour the concrete into its formwork using a hopper and with a vibrator,
pulsate the air voids out of the formwork. Let set overnight.
4.) Remove the formwork and backfill the remaining excavation site
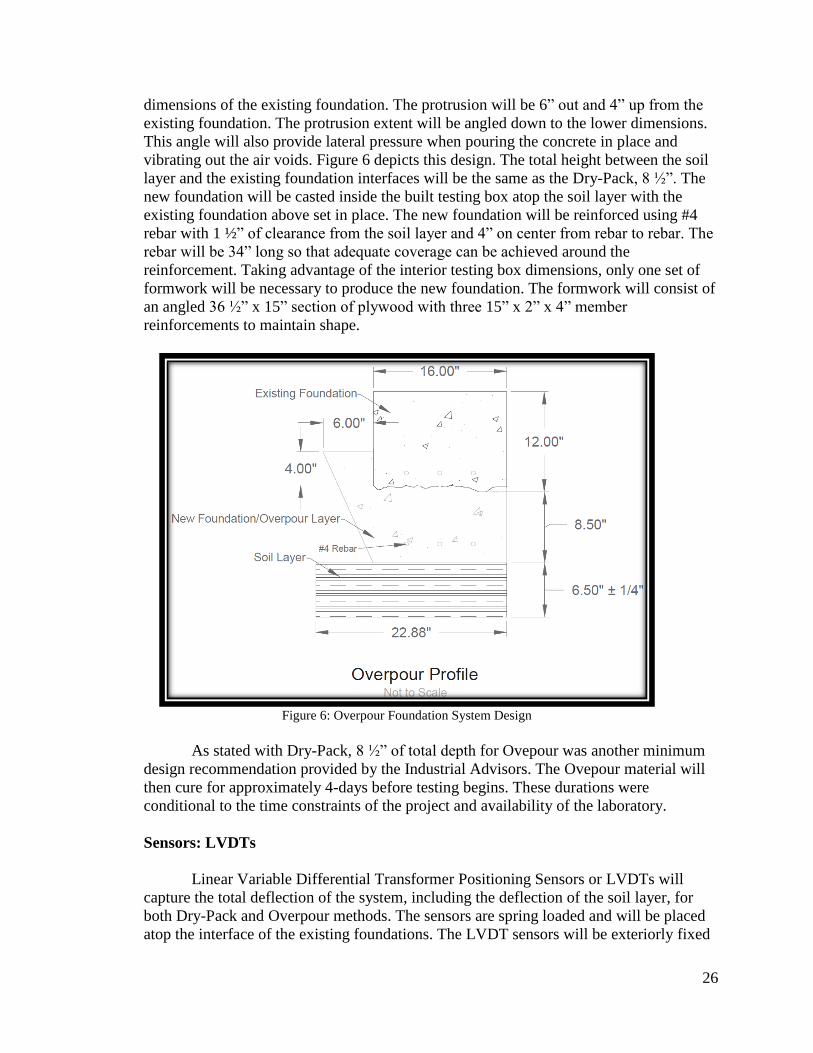
The Overpour new foundation was also designed to mimic the dimensions of
existing foundation as would be done in the field. However, the premise of Overpour
dictates that the concrete be poured above the existing foundation on one side. To
accommodate these conditions, the bottom face of the new foundation will have
dimensions 36 ½” x 16”; similar to the existing foundation. This will provide exact
coverage of load transfer from the existing foundations to the new foundations. The top
face of the foundation will have an extended section that will protrude beyond the
26
dimensions of the existing foundation. The protrusion will be 6” out and 4” up from the
existing foundation. The protrusion extent will be angled down to the lower dimensions.
This angle will also provide lateral pressure when pouring the concrete in place and
vibrating out the air voids. Figure 6 depicts this design. The total height between the soil
layer and the existing foundation interfaces will be the same as the Dry-Pack, 8 ½”. The
new foundation will be casted inside the built testing box atop the soil layer with the
existing foundation above set in place. The new foundation will be reinforced using #4
rebar with 1 ½” of clearance from the soil layer and 4” on center from rebar to rebar. The
rebar will be 34” long so that adequate coverage can be achieved around the
reinforcement. Taking advantage of the interior testing box dimensions, only one set of
formwork will be necessary to produce the new foundation. The formwork will consist of
an angled 36 ½” x 15” section of plywood with three 15” x 2” x 4” member
reinforcements to maintain shape.
Figure 6: Overpour Foundation System Design
As stated with Dry-Pack, 8 ½” of total depth for Ovepour was another minimum
design recommendation provided by the Industrial Advisors. The Ovepour material will
then cure for approximately 4-days before testing begins. These durations were
conditional to the time constraints of the project and availability of the laboratory.
Sensors: LVDTs
Linear Variable Differential Transformer Positioning Sensors or LVDTs will
capture the total deflection of the system, including the deflection of the soil layer, for
both Dry-Pack and Overpour methods. The sensors are spring loaded and will be placed
atop the interface of the existing foundations. The LVDT sensors will be exteriorly fixed
27
and unable to deflect regardless of what occurs in the system. There will be two LVDT
sensors placed on the front and back ends of the foundation. Due to the nature of the
sensors, the sampling rate for LVDTs will be fixed at 1,653 SPS or Samples per Second.
Sensors: Pressure Cell
Pressure Cell Sensors will also be utilized in this experiment to measure the
transfer of load into the soil layers. The Pressure Cell measures the transfer of load by
detecting miniscule changes in an electric current travelling through the sensor. The
Pressure Cell Sensors will be buried approximately 1” into the soil layer and will be
located in the precise center of the foundation system and under the linear actuator
loader. The maximum capacities of the Pressure Cells are approximately 39 psi. Due to
the nature of the sensors, the sampling rate for Pressure Cells will be fixed at 1,653 SPS.
Sensors: LDC1000EVM
The Texas Instruments LDC1000EVM Sensors measure the relative change
displacement and inductance over time. The LDC non-contact sensors emit an electric
field from a solenoid and detect objects within the field as long as it conducts electricity.
These sensors do not correlate and exact change in distance with a change in inductance
but provide a change in “proximity” to the sensor. The change in “proximity” is
dependent on the material being used and its distance between the solenoid. For this
experiment copper targets will be used, as copper is a very good conductor of electricity.
The copper targets will be placed at the very edge of the measured electrical field. The
targets will then be attached to the new foundations while the LDC sensors will be
mounted to the existing foundations. Using the freely supplied Graphic User Interface
software or GUI, the LDC sensors will measure the relative change in displacements
between the new and existing foundations through “proximity”. If bearing contact is
altered between the foundations, a change in proximity will be captured in the GUI
software. The software GUI version utilized for this experiment will be 1.0.4.1.
Three sensors will be used for each method of Dry-Pack and Overpour. One
sensor will be placed in the middle of the foundation between the new and existing
interfaces. The remaining two LDC sensors will be 6” on-center from left and right sides
of the center sensor. This will provide bearing contact coverage across the length of the
interfaces showing any uneven displacements. All three sensors will be operating at once
with a sampling rate of 500 SPS.
Sensors: MTS Actuator
The MTS Hydraulic Actuator provides internal sensors for load and displacement.
The actuator will be utilized to transfer load into the foundation system and to graph the
total load versus displacement. The actuator will be placed precisely in the center of the
foundation system atop of the existing footing. Due to the nature of the MTS Actuator,
the sampling rate will be fixed at 500 SPS and the loading rate fixed at 0.01 kip/min.
28
ASTM Standards
The following ASTM Standard Procedures were followed throughout the course/portions
of the experiment:
ASTM D1556 / D1556M – 15: “Standard Test Method for Density and Unit Weight of
Soil in Place by Sand-Cone Method”
ASTM C192 / C192M – 07: “Standard Practice for Making and Curing Concrete Test
Specimens in the Laboratory”
ASTM C143 / C143M – 12: “Standard Test Method for Slump of Hydraulic-Cement
Concrete”
ASTM C827 / C827M – 10: “Standard Test Method for Change in Height at Early Ages
of Cylindrical Specimens of Cementitious Mixtures”
ASTM E2835 – 11: “Standard Test Method for Measuring Deflections using a Portable
Impulse Plate Load Test Device”
ASTM C918 / C918M – 13: “Standard Test Method for Measuring Early-Age
Compressive Strength and Projecting Later-Age Strength”
ASTM C387: “Standard Specifications for Packaged, Dry, Combined Materials for
Mortar and Concrete”
Cylinders
Five ASTM Standard Cylinders were created to indicate strengths of the concrete mixes
for both existing and new foundations. An additional two cylinders will be created to indicate
strengths of the Dry-Packing material. Six non-standard cylinders were created with an
arrangement similar to that of the conditions of the foundation system tests. Three cylinders were
cast with concrete filled halfway, cured, filled with Overpour material the remaining half and
cured to 7-day compressive strength. The three remaining cylinders were produced utilizing the
same methodology but Dry-Packing material was used in place of the Overpour material.
Alternative Designs
For the experiment, multiple testing box designs and altercations were considered for
implementation. There were three different designs; each encompassing an alternate scope of the
project. The first alternative design relocated the testing box inside a large soil pit approximately
5’ in height. The second design moved the testing box to the concrete floor with a soil layer
incorporated. The third and final alternative design removed the current soil layers from the
testing procedures.
The first alternative design was considered to implement an entire 5’ deep soil box into
the experimentation. The soil box was already constructed, as it was a senior project completed
in recent years. The same soil in the soil box would be used for the final design of the
experiment. This profile would provide the most realistic conditions that would present out in the
field and would also be the most complicated design to implement. It is due to its complexity and
production of unknowns that this design was not selected for the experiment. With the creation
29
of too many unknowns and the presence of too many complexities, a direct answer or correlation
would have been extremely difficult to make.
The second design moved the testing box to the concrete floor of the lab. This was to
provide an even rigid surface with a soil layer and was developed before consideration of the
steel I-beam. The purpose of this testing design was to eliminate any lateral or horizontal
instability while removing any additional vertical support system. This design was not
considered due to the infeasibility of relocating the linear actuators and providing sufficient
structural support with the applied loads.
The third alternative design was devised to completely remove the soil layers from the
scope of the experiment. Removing the soil layer would eliminate all variables and would
simulate failures in the interfaces of bearing contact. This method however failed to produce any
field conditions and lacked practicality. This is due to the fact that the load is directly absorbed
into the steel I-beam, essentially giving the environment of bedrock which in most circumstances
is unreasonable to reach.
A typical cross-section of a foundation can be referenced in Appendix E. This cross-
section was used to develop and design the foundation that was used for this experiment. It was
with recommendation from the Industrial Advisors that the footings be modelled in this manner.
Displacement/Pressure/Load
When the data acquisition software plots the load versus displacement graph, bearing
contact failure can be seen through abrupt changes in slope; either negative or leveling slopes.
This shows that there is an increase of displacement without an increase of sustained load.
Pressure versus displacement will be graphed to show the relationship between load transferred
into the soil layer and the displacement of the system. For bearing contact failure to occur, the
same relationship would be present in the load versus displacement graph. It is the maintaining
of the initial bearing contact that this project aims to test.
30
Experimental Procedures
The procedures listed are in order as they were completed throughout the project. All of
the supplies and materials used for construction of the major components can be found within
local home improvement stores. In most cases, the supplies and materials used could be
substituted with an equal or better alternative.
Existing Foundation
The first major component that had to be built was the existing concrete
foundation formwork. From a single 5/8” x 4’ x 8’ sheet of plywood sections were cut to
the needed dimensions. The shorter sides of the formwork were cut 1 ¼” longer than
needed. This was to allow the short sides to overlap the ends of the longer sides. The
bottom plate was cut 1 ¼” wider and longer, to allow the sides to rest on the bottom plate.
Using 1 5/8” decking screws, the sides were attached to each other, as seen in Figure 7.
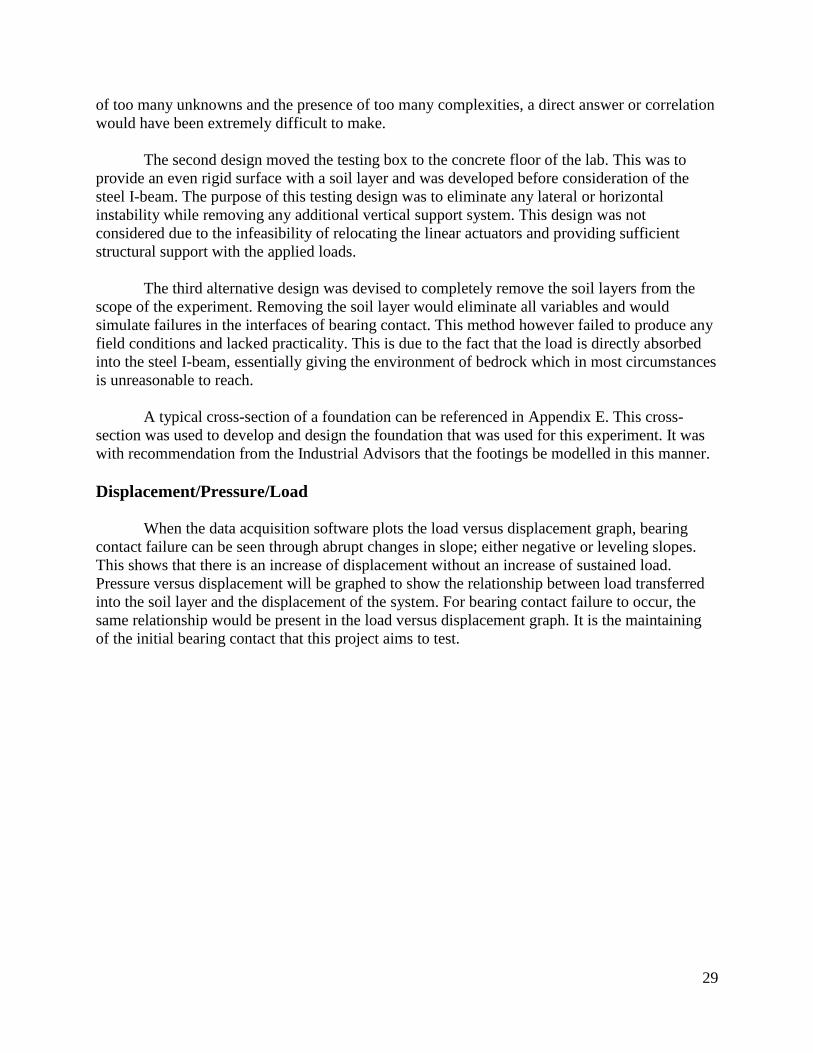
Figure 7: Shows the formwork assemble process
The holes are pre-drilled before each screw was placed. The drill bit should be smaller
than the thickness of the screw so that the screw has significant grip. The purpose of pre-
drilling is to reduce cracking and splitting of the plywood. The four sides are screwed
together first, then attached to the bottom plate. Starting in one corner secure the sides to
the bottom, then at the opposite corner secure the sides to the bottom insuring that the
box is square in all four corners. Once the box is square continue adding screws every
two to three inches. ¾ of the way up each side were the two sides meet add a 1 ½” x 1
½” metal angle bracket. The metal brackets are attached to the box using ½” screws, no
pre-drilling is required.
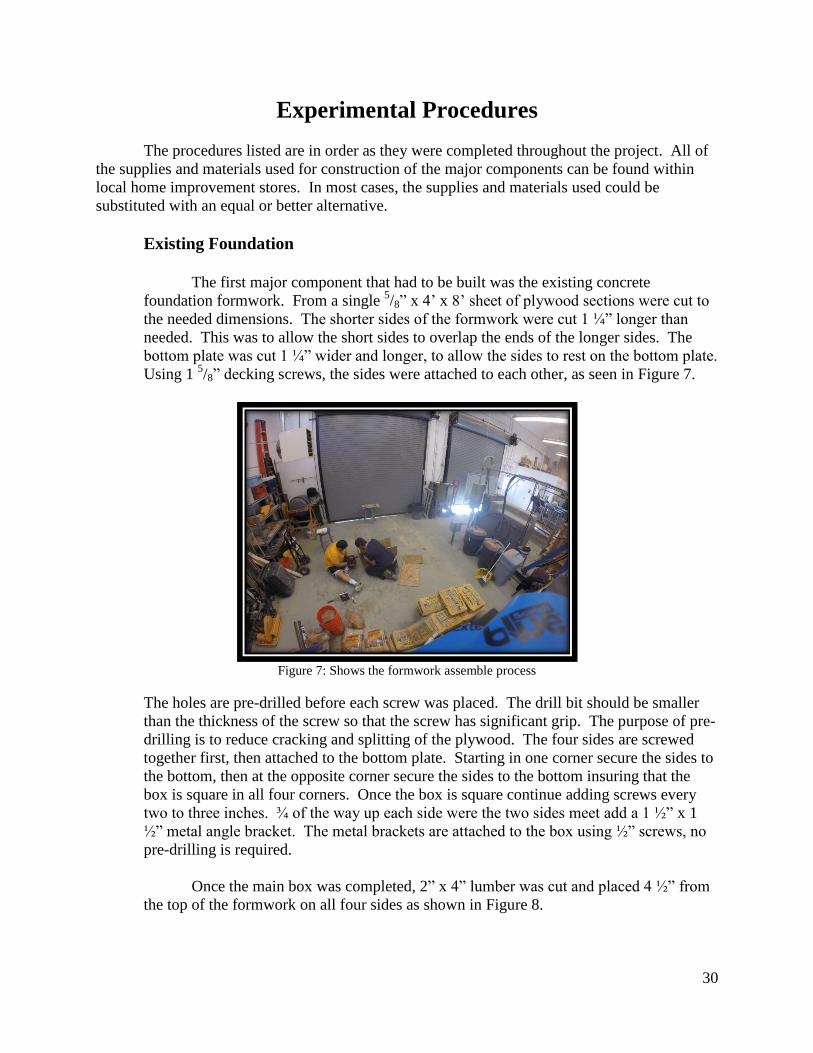
Once the main box was completed, 2” x 4” lumber was cut and placed 4 ½” from
the top of the formwork on all four sides as shown in Figure 8.
31
Figure 8: Shows the interior 2” x 4” lumber installation
The lumber was attached to the interior of the box from the outside, so the wood would
be left embedded in the concrete. The 2” x 4” lumber was cut so it would run the extent
of the longer side of the box and the short ends would fit between.
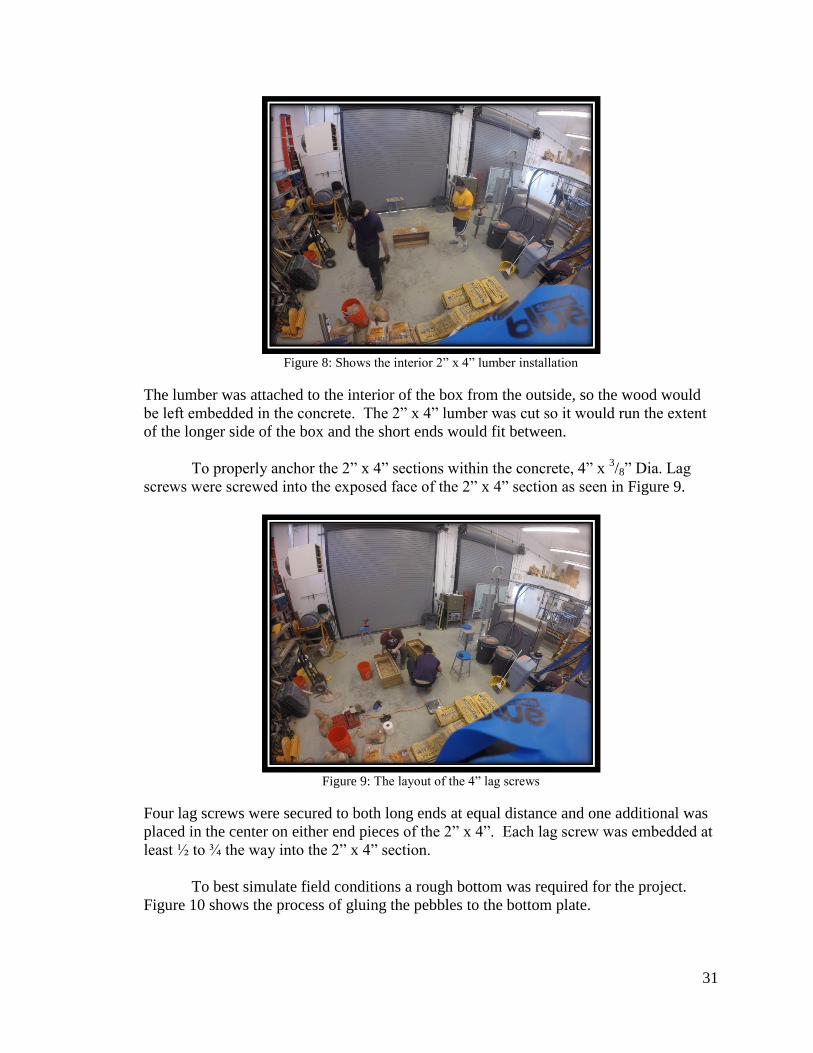
To properly anchor the 2” x 4” sections within the concrete, 4” x 3/8” Dia. Lag
screws were screwed into the exposed face of the 2” x 4” section as seen in Figure 9.
Figure 9: The layout of the 4” lag screws
Four lag screws were secured to both long ends at equal distance and one additional was
placed in the center on either end pieces of the 2” x 4”. Each lag screw was embedded at
least ½ to ¾ the way into the 2” x 4” section.
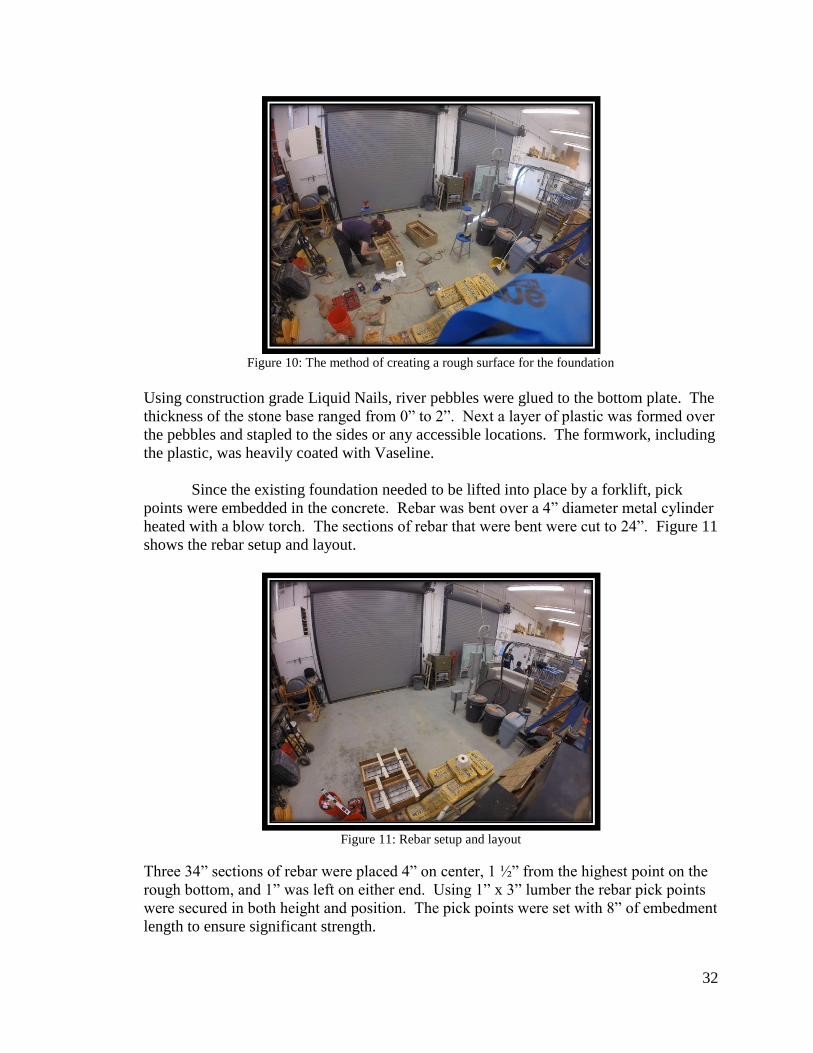
To best simulate field conditions a rough bottom was required for the project.
Figure 10 shows the process of gluing the pebbles to the bottom plate.
32
Figure 10: The method of creating a rough surface for the foundation
Using construction grade Liquid Nails, river pebbles were glued to the bottom plate. The
thickness of the stone base ranged from 0” to 2”. Next a layer of plastic was formed over
the pebbles and stapled to the sides or any accessible locations. The formwork, including
the plastic, was heavily coated with Vaseline.
Since the existing foundation needed to be lifted into place by a forklift, pick
points were embedded in the concrete. Rebar was bent over a 4” diameter metal cylinder
heated with a blow torch. The sections of rebar that were bent were cut to 24”. Figure 11
shows the rebar setup and layout.
Figure 11: Rebar setup and layout
Three 34” sections of rebar were placed 4” on center, 1 ½” from the highest point on the
rough bottom, and 1” was left on either end. Using 1” x 3” lumber the rebar pick points
were secured in both height and position. The pick points were set with 8” of embedment
length to ensure significant strength.
33
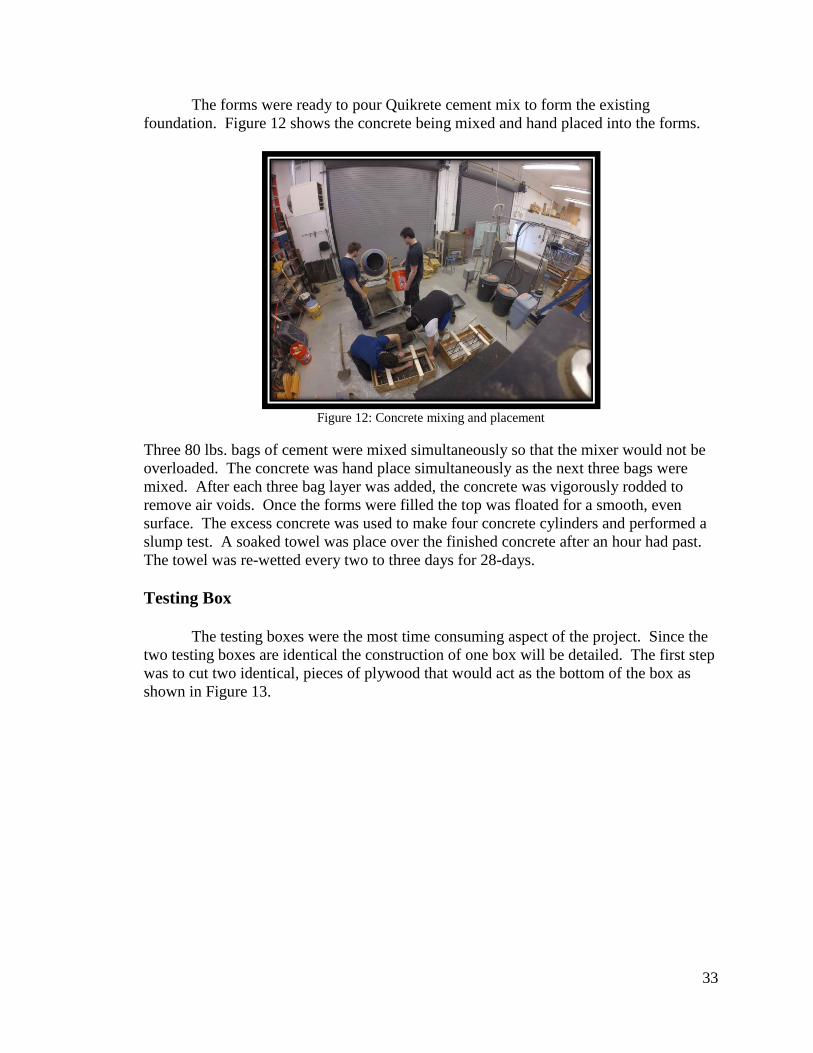
The forms were ready to pour Quikrete cement mix to form the existing
foundation. Figure 12 shows the concrete being mixed and hand placed into the forms.
Figure 12: Concrete mixing and placement
Three 80 lbs. bags of cement were mixed simultaneously so that the mixer would not be
overloaded. The concrete was hand place simultaneously as the next three bags were
mixed. After each three bag layer was added, the concrete was vigorously rodded to
remove air voids. Once the forms were filled the top was floated for a smooth, even
surface. The excess concrete was used to make four concrete cylinders and performed a
slump test. A soaked towel was place over the finished concrete after an hour had past.
The towel was re-wetted every two to three days for 28-days.
Testing Box
The testing boxes were the most time consuming aspect of the project. Since the
two testing boxes are identical the construction of one box will be detailed. The first step
was to cut two identical, pieces of plywood that would act as the bottom of the box as
shown in Figure 13.
34
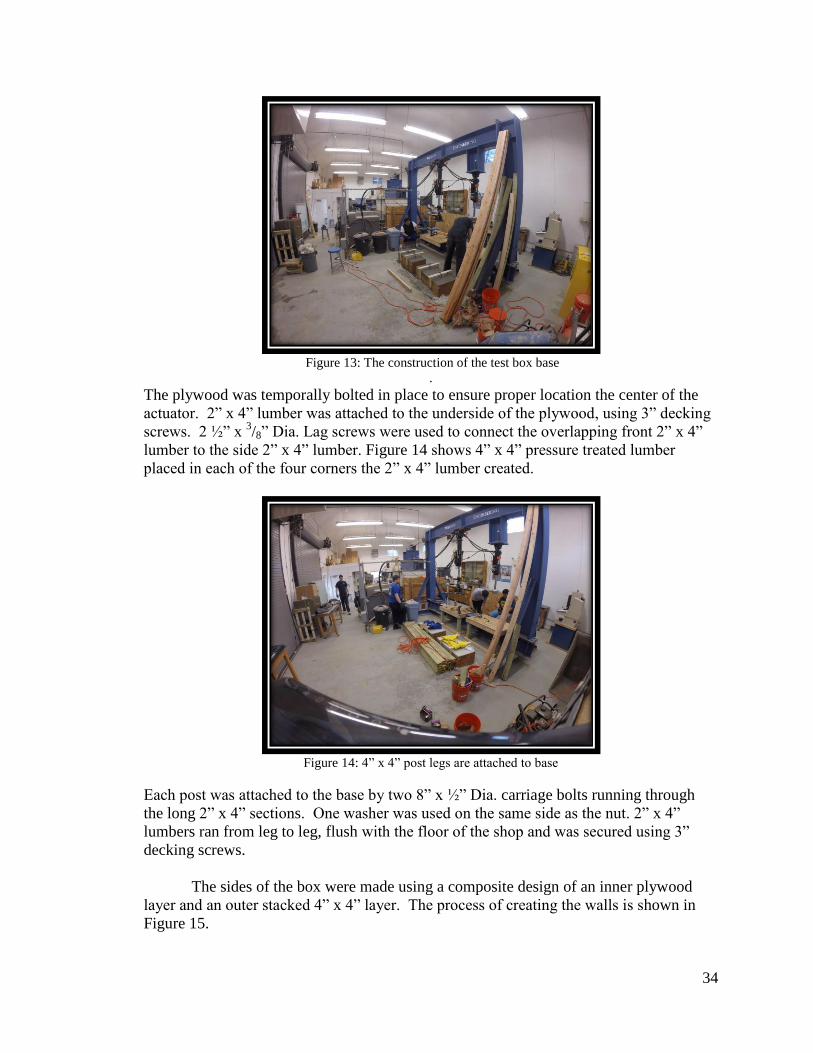
Figure 13: The construction of the test box base
.
The plywood was temporally bolted in place to ensure proper location the center of the
actuator. 2” x 4” lumber was attached to the underside of the plywood, using 3” decking
screws. 2 ½” x 3/8” Dia. Lag screws were used to connect the overlapping front 2” x 4”
lumber to the side 2” x 4” lumber. Figure 14 shows 4” x 4” pressure treated lumber
placed in each of the four corners the 2” x 4” lumber created.
Figure 14: 4” x 4” post legs are attached to base
Each post was attached to the base by two 8” x ½” Dia. carriage bolts running through
the long 2” x 4” sections. One washer was used on the same side as the nut. 2” x 4”
lumbers ran from leg to leg, flush with the floor of the shop and was secured using 3”
decking screws.
The sides of the box were made using a composite design of an inner plywood
layer and an outer stacked 4” x 4” layer. The process of creating the walls is shown in
Figure 15.
35
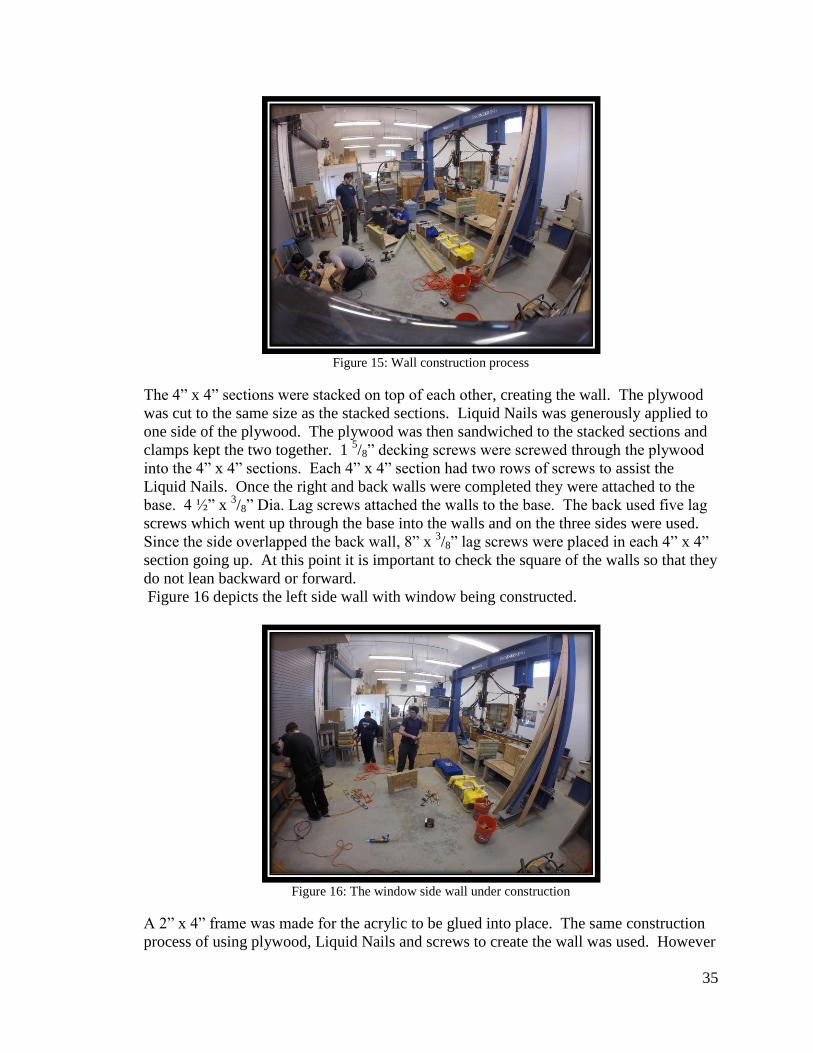
Figure 15: Wall construction process
The 4” x 4” sections were stacked on top of each other, creating the wall. The plywood
was cut to the same size as the stacked sections. Liquid Nails was generously applied to
one side of the plywood. The plywood was then sandwiched to the stacked sections and
clamps kept the two together. 1 5/8” decking screws were screwed through the plywood
into the 4” x 4” sections. Each 4” x 4” section had two rows of screws to assist the
Liquid Nails. Once the right and back walls were completed they were attached to the
base. 4 ½” x 3/8” Dia. Lag screws attached the walls to the base. The back used five lag
screws which went up through the base into the walls and on the three sides were used.
Since the side overlapped the back wall, 8” x 3/8” lag screws were placed in each 4” x 4”
section going up. At this point it is important to check the square of the walls so that they
do not lean backward or forward.
Figure 16 depicts the left side wall with window being constructed.
Figure 16: The window side wall under construction
A 2” x 4” frame was made for the acrylic to be glued into place. The same construction
process of using plywood, Liquid Nails and screws to create the wall was used. However
36
the 2” x 4” frame was placed in the center of the wall with two 4” x 4” sections on top
and three 4” x 4” sections below. The window was centered horizontally in the wall. On
either side of the 2” x 4” frame was a vertical 4” x 4” section. The plywood was cut out
around the window area. Using a special cutting tool, two ¼” thick acrylic sheets were
cut to the proper size. The sheets were stacked on top other and holes were carefully
drilled in each corner. A bead of Liquid Nails was placed around the 2” x 4” frame and
the first pane was put in place. A second bead of Liquid Nails was placed on the first
acrylic layer. The second piece of acrylic was layered on top of the already in place
piece. The holes were lined up and screws were put in place to help secure the two layers
of acrylic together. The window wall was attached to the base using the same hardware
and methods. The front to the testing box was cut from plywood and placed using
screws.
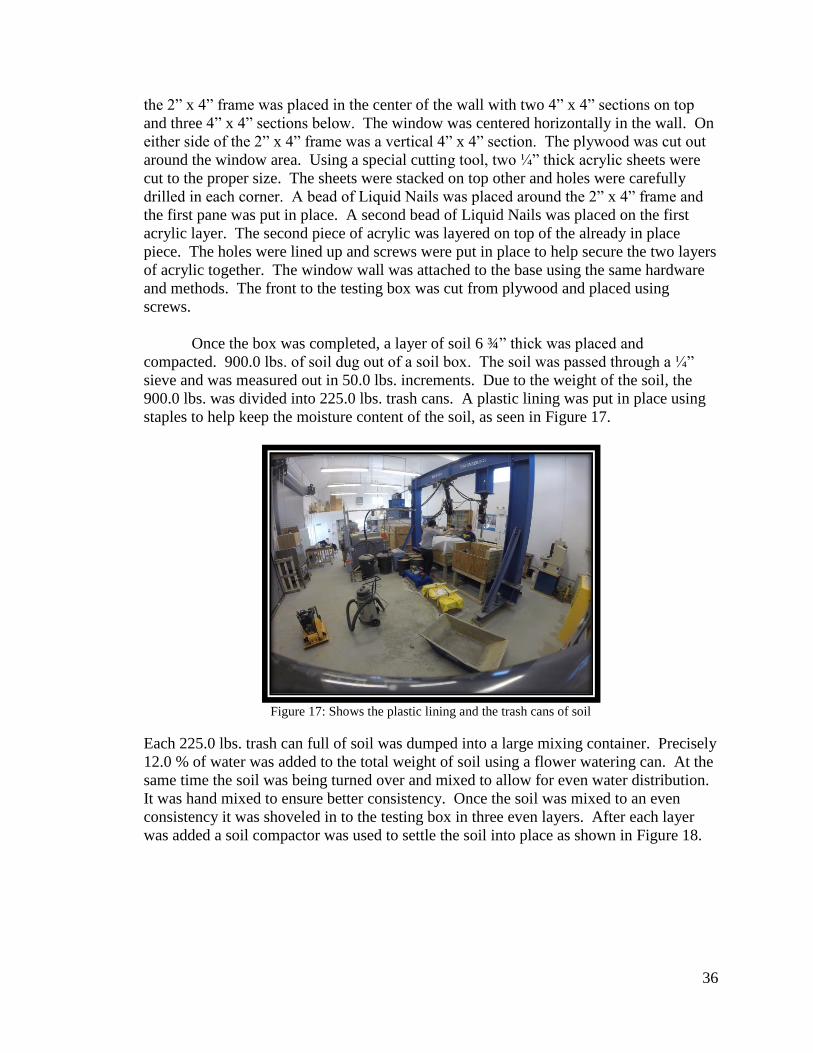
Once the box was completed, a layer of soil 6 ¾” thick was placed and
compacted. 900.0 lbs. of soil dug out of a soil box. The soil was passed through a ¼”
sieve and was measured out in 50.0 lbs. increments. Due to the weight of the soil, the
900.0 lbs. was divided into 225.0 lbs. trash cans. A plastic lining was put in place using
staples to help keep the moisture content of the soil, as seen in Figure 17.
Figure 17: Shows the plastic lining and the trash cans of soil
Each 225.0 lbs. trash can full of soil was dumped into a large mixing container. Precisely
12.0 % of water was added to the total weight of soil using a flower watering can. At the
same time the soil was being turned over and mixed to allow for even water distribution.
It was hand mixed to ensure better consistency. Once the soil was mixed to an even
consistency it was shoveled in to the testing box in three even layers. After each layer
was added a soil compactor was used to settle the soil into place as shown in Figure 18.
37
Figure 18: The soil compactor, compacting, the first lift of soil
Each layer was compacted for two minutes. The soil compactor was not able to reach the
sides or corners well. Heavy 10 lbs. metal plates were dropped from a height of 6” to
compact the edges and corners. Once the soil was compacted to the proper height,
samples were taken to confirm the water content. To further check the two soil samples
had close to the same strength an in situ test was performed. The test was performed in
six locations. Three were at the center of the testing box and the other three at the center
of where the existing foundation location. Two were placed at either end of the box and
one directly in the center. Soil pressure cells were embedded into the soil layer. These
sensors were place at the center of the existing foundation. Once the sensor location was
determined, it was traced on the soil layer. Using a small shovel the outline was dug up
to a depth of 1 ½”. The area where the pressure cell sat was made to be level. Once level
the cell was buried and the soil was lightly compacted on top. The soil layer was then
covered with a damp towel and a layer of plastic so the soil would not lose moisture
content.
Dry-Pack Method
The Dry-Pack method required an additional 6 ½” section of concrete to be
poured on top of the soil layer. The formwork for part of the new foundation is shown in
Figure 19.
38
Figure 19: Depicts the formwork for part of the new foundation
The formwork consisted of a section of plywood with a 2” x 4” section of lumber running
the length and two end pieces. Plastic was stapled in place so that the water from the
concrete would not seep into the soil layer, changing the water content. Three 34”
sections of #4 rebar were placed 4” on center and 1 ½” off the bottom of the soil layer.
Quikrete cement mix was mixed in the cement mixer and hand placed in the formwork in
three layers. After each layer was placed, the concrete was vigorously rodded. Once the
formwork was filled, the top was floated for a smooth even surface. After an hour a
soaked towel was placed on top. The towel was re-wetted every two to three days for 28-
days.
The wooden formwork of the existing foundation was stripped away. A forklift
was aligned with the pick points on the foundation. Using a chain on the pick points, the
foundation was leveled as the forklift began to lift it. The forklift carefully maneuvered
the foundation into place. Using the forklifts up and down controls the foundation was
lifted to two to three inches from the top of the new foundation. The existing foundation
was confirmed to be level. The foundation simulated “floating” with a gap between the
new and existing foundation. This was achieved by using 8” x 3/8” Dia. and 6” x
3/8” Dia.
Lag screws. Using the 10” drill bit a pilot hole was drilled for each screw. The screws
went through the outer wall into the embedded 2” x 4” lumber in the existing foundation.
Four of the 8” Lag screws were used per side. The long screws were placed so that they
were embedded into the 2” x 4” running the length of the existing foundation. Two went
into each 2” x 4” directly above of each other. Two additional 6” Lag screws were
placed into the 2” x 4” section located on either side of the foundation. Five 6” lag
screws were placed going through the back into the long 2” x 4” section running across
the back of the foundation. The forklift slowly released tension in the chain.
The main setup of the foundation is now complete and the actual method of Dry-
Pack could be performed. The Dry-Pack material was Sakrete high strength cement mix.
The Sakrete was mixed to a very dry consistency so that a ball will form, but when
dropped would fall apart. Three or four 3-ft sections of 2” x 4” lumber were cut and used
for placing the Dry-Pack material. The Dry-Pack material was added in handfuls until 4”
39
thick of material was added along the entire back of the gap. One of the 2” x 4” sections
was used as a battering ram to compact the material into the voids. A 6 lbs. hammer was
used to strike the end of the 2” x 4” section to further pack the material. Once this layer
is compacted, hand place more material and repeat the process until the gap was
completely filled. A trowel was used to smooth the front of the Dry-Pack material to
reduce voids. When the Dry-Packing is completed take a hose with a spray nozzle and
lightly mist the front of the foundation.
Dry-Pack Test
After a waiting period of four days the Dry-Pack system was ready to be tested.
Sensors had to be placed on the system to detect any failures in the bearing contact
between the new and existing foundations. To capture any small changes at the interface,
Texas Instruments LDC1000EVM sensors were used. These sensors measure proximity
between a metal target and the solenoid. The sensors were arranged as shown is Figure
20.
Figure 20: Displays the LDC1000EVM sensor arrangement for Dry-Pack
The metal target that was used in this experiment was copper. These sensors had to be
completely level and same went for the sensing targets. The center sensor was placed at
the center of the existing foundation, while the two outside sensors were 6” on center
from the center sensor.
The lag screws that held the existing foundation in place while the method was
being completed needed to be removed before the foundation system was tested. The
LVDT and LDC sensors were started prior to the removal of the lag screws. This was to
monitor any movement at the interface upon release of the lag screws. Simultaneously
four lag screws at a time were taken out in a symmetrical pattern.
LVDT displacement sensors were placed on top of the foundation to measure the
total displacement of the Dry-Pack system. One sensor was placed on the front of the
40
foundation directly in the center and the other in the same place but towards the back of
the foundation. The LVDT sensors can be seen in Figure 20. The LVDT sensors were
attached to the end of 2” x 4” sections. The section was attached to a wooden stand that
kept the sensors steady in place.
The actuator used to load the system had a maximum capacity of 35.0 kips shown
in Figure 21.
Figure 21: The actuator specifications
The foundation system was loaded to until failure or the actuator reached its max
capacity. The actuator loaded the foundation slowly with an average speed of a
hundredth of an inch per minute.
Overpour Method
The wooden formwork of the existing foundation was stripped away. A forklift
was aligned with the pick points on the foundation. Using a chain on the pick points, the
foundation was leveled as the forklift began to lift it. The forklift carefully maneuvered
the foundation into place. Using the forklifts up and down controls the foundation was
lifted to 8 ½” from the top of the soil layer. The existing foundation was confirmed to be
level. The foundation simulated “floating” with a gap between the new and existing
foundation. This was achieved by using 8” x 3/8” Dia. and 6” x
3/8” Dia. Lag screws.
Using the 10” drill bit a pilot hole was drilled for each screw. The screws went through
the outer wall into the embedded 2” x 4” lumber in the existing foundation. Four of the
8” Lag screws were used per side. The long screws were placed so that they were
embedded into the 2” x 4” running the length of the existing foundation. Two went into
each 2” x 4” directly above of each other. Two additional 6” Lag screws were placed
into the 2” x 4” section located on either side of the foundation. Five 6” lag screws were
placed going through the back into the long 2” x 4” section running across the back of the
foundation. The forklift slowly released tension in the chain
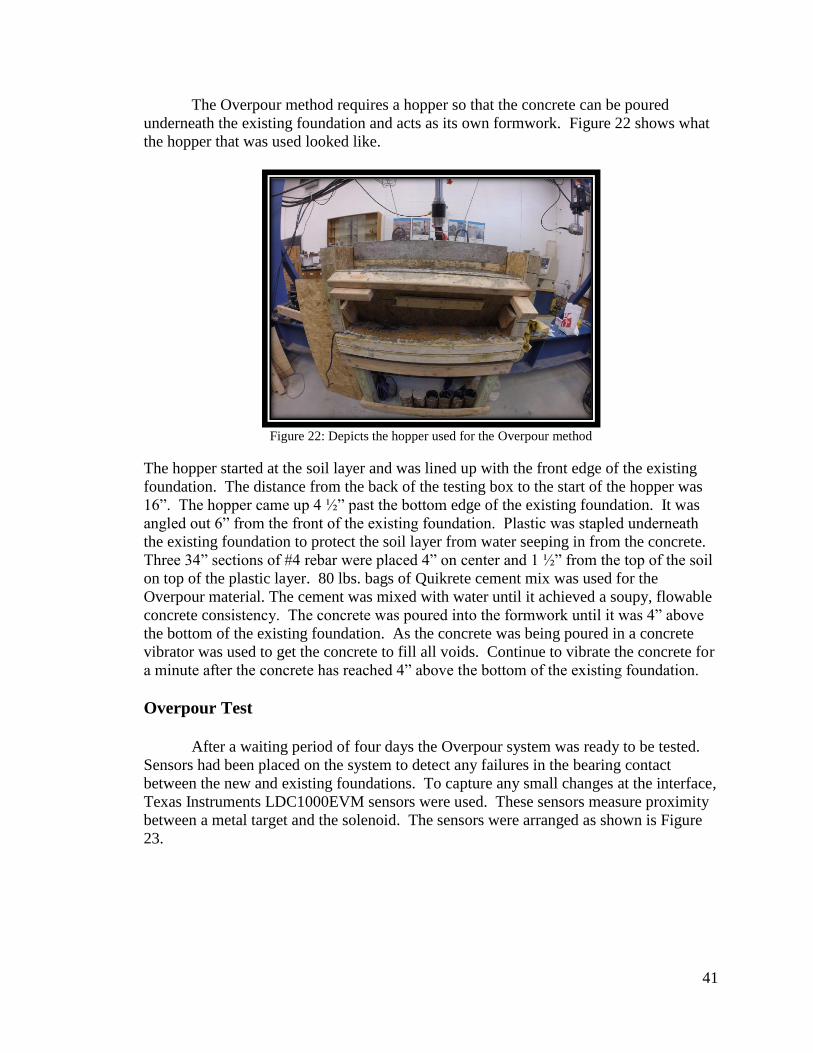
41
The Overpour method requires a hopper so that the concrete can be poured
underneath the existing foundation and acts as its own formwork. Figure 22 shows what
the hopper that was used looked like.
Figure 22: Depicts the hopper used for the Overpour method
The hopper started at the soil layer and was lined up with the front edge of the existing
foundation. The distance from the back of the testing box to the start of the hopper was
16”. The hopper came up 4 ½” past the bottom edge of the existing foundation. It was
angled out 6” from the front of the existing foundation. Plastic was stapled underneath
the existing foundation to protect the soil layer from water seeping in from the concrete.
Three 34” sections of #4 rebar were placed 4” on center and 1 ½” from the top of the soil
on top of the plastic layer. 80 lbs. bags of Quikrete cement mix was used for the
Overpour material. The cement was mixed with water until it achieved a soupy, flowable
concrete consistency. The concrete was poured into the formwork until it was 4” above
the bottom of the existing foundation. As the concrete was being poured in a concrete
vibrator was used to get the concrete to fill all voids. Continue to vibrate the concrete for
a minute after the concrete has reached 4” above the bottom of the existing foundation.
Overpour Test
After a waiting period of four days the Overpour system was ready to be tested.
Sensors had been placed on the system to detect any failures in the bearing contact
between the new and existing foundations. To capture any small changes at the interface,
Texas Instruments LDC1000EVM sensors were used. These sensors measure proximity
between a metal target and the solenoid. The sensors were arranged as shown is Figure
23.
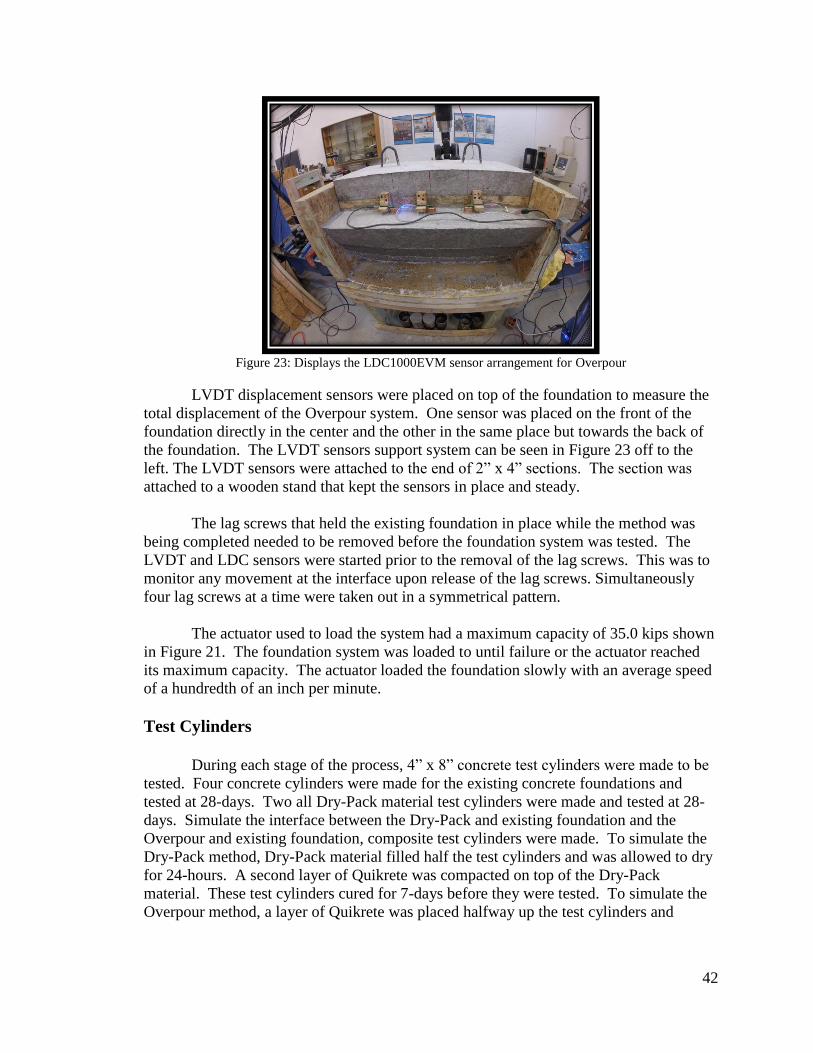
42
Figure 23: Displays the LDC1000EVM sensor arrangement for Overpour
LVDT displacement sensors were placed on top of the foundation to measure the
total displacement of the Overpour system. One sensor was placed on the front of the
foundation directly in the center and the other in the same place but towards the back of
the foundation. The LVDT sensors support system can be seen in Figure 23 off to the
left. The LVDT sensors were attached to the end of 2” x 4” sections. The section was
attached to a wooden stand that kept the sensors in place and steady.
The lag screws that held the existing foundation in place while the method was
being completed needed to be removed before the foundation system was tested. The
LVDT and LDC sensors were started prior to the removal of the lag screws. This was to
monitor any movement at the interface upon release of the lag screws. Simultaneously
four lag screws at a time were taken out in a symmetrical pattern.
The actuator used to load the system had a maximum capacity of 35.0 kips shown
in Figure 21. The foundation system was loaded to until failure or the actuator reached
its maximum capacity. The actuator loaded the foundation slowly with an average speed
of a hundredth of an inch per minute.
Test Cylinders
During each stage of the process, 4” x 8” concrete test cylinders were made to be
tested. Four concrete cylinders were made for the existing concrete foundations and
tested at 28-days. Two all Dry-Pack material test cylinders were made and tested at 28-
days. Simulate the interface between the Dry-Pack and existing foundation and the
Overpour and existing foundation, composite test cylinders were made. To simulate the
Dry-Pack method, Dry-Pack material filled half the test cylinders and was allowed to dry
for 24-hours. A second layer of Quikrete was compacted on top of the Dry-Pack
material. These test cylinders cured for 7-days before they were tested. To simulate the
Overpour method, a layer of Quikrete was placed halfway up the test cylinders and

43
allowed to cure for 24-hours. A second layer of Quikrete was compacted and let cure for
7-days. The concrete cylinder testing machine specifications are shown in Figure 24.
Figure 24: The testing machine for the concrete test cylinders
Each cylinder was loaded until failure and the ultimate pressures and loads were
recorded.
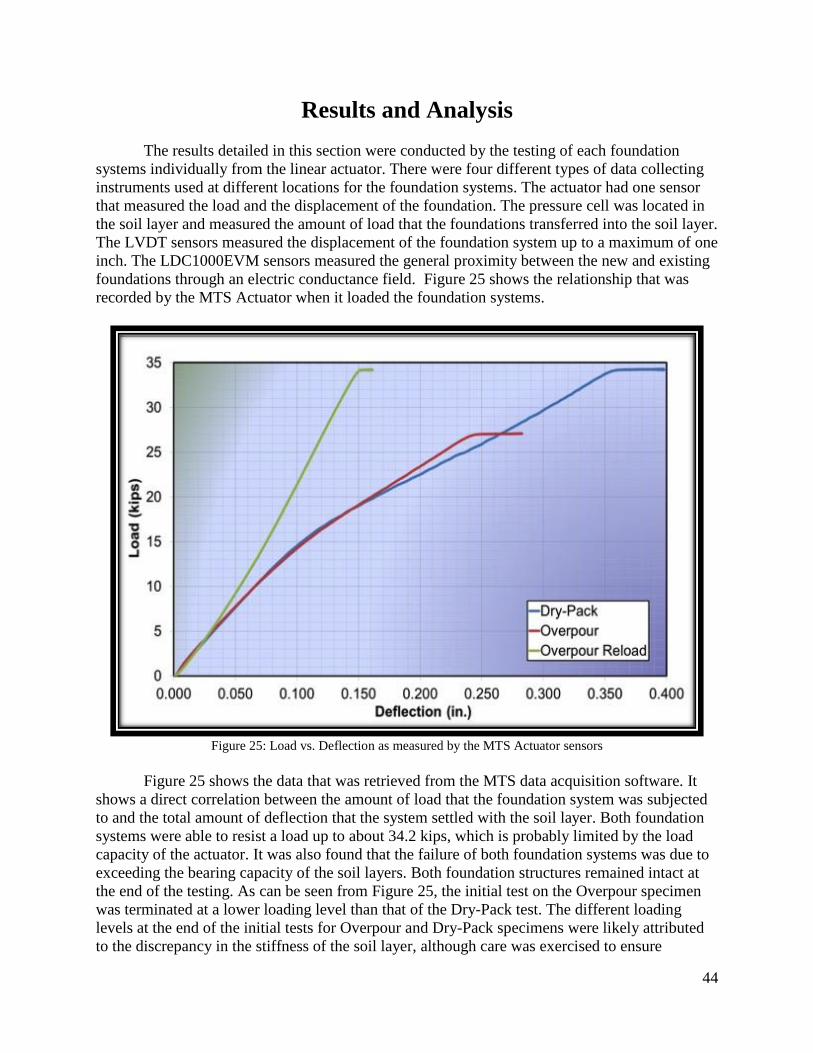
44
Results and Analysis
The results detailed in this section were conducted by the testing of each foundation
systems individually from the linear actuator. There were four different types of data collecting
instruments used at different locations for the foundation systems. The actuator had one sensor
that measured the load and the displacement of the foundation. The pressure cell was located in
the soil layer and measured the amount of load that the foundations transferred into the soil layer.
The LVDT sensors measured the displacement of the foundation system up to a maximum of one
inch. The LDC1000EVM sensors measured the general proximity between the new and existing
foundations through an electric conductance field. Figure 25 shows the relationship that was
recorded by the MTS Actuator when it loaded the foundation systems.
Figure 25: Load vs. Deflection as measured by the MTS Actuator sensors
Figure 25 shows the data that was retrieved from the MTS data acquisition software. It
shows a direct correlation between the amount of load that the foundation system was subjected
to and the total amount of deflection that the system settled with the soil layer. Both foundation
systems were able to resist a load up to about 34.2 kips, which is probably limited by the load
capacity of the actuator. It was also found that the failure of both foundation systems was due to
exceeding the bearing capacity of the soil layers. Both foundation structures remained intact at
the end of the testing. As can be seen from Figure 25, the initial test on the Overpour specimen
was terminated at a lower loading level than that of the Dry-Pack test. The different loading
levels at the end of the initial tests for Overpour and Dry-Pack specimens were likely attributed
to the discrepancy in the stiffness of the soil layer, although care was exercised to ensure
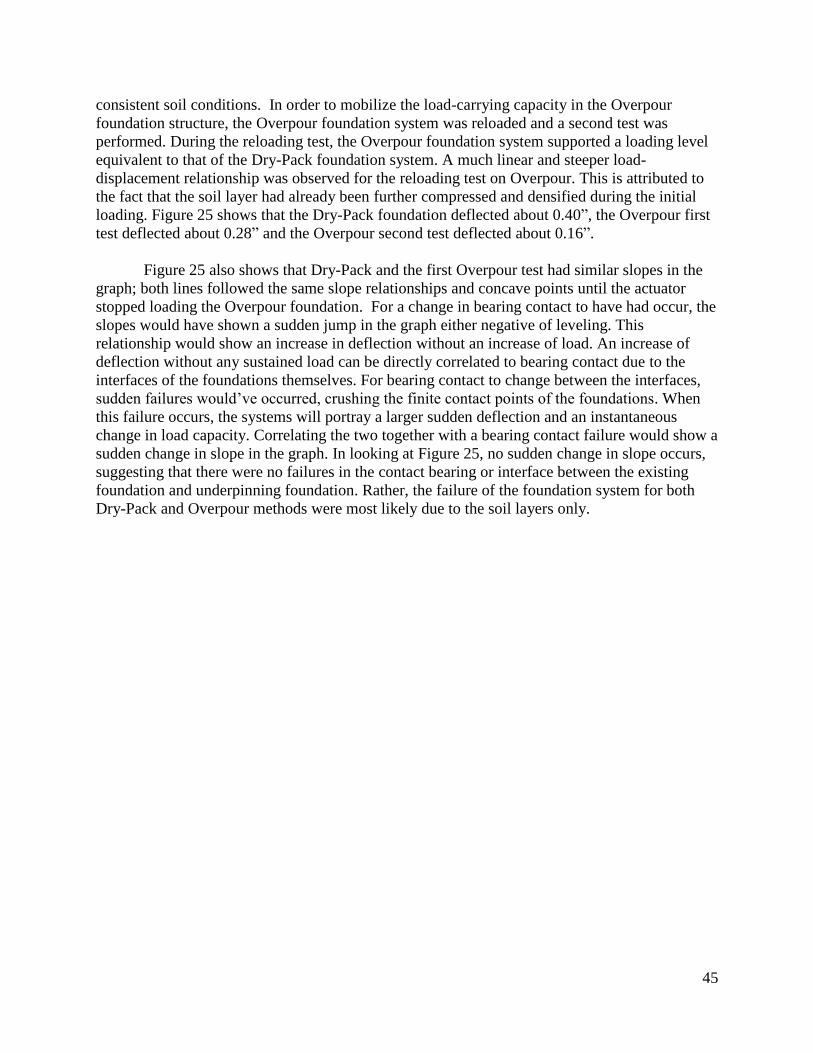
45
consistent soil conditions. In order to mobilize the load-carrying capacity in the Overpour
foundation structure, the Overpour foundation system was reloaded and a second test was
performed. During the reloading test, the Overpour foundation system supported a loading level
equivalent to that of the Dry-Pack foundation system. A much linear and steeper load-
displacement relationship was observed for the reloading test on Overpour. This is attributed to
the fact that the soil layer had already been further compressed and densified during the initial
loading. Figure 25 shows that the Dry-Pack foundation deflected about 0.40”, the Overpour first
test deflected about 0.28” and the Overpour second test deflected about 0.16”.
Figure 25 also shows that Dry-Pack and the first Overpour test had similar slopes in the
graph; both lines followed the same slope relationships and concave points until the actuator
stopped loading the Overpour foundation. For a change in bearing contact to have had occur, the
slopes would have shown a sudden jump in the graph either negative of leveling. This
relationship would show an increase in deflection without an increase of load. An increase of
deflection without any sustained load can be directly correlated to bearing contact due to the
interfaces of the foundations themselves. For bearing contact to change between the interfaces,
sudden failures would’ve occurred, crushing the finite contact points of the foundations. When
this failure occurs, the systems will portray a larger sudden deflection and an instantaneous
change in load capacity. Correlating the two together with a bearing contact failure would show a
sudden change in slope in the graph. In looking at Figure 25, no sudden change in slope occurs,
suggesting that there were no failures in the contact bearing or interface between the existing
foundation and underpinning foundation. Rather, the failure of the foundation system for both
Dry-Pack and Overpour methods were most likely due to the soil layers only.
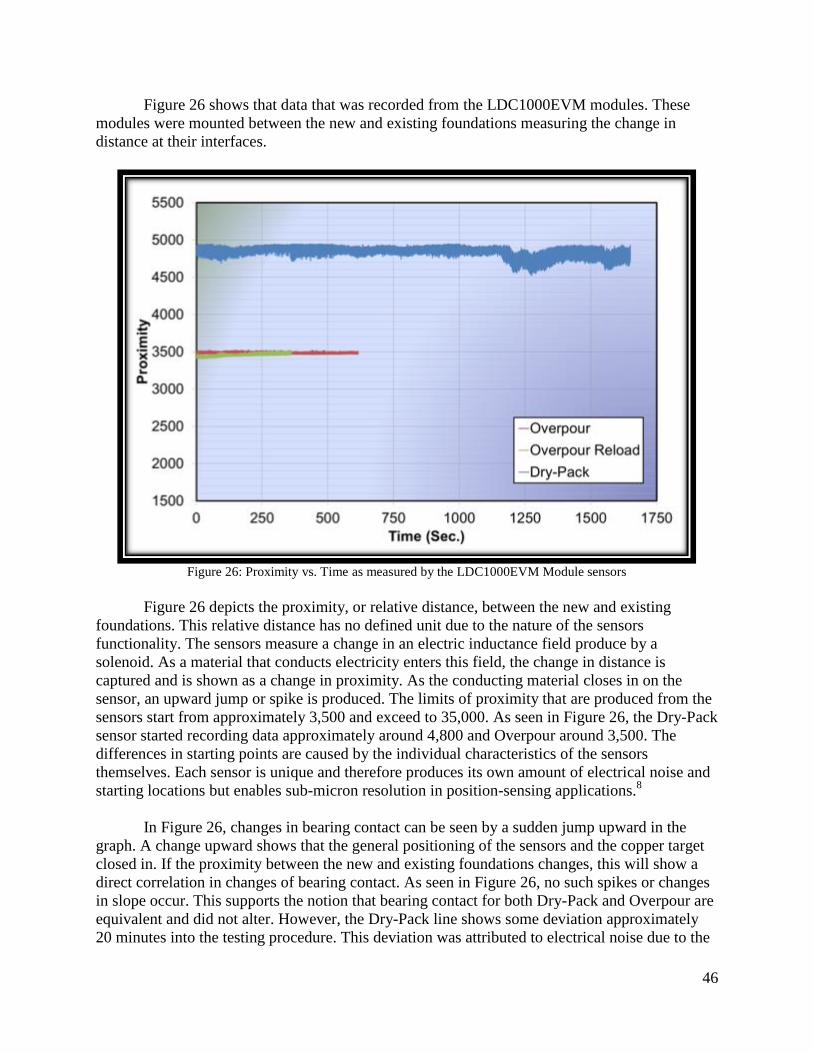
46
Figure 26 shows that data that was recorded from the LDC1000EVM modules. These
modules were mounted between the new and existing foundations measuring the change in
distance at their interfaces.
Figure 26: Proximity vs. Time as measured by the LDC1000EVM Module sensors
Figure 26 depicts the proximity, or relative distance, between the new and existing
foundations. This relative distance has no defined unit due to the nature of the sensors
functionality. The sensors measure a change in an electric inductance field produce by a
solenoid. As a material that conducts electricity enters this field, the change in distance is
captured and is shown as a change in proximity. As the conducting material closes in on the
sensor, an upward jump or spike is produced. The limits of proximity that are produced from the
sensors start from approximately 3,500 and exceed to 35,000. As seen in Figure 26, the Dry-Pack
sensor started recording data approximately around 4,800 and Overpour around 3,500. The
differences in starting points are caused by the individual characteristics of the sensors
themselves. Each sensor is unique and therefore produces its own amount of electrical noise and
starting locations but enables sub-micron resolution in position-sensing applications.8
In Figure 26, changes in bearing contact can be seen by a sudden jump upward in the
graph. A change upward shows that the general positioning of the sensors and the copper target
closed in. If the proximity between the new and existing foundations changes, this will show a
direct correlation in changes of bearing contact. As seen in Figure 26, no such spikes or changes
in slope occur. This supports the notion that bearing contact for both Dry-Pack and Overpour are
equivalent and did not alter. However, the Dry-Pack line shows some deviation approximately
20 minutes into the testing procedure. This deviation was attributed to electrical noise due to the
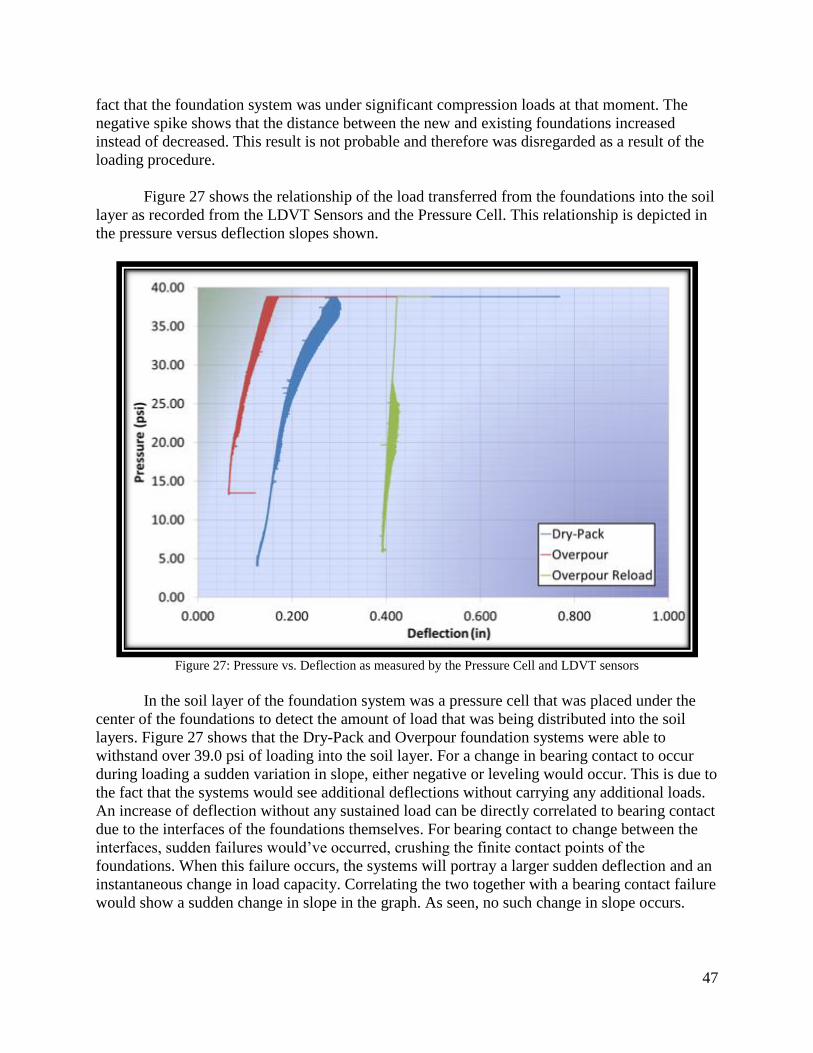
47
fact that the foundation system was under significant compression loads at that moment. The
negative spike shows that the distance between the new and existing foundations increased
instead of decreased. This result is not probable and therefore was disregarded as a result of the
loading procedure.
Figure 27 shows the relationship of the load transferred from the foundations into the soil
layer as recorded from the LDVT Sensors and the Pressure Cell. This relationship is depicted in
the pressure versus deflection slopes shown.
Figure 27: Pressure vs. Deflection as measured by the Pressure Cell and LDVT sensors
In the soil layer of the foundation system was a pressure cell that was placed under the
center of the foundations to detect the amount of load that was being distributed into the soil
layers. Figure 27 shows that the Dry-Pack and Overpour foundation systems were able to
withstand over 39.0 psi of loading into the soil layer. For a change in bearing contact to occur
during loading a sudden variation in slope, either negative or leveling would occur. This is due to
the fact that the systems would see additional deflections without carrying any additional loads.
An increase of deflection without any sustained load can be directly correlated to bearing contact
due to the interfaces of the foundations themselves. For bearing contact to change between the
interfaces, sudden failures would’ve occurred, crushing the finite contact points of the
foundations. When this failure occurs, the systems will portray a larger sudden deflection and an
instantaneous change in load capacity. Correlating the two together with a bearing contact failure
would show a sudden change in slope in the graph. As seen, no such change in slope occurs.
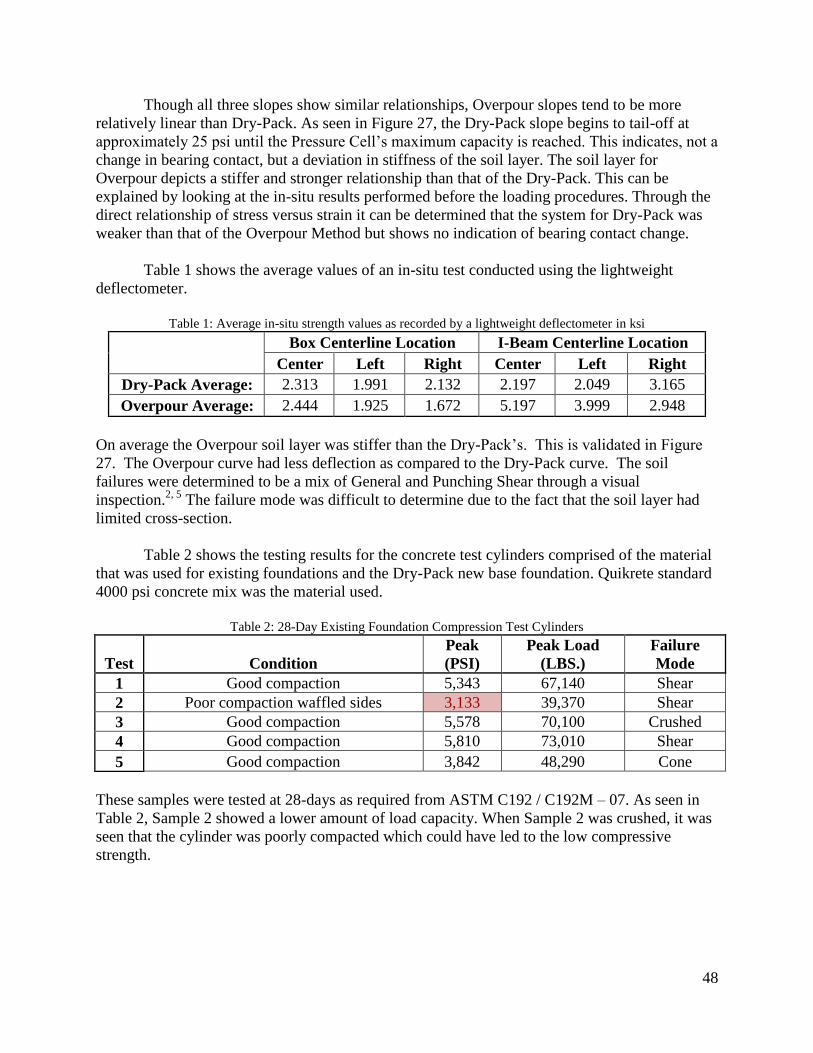
48
Though all three slopes show similar relationships, Overpour slopes tend to be more
relatively linear than Dry-Pack. As seen in Figure 27, the Dry-Pack slope begins to tail-off at
approximately 25 psi until the Pressure Cell’s maximum capacity is reached. This indicates, not a
change in bearing contact, but a deviation in stiffness of the soil layer. The soil layer for
Overpour depicts a stiffer and stronger relationship than that of the Dry-Pack. This can be
explained by looking at the in-situ results performed before the loading procedures. Through the
direct relationship of stress versus strain it can be determined that the system for Dry-Pack was
weaker than that of the Overpour Method but shows no indication of bearing contact change.
Table 1 shows the average values of an in-situ test conducted using the lightweight
deflectometer.
Table 1: Average in-situ strength values as recorded by a lightweight deflectometer in ksi
Box Centerline Location I-Beam Centerline Location
Center Left Right Center Left Right
Dry-Pack Average: 2.313 1.991 2.132 2.197 2.049 3.165
Overpour Average: 2.444 1.925 1.672 5.197 3.999 2.948
On average the Overpour soil layer was stiffer than the Dry-Pack’s. This is validated in Figure
27. The Overpour curve had less deflection as compared to the Dry-Pack curve. The soil
failures were determined to be a mix of General and Punching Shear through a visual
inspection.2, 5
The failure mode was difficult to determine due to the fact that the soil layer had
limited cross-section.
Table 2 shows the testing results for the concrete test cylinders comprised of the material
that was used for existing foundations and the Dry-Pack new base foundation. Quikrete standard
4000 psi concrete mix was the material used.
Table 2: 28-Day Existing Foundation Compression Test Cylinders
Test Condition
Peak
(PSI)
Peak Load
(LBS.)
Failure
Mode
1 Good compaction 5,343 67,140 Shear
2 Poor compaction waffled sides 3,133 39,370 Shear
3 Good compaction 5,578 70,100 Crushed
4 Good compaction 5,810 73,010 Shear
5 Good compaction 3,842 48,290 Cone
These samples were tested at 28-days as required from ASTM C192 / C192M – 07. As seen in
Table 2, Sample 2 showed a lower amount of load capacity. When Sample 2 was crushed, it was
seen that the cylinder was poorly compacted which could have led to the low compressive
strength.
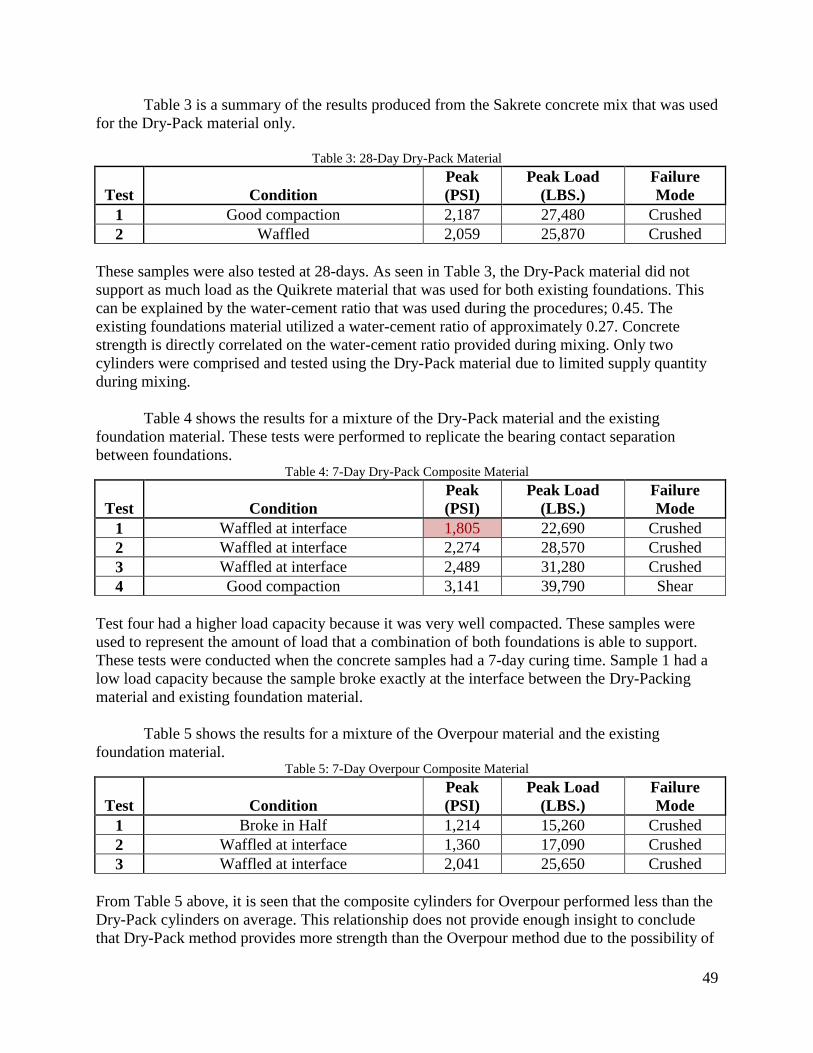
49
Table 3 is a summary of the results produced from the Sakrete concrete mix that was used
for the Dry-Pack material only.
Table 3: 28-Day Dry-Pack Material
Test Condition
Peak
(PSI)
Peak Load
(LBS.)
Failure
Mode
1 Good compaction 2,187 27,480 Crushed
2 Waffled 2,059 25,870 Crushed
These samples were also tested at 28-days. As seen in Table 3, the Dry-Pack material did not
support as much load as the Quikrete material that was used for both existing foundations. This
can be explained by the water-cement ratio that was used during the procedures; 0.45. The
existing foundations material utilized a water-cement ratio of approximately 0.27. Concrete
strength is directly correlated on the water-cement ratio provided during mixing. Only two
cylinders were comprised and tested using the Dry-Pack material due to limited supply quantity
during mixing.
Table 4 shows the results for a mixture of the Dry-Pack material and the existing
foundation material. These tests were performed to replicate the bearing contact separation
between foundations. Table 4: 7-Day Dry-Pack Composite Material
Test Condition
Peak
(PSI)
Peak Load
(LBS.)
Failure
Mode
1 Waffled at interface 1,805 22,690 Crushed
2 Waffled at interface 2,274 28,570 Crushed
3 Waffled at interface 2,489 31,280 Crushed
4 Good compaction 3,141 39,790 Shear
Test four had a higher load capacity because it was very well compacted. These samples were
used to represent the amount of load that a combination of both foundations is able to support.
These tests were conducted when the concrete samples had a 7-day curing time. Sample 1 had a
low load capacity because the sample broke exactly at the interface between the Dry-Packing
material and existing foundation material.
Table 5 shows the results for a mixture of the Overpour material and the existing
foundation material. Table 5: 7-Day Overpour Composite Material
Test Condition
Peak
(PSI)
Peak Load
(LBS.)
Failure
Mode
1 Broke in Half 1,214 15,260 Crushed
2 Waffled at interface 1,360 17,090 Crushed
3 Waffled at interface 2,041 25,650 Crushed
From Table 5 above, it is seen that the composite cylinders for Overpour performed less than the
Dry-Pack cylinders on average. This relationship does not provide enough insight to conclude
that Dry-Pack method provides more strength than the Overpour method due to the possibility of
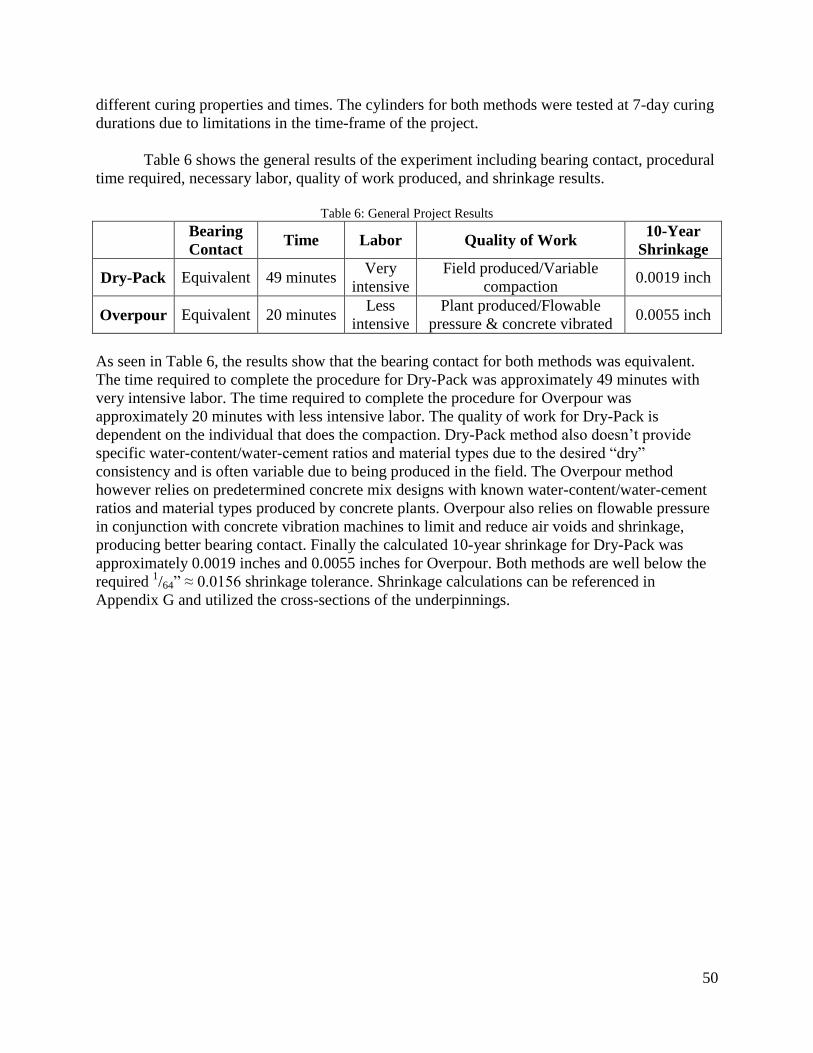
50
different curing properties and times. The cylinders for both methods were tested at 7-day curing
durations due to limitations in the time-frame of the project.
Table 6 shows the general results of the experiment including bearing contact, procedural
time required, necessary labor, quality of work produced, and shrinkage results.
Table 6: General Project Results
Bearing
Contact Time Labor Quality of Work
10-Year
Shrinkage
Dry-Pack Equivalent 49 minutes Very
intensive
Field produced/Variable
compaction 0.0019 inch
Overpour Equivalent 20 minutes Less
intensive
Plant produced/Flowable
pressure & concrete vibrated 0.0055 inch
As seen in Table 6, the results show that the bearing contact for both methods was equivalent.
The time required to complete the procedure for Dry-Pack was approximately 49 minutes with
very intensive labor. The time required to complete the procedure for Overpour was
approximately 20 minutes with less intensive labor. The quality of work for Dry-Pack is
dependent on the individual that does the compaction. Dry-Pack method also doesn’t provide
specific water-content/water-cement ratios and material types due to the desired “dry”
consistency and is often variable due to being produced in the field. The Overpour method
however relies on predetermined concrete mix designs with known water-content/water-cement
ratios and material types produced by concrete plants. Overpour also relies on flowable pressure
in conjunction with concrete vibration machines to limit and reduce air voids and shrinkage,
producing better bearing contact. Finally the calculated 10-year shrinkage for Dry-Pack was
approximately 0.0019 inches and 0.0055 inches for Overpour. Both methods are well below the
required 1/64” ≈ 0.0156 shrinkage tolerance. Shrinkage calculations can be referenced in
Appendix G and utilized the cross-sections of the underpinnings.
51
Conclusion
The objective of this project was to compare the relatively new and untested Overpour
method to the performance of the current industry common practice, Dry-Pack method.
Overpour is considered successful if its performance in bearing contact, time, labor, consistency
and shrinkage is equivalent or better than the Dry-Pack. The Overpour method has the potential
to be implemented into construction practices to help reduce project costs and increase the
efficiency of underpinning. Both methods were conducted and evaluated by applying quasi-static
load tests on two full-scale, three-foot section foundations.
The conditions of success for Overpour method were met within the project. It is evident
that from Figures 25 – 27 bearing contact for both Dry-Pack and Overpour methods were
maintained. As load increased to the ultimate load of 34.0 kips a steady curve was developed for
both procedures. For bearing contact to fail within one method, a sudden negative jump or
leveling in slope on the graph would be present. It is clear that no such jump or change in slope
is present on the graph supporting the premise that Dry-Pack and Overpour provide equivalent
bearing performance beyond reasonable loading conditions.
In the category of time performance, it is apparent that Overpour method reduces the
required working time for Dry-Pack method. For the industry common practice of Dry-Pack, the
procedures were completed within 49 minutes whereas the procedures for Overpour took 20
minutes of working time. In addition, Overpour significantly reduces the labor required to
perform the underpinning method. The difference in working time and reduction in labor
provides capital gains within foundation underpinning projects. For the time and labor criteria,
Overpour surpasses the performance of the Dry-Pack method.
Due to the fact that Dry-Pack method relies on individual quality of work, it tends to be
an inconsistent method of underpinning. On the other hand, Overpour relies on the flowable
pressure provided by Overpouring concrete above the foundation wall. It is this pressure in
conjunction with the concrete vibrator that minimizes air voids which produce sufficient bearing
contact. Shrinkage for both methods remains infinitesimal and therefore is not a major concern in
foundation underpinning. It should be pointed out that shrinkage is influenced by many factors
such as the conditions that are present during the curing process, the thickness of concrete layer
and the reinforcement provided.
Based on all of the previously defined performance criteria, it is evident that Overpour is
equivalent to the Dry-Pack method in terms of bearing contact, load-carrying capacity, and
resistance to shrinkage. Additionally, Overpour outperforms Dry-Pack in reduction of labor, time
efficiency and consistency. Overpour was therefore deemed a more optimal and cost-effective
process for shallow foundation underpinning.
52
Recommendations
After completing the Comparison of Dry-Pack vs. Overpour project, several
recommendations have been noted. The purpose of these recommendations is to improve ease of
construction, total time expended, and results. The project was considered a success; however
there are multiple ways to conduct the project.
The constraints of Widener University’s Civil Engineering Laboratory equipment did not
allow the foundation systems to be loaded to failure. The actuator that was used for loading the
foundation systems had a maximum capacity of 35.0 kips. It is recommended that a larger
capacity actuator be used when loading the foundations. The actuator would need to have a
calculated capacity that could fail the concrete foundations. The ultimate loading capacity of
each method could be compared to better determine the overall strengths of each method. The
failure mode of each method would show weaknesses and strengths.
The experiments were conducted using a soil layer to better represent field conditions.
However for better testing results it is recommended that the foundation systems be conducted
without a soil layer. Eliminating the soil layer would reduce the amount of unknowns in the
project. The LVDT’s that were positioned on the top of the foundation could have detected
failures in the bearing contact in conjunction with the LDC1000EVMs. However the soil layer
compressed and could have concealed any minor changes in distance related to the critical
interface.
The concrete mixer that was used to mix the cement for the Overpour method had a max
capacity of three 80 lbs. bags. Usually, all of the Overpour cement is mixed in one batch and is
continuously poured into the formwork. It is recommended that a larger capacity concrete mixer
be used to mix all concrete in one batch. This would reduce the total time of the Overpour
method since, mixing the cement is one step in the method. Using a large enough mixers would
better replicate how the method would be conducted in the field.
After conducting the foundation underpinning project it is recommended that the same
sampling rate for all sensors be consistent. The sampling rate for the LVDT’s and the soil
pressure cell was 1,653 SPS (Sample per Second). Whereas the MTS actuator and the
LDC1000EVM’s sampling rate was 500 SPS. This difference in sampling rates made it
extremely difficult to compare the MTS data to the LVDT data. Using the same sampling rate, a
better comparison of the data could have been made.
It is recommended that different sensors be used at the interface between the new and
existing foundation. The LDC1000EVM’s only measure proximity to a conductive target.
There is no direct way to calculate exact distance from the raw data. Better sensors could
enhance the data and ensure that no movement occurred.
The rebar design that was implemented in the Dry-Pack and Overpour methods had three
sections located near the bottom. Rebar is not typically required but is added to connect the
sections together. Utilizing a different rebar design could reduce shrinkage in the concrete as it
53
cures. Rebar could be placed evenly throughout the foundation cross-section possibly further
reducing the amount of overall shrinkage.
To fully capture every aspect of each method, more cameras could be set up at key
locations. A second and third window could be added in the back and right side of the box for
better viewing. These visual results could show if the material is, in fact, filling all voids.
Finally, one recommendation is to include more cylinder test specimens to provide more
accurate and quantifiable data to compare the methods and materials.
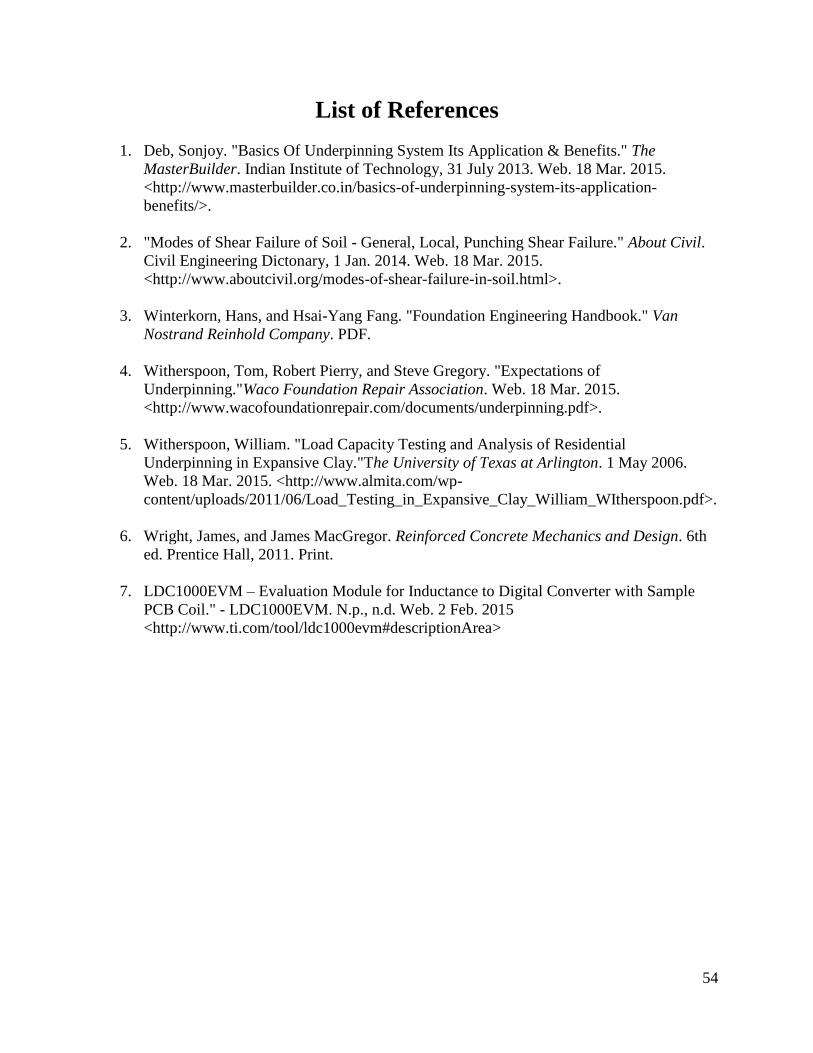
54
List of References
1. Deb, Sonjoy. "Basics Of Underpinning System Its Application & Benefits." The
MasterBuilder. Indian Institute of Technology, 31 July 2013. Web. 18 Mar. 2015.
<http://www.masterbuilder.co.in/basics-of-underpinning-system-its-application-
benefits/>.
2. "Modes of Shear Failure of Soil - General, Local, Punching Shear Failure." About Civil.
Civil Engineering Dictonary, 1 Jan. 2014. Web. 18 Mar. 2015.
<http://www.aboutcivil.org/modes-of-shear-failure-in-soil.html>.
3. Winterkorn, Hans, and Hsai-Yang Fang. "Foundation Engineering Handbook." Van
Nostrand Reinhold Company. PDF.
4. Witherspoon, Tom, Robert Pierry, and Steve Gregory. "Expectations of
Underpinning."Waco Foundation Repair Association. Web. 18 Mar. 2015.
<http://www.wacofoundationrepair.com/documents/underpinning.pdf>.
5. Witherspoon, William. "Load Capacity Testing and Analysis of Residential
Underpinning in Expansive Clay."The University of Texas at Arlington. 1 May 2006.
Web. 18 Mar. 2015. <http://www.almita.com/wp-
content/uploads/2011/06/Load_Testing_in_Expansive_Clay_William_WItherspoon.pdf>.
6. Wright, James, and James MacGregor. Reinforced Concrete Mechanics and Design. 6th
ed. Prentice Hall, 2011. Print.
7. LDC1000EVM – Evaluation Module for Inductance to Digital Converter with Sample
PCB Coil." - LDC1000EVM. N.p., n.d. Web. 2 Feb. 2015
<http://www.ti.com/tool/ldc1000evm#descriptionArea>
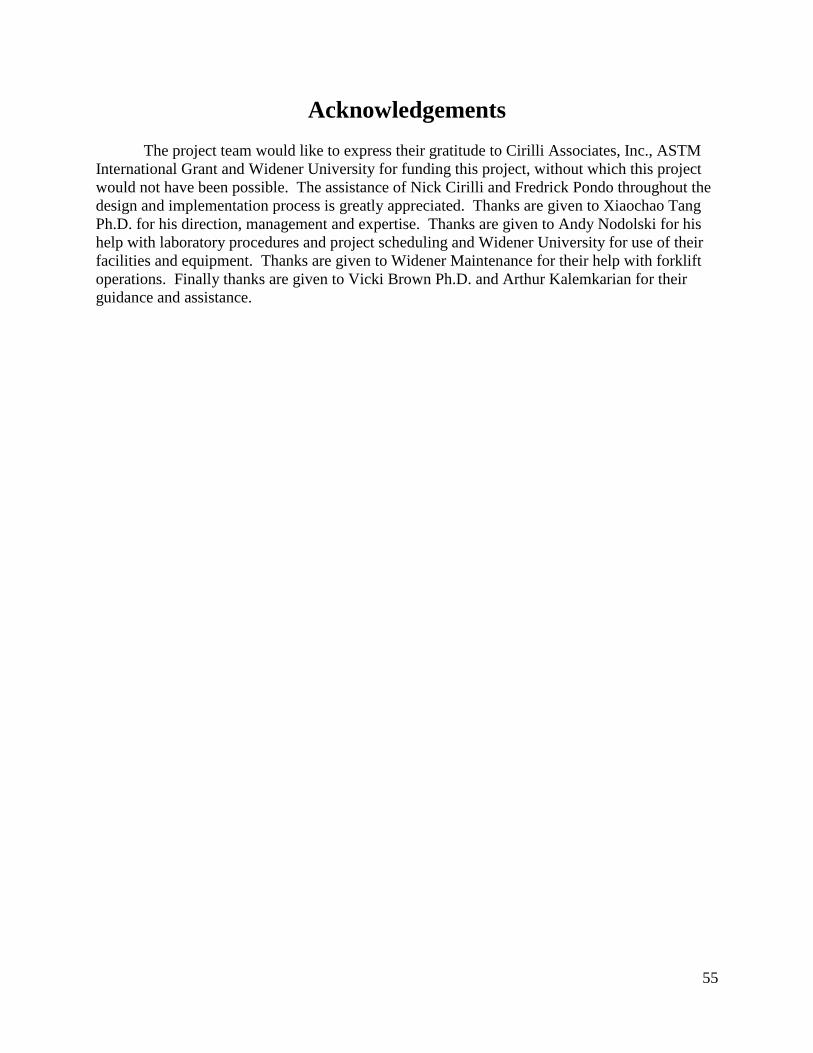
55
Acknowledgements
The project team would like to express their gratitude to Cirilli Associates, Inc., ASTM
International Grant and Widener University for funding this project, without which this project
would not have been possible. The assistance of Nick Cirilli and Fredrick Pondo throughout the
design and implementation process is greatly appreciated. Thanks are given to Xiaochao Tang
Ph.D. for his direction, management and expertise. Thanks are given to Andy Nodolski for his
help with laboratory procedures and project scheduling and Widener University for use of their
facilities and equipment. Thanks are given to Widener Maintenance for their help with forklift
operations. Finally thanks are given to Vicki Brown Ph.D. and Arthur Kalemkarian for their
guidance and assistance.
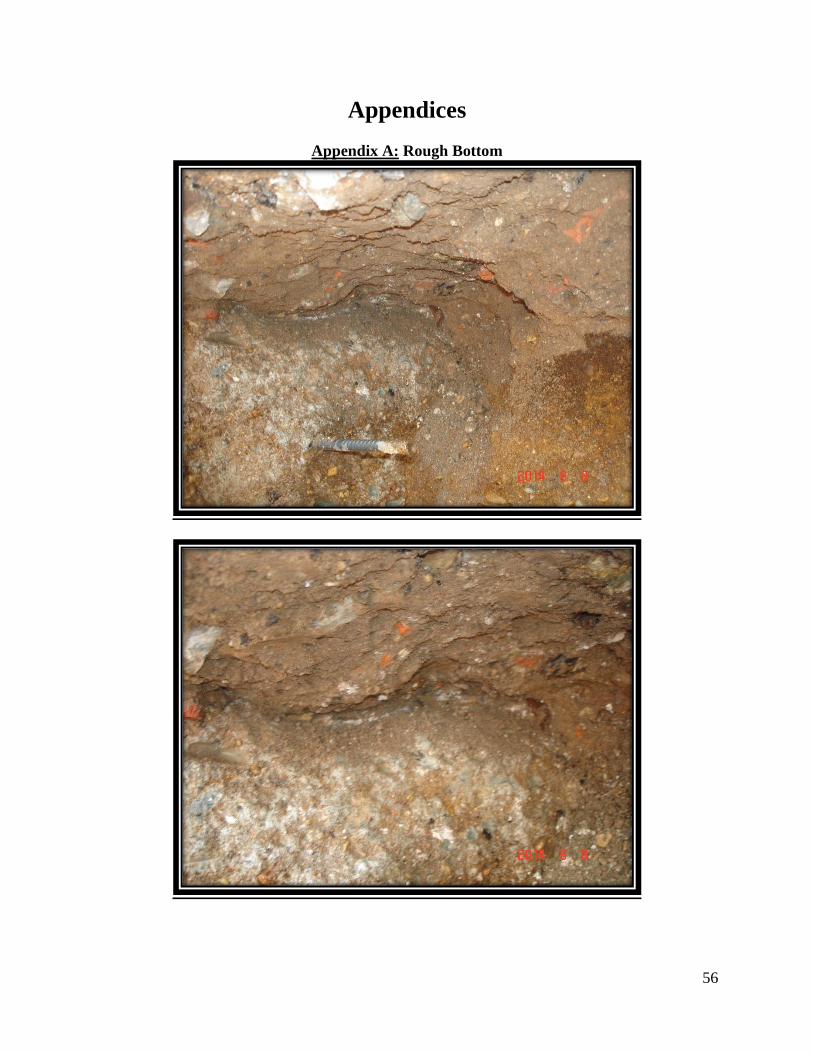
56
Appendices
Appendix A: Rough Bottom
57
Appendix B: Dry-Pack Method
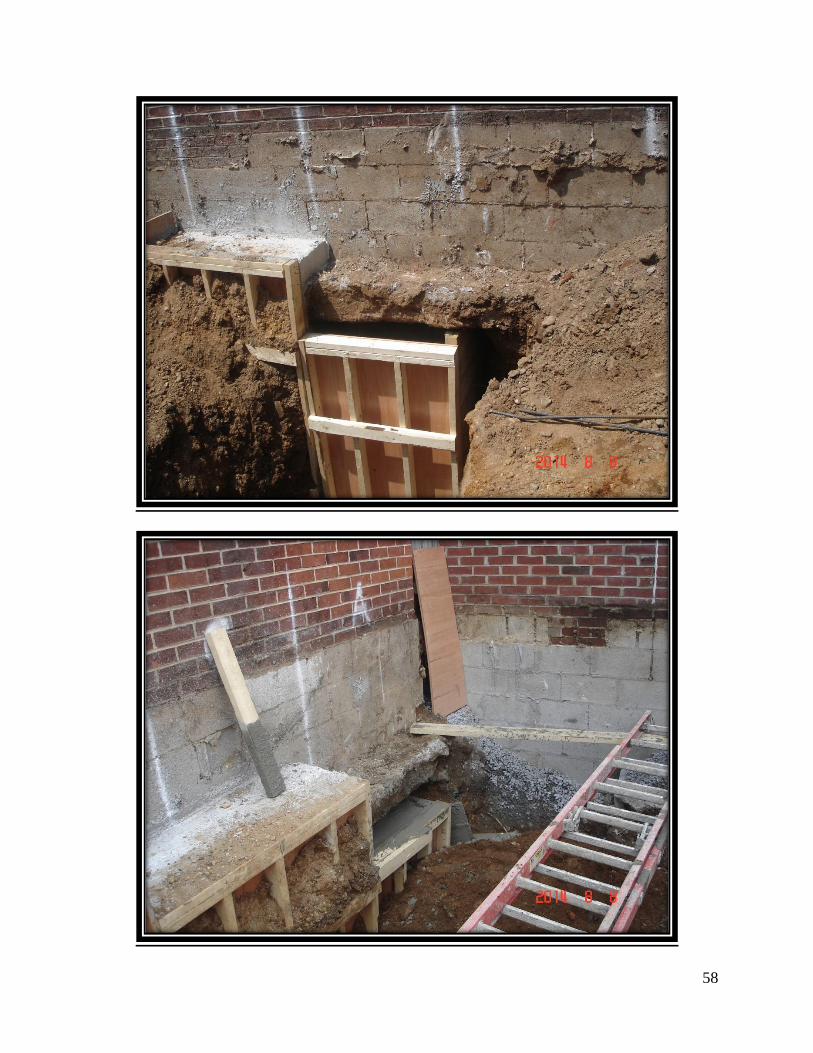
58
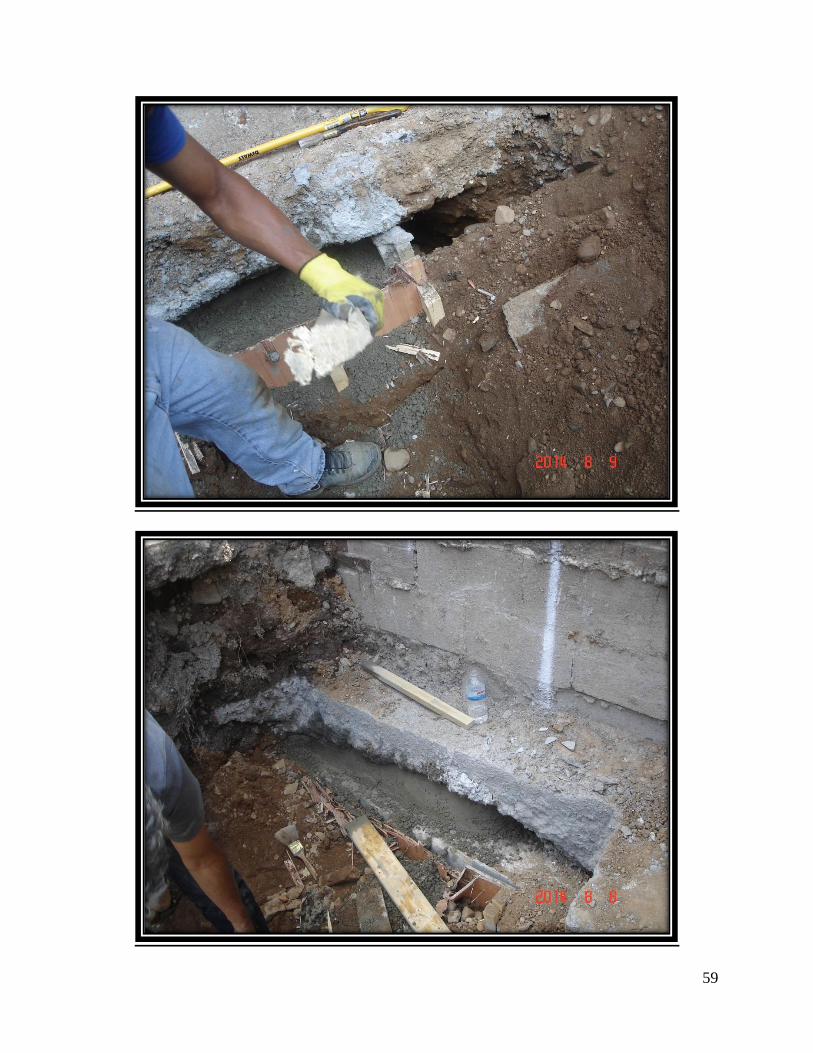
59
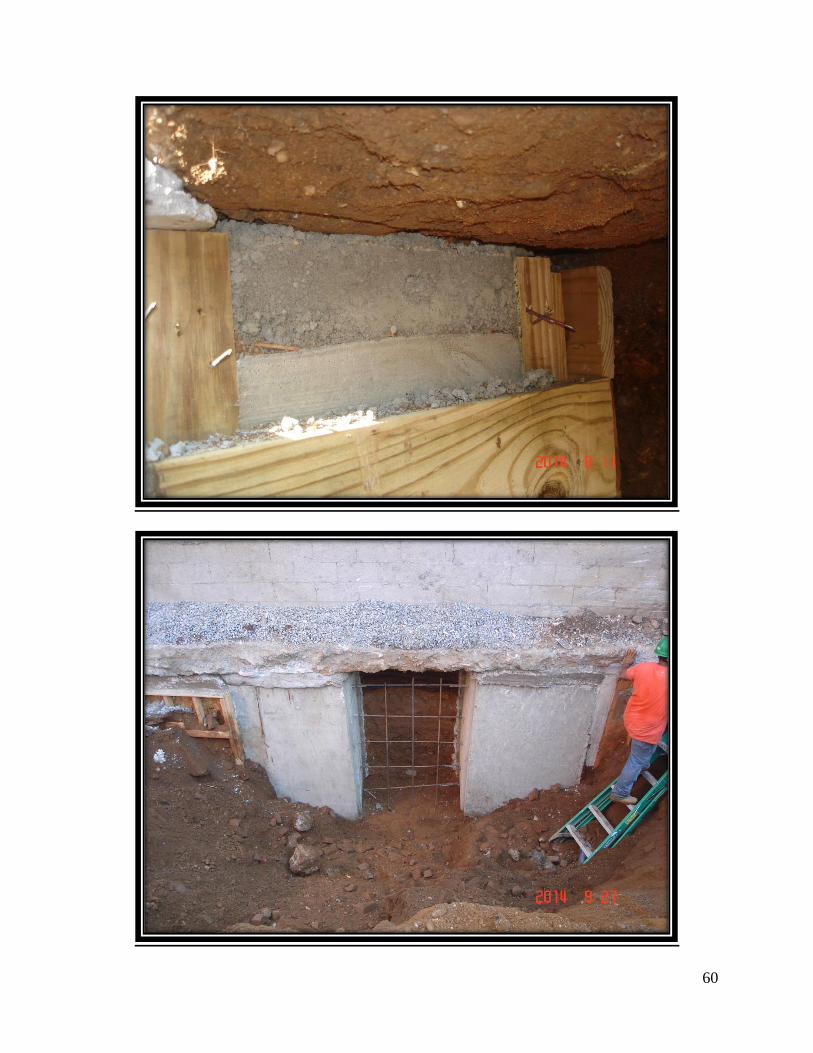
60
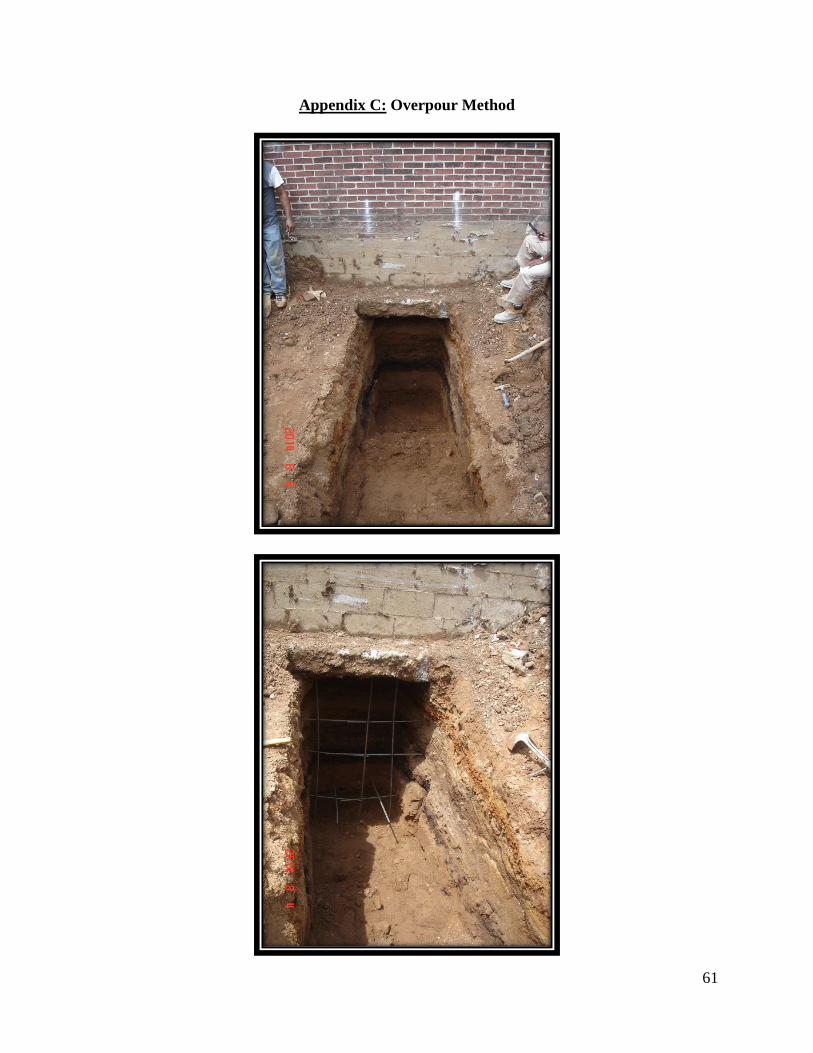
61
Appendix C: Overpour Method
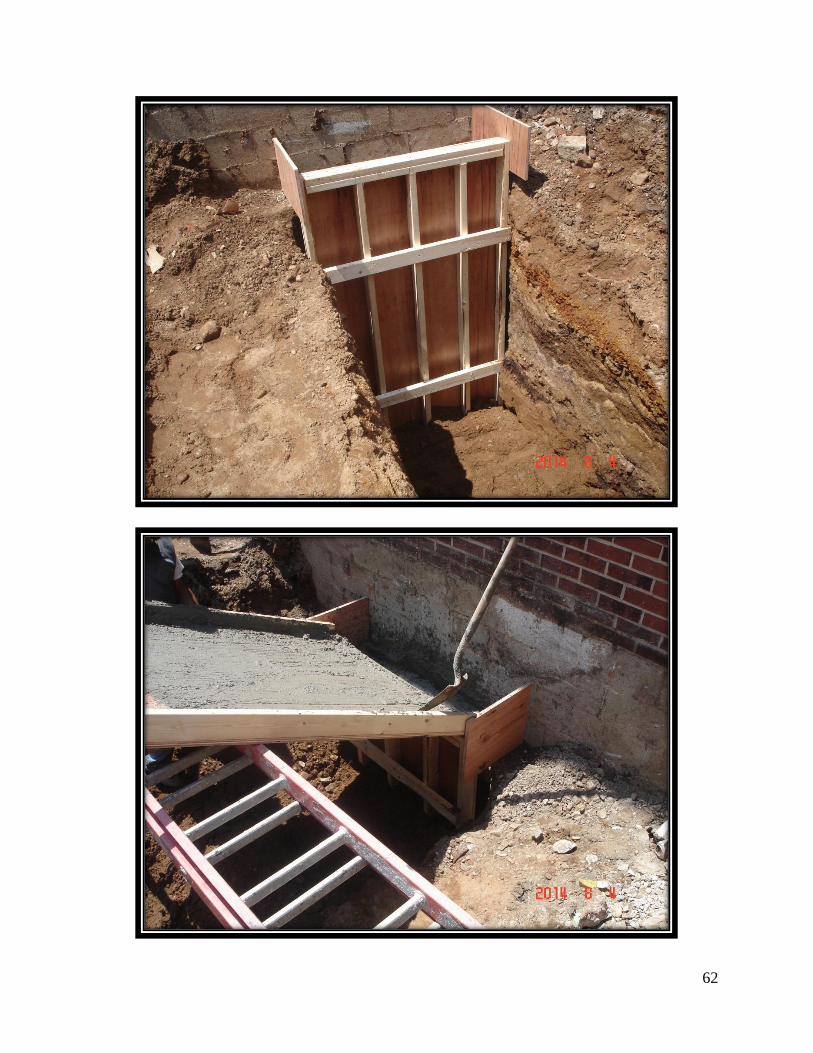
62
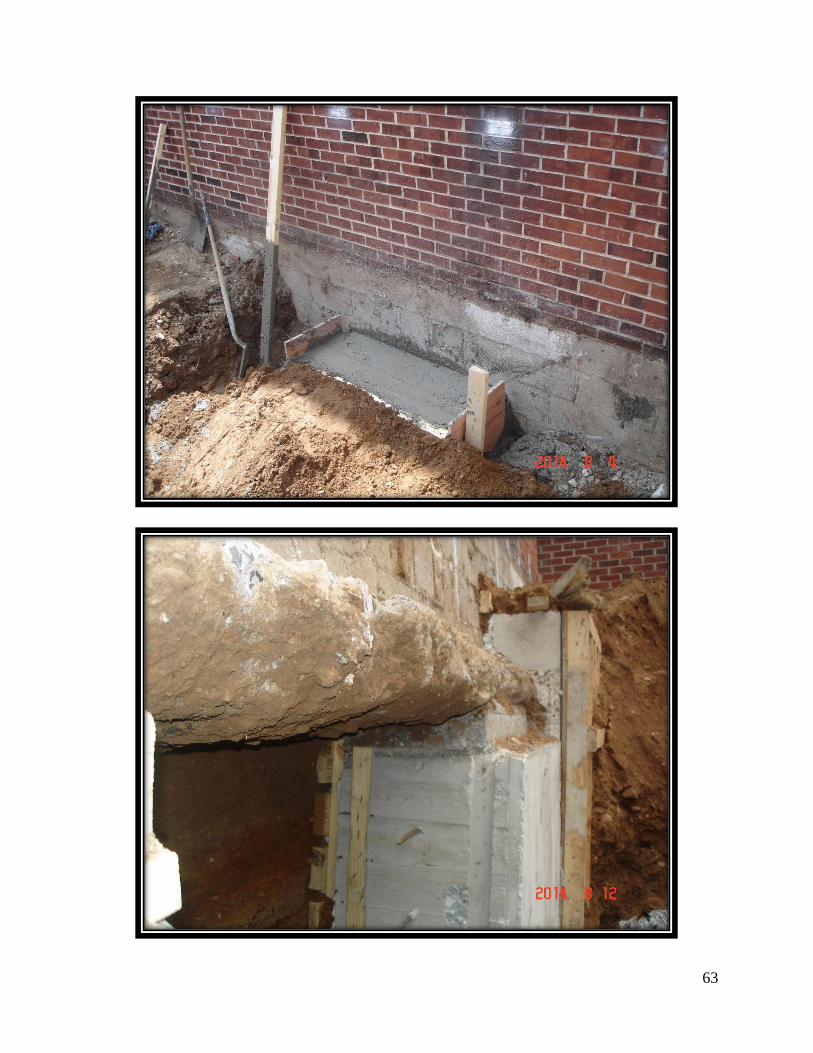
63
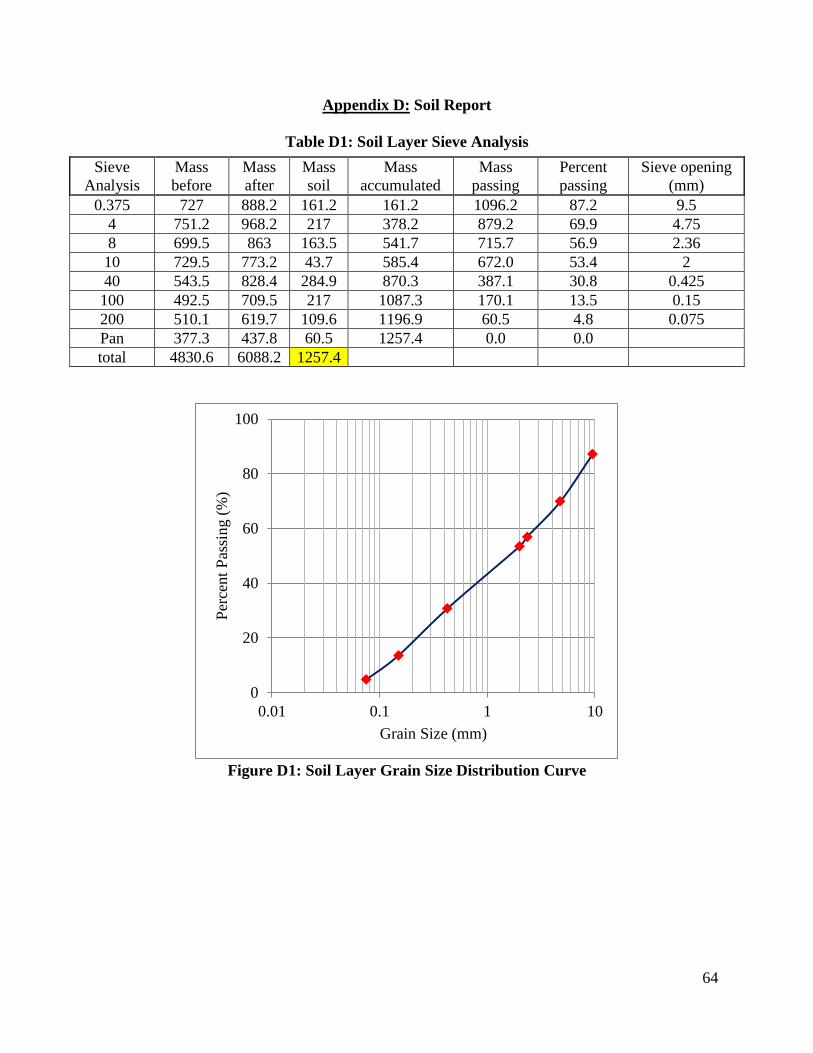
64
Appendix D: Soil Report
Table D1: Soil Layer Sieve Analysis
Figure D1: Soil Layer Grain Size Distribution Curve
0
20
40
60
80
100
0.01 0.1 1 10
Per
cent
Pas
sing (
%)
Grain Size (mm)
Sieve
Analysis
Mass
before
Mass
after
Mass
soil
Mass
accumulated
Mass
passing
Percent
passing
Sieve opening
(mm)
0.375 727 888.2 161.2 161.2 1096.2 87.2 9.5
4 751.2 968.2 217 378.2 879.2 69.9 4.75
8 699.5 863 163.5 541.7 715.7 56.9 2.36
10 729.5 773.2 43.7 585.4 672.0 53.4 2
40 543.5 828.4 284.9 870.3 387.1 30.8 0.425
100 492.5 709.5 217 1087.3 170.1 13.5 0.15
200 510.1 619.7 109.6 1196.9 60.5 4.8 0.075
Pan 377.3 437.8 60.5 1257.4 0.0 0.0
total 4830.6 6088.2 1257.4
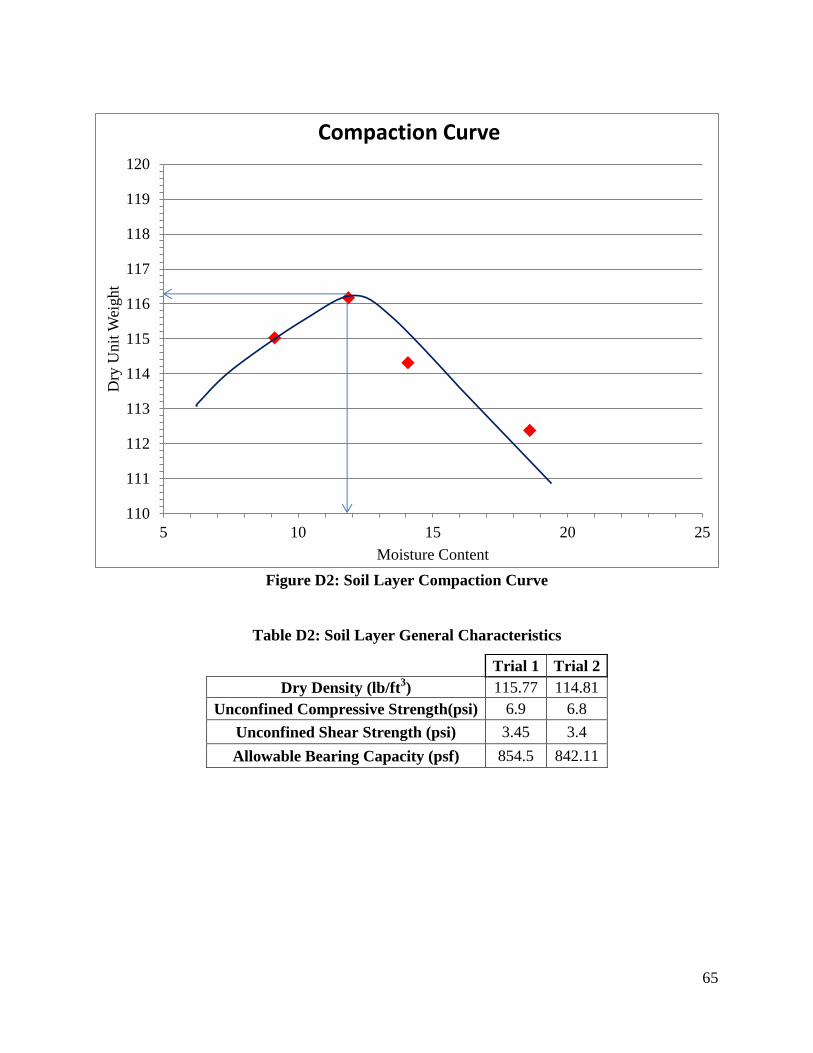
65
Figure D2: Soil Layer Compaction Curve
Table D2: Soil Layer General Characteristics
110
111
112
113
114
115
116
117
118
119
120
5 10 15 20 25
Dry
Unit
Wei
ght
Moisture Content
Compaction Curve
Trial 1 Trial 2
Dry Density (lb/ft3) 115.77 114.81
Unconfined Compressive Strength(psi) 6.9 6.8
Unconfined Shear Strength (psi) 3.45 3.4
Allowable Bearing Capacity (psf) 854.5 842.11
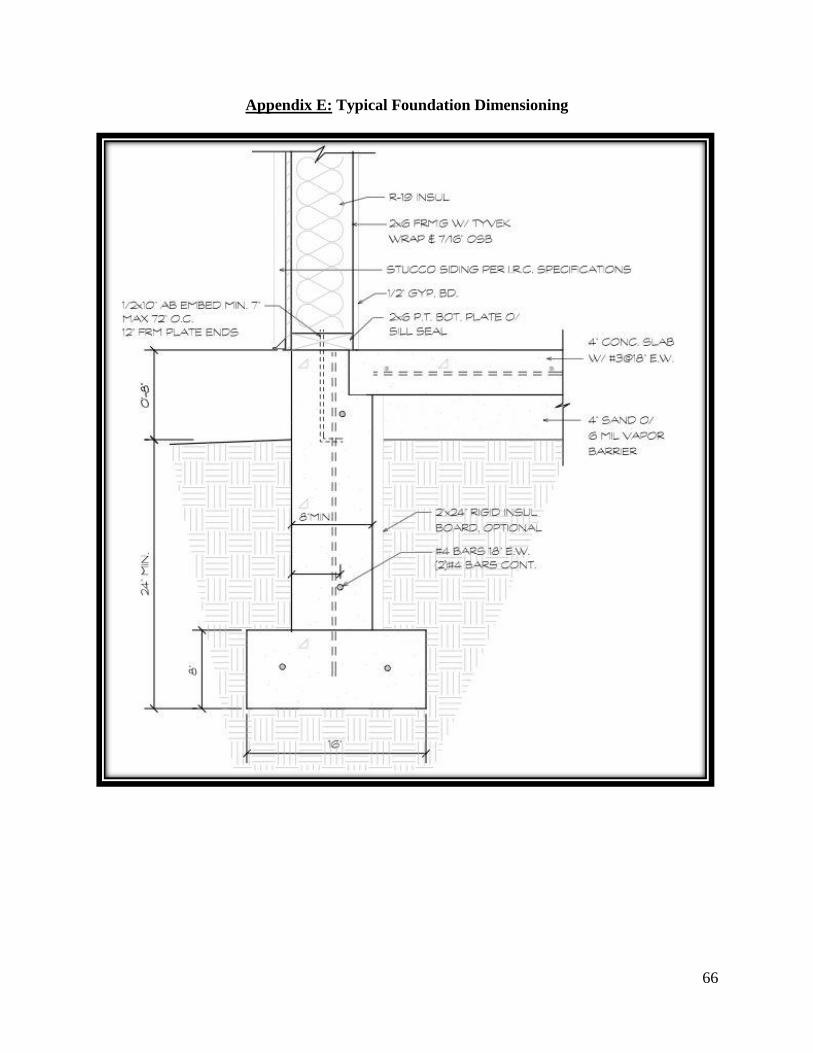
66
Appendix E: Typical Foundation Dimensioning
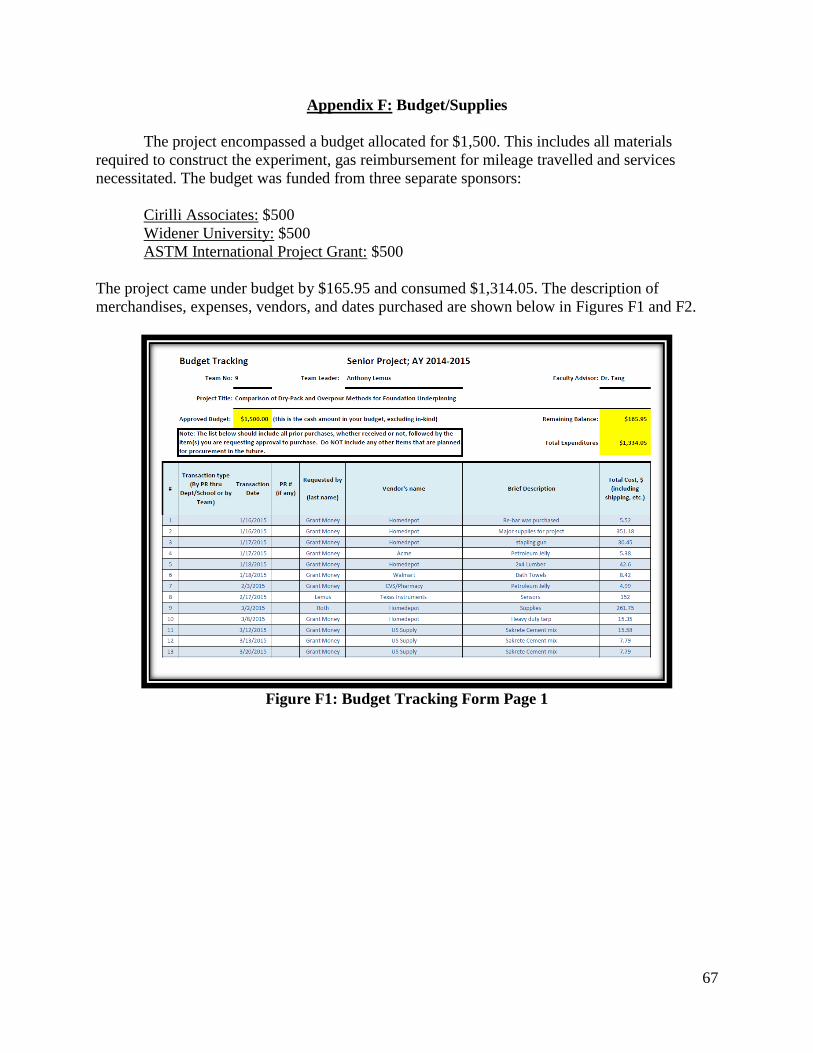
67
Appendix F: Budget/Supplies
The project encompassed a budget allocated for $1,500. This includes all materials
required to construct the experiment, gas reimbursement for mileage travelled and services
necessitated. The budget was funded from three separate sponsors:
Cirilli Associates: $500
Widener University: $500
ASTM International Project Grant: $500
The project came under budget by $165.95 and consumed $1,314.05. The description of
merchandises, expenses, vendors, and dates purchased are shown below in Figures F1 and F2.
Figure F1: Budget Tracking Form Page 1
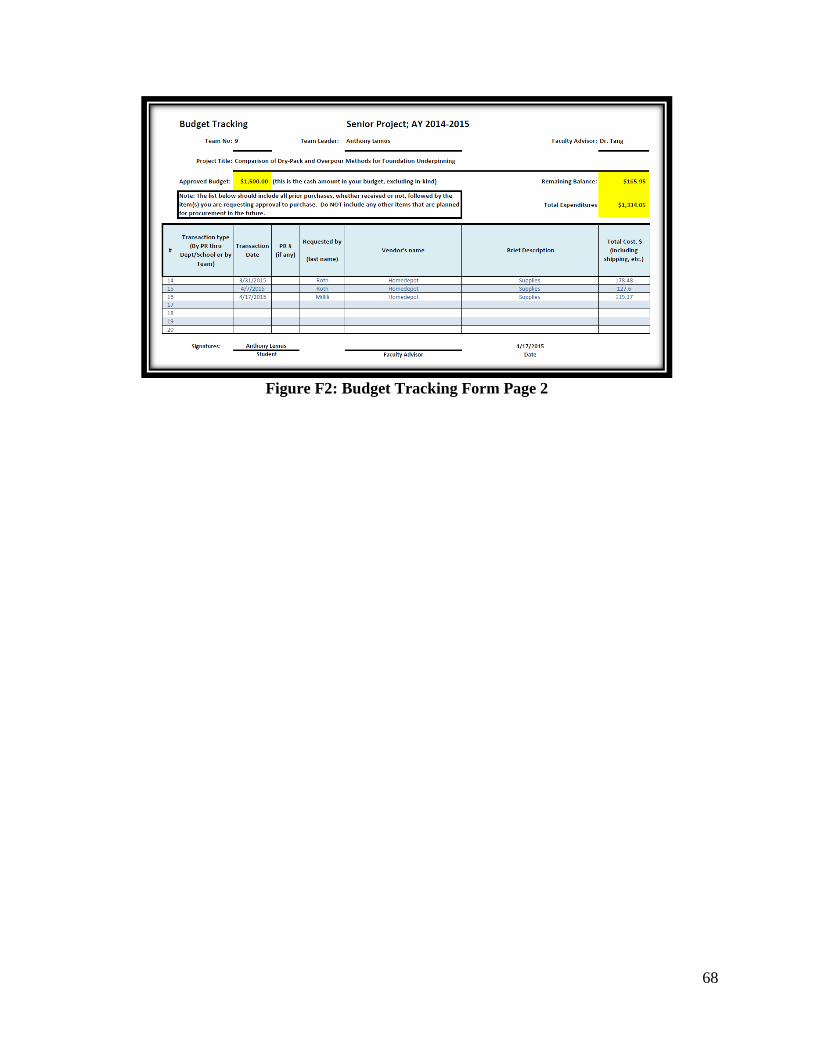
68
Figure F2: Budget Tracking Form Page 2
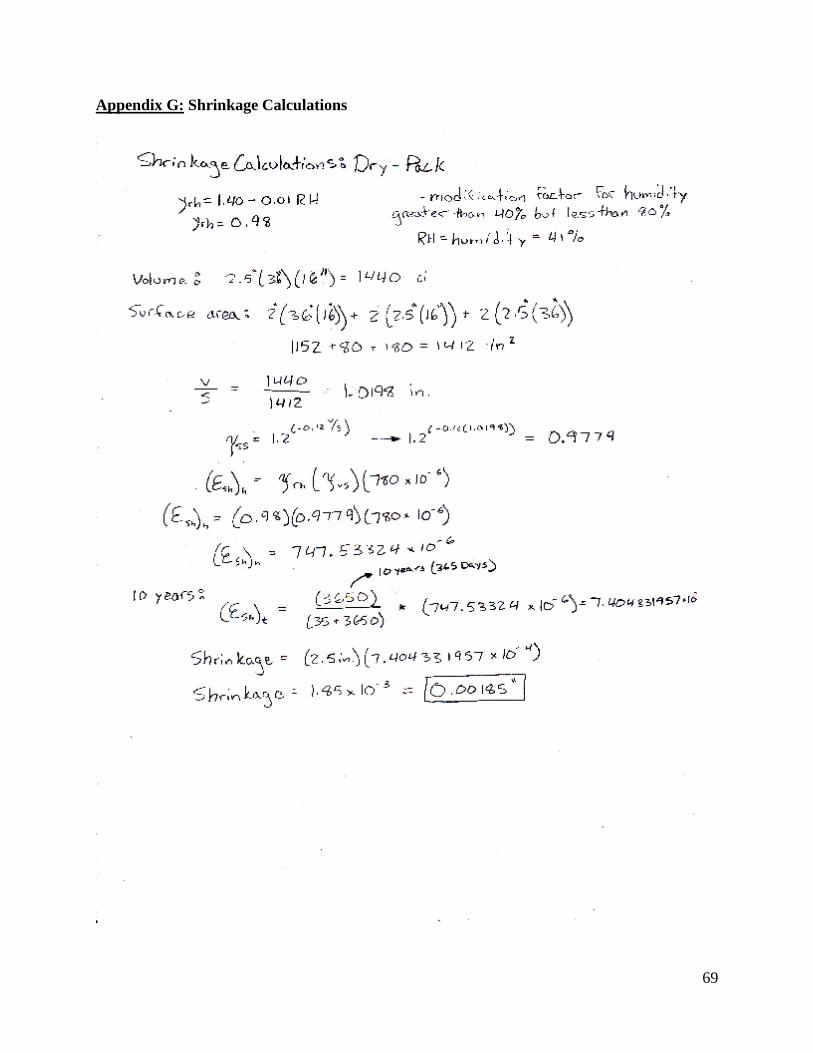
69
Appendix G: Shrinkage Calculations
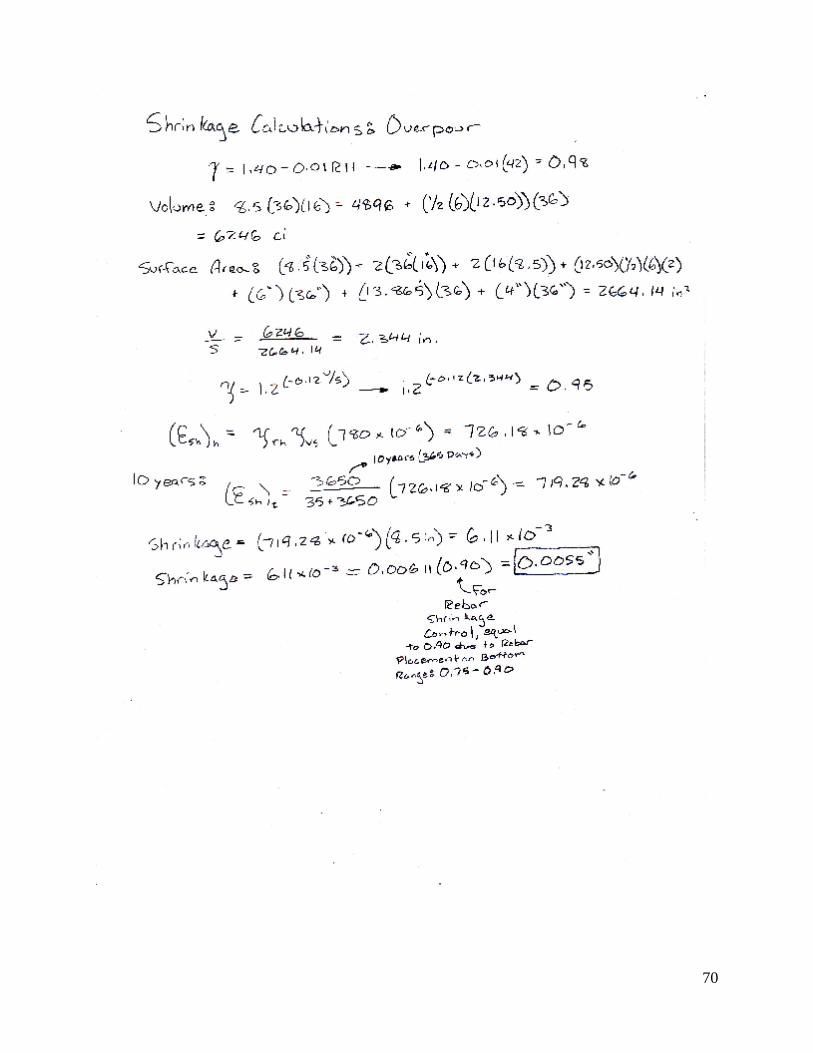
70
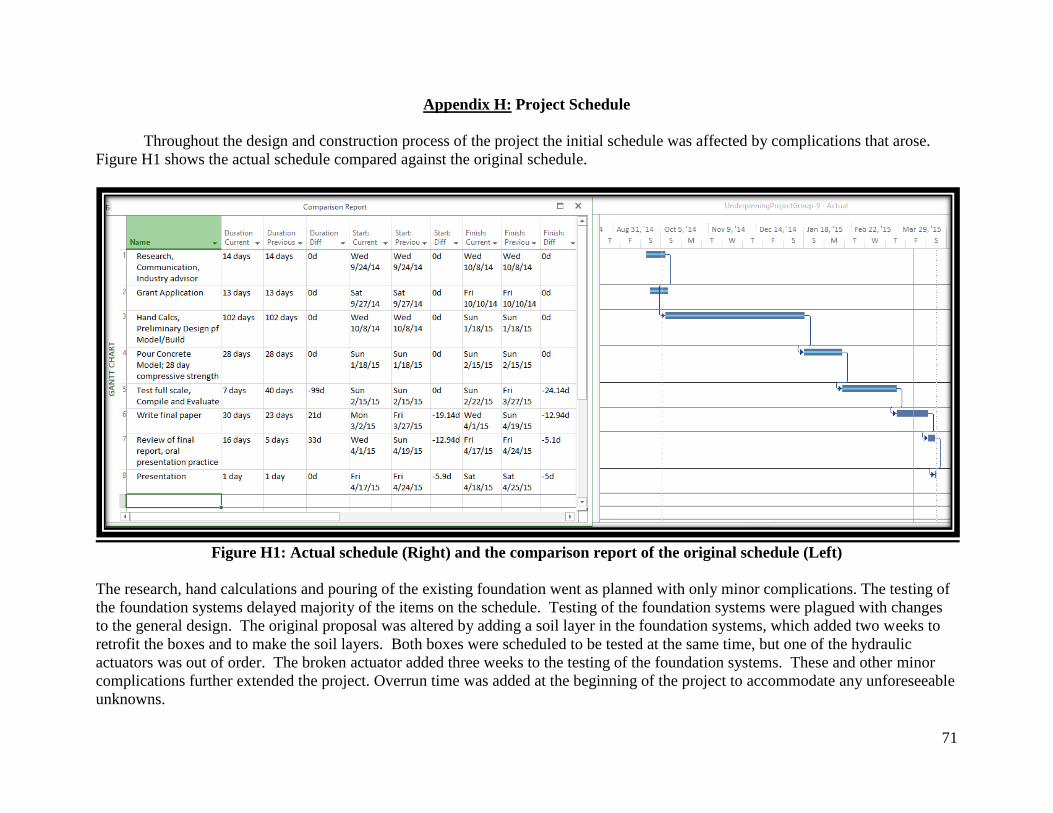
71
Appendix H: Project Schedule
Throughout the design and construction process of the project the initial schedule was affected by complications that arose.
Figure H1 shows the actual schedule compared against the original schedule.
Figure H1: Actual schedule (Right) and the comparison report of the original schedule (Left)
The research, hand calculations and pouring of the existing foundation went as planned with only minor complications. The testing of
the foundation systems delayed majority of the items on the schedule. Testing of the foundation systems were plagued with changes
to the general design. The original proposal was altered by adding a soil layer in the foundation systems, which added two weeks to
retrofit the boxes and to make the soil layers. Both boxes were scheduled to be tested at the same time, but one of the hydraulic
actuators was out of order. The broken actuator added three weeks to the testing of the foundation systems. These and other minor
complications further extended the project. Overrun time was added at the beginning of the project to accommodate any unforeseeable
unknowns.