Embed Size (px)
Citation preview

Legislative Research Commission
Office ofEducation
Accountability
Legislative Research Commission
Marcia Ford Seiler, Director; Sabrina Olds; Pam Young; Ken Chilton, PhD;Albert Alexander; Brenda Landy; Deborah Nelson, PhD; and Keith White, PhD
Research Report No. 376
School Districts’ Fund Balance Study
Prepared by


School Districts’ Fund Balance Study
Project Staff
Marcia Ford Seiler, Director Sabrina Olds Pam Young
Ken Chilton, PhD Albert Alexander
Brenda Landy Deborah Nelson, PhD
Keith White, PhD
Research Report No. 376
Legislative Research Commission Frankfort, Kentucky
lrc.ky.gov
September 8, 2010
Paid for with state funds. Available in alternate form by request.


Legislative Research Commission Foreword Office of Education Accountability
i
Foreword In December 2009, the Education Assessment and Accountability Review Subcommittee directed the Office of Education Accountability to examine school districts’ fund balances. A primary purpose of this study is to review fund balances held by districts and explore the purposes and intended uses of these funds. This study analyzes school districts’ fund balances for the general fund, special revenue fund, capital outlay fund, building fund, construction fund, and food service fund for fiscal years 2005 through 2009. Robert Sherman Director Legislative Research Commission Frankfort, Kentucky September 8, 2010


Legislative Research Commission Contents Office of Education Accountability
iii
Contents Summary...................................................................................................................................vii Chapter 1: Introduction ............................................................................................................... 1 Description of This Study ......................................................................................... 1 Organization of the Report ........................................................................................ 2 Financial Accounting Overview ................................................................................ 2 Chart of Accounts Overview ..................................................................................... 3 Funds ............................................................................................................ 4 Object Codes ................................................................................................. 5 Reporting Requirements ........................................................................................... 5 Budget Process .............................................................................................. 6 Draft Budget .................................................................................... 6 Tentative Budget .............................................................................. 7 Working Budget ............................................................................... 7 Budget Beginning Balance ............................................................... 7 Annual Financial Report ................................................................................ 8 Balance Sheet ................................................................................................ 8 Additional Guidance ................................................................................................. 9 Federal and Business Requirements ............................................................... 9 GASB 54 Requirements ............................................................................... 10 Other States’ Requirements .......................................................................... 11 Chapter 2: The General Fund .................................................................................................... 13 Organization of the Chapter ..................................................................................... 13 Revenues ................................................................................................................. 14 Investments.............................................................................................................. 16 District End-of-year Fund Balances and Percentages................................................ 17 Restrictions/Reserve Accounts ................................................................................. 20 Restricted for Sick Leave ............................................................................. 21 Year-end Fund Balance Cap .................................................................................... 22 Comparisons of Budgeted Contingency to Actual End-of-year Fund Balance .......... 22 Superintendent Survey ............................................................................................. 24 Other Superintendent Concerns .................................................................... 26 Chapter 3: Other Major Funds ................................................................................................... 27 Organization of the Chapter ..................................................................................... 27 Special Revenue Fund.............................................................................................. 27 Revenues ...................................................................................................... 28 Fund Balance ............................................................................................... 28 Capital Outlay Fund ................................................................................................. 29 Revenues ...................................................................................................... 29 Fund Balance ............................................................................................... 30 Maintenance, Insurance, and General Operating ........................................... 31 Building Fund .......................................................................................................... 31

Contents Legislative Research Commission Office of Education Accountability
iv
Revenues ...................................................................................................... 32 Fund Balance ............................................................................................... 33 Construction Fund ................................................................................................... 34 Revenues ...................................................................................................... 34 Fund Balance ............................................................................................... 34 Food Service ............................................................................................................ 34 Revenues ...................................................................................................... 34 Fund Balance ............................................................................................... 35 Chapter 4: Conclusions and Recommendations ......................................................................... 37 Fund Balance Requirements ..................................................................................... 37 Recommendation 4.1 .................................................................................... 38 Recommendation 4.2 .................................................................................... 38 Recommendation 4.3 .................................................................................... 38 Recommendation 4.4 .................................................................................... 39 Recommendation 4.5 .................................................................................... 39 KDE Business Rules and Internal Processes............................................................. 39 Recommendation 4.6 .................................................................................... 40 Recommendation 4.7 .................................................................................... 40 Recommendation 4.8 .................................................................................... 40 Recommendation 4.9 .................................................................................... 41 Recommendation 4.10 .................................................................................. 42 Other ....................................................................................................................... 42 Recommendation 4.11 .................................................................................. 42 Works Cited .......................................................................................................................... 43 Appendix A: Statutes and Regulations .................................................................................... 45 Appendix B: States’ Requirements for End-of-year Fund Balance, Rainy Day Reserve
Fund, and Cash Flow Reserve Fund ................................................................... 51 Appendix C: Per-pupil General Fund Local, State, and Federal Revenues, FY 2009 ............... 53 Appendix D: School Districts’ General Fund Balances, FY 2009 ............................................ 57 Appendix E: School Districts’ General Fund Balances, FY 2005-FY 2008 ............................. 63 Appendix F: Districts With at Least 20 Percent or Higher Fund Balance Percentages ............. 69 Appendix G: Districts’ Explanations for General Fund Balance Sheet Restrictions ................. 77 Appendix H: Office of Education Accountability Fund Balance Survey .................................. 81 Appendix I: Per-pupil Special Revenue Fund Local, State, and Federal Revenues, FY 2009 ............................................................................................................. 83 Appendix J: School Districts’ Fund Balances, FY 2009, Funds 2, 51, 310, and 320 ............... 87 Appendix K: Per-pupil Building Fund Local, State, and Federal Revenues, FY 2009 .............. 93 Appendix L: Per-pupil Food Service Fund Local, State, and Federal Revenues, FY 2009 ....... 97
List of Tables 1.1 Required Reports and Filing Dates................................................................................... 6 1.2 KDE Balance Sheet Object Codes for Undesignated Fund Balance .................................. 9 2.1 Per-pupil Local, State, and Total Local and State Funding With Percentage, FY 2009 ... 16

Legislative Research Commission Contents Office of Education Accountability
v
3.1 Special Revenue Fund Revenues by Local, State, and Federal Sources, FY 2005-FY 2009.......................................................................................................... 28
3.2 Special Revenue Fund Balance, FY 2005-FY 2009 ........................................................ 29 3.3 Capital Outlay Fund by Local and State Sources, FY 2005-FY 2009 ............................. 30 3.4 Capital Outlay Fund Balance, FY 2005-FY 2009 ........................................................... 30 3.5 Maintenance and Property Insurance Spent Out of Capital Outlay by
Object Codes and Function Codes, FY 2009 .................................................................. 31 3.6 Building Fund Revenue by Local and State Sources, FY 2005-FY 2009 ........................ 33 3.7 Building Fund Balance, FY 2005-FY 2009 .................................................................... 33 3.8 Food Service Fund by Local, State, and Federal Sources, FY 2005-FY 2009 ................. 35 4.1 Districts on the Kentucky Department of Education’s Watch List, FY 2002-FY 2009.......................................................................................................... 41 4.2 Deficit Districts, FY 2002-FY 2009 ............................................................................... 41
List of Figures 2.A General Fund Revenue by Local and State Sources, Inflation-adjusted and Nominal
Dollars, FY 2005-FY 2009 ............................................................................................ 15 2.B Per-pupil Fund Balance for Districts With and Without Investments, FY 2005-FY 2009.......................................................................................................... 17 2.C Number of Fund Balance Increases or Decreases, Annual Change ................................. 19 2.D Range of Fund Balance Percentages, FY 2009 ............................................................... 19 2.E Changes in Fund Balance Percentage, FY 2005-FY 2009 .............................................. 21 2.F Comparison of Budgeted to Actual Contingency, Revenue, and Expenses, FY 2009 ........................................................................................................................ 23 2.G Number of Districts by Percentage Above/Below Budgeted and Actual Fund Balance
Amounts, FY 2009 ........................................................................................................ 24

Legislative Research Commission Summary Office of Education Accountability
vii
Summary During recent legislative sessions, the General Assembly has been forced to make difficult budgeting decisions while managing revenue shortfalls. The legislature has avoided cuts to the Support Education Excellence in Kentucky funding formula in the past, but policy makers are interested in uncovering new revenue for education funding and encouraging reduction of expenditures where possible. In recent years, legislators have examined funds available in school districts’ general fund balances as a possible source to offset education spending cuts. It could be assumed that large fund balances mean that districts are hoarding money or setting it aside in slush funds. District superintendents fear that high fund balances might be misconstrued by legislators, who could be tempted to tap into fund balances to offset cuts in the education budget. The purpose of this study is to explore the purpose and use of school districts’ fund balances and to make policy recommendations that will increase accuracy and transparency in fund balance budgeting. While the subject matter of this report is technical and reflects the language of finance professionals, the report highlights the need for data accuracy and transparency. It is in the best interest of legislators, superintendents, and the Kentucky Department of Education (KDE) to have accurate data to make critical budgeting decisions. The policy recommendations included in Chapter 4 list the report’s key points. The vast majority of districts meet state requirements to maintain a 2 percent minimum budget contingency. As education budgets increase, fund balances must also increase to meet state requirements. Thus, total fund balance has risen over the last 5 years. However, the fund balance percentage has remained relatively stable statewide, when controlling for the two largest districts in the state, at about 12 percent, the equivalent of about 2 months’ worth of total expenditures. Most superintendents report that budgeted contingency should ideally be 1 to 2 months of general fund expenses, which equates to 6 to 12 percent on the current calculation for fund balance percentage. National standards regarding how much public schools should maintain in fund balance have not been promulgated. However, the Government Finance Officers Association recommends that public-sector organizations maintain a minimum of 2 months’ worth of general fund revenue or expenditures. Moody’s Investors Service, Fitch, and Standard and Poor’s—three major bond rating companies—suggest the importance of maintaining 5 percent to 10 percent of operating expenditures in the general fund balance for education. Thus, the Office of Education Accountability (OEA) recommends that KDE review the current minimum requirement of 2 percent for contingency and general fund balance percentages. A primary finding of this study is that high fund balances are not necessarily a sign of district inefficiency. In many cases, districts have targeted fund balance reserves to meet demands for facility upgrades, construction projects, technology purchases, cash flow, and unforeseen emergencies. However, policy makers and researchers cannot easily ascertain the intended uses of fund balances because reporting and accounting protocols are either incomplete or ignored. KDE should ensure that districts use the proper accounting codes to promote transparency and consistency in reporting fund balances. Similarly, unused funds that were restricted to a limited purpose, such as construction, should be applied to the unmet-needs calculation for school
Summary Legislative Research Commission Office of Education Accountability
viii
facilities purposes. These actions would correct current practices that make it difficult to figure out how or where general fund revenues are spent. The Governmental Accounting Standards Board provides states with guidelines in public budgeting and accounting procedures. In its research, the board found that the existing standards on fund balance were being misinterpreted by government agencies and that the public was having difficulty interpreting fund balance and financial statements. All government agencies must comply with the new reporting requirements on their 2011 end-of-year financial statements. At present, Kentucky has not implemented the board’s protocols, and this report recommends that KDE incorporate these changes along with coding issues on districts’ balance sheets by June 30, 2011. These changes will promote more transparency in understanding the financial position of school districts, which, in turn, provides legislators with more accurate data on fund balances. Another problem uncovered in this research is that end-of-year balances do not always match beginning amounts on working budgets. This discrepancy could lead to overspending or underbudgeting by a district. OEA recommends that KDE require that districts’ end-of-year balances match new fiscal year working budgets. Grants in the special revenue fund and money for projects in the construction fund are spent over multiple years, making it impossible to track expenditures or receipts on the KDE’s annual finance report. At present, districts are not required to submit annual project budget updates to KDE. Consequently, it is difficult to determine whether individual projects have been accounted for properly. KDE should require districts to submit annual detailed project budgets for the construction fund and the special revenue fund. This practice would enhance project monitoring and fiscal discipline. In reviewing fund balances, staff found that in some districts, other major funds end the year with negative balances. This is prohibited by current statute language, and KDE should require districts to cover any negative balances with general fund revenue. Tightening accounting practices will contribute to a more robust dialogue on education funding and fund balances. This report makes several recommendations aimed at improving and strengthening the fund balance calculation. OEA is sensitive to KDE’s concern about its capacity to implement accounting recommendations in light of continued staff cuts and limited resources. However, it is imperative that decision makers have accurate data to inform legislators and the general public. General fund revenues are significant and draw attention during budget hearings. Thus, it is in KDE’s fiscal interest to implement the recommendations made in this report.

Legislative Research Commission Chapter 1 Office of Education Accountability
1
Chapter 1
Introduction
During recent legislative sessions, the General Assembly has been forced to make difficult budgeting decisions while dealing with continuing shortfalls in revenue. The General Assembly and school districts rely on the Support Education Excellence in Kentucky (SEEK) funding formula, using a mixture of state and local tax dollars, to ensure funding equity across the state. While SEEK has been spared cuts in the past, there is continued interest in finding ways to fund education while encouraging reduction of expenditures where possible. In recent years, legislators have scrutinized funds available in school districts’ general fund balances. As of June 30, 2009, 174 school districts had a total general fund balance of $774 million. This study provides analysis of general fund balances, how they have changed over the years, and how districts incorporate fund balances in their long-term plans. Each year, school districts are required to create budgets that estimate revenues and expenditures for the upcoming year. A district must include on its tentative budget a contingency reserve of at least 2 percent of the district’s entire budget, per KRS 160.470. At the end of each fiscal year, a district submits to the Kentucky Department of Education (KDE) an annual financial report (AFR). The AFR includes detailed information about the types and amounts of revenues collected and how these revenues were spent. Any unexpended funds are reported in the fund balance section of the district’s balance sheet, also submitted to KDE. These fund balances and budgeted amounts are analyzed in this study.
Description of This Study
In December 2009, the Education Assessment and Accountability Review Subcommittee directed the Office of Education Accountability (OEA) to examine school districts’ fund balances. A primary purpose of this study is to review fund balances held by districts and report the purposes and intended uses of these funds. This study analyzes school districts’ fund balances for the general fund, special revenue fund, capital outlay fund, building fund, construction fund, and food service fund for fiscal years 2005
During recent legislative sessions, the General Assembly has been forced to make difficult budgeting decisions while dealing with continuing shortfalls in revenue. As of June 30, 2009, 174 school districts had a total general fund balance of $774 million.
A district must include, at a minimum, a contingency reserve of 2 percent of the district’s entire budget per KRS 160.470 on the tentative budget.
In December 2009, the Education Assessment and Accountability Review Subcommittee directed the Office of Education Accountability (OEA) to examine school districts’ fund balances. A primary purpose of this study is to review fund balances held by districts and explore the purposes and intended use of these funds.
Chapter 1 Legislative Research Commission Office of Education Accountability
2
through 2009. Fiscal data for this analysis were provided by KDE and include districts’ annual financial reports, balance sheets, and working budgets. OEA staff conducted interviews with superintendents and finance officers of districts identified as having restrictions/reserve accounts on the balance sheet or general fund balances of 20 percent or higher, as of June 30, 2009, to determine the intended use of these balances. OEA also administered a short survey to all superintendents to obtain their input on issues related to fund balances. In addition, several states were contacted to determine how they regulate and manage fund balances.
Organization of the Report The remainder of this chapter provides an overview of the Kentucky chart of accounts (COA) used by school districts for financial reporting and definitions and calculation methods for contingency and fund balances. This chapter concludes with a sample of states’ requirements for fund balances, as well as information on federal reporting requirements and business rules. Chapter 2 analyzes data related to districts’ fund balances, revenues, budgets, and reserves in the general fund. The chapter also presents budgeted contingency amounts for each district’s general fund. Survey results and interview data on fund balances provide additional insights. Chapter 3 analyzes fund balances and revenues for special revenue, capital outlay, building, construction, and food service funds. Capital outlay funds expended on maintenance and insurance are also reviewed. Chapter 4 presents the conclusions and recommendations.
Financial Accounting Overview The National Center for Education Statistics (NCES) publishes the Financial Accounting for State and Local School Systems handbook that includes national standards and guidance for school districts to ensure data are uniform across states. These standards also comply with generally accepted accounting principles established by the Governmental Accounting Standards Board (GASB). GASB, a nonprofit and independent organization,
OEA administered a short survey to all superintendents to obtain their input on issues related to fund balances. Several states were contacted to determine how they regulate and manage fund balances.
Chapter 1 provides an overview of the Kentucky chart of accounts (COA) and calculation methods for contingency and fund balances.
Chapter 2 analyzes data related to districts’ fund balances, revenues, budgets, and reserves in the general fund.
Chapter 3 analyzes fund balances and revenues for special revenue, capital outlay, building, construction, and food service funds.
Chapter 4 presents the final conclusions and recommendations.
The National Center for Education Statistics publishes the Financial Accounting for State and Local School Systems handbook that includes national standards and guidance for school districts to ensure data are uniform across states.
Legislative Research Commission Chapter 1 Office of Education Accountability
3
establishes financial accounting and reporting standards for local and state governments. According to 702 KAR 3:120, “a local board of education shall follow the uniform financial accounting system detailed in ‘KETS [Kentucky Education Technology System] District Administrative System Chart of Accounts,’ and the ‘Charts of Accounts Descriptions.’ ” In a previous OEA study, staff analyzed the National Center for Education Statistics and KDE accounting codes and found several problems (Commonwealth. Legislative. Office. Indicators). OEA recommended that KDE review these coding discrepancies, update the chart of accounts, and provide chart of accounts descriptions. KDE held several internal meetings with district finance officers to analyze the codes. A revised chart of accounts was developed, and all districts had to implement the new codes by June 30, 2010, for the FY 2010 AFR. KDE published the Chart of Accounts Descriptions and posted them on its website in April 2010. KRS 156.670 sets out the requirements to develop the KETS Master Plan, which mandates all districts to use the same accounting software. The original contract for accounting software was bid by KDE and granted effective September 15, 1994, to a company now known as Tyler Technologies. The software is commonly known as MUNIS. The contract has been either renewed or extended since the original bid. According to the FY 2004 contract, KDE approved a 2-year renewal beginning with FY 2005, with an additional 3 years of 1-year contract renewals ending June 30, 2010. According to the Finance and Administration Cabinet, there is no statute or regulation requiring a time line on when services have to be bid. KDE staff members indicate that they will seek continuation of the contract for another year, citing that a significant amount of new funding would be needed if a new software program were to be implemented. KDE staff provided the cabinet estimates ranging from $25 million to $50 million for KDE to bid and implement a new software program, and a recurring $7 million to $10 million would be needed for annual maintenance (Speer).
Chart of Accounts Overview
Though there are several components to the COA, only funds and object codes are covered in this study. The following is a brief description of the funds and accounts used in this study.
KRS 156.670 sets out the requirements to develop the Kentucky Education Technology System Master Plan, which mandates all districts to use the same accounting software. The software used is commonly known as MUNIS.
Though there are several components to the COA, only funds and object codes are covered in this study.

Chapter 1 Legislative Research Commission Office of Education Accountability
4
Funds A fund is a separate accounting entity with a self-balancing set of accounts for cash, revenues, assets, liabilities, and fund balances. KDE’s chart of accounts for funds was created using the NCES guidelines. The general fund, coded as Fund 1, is the main operating fund for school districts. It includes financial resources with the fewest restrictions on spending. Districts use this fund to pay for school-based decision making allocations, which includes the majority of staff salaries; districtwide and central office staff salaries; transportation; supplies and utilities costs; and maintenance. The special revenue fund, coded as Fund 2, includes local, state, and federal grants that are restricted for specific purposes. Frequently, the grant revenues expended out of this fund cross over multiple years, as some state and federal grants cover 12 to 36 months. Therefore, codes in this fund can be tracked across multiple years. The capital outlay fund, coded as Fund 310, is used primarily to pay for debt service; however, recent changes to statutes and budget language have opened this fund to pay for insurance, maintenance, and operating expenses. KRS 157.420 defines the restrictions governing expenditures of capital outlay funds, with additional guidance provided in budget language. These restrictions will be discussed in further detail in Chapter 3. The building fund, coded as Fund 320, is used to pay debt service and can be used for major renovation or new construction of school buildings. KRS 157.440 establishes requirements for participation in the Facilities Support Program of Kentucky (FSPK). The construction fund, coded as Fund 360, is used for construction projects. After a project has KDE approval, funds are transferred to this account from capital outlay, building fund, general fund, or bond proceeds. This is a multiyear fund and is set up like the special revenue fund. Districts track individual projects using project codes. The food service fund, coded as Fund 51, accounts for the food service program operated at each school in the district. This fund records receipts and expenditures from breakfast, lunch, and à la carte sales as well as the summer feeding program.
A fund is a separate accounting entity with a self-balancing set of accounts for cash, revenues, assets, liabilities, and fund balances.
The general fund is the main operating fund for school districts. It includes financial resources with the fewest restrictions on spending.
The special revenue fund includes local, state, and federal grants that are restricted for specific purposes. Grants typically are spent over 12 to 36 months.
The capital outlay fund is used primarily to pay for debt service. Recent changes to statutes and budget language have opened this fund to pay for insurance, maintenance, and operating expenses.
The building fund is used to pay debt service and can be used for major renovation or new construction of school buildings.
The construction fund is used for approved construction projects. Funds are transferred to this account from capital outlay, building fund, general fund, or bond proceeds.
The food service fund accounts for the food service program operated at each school in the district.

Legislative Research Commission Chapter 1 Office of Education Accountability
5
Object Codes All transactions require object codes that identify the service or commodity obtained with an expenditure, the source of revenue (local, state, federal), or the type of balance sheet account (asset, liability, and fund balance). Object codes are uniformly established and maintained in the chart of accounts, and most object codes can be used across individual funds.
Reporting Requirements The foundation of every financial plan is the budgeting process. There are several budgeting methods, such as line-item budgeting, performance budgeting, program and planning budgeting, zero-based budgeting, and outcome-focused budgeting. Kentucky school districts operate under a zero-based budgeting process, which means program activities and services are justified annually. Individual decisions are made on the basis of program goals and activities within each school. For each program, costs are assigned, outcomes are defined, and priorities are ranked. Zero-based budgeting is useful when spending must be reduced. Several statutes and regulations govern district-level budgeting and accounting practices. While some are highlighted in this chapter, Appendix A includes a summary of all relevant statutes and regulations pertaining to this study. KRS 160.550 stipulates that superintendents and local board members are not allowed to vote for any expenditure exceeding income and revenue for any year. Any district in violation of this law may be certified deficient by the Kentucky Board of Education. A district that is certified deficient cannot expend funds, make employment offers, make purchases, or ratify contracts unless approved by the commissioner of education. Any school district subject to the commissioner’s approval process shall remain so until the board has approved a sound budget for a succeeding fiscal year. Before a district may exceed its budget, 702 KAR 3:050 requires the local board of education to submit an application to KDE to determine whether an emergency exists. The commissioner is responsible for examining all facts and taking whatever action is deemed appropriate. Any application to exceed the current budget, as well as any emergency declared by the commissioner, shall be submitted to the state board for final decision. However, according to KDE, no districts have recently requested to exceed the working budget.
The foundation of every financial plan is the budgeting process. Kentucky school districts operate under a zero-based budgeting process, which means program activities and services are justified annually.
Several statutes and regulations govern district-level budgeting and accounting practices. Per KRS 160.550, superintendents and local board members are not allowed to vote for any expenditure exceeding income and revenue for any year. Any district in violation of this law may be certified deficient by the Kentucky Board of Education.
Before a district exceeds its budget, 702 KAR 3:050 requires the local board of education to submit an application to KDE to determine whether an emergency exists.

Chapter 1 Legislative Research Commission Office of Education Accountability
6
According to KRS 160.470, local boards of education are required to adopt three budgets: the draft, the tentative, and the final working budget. Table 1.1 lists the budgets and annual financial reports required and filing dates.
Table 1.1 Required Reports and Filing Dates
Report Description Filing Date Draft Budget Local board of education shall formally and
publicly examine detailed line items estimating revenues and expenditures for the next fiscal year.
Jan. 31
Tentative Budget Local board of education shall adopt a tentative budget, which shall include a minimum reserve of 2 percent of the total budget.
May 30
Working Budget Local board of education shall submit to the Kentucky Board of Education a final working budget for current fiscal year. The state board shall establish regulatory guidelines for this budget.
Sept. 30
Annual Financial Report and Balance Sheet
Local board of education shall submit to KDE an unaudited annual financial report of revenues and expenditures with breakdowns of budgeted amounts. The balance sheet includes assets, liabilities, and fund balances.
July 25
Source: KRS 160.470, KRS 157.060 and 702 KAR 3:110. Budget Process Draft Budget. By January 31 of each year, a school board is required to develop and approve a draft budget for the upcoming fiscal year. Because the current fiscal year is only half over when this process begins, all budget data are estimated. One important estimated data point is the beginning balance; however, this piece of information is not final until the end of June, when the current budget cycle is complete. As a result, the budgets are developed using estimations of the amount of money that will be carried over from the previous year, plus estimates of local, state, and federal revenues.
According to KRS 160.470, local boards of education are required to adopt three budgets: the draft, the tentative, and the final working budget.
By January 31 of each year, a school board is required to develop and approve a draft budget for the upcoming fiscal year.

Legislative Research Commission Chapter 1 Office of Education Accountability
7
Tentative Budget. The second budget required by statute for the upcoming fiscal year is the tentative working budget, which must be approved by the local board of education by the end of May—1 month before the current fiscal year ends. At this point, the district has a more accurate estimate of the funds it will be able to budget, including the beginning balance. KRS 160.470 also requires that the district budget a “minimum reserve of two percent (2%) of the total budget.” Frequently the 2 percent reserve is referred to as a “contingency” or a “rainy day” amount. While no definition is provided by statute, it is generally considered that an amount of money should be reserved in a budget to ensure the district has adequate funds to cover emergency expenses. Each year, KDE performs a calculation to determine whether sufficient funds are reserved. To determine whether each district has at least a 2 percent contingency, KDE divides the budgeted contingency amount in the expenditure object code 0840 by all expenditures from Funds 1, 2, 310, 320, and 51. Working Budget. The third and final budget required to be approved by the local board of education and submitted to KDE is the working budget. The working budget is due by September 30 and is built on final fiscal data from the previous year, not estimated data. The budget includes the actual beginning balance, which is the carryover of unexpended funds from the previous year. While the statute does not require inclusion of a reserve or contingency amount in the working budget, KDE continues to require districts to budget at least 2 percent, as mandated for the tentative budget. After a district has received KDE approval of the working budget, there is no further review of district solvency until review of year-end fiscal data. Budget Beginning Balance. As described above, each district’s budget includes a beginning balance. The working budget uses an actual beginning balance based on the audited ending balance on the district’s balance sheet. A beginning balance is calculated using the prior year’s ending balance, less certain restricted and reserved money. Restricted/reserved funds are dedicated by the district for specified allowable purposes and uses. Examples of dollars not carried over to the next year include reserves for sick leave, debt service, and construction projects.
The tentative working budget must be approved by the local board of education by the end of May—1 month before the current fiscal year ends. This budget must contain a minimum contingency of 2 percent of the total budget.
The final budget required to be approved by the local board of education and submitted to KDE is the working budget. The working budget is due by September 30 and is built on final fiscal data from the previous year, not estimated data.
Each district’s budget includes a beginning balance. The working budget uses an actual beginning balance based on the audited ending balance on the district’s balance sheet.

Chapter 1 Legislative Research Commission Office of Education Accountability
8
Annual Financial Report KRS 157.060 requires educational institutions and school districts supported by taxpayers to report to the Kentucky Board of Education at the close of each scholastic year all detailed funds received from state and other sources along with detailed expenditures for the year. Each year, districts are required to submit to KDE, by July 25, an unaudited annual financial report. The AFR is a year-end summary of revenues and expenditures, and it provides breakdowns of budgeted amounts, actual expenditures, and the division of expenditures between district and school administration, and the amount spent on instruction as of June 30 each year. As set out by 702 KAR 3:110, the AFR and balance sheet must be submitted electronically. Balance Sheet The balance sheet shows a school district’s financial condition at a specific point in time. Balance sheets as of June 30 must be submitted to KDE by July 25 along with the AFRs. District finance officers provide the board of education a monthly balance sheet and should provide periodic estimates of ending fund balance to ensure compliance with statutes and regulations. One section of the balance sheet includes fund balances, which are classified as either reserved/restricted funds or unreserved/unrestricted funds. Reserved funds are resources that cannot be appropriated and spent, such as reserve for inventories or funds that are legally limited to being spent for a specific purpose. Upon approval of the board of education, reserved fund balances are restricted on a district’s balance sheets, and the money is set aside for the approved tentative plans. While the board may decide to restrict these funds for planning purposes, the board can, at any time, reverse its decision and use these funds for other purposes. For this reason, general fund reserved balances are included in calculating Kentucky’s districts’ end-of-year fund balances. The unreserved fund balance represents the amount available for appropriation in the next fiscal year that can be spent for any purpose the district chooses. Unreserved fund balances, prior-year encumbrances, and restricted for school based carryforward become the beginning balance on subsequent annual budgets. Reserved/restricted dollars remain on the balance sheet until the board acts to spend them. KDE uses specific balance sheet object codes to determine the undesignated fund balance of each district’s general fund, as
Districts are required to submit to KDE, by July 25, an unaudited annual financial report (AFR). The AFR is a year-end summary of revenues and expenditures, and it provides breakdowns of budgeted amounts.
The balance sheet shows a school district’s financial condition at a specific point in time. Balance sheets as of June 30 must be submitted to KDE by July 25 along with the AFR.
One section of the balance sheet includes fund balances, which are classified as either reserved/restricted funds or unreserved/unrestricted funds.

Legislative Research Commission Chapter 1 Office of Education Accountability
9
shown in Table 1.2. When the district’s undesignated fund balance is determined, it is divided by the total expenditures for Funds 1, 2, 310, 320, and 51 less the expense object code 0280 (on-behalf-of payments) to calculate the general fund’s ending balance percentage.1
Table 1.2 KDE Balance Sheet Object Codes for Undesignated Fund Balance
Object Code Purpose 8770 Unreserved fund balance 8755 Prior year encumbrances 8760 Restricted for site-based carry forward 8766 Restricted for future construction 8767 Other restricted fund balances 8769 Restricted net assets
Total District undesignated fund balance Source: Staff compilation of data from the Kentucky Department of Education.
Additional Guidance Federal and Business Requirements Currently, there are no national standards regarding how much public schools should maintain in their fund balances. However, the Government Finance Officers Association approved a best practices document in October 2009 on the appropriate level of unrestricted fund balance in the general fund (Government). It suggests governments should maintain a minimum of 2 months of general fund revenue or expenditures. A footnote suggests that a significantly lower minimum may be approved for school districts because they are in a better position to forecast contingency amounts, as school revenues and expenditures are more diverse and less volatile. It suggests that all governments establish a formal policy on fund balance and how much should be maintained. Three major bond rating companies—Moody’s Investors Service, Fitch, and Standard and Poor’s—state the importance of maintaining 5 to 10 percent of operating expenditures in the general fund balance for education. Critics of the current system of education budgeting contend that schools need to operate more like 1 OEA includes Fund 400 (debt service) and excludes fund transfer object codes in its calculation of undesignated fund balance. This is done to eliminate double-counting of expenditures. This calculation varies slightly from the KDE calculation and is used in the OEA District Data Profiles report.
There are no national standards regarding how much public schools should maintain in their fund balances. However, the Government Finance Officers Association suggests a minimum of 2 months of general fund revenue or expenditures.
Three major bond rating companies recommend maintaining 5 to 10 percent of operating expenditures in the general fund balance for education.

Chapter 1 Legislative Research Commission Office of Education Accountability
10
private businesses. Under this guidance, school districts would keep 1 to 3 months’ worth of general fund operating expenses. One month’s worth of general fund operating expense equates to a 6 percent balance using the current calculation in Kentucky. Chapter 2 discusses this in detail. GASB 54 Requirements The Governmental Accounting Standards Board has provided states with guidelines in public budgeting and accounting procedures. In its prior research, GASB found that the existing standards on fund balance were being misinterpreted by government agencies and that the public was having difficulty interpreting fund balance and financial statements. The objective of the new GASB 54 reporting requirements was to enhance the usefulness of fund balance and provide clearer classifications for fund balance usage. Classifications are established to define the hierarchy constraints imposed on the use of these funds. Depending upon which entity mandates the constraint determines the classification balance sheet codes. They are classified by the legislative body, the local board, and the superintendent or committees approved by the superintendent. All governmental agencies are to implement these standards for the June 30, 2011, financial reporting period. The new GASB categories on a district’s balance sheet will appear as nonspendable fund balance, restricted fund balance, committed fund balance, assigned fund balance, and unassigned fund balance. Nonspendable fund balances include items that are not expected to be converted to cash, such as inventories, and will also include the long-term amount of loans. Restricted fund balances are amounts that can be spent only for a specific purpose stipulated by a constitutional provision or legislation. This includes districts’ grant funds, capital outlay, and FSPK funds that are unspent at year end. The committed and assigned fund balances are similar in nature, and some agencies will have only one of these classifications. The committed fund balance is imposed by the government’s highest level of decision-making authority, such as legislation, resolution, or ordinance. These funds cannot be used for any other reason unless the government takes action to recommit funds. Assigned fund balances are set aside for a specific purpose, to be used by the governing body itself, by a committee, or by someone to whom the board delegates authority. Both assigned and committed balances have constraints placed on them to be used for a specific purpose. Unassigned fund balances are what are left after districts have
The Governmental Accounting Standards Board (GASB) has provided states with guidelines in public budgeting and accounting procedures. In its prior research, GASB found that the existing standards on fund balance were being misinterpreted by government agencies and that the public was having difficulty interpreting fund balance and financial statements.

Legislative Research Commission Chapter 1 Office of Education Accountability
11
assigned all other funds. This account is used only in the general fund, unless another fund has a deficit. Other States’ Requirements OEA contacted surrounding states and states belonging to the Southern Regional Education Board to determine any statutory requirements for end-of-year general fund balances and the calculation methods. The results of this review are in Appendix B. Of the 13 states surveyed, including Kentucky, about one-third require districts to maintain a minimum amount in their general funds. Of those requiring a minimum, two states also require a cap on the maximum allowed. Two states do not require a minimum fund balance but do place limits on the maximum. Of the 13 states surveyed, 4 require caps on the maximum general fund balance allowed. Several states require districts either to reserve their fund balances, rainy day funds, or cash flow reserves on their balance sheets or to record them in a separate fund. Thus, no requirement is necessary in the budgeting process.


Legislative Research Commission Chapter 2 Office of Education Accountability
13
Chapter 2
The General Fund
The primary operating fund for districts is called the general fund, coded as Fund 1. Districts pay most major expenses, including student transportation; building maintenance; general operating, such as electric, phone, and other utility bills; supplies; and the majority of employee salaries and benefits from the general fund. This chapter reviews school district fiscal data gathered from districts’ annual financial reports, balance sheets, and working budgets submitted to KDE. AFRs and balance sheets are reported yearly and provide detailed district finance information, such as projected revenue, how funds were spent, and the financial condition of each district as of June 30. This chapter reports accumulated general fund balances for each district and provides districts’ explanations for these balances. OEA analysis of data in this chapter shows that few districts fall below the state-required minimum reserve; however, several districts have balances above what major bonding rating companies and Government Finance Officers Association recommends as best practices. Fund balances vary substantially by district, and superintendents are leery of moving forward with projects because of the financial uncertainty in the past couple of years.
Organization of the Chapter The first section of this chapter presents an overview of revenue sources and amounts recorded in districts’ general fund. Some districts invest funds to earn interest at a higher rate than from banks’ standard checking accounts; thus, investments as reported on districts’ balance sheets are presented. Trend data from FY 2005 through FY 2009 general fund ending balances and districts’ explanations of those balances are presented. The chapter also reviews how accurately districts budget revenues, expenditures, and anticipated ending balances. The chapter concludes with the results from OEA’s survey of superintendents, including their comments on general fund balances.
The primary operating fund for districts is called the general fund, coded as Fund 1. Districts pay most major expenses, including student transportation; building maintenance; general operating, such as electric, phone, and other utility bills; supplies; and the majority of employee salaries and benefits from the general fund.
OEA analysis of data in this chapter shows that few districts fall below the state-required minimum reserve; however, several districts have balances above what major bonding rating companies and the Government Finance Officers Association recommends as best practices.
The first section of this chapter presents an overview of revenue sources and amounts recorded in districts’ general fund. The chapter reviews how accurately districts budget revenues, expenditures, and anticipated ending balances and concludes with the results from OEA’s survey of superintendents.

Chapter 2 Legislative Research Commission Office of Education Accountability
14
Revenues General fund revenues come largely from state and local sources, with a small amount from federal sources. The majority of the school districts’ state revenue comes through the Support Education Excellence in Kentucky funding system, implemented in 1990 as part of the Kentucky Education Reform Act. Local revenue comes through local taxes levied, such as property, motor vehicle, utilities, and occupational taxes. Federal revenue in this fund comes mainly from Medicaid reimbursements. State revenues accounted for approximately 59 percent of all revenues recorded in districts’ general funds in FY 2009. Local revenues accounted for approximately 41 percent. In FY 2005, state revenues were roughly 60 percent, and local revenues were 40 percent. Federal sources of funding make up less than 1 percent of general fund revenues. Between FY 2005 and FY 2009, total federal dollars fluctuated from $5.9 million to $5.7 million. Figure 2.A shows that state revenues recorded in the general fund increased by $416.6 million from FY 2005 to FY 2009, and local revenues across the state increased by $352.3 million. When adjusted for inflation, state revenue increased by $199 million and local revenue increased by $200 million from FY 2005 through FY 2009. In total, the real general fund revenues districts received increased by $768.9 million, and inflation-adjusted revenues increased by $319 million. While the percentage of local, state, and federal funds did not fluctuate much between FY 2005 and FY 2009, there is wide variation in the amounts received through these three streams of revenue at the district level.
General fund revenues come largely from state and local sources, with a small amount from federal sources. The majority of the school districts’ state revenue comes through the Support Education Excellence in Kentucky (SEEK) funding system.
State revenues accounted for approximately 59 percent of all revenues recorded in districts’ general funds in FY 2009. Local revenues accounted for approximately 41 percent.
State revenues recorded in the general fund increased by $416.6 million from FY 2005 to FY 2009, and local revenues across the state increased by $352.3 million. Federal sources of funding make up less than 1 percent of general fund revenues.

Legislative Research Commission Chapter 2 Office of Education Accountability
15
Figure 2.A General Fund Revenue by Local and State Sources
Inflation-adjusted and Nominal Dollars FY 2005-FY 2009
Source: Staff analysis of data from the Kentucky Department of Education.
The amount of SEEK funds received by a district depends on student population factors such as the number of students transported and the number of at-risk, home hospital, and exceptional students. District wealth is also an important factor that affects state funding through SEEK; wealthier districts generate more local revenue than less wealthy districts and receive less SEEK funding. Appendix C provides a breakdown of per-pupil local, state, and federal revenues recorded in each district’s general fund for FY 2009. Table 2.1 compares local and state funding streams at Anchorage Independent, East Bernstadt Independent, and Bracken County and highlights how district wealth influences district funding. Anchorage Independent received 87.1 percent of its general fund revenue through local revenue, while state funds supplied 12.9 percent in FY 2009. In total, Anchorage Independent had approximately $14,490 per pupil in general fund revenues. In contrast, East Bernstadt Independent received 8.6 percent of its total general funds through local revenue and 91.3 percent from state funds, and had $6,096 per pupil in general fund revenues.
1,000
1,200
1,400
1,600
1,800
2,000
2,200
2,400
2,600
2005 2006 2007 2008 2009
Fund
Rev
enue
s ($
in m
illio
ns)
State nominal
State adjusted
Local nominal
Local adjusted
District wealth is an important factor that affects state funding through SEEK; wealthier districts generate more local revenue than those that are less wealthy.
Anchorage Independent received 87.1 percent of its general fund revenue through local revenue, while state funds supplied 12.9 percent in FY 2009. East Bernstadt Independent received 8.6 percent of its total general funds through local revenue and 91.3 percent from state funds.

Chapter 2 Legislative Research Commission Office of Education Accountability
16
Table 2.1 Per-pupil Local, State, and Total Local and State Funding With Percentage, FY 2009
Local Funding
State Funding
Total Local and State Funding
District Percent Per-pupil Percent Per-pupil Per-pupil Anchorage Ind. 87.1% $12,619 12.9% $1,871 $14,490East Bernstadt Ind. 8.6 522 91.3 5,568 6,090Bracken Co. 15.4 895 84.5 4,905 5,800State Average 41.1% $2,896 58.8% $4,139 $7,035Note: Table does not include federal funding, which is generally less than 1percent for all districts. Source: Staff analysis of data from the Kentucky Department of Education.
Of all districts, Anchorage Independent received the smallest amount of state revenue in the general fund, only $1,871 per pupil in FY 2009. East Bernstadt Independent received the most state funding, $5,568 per pupil. Bracken County received the lowest amount of total general fund dollars, $5,804 per pupil. The gap between the per-pupil total general fund revenue available to Bracken County compared to that for Anchorage Independent was $8,686. The state average was $7,044 per student in total revenue in the general fund.
Investments At various times during the year, districts may have significant amounts of cash. Some districts invest to earn more than the minimum interest paid through standard checking accounts. Staff analyzed districts’ balance sheets to see how many districts were investing funds as of June 30 of each year and found that nearly half of the districts indicated they invested their funds. Fiscal data collected from districts do not permit analysis of individual investment performance or interest earned on investments. Staff analysis, shown in Figure 2.B, found that districts that invested funds had higher fund balances than did noninvesting districts. Between FY 2008 and FY 2009, fund balances of investing districts and non-investing districts increased at about the same rate, but those that invested maintained their lead.
Anchorage Independent received the smallest amount of state revenue in the general fund, only $1,871 per pupil. East Bernstadt Independent received the most per-pupil state funding, $5,568.
At various times during the year, districts may have significant amounts of cash. Some districts invest to earn more than the minimum interest paid through standard checking accounts.
Districts that invested funds over the last 5 years had higher fund balances than noninvesting districts.

Legislative Research Commission Chapter 2 Office of Education Accountability
17
Figure 2.B Per-pupil Fund Balances for Districts With and Without Investments, FY 2005-FY 2009
Source: Staff analysis of data from the Kentucky Department of Education.
District End-of-year Fund Balances and Percentages The percentage of fund balance is derived by aggregating certain identified fund balance codes and dividing that sum by the total expenditures in all funds less on-behalf-of payments. There is no statutory year-end balance requirement, but KDE uses the threshold of 2 percent when determining fiscal solvency. KDE does not review or analyze the dollar amount saved or the stated purpose of the funds reserved. Districts’ fund balances grew in constant dollars from approximately $523 million in FY 2005 to approximately $774 million in FY 2009, exceeding the rate of inflation. However, a review of individual districts showed that $122.5 million of the increase came from the two largest districts in the state. Jefferson County’s fund balance grew by approximately $77 million, and Fayette County’s grew by approximately $45.5 million, accounting for about half of the total growth. Jefferson County ended FY 2009 with a fund balance of 13.4 percent and Fayette County ended with 23.8 percent.
600
700
800
900
1,000
1,100
1,200
1,300
1,400
1,500
1,600
2005 2006 2007 2008 2009
Per-
pupi
l end
-of-
year
fund
bal
ance
s ($)
With investments
Without investments
The percentage of fund balance is derived by aggregating certain identified fund balance codes and dividing that sum by the total expenditures in all funds less on-behalf-of payments.
Districts’ fund balances grew in current dollars from approximately $523 million in FY 2005 to approximately $774 million in FY 2009, However, $122.5 million of the increase came from the two largest districts in the state.

Chapter 2 Legislative Research Commission Office of Education Accountability
18
The number of districts with increasing and decreasing fund balances from FY 2005 to FY 2009 has fluctuated. From FY 2008 to FY 2009, 58 districts’ fund balances declined, and 116 districts’ fund balances increased, as shown in Figure 2.C. This change was more pronounced than in any of the previous years, reflecting more districts with increasing balances and fewer districts with decreasing balances.
Figure 2.C Number of Fund Balance Increases or Decreases, Annual Change
Source: Staff analysis of data from the Kentucky Department of Education.
As shown in Figure 2.D, there was a large range of year-end balance percentages across districts in FY 2009. A number of factors influenced these results, such as district revenue and expenditures, facility needs, district wealth, and previously incurred district debts. In order to better understand this issue, staff analyzed finance data, surveyed all superintendents, and interviewed finance officers in districts with fund balances of 20 percent or higher. Figure 2.D shows that at the end of FY 2009, only two districts fell below the 2 percent minimum. Eighteen districts ended at 2-5 percent. One hundred districts had an ending fund balance of 11 percent or more. The median year-end balance for FY 2009 was 12 percent. Appendix D includes the data used in this calculation, including each district’s fund balance, total expenses, and fund balance percent for FY 2009. Appendix E includes districts’ general fund balances and percent of fund balance for FY 2005 to FY 2008.
0
20
40
60
80
100
120
2006 2007 2008 2009
Num
ber
of D
istr
icts
Fiscal Years
Number of Districts Increasing Number of Districts Decreasing
From FY 2008 to FY 2009, 58 districts’ fund balances declined, and 116 districts’ fund balances increased.
A number of factors influence the large range of year-end balance percentages across districts in FY 2009, such as district revenue and expenditures, facility needs, district wealth, and previously incurred district debts.
At the end of FY 2009, only 2 districts fell below the 2 percent minimum, 18 districts ended at 2-5 percent, and 100 districts had an ending fund balance of 11 percent or more.

Legislative Research Commission Chapter 2 Office of Education Accountability
19
Figure 2.D Range of Fund Balance Percentages, FY 2009
Source: Staff analysis of data from the Kentucky Department of Education.
While the change in absolute dollar amounts has steadily increased, the fund balance percentage for the state has remained relatively stable. Figure 2.E breaks down Kentucky districts into two categories: 1) Jefferson County and Fayette County combined and 2) the aggregate of all other districts. The fund balance percentage has remained flat for the rest of the state, ranging from 12 to 13 percent. The fund balance percentage has more than doubled for the combined districts of Jefferson and Fayette. In 2009, Fayette had more than $13 million restricted on its balance sheet for construction projects and $5 million for sick leave, litigation, and energy cost, causing the fund balance percentage to be about 23 percent. Jefferson County has major cash flow issues from July until October each year, resulting in the need to keep more than $71 million to cover operational expenses during this time. Jefferson ended FY 2009 with a little more than 13 percent fund balance.
0
10
20
30
40
50
60
< 2 2-5 6-10 11-15 16-20 21-25 26-30 >30
Num
ber o
f Dis
tric
ts
Fund Balance Percentage
While the change in absolute dollar amounts has steadily increased, the fund balance percentage for the state has remained relatively stable.

Chapter 2 Legislative Research Commission Office of Education Accountability
20
Figure 2.E Changes in Fund Balance Percentage, FY 2005-2009
Note: JCPS and FCPS refer to Jefferson County Public Schools and Fayette County Public Schools, respectively. Source: Staff analysis of data from the Kentucky Department of Education.
Staff contacted all districts with at least a 20 percent fund balance in the general fund, seeking additional explanation for the seemingly large fund balances. Some districts with high balances had properly coded the restrictions for some of the funds, but others had not. Superintendents reported that balances reflect the need to cover construction projects, bonding that the building fund could not finance, and unforeseen emergency expenditures. Appendix F includes responses from superintendents describing their intended uses of fund balances.
Restrictions/Reserve Accounts Through the chart of accounts, based on government guidance, KDE provides specific approved codes to reserve and restrict funds. However, KDE does not provide any analysis or guidance regarding these funds. At present, there is no policy or regulation specifying the amount of funds that can be restricted or the length of time the funds may be reserved. Districts reported reserving funds for technology needs, bus purchases, and instructional programs, but more balance sheet codes are needed to accurately reflect the reasons why some districts have high fund balances. This would promote public transparency.
0%
2%
4%
6%
8%
10%
12%
14%
16%
18%
2005 2006 2007 2008 2009
Fund
Bal
ance
Per
cent
age
JCPS & FCPS Rest of State
Superintendents in districts with at least a 20 percent fund balance reported that balances reflect the need to cover construction projects, bonding that the building fund could not finance, and unforeseen emergency expenditures.

Legislative Research Commission Chapter 2 Office of Education Accountability
21
In FY 2009, nearly $102 million was restricted on districts’ balance sheets in the general fund that was included in the fund balance calculation. OEA contacted all districts that had funds restricted in FY 2009 to determine reasons for the restrictions and found that $45.5 million, or 45 percent of the restricted funds, was intended to be used for construction or bonding needs. The remaining amounts were targeted to various purposes and are detailed in Appendix G. On the 2009 balance sheets, approximately $10.4 million, or 10 percent of the total restricted funds, was inaccurately coded. Several districts used codes that are not part of the chart of accounts and are reflected in Appendix F as “unknown.” The use of accurate object codes is important because KDE’s annual district end-of-year fund calculation includes only amounts coded accurately. As a result of inaccurate coding, seven districts’ fund balances were understated in FY 2009 by KDE. Restricted for Sick Leave Districts have the option to restrict or escrow part of their money for unused sick leave payments. KRS 157.420(3) allows this escrow account but limits the account to contain no more than 50 percent of the maximum liability for the current year. These dollars cannot be used for any other purpose and cannot be considered part of the general fund balance when determining available local revenue for the facilities’ unmet-need calculation. KDE also does not include this account when it is determining the end-of-year fund balance. Staff analysis found examples of districts that appear to be restricting more than allowed. The median planned or restricted sick leave amount in FY 2009 was about $90,000; however, the median amount spent on sick leave payouts was less than $40,000, a 49 percent difference. OEA’s cursory review of these accounts from FY 2005 through FY 2009 found that some districts have not adjusted their balances for 5 years. The number of personnel eligible to retire each year fluctuates; therefore, districts’ restrictions should change accordingly. Because these funds are excluded from unmet-need and fund balance calculations, it is imperative that districts restrict the proper amount.
In FY 2009, nearly $102 million was restricted on districts’ balance sheets in the general fund, and $45.5 million, or 45 percent of the restricted funds, was intended to be used for construction or bonding needs.
On the 2009 balance sheets, approximately $10.4 million, or 10 percent of the total restricted funds, was inaccurately coded. Several districts used codes that are not part of the chart of accounts.
The median planned or restricted sick leave amount is approximately $90,000; however, the median amount spent on sick leave payouts was less than $40,000.
Some districts have not adjusted their sick leave balances from FY 2005 through FY 2009.

Chapter 2 Legislative Research Commission Office of Education Accountability
22
Year-end Fund Balance Cap The range of year-end balance amounts varies greatly depending on what future expenses the district has identified. While there is an enforced minimum balance requirement for budgeting purpose, there is not a limit on the maximum amount of funds a district can hold at the end of a fiscal year. In the past, KRS 157.615 capped year-end fund balances at 10 percent, and anything over 10 percent had to be restricted on the districts’ balance sheets for School Facilities Construction Commission (SFCC) purposes. Because use of SFCC funds is restricted to top-priority needs on the district facility plan, districts were reluctant to let those funds accumulate. In 2001, this provision was removed, allowing districts to end the year with an unlimited fund balance. Districts are not required to submit future spending plans that outline how large fund balances are to be spent. According to the GFOA research bulletin on unreserved fund balance, an informal standard of fund balance threshold for governments should not be in excess of 10 percent of annual operating expenditures (School). Anything over that should be examined carefully, and appropriate justification for maintaining that level should be documented. OEA interviews with district finance officers found that most districts have made tentative plans to spend their fund balances.
Comparisons of Budgeted Contingency to Actual End-of-year Fund Balance
To determine accuracy in budgeting, staff compared the budgeted contingencies on the districts’ working budgets to actual year-end amounts on districts’ balance sheets. When comparing these two items, staff included only those funds that would be included on the beginning balance of a budget, leaving out restricted funds not carried over, to more accurately reflect the working budget. As shown in Figure 2.F, there is a large discrepancy between the median amounts of both revenue and expenditures budgeted when compared to the median actual revenue and expenditures reported on districts’ year-end AFRs. Districts appear to be conservative with their projections, underbudgeting revenues while overestimating expenditures. The estimated contingency or reserve amount in the working budget should be closely aligned with the year-end fund balance amount.
Districts are not required to submit future spending plans that outline how large fund balances are to be spent.
Districts appear to be conservative with their projections, underbudgeting revenues while overestimating expenditures. The estimated contingency or reserve amount in the working budget should be closely aligned with the year-end fund balance amount.

Legislative Research Commission Chapter 2 Office of Education Accountability
23
Figure 2.F Comparison of Budgeted to Actual Contingency, Revenue, and Expenses, FY 2009
Source: Staff compilation of data from the Kentucky Department of Education.
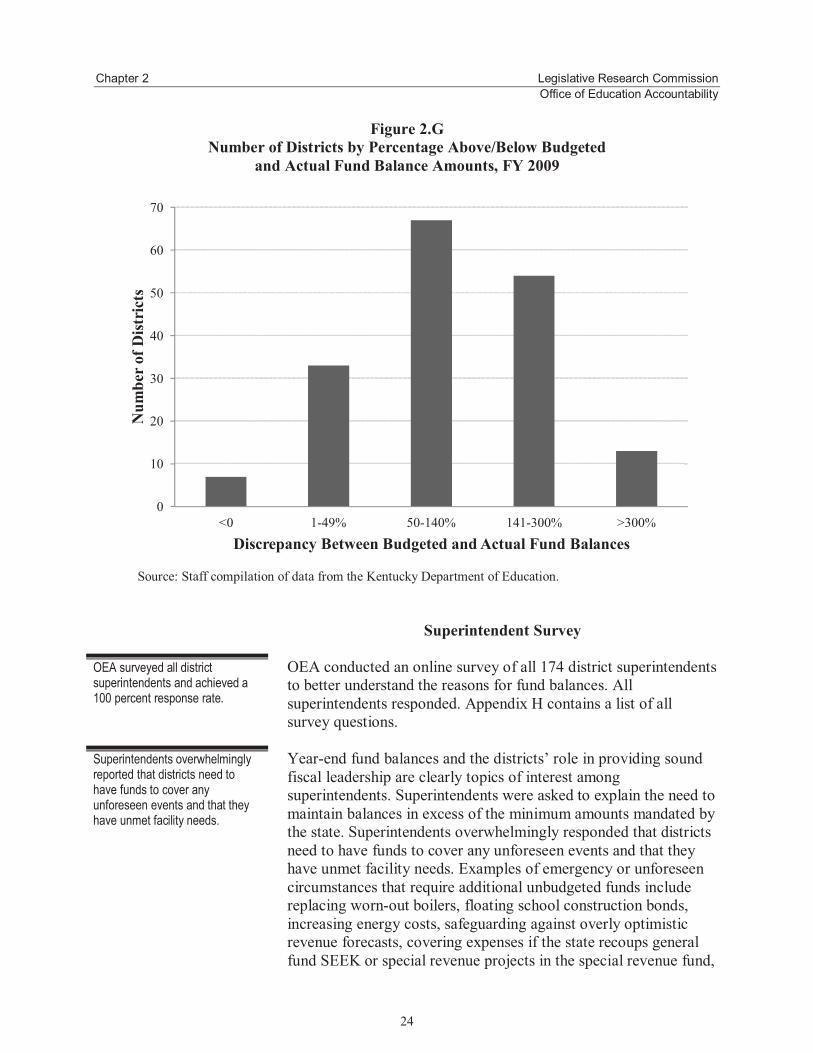
Figure 2.G shows that seven districts spent more than they had budgeted in contingency. Local boards of education are required by 702 KAR 3:050 to submit an application to KDE before exceeding their budgets. However, KDE stated that this regulation has not been enforced, resulting in districts spending more funds than budgeted. Thirty-three districts estimated their anticipated fund balance within 50 percentage points, while 67 district estimates were off by at least 141 percent, one being off by 1,037 percent.
0
2
4
6
8
10
12
14
16
Contingency/Fund Balance Revenue Expenses
Tota
l dol
lars
($ in
mill
ions
)
Median Budgeted Median Actual
Seven districts spent more than they had budgeted in contingency. Local boards of education are required by 702 KAR 3:050 to submit an application to KDE before exceeding their budgets. However, KDE stated that this regulation has not been enforced, resulting in districts spending more funds than budgeted.
Chapter 2 Legislative Research Commission Office of Education Accountability
24
Figure 2.G Number of Districts by Percentage Above/Below Budgeted
and Actual Fund Balance Amounts, FY 2009
Source: Staff compilation of data from the Kentucky Department of Education.
Superintendent Survey OEA conducted an online survey of all 174 district superintendents to better understand the reasons for fund balances. All superintendents responded. Appendix H contains a list of all survey questions. Year-end fund balances and the districts’ role in providing sound fiscal leadership are clearly topics of interest among superintendents. Superintendents were asked to explain the need to maintain balances in excess of the minimum amounts mandated by the state. Superintendents overwhelmingly responded that districts need to have funds to cover any unforeseen events and that they have unmet facility needs. Examples of emergency or unforeseen circumstances that require additional unbudgeted funds include replacing worn-out boilers, floating school construction bonds, increasing energy costs, safeguarding against overly optimistic revenue forecasts, covering expenses if the state recoups general fund SEEK or special revenue projects in the special revenue fund,
0
10
20
30
40
50
60
70
<0 1-49% 50-140% 141-300% >300%
Num
ber o
f Dist
rict
s
Discrepancy Between Budgeted and Actual Fund Balances
OEA surveyed all district superintendents and achieved a 100 percent response rate.
Superintendents overwhelmingly reported that districts need to have funds to cover any unforeseen events and that they have unmet facility needs.

Legislative Research Commission Chapter 2 Office of Education Accountability
25
and covering payroll expenses during the first part of the year before the collection of local property taxes. Another concern of superintendents is ensuring adequate cash flow to cover fiscal obligations throughout the year. Superintendents were asked if districts had to borrow funds for cash flow. Some districts reported having cash flow problems such as meeting payroll requirements, but only seven districts had to borrow funds in the past 5 years to meet expense obligations. Two reported that late property tax receipts resulted in cash flow problems. The survey also asked superintendents for their opinions on the minimum level of funds necessary to hold in reserve. Superintendents in only 14 districts said the current 2 percent requirement is sufficient to meet their district’s needs, those in 52 said the minimum requirement should be 5 percent, and those in 15 districts said it should be more than 10 percent. Districts were also asked to explain their recommended minimum. Fifty-eight of the 174 superintendents said the requirement should be minimally set at 1 month of general fund total expenditures. Thirty-seven superintendents said that an increase in the minimum fund balance was needed for funding cuts, new buildings and maintenance, and the unknowns of the economy; however, they did not specify whether fund balance should be an additional 1, 2, or 3 months of general fund operating expenses. Eighteen superintendents reported they would have cash flow issues if they did not keep above the 2 percent requirement. Many superintendents said high fund balances reflect prudent fiscal behavior that represents district foresight in dealing with an uncertain fiscal future. According to one respondent,
…we have worked very hard for years to build up a healthy contingency that will allow us to absorb excess operational costs of opening our new High School. … It would be a disservice to our students and taxpayers to reduce our district's funding simply because we have been resourceful enough to plan ahead for our students' future needs.
Judging from superintendents’ opinions and current best practice suggestions, support exists for increasing mandated budgeted reserves and year-end balances. As of FY 2009, more than half of Kentucky school districts had a fund balance of 12 percent or greater, which is equivalent to 2 months or more of expenses. About 30 percent of districts had a balance of 18 percent or greater, which is equivalent to 3 months or more of expenses.
Superintendents want to ensure adequate cash flow to cover fiscal obligations throughout the year. A few superintendents acknowledged that extra cash is sometimes needed in June, July, and August to cover payroll before the collection of property tax revenue.
Fifty-eight of the 174 superintendents said the minimum fund balance requirement should be set at 1 month of general fund total expenditures.
Many superintendents said high fund balances reflect prudent fiscal behavior that represents districts’ foresight in dealing with an uncertain fiscal future.
Approximately half of Kentucky school districts had a fund balance of 12 percent or greater, which is equivalent to 2 or more months of expenses.

Chapter 2 Legislative Research Commission Office of Education Accountability
26
About one-third of districts ended the year with balances in excess of 18 percent, while 20 districts ended the year with fund balances below 6 percent, or 1 month of expenses. Thus, only a few districts would have difficulty meeting a higher minimum balance requirement of at least 6 percent, or 1 month of expenses. Other Superintendent Concerns A number of superintendents pointed out that reported fund balances are not accurate reflections of districts’ fiscal health. Fund balances are a snapshot of a district’s fiscal situation on June 30. Over the course of an academic year, the fund balances fluctuate. Typically, available funds peak when property taxes are collected in November and December and are lower during other times of the year. Superintendents pointed out that the fund balance is reported without any context. It does not reflect pending investments in school infrastructure or emergency expenditures that all districts must manage. Many superintendents expressed frustration over budget constraints affecting Kentucky. They expressed concern about unfunded mandates in light of possible decreases in SEEK funding. As reasons to maintain fund balances, superintendents listed issues and programs that add to costs already incurred by districts, including mandated salary raises, purchasing new buses, renovating older buildings, implementing response to intervention, purchasing textbooks, Flex Focus cuts, potential fringe benefits increases associated with House Bill 540 in the 2010 legislative session, and hedging against sick leave pay for retirees.1 One superintendent noted that auditors recommended a reserve that would cover 3 to 6 months of operating expenses. Superintendents expressed concern that assumptions about large fund balances are unfounded. Some cited construction of new schools and facilities as reasons their districts carried seemingly large fund balances; superintendents reported that they have built up their fund balances over many years to complete such projects.
1 Flex Focus provides money for extended school services, preschool professional development, textbooks, and safe schools.
A number of superintendents pointed out that reported fund balances do not reflect pending investments in school infrastructure or emergency expenditures that all districts must manage.
Many superintendents highlighted concern about unfunded mandates in light of possible decreases in SEEK funding.
Superintendents expressed concern that assumptions about large fund balances are unfounded.
Legislative Research Commission Chapter 3 Office of Education Accountability
27
Chapter 3
Other Major Funds
Chapter 3 focuses on the major funds, other than the general fund, districts have in their financial system. These include the special revenue fund (Fund 2), capital outlay (Fund 310), building fund (Fund 320), construction fund (Fund 360), and food service fund (Fund 51). Data used in this chapter are reported from districts’ annual financial reports and balance sheets submitted to the Kentucky Department of Education.
Organization of the Chapter This chapter is divided into several sections, each devoted to the funds identified above. The analysis focuses on the types of revenues the fund receives and the restricted uses of these revenues. Staff also analyzed the districts that have used capital outlay funds for maintenance, operational expenses, and insurance over the past 5 years, as this is a recent flexibility provided by legislators.
Special Revenue Fund The special revenue fund includes local, state, and federal grants or projects local districts receive that must be spent on specific purposes. Examples of local grants include Crusade for Children and funds run through fiscal courts to local school districts. Examples of state grants include Safe Schools, Extended School Services, Textbooks, and Family Resource/Youth Service Center. Examples of federal grants include Title 1 funds used for economically disadvantaged children; Individuals with Disabilities Act funds used for special education; and Perkins funds used for vocational programs. Grants in this fund can be spent over multiple years, so the fund is commonly referred to as a multiyear fund. Because each individual grant stipulates how money must be spent, there are no governing state statutes or regulations.
Chapter 3 focuses on districts’ other major funds. These include the special revenue fund (Fund 2), capital outlay (Fund 310), building fund (Fund 320), construction fund (Fund 360), and food service fund (Fund 51).
The special revenue fund includes local, state, and federal grants or projects local districts receive that must be spent on specific purposes. Grants in this fund can be spent over multiple years, so the fund is commonly referred to as a multiyear fund.

Chapter 3 Legislative Research Commission Office of Education Accountability
28
Revenues Revenues in the special revenue fund come from local, state, and federal sources. For FY 2009, federal revenue was 63 percent of total funding, while 33 percent came from the state and 4 percent came from local sources. In FY 2005, 66 percent of total dollars came from federal sources, down 3 percent in FY 2009. As shown in Table 3.1, total revenue has fluctuated. State revenues dropped from $306.5 million in FY 2008 to $269.5 million in FY 2009 due to a reduction in Flex Focus funds and the commissioner using the commonwealth school improvement funds for implementing No Child Left Behind. Appendix I includes a breakdown of each district by revenue source for FY 2009.
Table 3.1 Special Revenue Fund Revenues by Local, State, and Federal Sources
FY 2005-FY 2009
Fiscal Year Local
Revenue State RevenueFederal Revenue Total Revenue
2005 $24,162,218 $221,991,087 $487,737,803 $733,891,1082006 29,235,958 252,453,613 507,866,457 789,556,0282007 34,279,728 293,936,481 493,526,458 821,742,6672008 34,233,296 306,569,475 508,351,561 849,154,3322009 36,023,969 269,571,545 517,657,533 823,253,047
Source: Staff analysis of data from the Kentucky Department of Education. Fund Balance The special revenue fund is a multiyear fund, meaning the projects and grants are spent over multiple years. Unlike the general fund, for which certain accounts at the end of the year roll into the beginning balance for the next year, the special revenue fund should never have a beginning balance. Revenue received by districts before closing the fiscal year for work that has yet to be completed is commonly called unearned revenue. These revenues are classified as deferred revenue on the balance sheet. Table 3.2 shows the special revenue fund balance from FY 2005 to FY 2009. Districts seem to have increased fund balances in reaction to economic uncertainty. It should be noted that this table does not reflect what districts still have available to spend in each individual grant. In FY 2007, six districts ended with a deficit balance, causing the overall state total to be negative. Appendix J includes school districts’ fund balances for FY 2009 for the special revenue fund.
For FY 2009, federal revenue makes up 63 percent of total funding, while state and local revenue make up 33 percent and 4 percent, respectively.
The special revenue fund is a multiyear fund.

Legislative Research Commission Chapter 3 Office of Education Accountability
29
Table 3.2 Special Revenue Fund Balance,
FY 2005-FY 2009
Fiscal Year Total Fund Balance 2005 $2,924,354 2006 3,013,000 2007 (1,864,464) 2008 4,172,404 2009 4,418,120
Source: Staff analysis of data from the Kentucky Department of Education.
Capital Outlay Fund The capital outlay fund was originally created for districts to spend revenues on direct payment of construction costs and debt service; however, budget language and recent changes to KRS 157.420 have allowed districts to also purchase land and pay for maintenance repairs, insurance, and general operating expenses. The General Assembly, in KRS 160.599, created the emergency revolving school loan fund account for districts experiencing the following conditions: loss of physical facilities due to fire or natural disaster, insufficient insurance on facilities to replace the loss, being bonded to capacity with insufficient resources to meet capital outlay needs, or failure of the sheriff to timely collect local tax revenues. 702 KAR 4:100 sets out the procedures for receiving and repaying loans from this fund. According to KDE, the revolving loan fund had a balance of $1 million; however, because districts had not used this fund in the past several years, Executive Order 2008-0111 took the fund’s money on January 4, 2008, as part of a budget reduction act. Revenues Since 1954, districts have received $100 per adjusted average daily attendance provided through the SEEK formula to spend on capital outlay expenditures. The only other revenue districts receive in this fund is interest accrued from interest bearing bank accounts. Table 3.3 shows the capital outlay revenues from FY 2005 to FY 2009.
The capital outlay fund was originally spent on direct payment of construction costs and debt service; however, budget language and recent changes to KRS 157.420 allow for additional expenses.
Since 1954, districts have received $100 per adjusted average daily attendance provided through the SEEK formula to spend on capital outlay expenditures.

Chapter 3 Legislative Research Commission Office of Education Accountability
30
Table 3.3 Capital Outlay Fund by Local and State Sources
FY 2005-FY 2009
Fiscal Year Local Revenue State Revenue Total Revenue 2005 $250,363 $57,730,520 $57,980,883 2006 422,937 58,205,256 58,628,193 2007 701,438 58,686,849 59,388,287 2008 524,281 58,840,282 59,364,563 2009 376,059 59,027,249 59,403,308
Source: Staff analysis of data from the Kentucky Department of Education. Fund Balance Districts that end with a fund balance in odd-numbered years must restrict any available funds on the balance sheet on July 1 to participate in the School Facilities Construction Commission. In FY 2009, 77 districts—or 44 percent of all districts—ended the year without any available funds in the capital outlay fund. Table 3.4 shows the total available capital outlay funds from FY 2005 to FY 2009. This breakdown shows the amounts restricted for SFCC construction projects as well as what is available to be spent on non-SFCC projects. From FY 2005 to FY 2008, the capital outlay budget grew by about 38 percent, but the SFCC balance dropped by $3 million in FY 2009. Appendix J includes school districts’ fund balances for FY 2009 for the capital outlay fund.
Table 3.4
Capital Outlay Fund Balance FY 2005-FY 2009
Fiscal Year
School Facilities Construction Commission Other
Total Fund Balance
2005 $8,709,011 $9,106,003 $17,815,014 2006 10,431,876 12,377,560 22,809,436 2007 11,030,614 11,671,367 22,701,981 2008 12,127,296 12,385,809 24,513,105 2009 9,164,416 12,814,595 21,979,011
Source: Staff analysis of data from the Kentucky Department of Education.
Districts that end with a fund balance in odd-numbered years must restrict any available funds on the balance sheet on July 1 to participate in the School Facilities Construction Commission (SFCC). In FY 2009, 77 districts—or 44 percent of all districts—ended the year without any available funds in the capital outlay fund.

Legislative Research Commission Chapter 3 Office of Education Accountability
31
Maintenance, Insurance, and General Operating Staff review found that the amount of FY 2009 capital outlay funds spent on maintenance and property insurance varied depending on how districts coded these expenses. Districts were instructed by KDE to code these expenditures to a specific function code and object code to enable expenditure tracking. However, staff performed the calculation using the specific function code and object code as instructed by KDE and again using object code only. It appears some districts failed to use the correct function code. Table 3.5 shows that the difference between the two calculations is approximately $1.1 million. As more funds in capital outlay are spent on normal general fund expenditures, this situation leaves less for districts to spend on facility unmet needs and may need to be reviewed in the future.
Table 3.5 Maintenance and Property Insurance Spent Out of Capital Outlay
by Object Codes and Function Codes, FY 2009
Expenditure
Amount by
Object Code
Amount by Function and Object Code Difference
Maintenance $6,877,629 $5,776,180 $1,101,449 Property Insurance 6,220,026 5,278,751 941,275
Source: Staff analysis of data from the Kentucky Department of Education.
Building Fund
The building fund was authorized by the General Assembly in 1990. KRS 157.440 governs this fund and limits spending to debt service on facility bond issues, new facilities, and major renovations of existing facilities as listed in the district’s approved facility plan. Allowable expenditures include purchase of sites, construction and equipping of new school buildings, and debt service on facility bond issues. Revenues The building fund records the revenue of the Facilities Support Program of Kentucky. Districts levy a 5-cent equivalent tax per $100 in assessed property value that is earmarked for facilities. This local tax is equalized by the state at 150 percent of the statewide average per-pupil property assessment. Any district that wants to participate in SFCC funding must levy this tax. Over the
In FY 2009, capital outlay funds spent on maintenance and property insurance varied by how the districts were instructed to code these expenses. It appears that some districts are not coding these expenses correctly.
KRS 157.440 governs the building fund and limits spending to debt service on facility bond issues, new facilities, and major renovations of existing facilities as listed in the district's approved facility plan.
The building fund records the revenue of the Facilities Support Program of Kentucky. Districts levy a 5-cent equivalent tax per $100 in assessed property value that is earmarked for facilities.

Chapter 3 Legislative Research Commission Office of Education Accountability
32
years, the General Assembly has seen the need for increased funding to maintain buildings and has added building levies. The first growth nickel was established in 1994 and allowed districts to levy an additional 5-cent equivalent tax if districts grew by at least 150 students and experienced 3 percent overall growth in the preceding 5 years. This was then equalized by the state beginning in FY 2004 if districts levied an additional growth nickel. Another levy is the recallable nickel. Beginning in FY 2006, retroactive equalization has been provided for those districts levying the recallable nickel. In FY 2006, if districts already committed at least a 10-cent equivalent tax to the building fund or had debt service in this amount and received no equalization other than the original FSPK equalization, they received equalization for facilities for 20 years. This nickel is referred to as the equalized facility funding nickel. In the 2008 Regular Session, the General Assembly authorized the levy of an additional 5-cent equivalent rate after April 24, 2008, provided that the district is located in a county that will have additional students as a direct result of the federal Base Realignment and Closure Act and receives a determination by the commissioner of education that the projected increase in students is sufficient to require new facilities or major renovation of existing facilities to accommodate the new students. Districts can receive equalization provided they have levied the original growth nickel and receive no equalization other than FSPK. In the 2010 Special Session, districts that had school facilities classified as Category 5 on May 18, 2010, were given the ability to levy an additional 5-cent equivalent tax rate for building purposes without being subject to recall, or the board may request that the issue be placed on the ballot. Districts will receive equalization the following year. For FY 2009, local revenues made up 71 percent of total funds in the building fund and state revenues made up 29 percent. As shown in Table 3.6, local and state sources of revenue increased in each fiscal year, amounting to a total increase of $104 million from FY 2005 to FY 2009. Appendix K includes revenues by district for the building fund for FY 2009.
Over the years, the General Assembly has seen the need for increased funding to maintain buildings and has added building levies, such as the growth nickels, recallable nickel, equalized facility funding nickel, federal Base Realignment and Closure nickel, and category 5 nickel.
For FY 2009, local revenues make up 71 percent of total funds in the building fund, and state revenues make up 29 percent. Both local and state sources have increased in each fiscal year, amounting to a total increase of $104 million from FY 2005 to FY 2009.
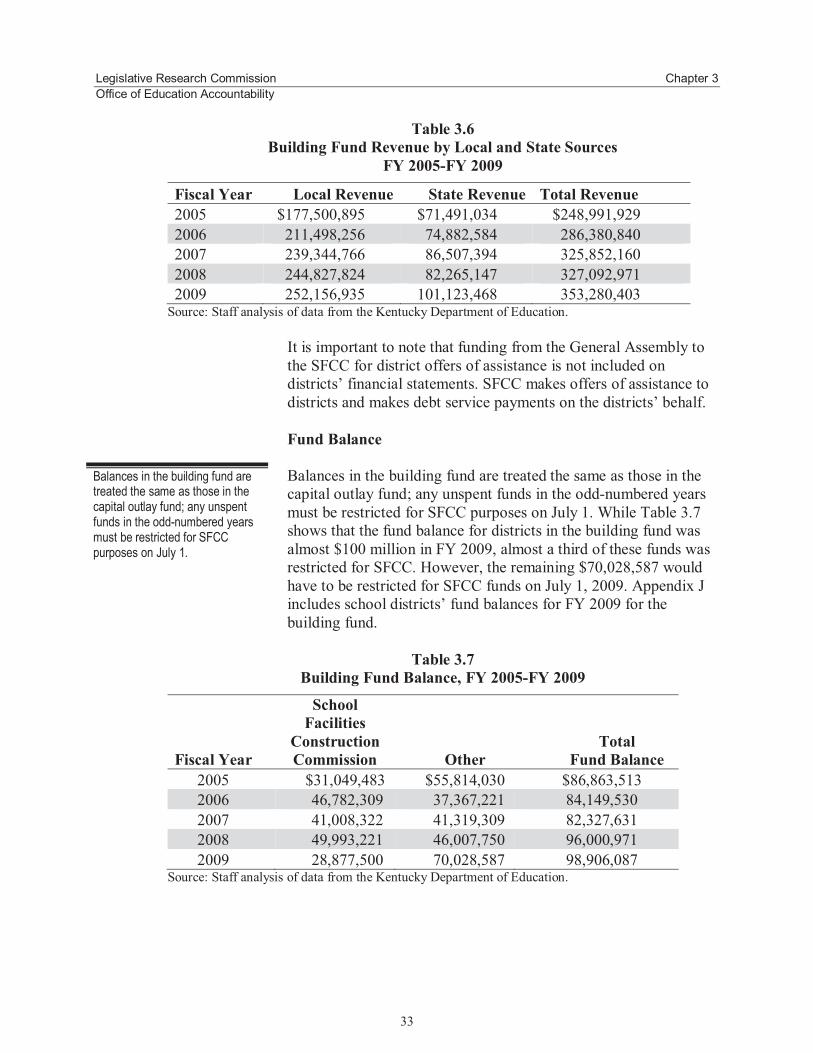
Legislative Research Commission Chapter 3 Office of Education Accountability
33
Table 3.6 Building Fund Revenue by Local and State Sources
FY 2005-FY 2009
Fiscal Year Local Revenue State Revenue Total Revenue 2005 $177,500,895 $71,491,034 $248,991,929 2006 211,498,256 74,882,584 286,380,840 2007 239,344,766 86,507,394 325,852,160 2008 244,827,824 82,265,147 327,092,971 2009 252,156,935 101,123,468 353,280,403
Source: Staff analysis of data from the Kentucky Department of Education. It is important to note that funding from the General Assembly to the SFCC for district offers of assistance is not included on districts’ financial statements. SFCC makes offers of assistance to districts and makes debt service payments on the districts’ behalf. Fund Balance Balances in the building fund are treated the same as those in the capital outlay fund; any unspent funds in the odd-numbered years must be restricted for SFCC purposes on July 1. While Table 3.7 shows that the fund balance for districts in the building fund was almost $100 million in FY 2009, almost a third of these funds was restricted for SFCC. However, the remaining $70,028,587 would have to be restricted for SFCC funds on July 1, 2009. Appendix J includes school districts’ fund balances for FY 2009 for the building fund.
Table 3.7 Building Fund Balance, FY 2005-FY 2009
Fiscal Year
School Facilities
Construction Commission Other
Total Fund Balance
2005 $31,049,483 $55,814,030 $86,863,513 2006 46,782,309 37,367,221 84,149,530 2007 41,008,322 41,319,309 82,327,631 2008 49,993,221 46,007,750 96,000,971 2009 28,877,500 70,028,587 98,906,087
Source: Staff analysis of data from the Kentucky Department of Education.
Balances in the building fund are treated the same as those in the capital outlay fund; any unspent funds in the odd-numbered years must be restricted for SFCC purposes on July 1.

Chapter 3 Legislative Research Commission Office of Education Accountability
34
Construction Fund The construction fund is a multiyear fund like the special revenue fund because construction projects run over multiple years and the accounts must stay open until the construction is completed. Once a district receives KDE’s approval to start a building project, all funds are transferred into a specific project in the construction fund to be expended. Revenues Revenues from the construction fund are generated by selling bonds or transferring funds from capital outlay, building fund, or the general fund after the building project has been approved by KDE. Fund Balance Because this fund is a multiyear fund, fund balances are recorded on districts’ balance sheets as restricted for future construction, and there should be no beginning balances on districts’ annual financial reports. Available balances after a construction project is completed should be captured in the unmet-need calculation
Food Service
The food service fund tracks schools’ receipts and expenditures for providing breakfast and lunch to their students. This account is financed and operated like a private business. All records of revenues and expenditures generated from the school breakfast and lunch programs are coded to this fund. Revenues The revenue streams coming into this fund greatly depend on the economic condition of the state. In Kentucky, 64 percent of food service revenue came from federal sources in FY 2009, while 35 percent was raised by local funds generated from students who pay for their meals. Federal funds made up 60 percent of the food service revenues in FY 2005, showing that more Kentucky students are using the free and reduced-price lunch program offered by the federal government. This is most likely a reflection of the economic recession. Table 3.8 includes a breakdown of how much revenue was generated in the food service fund for FY 2005-
The construction fund is a multiyear fund.
Revenues from the construction fund are generated by selling bonds or transferring funds from capital outlay, building fund, or the general fund after the building project has been approved by KDE.
The food service fund tracks schools’ receipts and expenditures for providing breakfast and lunch to their students. This account is financed and operated like a private business.
The revenue streams depend on the economic status of the state.

Legislative Research Commission Chapter 3 Office of Education Accountability
35
FY 2009. Appendix L includes revenue by district for FY 2009 for the food service fund.
Table 3.8 Food Service Fund by Local, State, and Federal Sources
FY 2005-FY 2009
Fiscal Year Local Revenue State Revenue Federal Revenue Total Revenue 2005 $104,660,999 $3,806,480 $164,971,233 $273,438,712 2006 108,243,365 4,141,235 174,818,463 287,203,063 2007 111,251,626 4,018,671 183,410,426 298,680,723 2008 114,487,785 3,987,090 195,132,217 313,607,092 2009 113,299,318 4,009,162 208,245,360 325,553,840
Source: Staff analysis of data from the Kentucky Department of Education. Fund Balance The food service fund balance was about $53.7 million in FY 2009 and had been fairly steady since FY 2005. While some districts had no fund balances or deficit fund balances, others had hefty fund balances in food service. Per 702 KAR 6:075, districts are supposed to keep only up to 3 months’ worth of operating expenses in this fund. According to KDE’s Nutrition and Health Service director, some of the large food service balances occur because of districts saving to purchase equipment for new cafeterias. Districts may need to purchase equipment for older schools as well but hold off on these purchases until the new-school purchases are made. Large balances may also reflect raised meal prices. Beginning in October 2010, KDE will track all districts’ fund balances, and any districts with balances more than 3 months’ worth of operating expenses will have to submit a plan to the department on how they will reduce the balance. Appendix J lists school districts’ food service fund balances for FY 2009.
According to 702 KAR 6:075, districts are supposed to keep only up to 3 months’ worth of operating expenses in the food service fund.

Legislative Research Commission Chapter 4 Office of Education Accountability
37
Chapter 4
Conclusions and Recommendations
General fund year-end balances are needed for a variety of factors. A large amount of these funds is being saved for specific purposes such as construction, technology and instructional needs, potential general fund expenditures to cover cuts in state grants in the special revenue fund, and significant one-time payments for disasters or other unforeseen events. Higher levels of fund balances are also needed by districts that have cash flow problems and need extra cash to cover payroll for June, July, and August, the months before local property taxes are collected. This report details the need for greater transparency in reporting and documenting the reasons for some districts’ large year-end general fund balances. While many of the districts have plans for these funds, the intended uses are not always readily apparent. The new GASB reporting requirements should make improvements in this area; however, additional fund balance object codes need to be added to the chart of accounts to allow for greater transparency in detailing why districts are reserving funds.
Fund Balance Requirements
Judging from districts’ use of codes in reporting restricted funds, most districts are saving funds for construction projects, which increases fund balances. Reasons why these funds are needed vary, although districts reported that they either did not have enough bonding potential to complete a project or that the project is classified as a priority 4 need on their facility plan. Priority 4 needs are items such as new ball fields, new construction or repairs for central office, and bus garages. Districts can spend restricted capital project funds on priority 4 projects only if they have no priority 1-3 needs, such as upgrading or constructing new school buildings. These dollars are also not currently accounted for when KDE calculates districts’ unmet needs for SFCC purposes: neither are any dollars that are not expended when a construction project has been completed in the construction fund. From reviewing current best practice suggestions and superintendents’ opinions, OEA staff found that support exists for increasing minimum budgeted reserves and year-end balances. In
General fund year-end balances are needed for a variety of factors, such as construction, technology and instructional needs, covering cuts in state grants, one-time payments for disasters or other unforeseen events, and covering cash flow problems.
This report details the need for greater transparency in reporting and documenting the reasons for some districts’ large year-end general fund balances.
Most districts with large fund balances are saving for construction projects. These dollars are not counted when KDE calculates districts’ unmet needs for School Facility Construction Commission purposes.

Chapter 4 Legislative Research Commission Office of Education Accountability
38
order to analyze the impact of increases on districts, staff calculated the impact of raising the requirement to 6 percent, which is generally equal to 1 month of expenses. Recommendation 4.1 The Kentucky Department of Education should review fund balance requirements to ensure that the minimum 2 percent requirement is adequate. Recommendation 4.2 The Kentucky Department of Education should mandate that districts use restricted/reserve object codes when fund balances are more than 12 percent or 2 months’ worth of general fund expenditures. Recommendation 4.3 In calculating the unmet need for School Facilities construction Commission, the Kentucky Department of Education should include funds reserved for future construction in the general fund, and any available funds after closing individual construction projects in the construction fund should also be included in the unmet-need calculation. Fund balances are scrutinized by legislators, researchers, and the general public. It is important that this calculation is transparent, is calculated correctly, and includes the proper codes across all districts. KDE is not capturing more than $10 million that districts have restricted on their balance sheets using object codes that do not exist on the current chart of accounts. Three years ago, when KDE started the chart of account revisions, balance sheet codes were not included in the initial cleanup process—they would be addressed in phase two. In a previous study, OEA recommended that school fees and activity funds be reported to the federal government to ensure accuracy when comparing states’ revenues and expenditures across the US (Commonwealth). KDE also uses the balance sheet object code 8769, restricted for net assets, in the fund balance calculation; however, the National Center for Education Statistics recommends that this account not be used on the general fund balance sheet. KDE also does not exclude fund transfers in its fund balance percentage calculation. If fund transfers are included, districts’ expenditures are overstated.
Recommendation 4.1
Recommendation 4.2
KDE is not capturing more than $10 million that districts have restricted on their balance sheets using object codes that do not exist on the current chart of accounts.
Recommendation 4.3

Legislative Research Commission Chapter 4 Office of Education Accountability
39
Recommendation 4.4 The Kentucky Department of Education should exclude “fund transfers” and restricted for net assets and include the debt service fund (also known as Fund 400) in the fund balance calculation. To improve transparency, the chart of accounts needs to include more-detailed fund balance object codes and a description of what these codes should be used for, including specifying which funds should have these codes. Several districts are saving funds for technology initiatives; however, no reserve object code exists for this reason. A few districts are saving for all-day kindergarten or other instructional programs that currently cannot be identified on the balance sheet. Recommendation 4.5 The Kentucky Department of Education should complete the chart of accounts cleanup by June 30, 2011. This cleanup should include adding balance sheet object codes for technology, instructional needs, and other areas for transparency in fund balance reporting.
KDE Business Rules and Internal Processes
KDE has a set of business rules or edits it performs electronically on the annual financial report and tentative and working budgets. These edits check for discrepancies to ensure districts have the 2 percent contingency and fund balance, that SEEK payments are recorded correctly, and that professional development funds are properly allocated to schools. While these edits are a good starting point, there are other areas that need attention, such as beginning balances. Several districts’ beginning balances on the approved working budgets did not match their ending balances on the AFRs. This situation was found in the general fund and other funds. If districts do not have an accurate beginning balance, they are liable to overspend funds as well as to not allocate all available funds. Because special revenue and construction funds are multiyear funds and grant information is retained by project numbers, it is not possible to monitor these funds on the AFR. Districts are currently not required to send KDE project budget reports on these funds; however, some grants in the special revenue fund are reported quarterly to programs within the department. For greater transparency in these funds, districts should submit project budget
Recommendation 4.4
Recommendation 4.5
Improvements should be made to KDE’s current set of business rules or edits that are electronically performed on annual financial reports and tentative and working budgets

Chapter 4 Legislative Research Commission Office of Education Accountability
40
reports for these two funds at least once a year to ensure that grant amounts are spent and that construction projects are monitored. Recommendation 4.6 The Kentucky Department of Education should ensure that districts’ beginning balances on the working budgets match the prior-year ending balances on annual financial reports. Recommendation 4.7 The Kentucky Department of Education should require districts to submit detailed project budget reports for the special revenue fund and construction fund at least once a year. The General Assembly, through KRS 160.470, requires districts to include a 2 percent contingency on the districts’ tentative budgets. However, on the working budgets, the General Assembly states that districts shall conform to the administrative regulation set by the Kentucky Board of Education. No regulation addresses the working budget minimum contingency amount set for districts. Recommendation 4.8 The Kentucky Board of Education should establish a regulation requiring districts to budget a minimum contingency amount on the working budget. KDE deems districts having less than 2 percent contingency on the annual finance report to be in need of review and places them on its “watch list.” KDE then assigns a finance liaison to work with the superintendent and finance officer. The liaison will visit the district at least once a month to review finances and staffing allocations and to work with the district to restore its fund balance back to at least the 2 percent minimum requirement. A district that ends the year with a negative balance in the general fund is deemed a deficit district, and a finance liaison is placed in that district as well. In addition to performing the same duties as for the watch districts, the finance liaison also approves all purchases for the deficit district and attends all local board meetings to inform board members of the financial situation of the district. Table 4.1 lists the districts placed on the watch list from FY 2002 to FY 2009. In FY 2006, six districts were placed on this list, compared to three in FY 2009. Table 4.2 highlights the districts that have ended the general fund in deficit for the past 8 years. KDE has not been consistent regarding how long districts receive support and does
Recommendation 4.6
Recommendation 4.8
Recommendation 4.7

Legislative Research Commission Chapter 4 Office of Education Accountability
41
not provide updates to the Kentucky Board of Education regarding changes in their financial status.
Table 4.1 Districts on the Kentucky Department of Education’s Watch List
FY 2002-FY 2009
District 2002 2003 2004 2005 2006 2007 2008 2009Jackson � � � � � Fulton � Adair � Clark � Jackson Ind. � Leslie � Ludlow Ind. � Campbellsville Ind. � Russell � � Wayne � Covington Ind. � � Dayton Ind. � Newport Ind. � � Pulaski � Total 1 1 1 2 6 3 4 3
Sources: Kentucky Board of Education agenda items and minutes; e-mail from Larry Stinson 2/12/09.
Table 4.2 Deficit Districts, FY 2002-FY 2009
District 2002 2003 2004 2005 2006 2007 2008 2009Covington Ind. � � � Jackson Ind. � Frankfort Ind. � Russell � Wayne � Total 1 1 0 1 1 0 3 0
Sources: Kentucky Board of Education agenda items and minutes; e-mail from Larry Stinson 2/12/09. Recommendation 4.9 The Kentucky Department of Education should establish a uniform process for determining when districts are placed on the watch and deficit lists, the length of time they remain on the lists, and when they are removed from the lists and should give regular updates to the Kentucky Board of Education on the districts’ financial conditions.
Recommendation 4.9

Chapter 4 Legislative Research Commission Office of Education Accountability
42
KDE does not enforce the mandate of 702 KAR 3:050 that requires districts to submit applications to exceed their working budgets. If KDE enforces this regulation, along with reviewing district data throughout the year, KDE could intervene earlier and prevent districts from being on the watch or deficit list. OEA staff analyzed districts’ ending balances for all funds from FY 2005 to FY 2009. There were districts that ended the fiscal year with negative fund balances in the special revenue fund, capital outlay, building fund, and food service fund. According to KRS 160.550, no superintendent or board member shall knowingly approve expenditures in excess of the income shown on the budget adopted by the local board and approved by the Kentucky Board of Education. Those districts ending the year with negative fund balances are in violation of this statute. Prior practice at KDE required districts to use general fund revenues to cover these negative fund balances. Recommendation 4.10 The Kentucky Department of Education should enforce KRS 160.550 and 702 KAR 3:050 and prohibit districts from ending the year with a negative balance in any fund.
Other The General Assembly established the emergency revolving school loan fund for districts experiencing hardships or having insufficient resources to meet their capital outlay needs (KRS 160.599). Regulation 702 KAR 4:100 sets out the procedures for receiving and repaying loans from this fund. However, through Executive Order 2008-0111, these funds were taken as part of a budget reduction act and have not been replenished. Recommendation 4.11 The General Assembly should consider either replenishing the emergency revolving school loan fund or repealing KRS 160.599.
Recommendation 4.10
Recommendation 4.11

Legislative Research Commission Works Cited Office of Education Accountability
43
Works Cited Allen, Ian J. Unreserved Fund Balance and Public School System Finance. School Business Affairs. 1991. Vol. 57, no. 10: 10-17. Commonwealth of Kentucky. Legislative Research Commission. Office of Education Accountability. Fees, Dues, and Supplies in Kentucky Schools. Research Report No. 361. Frankfort: LRC, 2009. Government Finance Officers Association. Appropriate Level of Unrestricted Fund Balance in the General Fund 2002 and 2009. Budget and CAAFR. Oct. 2009. <http://www.gfoa.org/downloads/AppropriateLevelUnrestrictedFundBalanceGeneralFund_BestPractice.pdf> (accessed April 20, 2010). Speer, Don. Phone interview. June 1, 2010. Stinson, Larry. “RE: School District Watch List.” Email to Pam Young. Feb. 12, 2009.


Legislative Research Commission Appendix A Office of Education Accountability
45
Appendix A
Statutes and Regulations
Statute Explanation KRS 156.265 State Committee for School District Audits comprises:
� Governor, or designee � Attorney General � Auditor of Public Accounts � A person designated by the Legislative Research Commission to represent Office of
Education Accountability � Commissioner of Education Statute requires accounts of each board to be audited not less than once every fiscal year.
KRS 157.060 Each school district shall make a report to the Kentucky Board of Education (KBE) detailing all funds received and expended for the year.
KRS 157.420 The following restrictions govern the expenditure of funds from the public school fund:1) Salary paid to teachers shall be at least equivalent to amount established in the biennial
budget for rank and experience of a 185-day term during the regular school year. 2) Beginning with the 2004-2006 biennium, KBE shall not approve any working budget or
salary schedule unless the 185-day schedule for certified staff has been adjusted over the previous year’s salary schedule by the cost- of-living adjustment percentage provided for state government workers under the biennial budget. The Support Education Excellence in Kentucky (SEEK) base shall be increased by the annual required cost-of-living adjustment percentage.
3) A district that pays teachers or employees for unused sick leave at the time of retirement may create an escrow account to maintain the funds necessary to pay those who qualify for this benefit. Fund is limited to not more than 50 percent of maximum liability for the current year, determined by number of staff employed on September 15. The funds shall not be used for any other purpose and shall not be considered part of the general fund balance in determining available local revenue.
4) The per-pupil capital outlay allotment shall be used for the following purposes: � Direct payment of construction costs � Debt service on voted and funding bonds � Payment or lease-rental agreements under which the board will acquire ownership of
school plant � Retirement of deficit resulting from capital construction overexpenditure � Reserve fund to be carried forward Subject to the commissioner of education’s approval, a district may request to use capital outlay funds to purchase land for a new school or modify an existing school if the project is included on the district facility plan and will be completed within 8 years. A district experiencing average daily attendance (ADA) increases of 20 percent over a 5-year period may request approval from the commissioner of education to use capital outlay funds for the operation of a new school for the first 2 years following its opening. A district may request approval from the commissioner of education to use capital outlay funds for maintenance expenditures or for purchase of property insurance without forfeiting participation in the School Facilities Construction Commission (SFCC) program.
5) A district may use capital outlay funds for energy conservation measures under guaranteed energy savings contracts.
6) A district that has a special levy for capital outlay or debt service equal to the capital outlay

Appendix A Legislative Research Commission Office of Education Accountability
46
allotment or a proportionate share may request approval from the commissioner of education to use proceeds for current expenses.
7) A district that has no capital outlay needs may request approval from the commissioner of education to use funds for school plant maintenance, repair, insurance, equipment replacement, school bus purchases, and technology purchases for education purposes only.
8) The department of education shall designate each school facility as permanent, functional, or transitional.
9) Classes held in a facility deemed a historical settlement school on January 1, 1994, may continue provided the facility meets health and safety standards for education facilities as required by administrative regulations.
10) A district that has requested a midyear adjustment to its SEEK funding under KRS 157.360 (15) may request approval from the commissioner of education to use capital outlay funds for the purchase of school buses or for increased operational expenses for the first 3 years following the increased growth without forfeiture of the district’s participation in the SFCC program.
The 2009 Regular Session provides that capital outlay funds used for expenditures, in either fiscal year 2009 or 2010, other than those designated in KRS 157.420 (4) and (5), shall be included in determining the amount of local available revenue for the purpose of calculating unmet need for participation in the SFCC program. The land purchases approved under these provisions shall not be included in the calculation of the district’s unmet need. The 2009 Special Session of the General Assembly allows school districts to request approval from the commissioner of education to use capital outlay funds for general operating expenses in fiscal year 2009-2010 without forfeiture of the district’s participation in the SFCC program.
KRS 157.620 A district must have unmet needs and meet the following eligibility criteria to participate in the school construction funding program: � Commit at least an equivalent tax rate of 5 cents to debt service, new facilities, or major
renovations of existing school facilities. � Restrict all available local revenue on July 1 of odd-numbered years for school building
construction, to be used for top priorities of the most current school facilities plan approved by the Kentucky Board of Education.
On or before October 15 of the year immediately preceding an even-numbered year regular session of the General Assembly, the Kentucky Board of Education shall certify the following to SFCC: � each district’s amount of school facility construction needs � each district’s amount of available local revenue � whether each district has met the eligibility criteria
KRS 158.780 The Kentucky Board of Education shall establish a program for the following: � Voluntary improvement program—to assist local districts with developing innovative
management practices and adopting currently accepted practices. � Involuntary supervision—upon conducting an administrative hearing, if the Kentucky
Board of Education determines a critical lack of efficiency or effectiveness exists in governance or administration, the board shall assume sufficient supervision of the district to ensure appropriate corrective action occurs.
� “State assisted district” or “state managed district”—Upon conducting an administrative hearing, if the Kentucky Board of Education determines that a pattern of lack of efficiency or effectiveness in governance or administration warrants action, the board shall assume control of the district.
KRS 158.785 Upon review of data or other information, including site investigations of district management practices, that indicates the presence of critically ineffective or inefficient management, the commissioner of education shall order a management audit of the district’s governance and administration. A local school board or superintendent may also request a management audit. When the commissioner of education recommends to the Kentucky Board of Education that a district be designated as “state assisted district” or “state managed district,” the following must

Legislative Research Commission Appendix A Office of Education Accountability
47
be established: � There is a pattern of significant lack of efficiency and effectiveness in governance or
administration. � State assistance or state management is necessary to correct the inefficiencies and
ineffectiveness. When a district is designated a “state assisted district,” the following actions are required of the commissioner: � Provide management assistance to the district to develop and implement a plan to correct
deficiencies found in the management audit. � Monitor the development and implementation of the correctional plan. If the plan is not
being adequately developed or implemented, the commissioner shall recommend to KBE that the district be declared a “state managed district.”
When a district is designated a “state managed district,” the following actions are required of the commissioner: � All aspects of management—administrative, operational, financial, personnel, and
instructional—formerly exercised by the school board and superintendent are exercised by the commissioner or his designee.
� The Kentucky Board of Education may remove school board member or superintendent. � Commissioner may revoke appointment to administrative position after 30 days of being
appointed a “state managed district.” � Commissioner may make administrative appointments necessary to exercise full and
complete control of all aspects of management. A school district shall be designated as a “state managed district” until the Kentucky Board of Education determines the pattern of ineffective and inefficient governance or administration and the specific deficiencies noted in the management audit have been corrected. No district shall remain under the status of “state managed district” longer than 3 consecutive school years unless the Kentucky Board of Education extends time after a new management audit has been reviewed.
KRS 160.431 A finance officer shall be appointed by the superintendent to be responsible for cash, investment, and financial management of the district. A finance officer is required to complete 42 hours of continuing education every 2 years.
KRS 160.470 The tax rates that a district may levy—Compensating, Subsection (1), and 4 percent Increase—are defined, hearing and recall provisions are described, and publication guidelines are provided. Each district shall prepare a draft budget on or before January 31 of each calendar year. Each district shall adopt a tentative working budget, which shall include a minimum reserve of 2 percent of the total budget, on or before May 30. Each district shall submit a working budget to the Kentucky Board of Education no later than September 30. The 2009 special session of the general assembly allows districts to adopt a tentative working budget that does not have a minimum 2 percent reserve of the total budget.
KRS 160.550 No superintendent shall recommend and no board member shall knowingly approve expenditure in excess of the income and revenue of any year as shown on the budget adopted by the board and approved by the Kentucky Board of Education, except for a purpose for which bonds have been voted or in case an emergency is declared by KBE. A district certified to KBE as being in violation of this statute may not spend any funds unless the commissioner has approved the expenditure in writing. The district’s certification shall continue until KBE has approved the district’s budget for the succeeding fiscal year.
KRS 160.599 Procedures for receiving and repaying loans made from the Emergency Revolving School Loan Fund Account are described. The emergency loan fund was established for districts experiencing a loss of physical facilities due to fire or natural disaster with insufficient insurance on such facilities to replace the loss, where the district is bonded to capacity and has

Appendix A Legislative Research Commission Office of Education Accountability
48
insufficient resources to meet its capital outlay needs, and for districts in which there is a failure of the sheriff to timely collect local tax revenues.
KRS 424.220 The financial statements shall show:� total amount of funds collected and received during the fiscal year from each individual
source; and � total amount of funds disbursed during the fiscal year to each individual payee exceeding
$1,000. Amounts paid to staff can be shown as lump-sum expenditures by category. The 2003, 2005, 2006, and 2008 Regular Sessions of the General Assembly allow districts to publish in the newspaper of largest general circulation in the county that the financial statements are available electronically at a designated web site or that a printed copy is available at the public library.
KRS 424.250 The board of education of the district shall cause the district’s budget to be advertised by publishing a copy of the budget in the newspaper.
Regulation Explanation 702 KAR 3:045 The commissioner of education is authorized to withhold SEEK funds from any school district
that fails to timely file reports required by statutes, rules, and regulations. 702 KAR 3:050 Upon receiving a district’s application to exceed the current budget, the commissioner of
education shall determine whether an emergency exists within the meaning of KRS 160.550. The commissioner also has the authority to declare an emergency in those cases where the health and safety of the pupils are placed in jeopardy or the school program is disrupted. The application to exceed the current budget, as well as any emergency declared by the commissioner of education, is submitted to the Kentucky Board of Education for final decision.
702 KAR 3:110 The due dates of documents electronically submitted through MUNIS are as follows:� Tentative Budget—May 30 � Annual Financial Report—July 25 � Balance Sheet—July 25 � Working Budget—September 30 The working budget shall be disapproved by the Kentucky Board of Education if it is financially unsound or fails to provide for the following: � principal and interest payment on any outstanding voted school improvement bonds
authorized and issued with written approval of KBE � rental payments connected to outstanding school building revenue bonds authorized with
written approval of KBE � compliance with applicable laws Upon receiving disapproval by KBE, the district shall amend its budget and resubmit.
702 KAR 3:120 A district shall follow the uniform financial accounting system detailed in “KETS District Administrative System Chart of Accounts” and “Charts of Accounts Descriptions.” All financial records shall be filed in either the superintendent’s office or in a location designated by the superintendent.
702 KAR 4:100 Procedures for receiving and repaying loans made from the Emergency Revolving School Loan Fund Account are described. The emergency loan fund was established for districts experiencing a loss of physical facilities due to fire or natural disaster or failure to timely receive local tax revenues.
702 KAR 6:075 Requirements necessary to properly protect all funds accruing to the local school nutrition program are described. A local school nutrition program shall be operated on a nonprofit basis. Actual cash balances shall not exceed 3 months’ operating balance.

Legislative Research Commission Appendix A Office of Education Accountability
49
703 KAR 3:205 The operational procedures for the management improvement program are outlined. If review of data regarding a school district indicates significant deficiencies, then the department shall conduct an on-site review, which may include an examination of district operations in � governance policy and procedures, � instructional programming and organization, � fiscal management and accountability procedures, � maintenance and condition of physical plant, � facility construction, � student transportation, and � community perception and support. If the review reveals significant deficiencies and the commissioner of education determines that they indicate the presence of critically ineffective or inefficient management, the commissioner shall order a management audit. The comprehensive audit shall cover the following areas: � Planning � Operational support � Fiscal management � Personnel administration � Instructional management Following the comprehensive audit, the department shall prepare a report and the commissioner shall determine whether a pattern exists of significant lack of effectiveness and efficiency. If so, and if state assistance or state management is necessary, the commissioner shall make a recommendation declaring such to the Kentucky Board of Education. If a district is declared state assisted or state managed, the district shall develop and implement an improvement plan. A district remains state assisted until the commissioner recommends to KBE that significant progress has been made in implementing the improvement plan or KBE makes a determination that the district shall be state managed.
703 KAR 5:130 The district’s accountability program, including eligibility for district rewards and procedures for determining assistance, and other consequences are described. A district containing a school classified as Level 3 that has not been a Level 3 previously shall modify its district consolidated plan by including a specific support plan to assist in improving its academic achievement. The plan shall address the following areas: � Instructional leadership � Instructional staff access to curriculum-related materials and training � Professional development planning process � Structure for instructional improvement � Financial services and support � Facilities � Certified employee evaluation system A district containing a school classified as Level 3 for two or more consecutive accountability cycles shall be subject to a district audit conducted by a district evaluation team. The district evaluation team shall submit a report, including its recommendations, to the commissioner of education, the district superintendent, and the local board of education. The recommendations may include the following: � No additional action needed � Revisions to the school support plan are needed � Revisions in implementation procedures are needed � Management audit is needed


Legislative Research Commission Appendix B Office of Education Accountability
51
Appendix B
States’ Requirements for End-of-year Fund Balance, Rainy Day Reserve Fund, and Cash Flow Reserve Fund
State
End-of-year Fund Balance, Rainy Day Reserve Fund, or Cash Flow Reserve Fund
Allocation Basis Alabama School boards are required to maintain a
1-month operating balance. Minimum 1-month operating balance is calculated by dividing the general fund expenditures and fund transfers out by 12.
Arkansas Allowed but not required. Not specified. Delaware Required to fund at least 1 month of
payroll for next fiscal year. District submits three financial position reports throughout the year (February 1, May 1, and August 31) to establish that it has sufficient balances to fund at least 1 month of payroll.
Florida School districts are required to maintain an unreserved general fund balance sufficient to address normal contingencies. However, unappropriated fund balances may not exceed 10 percent of total appropriations and transfers for operational purposes.
The financial condition ratio is determined by dividing the general fund unreserved fund balance (both designated and undesignated) by the general fund total revenues.
Georgia Allowed but not required. Cannot exceed 15 percent of current year’s total budget.
Not specified.
Indiana Allowed but not required. Not specified. Kansas Allowed but not required. For school years
2009 through 2012, the contingency reserve fund amount cannot exceed 10 percent of general fund budget. For school years 2013 and following, the contingency reserve fund amount cannot exceed 6 percent
Not specified.
Mississippi Allowed but not required. Recommends that districts maintain an ending balance in general operating fund equal to or greater than 7 percent of the total revenue deposited into that fund during the fiscal year

Appendix B Legislative Research Commission Office of Education Accountability
52
State
End-of-year Fund Balance, Rainy Day Reserve Fund, or Cash Flow Reserve Fund
Allocation Basis Missouri Allowed but not required. Requires notice to the board if
fiscal year-end balance of classroom and incidental funds are less than 1 percent of prior year amount expended from the funds.
Oklahoma Allowed but not required. Districts can use carryover funds for emergencies and to offset reductions in state aid, and as startup funds for the next fiscal year. Carryover funds are subject to percentage restrictions specified in statute.
South Carolina
Allowed but not required. Determined by local school board. Recommended 1-2 months expenditures.
Tennessee Districts are required to have a special revenue account known as “dedicated education fund” within the general fund. The account must maintain a balance above 3 percent for operation and districts can expend only 3 percent for emergencies.
Not specified.
West Virginia Allowed but not required. It is strongly recommended that all school districts budget 3 percent to 5 percent of their total projected revenues for contingency.
Not specified.
Source: Staff compilation of data from Mississippi’s Office of the State Auditor, Performance Audit Division Brief: The Myth of School Rainy Day funds, Vol. 5, No. 3, May 19, 2008; and responses to OEA’s email inquiries sent to Southern Regional Education Board member states and surrounding states.

Legislative Research Commission Appendix C Office of Education Accountability
53
Appendix C
Per-pupil General Fund Local, State, and Federal Revenues Fiscal Year 2009
District
Per-pupil Local
Revenue Percentage
of Total
Per-pupil State
Revenue Percentage
of Total
Per-pupil
Federal Revenue
Percentage of Total
Per-pupil Total
Revenue Adair $1,589 23.6% $5,132 76.3% $3 0.0% $6,724 Allen 1,076 18.3 4,806 81.5 13 0.2 5,895 Anchorage Ind. 12,619 87.1 1,871 12.9 0 0.0 14,490 Anderson 2,107 35.0 3,921 65.0 0 0.0 6,028 Ashland Ind. 2,233 33.7 4,373 66.0 17 0.3 6,623 Augusta Ind. 1,618 24.8 4,903 75.2 0 0.0 6,521 Ballard 2,043 30.8 4,574 69.0 10 0.1 6,627 Barbourville Ind. 1,241 19.9 4,998 80.1 0 0.0 6,239 Bardstown Ind. 2,755 40.5 4,051 59.5 0 0.0 6,806 Barren 1,987 30.6 4,470 68.9 31 0.5 6,488 Bath 1,218 18.8 5,218 80.7 29 0.4 6,465 Beechwood Ind. 4,360 61.5 2,727 38.5 0 0.0 7,087 Bell 1,300 18.5 5,706 81.2 23 0.3 7,029 Bellevue Ind. 3,374 46.4 3,874 53.2 30 0.4 7,278 Berea Ind. 2,113 28.4 5,305 71.4 10 0.1 7,428 Boone 3,870 59.0 2,680 40.9 9 0.1 6,559 Bourbon 2,543 38.4 4,076 61.6 0 0.0 6,619 Bowling Green Ind. 3,026 41.5 4,268 58.5 0 0.0 7,294 Boyd 2,847 38.0 4,601 61.4 42 0.6 7,490 Boyle. 2,336 35.7 4,207 64.3 0 0.0 6,543 Bracken 895 15.4 4,905 84.5 5 0.1 5,805 Breathitt 1,224 17.7 5,688 82.1 13 0.2 6,926 Breckinridge 2,047 30.3 4,704 69.6 4 0.1 6,755 Bullitt 2,155 36.0 3,824 64.0 0 0.0 5,979 Burgin Ind. 3,118 48.9 3,256 51.1 0 0.0 6,373 Butler 1,311 19.7 5,162 77.7 169 2.5 6,642 Caldwell 1,629 24.8 4,942 75.2 2 0.0 6,573 Calloway 2,542 38.5 4,058 61.5 0 0.0 6,600 Campbell 4,100 56.9 3,097 43.0 8 0.1 7,205 Campbellsville Ind. 2,636 35.1 4,832 64.3 52 0.7 7,520 Carlisle 1,597 23.7 5,117 76.0 15 0.2 6,729 Carroll 4,096 50.9 3,956 49.1 0 0.0 8,052 Carter 1,113 16.7 5,483 82.5 52 0.8 6,648 Casey 1,393 20.2 5,487 79.6 14 0.2 6,894 Caverna Ind. 2,553 35.5 4,638 64.5 0 0.0 7,191 Christian 1,990 30.2 4,543 69.0 55 0.8 6,588 Clark 2,412 39.7 3,665 60.3 0 0.0 6,077 Clay 1,201 16.6 6,003 83.1 24 0.3 7,228 Clinton 1,744 25.4 5,101 74.4 14 0.2 6,859

Appendix C Legislative Research Commission Office of Education Accountability
54
District
Per-pupil Local
Revenue Percentage
of Total
Per-pupil State
Revenue Percentage
of Total
Per-pupil
Federal Revenue
Percentage of Total
Per-pupil Total
Revenue Cloverport Ind. 1,141 15.1 6,356 84.0 73 1.0 7,570 Corbin Ind. 1,211 20.6 4,661 79.4 0 0.0 5,872 Covington Ind. 4,331 47.6 4,758 52.3 12 0.1 9,101 Crittenden 1,671 26.3 4,677 73.7 2 0.0 6,350 Cumberland 1,889 26.3 5,273 73.4 22 0.3 7,184 Danville Ind. 4,207 51.3 3,987 48.7 0 0.0 8,194 Daviess 2,376 35.3 4,342 64.6 7 0.1 6,724 Dawson Springs Ind. 952 14.4 5,662 85.6 0 0.0 6,614 Dayton Ind. 1,679 24.0 5,308 75.8 14 0.2 7,000 East Bernstadt Ind. 522 8.6 5,568 91.3 6 0.1 6,096 Edmonson 1,324 19.4 5,450 80.0 35 0.5 6,810 Elizabethtown Ind. 2,233 34.0 4,328 66.0 1 0.0 6,562 Elliott 959 14.4 5,660 85.2 22 0.3 6,641 Eminence Ind. 1,551 24.3 4,807 75.4 21 0.3 6,379 Erlanger-Elsmere Ind. 3,218 44.9 3,927 54.8 18 0.3 7,164 Estill 1,048 16.3 5,363 83.6 7 0.1 6,419 Fairview Ind. 1,278 19.7 5,206 80.3 0 0.0 6,484 Fayette 5,859 71.3 2,364 28.7 0 0.0 8,223 Fleming 1,318 20.8 5,004 79.0 9 0.1 6,331 Floyd 1,800 25.9 5,143 74.0 5 0.1 6,948 Fort Thomas Ind. 4,515 60.1 3,004 39.9 0 0.0 7,519 Frankfort Ind. 3,969 44.4 4,975 55.6 0 0.0 8,944 Franklin 3,050 47.4 3,383 52.5 5 0.1 6,438 Fulton 2,375 30.7 5,341 69.1 18 0.2 7,733 Fulton Ind. 3,150 36.2 5,514 63.4 34 0.4 8,698 Gallatin 2,482 35.2 4,564 64.8 0 0.0 7,046 Garrard 1,948 28.9 4,777 71.0 6 0.1 6,731 Glasgow Ind. 2,508 36.4 4,378 63.6 0 0.0 6,886 Grant 1,505 24.3 4,668 75.4 17 0.3 6,190 Graves 1,518 25.0 4,559 75.0 0 0.0 6,076 Grayson 1,565 25.1 4,661 74.9 0 0.0 6,226 Green 1,355 20.7 5,193 79.3 0 0.0 6,548 Greenup 1,770 26.1 5,003 73.9 0 0.0 6,774 Hancock 2,920 39.7 4,417 60.0 23 0.3 7,359 Hardin 2,142 32.7 4,379 66.8 39 0.6 6,560 Harlan 1,376 20.5 5,315 79.3 10 0.1 6,701 Harlan Ind. $971 16.0 5,081 84.0 0 0.0 6,052 Harrison 1,702 26.9 4,607 72.7 28 0.4 6,337 Hart 1,795 25.8 5,166 74.2 2 0.0 6,963 Hazard Ind. 1,975 28.7 4,899 71.3 0 0.0 6,874 Henderson 2,589 37.7 4,264 62.1 9 0.1 6,862 Henry 2,011 31.2 4,431 68.7 4 0.1 6,446 Hickman 2,389 32.9 4,869 67.1 0 0.0 7,258 Hopkins 2,038 28.9 5,005 70.9 12 0.2 7,055 Jackson 1,038 14.5 6,103 85.0 39 0.5 7,180 Jackson Ind. 1,089 15.3 6,036 84.6 11 0.2 7,136 Jefferson 5,356 63.2 3,123 36.8 0 0.0 8,479
Legislative Research Commission Appendix C Office of Education Accountability
55
District
Per-pupil Local
Revenue Percentage
of Total
Per-pupil State
Revenue Percentage
of Total
Per-pupil
Federal Revenue
Percentage of Total
Per-pupil Total
Revenue Jenkins Ind. 1,669 21.8 5,996 78.2 0 0.0 7,665 Jessamine. 2,994 44.2 3,768 55.7 6 0.1 6,768 Johnson 1,199 18.0 5,451 81.7 19 0.3 6,669 Kenton 3,364 51.1 3,210 48.8 7 0.1 6,581 Knott 2,702 38.7 4,273 61.2 4 0.1 6,978 Knox 1,313 19.5 5,435 80.5 3 0.0 6,752 LaRue 1,589 23.9 5,059 76.0 5 0.1 6,653 Laurel 1,476 24.3 4,587 75.4 22 0.4 6,085 Lawrence 1,559 23.2 5,155 76.7 7 0.1 6,721 Lee 1,138 18.6 4,953 81.1 13 0.2 6,103 Leslie 1,655 23.5 5,373 76.4 8 0.1 7,036 Letcher 1,890 24.9 5,699 75.0 9 0.1 7,598 Lewis 1,242 18.5 5,424 80.9 40 0.6 6,706 Lincoln 1,306 19.3 5,447 80.5 10 0.2 6,763 Livingston 2,894 42.6 3,899 57.4 0 0.0 6,793 Logan 1,719 26.9 4,665 72.9 11 0.2 6,395 Ludlow Ind. 2,223 32.6 4,605 67.4 0 0.0 6,828 Lyon 3,860 57.5 2,842 42.3 14 0.2 6,716 Madison 2,168 34.0 4,193 65.9 6 0.1 6,367 Magoffin 1,057 15.1 5,947 84.8 10 0.1 7,014 Marion 2,075 30.8 4,624 68.7 31 0.5 6,730 Marshall 2,911 44.0 3,712 56.0 0 0.0 6,623 Martin 2,076 29.7 4,924 70.3 0 0.0 7,000 Mason 2,657 39.5 4,038 60.1 28 0.4 6,723 Mayfield Ind. 1,894 26.7 5,162 72.9 29 0.4 7,085 McCracken 2,831 43.7 3,641 56.2 6 0.1 6,478 McCreary 1,159 16.5 5,853 83.5 0 0.0 7,012 McLean 1,679 25.5 4,878 74.1 23 0.4 6,580 Meade 1,275 20.8 4,839 79.1 6 0.1 6,120 Menifee 982 13.8 6,011 84.6 113 1.6 7,106 Mercer 2,088 31.5 4,531 68.5 0 0.0 6,619 Metcalfe 1,729 24.2 5,401 75.6 10 0.1 7,140 Middlesboro Ind. 1,948 26.1 5,526 74.0 (10) 00.1 7,464 Monroe 1,360 20.9 5,143 79.0 10 0.2 6,513 Montgomery 1,619 26.1 4,564 73.7 9 0.1 6,192 Monticello Ind. 872 13.0 5,820 86.8 12 0.2 6,704 Morgan 1,330 19.4 5,514 80.3 22 0.3 6,866 Muhlenberg 3,343 40.7 4,854 59.1 22 0.3 8,219 Murray Ind. 2,956 37.7 4,891 62.3 0 0.0 7,847 Nelson 2,319 36.3 4,068 63.7 0 0.0 6,387 Newport Ind. 4,129 50.1 4,086 49.6 28 0.3 8,243 Nicholas 1,151 18.7 5,002 81.3 0 0.0 6,153 Ohio 1,617 23.6 5,234 76.4 3 0.0 6,854 Oldham 2,900 46.1 3,392 53.9 0 0.0 6,292 Owen 1,590 25.1 4,744 74.8 9 0.1 6,343 Owensboro Ind. 3,292 40.5 4,829 59.4 3 0.0 8,124 Owsley 1,119 15.4 6,147 84.6 0 0.0 7,266
Appendix C Legislative Research Commission Office of Education Accountability
56
District
Per-pupil Local
Revenue Percentage
of Total
Per-pupil State
Revenue Percentage
of Total
Per-pupil
Federal Revenue
Percentage of Total
Per-pupil Total
Revenue Paducah Ind. 3,179 40.9 4,580 58.9 21 0.3 7,780 Paintsville Ind. 3,504 45.9 4,130 54.1 0 0.0 7,634 Paris Ind. 2,206 33.6 4,354 66.3 11 0.2 6,571 Pendleton 1,451 22.7 4,953 77.3 0 0.0 6,404 Perry 1,925 27.4 5,096 72.5 9 0.1 7,030 Pike 2,248 32.4 4,682 67.5 7 0.1 6,937 Pikeville Ind. 4,327 53.1 3,796 46.6 22 0.3 8,145 Pineville Ind. 1,049 16.2 5,398 83.3 36 0.6 6,483 Powell 1,007 15.8 5,355 84.2 0 0.0 6,362 Pulaski 1,913 30.7 4,313 69.3 0 0.0 6,226 Raceland-Worthington Ind.
1,365 22.2 4,778 77.8 0 0.0 6,143
Robertson 1,400 20.0 5,563 79.5 37 0.5 7,000 Rockcastle 1,073 15.8 5,692 84.0 15 0.2 6,780 Rowan 2,219 32.3 4,654 67.7 6 0.1 6,879 Russell 1,782 26.4 4,886 72.4 83 1.2 6,751 Russell Ind. 2,507 37.2 4,230 62.7 6 0.1 6,743 Russellville Ind. 2,554 33.4 5,057 66.1 43 0.6 7,654 Science Hill Ind. 1,327 20.8 5,051 79.1 11 0.2 6,389 Scott 2,649 42.4 3,596 57.5 8 0.1 6,253 Shelby 3,155 45.4 3,787 54.5 10 0.1 6,952 Silver Grove Ind. 4,463 49.1 4,618 50.9 0 0.0 9,081 Simpson 2,166 35.9 3,859 64.0 5 0.1 6,030 Somerset Ind. 3,162 46.2 3,661 53.5 16 0.2 6,839 Southgate Ind. 5,537 69.6 2,414 30.4 0 0.0 7,951 Spencer 2,150 35.2 3,952 64.8 0 0.0 6,102 Taylor 1,765 27.9 4,543 71.9 13 0.2 6,321 Todd 1,535 22.8 5,167 76.9 17 0.2 6,719 Trigg 4,447 53.4 3,883 46.6 0 0.0 8,330 Trimble 2,086 30.5 4,733 69.3 15 0.2 6,834 Union 2,557 33.7 5,015 66.1 14 0.2 7,586 Walton-Verona Ind. 3,729 47.9 4,064 52.1 0 0.0 7,793 Warren 2,359 39.7 3,578 60.2 5 0.1 5,942 Washington 2,124 30.0 4,945 70.0 0 0.0 7,069 Wayne 1,421 21.2 5,244 78.1 48 0.7 6,713 Webster 1,919 28.3 4,853 71.5 13 0.2 6,785 West Point Ind. 2,628 30.9 5,865 69.1 0 0.0 8,493 Whitley 1,106 15.9 5,857 84.2 (9) 0.1 6,954 Williamsburg Ind. 1,453 22.4 5,029 77.4 16 0.2 6,498 Williamstown Ind. 1,974 28.8 4,887 71.2 0 0.0 6,861 Wolfe 1,039 14.6 6,067 85.2 15 0.2 7,121 Woodford 2,921 49.3 3,005 50.7 5 0.1 5,931 State Average $2,896 41.1% $4,139 58.8% $10 0.1% $7,045
Note: The addition of per-pupil local, state, and federal percentage of total may not equal 100 percent due to rounding. Source: Staff compilation of data from the Kentucky Department of Education.

Legislative Research Commission Appendix D Office of Education Accountability
57
Appendix D
School Districts’ General Fund Balances, Fiscal Year 2009
District General Fund
Balance Total
Expenditures Fund Balance
Percent Adair $1,218,498 $21,334,644 5.7% Allen 2,485,311 22,064,996 11.3 Anchorage Ind. 1,471,544 5,602,321 26.3 Anderson 2,518,476 30,008,132 8.4 Ashland Ind. 2,027,902 24,909,865 8.1 Augusta Ind. 646,226 2,834,640 22.8 Ballard 1,893,029 12,769,338 14.8 Barbourville Ind. 431,109 4,740,224 9.1 Bardstown Ind. 777,388 19,876,549 3.9 Barren 1,127,800 38,798,460 2.9 Bath 3,409,938 15,760,358 21.6 Beechwood Ind. 1,843,316 8,797,017 21.0 Bell 794,065 27,022,744 2.9 Bellevue Ind. 1,646,418 6,554,190 25.1 Berea Ind. 3,305,704 9,672,058 34.2 Boone 22,382,207 147,126,849 15.2 Bourbon 3,273,837 22,667,512 14.4 Bowling Green Ind. 3,498,470 33,529,623 10.4 Boyd 2,866,917 28,652,009 10.0 Boyle 1,653,982 21,945,357 7.5 Bracken 1,541,772 8,877,386 17.4 Breathitt 1,413,008 21,313,405 6.6 Breckinridge 9,135,735 24,091,805 37.9 Bullitt 9,768,390 93,392,273 10.5 Burgin Ind. 876,767 3,255,029 26.9 Butler 2,234,485 19,173,066 11.7 Caldwell 3,678,137 15,655,970 23.5 Calloway 8,159,800 23,820,863 34.3 Campbell 5,184,620 39,966,503 13.0 Campbellsville Ind. 1,430,521 10,325,725 13.9 Carlisle 535,412 6,903,766 7.8 Carroll 4,645,267 17,162,415 27.1 Carter 2,425,330 37,386,970 6.5 Casey 5,403,829 19,565,193 27.6 Caverna Ind. 1,613,555 8,158,985 19.8 Christian 9,619,085 74,684,578 12.9

Appendix D Legislative Research Commission Office of Education Accountability
58
District General Fund
Balance Total
Expenditures Fund Balance
Percent Clark 3,154,183 38,814,750 8.1 Clay 2,564,680 32,446,472 7.9 Clinton 3,155,169 16,024,633 19.7 Cloverport Ind. 390,685 3,037,997 12.9 Corbin Ind. 1,387,662 19,268,489 7.2 Covington Ind. 274,550 45,325,200 0.6 Crittenden 918,759 10,217,648 9.0 Cumberland 628,950 9,585,137 6.6 Danville Ind. 2,862,316 18,319,607 15.6 Daviess 7,123,398 92,290,258 7.7 Dawson Springs Ind. 1,232,604 5,782,809 21.3 Dayton Ind. 320,465 7,815,638 4.1 East Bernstadt Ind. 463,016 4,150,765 11.2 Edmonson 1,219,429 16,987,318 7.2 Elizabethtown Ind. 3,087,657 16,530,757 18.7 Elliott 294,572 10,051,252 2.9 Eminence Ind. 1,224,811 5,158,296 23.7 Erlanger-Elsmere Ind. 1,945,583 18,053,717 10.8 Estill 2,735,807 19,475,668 14.1 Fairview Ind. 469,230 6,194,146 7.6 Fayette 75,297,271 315,822,967 23.8 Fleming 3,426,425 18,891,821 18.1 Floyd 6,113,217 51,940,024 11.8 Fort Thomas Ind. 1,408,722 20,492,658 6.9 Frankfort Ind. 1,453,139 8,577,314 16.9 Franklin 3,074,691 47,014,179 6.5 Fulton 1,357,359 5,681,006 23.9 Fulton Ind. 557,924 4,481,756 12.5 Gallatin 1,048,408 14,214,141 7.4 Garrard 1,725,076 21,056,669 8.2 Glasgow Ind. 3,530,785 15,863,062 22.3 Grant 4,740,580 29,992,934 15.8 Graves 1,712,579 35,820,950 4.8 Grayson 2,445,319 34,023,799 7.2 Green 1,548,988 12,933,167 12.0 Greenup 2,780,914 25,462,061 10.9 Hancock 2,771,406 13,449,496 20.6 Hardin 15,065,771 106,824,113 14.1 Harlan 2,650,250 36,435,369 7.3 Harlan Ind. 1,195,473 6,325,412 18.9 Harrison 3,341,470 23,527,278 14.2

Legislative Research Commission Appendix D Office of Education Accountability
59
District General Fund
Balance Total
Expenditures Fund Balance
Percent Hart 1,965,025 20,913,439 9.4 Hazard Ind. 1,419,365 8,051,325 17.6 Henderson 18,913,143 53,659,899 35.3 Henry 3,811,373 17,034,292 22.4 Hickman 1,215,016 7,090,741 17.1 Hopkins 8,511,886 58,928,401 14.4 Jackson 1,351,919 20,305,893 6.7 Jackson Ind. 314,327 3,534,544 8.9 Jefferson 125,728,729 928,304,708 13.5 Jenkins Ind. 337,724 5,159,694 6.6 Jessamine 5,474,678 63,335,007 8.6 Johnson 6,684,270 31,916,946 20.9 Kenton 10,639,159 103,784,896 10.3 Knott 3,280,166 21,924,882 15.0 Knox 6,555,085 39,493,496 16.6 LaRue 6,640,067 18,230,695 36.4 Laurel 6,257,617 68,734,408 9.1 Lawrence 1,634,735 20,310,351 8.1 Lee 1,095,124 9,817,380 11.2 Leslie 1,182,264 17,111,741 6.9 Letcher 2,742,338 28,769,594 9.5 Lewis 1,898,670 20,248,979 9.4 Lincoln 5,152,835 35,728,505 14.4 Livingston 1,896,896 11,350,721 16.7 Logan 9,841,581 27,269,228 36.1 Ludlow Ind. 1,438,884 6,970,437 20.6 Lyon 828,496 7,432,518 11.2 Madison 8,545,914 82,691,753 10.3 Magoffin 4,520,071 21,998,542 20.6 Marion 3,084,906 24,658,532 12.5 Marshall 3,525,920 37,311,013 9.5 Martin 1,387,802 19,534,211 7.1 Mason 3,368,771 22,201,188 15.2 Mayfield Ind. 1,058,801 13,214,335 8.0 McCracken 10,084,869 56,220,355 17.9 McCreary 1,903,812 27,747,333 6.9 McLean 2,188,617 14,544,813 15.1 Meade 10,296,108 37,209,275 27.7 Menifee 1,294,689 9,413,270 13.8 Mercer 804,887 28,066,271 2.9 Metcalfe 4,139,206 13,582,364 30.5

Appendix D Legislative Research Commission Office of Education Accountability
60
District General Fund
Balance Total
Expenditures Fund Balance
Percent Middlesboro Ind. 328,292 13,961,137 2.4 Monroe 1,290,502 17,206,297 7.5 Montgomery 8,214,652 34,029,506 24.1 Monticello Ind. 769,068 7,242,967 10.6 Morgan 1,063,206 17,863,011 6.0 Muhlenberg 13,322,530 43,729,469 30.5 Murray Ind. 5,402,996 13,074,766 41.3 Nelson 1,970,723 35,938,338 5.5 Newport Ind. 145,101 21,505,933 0.7 Nicholas 2,320,797 9,735,579 23.8 Ohio 6,144,097 31,250,427 19.7 Oldham 11,349,447 93,032,137 12.2 Owen 2,173,818 15,669,544 13.9 Owensboro Ind. 7,143,844 38,410,858 18.6 Owsley 922,517 9,223,215 10.0 Paducah Ind. 2,595,118 32,400,402 8.0 Paintsville Ind. 2,297,143 7,021,265 32.7 Paris Ind. 494,128 6,272,766 7.9 Pendleton 699,968 21,795,752 3.2 Perry 2,621,340 36,295,696 7.2 Pike 6,270,963 81,239,576 7.7 Pikeville Ind. 1,949,642 11,208,030 17.4 Pineville Ind. 316,333 4,827,919 6.6 Powell 1,157,258 20,103,634 5.8 Pulaski 1,444,255 62,101,848 2.3 Raceland-Worthington Ind.
649,476 8,221,816 7.9
Robertson 227,017 3,372,711 6.7 Rockcastle 3,467,955 23,762,842 14.6 Rowan 1,330,178 25,704,569 5.2 Russell 581,778 25,085,800 2.3 Russell Ind. 2,633,345 16,842,566 15.6 Russellville Ind. 2,495,796 10,295,993 24.2 Science Hill Ind. 174,329 3,324,347 5.2 Scott 7,200,856 59,075,563 12.2 Shelby 13,173,395 50,702,583 26.0 Silver Grove Ind. 672,055 2,785,702 24.1 Simpson 2,699,781 22,665,569 11.9 Somerset Ind. 1,828,045 11,264,632 16.2 Southgate Ind. 306,644 1,658,747 18.5 Spencer 2,323,231 19,983,604 11.6

Legislative Research Commission Appendix D Office of Education Accountability
61
District General Fund
Balance Total
Expenditures Fund Balance
Percent Taylor 881,734 19,433,289 4.5 Todd 5,135,337 17,953,910 28.6 Trigg 5,272,147 16,466,360 32.0 Trimble 5,359,800 11,453,942 46.8 Union 5,570,910 21,586,316 25.8 Walton-Verona Ind. 2,912,483 12,352,986 23.6 Warren 19,230,414 95,916,430 20.1 Washington 3,242,503 14,357,648 22.6 Wayne 885,534 21,946,536 4.0 Webster 1,712,469 17,054,453 10.0 West Point Ind. 682,325 1,365,986 50.0 Whitley 2,860,706 39,830,714 7.2 Williamsburg Ind. 211,739 6,466,718 3.3 Williamstown Ind. 1,383,773 8,545,219 16.2 Wolfe 571,959 13,034,239 4.4 Woodford 4,245,590 28,697,441 14.8 State Total $773,909,777 $5,552,916,823 13.9%
Note: Total expenditures from Funds 1, 2, 51, 310, 320, and 400 less on-behalf-of payments and fund transfers. Source: Staff compilation of data from the Kentucky Department of Education.


Legislative Research Commission Appendix E Office of Education Accountability
63
Appendix E
School Districts’ General Fund Balances Fiscal Year 2005-Fiscal Year 2008
FY 2005 FY 2006 FY 2007 FY 2008
District
General Fund
Balance
Fund BalancePercent
GeneralFund
Balance
Fund BalancePercent
GeneralFund
Balance
Fund Balance Percent
GeneralFund
Balance
Fund Balance Percent
Adair $489,061 2.3% $525,900 2.6% $741,142 3.5% $720,091 3.3%Allen 4,290,186 21.6 3,364,660 15.7 2,218,292 10.0 2,336,702 10.6 Anchorage Ind. 650,163 12.7 565,704 10.0 777,999 14.2 1,104,768 19.8 Anderson 3,897,059 17.4 3,807,782 14.9 3,776,273 13.6 3,212,115 10.6 Ashland Ind. 2,701,361 12.0 3,088,390 13.3 2,343,920 9.8 1,430,072 5.6 Augusta Ind. 755,689 29.7 803,846 31.2 825,970 31.2 775,396 27.8 Ballard 3,623,433 35.7 3,167,941 27.7 3,139,644 27.4 2,165,544 16.6 Barbourville Ind. 199,762 4.7 227,054 5.1 229,093 5.1 291,068 6.2 Bardstown Ind. 428,855 2.7 338,060 2.0 674,713 3.8 650,392 3.3 Barren 851,130 2.9 855,606 2.6 846,595 2.4 814,320 2.1 Bath 1,853,596 14.7 2,604,533 19.6 3,132,282 22.0 3,021,445 19.4 Beechwood Ind. 1,317,670 19.8 1,442,714 18.6 1,709,490 21.2 2,000,641 19.8 Bell 1,607,508 6.7 1,224,066 4.9 1,079,969 4.2 579,872 2.1 Bellevue Ind. 922,875 16.6 1,122,256 19.2 1,303,699 20.9 1,522,244 23.6 Berea Ind. 1,801,168 24.7 2,126,521 26.3 2,680,841 31.8 2,918,424 32.6 Boone 17,388,902 17.2 18,315,552 16.3 21,332,962 17.4 23,011,051 16.4 Bourbon 1,795,992 9.7 2,189,848 9.4 2,748,904 13.0 2,634,004 11.6 Bowling Green Ind. 1,998,433 7.4 2,481,506 6.5 2,800,139 8.9 3,221,059 9.67 Boyd 1,975,978 7.3 1,863,292 6.7 2,171,574 7.9 2,274,605 7.8 Boyle 2,690,055 14.4 2,517,886 12.4 2,360,365 11.1 2,012,115 8.9 Bracken 1,305,118 9.6 1,292,963 15.0 1,349,959 15.2 1,546,987 16.5 Breathitt 2,208,560 12.6 1,977,567 10.3 1,459,425 7.0 1,172,600 5.4 Breckinridge 5,313,198 28.1 6,754,733 34.0 7,537,648 35.7 8,785,089 40.4 Bullitt 6,146,147 9.1 8,597,823 9.5 11,183,964 13.6 9,625,793 10.5 Burgin Ind. 712,800 27.7 676,646 23.9 737,293 25.1 762,498 23.4 Butler 1,877,011 12.6 1,797,562 11.5 2,132,431 12.6 1,870,752 9.5 Caldwell 3,292,279 24.2 3,602,183 25.3 3,880,002 26.0 3,885,381 24.5 Calloway 2,309,368 10.0 4,182,471 18.8 5,858,953 26.3 7,108,774 28.5 Campbell 4,771,788 11.6 2,232,061 5.8 4,990,503 12.6 3,902,208 9.3 Campbellsville Ind. 293,410 3.0 316,316 3.0 138,879 1.3 621,730 5.9 Carlisle 546,081 9.9 485,603 8.2 487,612 7.7 493,925 7.5 Carroll 4,917,442 34.0 5,707,748 38.0 6,127,225 37.8 7,469,265 44.5 Carter 1,698,154 5.2 1,696,450 5.0 2,095,253 5.9 2,013,113 5.3 Casey 2,500,930 15.2 2,833,043 16.0 3,675,845 19.9 4,506,580 22.4

Appendix E Legislative Research Commission Office of Education Accountability
64
FY 2005 FY 2006 FY 2007 FY 2008
District
General Fund
Balance
Fund BalancePercent
GeneralFund
Balance
Fund BalancePercent
GeneralFund
Balance
Fund Balance Percent
GeneralFund
Balance
Fund Balance Percent
Caverna Ind. 1,637,712 29.9 2,110,905 35.5 2,058,307 31.0 1,936,715 28.2 Christian 8,632,050 14.0 9,686,383 15.2 10,455,519 15.4 11,624,441 15.6 Clark 658,387 2.0 200,527 0.6 1,433,736 3.8 3,013,294 7.2 Clay 1,442,594 4.5 808,433 2.5 1,757,773 5.7 1,749,970 5.2 Clinton 1,867,603 14.8 2,267,604 16.2 2,764,668 17.1 2,719,627 16.3 Cloverport Ind. 100,027 3.7 113,629 4.0 155,208 5.7 204,708 6.7 Corbin Ind. 1,030,278 7.1 1,082,752 7.1 1,452,941 9.1 1,377,445 7.5 Covington Ind. 1,497,392 3.6 1,576,747 3.5 1,010,802 2.2 12,138 0.03 Crittenden 1,376,727 15.1 1,214,288 12.5 976,620 9.4 945,315 9.1 Cumberland 590,769 7.1 449,547 5.1 629,811 7.1 631,744 6.7 Danville Ind. 2,304,697 15.0 2,367,073 14.8 2,142,684 12.6 2,510,987 14.0 Daviess 4,594,646 6.1 5,125,480 6.4 6,214,359 7.4 5,594,222 5.9 Dawson Springs Ind. 694,174 13.9 882,478 18.1 980,949 18.7 1,188,091 22.0 Dayton Ind. 452,247 6.0 322,428 3.9 276,163 3.3 71,080 0.8 East Bernstadt Ind. 592,241 18.2 623,817 18.2 654,081 18.2 616,704 15.2 Edmonson 1,265,999 8.3 1,170,380 7.7 1,021,028 6.4 1,018,090 5.1 Elizabethtown Ind. 1,961,240 13.9 1,795,465 11.7 2,489,462 15.4 2,909,417 17.7 Elliott 579,385 6.5 666,349 7.2 473,309 4.7 371,300 3.6 Eminence Ind. 401,407 9.8 506,537 11.7 669,759 14.7 1,025,569 21.3 Erlanger-Elsmere Ind. 1,271,040 7.8 1,288,282 8.1 735,561 4.2 485,346 2.6 Estill 429,104 2.4 1,290,856 7.3 2,003,421 10.5 2,730,674 13.7 Fairview Ind. 153,307 3.1 406,200 8.0 332,145 5.7 417,246 7.1 Fayette 29,608,550 11.5 40,940,438 15.0 54,711,342 19.1 60,615,362 19.2 Fleming 3,071,960 18.1 2,892,076 16.5 2,709,118 15.3 2,785,525 15.1 Floyd 6,801,725 13.8 5,086,059 9.7 4,269,210 8.2 4,315,922 8.1 Fort Thomas Ind. 706,336 4.4 686,601 4.0 696,423 3.8 910,286 4.6 Frankfort Ind. 391,394 5.0 098,018 01.2 593,952 8.1 1,318,281 16.9 Franklin 2,377,887 6.0 2,679,472 6.2 2,749,823 6.2 2,034,375 4.2 Fulton 124,606 2.0 443,115 7.5 602,588 10.7 1,072,914 18.6 Fulton Ind. 793,116 19.3 799,793 19.1 800,944 18.7 620,452 14.0 Gallatin 1,402,837 13.0 1,165,684 9.9 1,435,711 11.4 1,584,189 11.6 Garrard 502,031 2.7 408,225 2.2 724,038 3.7 1,227,890 5.9 Glasgow Ind. 783,487 6.1 1,192,419 8.6 1,809,368 12.3 2,753,789 17.5 Grant $6,668,739 29.1 5,735,903 20.2 6,094,522 13.5 5,244,769 15.8 Graves $3,270,678 11.3 3,163,538 10.5 2,116,816 6.3 1,812,913 5.0 Grayson $2,768,420 10.5 2,466,495 8.7 2,906,688 9.9 3,317,178 10.0 Green $1,337,852 12.3 975,995 8.3 922,630 7.6 1,195,871 9.5 Greenup $4,639,223 21.5 4,402,076 19.2 4,139,103 17.5 3,602,518 14.3 Hancock $902,137 7.4 1,671,677 11.9 1,545,609 12.1 1,929,504 14.4

Legislative Research Commission Appendix E Office of Education Accountability
65
FY 2005 FY 2006 FY 2007 FY 2008
District
General Fund
Balance
Fund BalancePercent
GeneralFund
Balance
Fund BalancePercent
GeneralFund
Balance
Fund Balance Percent
GeneralFund
Balance
Fund Balance Percent
Hardin $12,577,605 14.3 10,843,875 11.2 11,133,522 11.1 11,715,119 10.7 Harlan $3,033,838 9.3 1,445,170 4.3 1,720,291 4.9 2,417,954 6.6 Harlan Ind. $1,124,220 18.6 1,228,080 20.1 1,429,802 23.0 1,206,898 19.1 Harrison $3,602,945 19.0 3,723,215 17.4 4,063,755 18.8 3,368,811 14.9 Harrodsburg Ind. $943,059 12.3 668,411 8.4 Null Null Null Null Hart $2,096,877 12.3 1,618,351 8.2 1,921,078 9.5 1,652,592 7.8 Hazard Ind. $551,986 8.8 417,567 6.1 702,029 9.9 1,065,091 14.2 Henderson $13,704,121 28.5 15,631,539 32.8 17,708,699 32.7 17,650,752 31.8 Henry $2,445,680 17.7 3,170,113 21.3 3,020,530 18.9 3,487,654 20.6 Hickman $842,294 13.7 670,049 10.2 652,746 9.8 984,473 14.6 Hopkins $4,714,622 9.5 4,756,112 9.0 5,464,110 10.3 6,800,469 10.7 Jackson $261,436 1.5 199,854 1.1 541,320 2.8 638,638 3.1 Jackson Ind. ($120,776) 02.5 46,996 1.3 225,511 5.4 171,798 5.2 Jefferson $47,828,975 6.1 67,950,061 8.3 67,134,499 7.8 100,166,926 10.9 Jenkins Ind. $180,337 4.2 193,482 4.2 382,673 8.1 264,089 5.0 Jessamine $3,971,748 6.8 5,672,205 10.8 5,999,352 10.7 5,314,280 8.8 Johnson $8,756,866 34.6 9,734,762 35.5 9,469,080 32.0 8,567,383 26.5 Kenton $7,167,468 8.5 8,437,060 9.4 7,121,586 7.2 5,902,176 5.4 Knott $1,948,258 9.4 1,566,855 7.5 2,646,137 13.1 2,834,924 13.2 Knox $6,070,815 17.2 5,339,794 14.1 4,806,213 12.0 5,226,390 13.0 LaRue $3,326,949 21.5 3,939,904 23.7 4,691,430 27.2 5,448,354 29.6 Laurel $4,144,775 7.4 6,859,481 11.9 5,303,327 8.2 4,882,376 7.0 Lawrence $3,846,486 21.3 3,420,562 17.2 1,026,270 4.8 917,067 4.6 Lee $1,330,476 14.5 1,405,667 15.1 1,555,069 15.9 1,292,517 12.6 Leslie $1,189,989 7.5 197,673 1.2 1,432,655 9.2 1,601,916 9.3 Letcher $1,641,234 6.4 1,496,995 5.1 1,579,622 5.4 1,972,790 6.7 Lewis $1,131,730 6.6 739,613 3.9 1,137,011 6.0 1,245,720 6.2 Lincoln $4,511,631 14.0 5,085,159 15.5 5,911,849 17.3 5,072,612 13.6 Livingston $2,920,463 29.5 2,796,131 26.7 2,754,347 25.2 2,433,642 21.0 Logan $9,383,805 42.2 9,460,922 38.9 8,410,867 32.6 8,942,622 32.1 Ludlow Ind. $556,500 8.2 117,269 1.7 $620,588 9.8 1,283,408 19.2 Lyon 1,429,781 20.6 884,535 11.5 931,101 12.5 804,293 10.3 Madison 5,751,401 8.9 6,907,948 9.6 5,947,254 7.5 7,458,969 9.3 Magoffin 2,852,967 15.1 4,674,338 24.7 4,968,594 25.1 5,470,589 25.6 Marion 2,400,486 11.5 2,469,511 10.7 2,454,206 10.2 2,316,345 9.1 Marshall 2,490,260 8.4 4,000,706 12.8 4,245,189 12.5 4,079,570 11.0 Martin 533,351 3.0 632,952 3.5 1,326,283 7.1 1,524,508 7.9 Mason 3,709,088 19.5 3,533,502 16.7 3,877,194 18.5 4,456,539 20.1 Mayfield Ind. 668,941 5.9 659,526 5.3 354,906 2.8 684,080 5.0

Appendix E Legislative Research Commission Office of Education Accountability
66
FY 2005 FY 2006 FY 2007 FY 2008
District
General Fund
Balance
Fund BalancePercent
GeneralFund
Balance
Fund BalancePercent
GeneralFund
Balance
Fund Balance Percent
GeneralFund
Balance
Fund Balance Percent
McCracken 4,331,857 9.2 6,497,346 14.0 9,391,010 19.5 10,279,338 19.6 McCreary 876,416 3.6 1,583,490 6.2 1,710,900 6.3 1,070,241 3.8 McLean 400,423 3.4 345,995 2.9 747,405 5.9 1,328,571 9.0 Meade 8,075,723 27.4 9,155,528 29.7 9,735,033 28.8 10,350,252 28.6 Menifee 563,485 6.6 498,320 5.5 516,784 5.5 722,277 7.5 Mercer 2,533,040 17.7 1,843,264 10.6 2,424,146 9.6 1,288,083 4.5 Metcalfe 532,619 4.1 873,244 6.8 1,671,876 13.2 3,018,739 22.3 Middlesboro Ind. 915,055 7.4 803,003 6.1 897,977 6.5 530,124 3.7 Monroe 1,859,244 12.4 1,493,944 9.1 1,624,446 9.4 1,052,561 5.7 Montgomery 2,426,239 8.8 3,230,846 10.5 5,030,806 15.8 6,536,731 19.0 Monticello Ind. 573,067 9.5 452,179 6.6 456,267 7.0 451,863 5.1 Morgan 1,410,820 8.6 1,643,983 9.8 1,804,041 9.8 1,263,198 6.6 Muhlenberg 9,655,323 26.9 11,550,932 30.3 12,589,317 31.0 15,151,014 34.6 Murray Ind. 1,215,514 10.1 1,756,771 13.9 3,284,405 29.8 4,733,602 37.0 Nelson 2,152,069 7.1 2,391,419 7.5 2,435,148 6.9 1,920,821 5.1 Newport Ind. 7,204,621 35.3 5,089,448 22.9 2,018,966 8.9 530,158 2.2 Nicholas 1,870,371 24.6 2,282,318 28.9 2,533,110 31.5 2,693,770 30.7 Ohio 6,139,598 21.5 7,236,531 22.4 7,162,882 23.7 4,873,069 15.0 Oldham 4,171,638 6.2 5,803,233 7.7 7,924,610 9.0 10,240,167 11.5 Owen 2,529,302 19.9 3,006,685 21.9 2,694,941 17.6 2,843,348 17.9 Owensboro Ind. 3,764,046 11.3 3,646,962 10.1 4,942,095 13.8 5,655,379 15.0 Owsley 1,077,005 12.3 1,042,453 12.0 766,626 8.5 700,056 7.4 Paducah Ind. 669,358 2.7 1,753,753 7.0 2,278,330 8.7 2,523,534 8.8 Paintsville Ind. 1,549,440 26.7 1,705,978 26.8 2,026,780 30.2 2,129,770 30.2 Paris Ind. 518,081 9.7 521,111 9.2 514,553 9.0 443,779 7.1 Pendleton 1,653,255 8.7 1,070,055 5.2 1,415,754 6.8 1,244,987 5.0 Perry 2,949,416 8.9 1,553,423 4.5 2,009,452 5.8 2,263,386 6.2 Pike 6,916,356 9.4 2,166,652 2.8 5,373,765 7.0 4,621,005 5.6 Pikeville Ind. 2,844,322 30.2 2,629,701 25.7 2,412,939 22.9 2,144,397 19.3 Pineville Ind. 341,535 8.0 304,863 6.8 472,564 10.6 328,141 6.7 Powell 1,504,512 8.5 1,196,957 6.5 1,529,182 8.1 1,484,502 7.4 Providence Ind. 301,068 9.2 335,027 10.2 237,564 7.3 Null Null Pulaski 2,363,383 4.6 2,199,677 4.0 2,000,289 3.3 94,473 0.2 Raceland-Worthington Ind. 1,381,306 20.2 1,285,535 18.2 949,279 12.2 897,220 11.1 Robertson 150,900 4.5 90,282 2.6 102,922 3.1 131,033 3.9 Rockcastle 3,694,240 17.7 3,703,194 17.3 4,006,691 17.7 3,400,850 13.8 Rowan 1,380,194 6.6 1,061,841 4.7 1,555,066 6.5 1,265,296 4.9 Russell 2,317,401 10.6 1,041,180 4.4 71,976 0.3 0204,071 0.8 Russell Ind. 1,062,166 7.9 1,153,450 8.3 1,677,948 11.3 2,278,525 14.5

Legislative Research Commission Appendix E Office of Education Accountability
67
FY 2005 FY 2006 FY 2007 FY 2008
District
General Fund
Balance
Fund BalancePercent
GeneralFund
Balance
Fund BalancePercent
GeneralFund
Balance
Fund Balance Percent
GeneralFund
Balance
Fund Balance Percent
Russellville Ind. 1,866,569 21.0 1,977,525 21.6 2,106,392 23.1 2,520,634 26.1 Science Hill Ind. 678,994 23.7 676,000 22.2 626,370 18.5 220,288 5.9 Scott 3,605,834 7.9 5,031,120 10.2 6,233,155 11.4 5,475,401 8.7 Shelby 12,015,329 32.8 13,347,401 32.2 14,687,603 31.7 12,652,407 25.0 Silver Grove Ind. 529,512 22.9 639,039 27.4 781,151 32.4 820,300 31.3 Simpson 2,812,794 14.6 2,835,955 14.2 3,379,403 16.1 3,326,219 14.7 Somerset Ind. 2,365,398 22.8 2,345,435 21.2 1,907,054 16.6 1,240,048 10.2 Southgate Ind. 182,401 14.8 546,881 42.4 557,024 39.2 445,775 27.1 Spencer 1,387,810 8.9 1,283,145 7.2 1,582,034 8.7 1,888,339 9.5 Taylor 2,060,083 12.5 2,348,739 12.5 1,771,805 9.4 493,867 2.4 Todd 5,182,798 35.4 4,910,559 31.8 5,333,829 33.1 5,299,490 29.6 Trigg 1,676,349 11.4 2,313,075 15.5 2,242,038 14.5 2,452,027 15.0 Trimble 2,341,698 22.8 2,767,038 25.9 3,531,280 31.9 4,648,719 40.4 Union 3,048,259 17.1 2,849,060 15.6 3,860,964 20.0 4,546,356 22.4 Walton-Verona Ind. 2,234,340 25.1 855,489 8.9 1,744,462 17.8 2,216,058 18.1 Warren 10,328,852 14.0 13,162,899 16.4 15,824,674 18.9 15,718,692 16.4 Washington 1,564,542 12.3 1,838,591 13.7 2,345,339 17.7 2,735,262 18.0 Wayne 796,530 4.0 490,345 2.4 32,261 0.2 0260,595 01.2 Webster 1,441,991 11.5 1,179,335 8.9 778,494 5.2 1,047,239 5.8 West Point Ind. 450,556 32.6 456,455 34.5 556,125 42.3 683,676 44.8 Whitley 2,988,258 8.2 2,705,616 7.3 3,471,060 9.1 2,243,719 5.6 Williamsburg Ind. 188,968 3.4 252,159 4.3 252,681 4.2 282,412 4.4 Williamstown Ind. 562,960 7.5 914,243 12.5 954,085 8.7 1,245,928 15.5 Wolfe 971,096 8.7 608,759 5.2 779,000 6.7 1,019,951 8.3 Woodford 1,440,675 6.0 2,487,047 9.9 4,118,795 15.3 4,331,657 15.3 State Total $522,934,857 11.2% $572,772,427 11.5% $633,190,669 12.2% $680,854,882 12.2%Note: Null refers to districts that have been consolidated into other systems and no longer exist. Source: Staff compilation of data from the Kentucky Department of Education.


Legislative Research Commission Appendix F Office of Education Accountability
69
Appendix F
Districts With at Least 20 Percent or Higher Fund Balance Percentages
This appendix presents comments gleaned from the OEA staff survey of districts. District
Percent Ending Fund
Balance
Explanation of Ending Fund Balance Anchorage Ind. 26.3% Currently pays tuition for students attending high school in Jefferson County Public
Schools. Tuition paid last year was more than $400,000. Amount continues to increase each year. Also saving for maintenance and boiler replacement.
Augusta Ind. 22.8 District was in deficit about 15 years ago. District anticipates this year's end-of-year fund balance to drop to about $500,000. Approximately $68,000 in general fund is for scholarships. District expects revenues to drop $100,000 next year.
Bath 21.6 Owingsville elementary needs new roof and other renovations. High school needs new roof and improvements to athletic complex currently leased from county parks system. Considering increasing certified salary schedule since it is one of lowest in state. Needs new buses. Also needs to purchase or lease facility for district's alternative program.
Beechwood Ind. 20.9 Since average daily attendance is increasing due to more private school children now attending public school, district needs more classrooms, computers, etc. Approximately $100,000 needed to fix cafeteria before next year.
Bellevue Ind. 25.1 Added two computer labs this year—one was laptops and other was desktops.Purchased desktops for all teachers at both schools, installed additional wireless components, and purchased smart boards and projectors. Also installed new security system throughout the district and new phone system. Approximate cost was $201,500.
Burgin Ind. 26.9 Approximately $150,000 was left over from a previous teacher's endowment. Interest from this is currently used to provide classroom items for teachers. Spent approximately $25,000 on parking lots and refinishing the gym floor. Hired additional teacher at the beginning of the year. Funds used to help offset cuts to Flex Focus funds. Plans to replace school roof and partially pay out of general fund. Needs 102 buses and planning to pay cash. Plans to purchase math textbooks. Needs to supplement extended school services. Saving because district experiences cash flow problems around August/September. Saving in anticipation of an adjustment (reduction) to SEEK appropriations.
Calloway 34.2 Expenditures from general fund have been and will continue to be necessary due to reductions in Flex Focus. Funding for the following items/projects is needed: asphalt for all district parking lots, multiple maintenance and transportation department vehicles, installation of security systems in the schools, upgrade existing phone systems, pending litigation against the district, and construction of an area tech center/vocational school. Most projects will not be started until financial conditions improve.

Appendix F Legislative Research Commission Office of Education Accountability
70
District
Percent Ending Fund
Balance
Explanation of Ending Fund Balance Dawson Springs Ind.
21.3 List of projects and approximate cost include: rebuild retaining wall behind central office, $11,000; demolish two old houses on campus, $12,000; move fiber optic cabling from demolished houses to data center, $16,000; repave central office parking lot, $19,000; create bus loop in front of preschool, $2,500; reroof 1958 section of elementary, $70,000; and renovate first-floor classrooms and restrooms in elementary, $600,000. District has no bonding potential, so all projects will have to be paid with general fund dollars.
Elizabethtown Ind.
20.0 Plans include several discretionary facility projects, such as upgrades to parking lots, field lighting, and parking lot lights, which have already been approved by board … Discretionary needs cost over $8 million and in a typical budget climate, district would have funded all along rather than waiting.
Eminence Ind. 23.7 Plans to replace heating/air conditioning system for elementary wing. District was deeded the community center building by the City of Eminence, so funds have been set aside to take over the additional expense of maintaining this building. District is in the process of updating its technology infrastructure with new wiring, etc.
Fulton 23.9 District plans include:1) To maintain a healthy balance for unexpected buildings and grounds needs; i.e. repair and replace doors; tiles; HVAC systems; assure floor maintenance needs are provided; assure painting needs are provided; etc; 2) To make informed choices about student learning needs including purchases of technology, instructional materials (since district does not have textbook funds), and professional development; 3) To prepare for and implement the requirements of Senate Bill 1; 4) To compensate for the continuing decline of funds for student transportation; and 5) To maintain staffing and services at a high level when budget cuts are imposed.
Hancock 20.6 Most of these funds were generated by a utility lawsuit. The district plans to save these funds for a vocational school in the near future
Johnson 20.9 District has no bonding potential and needs these funds to pay for roof repairs and to replace a category 5 school.
Livingston 20.9 Saving funds to replace district's middle school, considered a category 4, and pay for modifications due to safety issues in the high school. Needs new windows and doors with alarm systems according to audit performed at the high school. District is updating fiber optic lines now and plans to update technology at all schools. Land erosion behind the high school is also top priority.

Legislative Research Commission Appendix F Office of Education Accountability
71
District
Percent Ending Fund
Balance
Explanation of Ending Fund Balance Logan 36.4 District has been saving for years for a new elementary school. The land has been
purchased, architectural plans drawn, and the project approved by the state through BG 09-072. The BG-1 was recently rescinded due to lack of funds and the need to supplement educational programs instead of construction. There are several instructional projects for which funds have been accumulated. All the elementary/middle schools have reading and math grants that have enhanced student achievement, and district wants to continue these programs after the grants are complete, probably beginning next fiscal year. The district plans to implement distance learning labs, hopefully beginning this year. Other ongoing programs include Math Alliance, LoTi, Gear Up, Novell Stars, etc. Also, the district plans to replace outdated technology at each school. Board does not consider one month's operating resources to be excessive. Amount budgeted was increased due to tentative funding and the knowledge that state funding cuts could be made during the year, after commitments had been made. Also, fluctuating energy prices were considered. As the economy and funding stabilizes, some of these funds can be rebudgeted toward the construction of the elementary school.
Ludlow Ind. 20.6 The board wants to keep a large amount because it is on the watch list. Magoffin 20.5 The district is conservative in its spending to allow additional monies to be available
for unfunded mandates. District is largely saving to build athletic facilities. District has no track, baseball, or softball fields and no dressing room facilities for visiting football teams. The facility currently being used for weight lifting and for the football dressing room is inadequate. District currently leases the city/county park for home softball, baseball, and track events. District has had plans drawn up by architects on at least three occasions but could not afford the estimated cost, and the location available is in a floodway. District has discussed purchasing land out of the floodway or floodplain for future development of athletic facilities with enough land suitable for a bus garage. Since 2001, the district has built three state-of-the-art elementary schools and is currently renovating and building needed additions to the high school, addressing security and program space. The board recently asked architects to study the feasibility of building a facility to house a concession stand, restrooms, dressing rooms for home and visiting teams with showers, weight room/exercise room for all athletes, batting cage space for softball and baseball, and a wellness facility available to all staff and community agency partners' employees at a minimal monthly fee. The district is awaiting the estimated cost for this building. The district's last estimate to build a softball, baseball, weight room/dressing rooms, and relocate the football field to accommodate the other fields was around $3.8 million. The district will likely complete this project in phases. District has been trying to update its bus fleet by buying four or five new school buses, at least 10 percent of district's fleet.

Appendix F Legislative Research Commission Office of Education Accountability
72
District
Percent Ending Fund
Balance
Explanation of Ending Fund Balance Meade 27.7 Meade County Schools has been experiencing growth for the past few years and
anticipates a surge of growth in the near future related to base realignment and closure at neighboring Fort Knox. Since 2002, the district's enrollment has increased 8.5 percent, or 395 students. Over the past two school years, the number of students with parents in the active military has increased by 70 students (30 percent), and students with parents working as civilians at Fort Knox has increased by 131 students (34 percent). To address this growth, the district is building a new primary school, at a cost of $17.2 million, to be opened this fall. The district is also in the planning phase for a new middle school that will open in 2-3 years. This will be the district's largest construction project in the past 20 years. The district anticipates hiring many additional teachers, administrators, and support staff, while purchasing much infrastructure such as buses, computers and furniture over the next 5 years to staff these new buildings. Since the district's growth is coming at a time when state funding is being cut, this requires the district to have sufficient contingency funds to keep the district operating while adding new buildings, buses and staff. … Over the past 5 years, the district issued over $43 million in bonds to provide adequate facilities for learning. To finance this, the community agreed to levy a third Facility Nickel tax. Therefore, the district believes that a large contingency will be necessary to continue with their facility plan and fund the new recurring costs created by growth.
Metcalfe 30.5 Funds have been tied up in a BG-1 project. District is constructing a new middle school and anticipates completion of the project to be within 18 to 24 months.
Montgomery 24.1 A larger balance was carried forward from FY 2009 which contained substantial amounts of committed funds: A) $1,500,000 is reserved to retire short-term debts (Kentucky Interlocal School Transportation Association) and repay borrowed funds. This debt has not been repaid, because funds provide emergency protection for the general fund as state funding continues to be unstable. B) $2 million is reserved for an administrative center. The district administration was housed at an old elementary center that was then converted back to classrooms to meet urgent needs. The administration moved into the back of the high school. However, this makes the high school crowded. The administration needs to be housed in another location. C) $2 million is expected to be needed to balance the FY 2011 budget. $1 million in reserves and $750,000 in stimulus money was used to balance the general fund for FY 2010. The sum of $2 million may not be sufficient if state funds are further reduced. D) $1.5 million is needed in technology to complete intelligent classrooms. If funds permit, this will be done in FY 2011. If state funds continue to be unstable, the project will be divided over two fiscal years. E) $200,000 for textbooks and learning materials is needed above state funding. F) $45,000 is needed for instructional planning to incorporate new standards into the curriculum. G) $60,000 is for assessment upgrades and electronic scoring equipment. Obviously, the unfunded needs exceed the available funds. This coupled with the state funding scenario causes the district to hold back on some of these projects in order to protect instructional programs funded through the general fund.
Murray Ind. 41.3 Currently educating 300 students from Calloway County with no state funds following them. The district has been saving funds to help carry them through future years of losing students and trying to maintain bonding potential.

Legislative Research Commission Appendix F Office of Education Accountability
73
District
Percent Ending Fund
Balance
Explanation of Ending Fund Balance Russellville Ind. 24.2 The district has the following projects that it is saving for:
• rewiring schools • purchasing computers—staff computers are now 5 years old • new roof and a new compressor for the heating and cooling in the science wing at the high school • new energy-efficient windows, ceiling tile and lighting, and doors at the high school• air conditioning in the welding shop at area technology center • new gym floor in the next 5 years • purchasing textbooks for the high school • purchasing a bus next year • lights for new soccer field/score board/restrooms/press box The district needs approximately $42,000 per day to operate payroll. Since the district does not get funding until the first of November, it takes about 20 percent carryover to meet bills.
Silver Grove Ind.
24.1 District is saving for two projects—central air conditioning and heat for the high school building and gym renovations.
Todd 28.6 District's fund balance is being maintained for the following needs: • paying more of the cost of retired employees health insurance over the next few years • moving forward to fund all-day kindergarten • funding for preschool for all 4-year-olds who wish to attend • providing support services such as alternative school, credit recovery program, and extended school services in spite of decreased funding or in some cases eliminated funding. These programs are essential for the most at-risk students. • updating bus fleet and transportation services • providing all high school students with laptop computers through a lease that costs more than $300,000 per year • moving toward establishing career/technical center • replacing gym roof on middle school. The cost for this is $300,000-$400,000. • constructing restroom facilities on softball, volleyball, and baseball fields. This cost is around $100,000. • upgrading track. Estimated cost is $200,000. • fencing around all athletic fields. $200,000

Appendix F Legislative Research Commission Office of Education Accountability
74
District
Percent Ending Fund
Balance
Explanation of Ending Fund Balance Trigg 32.0 The district’s unmet facility needs are approximately $14 million, and its bonding
potential is approximately $1.2 million; thus renovations must be paid with cash. The district has spent $250,000 of its balance on technology upgrades this academic school year. The Trigg County Board of Education has approved two BG-1 applications for two roof/HVAC projects for the Vocational School and Central office at $900,000 +. Other needs the district will be addressing, as quickly as the economy stabilizes: 1) diesel fuel tanks and pump replacement for transportation department, $495,000; 2) construction of preschool classrooms, $3 million+; 3) elementary school building needs major renovation in the amount of $7 million; 4) the district, operating very conservatively, has elected to not purchase on an annual basis all the school buses necessary to meet the replacement guideline per the depreciation schedule. Needs to purchase at least 4 buses at $300,000; 5) the district, with four schools on one campus, presently has one kitchen and one cafeteria. Construction of a second cafeteria is estimated at $3 million+; 6) the district needs a fourth gymnasium, and the cost is estimated at $4 million.
Walton-Verona Ind.
23.6 District has $12,491,516 in unmet need on its facilities plan. This includes a classroom addition to an elementary school that is already under way but does not include another classroom addition to the high school that is needed immediately; architect is estimating the additional cost for this project to be between $2.5 million and $3 million. These additions are both needed to accommodate the continued growth in student population. Student population has grown 25.9 percent since the end of the 2004-2005 school year. District has very little bonding capacity (less than $500K), so the plan is to start the high school addition in the next 6-18 months, and the only way that this will be accomplished is through local funding as it appears that the district will not be receiving funding from the legislature for additions or renovations or additional offers of assistance. The district has transferred $2 million to its building fund (from the general fund) since the beginning of the year for this very purpose.
Warren 20.0 District's plans include the following:• South Warren High School, $2.5 million, opening August 2010 • South Warren Middle School, $1.5 million, opening August 2010 • Richardsville Elementary, $1.5 million, opening August 2010 • Bristow Elementary, $1.5 million, opening August 2010 • Ivan Downs Elementary, $1.5 million, opening August 2011 • bus purchases, $1.6 million; waiting on information on hybrid bus • network upgrades, $1.2 million, ongoing
Washington 22.6 The district would like build a new high school and renovate the current high school, converting it to a middle school. The district is in the design phase of the building project. However, the district does not have enough bonding capacity to build what it actually needs. The board wants to use a proactive approach to build what is needed in the future versus a reactive approach based on the current bonding capacity. Because of the age of the buildings, the district's current facility needs for maintenance is projected to spend $400,000 over the next few months in maintenance needs (water treatment plant system, fresh air unit replacement / HVAC, roofing needs, etc.) that are outside of the above mentioned “building projects.” The district is restructuring and updating its programming instructionally and meeting staffing obligations as well and hopes to fully implement by next fiscal year.

Legislative Research Commission Appendix F Office of Education Accountability
75
District
Percent Ending Fund
Balance
Explanation of Ending Fund Balance West Point Ind. 49.9 West Point Independent received $2 million from Urgent Needs Funds on January 31,
2008. Our building project was in process, but bills did not start going out until April with the larger amounts not arriving until July and August. The building project was completed, and the new wing was occupied on January 5, 2009. With the completion of this building project, the fund balance was lowered about $2.3 million.


Legislative Research Commission Appendix G Office of Education Accountability
77
Appendix G
Districts’ Explanations for General Fund Balance Sheet Restrictions
This appendix presents comments gleaned from the OEA staff survey of districts. District Code Description Amount Reason Berea Ind. 8767 Other Restricted $328,330 Cable tax restricted for lawsuit, now set aside
for new roof on school. Boone 8767 Other Restricted 4,199,406 Money is set aside to open new schools.
Revenue in lieu of taxes has limited number of years left. Opening a new elementary school in fall 2010. Opening a school every other year, and the estimated cost to open one ranges from $1.5 million to $2.5 million depending on grade level. Seventy-one buses in fleet are more than 12 years old.
Boyle 8765 Unknown Code 347,630 District was going to buy some land. Deal didnot go through, and funds were put in beginning balance.
Breckinridge 8759 Unknown Code 84,039 Bus purchases.Breckinridge 8763 Unknown Code 637,393 Whiteboard and laptop initiatives. Breckinridge 8766 Future Construction 60,000 Classified retirement match. Breckinridge 8772 Unknown Code 100,000 Adding foreign-language teachers.Breckinridge 8779 Unknown Code 9,960Breckinridge 8780 Unknown Code 500,000 Unanticipated fuel cost. Breckinridge 8781 Unknown Code 1,448,929 Reading/writing intervention. Breckinridge 8782 Unknown Code 70,000 One year of high school textbooks.
Breckinridge 8785 Unknown Code 95,939 One year’s worth of maintenance costBreckinridge 8787 Unknown Code 79,023Breckinridge 8788 Unknown Code 510,349 Innovative ideas from staff or students.Breckinridge 8789 Unknown Code 150,000Breckinridge 8791 Unknown Code 415,000 Energy management proposal. Bullitt 8779 Unknown Code 148,676 Fiber optic repair.Caldwell 8766 Future Construction 300,000 Maintenance building, two new roofs, sports
complex. Campbell 8767 Other Restricted 655 Internal Alumni Fund for scholarships.Carroll 8766 Future Construction 600,000 Renovating K-2 school with Head Start.
Construction is just beginning on the 3rd- to 5th-
grade renovation. Danville Ind. 8766 Future Construction 500,000 District planned on buying the central office
building it rents. It is now rethinking buying new building or renovating the elementary building and moving central office there.

Appendix G Legislative Research Commission Office of Education Accountability
78
District Code Description Amount Reason Fayette 8766 Future Construction 13,015,545 Clark Property (new elementary school);
Russell Cave Property (new warehouse); Equine Science Center (new tech school); Keithshire Elementary (new elementary school).
Fayette 8767 Other Restricted 5,029,059 Energy cost, litigation, sick leave payout.
Frankfort Ind. 8767 Other Restricted 4,232 National Board Certified Teachers. After staying with district for 5 years they get $1,000 a year.
Fulton Ind. 8766 Future Construction 119,602 Restricted for a roof that is leaking at the high school. Money will be used to repair roof and one of the water heaters at Carr Elementary.
Glasgow Ind. 8766 Future Construction 2,753,789 Construct new high school. District hopes to sell bonds July 1, 2010.
Graves 8766 Future Construction 30,073 New roof for a school. Harlan 8767 Other Restricted 479,000 Self insured for Workers Compensation.
Harlan Ind. 8766 Future Construction 577,318 Already spent $170,000 on a new preschool building. Two more projects coming up. Middle/high school does not have a cafeteria, and the library is more than 40 years old, so it needs to be expanded and rebuilt. Will cost $2 million to $2.5 million.
Henderson 8752 Unknown Code 1,607,000 Smart board technology. Henderson 8754 Unknown Code 429,000 New computers for the classroom. Henderson 8756 Reserve for Debt Service 643,000 Six new buses.Henderson 8757 Unknown Code 643,000 HVAC system for Spotsville Elementary in
the summer of 2011, and the rest will be used for Heights Elementary HVAC in 2012
Henderson 8758 Unknown Code 536,000 New roof for Spotsville Elementary insummer of 2011
Henderson 8759 Unknown Code 1,072,000 Construct a districtwide preschool building.Henry 8763 Unknown Code 49,700 Technology match.
Henry 8766 Future Construction 1,095,470 Restricted years ago for an elementary school but still not enough for bonding potential.
Jefferson 8767 Other Restricted 35,800,000 “Restrict state-required fund balance, 2percent is somewhere around $18M, but we’ve tried as we can to bring this amount up to the recommended 5 percent. It’s about 4 percent now.”
Kenton 8756 Reserve for Debt Service 58,557 Restricted due to donations that are given to three schools and the district can spend only the interest. Interest is only about $500 a year.
Knox 8766 Future Construction 694,392 District accumulated this from sales of school buildings and plans on using this for current facility needs. In 2010, the district is going to use some of the funds to construct a softball field.
LaRue 8756 Reserve for Debt Service 565,016 Qualified Zone Academy Bond restriction.

Legislative Research Commission Appendix G Office of Education Accountability
79
District Code Description Amount Reason LaRue 8767 Other Restricted 1,000,000 Originally set aside for future construction
and unfunded salaries. District is considering providing laptops for all high school students. This will cost a lot of upfront money and maintenance.
Lincoln 8767 Other Restricted 225,651 Bus garage in next 3-5 years. Lyon 8766 Future Construction 193,854 Emergency maintenance, such as new roofs.Madison 8767 Other Restricted 2,180,802 Currently moved to beginning balance and is
spending it on operating expenses for new middle school.
Marshall 8767 Other Restricted 20,229 The district matches $5,000 per year for elementary school playground equipment for the next 4 years.
Muhlenberg 8767 Other Restricted 442,460 Will be used for Bremen Elementary. $12 million project, new auditorium costing $4.5 million, currently submitted a BG-1 for football complex, redoing HVAC at the old high school gyms. $1.5 million out of general fund.
Nelson 8752 Unknown Code 250,000 Coded wrong; should be sick leave.Nelson 8754 Unknown Code 265,756 Smart board technology. Nelson 8756 Reserve for Debt Service 325,000 School buses.Nelson 8757 Unknown Code 300,000 Roof at Cox’s Creek Elementary. Nelson 8758 Unknown Code 130,000 Roof at Cox’s Creek Elementary. Ohio 8761 Unknown Code 244,501 Restriction for lawsuit over tax collection.
The lawsuit is settled; half the settlement went to sheriff, and half went to the construction account.
Ohio 8767 Other Restricted 2,167,647 Two BG-1s for a football practice field repair and toilet renovations at the high school. One of these cost $400,000 and the other $300,000.
Oldham 8766 Future Construction 1,150,000 This was set aside 2 years ago for the opening of a new elementary school (Locust Grove Elementary) to pay for operating and opening expenses. District will start using these funds in 2011.
Paintsville Ind. 8761 Unknown Code 339,201 Restricted for bond payments. Paintsville Ind. 8766 Future Construction 1,000,000 District has a high school without a cafeteria,
has taken bids, and is starting on site preparation. Roof at Paintsville Elementary will need to be replaced in next 2 years.
Russell Ind. 8767 Other Restricted 57,132 Family Resources and Youth Services Centersdonations, Medicaid reimbursements, community education donations, Kentucky Education Technology System donations. Every July 1, district unrestricts this money and puts it in the general fund beginning balance.

Appendix G Legislative Research Commission Office of Education Accountability
80
District Code Description Amount Reason Scott 8767 Other Restricted 1,294,177 Equip new Vo-Tech school, which will be
partially opening in the fall of 2010, fully operational in fall of 2011.
Shelby 8766 Future Construction 9,230,521 New facilities and operating expenses.
Simpson 8766 Future Construction 1,000,000 New gym for the high school. Trimble 8766A Future Construction 500,331 New bleachers for the middle school.Trimble 8766B Future Construction 500,000 Upgrade electrical system at high school.Trimble 8766C Future Construction 800,000 Full-day kindergarten. Trimble 8766D Future Construction 700,000 Full-day kindergarten. Union 8766 Future Construction 400,000 HVAC and lighting system. Union 8767 Other Restricted 1,235,000 Needed for bonding future construction
projects. Wayne 8756 Reserve for Debt Service 132,613 Qualified Zone Academy Bond restriction.

Legislative Research Commission Appendix H Office of Education Accountability
81
Appendix H
Office of Education Accountability Fund Balance Survey


Legislative Research Commission Appendix I Office of Education Accountability
83
Appendix I
Per-pupil Special Revenue Fund Local, State, and Federal Revenues Fiscal Year 2009
District
Per-pupil Local
Revenue
Percent of
Total
Per-pupil State
Revenue
Percent of
Total
Per-pupil Federal Revenue
Percent of
Total
Per-pupil Total
Revenue Adair $24 1% $466 28% $1,192 71% $1,681 Allen 47 4 347 27 886 69 1,280 Anchorage Ind. 63 15 88 21 276 65 427 Anderson 30 3 551 47 586 50 1,167 Ashland Ind. 18 1 347 23 1,118 75 1,483 Augusta Ind. 11 0 1,024 42 1,420 58 2,455 Ballard 71 4 812 50 755 46 1,637 Barbourville Ind. 49 3 339 22 1,167 75 1,555 Bardstown Ind. 28 3 421 38 649 59 1,098 Barren 73 5 426 29 961 66 1,459 Bath 136 8 575 34 973 58 1,684 Beechwood Ind. 17 3 220 32 444 65 682 Bell 7 0 697 37 1,195 63 1,899 Bellevue Ind. 2 0 397 29 988 71 1,386 Berea Ind. 18 1 468 27 1,253 72 1,739 Boone 18 3 233 36 402 62 653 Bourbon 132 5 586 24 1,713 70 2,431 Bowling Green Ind. 3 0 437 31 969 69 1,409 Boyd 10 1 606 32 1,289 68 1,905 Boyle 41 3 589 47 631 50 1,261 Bracken 0 0 447 41 636 59 1,083 Breathitt 115 4 1,023 36 1,703 60 2,841 Breckinridge 87 5 315 19 1,291 76 1,692 Bullitt 47 5 394 40 547 55 988 Burgin Ind. 0 0 592 58 431 42 1,024 Butler 10 1 457 32 967 67 1,434 Caldwell 0 0 387 31 846 69 1,233 Calloway 46 4 533 41 725 56 1,304 Campbell 1 0 501 53 444 47 947 Campbellsville Ind. 21 1 791 32 1,693 68 2,505 Carlisle 221 14 771 47 635 39 1,627 Carroll 57 4 322 23 1,021 73 1,400 Carter 4 0 539 38 893 62 1,436 Casey 42 3 395 24 1,186 73 1,622 Caverna Ind. 21 1 619 30 1,445 69 2,085 Christian 4 0 500 32 1,057 68 1,561 Clark 28 3 392 36 680 62 1,099 Clay 162 7 620 27 1,542 66 2,324 Clinton 3 0 859 29 2,078 71 2,940 Cloverport Ind. 416 11 1,319 36 1,920 53 3,655 Corbin Ind. (0) 0 468 36 846 64 1,314

Appendix I Legislative Research Commission Office of Education Accountability
84
District
Per-pupil Local
Revenue
Percent of
Total
Per-pupil State
Revenue
Percent of
Total
Per-pupil Federal Revenue
Percent of
Total
Per-pupil Total
Revenue Covington Ind. 100 3 965 30 2,184 67 3,249 Crittenden 0 0 427 30 978 70 1,405 Cumberland 0 0 605 29 1,483 71 2,088 Danville Ind. 340 17 685 34 984 49 2,009 Daviess 49 4 452 41 602 55 1,103 Dawson Springs Ind. 9 1 483 31 1,072 69 1,564 Dayton Ind. 0 0 468 30 1,111 70 1,579 East Bernstadt Ind. 0 0 692 46 814 54 1,506 Edmonson 15 1 719 46 839 53 1,573 Elizabethtown Ind. 38 4 367 42 463 53 868 Elliott 45 2 687 32 1,444 66 2,176 Eminence Ind. 94 7 449 34 793 59 1,336 Erlanger-Elsmere Ind. 25 2 298 30 682 68 1,005 Estill 23 1 590 35 1,082 64 1,695 Fairview Ind. 0 0 520 46 604 54 1,124 Fayette 11 1 479 40 698 59 1,188 Fleming 19 1 674 40 993 59 1,686 Floyd 11 1 485 28 1,216 71 1,712 Fort Thomas Ind. 99 17 146 25 335 58 580 Frankfort Ind. 184 7 1,070 43 1,244 50 2,498 Franklin 11 1 442 46 500 52 953 Fulton 0 0 468 20 1,859 80 2,327 Fulton Ind. 48 2 883 36 1,513 62 2,444 Gallatin 28 2 396 34 747 64 1,171 Garrard 21 2 431 37 724 62 1,176 Glasgow Ind. 0 0 428 32 911 68 1,339 Grant 21 3 203 25 591 72 815 Graves 8 1 426 36 743 63 1,177 Grayson 10 1 471 34 906 65 1,387 Green 11 1 249 23 822 76 1,082 Greenup 4 0 320 24 1,013 76 1,337 Hancock 5 0 509 49 530 51 1,044 Hardin 9 1 431 41 620 58 1,060 Harlan 7 0 574 27 1,558 73 2,139 Harlan Ind. 95 6 529 33 959 61 1,583 Harrison 34 4 286 31 615 66 935 Hart 40 2 726 35 1,286 63 2,052 Hazard Ind. 3 0 1,172 54 1,012 46 2,187 Henderson 5 0 474 40 700 59 1,179 Henry 10 1 448 42 599 57 1,057 Hickman 158 9 579 31 1,102 60 1,839 Hopkins 1 0 385 35 714 65 1,100 Jackson 5 0 750 32 1,556 67 2,311 Jackson Ind. 0 0 811 51 785 49 1,596 Jefferson 232 13 444 25 1,078 61 1,754 Jenkins Ind. 15 1 491 24 1,567 76 2,073 Jessamine 34 3 517 46 585 51 1,136
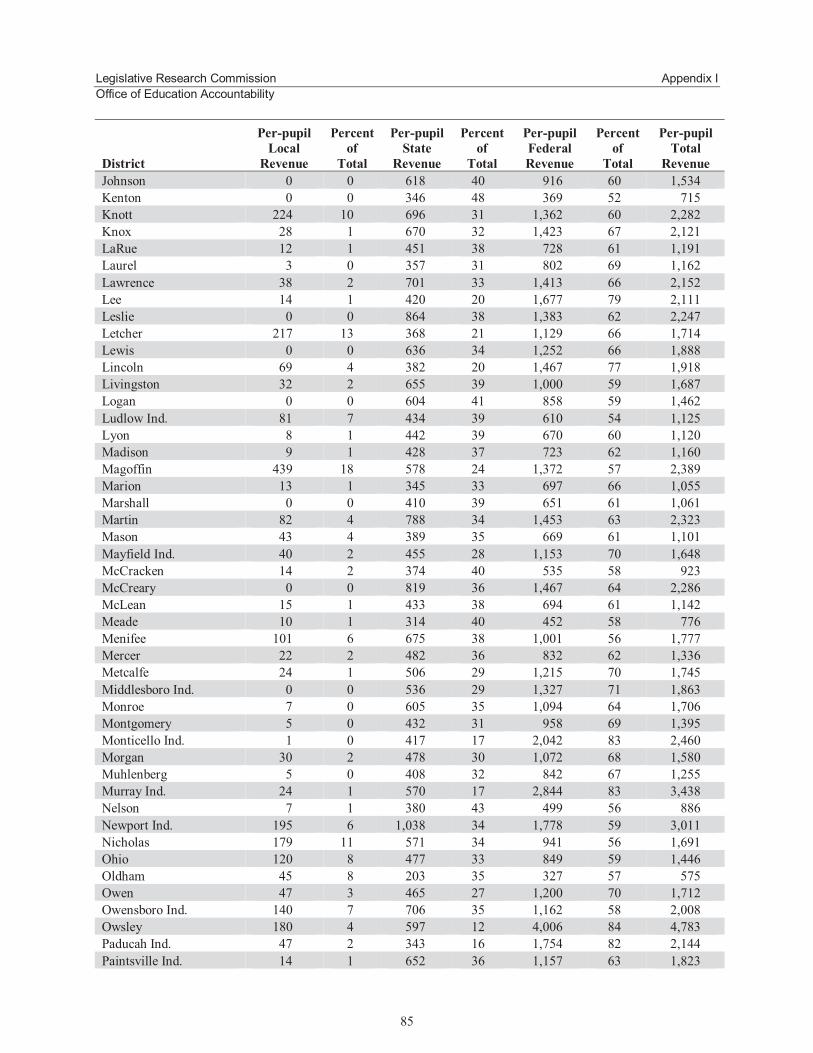
Legislative Research Commission Appendix I Office of Education Accountability
85
District
Per-pupil Local
Revenue
Percent of
Total
Per-pupil State
Revenue
Percent of
Total
Per-pupil Federal Revenue
Percent of
Total
Per-pupil Total
Revenue Johnson 0 0 618 40 916 60 1,534 Kenton 0 0 346 48 369 52 715 Knott 224 10 696 31 1,362 60 2,282 Knox 28 1 670 32 1,423 67 2,121 LaRue 12 1 451 38 728 61 1,191 Laurel 3 0 357 31 802 69 1,162 Lawrence 38 2 701 33 1,413 66 2,152 Lee 14 1 420 20 1,677 79 2,111 Leslie 0 0 864 38 1,383 62 2,247 Letcher 217 13 368 21 1,129 66 1,714 Lewis 0 0 636 34 1,252 66 1,888 Lincoln 69 4 382 20 1,467 77 1,918 Livingston 32 2 655 39 1,000 59 1,687 Logan 0 0 604 41 858 59 1,462 Ludlow Ind. 81 7 434 39 610 54 1,125 Lyon 8 1 442 39 670 60 1,120 Madison 9 1 428 37 723 62 1,160 Magoffin 439 18 578 24 1,372 57 2,389 Marion 13 1 345 33 697 66 1,055 Marshall 0 0 410 39 651 61 1,061 Martin 82 4 788 34 1,453 63 2,323 Mason 43 4 389 35 669 61 1,101 Mayfield Ind. 40 2 455 28 1,153 70 1,648 McCracken 14 2 374 40 535 58 923 McCreary 0 0 819 36 1,467 64 2,286 McLean 15 1 433 38 694 61 1,142 Meade 10 1 314 40 452 58 776 Menifee 101 6 675 38 1,001 56 1,777 Mercer 22 2 482 36 832 62 1,336 Metcalfe 24 1 506 29 1,215 70 1,745 Middlesboro Ind. 0 0 536 29 1,327 71 1,863 Monroe 7 0 605 35 1,094 64 1,706 Montgomery 5 0 432 31 958 69 1,395 Monticello Ind. 1 0 417 17 2,042 83 2,460 Morgan 30 2 478 30 1,072 68 1,580 Muhlenberg 5 0 408 32 842 67 1,255 Murray Ind. 24 1 570 17 2,844 83 3,438 Nelson 7 1 380 43 499 56 886 Newport Ind. 195 6 1,038 34 1,778 59 3,011 Nicholas 179 11 571 34 941 56 1,691 Ohio 120 8 477 33 849 59 1,446 Oldham 45 8 203 35 327 57 575 Owen 47 3 465 27 1,200 70 1,712 Owensboro Ind. 140 7 706 35 1,162 58 2,008 Owsley 180 4 597 12 4,006 84 4,783 Paducah Ind. 47 2 343 16 1,754 82 2,144 Paintsville Ind. 14 1 652 36 1,157 63 1,823

Appendix I Legislative Research Commission Office of Education Accountability
86
District
Per-pupil Local
Revenue
Percent of
Total
Per-pupil State
Revenue
Percent of
Total
Per-pupil Federal Revenue
Percent of
Total
Per-pupil Total
Revenue Paris Ind. 19 1 575 36 1,018 63 1,612 Pendleton 0 0 488 44 609 56 1,097 Perry 17 1 651 37 1,100 62 1,768 Pike 76 4 405 23 1,278 73 1,759 Pikeville Ind. (23) 03 206 23 726 80 909 Pineville Ind. 0 0 732 39 1,122 61 1,854 Powell 15 1 556 33 1,121 66 1,692 Pulaski 11 1 499 34 948 65 1,458 Raceland-Worthington Ind. 14 1 474 35 852 64 1,340 Robertson 13 1 561 31 1,222 68 1,796 Rockcastle 1 0 330 26 945 74 1,276 Rowan 18 1 473 35 876 64 1,367 Russell 5 0 398 29 989 71 1,392 Russell Ind. 57 6 307 34 552 60 916 Russellville Ind. 70 4 551 33 1,053 63 1,674 Science Hill Ind. 0 0 479 46 572 54 1,051 Scott 17 2 361 46 399 51 777 Shelby 68 7 441 47 423 45 932 Silver Grove Ind. 354 16 946 43 875 40 2,175 Simpson 25 2 495 41 695 57 1,215 Somerset Ind. 48 4 319 26 841 70 1,208 Southgate Ind. 319 14 867 37 1,134 49 2,320 Spencer 19 2 444 52 383 45 846 Taylor 24 2 306 30 673 67 1,003 Todd 3 0 828 46 959 54 1,790 Trigg 0 0 532 47 598 53 1,130 Trimble 20 2 245 18 1,070 80 1,335 Union 0 0 610 44 767 56 1,376 Walton-Verona Ind. 0 0 248 42 344 58 592 Warren 8 1 346 35 638 64 992 Washington 63 4 535 35 930 61 1,528 Wayne 12 1 486 33 965 66 1,463 Webster 2 0 321 30 735 69 1,058 West Point Ind. 222 7 1,623 50 1,417 43 3,262 Whitley 111 6 579 30 1,214 64 1,904 Williamsburg Ind. 0 0 597 30 1,420 70 2,017 Williamstown Ind. 35 2 677 34 1,281 64 1,993 Wolfe 48 2 603 28 1,540 70 2,191 Woodford 18 2 285 39 432 59 735 State Average $62 4% $461 33% $884 63% $1,407
Note: Percent of total local, state, and federal per-pupil revenue may not add up to 100 percent due to rounding. Source: Staff compilation of data from the Kentucky Department of Education.

Legislative Research Commission Appendix J Office of Education Accountability
87
Appendix J
School Districts’ Fund Balances, Fiscal Year 2009 Funds 2, 51, 310, and 320
District Fund 2 Fund 51 Fund 310 Fund 320 Adair $2 $131,098 $250,964 $139,740 Allen 0 694,256 0 96,955 Anchorage Ind. 0 35,442 0 0 Anderson 0 402,172 (175,839) 1,021,519 Ashland Ind. 0 225,273 251,710 25,124 Augusta Ind. 0 28,145 432 16,827 Ballard 0 142,321 386,795 239,578 Barbourville Ind. 0 39,128 18,985 126,219 Bardstown Ind. 0 309,160 0 0 Barren 0 121,795 0 0 Bath 0 289,706 29,222 15,703 Beechwood Ind. 109,204 5,020 19,871 347,325 Bell 1 30,364 882,940 964,296 Bellevue Ind. 0 93,446 17,658 5,786 Berea Ind. 0 102,482 4,117 305,360 Boone 0 2,081,321 0 0 Bourbon 0 111,985 0 187,114 Bowling Green Ind. 184,460 201,338 336,877 857,028 Boyd 0 101,113 0 0 Boyle 0 344,729 44,019 35,739 Bracken 0 61,741 190,184 1,343,980 Breathitt 0 14,476 0 0 Breckinridge 13,572 492,387 284,610 246,006 Bullitt 225,277 1,004,268 0 0 Burgin Ind. 0 6,595 23,567 204,179 Butler 74,404 295,626 190,519 249,700 Caldwell 0 189,538 277,374 809,670 Calloway 0 661,253 285,078 207,227 Campbell 0 243,219 507,210 0 Campbellsville Ind. 0 74,647 0 0 Carlisle 0 124,033 0 0 Carroll 0 67,308 318,306 233,687 Carter 0 604,551 0 426,036 Casey 0 506,920 74,400 33,118 Caverna Ind. 0 44,605 94,428 0 Christian 0 1,948,401 0 703,290

Appendix J Legislative Research Commission Office of Education Accountability
88
District Fund 2 Fund 51 Fund 310 Fund 320 Clark 0 385,955 269,656 1,276,349 Clay 0 0 9,997 98,999 Clinton 0 61,525 0 0 Cloverport Ind. 3,699 0 81,306 17,832 Corbin Ind. 0 283,158 0 0 Covington Ind. 0 48,063 0 0 Crittenden 0 143,972 0 0 Cumberland 0 114,616 18,690 236,642 Danville Ind. 0 57,072 115,086 69,667 Daviess 0 1,532,166 0 3,592,472 Dawson Springs Ind. 26,637 106,716 36,083 274,869 Dayton Ind. 0 87,736 26,869 173,096 East Bernstadt Ind. (2) 67,391 119,054 273,233 Edmonson 60,933 44,633 4,478 95,809 Elizabethtown Ind. 59,980 517,006 1,906,007 4,007,754 Elliott 0 181,388 0 1,738 Eminence Ind. 0 85,660 0 343,057 Erlanger-Elsmere Ind. 0 12,633 0 372,410 Estill 0 88,333 48,176 378,938 Fairview Ind. 0 66,002 0 15,966 Fayette 0 3,594,218 0 821 Fleming 0 218,957 11,560 0 Floyd 0 333,513 421,437 1,245,260 Fort Thomas Ind. 0 301,914 27,606 166,319 Frankfort Ind. 0 0 0 161,729 Franklin 0 194,982 517,263 927,418 Fulton 0 137,615 81,359 0 Fulton Ind. 0 53,043 63,706 297,048 Gallatin 0 134,724 0 666,160 Garrard 0 22,489 0 4,111 Glasgow Ind. 0 210,944 0 1,291,215 Grant (2) 522,675 1,273,613 2,057,245 Graves 0 130,720 0 185,987 Grayson 0 121,838 743 0 Green 0 191,465 97,911 287,980 Greenup 0 0 0 452,121 Hancock 0 135,364 2,467 1 Hardin 245,850 871,118 14,655 1,767 Harlan 0 396,965 1,900 895,773 Harlan Ind. 0 38,108 0 0 Harrison 0 273,825 3,275 261 Hart 83,626 189,839 0 99,787

Legislative Research Commission Appendix J Office of Education Accountability
89
District Fund 2 Fund 51 Fund 310 Fund 320 Hazard Ind. 0 71,806 618,049 171,965 Henderson 0 1,989,232 1,550,150 935,346 Henry 0 204,002 0 0 Hickman 0 19,278 81,069 2,892 Hopkins 573,418 603,052 541,985 0 Jackson 0 89,401 43,467 18,863 Jackson Ind. 0 16,897 0 932 Jefferson 0 1,089,353 0 19,365,290 Jenkins Ind. 0 0 70,116 166,305 Jessamine 0 1,396,550 618,959 793,120 Johnson 0 352,444 173,743 598,532 Kenton 0 1,250,279 0 0 Knott 0 20,799 427,239 57,666 Knox 0 488,351 126,584 0 LaRue 54,559 956,084 0 4,197 Laurel 0 230,289 0 0 Lawrence 0 164,884 58,699 420,259 Lee 0 55,155 61,860 3,504 Leslie 0 190,671 71,919 134,439 Letcher 0 78,999 0 0 Lewis 0 63,004 0 0 Lincoln 0 (16,419) 988,310 36,512 Livingston 0 133,533 75,946 62,681 Logan 106,852 617,543 361,286 468,854 Ludlow Ind. 0 101,317 11,899 55,240 Lyon 0 70,414 17,076 51,917 Madison 0 779,465 29,217 4,562,409 Magoffin 0 80,617 0 0 Marion 0 71,295 176,225 82,673 Marshall 0 246,214 197,133 652,007 Martin 0 127,807 0 59,415 Mason 0 215,620 141,568 426,080 Mayfield Ind. 0 295,700 0 0 McCracken 0 729,161 1,578,469 5,822,122 McCreary 0 437,466 90,586 0 McLean 0 90,328 0 0 Meade 0 3,161 141,961 2,037,965 Menifee 0 42,146 66,578 62,791 Mercer 0 182,694 7,256 48,515 Metcalfe 0 107,110 26,176 196,471 Middlesboro Ind. (0) 23,188 0 97,010 Monroe 0 22,084 750 5,741

Appendix J Legislative Research Commission Office of Education Accountability
90
District Fund 2 Fund 51 Fund 310 Fund 320 Montgomery 0 787,723 0 21,100 Monticello Ind. 0 120,505 14,268 70,075 Morgan 0 363,826 0 1,460,704 Muhlenberg 0 577,352 0 474,123 Murray Ind. 0 265,472 386,157 1,884,855 Nelson 0 586,404 0 0 Newport Ind. 0 3,832 20,698 635,494 Nicholas 0 116,681 0 0 Ohio 801,692 622,849 0 195,649 Oldham 225,599 894,052 0 1,538,367 Owen 0 82,426 0 451,352 Owensboro Ind. 185,995 1,094,447 0 2,433,431 Owsley 0 199,278 38,073 114,178 Paducah Ind. 0 147,233 214,041 1,382,974 Paintsville Ind. 0 197,018 0 217,374 Paris Ind. 0 92,826 21,003 135,356 Pendleton 0 668,030 157,387 4,971,020 Perry 0 44,519 0 32,911 Pike 0 568,300 0 0 Pikeville Ind. 0 0 128,488 844 Pineville Ind. (0) 21,421 0 0 Powell 0 220,153 0 1,001 Pulaski 0 751,937 0 157,467 Raceland-Worthington Ind. 0 195,843 0 0 Robertson 0 32,302 43,840 57,046 Rockcastle 0 168,008 0 0 Rowan 0 226,391 628,935 1,431,002 Russell 111,177 146,290 0 0 Russell Ind. 0 176,062 330,933 4,580 Russellville Ind. 27,761 199,619 0 0 Science Hill Ind. 0 21,512 0 0 Scott 0 953,007 260,265 1,335 Shelby 0 702,965 0 3,473,094 Silver Grove Ind. 0 (36,443) 48,123 89,734 Simpson 51,211 118,650 118,795 40,218 Somerset Ind. 0 177,988 4,945 181,958 Southgate Ind. 0 17,669 21,368 66,511 Spencer 0 123,162 0 2,698,519 Taylor 0 253,487 0 1,852,317 Todd 114,207 132,494 41,645 599,148 Trigg 59,284 428,365 133,079 75,760

Legislative Research Commission Appendix J Office of Education Accountability
91
District Fund 2 Fund 51 Fund 310 Fund 320 Trimble 0 234,493 0 0 Union 0 105,220 42,124 63,229 Walton-Verona Ind. 0 114,794 0 0 Warren 812,290 2,167,690 0 0 Washington 0 18 857,236 2,356,374 Wayne 0 211,301 514 0 Webster 216,713 300,573 7,939 8,724 West Point Ind. 0 0 16,254 181,714 Whitley 0 510,715 622,299 2,035,559 Williamsburg Ind. (10,282) 9,643 0 57,283 Williamstown Ind. 0 67,857 0 147,813 Wolfe 0 0 0 34,636 Woodford 0 33,971 0 1,058,503 State Total $4,418,120 $53,699,107 $21,979,011 $98,906,087
Source: Staff compilation of data from the Kentucky Department of Education.


Legislative Research Commission Appendix K Office of Education Accountability
93
Appendix K
Per-pupil Building Fund Local, State, and Federal Revenues Fiscal Year 2009
District
Per-pupil Local
Revenue Percent of
Total
Per-pupil State
Revenue Percent of
Total Per-pupil Total
Revenue Adair $145 40% $ 221 60% $366 Allen 587 57 442 43 1,029 Anchorage Ind. 1,167 100 0 0 1,167 Anderson 661 71 274 29 935 Ashland Ind. 171 48 185 52 356 Augusta Ind. 92 27 246 73 338 Ballard 394 54 336 46 730 Barbourville Ind. 91 25 274 75 365 Bardstown Ind. 740 77 220 23 960 Barren 523 59 368 41 891 Bath 112 31 250 69 362 Beechwood Ind. 551 78 157 22 708 Bell 131 34 254 66 385 Bellevue Ind. 268 73 97 27 365 Berea Ind. 229 31 510 69 739 Boone 1,106 100 0 0 1,106 Bourbon 222 61 142 39 364 Bowling Green Ind. 378 52 346 48 724 Boyd 238 63 141 37 379 Boyle 224 62 136 38 360 Bracken 492 52 447 48 939 Breathitt 121 34 235 66 356 Breckinridge 182 51 174 49 356 Bullitt 689 73 250 27 939 Burgin Ind. 276 79 74 21 350 Butler 121 33 242 67 363 Caldwell 142 40 212 60 354 Calloway 252 70 106 30 358 Campbell 779 100 0 0 779 Campbellsville Ind. 194 54 168 46 362 Carlisle 153 43 206 57 359 Carroll 239 68 114 32 353 Carter 103 29 258 71 361 Casey 131 36 231 64 362 Caverna Ind. 217 60 143 40 360 Christian 189 52 175 48 364 Clark 539 85 93 15 632 Clay 86 24 278 76 364 Clinton 148 41 213 59 361 Cloverport Ind. 70 18 322 82 392 Corbin Ind. 327 40 488 60 815
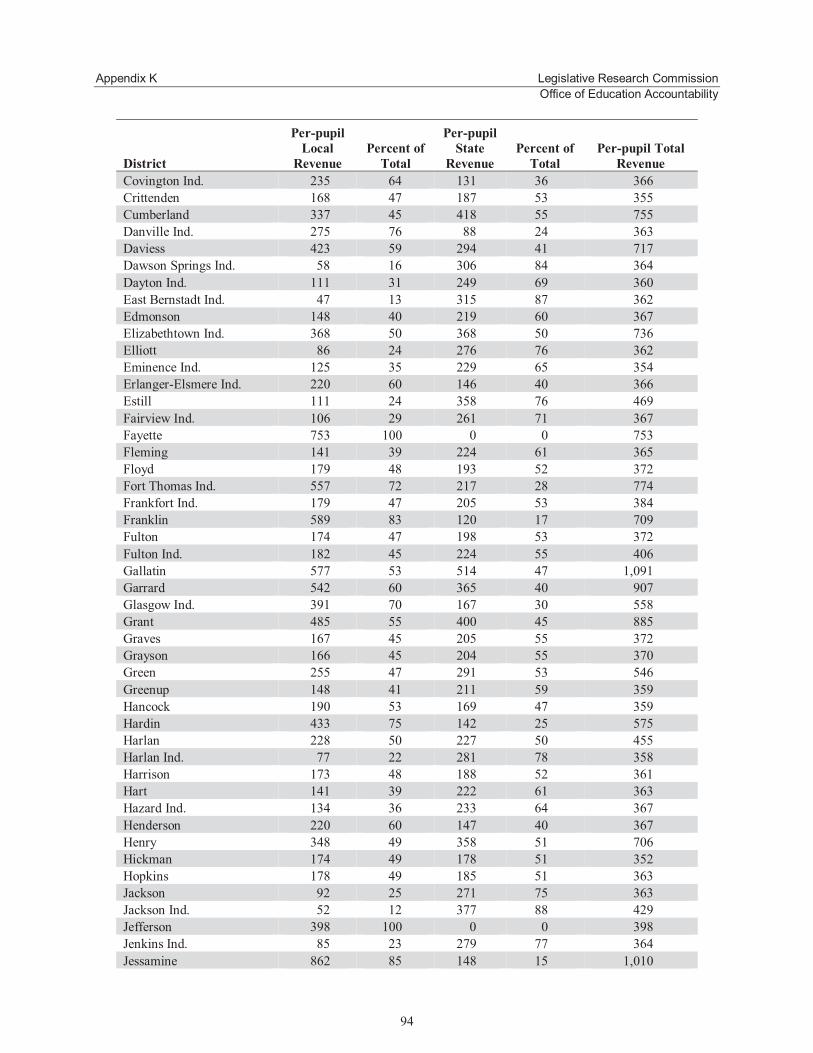
Appendix K Legislative Research Commission Office of Education Accountability
94
District
Per-pupil Local
Revenue Percent of
Total
Per-pupil State
Revenue Percent of
Total Per-pupil Total
Revenue Covington Ind. 235 64 131 36 366 Crittenden 168 47 187 53 355 Cumberland 337 45 418 55 755 Danville Ind. 275 76 88 24 363 Daviess 423 59 294 41 717 Dawson Springs Ind. 58 16 306 84 364 Dayton Ind. 111 31 249 69 360 East Bernstadt Ind. 47 13 315 87 362 Edmonson 148 40 219 60 367 Elizabethtown Ind. 368 50 368 50 736 Elliott 86 24 276 76 362 Eminence Ind. 125 35 229 65 354 Erlanger-Elsmere Ind. 220 60 146 40 366 Estill 111 24 358 76 469 Fairview Ind. 106 29 261 71 367 Fayette 753 100 0 0 753 Fleming 141 39 224 61 365 Floyd 179 48 193 52 372 Fort Thomas Ind. 557 72 217 28 774 Frankfort Ind. 179 47 205 53 384 Franklin 589 83 120 17 709 Fulton 174 47 198 53 372 Fulton Ind. 182 45 224 55 406 Gallatin 577 53 514 47 1,091 Garrard 542 60 365 40 907 Glasgow Ind. 391 70 167 30 558 Grant 485 55 400 45 885 Graves 167 45 205 55 372 Grayson 166 45 204 55 370 Green 255 47 291 53 546 Greenup 148 41 211 59 359 Hancock 190 53 169 47 359 Hardin 433 75 142 25 575 Harlan 228 50 227 50 455 Harlan Ind. 77 22 281 78 358 Harrison 173 48 188 52 361 Hart 141 39 222 61 363 Hazard Ind. 134 36 233 64 367 Henderson 220 60 147 40 367 Henry 348 49 358 51 706 Hickman 174 49 178 51 352 Hopkins 178 49 185 51 363 Jackson 92 25 271 75 363 Jackson Ind. 52 12 377 88 429 Jefferson 398 100 0 0 398 Jenkins Ind. 85 23 279 77 364 Jessamine 862 85 148 15 1,010

Legislative Research Commission Appendix K Office of Education Accountability
95
District
Per-pupil Local
Revenue Percent of
Total
Per-pupil State
Revenue Percent of
Total Per-pupil Total
Revenue Johnson 105 30 251 70 356 Kenton 961 93 71 7 1,032 Knott 243 68 116 32 359 Knox 123 34 236 66 359 LaRue 148 41 217 59 365 Laurel 527 59 363 41 890 Lawrence 159 43 210 57 369 Lee 133 37 222 63 355 Leslie 182 50 183 50 365 Letcher 154 43 206 57 360 Lewis 116 32 251 68 367 Lincoln 134 37 230 63 364 Livingston 270 73 97 27 367 Logan 153 42 208 58 361 Ludlow Ind. 152 41 222 59 374 Lyon 451 100 0 0 451 Madison 682 72 268 28 950 Magoffin 102 28 266 72 368 Marion 183 52 172 48 355 Marshall 231 64 129 36 360 Martin 173 48 184 52 357 Mason 250 69 110 31 360 Mayfield Ind. 223 32 479 68 702 McCracken 600 83 125 17 725 McCreary 85 23 282 77 367 McLean 151 43 203 57 354 Meade 429 40 648 60 1,077 Menifee 89 25 270 75 359 Mercer 606 65 320 35 926 Metcalfe 125 33 251 67 376 Middlesboro Ind. 167 45 206 55 373 Monroe 220 31 495 69 715 Montgomery 513 58 366 42 879 Monticello Ind. 48 7 591 93 639 Morgan 110 30 257 70 367 Muhlenberg 154 42 210 58 364 Murray Ind. 701 64 396 36 1,097 Nelson 691 72 267 28 958 Newport Ind. 240 67 120 33 360 Nicholas 255 47 284 53 539 Ohio 137 38 225 62 362 Oldham 1,152 83 237 17 1,389 Owen 614 62 375 38 989 Owensboro Ind. 378 69 173 31 551 Owsley 80 22 285 78 365 Paducah Ind. 402 66 207 34 609 Paintsville Ind. 179 50 180 50 359

Appendix K Legislative Research Commission Office of Education Accountability
96
District
Per-pupil Local
Revenue Percent of
Total
Per-pupil State
Revenue Percent of
Total Per-pupil Total
Revenue Paris Ind. 159 45 192 55 351 Pendleton 450 51 429 49 879 Perry 196 54 164 46 360 Pike 180 50 183 50 363 Pikeville Ind. 234 64 130 36 364 Pineville Ind. 119 24 378 76 497 Powell 112 31 250 69 362 Pulaski 409 73 151 27 560 Raceland-Worthington Ind. 89 25 269 75 358 Robertson 112 30 257 70 369 Rockcastle 92 26 268 74 360 Rowan 362 63 210 37 572 Russell 559 62 341 38 900 Russell Ind. 189 53 168 47 357 Russellville Ind. 295 41 425 59 720 Science Hill Ind. 253 34 501 66 754 Scott 847 85 152 15 999 Shelby 876 84 164 16 1,040 Silver Grove Ind. 237 61 151 39 388 Simpson 223 63 132 37 355 Somerset Ind. 255 71 103 29 358 Southgate Ind. 478 100 0 0 478 Spencer 689 72 262 28 951 Taylor 173 48 185 52 358 Todd 270 37 456 63 726 Trigg 238 65 126 35 364 Trimble 292 60 198 40 490 Union 177 49 184 51 361 Walton-Verona Ind. 528 62 329 38 857 Warren 802 82 181 18 983 Washington 391 64 220 36 611 Wayne 157 43 206 57 363 Webster 157 43 205 57 362 West Point Ind. 146 35 270 65 416 Whitley 67 20 272 80 339 Williamsburg Ind. 119 33 241 67 360 Williamstown Ind. 315 38 512 62 827 Wolfe 105 29 256 71 361 Woodford 633 89 81 11 714 State Average $431 71% $173 29% $604
Source: Staff compilation of data from the Kentucky Department of Education.

Legislative Research Commission Appendix L Office of Education Accountability
97
Appendix L
Per-pupil Food Service Fund Local, State, and Federal Revenues Fiscal Year 2009
District
Per-pupil Local
Revenue Percent of Total
Per-pupil State
Revenue Percent of Total
Per-pupil Federal Revenue
Percent of Total
Per-pupil Total
Revenue Adair $199 34% $6 1% $388 65% $593 Allen 224 38 6 1 354 61 584 Anchorage Ind. 479 90 4 1 49 9 532 Anderson 254 54 6 1 211 45 471 Ashland Ind. 206 35 6 1 382 64 594 Augusta Ind. 125 20 8 1 500 79 633 Ballard 224 38 7 1 366 61 597 Barbourville Ind. 232 40 6 1 337 59 575 Bardstown Ind. 184 30 22 4 403 66 609 Barren 273 39 7 1 423 60 703 Bath 127 21 8 1 460 77 595 Beechwood Ind. 214 77 3 1 62 22 279 Bell 113 15 8 1 616 84 737 Bellevue Ind. 152 29 6 1 360 69 518 Berea Ind. 209 36 6 1 372 63 587 Boone 260 57 5 1 188 42 453 Bourbon 165 32 6 1 341 67 512 Bowling Green Ind. 242 36 7 1 428 63 677 Boyd 206 38 6 1 333 61 545 Boyle 265 51 5 1 249 48 519 Bracken 165 33 6 1 334 66 505 Breathitt 111 15 8 1 610 84 729 Breckinridge 192 29 7 1 461 70 660 Bullitt 223 44 5 1 278 55 506 Burgin Ind. 253 49 6 1 253 49 512 Butler 183 29 50 8 390 63 623 Caldwell 177 34 6 1 339 65 522 Calloway 269 40 7 1 398 59 674 Campbell 252 53 5 1 220 46 477 Campbellsville Ind. 170 23 7 1 550 76 727 Carlisle 206 34 7 1 386 64 599 Carroll 237 35 7 1 430 64 674 Carter 124 23 6 1 412 76 542 Casey 142 23 7 1 470 76 619 Caverna Ind. 157 21 8 1 570 78 735 Christian 144 24 7 1 439 74 590 Clark 254 41 6 1 359 58 619 Clay 128 21 6 1 466 78 600 Clinton 177 24 8 1 561 75 746 Cloverport Ind. 215 27 8 1 565 72 788 Corbin Ind. 221 38 6 1 353 61 580

Appendix L Legislative Research Commission Office of Education Accountability
98
District
Per-pupil Local
Revenue Percent of Total
Per-pupil State
Revenue Percent of Total
Per-pupil Federal Revenue
Percent of Total
Per-pupil Total
Revenue Covington Ind. 71 11 13 2 587 87 671 Crittenden 227 38 6 1 362 61 595 Cumberland 192 31 7 1 413 67 612 Danville Ind. 208 33 7 1 412 66 627 Daviess 248 42 7 1 342 57 597 Dawson Springs Ind. 173 28 7 1 434 71 614 Dayton Ind. 100 15 7 1 567 84 674 East Bernstadt Ind. 165 26 8 1 453 72 626 Edmonson 210 35 7 1 392 64 609 Elizabethtown Ind. 195 36 6 1 344 63 545 Elliott 102 17 7 1 504 82 613 Eminence Ind. 214 38 5 1 342 61 561 Erlanger-Elsmere Ind. 139 29 6 1 330 70 475 Estill 173 32 6 1 367 67 546 Fairview Ind. 172 31 6 1 375 68 553 Fayette 207 42 5 1 281 57 493 Fleming 216 33 7 1 438 66 661 Floyd 182 29 7 1 438 70 627 Fort Thomas Ind. 372 83 4 1 71 16 447 Frankfort Ind. 196 32 6 1 409 67 611 Franklin 220 44 5 1 275 55 500 Fulton 116 17 8 1 547 81 671 Fulton Ind. 115 15 8 1 631 84 754 Gallatin 197 30 7 1 459 69 663 Garrard 201 38 6 1 316 60 523 Glasgow Ind. 263 38 7 1 420 61 690 Grant 223 37 7 1 377 62 607 Graves 272 41 7 1 382 58 661 Grayson 189 33 6 1 372 66 567 Green 180 35 6 1 327 64 513 Greenup 231 38 6 1 364 61 601 Hancock 287 47 6 1 317 52 610 Hardin 218 38 7 1 349 61 574 Harlan 118 19 7 1 489 80 614 Harlan Ind. 167 33 5 1 335 66 507 Harrison 254 41 6 1 354 58 614 Hart 193 31 7 1 425 68 625 Hazard Ind. 254 44 6 1 312 55 572 Henderson 258 41 6 1 368 58 632 Henry 293 42 7 1 396 57 696 Hickman 220 37 6 1 365 62 591 Hopkins 172 37 6 1 289 62 467 Jackson 66 9 9 1 670 90 745 Jackson Ind. 144 20 5 1 554 79 703 Jefferson 145 28 6 1 364 71 515 Jenkins Ind. 95 18 7 1 419 81 521 Jessamine 149 37 5 1 250 62 404

Legislative Research Commission Appendix L Office of Education Accountability
99
District
Per-pupil Local
Revenue Percent of Total
Per-pupil State
Revenue Percent of Total
Per-pupil Federal Revenue
Percent of Total
Per-pupil Total
Revenue Johnson 164 27 34 6 402 67 600 Kenton 224 57 5 1 167 42 396 Knott 222 33 7 1 451 66 680 Knox 83 14 7 1 490 85 580 LaRue 169 32 6 1 359 67 534 Laurel 217 36 6 1 380 63 603 Lawrence 135 24 6 1 410 74 551 Lee 124 18 7 1 561 81 692 Leslie 203 31 7 1 443 68 653 Letcher 175 31 6 1 391 68 572 Lewis 177 28 7 1 454 71 638 Lincoln 153 26 7 1 438 73 598 Livingston 190 36 7 1 336 63 533 Logan 236 41 6 1 336 58 578 Ludlow Ind. 179 37 6 1 294 61 479 Lyon 209 43 5 1 274 56 488 Madison 190 39 5 1 288 60 483 Magoffin 108 16 8 1 557 83 673 Marion 255 40 7 1 381 59 643 Marshall 200 40 6 1 290 58 496 Martin 125 21 7 1 454 77 586 Mason 175 32 6 1 359 66 540 Mayfield Ind. 86 13 8 1 564 86 658 McCracken 256 43 6 1 334 56 596 McCreary 22 3 8 1 617 95 647 McLean 232 37 6 1 396 62 634 Meade 205 39 6 1 314 60 525 Menifee 150 24 7 1 471 75 628 Mercer 230 46 5 1 265 53 500 Metcalfe 196 27 8 1 523 72 727 Middlesboro Ind. 229 30 7 1 538 70 774 Monroe 252 31 8 1 557 68 817 Montgomery 221 37 6 1 365 62 592 Monticello Ind. 88 14 6 1 545 85 639 Morgan 142 23 20 3 446 73 608 Muhlenberg 199 35 6 1 362 64 567 Murray Ind. 311 45 7 1 370 54 688 Nelson 235 47 7 1 258 52 500 Newport Ind. 103 17 101 17 394 66 598 Nicholas 197 31 7 1 423 67 627 Ohio 153 26 7 1 428 73 588 Oldham 232 65 4 1 119 33 355 Owen 190 34 6 1 365 65 561 Owensboro Ind. 148 20 7 1 598 79 753 Owsley 231 23 9 1 763 76 1,003 Paducah Ind. 169 25 7 1 510 74 686 Paintsville Ind. 193 37 4 1 321 62 518

Appendix L Legislative Research Commission Office of Education Accountability
100
District
Per-pupil Local
Revenue Percent of Total
Per-pupil State
Revenue Percent of Total
Per-pupil Federal Revenue
Percent of Total
Per-pupil Total
Revenue Paris Ind. 166 25 7 1 502 74 675 Pendleton 225 39 6 1 349 60 580 Perry 174 28 7 1 442 71 623 Pike 188 33 6 1 367 65 561 Pikeville Ind. 302 60 6 1 199 39 507 Pineville Ind. 74 11 7 1 599 88 680 Powell 159 28 6 1 403 71 568 Pulaski 128 22 7 1 448 77 583 Raceland-Worthington Ind. 217 45 5 1 261 54 483 Robertson 206 32 0 0 430 68 636 Rockcastle 169 29 6 1 409 70 584 Rowan 195 35 0 0 363 65 558 Russell 197 29 7 1 485 70 689 Russell Ind. 235 52 6 1 212 47 453 Russellville Ind. 162 25 7 1 476 74 645 Science Hill Ind. 254 42 7 1 342 57 603 Scott 259 52 5 1 236 47 500 Shelby 213 43 5 1 282 56 500 Silver Grove Ind. 147 20 8 1 593 79 748 Simpson 217 40 6 1 323 59 546 Somerset Ind. 180 33 6 1 359 66 545 Southgate Ind. 153 29 7 1 371 70 531 Spencer 232 48 5 1 250 51 487 Taylor 164 36 6 1 291 63 461 Todd 225 34 7 1 437 65 669 Trigg 185 36 6 1 318 62 509 Trimble 247 42 7 1 328 56 582 Union 243 39 6 1 373 60 622 Walton-Verona Ind. 349 63 6 1 203 36 558 Warren 228 40 6 1 334 59 568 Washington 247 41 7 1 345 58 599 Wayne 119 18 8 1 550 81 677 Webster 237 34 6 1 445 65 688 West Point Ind. 166 25 6 1 500 74 672 Whitley 93 14 7 1 540 84 640 Williamsburg Ind. 220 31 7 1 487 68 714 Williamstown Ind. 257 41 6 1 368 58 631 Wolfe 68 10 8 1 611 89 687 Woodford 289 55 5 1 227 44 521 State Average $194 35% 7 1% $356 64% $557
Note: Percent of total local, state, and federal per-pupil revenue may not add up to 100 percent due to rounding. Source: Staff compilation of data from the Kentucky Department of Education.