Embed Size (px)
Citation preview

School Accountability Report Card School Year 2001-2002
School Information District Information
School Name Piedmont Hills High District Name East Side Union High
Principal Bill Yamaki Superintendent Joe Coto
Street 1377 Piedmont Road Street 830 N. Capitol Ave.
City, State,Zip
San Jose, CA 95132-2497 City, State, Zip San Jose, CA 95133-1316
PhoneNumber
408 347-3800 Phone Number 408 347-5000
FAX Number 408 347-3805 FAX Number 408 347-5045
Web Site ph.campusgrid.net/home Web Site www.esuhsd.org
EmailAddress
[email protected] Email Address [email protected]
CDS Code 43-69427-4335907 SARC Contact Lorraine Guerin
School Description and Mission Statement
School Description
tSeeped in tradition, Piedmont Hills High School challenges students to set high academic and personalstandards and supports them in their pursuit of success. The faculty is strongly committed to providingthe highest quality educational program consistent with the expectation of the community. Many of thestudents enroll in post secondary education. Approximately 42% of the students meet 4-yearcollege/university requirements. 37% attend 4-year universities and 55% attend community colleges.Recent graduates have attended such prestigious colleges as MIT, Harvard, Stanford and all theUniversity of California campuses. The school, located in the northeast foothills of San Jose, is acompact campus on 48 acres of a park-like setting. The school houses over 1,900 students of richlydiverse cultural backgrounds.
The school has an active school site council, a parent booster club, and various special program groups,e.g. band, drama, and athletics. In addition, the African American Parent Coalition, the Latino ParentEducation Network, and the Filipino Parents and Student Association, support specific ethnic groups. Arecent parent survey reflects that the school staff deals effectively with cultural diversity and that theschool is a good place to learn and a pleasant place to be.
Mission

The mission of Piedmont Hills High School is to provide all students with a strong educational program,one that develops academic, vocational, thinking, communication, technical, physical, and cooperativeskills. The staff will encourage respect for diversity, inspire an appreciation for the arts, and fosterresponsibility, self-esteem, healthful living, self-direction, tolerance, fairness, honesty, and respect. Thestaff will encourage each student to achieve his or her potential.
Expected Schoolwide Learning ResultsPiedmont Hills High School students will be independent and creative thinkers who are able to solveacademic and real-life problems. Students will
• Apply basic skills to life experiences• Gather, organize, and analyze information• Recognize options and then make goal-oriented choices• Accept responsibility• Be willing to take risks to explore subject or activity
Piedmont Hills High School students will be proficient readers of all types of literature and text material.Students will
• Read and comprehend at grade level• Increase vocabulary• Use different strategies when approaching different texts• Read for different purposes, including information and entertainment• Recognize main ideas, summarize, draw conclusions, predict, make inferences
Piedmont Hills High School students will be able to keep up with and use the technology that will moldthe 21st century in which they will work. Students will
• Produce finished reports or projects using word processing software, such as Microsoft Word,Photoshop, Illustrator, etc.
• Integrate internet information into their work• Use the Internet wisely• Use technology to gather and organize information• Demonstrate ethnical behavior while using the Internet wisely
Piedmont Hills High School students will be able to meet the standards in the core academic areas oflanguage arts, mathematics, social studies and science. Students will
• Attend class regularly• Succeed in class work by achieving with a C or better• Meet graduation requirements, including the High School Exit Exam• Use alternate resources, such as tutoring and summer school, when needed to meet the standards
Piedmont Hills High School students will be able to express themselves clearly through written and oralexpression. Students will
• Read, write and speak at the appropriate grade level• Listen to others and respond appropriately• Apply writing conventions in their writing across the curriculum• Avoid plagiarism in coursework and published work• Communicate orally and in written form in a variety of situations
Piedmont Hills High School students will be able to locate and use resources indepenently. Students will
• Find and effectively use materials in the library• Evaluate the merits of various sources of information• Locate and evaluate information from the Internet• Use effective note-taking skills

Opportunities for Parental Involvement
Contact PersonName
Bill Yamaki Contact Person PhoneNumber
408.347.3810
The school has an active school site council, a parent booster club, and various special program groups,e.g. band, drama, and athletics. In addition, the African American Parent Coalition, the Latino ParentEducation Network, and the Filipino Parent and Student Association support specific ethnic groups. Arecent parent survey reflects that the school staff deals effectively with cultural diversity and that theschool is a good place to learn and a pleasant place to be.
I. Demographic Information
Student Enrollment, by Grade Level
Grade Level Enrollment
Grade 9 486
Grade 10 511
Grade 11 472
Grade 12 434
Ungraded Secondary 18
Total 1921
Student Enrollment, by Ethnic GroupThe percentage of students is the number of students in a racial/ethnic category divided by the school'smost recent California Basic Educational Data System (CBEDS) total enrollment.
Racial/Ethnic Category Number
ofStudents
Percentageof
Students
Racial/EthnicCategory
Numberof
Students
Percentageof
Students
African-American 103 5.4 Hispanic or Latino 373 19.4
American Indian or Alaska Native 11 0.6 Pacific Islander 6 0.3
Asian-American 820 42.7 White (Not Hispanic) 415 21.6
Filipino-American 193 10.0 Other 0 0.0
• II. School Safety and Climate for Learning
School Safety Plan

Date of LastReview/Update
Spring 2001 Date Last Discussed withStaff
Spring 2001
With the implementation of SB 187 all schools in the ESUHSD are required to write and annually reviewthe school’s comprehensive safety plan. In addition to the process for the annual review of safety plans,SB 187 identifies the essential elements of a comprehensive school safety plan. These elements includea site-based assessment of the current status of school crime and appropriate strategies and programsthat will provide or maintain a high level of school safety. Piedmont Hills’ Comprehensive safety plan hasbeen approved by the ESUHSD Board of Education. Piedmont Hill’s tries to provide safe clean andcomfortable learning environments for its students
School Programs and Practices that Promote a Positive Learning Environment
Piedmont Hills has a written discipline plan that was developed in accordance with district policy. Thisplan is well publicized and is available to students, parents, staff, and community members.
Special programs have been developed by the school to encourage appropriate student behavior. Theseinclude after-school detention, Saturday School, the Pirate Assistance Program, the attendance recoveryprogram and community service done at school. The school continues to use the Multi-Service Team(MST) approach to helping students. Through the MST a number of community agencies and servicesare on campus to assist students and parents.
Suspensions and ExpulsionsThe number of suspensions and expulsions is the total number of incidents that result in a suspension orexpulsion. The rate of suspensions and expulsions is the total number of incidents divided by the school'sCalifornia Basic Educational Data System (CBEDS) total enrollment for the given year. In unified schooldistricts, a comparison between a particular type of school (elementary, middle, high) and the districtaverage may be misleading. Schools have the option of comparing their data with the district-wideaverage for the same type of school.
School District
2000 2001 2002 2000 2001 2002
Suspensions (number) 170 180 176 2549 2101 2109
Suspensions (rate) 9% 9% 9.2% 10% 9% 9%
Expulsions (number) 3 2 2 74 31 31
Expulsions (rate) .2% .1% .1% .3% .1% .1%
School Facilities
The school, located in the northeast foothills of San Jose, is a compact campus on 48 acres of a park likesetting. The school houses more than 1,900 students of richly diverse cultural backgrounds. The schoolis undergoing modernization. A new theater has been built and one-third of the classrooms have beenmodernized. Another phase of the modernization is scheduled for the 2001-02 school year. Portables will

continue to be on the campus to house students while classrooms are reconstructed.
III. Academic Data
Standardized Testing and Reporting (STAR)Through the California Standardized Testing and Reporting (STAR) Program, students in grades 2-11 aretested annually in various subject areas. Currently, the STAR program includes California StandardsTests (CST) in English Language Arts and Mathematics in grades 2-11, and Science and History-SocialScience in grades 9-11; and the Stanford Achievement Test, Ninth Edition (Stanford 9), which testsReading, Language, Mathematics (grades 2-11), Spelling (grades 2-8), and Science and History-SocialScience (grades 9-11 only). Note: To protect student privacy, scores are not shown when the number ofstudents tested is 10 or less.
California Standards Tests (CST)The California Standards Tests show how well students are doing in relation to the state contentstandards. Student scores are reported as performance levels. The five performance levels are Advanced(exceeds state standards), Proficient (meets standards), Basic (approaching standards), Below Basic(below standards), and Far Below Basic (well below standards). Students scoring at the Proficient orAdvanced level have met state standards in that content area. Note: To protect student privacy, scoresare not shown when the number of students tested is 10 or less.
CST - English Language ArtsPercentage of students achieving at the Proficient or Advanced level (meeting or exceeding the statestandard)
School District State GradeLevel
2000 2001 2002 2000 2001 2002 2000 2001 2002
9 --- 43 54 --- 27 32 --- 28 33
10 --- 39 53 --- 27 30 --- 31 33
11 --- 32 41 --- 24 28 --- 29 31
CST - MathematicsPercentage of students achieving at the Proficient or Advanced level (meeting or exceeding the statestandard)
School District State GradeLevel
2000 2001 2002 2000 2001 2002 2000 2001 2002
9 --- --- 35 --- --- 17 --- --- 21
10 --- --- 32 --- --- 15 --- --- 21
11 --- --- 25 --- --- 13 --- --- 18

CST - SciencePercentage of students achieving at the Proficient or Advanced level (meeting or exceeding the statestandard)
School District State GradeLevel
2000 2001 2002 2000 2001 2002 2000 2001 2002
9 --- --- 11 --- --- 7 --- --- 22
10 --- --- 32 --- --- 22 --- --- 26
11 --- --- 21 --- --- 18 --- --- 25
CST - History/Social SciencePercentage of students achieving at the Proficient or Advanced level (meeting or exceeding the statestandard)
School District State GradeLevel
2000 2001 2002 2000 2001 2002 2000 2001 2002
9 --- --- 37 --- --- 22 --- --- 24
10 --- --- 33 --- --- 19 --- --- 24
11 --- --- 40 --- --- 23 --- --- 31
CST - Subgroups - English Language ArtsPercentage of students achieving at the Proficient or Advanced level (meeting or exceeding the statestandard)
Grade
Level Male
Female
EnglishLearners
Not-EnglishLearners
SocioeconomicallyDisadvantaged
NotSocioeconomically
Disadvantaged
MigrantEducationServices
9 52 58 14 62 54
10 43 63 10 25 55
11 38 45 4 21 45
CST - Subgroups - MathematicsPercentage of students achieving at the Proficient or Advanced level (meeting or exceeding the statestandard)

Grade
Level Male
Female
EnglishLearners
Not-EnglishLearners
SocioeconomicallyDisadvantaged
NotSocioeconomically
Disadvantaged
MigrantEducationServices
9 36 38 34 38 36
10 34 31 39 33 33
11 29 21 33 24
CST - Subgroups - SciencePercentage of students achieving at the Proficient or Advanced level (meeting or exceeding the statestandard)
Grade
Level Male
Female
EnglishLearners
Not-EnglishLearners
SocioeconomicallyDisadvantaged
NotSocioeconomically
Disadvantaged
MigrantEducationServices
9 39 37 9 43 38
10 37 30 3 20 35
11 45 34 7 27 43
CST - Subgroups - History/Social SciencePercentage of students achieving at the Proficient or Advanced level (meeting or exceeding the statestandard)
Grade
Level Male
Female
EnglishLearners
Not-EnglishLearners
SocioeconomicallyDisadvantaged
NotSocioeconomically
Disadvantaged
MigrantEducationServices
9 39 37 9 43 38
10 37 30 3 20 35
11 45 34 7 27 43
CST - Racial/Ethnic Groups - English Language ArtsPercentage of students achieving at the Proficient or Advanced level (meeting or exceeding the statestandard)
GradeLevel
African-American
AmericanIndian orAlaskaNative
Asian-American
Filipino-American
Hispanicor Latino
PacificIslander
White(not
Hispanic) Other
9 58 64 42 31 62

10 17 65 57 34 51
11 27 50 33 28 44
CST - Racial/Ethnic Groups - MathematicsPercentage of students achieving at the Proficient or Advanced level (meeting or exceeding the statestandard)
GradeLevel
African-American
AmericanIndian orAlaskaNative
Asian-American
Filipino-American
Hispanicor Latino
PacificIslander
White(not
Hispanic) Other
9 13 54 26 11 30
10 49 38 4 21
11 38 7 9 16
CST - Racial/Ethnic Groups - SciencePercentage of students achieving at the Proficient or Advanced level (meeting or exceeding the statestandard)
GradeLevel
African-American
AmericanIndian orAlaskaNative
Asian-American
Filipino-American
Hispanicor Latino
PacificIslander
White(not
Hispanic) Other
9 20 11
10 47 59 6 26
11 27 8 7 28
CST - Racial/Ethnic Groups - History/Social SciencePercentage of students achieving at the Proficient or Advanced level (meeting or exceeding the statestandard)
GradeLevel
African-American
AmericanIndian orAlaskaNative
Asian-American
Filipino-American
Hispanicor Latino
PacificIslander
White(not
Hispanic) Other
9 22 46 34 20 41
10 13 47 33 12 32
11 17 49 32 28 40

Stanford 9 (SAT 9)Reading and mathematics results from the Stanford 9 test are reported for each grade level as thepercentage of tested students scoring at or above the 50th percentile (the national average). Schoolresults are compared to results at the district and state levels. Note: To protect student privacy, scoresare not shown when the number of students tested is 10 or less.
SAT 9 - ReadingPercentage of students scoring at or above the 50th percentile
School District State GradeLevel
2000 2001 2002 2000 2001 2002 2000 2001 2002
9 43 50 47 30 32 33 35 35 34
10 41 40 47 26 28 31 34 34 34
11 46 40 46 29 29 30 36 37 37
SAT 9 - MathematicsPercentage of students scoring at or above the 50th percentile
School District State GradeLevel
2000 2001 2002 2000 2001 2002 2000 2001 2002
9 75 71 81 57 56 60 51 51 52
10 57 58 71 46 47 50 46 45 46
11 68 56 66 48 47 48 47 46 47
SAT 9 - Subgroups - ReadingPercentage of students scoring at or above the 50th percentile
Grade
Level Male
Female
EnglishLearner
s
Not-EnglishLearners
SocioeconomicallyDisadvantaged
NotSocioeconomicall
yDisadvantaged
MigrantEducatio
nServices
9 46 49 12 54 47
10 43 52 0 50 28 49
11 44 47 7 49 24 49
SAT 9 - Subgroups - Mathematics

Percentage of students scoring at or above the 50th percentile
Grade
Level Male
Female
EnglishLearner
s
Not-EnglishLearners
SocioeconomicallyDisadvantaged
NotSocioeconomicall
yDisadvantaged
MigrantEducatio
nServices
9 81 81 77 81 81
10 72 69 68 71 68 71
11 71 61 46 67 58 67
SAT 9 - Racial/Ethnic Groups - ReadingPercentage of students scoring at or above the 50th percentile
GradeLevel
African-American
AmericanIndian orAlaskaNative
Asian-American
Filipino-American
Hispanicor Latino
PacificIslander
White(not
Hispanic) Other
9 39 56 26 28 58
10 13 57 47 26 53
11 32 53 34 33 51
SAT 9 - Racial/Ethnic Groups - MathematicsPercentage of students scoring at or above the 50th percentile
GradeLevel
African-American
AmericanIndian orAlaskaNative
Asian-American
Filipino-American
Hispanicor Latino
PacificIslander
White(not
Hispanic) Other
9 69 94 81 60 73
10 30 85 78 47 67
11 50 80 53 45 64
California Fitness TestPercentage of students meeting fitness standards (scoring in the healthy fitness zone on all six fitnessstandards)Note: To protect student privacy, scores are not shown when the number of students tested is 10 or less.
School District State GradeLevel
Total Female Male Total Female Male Total Female Male

9 0.7 0.8 0.0 23.4 20.2 27.0 22.7 21.0 24.6
Academic Performance Index (API)
The Academic Performance Index (API) is a score on a scale of 200 to 1000 that annually measuresthe academic performance and progress of individual schools in California. On an interim basis, the statehas set 800 as the API score that schools should strive to meet.Growth Targets: The annual growth target for a school is 5% of the distance between its base API and800. The growth target for a school at or above 800 is to remain at or above 800. Actual growth is thenumber of API points a school gained between its base and growth years. Schools that reach their annualtargets are eligible for monetary awards. Schools that do not meet their targets and have a statewide APIrank of one to five are eligible to participate in the Immediate Intervention/Underperforming SchoolsProgram (II/USP), which provides resources to schools to improve their academic achievement.Subgroup APIs and Targets: In addition to a whole-school API, schools also receive API scores foreach numerically significant racial/ethnic and socioeconomically disadvantaged subgroup in the school.Growth targets, equal to 80 percent of the school's target, are also set for each of the subgroups. Eachsubgroup must also meet its target for the school to be identified as having met its target.Percentage Tested: In order to be eligible for awards, elementary and middle schools must have at least95% of their students in grades 2-8 tested in STAR. High schools must have at least 90% of theirstudents in grades 9-11 tested.Statewide Rank: Schools receiving an API score are ranked in ten categories of equal size (deciles) fromone (lowest) to ten (highest), according to type of school (elementary, middle, or high school).Similar Schools Rank: This is a comparison of each school with 100 other schools with similardemographic characteristics. Each set of 100 schools is ranked by API score from one (lowest) to ten(highest) to indicate how well the school performed compared to schools most like it.
API criteria are subject to change as new legislation is enacted into law. More detailed and currentinformation about the API and public school accountability in California can be found at the CaliforniaDepartment of Education Web site or by speaking with the school principal
School Wide API
API Base Data API Growth Data
1999 2000 2001 From1999
to 2000
From2000
to 2001
From2001
to 2002
Percentage Tested 100 97 99 Percentage Tested 97 99 99
API Base Score 723 710 692 API Growth Score 702 697 733
Growth Target 4 5 5 Actual Growth -21 -13 41
Statewide Rank 9 8 7
Similar Schools Rank 7 3 2

API Subgroups - Racial/Ethnic Groups
API Base Data API Growth Data
1999 2000 2001 From1999
to 2000
From2000
to 2001
From2001
to 2002
African-American African-American
API Base Score API Growth Score
Growth Target Actual Growth
American Indian or Alaska Native American Indian or Alaska Native
API Base Score API Growth Score
Growth Target Actual Growth
Asian-American Asian-American
API Base Score 788 774 760 API Growth Score 770 765 800
Growth Target 3 4 4 Actual Growth -18 -9 40
Filipino-American Filipino-American
API Base Score 663 663 API Growth Score 664 715
Growth Target 4 4 Actual Growth 1 52
Hispanic or Latino Hispanic or Latino
API Base Score 576 587 595 API Growth Score 558 605 611
Growth Target 3 4 4 Actual Growth -18 18 16
Pacific Islander Pacific Islander
API Base Score API Growth Score
Growth Target Actual Growth
White (Not Hispanic) White (Not Hispanic)
API Base Score 759 748 697 API Growth Score 746 703 739
Growth Target 3 4 4 Actual Growth -13 -45 42

API Subgroups - Socioeconomically Disadvantaged
API Base Data API Growth Data
1999 2000 2001 From1999
to 2000
From2000
to 2001
From2001
to 2002
API Base Score 633 612 API Growth Score 613 630
Growth Target 4 4 Actual Growth -20 18
API-Based Awards and Intervention ProgramsCalifornia program data are based on API growth data from the previous academic year.***The II/USP Program was not funded for the year 2002.
California Programs Federal Programs
2000 2001 2002 2000 2001 2002
Eligible for Governor's Performance Award
NO NO N/R Recognition for Achievement (Title 1)
Eligible for II/USP NO NO *** Identified for Program Improvement (Title 1)
Applied for II/USP $ NO NO *** Exited Title 1 Program Improvement
Received II/USP $ NO NO ***
IV. School Completion (Secondary Schools)
California High School Exit Exam (CAHSEE)Beginning with the graduating class of 2004, students in California public schools will have to pass theCalifornia High School Exit Exam to receive a high school diploma. The School Accountability ReportCard for that year will report the percentage of students completing grade 12 who successfully completethe California High School Exit Exam.
These data are not required to be reported until 2004 when they can be reported for the entire potentialgraduating class. When implemented, the data shall be disaggregated by special education status,English language learners, socioeconomic status, gender and ethnic group.
Dropout Rate and Graduation RateData reported regarding progress over the most recent three-year period toward reducing dropout ratesinclude: grade 9-12 enrollment, the number of dropouts, and the one-year dropout rate listed in the
California Basic Educational Data System (CBEDS). The formula for the one-year dropout rate is (Grades9-12 Dropouts/Grades 9-12 Enrollment) multiplied by 100. Graduation rate data will be reported after theCalifornia State Board of Education approves a graduation rate formula.
School District State
1999 2000 2001 1999 2000 2001 1999 2000 2001
Enrollment (9-12) 1927 1955 1948 24259 24577 24282 165903
0 170349
2 173557
6
Number ofDropouts
25 9 9 1098 840 601 46470 47282 47899
Dropout Rate 1.3 0.5 0.5 4.5 3.4 2.5 2.8 2.8 2.8
V. Class Size
Average Teaching Load and Teaching Load DistributionData reported are the average class size and the number of classrooms for each range of students, bysubject area, as reported by CBEDS.
2000 2001 2002 Subject
Avg. 1-22 23-32 33+ Avg. 1-22 23-32 33+ Avg. 1-22 23-32 33+
English 24.70 36 44 1 24.73 36 46 0 24.67 28 42 3
Mathematics 25.94 21 36 5 26.30 19 36 5 27.36 12 35 3
Science 29.60 3 49 8 27.61 1 60 0 28.04 2 50 1
Social Science 29.92 4 40 8 29.92 1 47 4 28.79 2 21 6
VI. Teacher and Staff Information
Teacher Credential InformationPart-time teachers are counted as '1'. If a teacher works at two schools, he/she is only counted at oneschool. Data are not available for teachers with a full credential and teaching outside his/her subject area.
2000 2001 2002
Total Number of Teachers
92 91 92
Full Credential
(full credential and teaching in subject area) 81 75 74

Teaching Outside Subject Area
(full credential but teaching outside subject area)
Emergency Credential
(includes District Internship, University Internship, Pre-Interns and EmergencyPermits)
13 16 18
Teachers with Waivers
(does not have credential and does not qualify for an Emergency Permit) 1 1
Teacher Evaluations
All teachers and staff are regularly evaluated. Teachers are observed and given assistance byadministrators and peer coaches (colleagues trained in improving the delivery of instruction).
The Principal and Associate Principals are required to provide formal written evaluations for permanentteachers, counselors and student advisors every other year. Temporary and probationary teachers areevaluated annually.
The Principal also evaluates the performance of the Associate Principals and the Director of Activities.The Principal, in turn, is evaluated by the Superintendent.
Teachers participate in staff development programs offered by the district and Piedmont Hills HighSchool. In addition, many take advantage of local college and university classes, and workshops offeredby the Santa Clara County Office of Education.
District Subject Area Coordinators (SAC) and resource teachers support teacher improvement andcurriculum development.
Substitute Teachers
The East Side Union High School District has developed a large pool of qualified substitute teachers.When teachers are absent for illness or personal emergencies or need to participate in specialprofessional training activities, substitute teachers are sent to cover classes.
However, to maintain the quality of the instructional program, every effort is made to minimize teacherabsences.
Counselors and Other Support StaffData reported are in units of full-time equivalents (FTE). One FTE is defined as a staff person who is working 100%
full time. Two staff persons working 50% of full time also equals one FTE.
Title FTE
Counselor 2
Librarian 1

Psychologist 1
Social Worker
Nurse **
Speech/Language/Hearing Specialist
Resource Specialist (non-teaching)
Other
** There are two nurses in the district who serve all schools.
VII. Curriculum and Instruction
School Instruction and Leadership
The staff at Piedmont Hills High School is very knowledgeable, talented and experienced. The staff isextremely well qualified and stable as in past years. Over 42% of the staff have advanced degrees.Piedmont Hills' teachers have an average of 21 years of teaching experience and 16 years at PiedmontHills.
The school leaders and staff have high expectations of all students. Excellence in education isemphasized and academic achievements are recognized. The high quality of instruction and leadershipare reflected in the academic success of the students.
Most Piedmont Hills High School students have a six-period day. Seventy-five percent of our coursesmeet UC/CSU requirements and this number may increase under district direction in the next few years.The vocational classes in the business department and the Auto-CAD classes in Industrial Arts includestate-of-the-art equipment and instruction, appealing to a diverse group of students. The businessmagnet includes two paths; one in applications which prepares students for administrative support work,and the other in entrepreneurship, preparing students to manage and work in their own or a smallbusiness.
In addition to the appeal of the business magnet program that draws a large number of students to ourschool, Piedmont Hills is addressing technology of the 21st century through a Digital High school grant.We are currently in our first year of the three-year program and the staff receives training during staffdevelopment time and after-school sessions. In addition to a program coordinator and two technicians,three mentors have been appointed to coach teachers on the integration of technology into classroominstruction, and teachers will develop integrated lessons during the second semester of this year.
Piedmont Hills has nine Advanced Placement classes in addition to sections of honors or advancedclasses in biology, English, math, and chemistry. Staff and students believe the AP and honors coursesare for truly exceptional students; students who transfer in from other schools often require schedulechanges because our AP courses are much more difficult than they experienced in their previousschools. Since even the general level courses are focused on college preparation, the majority of classesare rigorous. Returning graduates support this with their experiences of being prepared for collegecourses.
Students are encouraged to strive for excellence not only in the curricular program but also in the co-curricular program. In addition to its academic tradition, Piedmont Hills has a long history of student

involvement in co-curricular activities. Our best estimates are that approximately 75% of the student bodyis engaged in one or more of 25 clubs and athletics. The Performing Arts department includesapproximately 20% of the students body. Piedmont Hills also has unusual events, such as Pirate MovieNights, a Lip Sync contest, Jell-O pudding wrestling, a talent show, FANTASTICS, and the InternationalFair. All of these events raise money to help the school discretionary funding and give students theopportunity to participate in good, clean fun.
When students need extra support in order to achieve, they have access to the counselors and to anumber of people involved on the Multiple-Services Team (MST). This year we have paired students whohave specific needs with community counseling groups. We have also had students participate inCommunity Partners for Youth and Camp Anytown to help motivate and focus students on responsiblebehavior and goals. The student leadership class has also begun to explore ways to address issues thatinvolve student life outside of the classroom by doing surveys and planning some activities. Link Crewhas been a successful support group of peer mentors for incoming freshmen for three years now, thoughrecent cuts may mean the end of the program. We also have a limited Peer Resources program thattrains students to participate in conflict resolution, but funding issues may end that program as well.Formal academic support through tutoring is available to students in addition to direct help from theteacher. The City of San Jose provides funds for a homework center that has recently increasedavailability from two days a week to four. CAL-SOAP provides tutoring after school in the career center.The Math Mastery program enables students who have not met standards to earn credits in IntegratedMath 1 after school. Remediation in literacy is provided through a special class after school during thesecond semester. The MESA (Math, Engineering and Science Achievement) program provides bothtutoring and motivation for students from ethnic groups who are under-represented in then colleges.
Piedmont Hills has one of the lowest dropout rates in the East Side Union High School District. Inaddition, Piedmont Hills has one of the highest attendance rates in the District. This is an indication of thehigh quality of instruction and leadership. A variety of programs exists to help students with specialneeds, and the staff implements various instructional strategies to help maximize the students’ learning.
The school leaders and staff continue to grow in the profession to keep abreast of the latest trends ineducation. Several members of the staff joined the California School Leadership Academy.
Professional Development
The major areas of focus this year and for the next several years will be shifting from services andprograms to the learning environment: what is happening in the classrooms, how we can improvelearning, and how to evaluate student learning and achievement. Specifically, professional developmenthas been centered around literacy, standards and technology. In eighteen hours of professionaldevelopment throughout, as part of our Digital High School Grant, teachers were trained to incorporateExcel, spreadsheets and PowerPoint into their classroom lessons. Teachers also learned how toincorporate literacy strategies across the curriculum. Moreover, teachers aligned lessons to StateStandards. The staff at Piedmont Hills High School is strongly committed to a broad staff developmentprogram which enriches the learning experiences of the students. The school's new task is a difficult andlengthy one, but the results should lead to powerful learning for all of the students. It is to this end thatour staff development and school-based coordinated plan have been driven this year and will continue tobe driven for the next several years. When students become powerful learners and teachers becomementors, the school will have achieved a major milestone.
The School Based Coordinated Program (SBCP) planning process, particularly the SB 1882 staffdevelopment resources, allow the school to continually review and improve upon its instructionalstrategies; improve upon instructional programs; and make modifications on the curriculum.
Quality and Currency of Textbooks and Other Instructional Materials

All students are provided with textbooks for courses that require them. On the average, a new textbookcosts between $55.00 and $60.00. Students who take five required courses may have as many as 5texts with a total value in excess of $275.00.
New textbooks were adopted by the Board of Trustees for courses in ELD, Health and Safety Education,Foreign Language, English, and Social Science. These textbooks are being phased in to replaceoutdated textbooks.
One hundred fifty computers are available through the Business Department, and eighteen computersare available in the math lab.
Textbook losses continue to be a serious district problem that students, parents and teachersmust address every year
Instructional MinutesThe California Education Code establishes the required number of instructional minutes per year for eachgrade. Data reported compares the number of instructional minutes offered at the school level to the staterequirement for each grade.
Instructional Minutes GradeLevel
Offered State Requirement
9 65,423 64,800
10 65,423 64,800
11 65,423 64,800
12 65,423 64,800
Total Number of Minimum Days
VIII. Postsecondary Preparation (Secondary Schools)
Advanced Placement/International Baccalaureate Courses OfferedThe Advanced Placement (AP) and International Baccalaureate (IB) programs give students anopportunity to take college-level courses and exams while still in high school. The table below shows thenumber of classes offered and the enrollment in various AP and IB classes. The data for Fine andPerforming Arts includes AP Art and AP Music, and the data for Social Science include IB Humanities.
Subject Number of Courses Number of Classes Enrollment
Fine and Performing Arts

Computer Science
English
Foreign Language 2 2 41
Mathematics 2 4 102
Science 1 2 52
Social Science 1 2 52
Pupils Enrolled in Courses Required for University of California (UC) andCalifornia State University (CSU) Admission (Grades 9-12)The percentage of pupils enrolled in courses required for UC and/or CSU admission is calculated bydividing the total number of pupils in courses required for UC and/or UC admission (duplicated count) bythe total number of pupils in all courses (also a duplicated count) for the most recent year.
Number of PupilsEnrolled in all Courses
Number of Pupils EnrolledIn Courses Required
For UC and/or CSU Admission
Percentage of Pupils EnrolledIn Courses Required
For UC and/or CSU Admission
9087 6413 70.6
Graduates Who Have Passed Courses Required for University of California (UC)and California State University (CSU) AdmissionThe percentage of graduates is the number of graduates who have passed course requirements for UCand/or CSU admission divided by the school's California Basic Educational Data System (CBEDS) totalgraduates for the most recent year.
Number ofGraduates
Number of GraduatesWho Have Passed Course
RequirementsFor UC and/or CSU Admission
Percentage of GraduatesWho Have Passed Course
RequirementsFor UC and/or CSU Admission
425 226 53.2
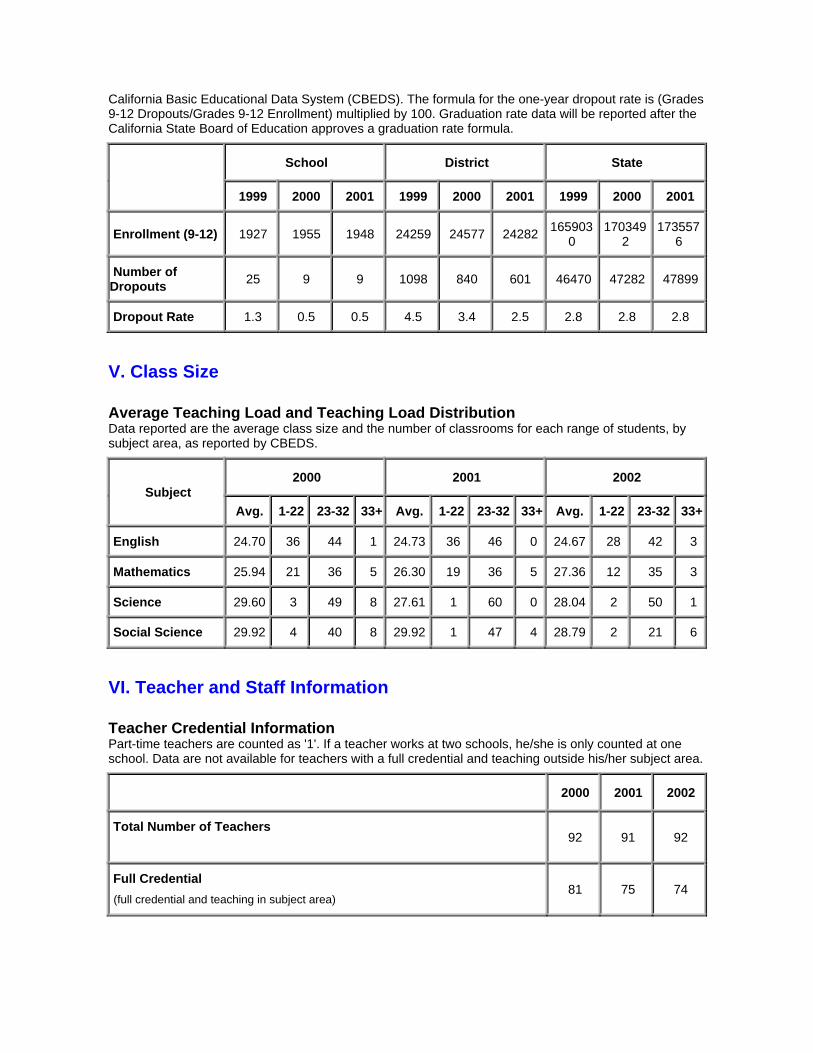
SAT I Reasoning TestStudents may voluntarily take the SAT test for college entrance. The test may or may not be available tostudents at a given school. Students may take the test more than once, but only the highest score isreported at the year of graduation.
School District State
2000 2001 2002 2000 2001 2002 2000 2001 2002
Grade 12 Enrollment 473 458 434 5632 5693 5590 347813 357789 365907
Percentage of Grade 12 Enrollment Taking Test
62 61 56 38 40 40 36 37 37
Average Verbal Score 491 495 481 459 462 453 492 492 490
Average Math Score 536 544 527 502 500 494 517 516 516
College Admission Test Preparation Course Program
Piedmont Hills has two college test prep programs. For the past 15 years, Piedmont has had anarrangement with Evergreen Community College. An Evergreen instructor teaches an SAT prep class oncampus. Students earn college credit as they raise their SAT scores. In addition to the Evergreenprogram, this year is Piedmont’s first year of association with the Kapplan SAT prep program. 125Piedmont juniors meet weekly to use the Kapplan—developed learning materials. Some students areenrolled in both programs.
Degree to Which Students are Prepared to Enter Workforce
In addition to providing students with a curriculum that prepares students for college entrance, studentsmay simultaneously take courses that provide them a school-to-career focus in business, advancedcomputer skills, computer aided drafting and over 30 trades and technical fields.
IX. Fiscal and Expenditure Data
Average Salaries (Fiscal Year 2000-2001) (Note: 2001-02 data was not available at this time.)Statewide data categories used for comparison are determined by type (Elementary, High, and Unified)and enrollment, as defined in www.cde.ca.gov. The statewide average for principals is aggregated bydistrict. There is no statewide average calculated for Common Administration Districts.
Category District Amount State AverageFor Districts
In Same Category
Beginning Teacher Salary 38833 35124
Mid-Range Teacher Salary 62560 57212
Highest Teacher Salary 77200 71349
Average Principal Salary (High) 102401 99782
Superintendent Salary 199132 138750
Percentage of Budget for Teacher Salaries 39.01 38.23
Percentage of Budget for Administrative Salaries 5.33 5.12
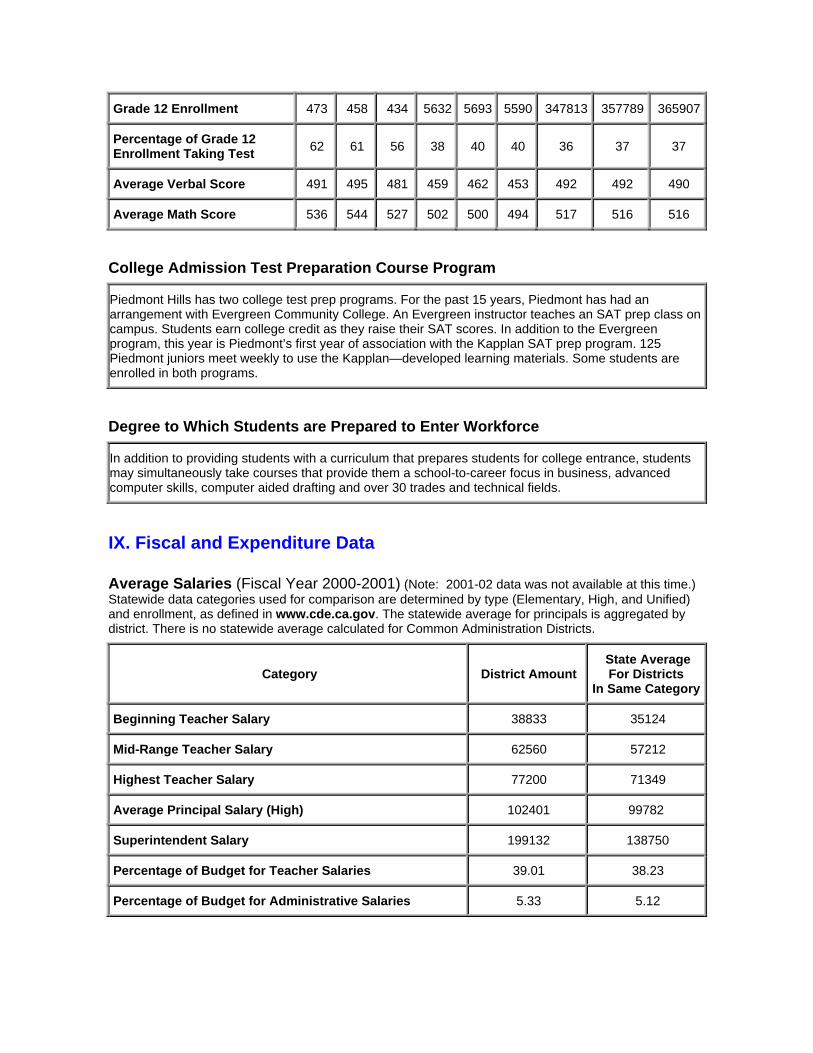
Expenditures (Fiscal Year 2000-2001) (Note: 2001-02 data was not available at this time.)
District District State AverageFor Districts
In Same Category
State AverageAll Districts
Total Dollars Dollars per Student
(ADA) Dollars per Student
(ADA) Dollars per Student
(ADA)
$173,933,670 $7,385 $6,534 $6,360
Types of Services Funded
In 2001-2002, the East Side Union High School District received $200 million. When costs for directinstruction, transportation, salaries, fringe benefits, food services and facilities maintenance areconsidered, the district expended $8,375 per student. The graphs below illustrate district income andexpenditures.
A variety of integrated instructional programs have been developed within the East Side Union HighSchool District. Through these programs, students can obtain technical training to prepare them to enterthe work force or further their education. Included are Integrated Career Programs (ICP’s); Tech Prep;Work Experience; Central County Occupational Center, which includes Regional Occupational SatellitePrograms; New Ways Workers; Partnership Academies and Job Placement Center.
The following special programs are offered at the school:
• English Language Learners• School Based Coordinated Program (School Site Council)• Business Magnet Program• Gifted and Talented Education• Learning Handicapped• Adult Education• Speech Therapy• Adaptive Physical Education• Special Education (SDC, SDC-Low Functioning, RSP)• Vocational Education• MESA Program (Math/Engineering/Science Achievement)• Evergreen Valley College courses• Upward Bound• INROADS and L.E.A.P.• Tutorial• Student Assistant Program• Independent Study Program (ISP)• Multi-Service Team• Unfinished Journey/San Jose State University• San Jose State University Outreach• CAL-SOAP• Community College Partnership