Embed Size (px)
Citation preview

© 2004 ADS LLC. All Rights Reserved.
1
Scattergraph Principles and Practice A Comparison of Various Applications of the Manning Equation
Kevin L. Enfinger, P.E. and Hal R. Kimbrough ADS Environmental Services 4940 Research Drive Huntsville, Alabama 35805 www.adsenv.com/scattergraph
ABSTRACT The Manning Equation is an empirical formula commonly used to design sewer systems. This equation is also used to describe the performance of existing sewers by evaluating flow monitor data on a scattergraph using a variety of methods, including the Design Method, the Lanfear-Coll Method, and the Stevens-Schutzbach Method. The proper selection and application of these methods have a significant impact on the calculation of sewer capacity and the evaluation of sewer performance based on flow monitor data. Examples of each method are provided from flow monitor locations throughout the United States. Laboratory research by the authors is also provided to further explore the performance of these methods and provide guidelines for their proper application.
KEY WORDS Flow Monitoring, Manning Equation, Scattergraph, Sewer Capacity
Introduction The scattergraph is a graphical tool that provides insight into sewer performance through a simple and intuitive display of flow monitor data. The resulting patterns form characteristic signatures that reveal important information about conditions within a sewer and the impact that these conditions have on sewer capacity.1 The Manning Equation is an important component of the scattergraph and can be applied using a variety of methods. Proper selection and application of these methods have a significant impact on the calculation of sewer capacity and the evaluation of sewer performance based on flow monitor data. Therefore, the purpose of this paper is to provide an overview and comparison of three methods that use the Manning Equation to estimate sewer capacity from flow monitor data and provide guidelines for their proper application.

© 2004 ADS LLC. All Rights Reserved.
2
Manning Equation The Manning Equation is an empirical formula used to design sewer systems. The most common expression of this formula is provided in Equation (1).
2/13/2 SRn
486.1=v (1)
where: v = flow velocity, ft/s
n = roughness coefficient R = hydraulic radius, ft S = slope of the energy gradient Several assumptions are generally made with respect to the Manning Equation: the roughness coefficient is constant, and the slope of the energy gradient equals the slope of the pipe.2 Based on these assumptions, the Manning Equation can be algebraically rearranged such that these parameters are consolidated into a single coefficient, defined as the hydraulic coefficient, and restated as shown in Equation (2). This expression is useful in subsequent discussions.
3/2CR486.1=v (2)
where: v = flow velocity, ft/s C = hydraulic coefficient R = hydraulic radius, ft The relationship between flow depth and velocity described by the Manning Equation is depicted in Figure 1 as a pipe curve ( - - - ) and provides a convenient reference to evaluate flow monitor data.
0.0 1.4
Flow Velocity (v/vD)
Flo
w D
ept
h (d
/D)
0.0
0.2
0.4
0.6
0.8
1.0
0.2 0.4 0.6 0.8 1.0 1.2
Manning Equation
FIGURE 1: Hydraulic Relationship of the Manning Equation

© 2004 ADS LLC. All Rights Reserved.
3
Manning Methods The Manning Equation is also used to describe the performance of existing sewers by evaluating flow monitor data on a scattergraph, as shown in Figure 2. The Manning Equation is used to generate a pipe curve which is then compared to actual flow monitor data ( ). This data may agree or disagree with the Manning Equation, depending on actual conditions at the monitoring location. In either case, important information can be learned about the performance of a sewer and its effect on sewer capacity.3 For example, the flow monitor data shown in Figure 2 indicate that this sewer operates as expected up to a flow depth of about 15 inches. However, as backwater conditions develop, flow conditions become deeper and slower and are revealed on the scattergraph as a departure from the pipe curve, resulting in surcharge and overflow conditions at a much lower capacity than expected.4 Three manual confirmations ( ) are also shown and provide a means to evaluate the accuracy of the flow monitor.
Flo
w D
epth
(in
)
0
30
5
10
15
20
25
Flow Velocity (ft/s)
0 8
70
65
60
55
50
45
40
35
min
max
2 4 6
FIGURE 2: Scattergraph of Flow Depth and Velocity Data
Flow Monitor Data
Manning Equation
The Manning Equation is an important component of the scattergraph and can be applied using three different methods, defined as the Design Method, the Lanfear-Coll Method, and the Stevens-Schutzbach Method. The Design Method uses the Manning Equation to describe a relationship between flow depth and velocity using a specified roughness coefficient and pipe slope. This relationship is then compared with actual flow monitor data. The Lanfear-Coll Method and the Stevens-Schutzbach Method use curve fitting techniques to correlate the Manning Equation directly to such data. Each method may rely on assumptions different from design or as-built conditions. An overview and comparison of these methods are provided in the following sections.

© 2004 ADS LLC. All Rights Reserved.
4
Design Method The Design Method uses the Manning Equation with a specified roughness coefficient and pipe slope. The Manning Equation is applied using this method under the general assumptions shown in Figure 3.
FIGURE 3: General Assumptions of the Design Method
flow monitor
n = constant S = constant
uniform flow
The Design Method incorporates the Manning Equation as expressed in Equation (3) and the hydraulic radius as defined in Equation (4).
3/2DMDMDM RC486.1=v (3)
P
A=RDM (4)
where: vDM = flow velocity, ft/s CDM = hydraulic coefficient RDM = hydraulic radius, ft A = wetted area, ft2 P = wetted perimeter, ft The roughness coefficient and the pipe slope are specified based on design assumptions, as-built documentation, or field observations and are used to calculate the hydraulic coefficient as shown in Equation (5).
2/1DM S
n
1=C (5)
where: CDM = hydraulic coefficient n = roughness coefficient S = pipe slope The Design Method is then used to generate a pipe curve which is compared to actual flow monitor data on a scattergraph. If the data agree with the pipe curve, then this method can be used to estimate the full-pipe capacity of the sewer, assuming the assumptions of this method remain valid at the monitoring location from 0 ≤ d ≤ D. The application of the Design Method is demonstrated in the following example.

© 2004 ADS LLC. All Rights Reserved.
5
EXAMPLE Flow monitor data are obtained from a 30-in sewer, as shown in thescattergraph below. The roughness coefficient (n) and the slope (S) are alsoprovided, based on design documentation.
Use the Design Method to construct a pipe curve on the scattergraph andestimate the full-pipe capacity of this sewer.
0
5
10
20
25
15
Flo
w D
epth
(in
)
0
30
Flow Velocity (ft/s)
max
min
93 6
= 0.013n
= 0.45%S

© 2004 ADS LLC. All Rights Reserved.
6
EXAMPLE
000
096
141
180
219
264
360
0.00
0.54
1.43
2.45
3.48
4.37
4.91
0.00
2.10
3.08
3.93
4.78
5.75
7.85
0.26
0.47
0.63
0.73
0.76
3.09
4.61
5.61
6.20
6.39
00
05
10
15
20
25
30
d A P RDM vDM
in ft2 ft ft ft/s
o
0.63 5.61
= 2cos-1(1 - 2d/D)
A = (D2/8)(- sin
P = D/2
Ad
D
Calculate CDM assuming n = 0.013 and S = 0.45%
CDM = 5.16
Calculate vDM for 0 < d < D
For a circular sewer,5
(a)
(b)
Solution: Calculate the hydraulic coefficient, construct pipe curve, and estimate sewer capacity
These results provide the necessary information to construct a pipe curve on ascattergraph, as shown below.
The full-pipe capacity is calculated using the Continuity Equation, QDM = AvDM. Therefore,QDM = 4.91 ft2 x 5.61 ft/s = 27.5 ft3/s or 17.8 MGD.
The conditions observed within this sewer are effectively described by the ManningEquation using the Design Method.
Calculate QDM for d = D(c)
0.40
0.60
0.73
0.81
0.83
RDM2/3
ft2/3
0.73
0
5
10
20
25
15
Flo
w D
epth
(in
)
0
30
Flow Velocity (ft/s)
max
min
93 6
= 0.013n
= 0.45%S
= 5.16CDM
DM

© 2004 ADS LLC. All Rights Reserved.
7
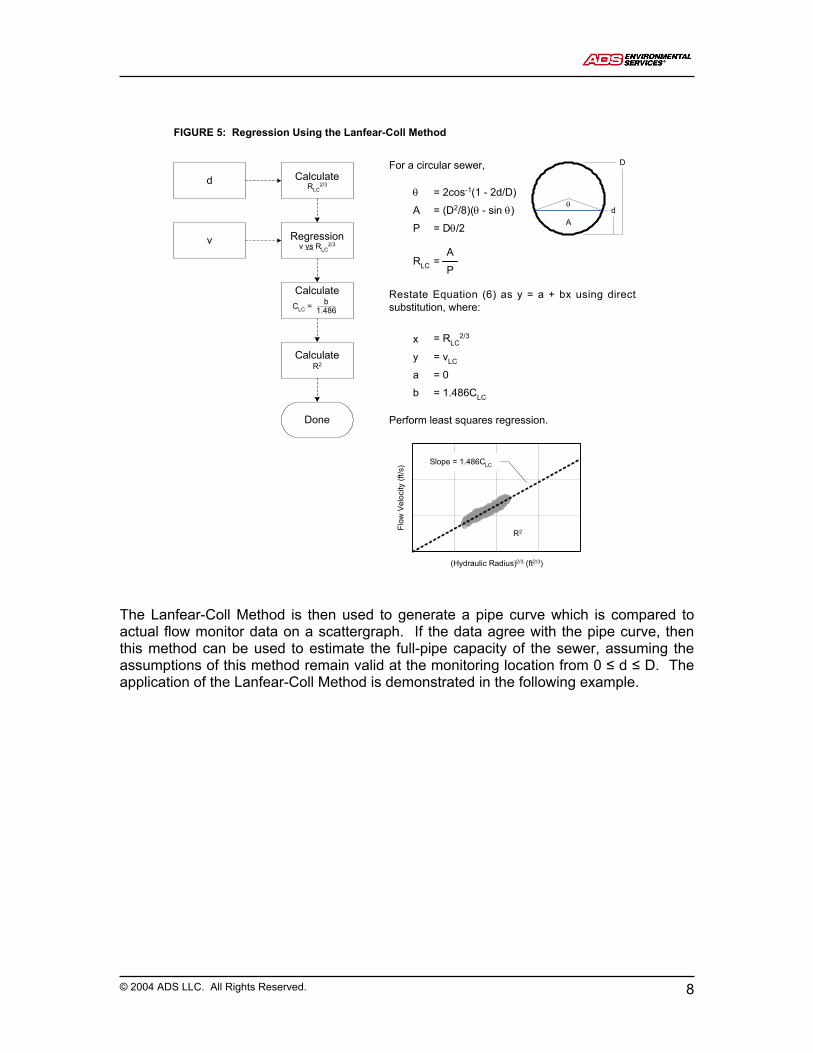
Lanfear-Coll Method The Lanfear-Coll Method uses a curve fitting technique to fit the Manning Equation to flow monitor data.6 The Manning Equation is applied using this method under the general assumptions shown in Figure 4.
FIGURE 4: General Assumptions of the Lanfear-Coll Method
flow monitor
n = constant S = constant
uniform flow
This method is applicable to flow monitor data obtained under uniform flow conditions and incorporates the Manning Equation as expressed in Equation (6) and the hydraulic radius as defined in Equation (7).
3/2LCLCLC RC486.1=v (6)
P
A=RLC (7)
where: vLC = flow velocity, ft/s CLC = hydraulic coefficient RLC = hydraulic radius, ft A = wetted area, ft2 P = wetted perimeter, ft This method provides an implicit solution to the Manning Equation and requires no direct knowledge of the roughness coefficient or the slope of the energy gradient. Flow depth and velocity data are used to calculate the hydraulic coefficient based on a least squares regression of Equation (6), as described in Figure 5. Regression results are characterized using the coefficient of determination.7
© 2004 ADS LLC. All Rights Reserved.
8
FIGURE 5: Regression Using the Lanfear-Coll Method
A
D
d
Restate Equation (6) as y = a + bx using directsubstitution, where:
= RLC2/3
= vLC
= 1.486CLC
= 0
x
y
b
a
= 2cos-1(1 - 2d/D)
A = (D2/8)( - sin )
P = D/2
For a circular sewer,
RLC =A
P
Flo
w V
eloc
ity(f
t/s) Slope = 1.486CLC
(Hydraulic Radius)2/3 (ft2/3)
R2
Perform least squares regression.
CalculateRLC
2/3
Regressionv vs RLC
2/3
CalculateR2
d
v
CalculateCLC =
b1.486
Done
The Lanfear-Coll Method is then used to generate a pipe curve which is compared to actual flow monitor data on a scattergraph. If the data agree with the pipe curve, then this method can be used to estimate the full-pipe capacity of the sewer, assuming the assumptions of this method remain valid at the monitoring location from 0 ≤ d ≤ D. The application of the Lanfear-Coll Method is demonstrated in the following example.

© 2004 ADS LLC. All Rights Reserved.
9
EXAMPLE Flow monitor data are obtained from a 42-in sewer, as shown in the
scattergraph below. Tabular data are provided on the following page.
Use the Lanfear-Coll Method to construct a pipe curve on the scattergraph andestimate the full-pipe capacity of this sewer.
Flo
w D
ept
h (in
)
Flow Velocity (ft/s)
0
min
max
0
42
35
28
21
14
7
153 6 9 12

© 2004 ADS LLC. All Rights Reserved.
10
EXAMPLE
(b)
(a)
Solution: Calculate the hydraulic coefficient
00:00
00:15
00:30
00:45
01:00
01:15
01:30
23:45
11/01
11/01
11/01
11/01
11/01
11/01
11/01
11/30
13.99
14.03
13.71
13.59
13.22
13.16
13.14
15.64
7.18
7.40
7.11
7.15
6.89
7.00
6.82
7.22
2.59
2.58
2.57
3.26
137
136
136
150
2.80
2.82
2.73
2.70
141
141
139
139
4.17
4.16
4.16
4.59
4.31
4.31
4.26
4.24
vavg
01:45
02:00
11/01
11/01
13.01
12.81
6.71
6.71
2.54
2.48
135
134
4.13
4.10
d
in
v
ft/s
time
hh:mm
date
mm/dd
A
ft2o
P
ft
RLC
ft ft2/3
0.62
0.62
0.62
0.65
0.65
0.64
0.64
0.61
0.61
0.73
0.73
0.73
0.75
0.75
0.74
0.74
0.72
0.72
0.71 0.80
7.17
RLC2/3
00:00
00:15
00:30
00:45
01:00
01:15
01:30
23:45
11/01
11/01
11/01
11/01
11/01
11/01
11/01
11/30
0.75
0.75
0.74
0.74
0.73
0.73
0.73
0.80
7.18
7.40
7.11
7.15
6.89
7.00
6.82
7.22
5.39
5.57
5.28
5.29
5.02
5.09
4.95
5.75
6.98
6.99
6.91
6.88
6.78
6.76
6.75
7.40
0.56
0.57
0.55
0.55
0.53
0.53
0.53
0.63
0.038
0.164
0.040
0.075
0.013
0.058
0.004
0.033
0.000
0.048
0.005
0.001
0.084
0.032
0.130
0.002
x xy vLC
ft2/3 ft5/3/s ft/s
y
ft/s
time
hh:mm
date
mm/dd
x2
ft4/3
(vLC - v)2
(ft/s)2
(v - vavg)2
(ft/s)2
SSE SYY xy x2
CLC = xy x2
1.486
/R2 =
SSE
SYY1 -
For this example, a total of 2,880data points were used. Completecalculat ions are avai lable in aspreadsheet that accompanies thistechnical paper.
Based on the regression results, CLC = 6.26 and R2 = 0.84.
01:45
02:00
11/01
11/01
0.72
0.72
6.71
6.71
4.85
4.81
6.72
6.66
0.52
0.51
0.000
0.002
0.221
0.221
Calculate RLC2/3
Calculate CLC and R2 based on a least squares regression

© 2004 ADS LLC. All Rights Reserved.
11
EXAMPLE
The full-pipe capacity is calculated using the Continuity Equation, QLC = AvLC. Therefore,QLC = 9.62 ft2 x 8.50 ft/s = 81.8 ft3/s or 52.9 MGD.
The conditions observed within this sewer are effectively described by the ManningEquation fitted to observed flow depth and velocity data using the Lanfear-Coll Method.
Solution: Construct pipe curve and estimate sewer capacity
(d)
These results provide the necessary information to construct a pipe curve on ascattergraph, as shown below.
(c) Calculate vLC for 0 < d < D
Calculate QLC for d = D
000
096
141
180
219
264
360
00.00
02.94
04.31
05.50
06.69
08.05
11.00
0.36
0.65
0.88
1.02
1.06
4.69
6.99
8.50
9.41
9.69
00
07
14
21
28
35
42
d P RLC vLC
in ft ft ft/s
o
0.88 8.50
0.00
1.05
2.81
4.81
6.81
8.57
9.62
A
ft2
0.50
0.75
0.91
1.01
1.04
RLC2/3
ft2/3
0.91
Flo
w D
ep
th (
in)
Flow Velocity (ft/s)
0
min
max
0
42
35
28
21
14
7
153 6 9 12
LC
n = constant
= 6.26CLC
= 0.84R2

© 2004 ADS LLC. All Rights Reserved.
12
Stevens-Schutzbach Method The Stevens-Schutzbach Method uses an iterative curve fitting technique to fit the Manning Equation to flow monitor data.8 The Manning Equation is applied using this method under the general assumptions shown in Figure 6.
flow monitor
ddog
FIGURE 6: General Assumptions of the Stevens-Schutzbach Method
n = constant
non-uniform flow
S = constant < S0 This method is applicable to flow monitor data obtained under uniform flow conditions or non-uniform flow conditions resulting from a variety of downstream obstructions, or dead dogs. Examples include offset joints, debris, and other related conditions. The Stevens-Schutzbach Method incorporates the Manning Equation as expressed in Equation (8) and the hydraulic radius as defined in Equation (9).
3/2SSSSSS RC486.1=v (8)
P
A=R e
SS (9)
where: vSS = flow velocity, ft/s CSS = hydraulic coefficient RSS = hydraulic radius, ft
Ae = effective wetted area, ft2 P = wetted perimeter, ft
Note that the definition of the hydraulic radius is modified from the traditional definition and requires certain assumptions regarding the shape and magnitude of the dead dog. Based on these assumptions, flow depth and velocity data are used to calculate the hydraulic coefficient based on an iterative least squares regression method, as described in Figure 7. The magnitude of the dead dog (ddog) is varied in successive iterations until the coefficient of determination is maximized.

© 2004 ADS LLC. All Rights Reserved.
13
FIGURE 7: Regression Using the Stevens-Schutzbach Method
Assumeddog = 0
Regressionv vs RSS
2/3
CalculateR2
R2 Max?
Increase ddog0 < ddog < dmin
No
Yes
d
v
CalculateRSS
2/3
e
Ae
A
D
d de
ddog
Restate Equation (8) as y = a + bx usingdirect substitution, where:
= RSS2/3
= vSS
= 1.486CSS
= 0
x
y
b
a
AssumeObstruction
= 2cos-1(1 - 2d/D)
A = (D2/8)( - sin )
P = D/2
For a circular sewer,
de = d - ddog
e = 2cos-1(1 - 2de/D)
Ae = (D2/8)(e - sin e)
CalculateCSS =
b1.486
Done
Effect of a dead dog can beapproximated using variousassumptions. By default thismethod uses an offset joint.
Further discussion regardingthis assumption is available inthe literature.8
RSS =Ae
P
Iteration 2
(Hydraulic Radius)2/3 (ft2/3) (Hydraulic Radius)2/3 (ft2/3)
Slope = 1.486CSS
Iteration n
R2 maximizedFlo
w V
elo
city
(ft/
s)
Iteration 1
(Hydraulic Radius)2/3 (ft2/3)
Perform iterative least squares regression.
The Stevens-Schutzbach Method is then used to generate a pipe curve which is compared to actual flow monitor data on a scattergraph. If the data agree with the pipe curve, then this method can be used to estimate the full-pipe capacity of the sewer, assuming the assumptions of this method remain valid at the monitoring location from 0 ≤ d ≤ D. The application of the Stevens-Schutzbach Method is demonstrated in the following example.

© 2004 ADS LLC. All Rights Reserved.
14
EXAMPLE
Use the Stevens-Schutzbach Method to construct a pipe curve on thescattergraph and estimate the full-pipe capacity of this sewer.
Flow monitor data are obtained from a 27-in sewer, as shown in thescattergraph below. Tabular data are provided on the following page.
max
min
Flo
w D
ept
h (in
)
0
27
9
18
Flow Velocity (ft/s)
0 41 2 3

© 2004 ADS LLC. All Rights Reserved.
15
00:00
00:15
00:30
00:45
01:00
01:15
01:30
23:45
00:00
00:15
00:30
00:45
01:00
01:15
01:30
23:45
08/01
08/01
08/01
08/01
08/01
08/01
08/01
08/21
08/01
08/01
08/01
08/01
08/01
08/01
08/01
08/21
14.34
14.08
13.91
13.81
13.48
13.14
12.93
14.19
0.70
0.69
0.69
0.69
0.68
0.67
0.67
0.70
2.11
2.03
1.99
1.96
1.99
1.92
1.84
2.07
2.11
2.03
1.99
1.96
1.99
1.92
1.84
2.07
14.34
14.08
13.91
13.81
13.48
13.14
12.93
14.19
1.47
1.41
1.37
1.35
1.36
1.29
1.23
1.44
1.98
1.92
1.88
2.12
1.92
1.90
1.89
1.89
1.87
1.85
1.84
1.91
180
177
175
186
0.49
0.48
0.48
0.47
0.46
0.45
0.45
0.48
180
177
175
186
0.037
0.016
0.009
0.005
0.015
0.005
0.000
0.026
EXAMPLE
187
185
183
183
2.15
2.10
2.06
2.05
187
185
183
183
0.063
0.030
0.017
0.010
0.017
0.004
0.000
0.045
3.53
3.47
3.44
3.65
3.67
3.63
3.60
3.59
x xy vSS
ft2/3 ft5/3/s ft/s
y
ft/s
time
hh:mm
date
mm/dd
x2
ft4/3
(vSS - v)2
(ft/s)2
(v - vavg)2
(ft/s)2
SSE SYY xy x2
(a)
(b)
vavg
CSS = xy x2
1.486
/R2 =
SSE
SYY1 -
For this example, a total of 2,016data points were used. Completecalculat ions are avai lable in aspreadsheet that accompanies thistechnical paper.
Based on this iteration, CSS = 1.85 and R2 = 0.50. R2 is not maximized.
01:45
02:00
08/01
08/01
13.04
12.88
1.88
1.80
13.04
12.88
1.90
1.87
176
175
176
175
3.46
3.43
01:45
02:00
08/01
08/01
0.67
0.67
1.88
1.80
1.26
1.20
1.84
1.83
0.45
0.45
0.001
0.001
0.000
0.003
d e
in o
v
ft/s
time
hh:mm
date
mm/dd
de
in
Ae
ft2o
P
ft
RSS
ft
RSS2/3
ft2/3
dmin
0.56
0.55
0.55
0.58
0.58
0.57
0.57
0.55
0.55
0.68
0.67
0.67
0.70
0.69
0.69
0.69
0.67
0.67
0.58 0.70
10.35 1.86
Solution: Calculate the hydraulic coefficient - Iteration 1
Assume ddog = 0.00 in. Calculate RSS2/3
Calculate CSS and R2 based on a least squares regression

© 2004 ADS LLC. All Rights Reserved.
16
00:00
00:15
00:30
00:45
01:00
01:15
01:30
23:45
00:00
00:15
00:30
00:45
01:00
01:15
01:30
23:45
08/01
08/01
08/01
08/01
08/01
08/01
08/01
08/21
08/01
08/01
08/01
08/01
08/01
08/01
08/01
08/21
14.34
14.08
13.91
13.81
13.48
13.14
12.93
14.19
0.66
0.65
0.65
0.65
0.64
0.63
0.62
0.65
2.11
2.03
1.99
1.96
1.99
1.92
1.84
2.07
2.11
2.03
1.99
1.96
1.99
1.92
1.84
2.07
13.34
13.08
12.91
12.81
12.48
12.14
11.93
13.19
1.39
1.32
1.29
1.26
1.27
1.21
1.15
1.35
1.80
1.73
1.69
1.93
1.93
1.91
1.90
1.89
1.87
1.85
1.83
1.92
171
168
167
177
0.43
0.42
0.42
0.42
0.41
0.40
0.39
0.43
180
177
175
186
0.033
0.014
0.008
0.004
0.014
0.006
0.000
0.023
EXAMPLE
179
176
175
174
1.96
1.91
1.88
1.86
187
185
183
183
0.063
0.030
0.017
0.010
0.017
0.004
0.000
0.045
3.53
3.47
3.44
3.65
3.67
3.63
3.60
3.59
x xy vSS
ft2/3 ft5/3/s ft/s
y
ft/s
time
hh:mm
date
mm/dd
x2
ft4/3
(vSS - v)2
(ft/s)2
(v - vavg)2
(ft/s)2
SSE SYY xy x2
(a)
(b)
vavg
CSS = xy x2
1.486
/R2 =
SSE
SYY1 -
For this example, a total of 2,016data points were used. Completecalculat ions are avai lable in aspreadsheet that accompanies thistechnical paper.
Based on this iteration, CSS = 1.97 and R2 = 0.58. R2 is not maximized.
01:45
02:00
08/01
08/01
13.04
12.88
1.88
1.80
12.04
11.88
1.71
1.69
168
166
176
175
3.46
3.43
01:45
02:00
08/01
08/01
0.63
0.62
1.88
1.80
1.18
1.12
1.84
1.83
0.39
0.39
0.002
0.001
0.000
0.003
d e
in o
v
ft/s
time
hh:mm
date
mm/dd
de
in
Ae
ft2o
P
ft
RSS
ft
RSS2/3
ft2/3
dmin
0.51
0.50
0.49
0.53
0.53
0.52
0.52
0.50
0.49
0.64
0.63
0.62
0.66
0.65
0.65
0.65
0.63
0.62
0.53 0.65
10.35 1.86
Solution: Calculate the hydraulic coefficient - Iteration 2
Assume ddog = 1.00 in. Calculate RSS2/3
Calculate CSS and R2 based on a least squares regression

© 2004 ADS LLC. All Rights Reserved.
17
00:00
00:15
00:30
00:45
01:00
01:15
01:30
23:45
00:00
00:15
00:30
00:45
01:00
01:15
01:30
23:45
08/01
08/01
08/01
08/01
08/01
08/01
08/01
08/21
08/01
08/01
08/01
08/01
08/01
08/01
08/01
08/21
14.34
14.08
13.91
13.81
13.48
13.14
12.93
14.19
0.61
0.61
0.60
0.60
0.59
0.58
0.58
0.61
2.11
2.03
1.99
1.96
1.99
1.92
1.84
2.07
2.11
2.03
1.99
1.96
1.99
1.92
1.84
2.07
12.34
12.08
11.91
11.81
11.48
11.14
10.93
12.19
1.30
1.23
1.20
1.18
1.18
1.12
1.06
1.26
1.61
1.55
1.51
1.74
1.94
1.92
1.91
1.90
1.87
1.84
1.82
1.93
163
160
158
169
0.38
0.37
0.36
0.36
0.35
0.34
0.33
0.37
180
177
175
186
0.029
0.012
0.007
0.004
0.014
0.006
0.000
0.020
EXAMPLE
170
168
166
166
1.77
1.72
1.69
1.67
187
185
183
183
0.063
0.030
0.017
0.010
0.017
0.004
0.000
0.045
3.53
3.47
3.44
3.65
3.67
3.63
3.60
3.59
x xy vSS
ft2/3 ft5/3/s ft/s
y
ft/s
time
hh:mm
date
mm/dd
x2
ft4/3
(vSS - v)2
(ft/s)2
(v - vavg)2
(ft/s)2
SSE SYY xy x2
(a)
(b)
vavg
CSS = xy x2
1.486
/R2 =
SSE
SYY1 -
For this example, a total of 2,016data points were used. Completecalculat ions are avai lable in aspreadsheet that accompanies thistechnical paper.
Based on this iteration, CSS = 2.12 and R2 = 0.66. R2 is not maximized.
01:45
02:00
08/01
08/01
13.04
12.88
1.88
1.80
11.04
10.88
1.53
1.50
159
158
176
175
3.46
3.43
01:45
02:00
08/01
08/01
0.58
0.58
1.88
1.80
1.09
1.04
1.83
1.82
0.34
0.33
0.002
0.000
0.000
0.003
d e
in o
v
ft/s
time
hh:mm
date
mm/dd
de
in
Ae
ft2o
P
ft
RSS
ft
RSS2/3
ft2/3
dmin
0.46
0.45
0.44
0.48
0.47
0.47
0.47
0.44
0.44
0.59
0.58
0.58
0.61
0.61
0.60
0.60
0.58
0.58
0.48 0.61
10.35 1.86
Solution: Calculate the hydraulic coefficient - Iteration 3
Assume ddog = 2.00 in. Calculate RSS2/3
Calculate CSS and R2 based on a least squares regression
© 2004 ADS LLC. All Rights Reserved.
18
00:00
00:15
00:30
00:45
01:00
01:15
01:30
23:45
00:00
00:15
00:30
00:45
01:00
01:15
01:30
23:45
08/01
08/01
08/01
08/01
08/01
08/01
08/01
08/21
08/01
08/01
08/01
08/01
08/01
08/01
08/01
08/21
14.34
14.08
13.91
13.81
13.48
13.14
12.93
14.19
0.41
0.40
0.40
0.39
0.38
0.37
0.36
0.41
2.11
2.03
1.99
1.96
1.99
1.92
1.84
2.07
2.11
2.03
1.99
1.96
1.99
1.92
1.84
2.07
7.89
7.63
7.46
7.36
7.03
6.69
6.48
7.74
0.87
0.82
0.79
0.77
0.75
0.70
0.66
0.84
0.82
0.77
0.73
0.94
2.02
1.98
1.94
1.93
1.86
1.80
1.76
2.00
123
119
117
130
0.17
0.16
0.16
0.15
0.14
0.13
0.13
0.16
180
177
175
186
0.008
0.003
0.002
0.001
0.016
0.015
0.007
0.006
EXAMPLE
131
129
128
126
0.97
0.92
0.90
0.88
187
185
183
183
0.063
0.030
0.017
0.010
0.017
0.004
0.000
0.045
3.53
3.47
3.44
3.65
3.67
3.63
3.60
3.59
x xy vSS
ft2/3 ft5/3/s ft/s
y
ft/s
time
hh:mm
date
mm/dd
x2
ft4/3
(vSS - v)2
(ft/s)2
(v - vavg)2
(ft/s)2
SSE SYY xy x2
(a)
(b)
vavg
CSS = xy x2
1.486
/R2 =
SSE
SYY1 -
For this example, a total of 2,016data points were used. Completecalculat ions are avai lable in aspreadsheet that accompanies thistechnical paper.
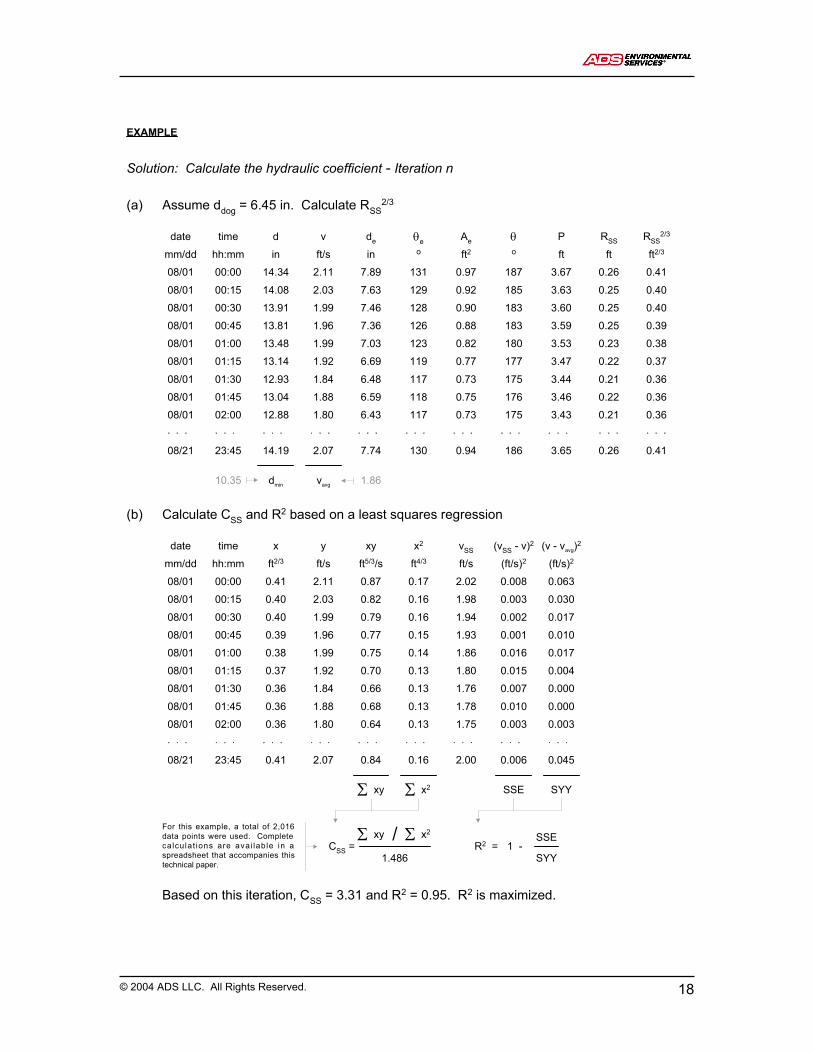
Based on this iteration, CSS = 3.31 and R2 = 0.95. R2 is maximized.
01:45
02:00
08/01
08/01
13.04
12.88
1.88
1.80
6.59
6.43
0.75
0.73
118
117
176
175
3.46
3.43
01:45
02:00
08/01
08/01
0.36
0.36
1.88
1.80
0.68
0.64
1.78
1.75
0.13
0.13
0.010
0.003
0.000
0.003
d e
in o
v
ft/s
time
hh:mm
date
mm/dd
de
in
Ae
ft2o
P
ft
RSS
ft
RSS2/3
ft2/3
dmin
0.23
0.22
0.21
0.26
0.25
0.25
0.25
0.22
0.21
0.38
0.37
0.36
0.41
0.40
0.40
0.39
0.36
0.36
0.26 0.41
10.35 1.86
Solution: Calculate the hydraulic coefficient - Iteration n
Assume ddog = 6.45 in. Calculate RSS2/3
Calculate CSS and R2 based on a least squares regression

© 2004 ADS LLC. All Rights Reserved.
19
EXAMPLE
(c)
000
078
113
141
167
193
219
0.00
0.00
0.00
0.19
0.59
1.08
1.62
0.00
1.53
2.21
2.77
3.28
3.78
4.30
0.00
0.00
0.07
0.18
0.29
0.00
0.00
0.83
1.57
2.13
00
03
06
09
12
15
18
d Ae P RSS vSS
in ft2 ft ft ft/s
o
0.38 2.57
The full-pipe capacity is calculated using the Continuity Equation, QSS = AvSS. Therefore,QSS = 3.98 ft2 x 2.93 ft/s = 11.7 ft3/s or 7.5 MGD.
The conditions observed within this sewer are effectively described by the ManningEquation fitted to observed flow depth and velocity data using the Stevens-SchutzbachMethod.
Solution: Construct pipe curve and estimate sewer capacity
(d)
00.00
00.00
00.00
02.55
05.55
08.55
11.55
de
in
000
000
000
072
108
137
163
e
o
247
282
360
2.19
2.74
3.25
4.86
5.54
7.07
0.45
0.49
2.89
3.07
21
24
27 0.46 2.93
14.55
17.55
20.55
189
215
243
0.00
0.24
0.66
1.16
1.71
2.27
2.82
A
ft2
3.32
3.73
3.98
Calculate vSS for 0 < d < D
Calculate QSS for d = D
0.00
0.00
0.17
0.32
0.43
RSS2/3
ft
0.52
0.59
0.62
0.60
These results provide the necessary information to construct a pipe curve on ascattergraph, as shown below.
max
min
Flo
w D
ept
h (in
)
0
27
9
18
Flow Velocity (ft/s)
0 41 2 3
ddog
ddog = 6.45-in
CSS = 3.31
R2 = 0.95
SS

© 2004 ADS LLC. All Rights Reserved.
20
Laboratory Investigation Laboratory investigations were designed to demonstrate the performance of these methods under controlled conditions and were performed using hydraulic testing facilities located at Accusonic Technologies in Falmouth, Massachusetts. Equipment and Methodology The laboratory equipment used during this investigation was designed and configured to simulate hydraulic conditions encountered in the urban sewer environment. The general arrangement of this equipment is provided in Figure 8.
FIGURE 8: Laboratory General Arrangement
1 2Influent Chamber Effluent Chamber
Electromagnetic Flow Meter
Wet WellPump
Test Pipe
Baffles
1
2
Monitoring Point.
Downstream Obstruction (Variable). See Figure 9 for Detail.
Manual Valve
A pump provides flow through a 6-in PVC force main to an influent chamber. A manual valve regulates the pump, and an electromagnetic flow meter measures the pump discharge. Flow passes through three consecutive baffles within the influent chamber, minimizing surface disturbances before entering an 8-in PVC test pipe. Uniform and non-uniform flow conditions are observed and measured at a monitoring point located within the test pipe. Flow conditions are controlled using one of three obstructions of known depth, as depicted in Figure 9, positioned a fixed distance downstream from the monitoring point. Following discharge from the test pipe to an effluent chamber, the flow is returned to a wet well for re-circulation by the pump.
FIGURE 9: Downstream Obstructions for Laboratory Investigation
0.0-in 1.5-in 3.0-in
After placing an obstruction within the test pipe, the pump is activated, and flow is introduced into the system. Once the system has reached equilibrium, flow depth and quantity measurements are obtained at three consecutive one-minute intervals. Flow depth is measured in the test pipe with a stainless steel ruler, and flow quantity is

© 2004 ADS LLC. All Rights Reserved.
21
measured in the force main with the electromagnetic flow meter. These measurements are then used to calculate flow velocity in the test pipe using the Continuity Equation. A total of 30 flow depth and quantity measurements were obtained at a variety of pump settings for each obstruction. Results and Discussion Flow depth and velocity data obtained during the laboratory investigations are plotted on scattergraphs and evaluated with respect to the Manning Equation using the Design Method, the Lanfear-Coll Method, and the Stevens-Schutzbach Method, as shown in Figure 10. The Design Method is applied using a roughness coefficient of 0.009 and a pipe slope of 0.72%. These values were selected based on the recommendation of the Uni-Bell PVC Pipe Association and laboratory measurements, respectively.9
FIGURE 10: Laboratory Results
Flo
w D
epth
(in)
0
8
Flow Velocity (ft/s)
0 4
max
min
2 31
LC
SS
DM
Flo
w D
epth
(in)
0
8
Flow Velocity (ft/s)
0 4
max
min
2 31
DM
Flo
w D
epth
(in)
8
Flow Velocity (ft/s)
0 4
max
min
2 31
DM
0
2
4
6
2
4
6
2
4
6
(b) Downstream Obstruction = 1.5 in
(a) Downstream Obstruction = 0.0 in
(c) Downstream Obstruction = 3.0 in
LC
SS
SS
LC
Laboratory Data
The laboratory observations demonstrate that these methods provide similar results under uniform flow conditions, as shown in Figure 10a. However, the Stevens-Schutzbach Method best describes the relationship between flow depth and velocity under non-uniform flow conditions resulting from various dead dogs, as shown in Figure 10b and Figure 10c.

© 2004 ADS LLC. All Rights Reserved.
22
Conclusion The scattergraph is a graphical tool that provides insight into sewer performance through a simple and intuitive display of flow monitor data. The resulting patterns form characteristic signatures that reveal important information about conditions within a sewer and the impact that these conditions have on sewer capacity. The Manning Equation is an important component of the scattergraph and can be applied using a variety of methods, including the Design Method, the Lanfear-Coll Method, and the Stevens-Schutzbach Method. Each method applies a specific set of assumptions to the Manning Equation, and an understanding of these assumptions is essential to effective application of these methods. Proper selection and application of these methods have a significant impact on the calculation of sewer capacity and the evaluation of sewer performance based on flow monitor data. Laboratory results indicate that these methods provide similar results under uniform flow conditions. However, the Stevens-Schutzbach Method best describes the relationship between flow depth and velocity under non-uniform flow conditions resulting from various dead dogs.
Symbols and Notation The following symbols and notation are used in this paper:
d = flow depth, in or ftvQnRSCDAPR2
= flow velocity, ft/s= flow rate, ft3/s or MGD= roughness coefficient= hydraulic radius, ft= slope of the energy gradient= hydraulic coefficient= diameter, in or ft= wetted area, ft2
= wetted perimeter, ft= coefficient of determination
= Design Method= Lanfear-Coll Method= Stevens-Schutzbach Method
= effective= dead dog
DM
LC
SS
e
dog
VARIABLES SUBSCRIPTS
= averageavg
= minimummin
Acknowledgement The authors acknowledge John Pangallo for motivating this work and Karl Boone for his support of laboratory research activities. Special thanks are also extended to Patrick Stevens, Jim Schutzbach, Peter Keefe, and Paul Mitchell for their insight and thoughtful review.

© 2004 ADS LLC. All Rights Reserved.
23
References 1. Enfinger, K.L. and Keefe, P.N. (2004). “Scattergraph Principles and Practice – Building a
Better View of Flow Monitor Data,” KY-TN Water Environment Association Water Professionals Conference; Nashville, TN.
2. Metcalf & Eddy, Inc. (1981). Wastewater Engineering: Collection and Pumping of
Wastewater, McGraw-Hill, New York, NY. 3. Stevens, P.L. (1997). “The Eight Types of Sewer Hydraulics,” Proceedings of the Water
Environment Federation Collection Systems Rehabilitation and O&M Specialty Conference; Kansas City, MO. Water Environment Federation: Alexandria, VA.
4. Stevens, P.L. and Sands, H.M. (1995). “Sanitary Sewer Overflows Leave Telltale Signs
in Depth-Velocity Scattergraphs,” Seminar Publication – National Conference on Sanitary Sewer Overflows; EPA/625/R-96/007; Washington, D.C.
5. Butler, D. and Davies, J.W. (2000). Urban Drainage. E & FN Spon, London. 6. Lanfear, K.J. and Coll, J.J. (March 1978). “Modifying Manning’s Equation for Flow Rate
Estimates,” Water and Sewage Works, 68-69. 7. Walpole, R.E. and Myers, R.H. (1989). Probability and Statistics for Engineers and
Scientists, 4th edition, Macmillan Publishing Company, New York, NY. 8. Stevens, P.L. and Schutzbach, J.S. (1998). “New Diagnostic Tools Improve the Accuracy
of the Manning Equation,” Proceedings of the Water Environment Federation Technical Exhibition and Conference; Orlando, FL. Water Environment Federation: Alexandria, VA.
9. Uni-Bell PVC Pipe Association (2001). Handbook of PVC Pipe: Design and Construction,
4th edition, Dallas, TX.