Embed Size (px)
Citation preview

Sberbank CIB Russia: The Inside Track Investor presentation 15 April 2015

1
Disclaimer IMPORTANT: You must read the following before continuing.
The following applies to the presentation (the “Presentation”) following this important notice, and you are, therefore, advised to read this important notice carefully before reading, assessing or making any other use of the Presentation. In assessing the Presentation, you unconditionally agree to be bound by the following terms, conditions and restrictions, including any modifications to them any time that you receive any information from Etalon Group Limited (“Etalon Group” or the “Company”) as a result of such access.
This Presentation has been prepared by the Company for informational purposes only and does not constitute or form part of, and should not be construed as, an offer or invitation to sell or issue, or any solicitation of any offer to subscribe for or purchase any securities of Company in any jurisdiction or an inducement to enter into investment activity. This Presentation is strictly confidential and may not be copied, distributed, published or reproduced in whole or in part, or disclosed or distributed by recipients to any other person in any form. Failure to comply with this restriction may constitute a violation of applicable laws.
This Presentation (i) is not intended to form the basis for any investment decision and (ii) does not purport to contain all the information that may be necessary or desirable to evaluate the Company fully and accurately, and (iii) is not to be considered as recommendation by the Company or any of its affiliates that any person (including a recipient of this Presentation) participate in any transaction involving the Company or its securities. The information contained in this Presentation has not been independently verified and the Company does not undertake any obligation to do so. No representation, warranty or undertaking, express or implied, is made as to, and no reliance should be placed on, the fairness, accuracy, completeness or correctness of the information or the opinions contained herein or any other material discussed in connection with the Presentation. Neither the Company nor any of its directors, officers, employees, shareholders, affiliates, advisors or representatives shall have any liability whatsoever (in negligence or otherwise) for any loss howsoever arising from any use of this Presentation or its contents or otherwise arising in connection with the Presentation.
Any ‘forward-looking statements’, which include all statements other than statements of historical facts, including, without limitation, forecasts, projections and any statements preceded by, followed by or that include the words ‘targets’, ‘believes’, ‘expects’, ‘aims’, ‘intends’, ‘will’, ‘may’, ‘anticipates’, ‘would’, ‘could’ or similar expressions or the negative thereof, involve known and unknown risks, uncertainties and other important factors beyond the Company’s control that could cause the actual results, performance or achievements to be materially different from future results, performance or achievements expressed or implied by such forward-looking statements. Forward-looking statements include statements regarding: our construction programme and future construction and development projects (information concerning which is being provided solely on an indicative basis for information purposes only and is subject to change without notice); strategies, outlook and growth prospects; future plans and potential for future growth; liquidity, capital resources and capital expenditures; growth in demand for products; economic outlook and industry trends; developments of markets; the impact of regulatory initiatives; and the strength of competitors. Such forward-looking statements are based on numerous assumptions by management regarding present and future business strategies and the environment operating in the future. Although the Company believes that these assumptions were reasonable when made, these assumptions are inherently subject to significant uncertainties and contingencies which are difficult or impossible to predict and are beyond its control. Neither the Company, nor any of its agents, employees or advisors intend or have any duty or obligation to supplement, amend, update or revise any of the forward-looking statements contained in this Presentation.
Construction programme area figures set out in this presentation, including the "Total area of construction programme" figures, may not reflect the final construction programme area figures. Whether such figures do or do not reflect the final construction programme area figures, they may not reflect the revenues ultimately recognized by Etalon. Calculating construction programme area figures is an inherently subjective process, and is subject to uncertainty. In addition, the construction programme area figures may not be directly comparable to figures given in respect of similar portfolios held by other real estate development businesses in the Russian market as a result of different assumptions and methodologies. In particular, the "Total area of construction programme" figures include area in which governmental authorities, and other third parties, have an interest.
The information contained in this document is provided as at the date of this Presentation and is subject to change without notice. Neither the Company nor any of its agents, directors, officers, employees, shareholders, affiliates, advisors or representatives intend or have any duty or obligation to supplement, amend, update or revise any information contained in this Presentation.
This Presentation contains certain unaudited half- and full- year financial information which has been prepared based on the Company’s reviewed management accounts. This Presentation contains also certain full- and half- year financial information based on the Company’s audited consolidated IFRS accounts. It also includes certain non-IFRS financial information, such as Earnings before interest, taxes, depreciation and amortization (“EBITDA”), EBITDA margin, Working capital and free cash flow (“FCF”) which has not been audited or reviewed by the Company’s auditors.
Neither the Presentation nor any copy of it may be taken or transmitted into the United States of America, its territories or possessions, or distributed, directly or indirectly, in the United States of America, its territories or possessions. This
Presentation does not contain or constitute and should not be construed as an offer to sell or the solicitation of an offer to buy securities in the United States. No securities of the Company have been registered or are intended to be registered under the Securities Act of 1933, as amended (the "Securities Act"), or the securities laws of any state of the United States, and unless so registered may not be offered or sold except pursuant to an exemption from, or in a transaction not subject to, the registration requirements of the Securities Act and applicable state securities laws. Any failure to comply with these restrictions is a violation of U.S. federal or applicable state securities laws.
In any EEA Member State that has implemented the Prospectus Directive, this Presentation is only addressed to and is only directed at qualified investors in any relevant Member State within the meaning of the Prospectus Directive. The expression “Prospectus Directive” means Directive 2003/71/EC (and amendments thereto, including Directive 2010/73/EU, to the extent implemented in any relevant Member State) and includes any relevant implementing measure in any relevant Member State.
This Presentation is only being distributed to and is only directed at (i) persons who are outside the United Kingdom or (ii) investment professionals within the meaning set out in Article 19(5) of the Financial Services and Markets Act 2000 (Financial Promotion) Order 2005, as amended (the “Order”) or (iii) high net worth companies, and other persons to whom it may lawfully be communicated, falling within Article 49(2)(a) to (d) of the Order (all such persons in (i), (ii) and (iii) above together being referred to as “Relevant Persons”). Securities in the Company are only available to, and any invitation, offer or agreement to subscribe, purchase or otherwise acquire such securities will be engaged in only with, Relevant Persons. Any person in the United Kingdom who is not a Relevant Person should not act or rely on this Presentation or any of its contents.
Neither this Presentation nor any copy of it may be taken or transmitted into Australia, Canada, South Africa, the Hong Kong Special Administrative Region of the People’s Republic of China or Japan or to any securities analyst or other person in any of those jurisdictions. Any failure to comply with this restriction may constitute a violation of applicable securities law. The distribution of this presentation in other jurisdictions may be restricted by law and persons into whose possession this presentation comes should inform themselves about, and observe, any such restrictions. The Company has not registered and does not intend to register any of its securities under the applicable securities laws of Australia, Canada, South Africa, the Hong Kong Special Administrative Region of the People’s Republic of China or Japan, and, subject to certain exceptions, its securities may not be offered or sold within Australia, Canada, South Africa, the Hong Kong Special Administrative Region of the People’s Republic of China or Japan or to any national, resident or citizen of Australia, Canada, South Africa, the Hong Kong Special Administrative Region of the People’s Republic of China or Japan. Information contained in this Presentation is not an offer, or an invitation to make offers, sell, purchase, exchange or transfer any securities in Russia or to or for the benefit of any Russian person, and does not constitute an advertisement of any securities in Russia. This information must not be passed on to third parties or otherwise be made publicly available in Russia. The Company’s securities have not been and will not be registered in the Russian Federation or admitted to public placement and/or public circulation in the Russian Federation except as permitted by Russian law.
This Presentation does not constitute or form a part of, and should not be construed as, (i) an advertisement of any securities of the Company, or an offer, or an invitation (including an invitation to make an offer) by or on behalf of the Company in the Russian Federation or in any other jurisdiction or (ii) any promise or representation that any such offer or invitation will be made and shall not form the basis of, nor may it accompany, nor form part of, any contract to acquire any securities of the Company in the Russian Federation or in any other jurisdiction.
This Presentation is not directed to, or intended for distribution to or use by, any person or entity that is a citizen or resident located in any locality, state, country or other jurisdiction where such distribution, publication, availability or use would be contrary to law or regulation or which would require registration of licensing within such jurisdiction.
By receiving and reading this Presentation, you agree to be bound by the restrictions in this disclaimer, and acknowledge that that you will be solely responsible for your own assessment of the market, the market position of the Company and any securities of the Company and that you will conduct your own analysis and be solely responsible for forming your own view of the potential future performance of the Company’s business.

Today’s presenting team
2
Viacheslav Zarenkov
Chairman of the Board of Directors
Founding shareholder and President of Etalon Group
Founded Etalon in 1987
Anton Evdokimov
Chief Executive Officer
Member of the Board of Directors
With Etalon Group since 1998
Kirill Bagachenko
Head of Corporate Investments and IR
Member of the Board of Directors
With Etalon Group since 2013

1 2 3 4 5
Operating Results
Financial Results
Landbank Valuation 2015 Deliveries Appendix

Summary
4
1
2
3
4
5
1Q 2015 operating results affected by consumer cool-down after 4Q 2014 rush
and high base effect from 1Q 2014
Balance sheet remains exceptionally strong, with net debt of only RUB 636 million
(0.06x net debt / EBITDA) as of 31 December 2014
Sales for 811 ths sqm of NSA due to be launched in 2Q-4Q 2015, providing impulse
for new sales in the remainder of the year
Strong operating results in 2014, with deliveries up 24% and new contract sales
up 28% (in sqm)
Project portfolio grew in value by 17% to RUB 104.3 billion, or RUB 357 per share
(source: JLL portfolio valuation as of 31 December 2014)

Operating Results

Transfers h-o-h, sqm
Etalon Group delivered record volumes of high-quality housing on schedule
6
Project NSA delivered in 2014, ths sqm
Emerald Hills 133
Rechnoy 111
Molodejny 107
Tsar’s Capital 107
Swallow’s Nest 83
Galant 39
Total 580
28 76
440
504
2013 2014
1H 2H
Deliveries, ths sqm
468
+24%
349,793
403,463
2013 2014
+15%
2014 project deliveries breakdown
Source: Company data
580
• Etalon Group successfully delivered on its construction plan in
2014, completing 580 ths sqm of NSA for the year, an increase of
24% compared to 2013 and an all-time record for the Company.
• During 2014 Etalon delivered a total of 16 buildings containing
8,055 flats at ongoing projects including Tsar’s Capital,
Swallow’s Nest, Molodejny and Emerald Hills, as well as at
Rechnoy and Galant, where the Company completed
construction work.

4,158 5,566 5,923 9,078 3,781
5,194 6,746
8,095 4,336
5,563 8,152
9,480
6,031
7,416
9,406
13,309
2011 2012 2013 2014
1Q 2Q 3Q 4Q
30,227
39,961
2013 2014
356,075
457,056
2013 2014
6,932
9,045
2013 2014
26,073
35,335
2013 2014
FY 2014 Operating results outperform Company guidance
7
New contract sales, sqm
Source: Company data
Number of contracts New contract sales, mln RUB
Cash collections, mln RUB New contract sales y-o-y, mln RUB
+30%
+27%
+32%
+28% +32% +30%
+36%
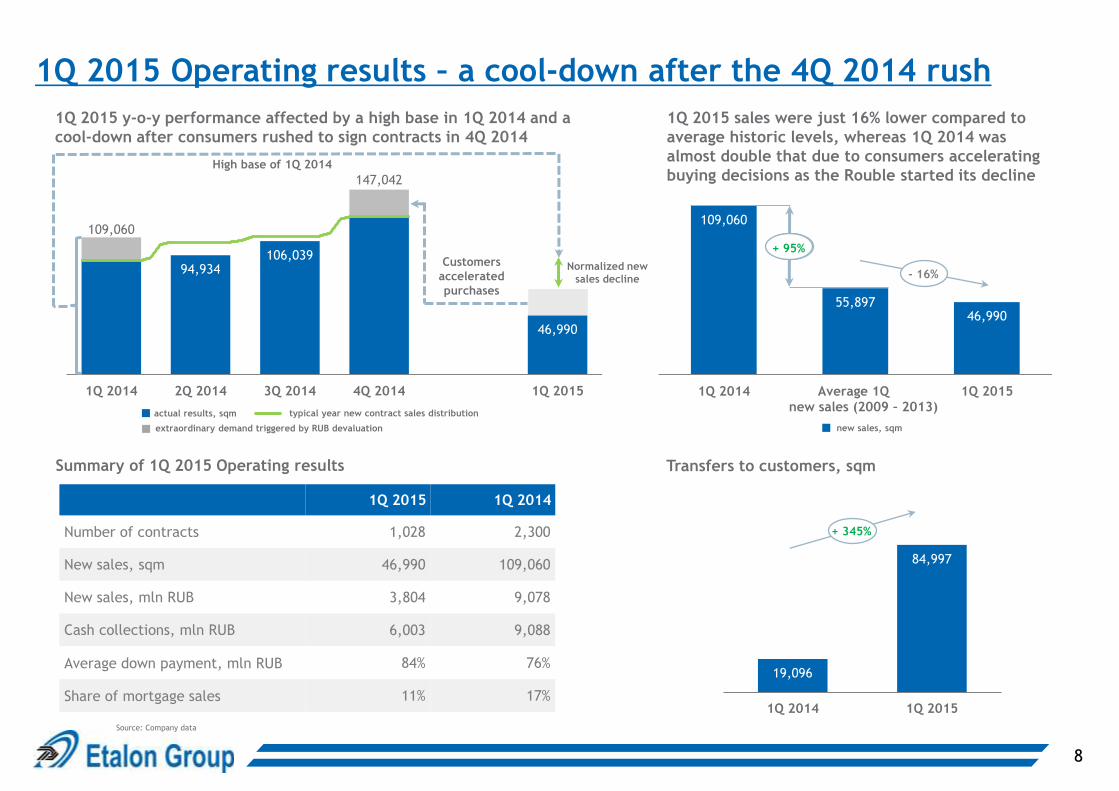
94,934 106,039
46,990
1Q 2014 2Q 2014 3Q 2014 4Q 2014 1Q 2015
Customers
accelerated
purchases
147,042
109,060
typical year new contract sales distribution
High base of 1Q 2014
extraordinary demand triggered by RUB devaluation
Normalized new
sales decline
109,060
55,897 46,990
1Q 2014 Average 1Q 1Q 2015
- 16%
1Q 2015 1Q 2014
Number of contracts 1,028 2,300
New sales, sqm 46,990 109,060
New sales, mln RUB 3,804 9,078
Cash collections, mln RUB 6,003 9,088
Average down payment, mln RUB 84% 76%
Share of mortgage sales 11% 17%
Summary of 1Q 2015 Operating results
19,096
84,997
1Q 2014 1Q 2015
+ 345%
Transfers to customers, sqm
new sales (2009 – 2013)
+ 95%
8
1Q 2015 y-o-y performance affected by a high base in 1Q 2014 and a
cool-down after consumers rushed to sign contracts in 4Q 2014
1Q 2015 Operating results – a cool-down after the 4Q 2014 rush
1Q 2015 sales were just 16% lower compared to
average historic levels, whereas 1Q 2014 was
almost double that due to consumers accelerating
buying decisions as the Rouble started its decline
actual results, sqm
new sales, sqm
Source: Company data

20%
6%
8%
3%
21%
12%
12%
3%
10% 5%
25%
14%
12% 12%
10%
7%
6%
4%
2% 1%
1%
6%
Inventory of completed housing drives new contract sales in 1Q 2015
9
1Q 2015 New contract sales by project, sqm 1Q 2014 New contract sales by project, sqm
Swallow’s Nest
Tsar’s Capital
Rechnoy
Jubilee Estate
Molodejny
Galant
Moscow
Gates Etalon
City
Letniy
76,426 79,083 80,347 81,908
84,385 85,315
90,860 88,811
93,122 95,923
93,223 97,522
106,228
71,611 75,120 74,073
78,484 80,606
84,286 87,887
85,671 83,234
85,271 89,402 90,511
80,946
50,000
65,000
80,000
95,000
110,000
1Q12 2Q12 3Q12 4Q12 1Q13 2Q13 3Q13 4Q13 1Q14 2Q14 3Q14 4Q14 1Q15
apartments total
Significant portfolio diversification with growing
share of prime location projects
• Regional sales accounted for 37.5% of new sales in 1Q 2015
• Higher share of parking spaces in the 1Q 2015 new sales mix
had an impact on the total average price
• Though the blended average price per sqm decreased 3%
year-on-year to RUB 80.9 thousand, average prices for
apartments increased 14% year-on-year to RUB 106.2
thousand per sqm, driven by Etalon Group’s increasing share
of sales at prime-location projects
Average price, RUB/sqm
Source: Company data
Emerald Hills
Samotsvety
Swallow’s Nest
Emerald Hills
Tsar’s Capital
Rechnoy
Molodejny
Galant
Etalon City
Other projects
Letniy
Other projects
Jubilee Estate

12.29% 12.20% 12.22% 12.32% 12.45%
14.16% 14.45%
11.0%
11.5%
12.0%
12.5%
13.0%
13.5%
14.0%
14.5%
15.0%
subsidised mortgage
interest rate
12%
• Apartments at Etalon Group development projects in the Moscow and St.
Petersburg Metropolitan Areas are eligible for the Russian government’s
subsidised mortgage programme
• Etalon Group works with with major domestic banks that offer subsidised
mortgage programmes, including Sberbank, VTB24, Rosbank, Bank St.
Petersburg and Absolut Bank
• Basic terms of the subsidised mortgage programme:
• minimum down payment: 20%
• loan amount: up to RUB 8 million
• maturity: up to 30 years
• interest rate: from 12%
9%
11%
16%
Jan-15 Feb-15 Mar-15
Mortgage market stabilised after launch of State support programme
10
Highlights
17%
11%
1Q 2014 1Q 2015
Share of mortgage sales, %
(1) CBR data
Average mortgage rate dynamics in Russia(1)
Share of mortgage sales in 1Q 2015, %
Source: Company data

185
522
811
2013 2014 2015
+ 55%
+ 182%
New launches in 2Q-4Q will provide impulse for new sales in 2015
11
Launch of sales, ths sqm
0
112
268
431
1Q 2015 2Q 2015 3Q 2015 4Q 2015
No projects
launched in
1Q 2015
Source: Company estimates
Actual launch of sales Planned launch of sales
Launch of sales in 2015 by quarter, ths sqm

Financial Results
12

7,256
9,909
2013 2014
29,548
37,560
2013 2014
349,793
403,463
2013 2014
39,921
51,481
2013 2014
Robust financial performance in 2014
13
Transfers to customers, sqm
Source: IFRS financial statements, Company information
Residential real estate development
revenue, mln RUB
Construction services revenue from third parties/external,
mln RUB Total revenue, mln RUB
+27% +15%
+37% +29%

11,964
15,080
40% 40%
0%
10%
20%
30%
40%
50%
60%
70%
80%
0
2,000
4,000
6,000
8,000
10,000
12,000
14,000
2013 2014Residential real estate development adjusted gross profit*,mln RUBAdjusted gross profit margin*, %
11,964 15,080
743
1,369 440
371
2013 2014
Residential real estate development
Construction services
Other segments plus elimination of inter-segment profit
14
Healthy profitability levels maintained
Adjusted gross profit*, mln RUB Residential real estate development adjusted gross
profit*, mln RUB
13,147
Source: IFRS financial statements
*Note 5 to IFRS financial statements
9,430 10,611
2013 2014
EBITDA, mln RUB Net income, mln RUB
+26% +28%
+13%
16,820
6,664
8,369
2013 2014
+26%

Liquidity position, RUB mln(1)
Strong balance sheet secured by robust cash collections
15
Gross debt composition (as of 31/12/2014) (1)
By type of facility By currency
1,076 net debt
182 net debt
349 net cash
636 net debt
30.06.2013 31.12.2013 30.06.2014 31.12.2014
92%
8%
RUB
EUR
31%
69%
Localbonds
Bankloans
Highlights
• Company estimates that only c. 15% of total construction
costs linked to USD
• Foreign currency denominated cash to debt ratio is 3.5
(as of 31 December 2014)
• 0.06x Net debt/EBITDA (as of 31 December 2014)
4,201
3,944
5,721
1,820 605 16,291
2015 2016 2017 2018 2019-2021 Total
Debt maturity profile
(as of 31/12/2014; RUB mln)(2)
USD/RUB fx rate as of 31 December 2014 56.26
EUR/RUB fx rate as of 31 December 2014 68.34 (1) IFRS financial statements
(2) Includes accrued interest payable in 2015, based on management accounts

(1,482) (4,482) (4,897)
(1,462) (76)
43,172
55,184
71,934
89,253
104,286
2010 2011 2012 2013 2014
FCF, mln RUB Open Market Value, mln RUB
IPO proceeds
16
Balanced growth strategy
1.25x
1.53x 1.53x 1.49x
1.29x
0.0x
0.2x
0.4x
0.6x
0.8x
1.0x
1.2x
1.4x
1.6x
0
5
10
15
20
25
30
35
40
45
50
2010 2011 2012 2013 2014
Working capital, bln RUB (lhs)
Cash collections, bln RUB (lhs)
Working capital to Cash collections ratio (rhs)
0.34x
0.43x 0.44x 0.44x 0.44x
0.0x
0.1x
0.1x
0.2x
0.2x
0.3x
0.3x
0.4x
0.4x
0.5x
0.5x
0
10
20
30
40
50
60
70
80
90
100
110
2010 2011 2012 2013 2014
Working capital, bln RUB (lhs)
Open Market Value, bln RUB (lhs)
Working capital to Open Market Value ratio (rhs)
1.04x
1.31x 1.34x
1.29x
1.14x
0.0x
0.2x
0.4x
0.6x
0.8x
1.0x
1.2x
1.4x
0
5
10
15
20
25
30
35
40
45
50
2010 2011 2012 2013 2014
Working capital, bln RUB (lhs)
New Contract Sales, bln RUB (lhs)
Working capital to New Contract Sales ratio (rhs)
Organic portfolio value
growth as a result of IPO
proceeds investment
Note: for FCF and Working capital detailed calculations please refer to pp. 45-46 (1) JLL land bank valuation report as of 31.12.2014
(1)

Landbank Valuation

Open market value,
RUB mln
89,253 104,286
2013 2014
305.6 357.1
2013 2014
18
49%
46%
5%
Projects under development
Projects at design stage
Projects completed
56%
44%
SPMA MMA
Etalon Group’s portfolio grew in value again in 2014 despite the more complex macro environment
Breakdown by stage of
development
Breakdown by region
Open market value per
share, RUB
+17%
Sustainable growth of open market value based on well diversified portfolio
• Market value of the Group’s portfolio as of 31 December 2014 reached RUB 104,286 million, up 17% year-on-year
• Landbank volume remained generally stable at 3.11 million sqm of unsold NSA
• The Company acquired one new project in St. Petersburg during 2014
• The share of MMA projects reached 44%, up 2 p.p. year-on-year
+17%
Source: JLL estimate as of 31.12.2014

19
Etalon Group targets optimal land bank management Acquired Launched Completed
1 project acquired in 2014:
• Three-hectare land plot
situated on Polyustrovskiy
prospect in the Kalininskiy
district of St. Petersburg
• Total NSA - 91 ths sqm
• Land planning
documentation for the
land plot already obtained,
allowing the rights holder
to begin construction in
the near future
• Property is located within
walking distance from the
Lesnaya metro station and
four kilometres from
central St. Petersburg
2 projects launched in 2014 enjoy strong demand, driving
new sales:
Samotsvety
• Total NSA – 206 ths sqm
• Launched in August 2014
• Project share in 4Q 2014
sales – 12 %
Moscow Gates
• Total NSA – 234 ths sqm
• Launched in November 2014
• Project share in 4Q 2014
sales – 4 %
2 projects completed in 2014
still generate sales without
extra spending:
Galant
• Total NSA – 50 ths sqm
• Apartment pre-sales rate –
67% (as of June 2014)
Rechnoy
• Total NSA – 111 ths sqm
• Apartment pre-sales rate –
82 % (as of December 2014)
Total inventory of completed and available for sale property stands at 432 ths sqm,
including 220 ths sqm of apartments, as of 31.12.2014
Source: Company data and JLL land bank valuation report as of 31.12.2014

Under construction
Design stage
4
6
1
3
2
Operations in SPMA and MMA
20
Projects in Moscow Metropolitan Area
2
4
5
1
3
Under construction
Design stage
6
Projects in St. Petersburg Metropolitan Area
7
Completed
8
9
5

21
Project Status Total NSA
(‘000 sqm)
Unsold NSA
(Etalon’s share)
(‘000 sqm) (1)
Unsold
parking (lots),
#
OMV
(RUBmln)
Income from
sales
(RUBmln) (2)
Construction
budget
(RUBmln) (3)
Outstanding
budget
(RUBmln) (3)
Current Projects
St. Petersburg Metropolitan Area (SPMA)
1. Galactica Design stage 779.4 631.5 4,238 8,182 78,557 38,978 37,520
2. Tsar’s Capital Construction 392.4 216.3 2,089 13,197 33,225 15,374 6,868
3. Swallow’s Nest Construction 333.6 149.0 1,582 8,720 22,932 13,365 1,880
4. Moscow Gates Construction 234.1 202.0 884 7,104 25,662 10,136 8,122
5. Samotsvety Construction 205.8 179.6 1,654 8,613 22,614 8,466 5,757
6. Molodejny Construction 111.8 25.8 491 935 8,545 4,352 1,140
7. Polyustrovskiy prospect Design stage 91.3 91.3 530 1,098 6,965 3,377 3,377
8. Technopark Design stage 51.0 51.0 440 572 4,451 3,571 3,089
9. Beloostrovskaya Design stage 42.9 41.0 277 383 3,588 2,290 2,281
Total SPMA 2,242.3 1,587.6 12,185 48,804 206,540 99,909 70,033
Moscow Metropolitan Area (MMA)
1. Emerald Hills Construction 864.8 479.3 3,174 18,484 66,218 37,548 17,094
2. Etalon-City Construction 372.2 272.3 2,276 8,871 34,955 17,575 15,531
3. Dmitrovskoe shosse Design stage 322.3 266.1 2,122 5,276 33,604 16,696 16,579
4. Alekseevskiy District Design stage 179.5 169.6 2,160 6,835 23,957 8,973 8,903
5. Budennogo street Design stage 119.0 110.7 936 3,825 13,950 5,836 5,763
6. Losinoostrovskiy District Design stage 91.5 83.9 851 3,032 11,635 4,372 4,351
Total MMA 1,949.3 1,381.8 11,519 46,323 184,319 90,998 68,222
Total Current Projects 4,191.6 2,969.4 23,704 95,127 390,859 190,907 138,255
Completed Projects
Residential property in completed projects 124.5 3,219 8,198
Completed stand-alone commercial properties 20.4 59 961
Total Completed Projects 144.9 3,278 9,159
All Projects
Total Etalon Group 3,114.3 26,982 104,286
Etalon Group portfolio: high quality projects diversified across the two most lucrative macro regions in Russia
Source: construction period based on company estimates, all numbers based on JLL report as of 31.12.2014
(1) Including parking with average area c. 30 sqm (3) Excluding land acquisition costs
(2) Income from sales includes potential and received incomes as of 31 December 2014

12,360
13,035
12,031
12,580
13,589
200
319
364
467
580
209
328 363
468
580
0
100
200
300
400
500
600
700
2010 2011 2012 2013 2014
FY 2014 construction volumes: yet another year of successful growth
22
Source: Company estimates
*Calculations of total deliveries in target markets (MMA and St. Petersburg) for 2010-2013 are based on GKS data, 2014 total deliveries based on GKS data and preliminary announcements of Moscow region Government representatives
Actual Construction programme
Construction programme, ths sqm of NSA
Total deliveries in target regions*

2015 Deliveries
23
24
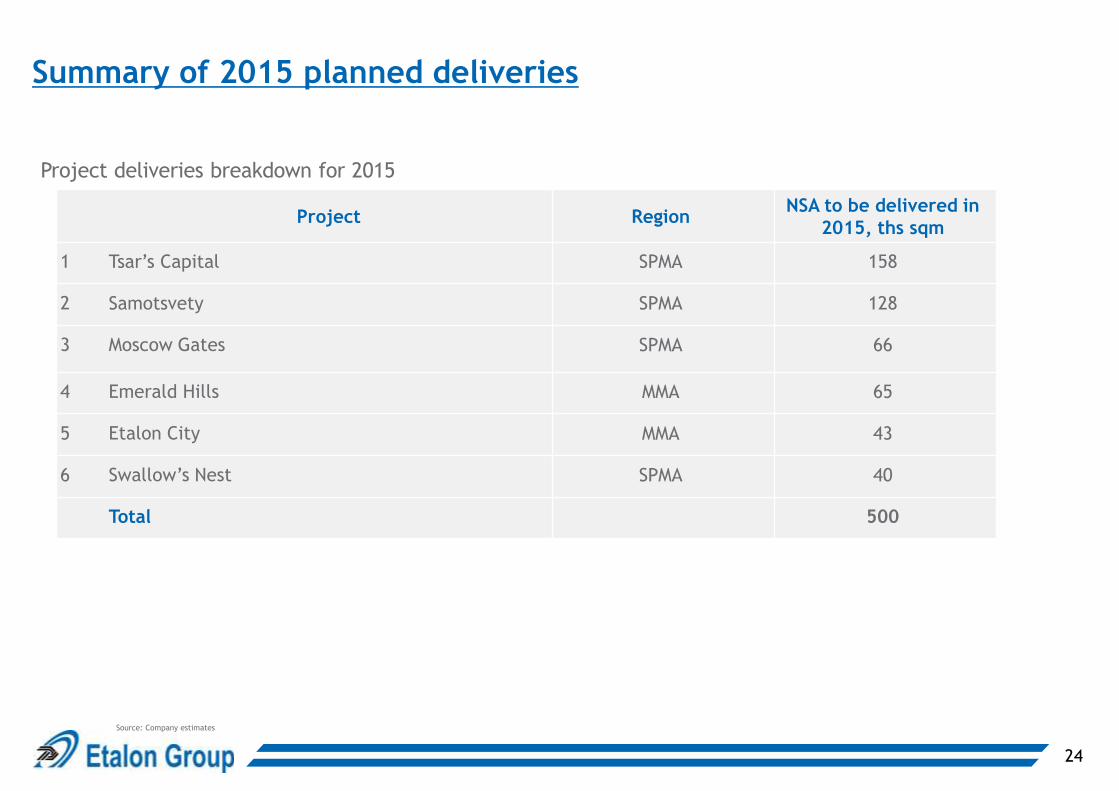
Summary of 2015 planned deliveries
Project deliveries breakdown for 2015
Source: Company estimates
Project Region NSA to be delivered in
2015, ths sqm
1 Tsar’s Capital SPMA 158
2 Samotsvety SPMA 128
3 Moscow Gates SPMA 66
4 Emerald Hills MMA 65
5 Etalon City MMA 43
6 Swallow’s Nest SPMA 40
Total 500

Tsar’s Capital
25
March 2015 December 2013
Income from sales*
RUB 33,225 mln
*JLL estimate as of 31.12.2014
Open Market Value*
RUB 13,197 mln Total NSA 392 ths sqm
Planned 2015 deliveries
158 ths sqm

Samotsvety
26
March 2015
Income from sales*
RUB 22,614 mln
Open Market Value*
RUB 8,613 mln Total NSA 206 ths sqm
Planned 2015 deliveries
128 ths sqm
December 2013
*JLL estimate as of 31.12.2014

Moscow Gates
27
March 2015
Income from sales*
RUB 25,662 mln
Open Market Value*
RUB 7,104 mln Total NSA 234 ths sqm
Planned 2015 deliveries
66 ths sqm
December 2013
*JLL estimate as of 31.12.2014

Emerald Hills
28
March 2015 December 2013
Planned 2015 deliveries
65 ths sqm
Income from sales*
RUB 66,218 mln
Open Market Value*
RUB 18,484 mln Total NSA 865 ths sqm
*JLL estimate as of 31.12.2014

Etalon City
29
March 2015 December 2013
Income from sales*
RUB 34,955 mln
Open Market Value*
RUB 8,871 mln Total NSA 372 ths sqm
Planned 2015 deliveries
43 ths sqm
*JLL estimate as of 31.12.2014

Swallow’s Nest
30
March 2015 December 2013
Income from sales*
RUB 22,932 mln Total NSA 334 ths sqm
Delivered in 2015
40 ths sqm
Open Market Value*
RUB 8,720 mln
*JLL estimate as of 31.12.2014

Appendix

At a glance
32
Presence in rapidly growing markets
• Focus on middle class residential real estate in Moscow metropolitan area (MMA) and St. Petersburg metropolitan area (SPMA)
• 29% CAGR for deliveries over 2010-2014(1)
Strong delivery track record
•Over 27 years of construction & development experience
• 4.5 mln sqm commissioned
True vertical integration
• Strategic vertical integration in key value-added segments of property development enables the Company to control costs, quality and timing
• 5,000 employees
•Country-wide sales network covering 36 cities
Diversified projects portfolio
• Land bank of 3.11 mln sqm(2)
• Land bank sufficient until 2018
• Projects well diversified by locations within both SPMA and MMA
Liquidity and credit ratings
• Secure liquidity position supported by pre-sales cash collections model
• Low leverage: 0.06x net debt / EBITDA, with a net debt of just RUB 636 mln(3)
•Credit rating by S&P: B+/B(4)
Corporate governance
• 10 BoD members, 5 NEDs
•Board of Directors consists of professionals with broad range of experience and expertise, ensuring that the interests of all groups of shareholders are appropriately represented
•Monthly visual updates on projects, quarterly trading updates and semi-annual financial reporting
•Official guidance on deliveries and new contract sales
•Dividend policy aims to pay out 15% to 30% of IFRS net profit semi-annually
(1) Company operating results; (2) JLL land bank valuation report as of 31.12.2014; (3) IFRS financial statements as of 31 December 2014; (4) 'B+' long-term & ‘B’ short-term corporate credit ratings of SSMO LenSpetsSMU
(last reconfirmed on 29.07.2013).
49% 46%
5%
Projects under development
Projects at design stage
Projects completed
LSE ticker ETLN:LI
Share price USD 2.55 (13.04.2015)
Market
capitalization
USD 745 mln
(13.04.2015)
Portfolio valuation
(by Jones Lang La
Salle)
RUB 104,286 mln
(31.12.2014)
Portfolio composition (2)
56%
44% SPMA
MMA

Construction Materials*
Construction Contracting & Commissioning
Tower Cranes**
Strategic vertical integration: control over costs, quality and timing Etalon Group operates in every part of property development process
33
* Brick plant and concrete products plant. Own production only for “bottleneck” construction materials
** 62 tower cranes (Liebherr and Wolff). Data as of 31.12.2014
Control over costs, quality &
timely delivery of the projects
Business stability and lower risk
of dependence on counterparties
Understanding of customer
needs (sales network throughout
the country)
Land Acquisition & Permits
Design
Sales & Marketing
Ongoing Maintenance & Service
Effective Capital Recycling
Funding
Independence from
suppliers, but only in
crucial areas
> 40 business units > 5,000 people

Powerful sales network across the country
Etalon Group’s sales offices / representatives
Nationwide sales & marketing network supports sustainable contracting
34
Etalon Group’s regional sales geography(1)
• Etalon Group sales force is focused on the regions with the largest income per capita
• Key markets: SPMA and MMA
• 36 cities covered with 14 sales offices in St. Petersburg and 17 more sales offices
nationwide
• External professional marketing and sales service agents engaged nationwide
(1)Source: company data for 1Q 2015 (2)Average monthly cash income per capita, Rosstat’s preliminary estimates for 12M 2014
Region Share of total
contracts
Leningrad 5.5%
Krasnoyarski krai 2.4%
Kamchatski krai 2.2%
Primorski krai 2.2%
Murmansk 1.8%
Sakhalin 1.4%
Khabarovski krai 1.3%
Samara 1.2%
Other Russian regions 16.9%
Foreigners 2.5%
Total: 37.5%
The Group’s flats are sold in 14 out of Russia’s 15 richest regions
Average income per capita (RUB)(2)
Etalon Group’s target regions
Regional population actively buys apartments in Moscow and St. Petersburg
Petropavlovsk-
Kamchatskiy
Magadan
Uzhno-
Sakhalinsk Khabarovsk
Norilsk
Noviy Urengoy
Nizhnevartovsk Surgut
Murmansk
SPMA
MMA
Arkhangelsk
Vladivostok
Irkutsk
Yakutsk
Mirniy
Noyabrsk
Cherepovets
Chelyabinsk
Nakhodka
Yaroslavl Ukhta
Established relationships/ partnerships with local sales agencies
Blagoveshchensk
Novosibirsk
Ekaterinburg
Petrozavodsk
Nadim
Salekhard
Apatity
Izhevsk
Neryungri
Siktivkar
Tomsk
Severodvinsk
Usolye-Sibirskoye
27,749
31,999
32,013
33,991
34,069
34,661
34,853
37,369
38,695
41,929
44,527
45,936
54,706
55,170
60,694
67,620
Russia average
Sverdlovsk
Khabarovski krai
Murmansk
Yakutia
Saint Petersburg
Moscow region
Kamchatski krai
Tyumen
Khanty-Mansiysk AD
Sakhalin
Magadan
Chukotka
Moscow
Yamalo-Nenets AD
Nenets AD

Board of Directors represents interests of all investor groups
35
Michael John Calvey
Senior partner at Baring Vostok since 1999
Experience and awards • Member of the board of Europlan, Volga
Gas, Gallery Media Group • Worked at EBRD, Salomon Brothers,
Sovlink Corporation • Ex-Member of the board of CTC Media,
Golden Telecom, Burren Energy
Education • University of Oklahoma and London
School of Economics
Alexei Kalinin
Senior partner at Baring Vostok
Experience and awards • With Baring Vostok since 1999 • Worked at Alfabank and Alfa Capital • Chairman of the Board of Directors at
Volga Gas, member of the board at Samarenergo and two Russian glass companies
Education • Moscow Power Engineering University • PhD in Engineering
Martin Cocker
Independent Non-Executive Director
Experience and awards • 19 years of experience in audit, 5 years
- in construction industry • Runs his own development business in
Portugal • Worked at Deloitte & Touche,
KPMG and Ernst & Young in Russia, Kazakhstan and UK
Education • University of Keele
IND
EPEN
DEN
T N
ON
-EXEC
UT
IVE
DIR
EC
TO
RS
(1) Title granted by President of Russia
EXEC
UT
IVE D
IREC
TO
RS
Boris Svetlichny
Chief Financial Officer
Experience and awards • Over 26 years experience in finance
and senior management with international and Russian companies
• Recent experience included CFO position at Orange in Russia, VP for Finance at Vimpelcom and CFO at Golden Telecom
Education • University of Massachusetts (BBA in
Accounting) • Carnegie-Mellon University (MBA)
Kirill Bagachenko
Head of Corporate Investments and IR
Experience and awards • 10 years’ experience in corporate
finance and asset management • Previously held position of senior equity
portfolio manager at TKB BNP Paribas Investment Partners
• In 2013 voted one of the top three portfolio managers in Russia by Thomson Reuters Extel Survey
Education • St. Petersburg State University of
Economics and Finance
Anton Evdokimov
Chief Executive Officer, First Vice-President
Experience and awards • 28 years of experience in construction
industry • Certificate of Honour of the Ministry of
Regional Development
Education • Leningrad Engineering Construction
Institute, SPb State University and International Banking Institute, Open University Business School (MSc in International finance, MBA in business strategy)
Dmitry Zarenkov
Vice-President
Experience and awards • 18 years of experience in construction industry • Honoured builder of Russia(1); Certificate of Honour of the Ministry of
Regional Development
Education • Institute of Aeronautical Instrumentation, SPb University of
Architecture & Civil Engineering , SPb University of Internal Affairs • PhD in Engineering
Anton Poryadin
Independent Non-Executive Director
Experience and awards • 13 years of experience in strategy
consulting at A.T. Kearney. Partner and Vice President at A.T. Kearney
• Worked at Barents International Markets B.V., Torno Internazionale S.p.A., St. Petersburg Foundation for Enterprise Development
Education • SPb Technical University, Business
School at the University Of Rochester
Andrew Howat
Independent Non- Executive Director
Experience and awards • 30 years of experience in
international finance, banking and investment businesses
• Worked as a senior Director at ING Bank in the Corporate Banking and Financial Markets divisions, and as Managing Director of Butterfield Fulcrum
• Chartered member of the Chartered Institute for Securities & Investment
Education • Farnborough College of Technology
Viacheslav Zarenkov
Chairman of the Board of Directors, Founding shareholder and President
Experience and awards • 45 years of experience in construction industry • Honoured builder of Russia(1)
Education • Institute of Civil Engineering, SPb University of Internal Affairs • PhD in Economics, PhD in Technical Sciences, PhD in Architecture,
Professor
FO
UN
DIN
G
SH
AR
EH
OLD
ER
S
NO
N-E
XEC
UT
IVE D
IREC
TO
RS

Strong corporate governance and shareholding structure
36
Corporate governance structure Shareholding structure
General Shareholders Meeting
Board of Directors
Strategy Committee
Remuneration & Nomination
Committee
Audit Committee Management Team
• Chairman (V. Zarenkov)
• 4 Executive Directors
• 5 Non-Executive Directors, including 3 Independent Directors
Source: Company data
As of 31 December 2014
44.1%
7.7% 16.4%
30.8%
1.0%
Zarenkov family
Management
Baring Vostok
Free float
Etalon Development Ltd
Board Committees

37
4% 4% 6%
6%
7%
8%
20%
45%
Sales costs
Interest expense
Land acquisition
Project management Design
Other
Typical project cost structure
*Source: Company estimates for typical project based on current portfolio average. Actual breakdown per project is subject to significant variation due to a number of factors.
8% 8%
20%
23%
41%
Machinery
Taxes
Overhead expenses
Materials
Total cost structure *
(RUB 59,000 – 72,000 per sqm of NSA)
Construction cost structure *
(RUB 29,000 – 39,000 per sqm of NSA)
52%
20%
14%
6% 4% 4%
Metal products
Bricks
Crushed
granite Sand
Other
Materials cost structure *
(RUB 12,000 – 18,000 per sqm of NSA)
Cement
0 5 10 15 20 25 30
Task Share,% Start, month Duration, month
Predevelopment 3 0 8
Zero cycle works 7 2 10
Construction works 43 5 20
Facade works 11 16 10
Fit out works 5 18 10
MEP systems 14 7 21
Engineering facilities 15 5 23
Urban landscaping 2 24 6
Construction timeline, month
Typical project lifecycle*
Wages Construction
Infrastructure

Residential development scheme
38
Timing
Stages of residential real estate development
Revenue recognition
Permission risk vs. Project value
Total development period range: 39-59 months
3-5 years
Zoning & initial permit documentation
12-18 months
Investment contract, planning & construction permit
18-30 months
Construction
Pre-sale
1-2 months
State commission
3 months
Ownership rights registration
Etalon Group focus
Source: Company data
High permission risk
Low entry price
Medium-low permission risk
Medium entry price
For share participation agreements when the construction is completed and the building has been approved by the State commission for acceptance of finished buildings.
For share accumulation agreements when the building has been approved by the State commission for acceptance of finished buildings and act of acceptance is signed by share accumulation cooperative.
For 100% payment when sale-purchase agreement is signed.
For less than 100% payment when preliminary agreement and act of acceptance is signed by client.
Sales after commissioning

(2) calculation based on EMLS index (secondary market) as of December for preceding 3 years
(3) calculation based on IRN housing price index as of December for preceding 3 years
• Current land bank is sufficient for Etalon Group’s construction programme, no
need to acquire land plots in the medium term
• More diversified product offering based on a higher number of projects and a
growing share on lucrative MMA market
• Growing contribution from the Company's sales network in Russia's resource-rich
regions
39
Etalon Group is well positioned to continue creating shareholder value in a more complicated macro environment
2008 2014
Land bank (unsold NSA) bop, ths sqm 1,280 3,442
Number of projects in construction
programme, eop 8 15
Share of Moscow Metropolitan Area in
total contract sales, % - 23%
Share of regional sales, % 21.0% 34.4%(1)
Total net debt (net cash), mln RUB 4,358 636
- % FX denominated debt 88.5% 8%
- % of debt borrowed outside of Russia 46.4% -
- Net debt / EBITDA 1.37x 0.06x
Credit rating (Standard & Poor’s) B B+
Residential real estate price CAGR (previous 3 years), %:
- St. Petersburg market(2) 41% 6%
- Moscow market(3) 34% 7%
Inventory of completed and available
for sale apartments eop, ths sqm 25 220
Share of mortgage sales 8% 22%(1)
Qualitative criteria
- 3 years of public
debt history
- Partnership with
Baring Vostok
Capital Partners
- Public listing on
LSE
- Transparent
corporate
governance
- Dividend policy
- 9 years of public
debt history
*Sources: Land bank valuation report by JLL as of 31.12.2013 and 31.12.2014, management accounts, IPO Prospectus, IFRS financial statements for 2008, 1H2014,
and 12M 2014
(1) for FY 2014
• The strongest balance sheet in the industry
• Low level of FX-denominated debt fully hedged by FX-denominated
deposits
• Currently no debt borrowed outside of Russia
• Etalon Group maintains its B+ credit rating from Standard & Poor's
despite Russia's sovereign credit rating downgrade in 2014
• Moderate share of mortgage sales, well below that of other public peers
• Reasonable price growth during preceding 3 years, no signs of a
bubble
• Comprehensive inventory of completed apartments in diverse locations is
attractive to clients during macroeconomic instability. It also enables the
Company generate revenue without incurring additional costs
• Transparent public company with long and successful track record of
cooperation with capital markets

Selected key projects
Construction services
Description • Etalon Group is a leader in industrial construction in the North-West region of Russia with superb track record throughout its history
Track-record •We have contributed to 24 milestone projects
•Heat & power station, two hotels, four car assembly plants, shipyards, machinery plant, fitness and sports centre etc.
Strategy • 3 projects under way
• Etalon Group plans to continue developing its industrial construction operations and maintain its share in total business
Diversification benefits
• Ability and expertise to provide quality construction services to well-known international and local companies facilitates Group’s brand development
• Allows to maintain skilled work force during market downturn
40
Toyota Ford GM
Poling and gridding Design & construction (increase of production capacities)
Poling & road infrastructure construction
Nissan Admiralty Shipyards
Infrastructure & site for the finished goods
Construction of workshop & transportation utilities
Full construction cycle
ExpoForum North-West Heat & Power Station
Almazov Medical Complex
Full construction cycle Foundation construction for a cooling tower and main building
Renovation of the existing building and building up two additional floors
Pulkovo customs

Income statement
41
mln RUB 2011 2012 2013 2014
Revenue 22,741 26,894 39,921 51,481
Cost of sales (11,888) (17,494) (27,553) (35,685)
Gross profit 10,853 9,400 12,368 15,796
General and administrative expenses (2,328) (2,324) (3,157) (4,178)
Selling expenses (854) (958) (1,023) (1,474)
Other expenses, net (27) (209) (40) (913)
Results from operating activities 7,644 5,909 8,148 9,231
Finance income 1,441 749 691 1,717
Finance costs (60) (132) (342) (553)
Net finance income 1,381 617 349 1,164
Profit before income tax 9,025 6,526 8,497 10,395
Income tax expense (1,585) (1,526) (1,833) (2,026)
Profit for the period 7,440 5,000 6,664 8,369
Profit attributable to:
Owners of the Company 7,332 4,979 6,629 8,345
Non-controlling interest 108 21 35 24
Profit for the period 7,440 5,000 6,664 8,369
Source: IFRS financial statements for 2011, 2012, 2013, 2014
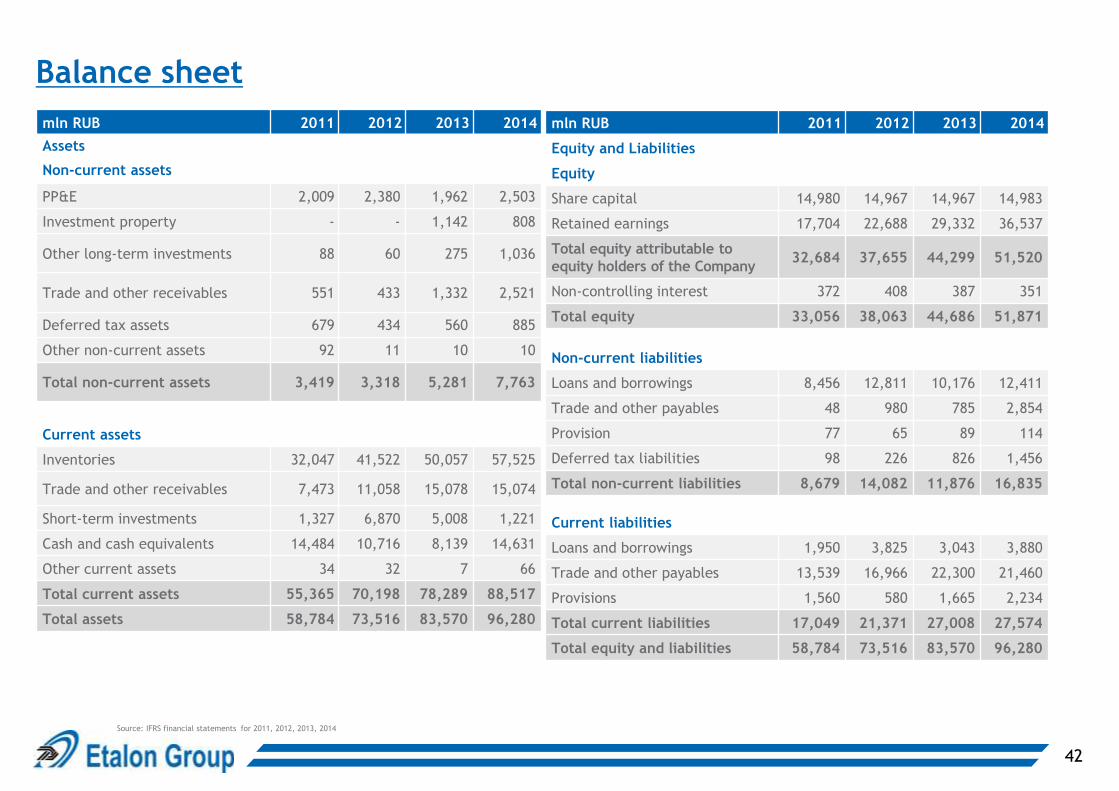
Balance sheet
mln RUB 2011 2012 2013 2014
Assets
Non-current assets
PP&E 2,009 2,380 1,962 2,503
Investment property - - 1,142 808
Other long-term investments 88 60 275 1,036
Trade and other receivables 551 433 1,332 2,521
Deferred tax assets 679 434 560 885
Other non-current assets 92 11 10 10
Total non-current assets 3,419 3,318 5,281 7,763
Current assets
Inventories 32,047 41,522 50,057 57,525
Trade and other receivables 7,473 11,058 15,078 15,074
Short-term investments 1,327 6,870 5,008 1,221
Cash and cash equivalents 14,484 10,716 8,139 14,631
Other current assets 34 32 7 66
Total current assets 55,365 70,198 78,289 88,517
Total assets 58,784 73,516 83,570 96,280
mln RUB 2011 2012 2013 2014
Equity and Liabilities
Equity
Share capital 14,980 14,967 14,967 14,983
Retained earnings 17,704 22,688 29,332 36,537
Total equity attributable to
equity holders of the Company 32,684 37,655 44,299 51,520
Non-controlling interest 372 408 387 351
Total equity 33,056 38,063 44,686 51,871
Non-current liabilities
Loans and borrowings 8,456 12,811 10,176 12,411
Trade and other payables 48 980 785 2,854
Provision 77 65 89 114
Deferred tax liabilities 98 226 826 1,456
Total non-current liabilities 8,679 14,082 11,876 16,835
Current liabilities
Loans and borrowings 1,950 3,825 3,043 3,880
Trade and other payables 13,539 16,966 22,300 21,460
Provisions 1,560 580 1,665 2,234
Total current liabilities 17,049 21,371 27,008 27,574
Total equity and liabilities 58,784 73,516 83,570 96,280
42
Source: IFRS financial statements for 2011, 2012, 2013, 2014

Cashflow statement
mln RUB 2011 2012 2013 2014
Operating Activities
Profit for the period 7,440 5,000 6,664 8,369
Adjustments for
Depreciation 265 417 343 417
Gain on disposal of PP&E (92) (49) (15) (52)
Loss on disposal of subsidiaries 1 28 - -
Gain on disposal of equity
accounted investees (24) - - -
Impairment loss on investment
property - - - 280
Impairment loss on inventories - - - 466
Finance income, net (1,425) (544) (337) (1,164)
Income tax expense 1,585 1,526 1,833 2,026
Cash from operating activities
before changes in working capital 7,750 6,378 8,488 10,342
Change in inventories (5,308) (7,633) (7,837) (6,890)
Change in accounts receivable (2,893) (3,024) (5,080) (1,427)
Change in accounts payable (818) 4,074 4,880 1,184
Change in provisions 367 (992) 1,109 594
Change in other currents assets 24 3 25 (59)
Income tax paid (1,897) (1,833) (907) (1,645)
Interest paid (1,098) (1,097) (1,724) (1,588)
Net cash from/(used in) operating
activities (3,873) (4,124) (1,046) 511
mln RUB 2011 2012 2013 2014
Investing Activities
Proceeds from disposal of non-current assets 117 71 15 66
Interest received 140 552 611 823
Acquisition of PP&E (726) (844) (431) (653)
Loans given (253) (371) (55) (178)
Loans repaid 234 363 85 174
Acquisition of subsidiaries, net of cash
acquired - - 10 -
Disposal of subsidiaries, net of cash disposed
of (17) (8) (20) 7
(Acquisition)/disposal of other investments (1,027) (5,506) 1,606 3,038
Net cash used in investing activities (1,532) (5,743) 1,821 3,277
Financing activities
Proceeds from IPO 13,487 - - -
Acquisition of non-controlling interest (3) (3) (10) (83)
Proceeds from disposal of non-controlling
interest 24 - - -
Proceeds from borrowings 6,353 12,140 5,937 10,763
Repayments of borrowings (4,821) (5,552) (9,668) (8,498)
Acquisition of own shares (459) (13) - 16
Dividends paid - - - (1,124)
Net cash from/(used in) financing activities 14,581 6,572 (3,741) 1,074
Net increase/(decrease) in cash and cash
equivalents 9,176 (3,295) (2,966) 4,862
Effect of FX rate fluctuations 1,672 (473) 389 1,630
Cash & cash equivalents at the end of the
period 14,484 10,716 8,139 14,631
43
Source: IFRS financial statements for 2011, 2012, 2013, 2014

mln RUB 2011 2012 2013 2014
Comprehensive income 7,440 5,000 6,664 8,369
Income tax expense 1,585 1,526 1,833 2,026
Interest expense on loans and finance leases 10 7 233 295
Net foreign exchange loss - 125 109 -
Interest income on bank deposits (140) (543) (583) (729)
Interest income on loans and receivables (6) (9) (28) (94)
Interest income on promissory notes - - - -
Gain on repurchase of CLNs - - - -
Net foreign exchange gain (1,168) - - (814)
Bank fees and commissions 46 67 80 117
Interest in COS 169 341 779 1,024
Depreciation 265 417 343 417
EBITDA 8,201 6,931 9,430 10,611
44
EBITDA calculation
2011 2012 2013 2014
Depreciation to COGS (Note 13 PP&E) 239 385 292 271
Depreciation to selling expenses (Note 13 PP&E) 1 1 1 4
Depreciation to G&A expenses (Note 13 PP&E) 25 31 39 94
Depreciation to Investment property (Note 14 Investment
property) - - 11 48

45
Working capital calculation
Working capital calculation
mln RUB 2011 2012 2013 2014
Total inventory 32,047 41,522 50,057 57,525
Current part
+ Trade and other receivables 7,473 11,058 15,078 15,074
- Trade and other payables 13,539 16,966 22,300 21,460
- Provisions 1,560 580 1,665 2,234
Non-current part
+ Trade and other receivables 551 433 1,332 2,521
- Trade and other payables 48 980 785 2,854
- Provisions 77 65 89 114
Adjustments
- Cumulative borrowing costs capitalized during the period
(Note 11 Finance income and finance costs) 1,482 2,725 4,092 5,416
+ Cumulative borrowing costs that have been included into the
cost of sales (Note 11 Finance income and finance costs) 169 510 1,289 2,313
-Income tax receivable (Note 18 Trade and other receivables) 72 310 103 159
+Income tax payable (Note 25 Trade and other payables) 447 7 248 380
Working capital 23,909 31,904 38,970 45,576

46
FCF calculation
mln RUB 2011 2012 2013 2014
Comprehensive income 7,440 5,000 6,664 8,369
Adjustment for:
Depreciation 265 417 343 417
Gain on disposal of PP&E (92) (49) (15) (52)
Impairment loss on investment property - - - 280
Impairment loss on inventories - - - 466
Loss on disposal of subsidiaries 1 28 - -
Gain on disposal of equity accounted investees (24) - - -
Finance income, net (1,425) (544) (337) (1,164)
Income tax expense 1,585 1,526 1,833 2,026
Income tax paid (1,897) (1,833) (907) (1,645)
Interest paid (1,098) (1,097) (1,724) (1,588)
(Increase)/Decrease in working capital (8,628) (7,572) (6,903) (6,598)
(Increase)/Decrease in invested capital (609) (773) (416) (587)
FCF (4,482) (4,897) (1,462) (76)
(Increase)/Decrease in working capital based on CF statement 2011 2012 2013 2014
Change in inventories (5,308) (7,633) (7,837) (6,890)
Change in accounts receivable (2,893) (3,024) (5,080) (1,427)
Change in accounts payable (818) 4,074 4,880 1,184
Change in provisions 367 (992) 1,109 594
Change in other current assets 24 3 25 (59)
Working capital change (8,628) (7,572) (6,903) (6,598)
(Increase)/Decrease in invested capital based on CF statement 2011 2012 2013 2014
Acquisition of PP&E (726) (844) (431) (653)
Proceeds from disposal of non-current assets 117 71 15 66
Invested capital change (609) (773) (416) (587)

Etalon Group Limited
Redwood House
St Julian’s Avenue
St Peter Port
Guernsey
GY1 1WA
Tel: +44 (0)20 8123 1328
Fax: +44 (0)20 8123 1328
Email: [email protected]
47