Embed Size (px)
Citation preview
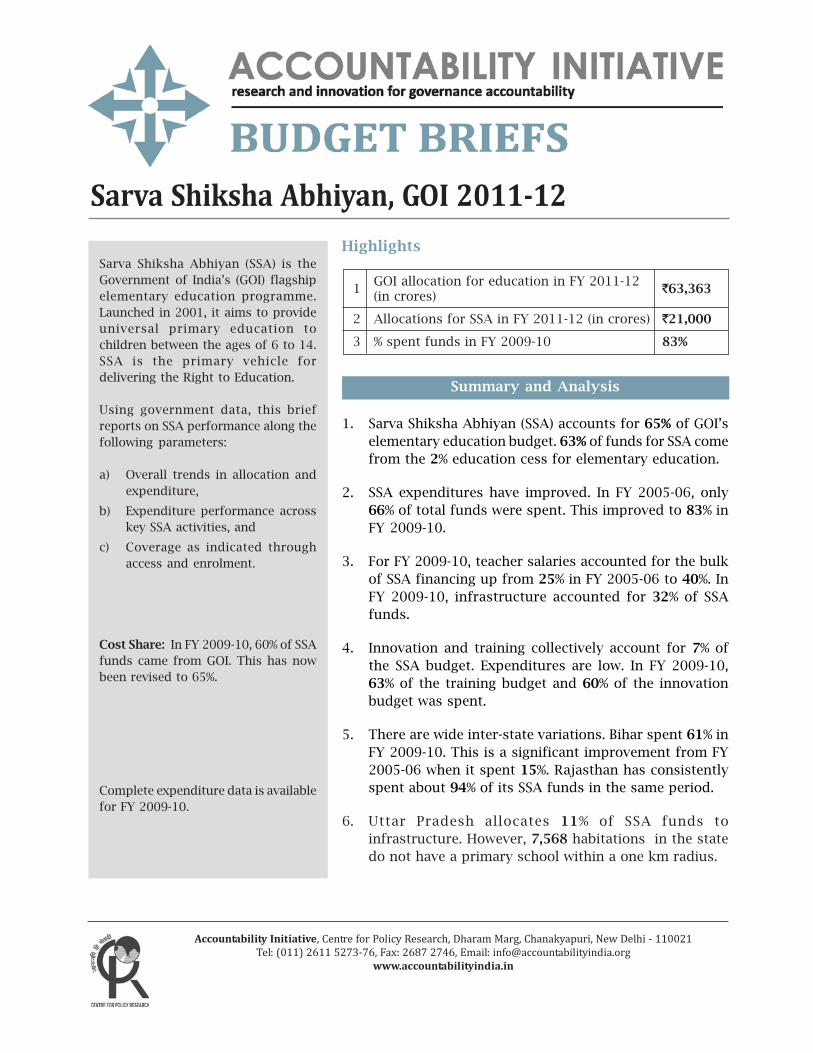
Sarva Shiksha Abhiyan, GOI 2011-12
Sarva Shiksha Abhiyan (SSA) is the
Government of India’s (GOI) flagship
elementary education programme.
Launched in 2001, it aims to provide
universal primary education to
children between the ages of 6 to 14.
SSA is the primary vehicle for
delivering the Right to Education.
Using government data, this brief
reports on SSA performance along the
following parameters:
a) Overall trends in allocation and
expenditure,
b) Expenditure performance across
key SSA activities, and
c) Coverage as indicated through
access and enrolment.
Cost Share: In FY 2009-10, 60% of SSA
funds came from GOI. This has now
been revised to 65%.
Complete expenditure data is available
for FY 2009-10.
Highlights
1GOI allocation for education in FY 2011-12
`63,363(in crores)
2 Allocations for SSA in FY 2011-12 (in crores) `21,000
3 % spent funds in FY 2009-10 83%
Accountability Initiative, Centre for Policy Research, Dharam Marg, Chanakyapuri, New Delhi - 110021
Tel: (011) 2611 5273-76, Fax: 2687 2746, Email: [email protected]
www.accountabilityindia.in
Summary and Analysis
1. Sarva Shiksha Abhiyan (SSA) accounts for 65% of GOI’s
elementary education budget. 63% of funds for SSA come
from the 2% education cess for elementary education.
2. SSA expenditures have improved. In FY 2005-06, only
66% of total funds were spent. This improved to 83% in
FY 2009-10.
3. For FY 2009-10, teacher salaries accounted for the bulk
of SSA financing up from 25% in FY 2005-06 to 40%. In
FY 2009-10, infrastructure accounted for 32% of SSA
funds.
4. Innovation and training collectively account for 7% of
the SSA budget. Expenditures are low. In FY 2009-10,
63% of the training budget and 60% of the innovation
budget was spent.
5. There are wide inter-state variations. Bihar spent 61% in
FY 2009-10. This is a significant improvement from FY
2005-06 when it spent 15%. Rajasthan has consistently
spent about 94% of its SSA funds in the same period.
6. Uttar Pradesh allocates 11% of SSA funds to
infrastructure. However, 7,568 habitations in the state
do not have a primary school within a one km radius.
Budget Briefs-Sarva Shiksha Abhiyan Vol 3 Issue 2 Accountability Initiative
- 2 - February, 2011
Trends in Overall Allocations and
Expenditures
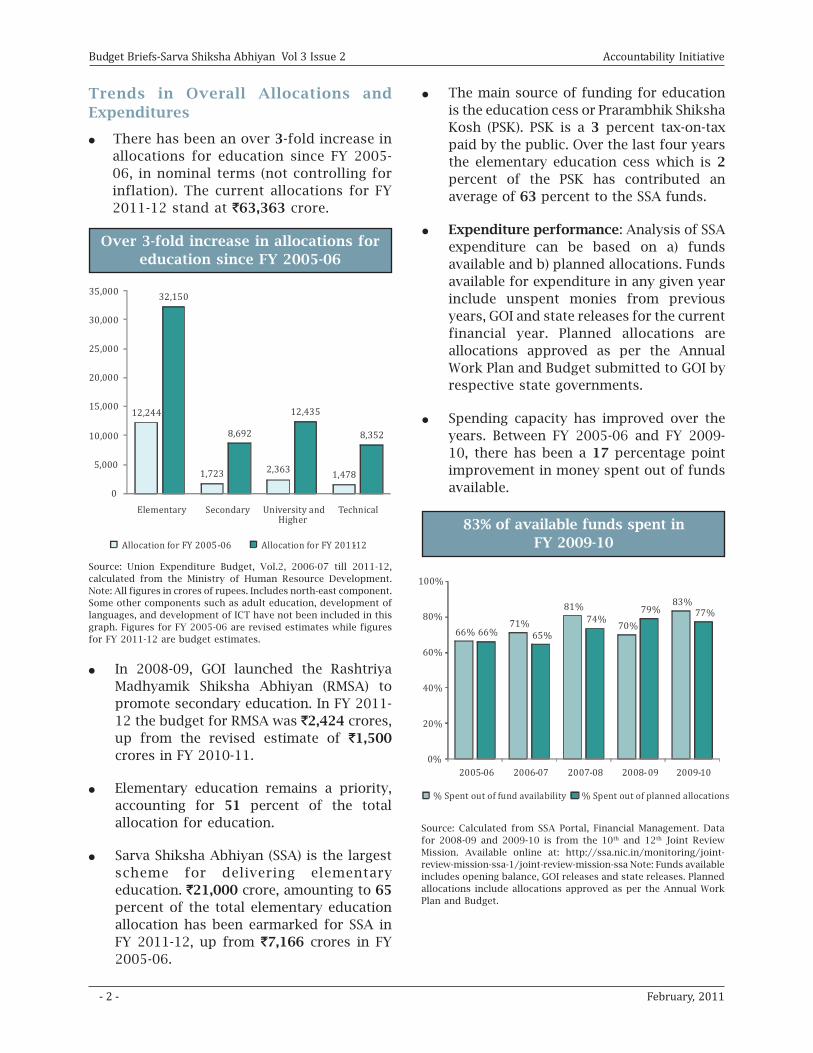
● There has been an over 3-fold increase in
allocations for education since FY 2005-
06, in nominal terms (not controlling for
inflation). The current allocations for FY
2011-12 stand at `63,363 crore.
Over 3-fold increase in allocations for
education since FY 2005-06
● The main source of funding for education
is the education cess or Prarambhik Shiksha
Kosh (PSK). PSK is a 3 percent tax-on-tax
paid by the public. Over the last four years
the elementary education cess which is 2
percent of the PSK has contributed an
average of 63 percent to the SSA funds.
● Expenditure performance: Analysis of SSA
expenditure can be based on a) funds
available and b) planned allocations. Funds
available for expenditure in any given year
include unspent monies from previous
years, GOI and state releases for the current
financial year. Planned allocations are
allocations approved as per the Annual
Work Plan and Budget submitted to GOI by
respective state governments.
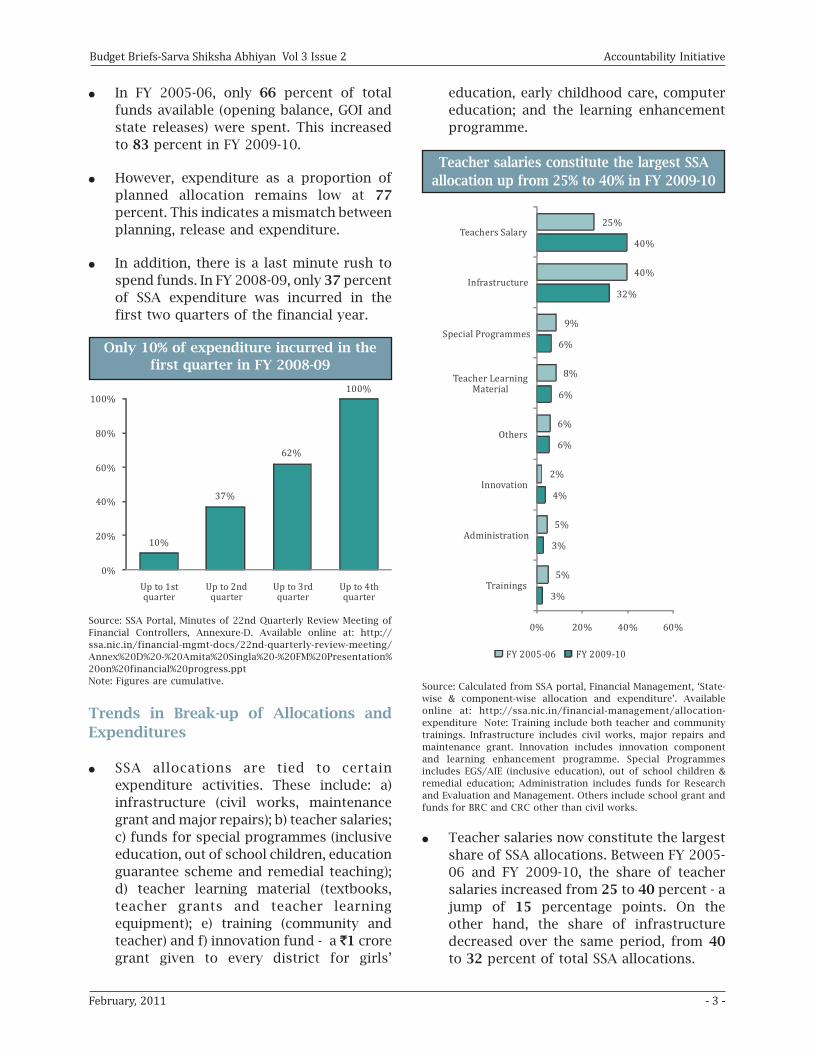
● Spending capacity has improved over the
years. Between FY 2005-06 and FY 2009-
10, there has been a 17 percentage point
improvement in money spent out of funds
available.
83% of available funds spent in
FY 2009-10
Source: Union Expenditure Budget, Vol.2, 2006-07 till 2011-12,
calculated from the Ministry of Human Resource Development.
Note: All figures in crores of rupees. Includes north-east component.
Some other components such as adult education, development of
languages, and development of ICT have not been included in this
graph. Figures for FY 2005-06 are revised estimates while figures
for FY 2011-12 are budget estimates.
● In 2008-09, GOI launched the Rashtriya
Madhyamik Shiksha Abhiyan (RMSA) to
promote secondary education. In FY 2011-
12 the budget for RMSA was `2,424 crores,
up from the revised estimate of `1,500
crores in FY 2010-11.
● Elementary education remains a priority,
accounting for 51 percent of the total
allocation for education.
● Sarva Shiksha Abhiyan (SSA) is the largest
scheme for delivering elementary
education. `21,000 crore, amounting to 65
percent of the total elementary education
allocation has been earmarked for SSA in
FY 2011-12, up from `7,166 crores in FY
2005-06.
Source: Calculated from SSA Portal, Financial Management. Data
for 2008-09 and 2009-10 is from the 10th and 12th Joint Review
Mission. Available online at: http://ssa.nic.in/monitoring/joint-
review-mission-ssa-1/joint-review-mission-ssa Note: Funds available
includes opening balance, GOI releases and state releases. Planned
allocations include allocations approved as per the Annual Work
Plan and Budget.
12,244
1,723 2,3631,478
32,150
8,692
12,435
8,352
0
5,000
10,000
15,000
20,000
25,000
30,000
35,000
Elementary Secondary University and Higher
Technical
Allocation for FY 2005-06 Allocation for FY 2011-12
66%71%
81%
70%
83%
66% 65%
74%79% 77%
0%
20%
40%
60%
80%
100%
2005-06 2006-07 2007-08 2008-09 2009-10
% Spent out of fund availability % Spent out of planned allocations
Budget Briefs-Sarva Shiksha Abhiyan Vol 3 Issue 2 Accountability Initiative
February, 2011 - 3 -
● In FY 2005-06, only 66 percent of total
funds available (opening balance, GOI and
state releases) were spent. This increased
to 83 percent in FY 2009-10.
● However, expenditure as a proportion of
planned allocation remains low at 77
percent. This indicates a mismatch between
planning, release and expenditure.
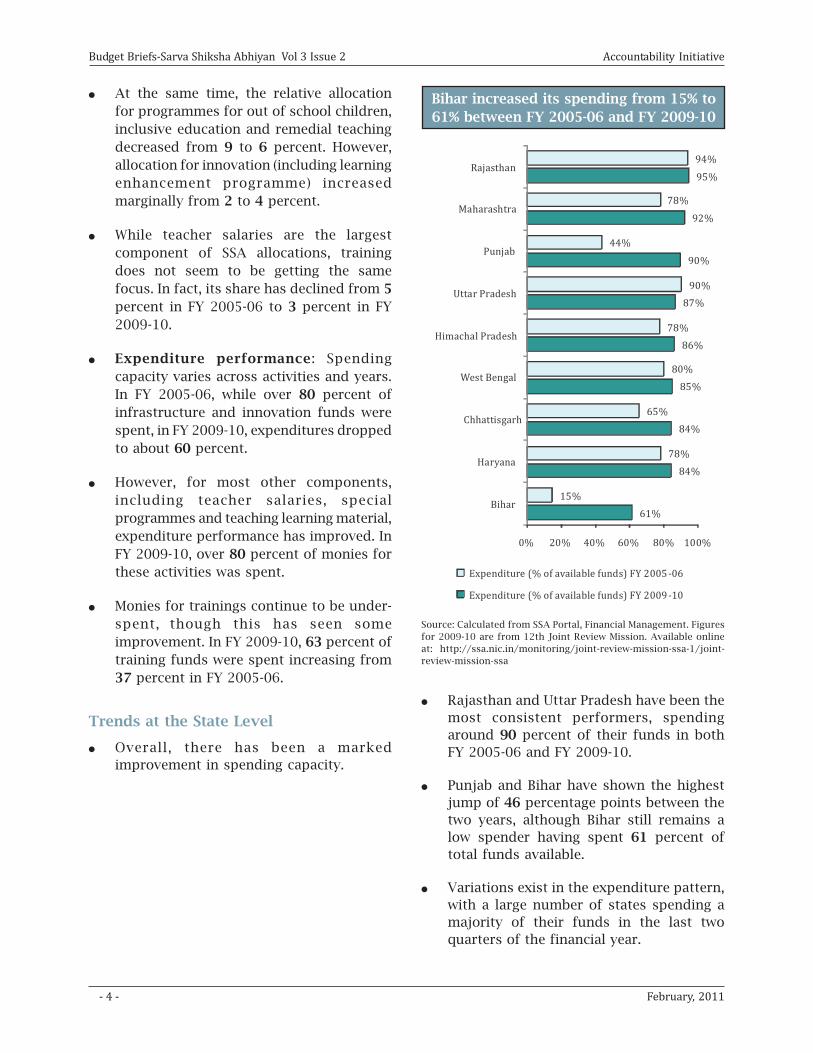
● In addition, there is a last minute rush to
spend funds. In FY 2008-09, only 37 percent
of SSA expenditure was incurred in the
first two quarters of the financial year.
Only 10% of expenditure incurred in the
first quarter in FY 2008-09
Source: SSA Portal, Minutes of 22nd Quarterly Review Meeting of
Financial Controllers, Annexure-D. Available online at: http://
ssa.nic.in/financial-mgmt-docs/22nd-quarterly-review-meeting/
Annex%20D%20-%20Amita%20Singla%20-%20FM%20Presentation%
20on%20financial%20progress.ppt
Note: Figures are cumulative.
Trends in Break-up of Allocations and
Expenditures
● SSA allocations are tied to certain
expenditure activities. These include: a)
infrastructure (civil works, maintenance
grant and major repairs); b) teacher salaries;
c) funds for special programmes (inclusive
education, out of school children, education
guarantee scheme and remedial teaching);
d) teacher learning material (textbooks,
teacher grants and teacher learning
equipment); e) training (community and
teacher) and f) innovation fund - a `1 crore
grant given to every district for girls’
education, early childhood care, computer
education; and the learning enhancement
programme.
Teacher salaries constitute the largest SSA
allocation up from 25% to 40% in FY 2009-10
Source: Calculated from SSA portal, Financial Management, ‘State-
wise & component-wise allocation and expenditure’. Available
online at: http://ssa.nic.in/financial-management/allocation-
expenditure Note: Training include both teacher and community
trainings. Infrastructure includes civil works, major repairs and
maintenance grant. Innovation includes innovation component
and learning enhancement programme. Special Programmes
includes EGS/AIE (inclusive education), out of school children &
remedial education; Administration includes funds for Research
and Evaluation and Management. Others include school grant and
funds for BRC and CRC other than civil works.
● Teacher salaries now constitute the largest
share of SSA allocations. Between FY 2005-
06 and FY 2009-10, the share of teacher
salaries increased from 25 to 40 percent - a
jump of 15 percentage points. On the
other hand, the share of infrastructure
decreased over the same period, from 40
to 32 percent of total SSA allocations.
10%
37%
62%
100%
0%
20%
40%
60%
80%
100%
Up to 1st quarter
Up to 2nd quarter
Up to 3rd quarter
Up to 4th quarter 3%
3%
4%
6%
6%
6%
32%
40%
5%
5%
2%
6%
8%
9%
40%
25%
0% 20% 40% 60%
Trainings
Administration
Innovation
Others
Teacher Learning Material
Special Programmes
Infrastructure
Teachers Salary
FY 2005-06 FY 2009-10
Budget Briefs-Sarva Shiksha Abhiyan Vol 3 Issue 2 Accountability Initiative
- 4 - February, 2011
● At the same time, the relative allocation
for programmes for out of school children,
inclusive education and remedial teaching
decreased from 9 to 6 percent. However,
allocation for innovation (including learning
enhancement programme) increased
marginally from 2 to 4 percent.
● While teacher salaries are the largest
component of SSA allocations, training
does not seem to be getting the same
focus. In fact, its share has declined from 5
percent in FY 2005-06 to 3 percent in FY
2009-10.
● Expenditure performance: Spending
capacity varies across activities and years.
In FY 2005-06, while over 80 percent of
infrastructure and innovation funds were
spent, in FY 2009-10, expenditures dropped
to about 60 percent.
● However, for most other components,
including teacher salaries, special
programmes and teaching learning material,
expenditure performance has improved. In
FY 2009-10, over 80 percent of monies for
these activities was spent.
● Monies for trainings continue to be under-
spent, though this has seen some
improvement. In FY 2009-10, 63 percent of
training funds were spent increasing from
37 percent in FY 2005-06.
Trends at the State Level
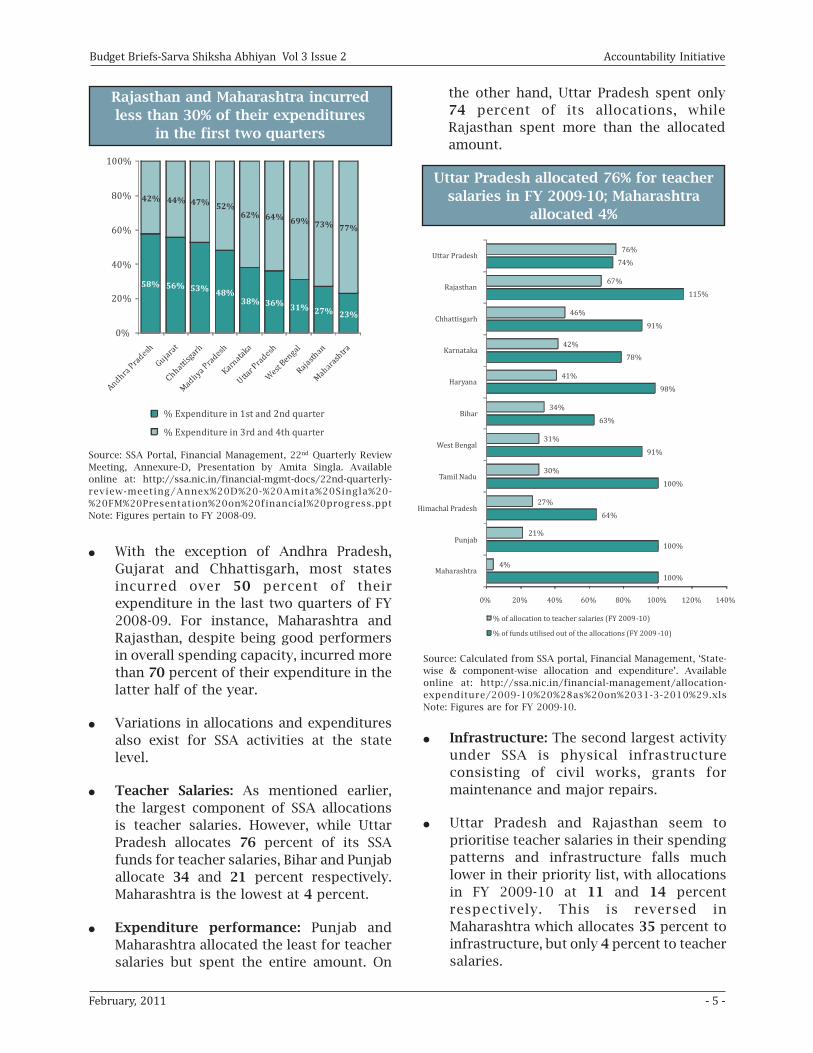
● Overall, there has been a marked
improvement in spending capacity.
Bihar increased its spending from 15% to
61% between FY 2005-06 and FY 2009-10
Source: Calculated from SSA Portal, Financial Management. Figures
for 2009-10 are from 12th Joint Review Mission. Available online
at: http://ssa.nic.in/monitoring/joint-review-mission-ssa-1/joint-
review-mission-ssa
● Rajasthan and Uttar Pradesh have been the
most consistent performers, spending
around 90 percent of their funds in both
FY 2005-06 and FY 2009-10.
● Punjab and Bihar have shown the highest
jump of 46 percentage points between the
two years, although Bihar still remains a
low spender having spent 61 percent of
total funds available.
● Variations exist in the expenditure pattern,
with a large number of states spending a
majority of their funds in the last two
quarters of the financial year.
61%
84%
84%
85%
86%
87%
90%
92%
95%
15%
78%
65%
80%
78%
90%
44%
78%
94%
0% 20% 40% 60% 80% 100%
Bihar
Haryana
Chhattisgarh
West Bengal
Himachal Pradesh
Uttar Pradesh
Punjab
Maharashtra
Rajasthan
Expenditure (% of available funds) FY 2005-06
Expenditure (% of available funds) FY 2009-10
Budget Briefs-Sarva Shiksha Abhiyan Vol 3 Issue 2 Accountability Initiative
February, 2011 - 5 -
Rajasthan and Maharashtra incurred
less than 30% of their expenditures
in the first two quarters
the other hand, Uttar Pradesh spent only
74 percent of its allocations, while
Rajasthan spent more than the allocated
amount.
Uttar Pradesh allocated 76% for teacher
salaries in FY 2009-10; Maharashtra
allocated 4%
Source: SSA Portal, Financial Management, 22nd Quarterly Review
Meeting, Annexure-D, Presentation by Amita Singla. Available
online at: http://ssa.nic.in/financial-mgmt-docs/22nd-quarterly-
review-meeting/Annex%20D%20-%20Amita%20Singla%20-
%20FM%20Presentation%20on%20financial%20progress.ppt
Note: Figures pertain to FY 2008-09.
● With the exception of Andhra Pradesh,
Gujarat and Chhattisgarh, most states
incurred over 50 percent of their
expenditure in the last two quarters of FY
2008-09. For instance, Maharashtra and
Rajasthan, despite being good performers
in overall spending capacity, incurred more
than 70 percent of their expenditure in the
latter half of the year.
● Variations in allocations and expenditures
also exist for SSA activities at the state
level.
● Teacher Salaries: As mentioned earlier,
the largest component of SSA allocations
is teacher salaries. However, while Uttar
Pradesh allocates 76 percent of its SSA
funds for teacher salaries, Bihar and Punjab
allocate 34 and 21 percent respectively.
Maharashtra is the lowest at 4 percent.
● Expenditure performance: Punjab and
Maharashtra allocated the least for teacher
salaries but spent the entire amount. On
Source: Calculated from SSA portal, Financial Management, ‘State-
wise & component-wise allocation and expenditure’. Available
online at: http://ssa.nic.in/financial-management/allocation-
expenditure/2009-10%20%28as%20on%2031-3-2010%29.xls
Note: Figures are for FY 2009-10.
● Infrastructure: The second largest activity
under SSA is physical infrastructure
consisting of civil works, grants for
maintenance and major repairs.
● Uttar Pradesh and Rajasthan seem to
prioritise teacher salaries in their spending
patterns and infrastructure falls much
lower in their priority list, with allocations
in FY 2009-10 at 11 and 14 percent
respectively. This is reversed in
Maharashtra which allocates 35 percent to
infrastructure, but only 4 percent to teacher
salaries.
100%
100%
64%
100%
91%
63%
98%
78%
91%
115%
74%
4%
21%
27%
30%
31%
34%
41%
42%
46%
67%
76%
0% 20% 40% 60% 80% 100% 120% 140%
Maharashtra
Punjab
Himachal Pradesh
Tamil Nadu
West Bengal
Bihar
Haryana
Karnataka
Chhattisgarh
Rajasthan
Uttar Pradesh
% of allocation to teacher salaries (FY 2009-10)
% of funds utilised out of the allocations (FY 2009 -10)
58% 56% 53%48%
38% 36%31%
27%23%
42% 44% 47%52%
62% 64%69%
73%77%
0%
20%
40%
60%
80%
100%
% Expenditure in 1st and 2nd quarter
% Expenditure in 3rd and 4th quarter
Budget Briefs-Sarva Shiksha Abhiyan Vol 3 Issue 2 Accountability Initiative
- 6 - February, 2011
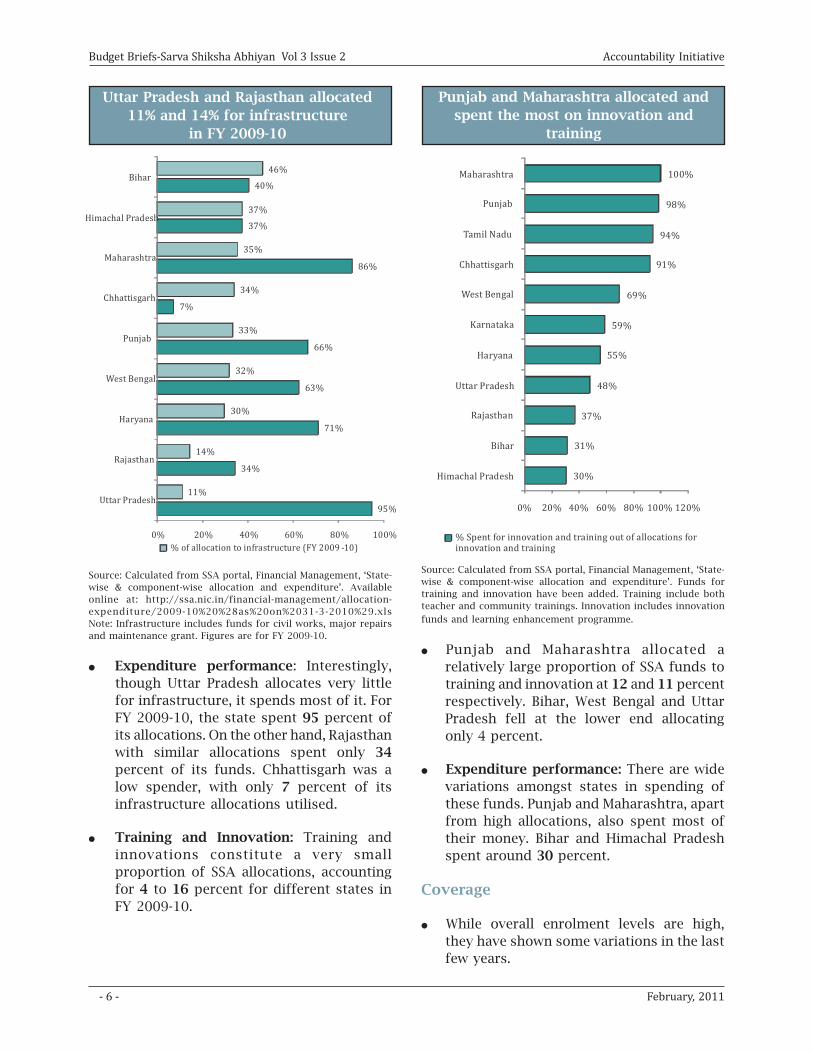
Uttar Pradesh and Rajasthan allocated
11% and 14% for infrastructure
in FY 2009-10
Punjab and Maharashtra allocated and
spent the most on innovation and
training
Source: Calculated from SSA portal, Financial Management, ‘State-
wise & component-wise allocation and expenditure’. Available
online at: http://ssa.nic.in/financial-management/allocation-
expenditure/2009-10%20%28as%20on%2031-3-2010%29.xls
Note: Infrastructure includes funds for civil works, major repairs
and maintenance grant. Figures are for FY 2009-10.
● Expenditure performance: Interestingly,
though Uttar Pradesh allocates very little
for infrastructure, it spends most of it. For
FY 2009-10, the state spent 95 percent of
its allocations. On the other hand, Rajasthan
with similar allocations spent only 34
percent of its funds. Chhattisgarh was a
low spender, with only 7 percent of its
infrastructure allocations utilised.
● Training and Innovation: Training and
innovations constitute a very small
proportion of SSA allocations, accounting
for 4 to 16 percent for different states in
FY 2009-10.
Source: Calculated from SSA portal, Financial Management, ‘State-
wise & component-wise allocation and expenditure’. Funds for
training and innovation have been added. Training include both
teacher and community trainings. Innovation includes innovation
funds and learning enhancement programme.
● Punjab and Maharashtra allocated a
relatively large proportion of SSA funds to
training and innovation at 12 and 11 percent
respectively. Bihar, West Bengal and Uttar
Pradesh fell at the lower end allocating
only 4 percent.
● Expenditure performance: There are wide
variations amongst states in spending of
these funds. Punjab and Maharashtra, apart
from high allocations, also spent most of
their money. Bihar and Himachal Pradesh
spent around 30 percent.
Coverage
● While overall enrolment levels are high,
they have shown some variations in the last
few years.
95%
34%
71%
63%
66%
7%
86%
37%
40%
11%
14%
30%
32%
33%
34%
35%
37%
46%
0% 20% 40% 60% 80% 100%
Uttar Pradesh
Rajasthan
Haryana
West Bengal
Punjab
Chhattisgarh
Maharashtra
Himachal Pradesh
Bihar
% of allocation to infrastructure (FY 2009 -10)
30%
31%
37%
48%
55%
59%
69%
91%
94%
98%
100%
0% 20% 40% 60% 80% 100% 120%
Himachal Pradesh
Bihar
Rajasthan
Uttar Pradesh
Haryana
Karnataka
West Bengal
Chhattisgarh
Tamil Nadu
Punjab
Maharashtra
% Spent for innovation and training out of allocations for innovation and training
Budget Briefs-Sarva Shiksha Abhiyan Vol 3 Issue 2 Accountability Initiative
February, 2011 - 7 -
Source: DISE Flash statistics 2007 and 2009. Available online
at: www.dise.in
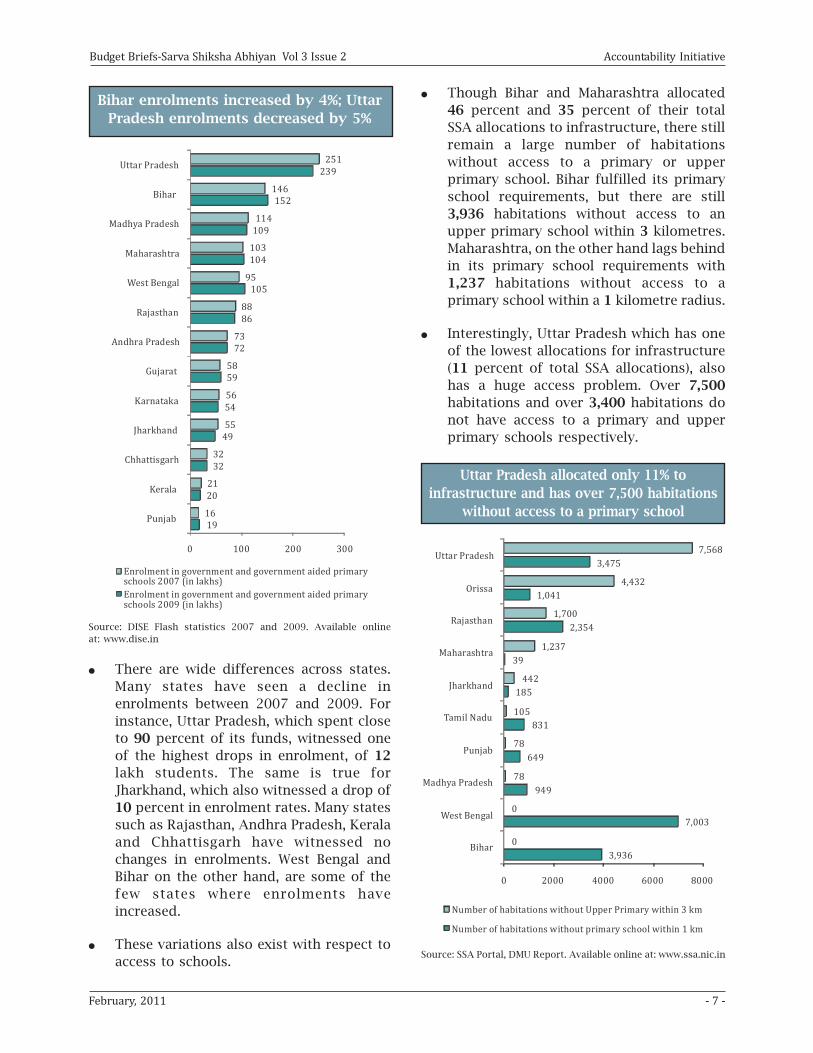
● There are wide differences across states.
Many states have seen a decline in
enrolments between 2007 and 2009. For
instance, Uttar Pradesh, which spent close
to 90 percent of its funds, witnessed one
of the highest drops in enrolment, of 12
lakh students. The same is true for
Jharkhand, which also witnessed a drop of
10 percent in enrolment rates. Many states
such as Rajasthan, Andhra Pradesh, Kerala
and Chhattisgarh have witnessed no
changes in enrolments. West Bengal and
Bihar on the other hand, are some of the
few states where enrolments have
increased.
● These variations also exist with respect to
access to schools.
● Though Bihar and Maharashtra allocated
46 percent and 35 percent of their total
SSA allocations to infrastructure, there still
remain a large number of habitations
without access to a primary or upper
primary school. Bihar fulfilled its primary
school requirements, but there are still
3,936 habitations without access to an
upper primary school within 3 kilometres.
Maharashtra, on the other hand lags behind
in its primary school requirements with
1,237 habitations without access to a
primary school within a 1 kilometre radius.
● Interestingly, Uttar Pradesh which has one
of the lowest allocations for infrastructure
(11 percent of total SSA allocations), also
has a huge access problem. Over 7,500
habitations and over 3,400 habitations do
not have access to a primary and upper
primary schools respectively.
Uttar Pradesh allocated only 11% to
infrastructure and has over 7,500 habitations
without access to a primary school
Source: SSA Portal, DMU Report. Available online at: www.ssa.nic.in
Bihar enrolments increased by 4%; Uttar
Pradesh enrolments decreased by 5%
19
20
32
49
54
59
72
86
105
104
109
152
239
16
21
32
55
56
58
73
88
95
103
114
146
251
0 100 200 300
Punjab
Kerala
Chhattisgarh
Jharkhand
Karnataka
Gujarat
Andhra Pradesh
Rajasthan
West Bengal
Maharashtra
Madhya Pradesh
Bihar
Uttar Pradesh
Enrolment in government and government aided primary schools 2007 (in lakhs)
Enrolment in government and government aided primary schools 2009 (in lakhs)
3,936
7,003
949
649
831
185
39
2,354
1,041
3,475
0
0
78
78
105
442
1,237
1,700
4,432
7,568
0 2000 4000 6000 8000
Bihar
West Bengal
Madhya Pradesh
Punjab
Tamil Nadu
Jharkhand
Maharashtra
Rajasthan
Orissa
Uttar Pradesh
Number of habitations without Upper Primary within 3 km
Number of habitations without primary school within 1 km
Budget Briefs-Sarva Shiksha Abhiyan Vol 3 Issue 2 Accountability Initiative
- 8 - February, 2011
Prepared byAvani Kapur, [email protected] & Anirvan Chowdhury [email protected]
Advisory SupportAnit Mukherjee, National Institute of Public Finance and Policy (NIPFP), [email protected]
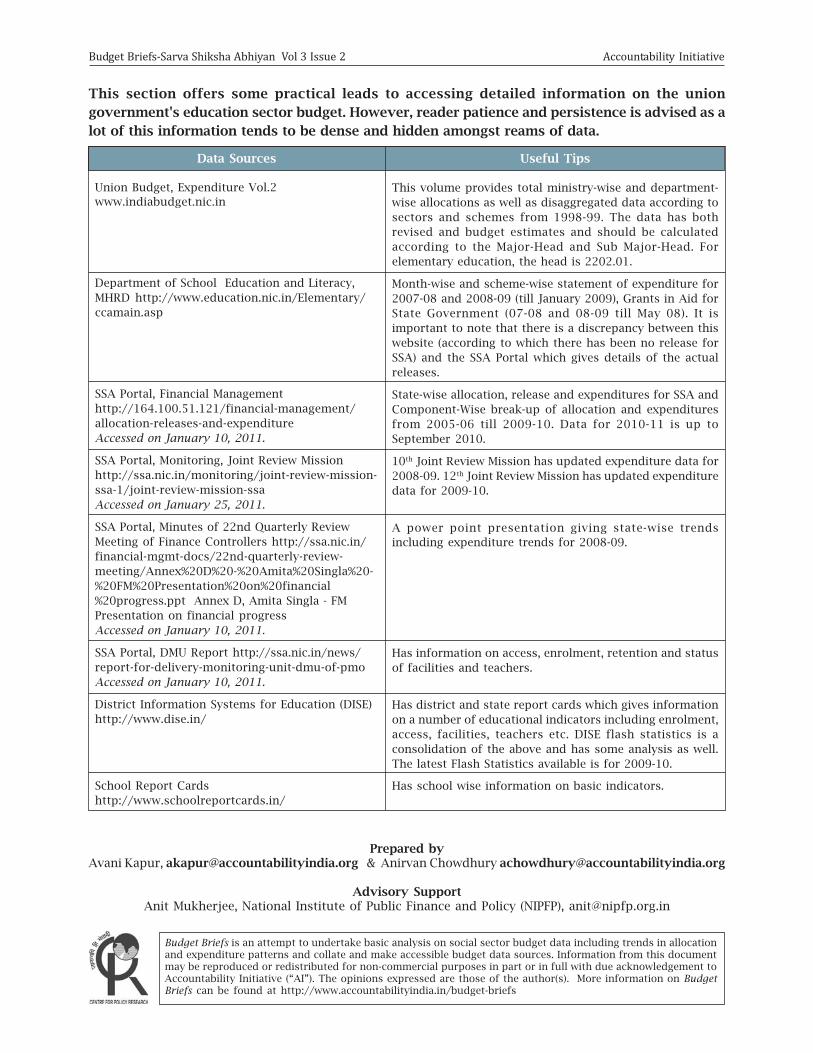
This section offers some practical leads to accessing detailed information on the union
government's education sector budget. However, reader patience and persistence is advised as a
lot of this information tends to be dense and hidden amongst reams of data.
Data Sources
Union Budget, Expenditure Vol.2
www.indiabudget.nic.in
Department of School Education and Literacy,
MHRD http://www.education.nic.in/Elementary/
ccamain.asp
SSA Portal, Financial Management
http://164.100.51.121/financial-management/
allocation-releases-and-expenditure
Accessed on January 10, 2011.
SSA Portal, Monitoring, Joint Review Mission
http://ssa.nic.in/monitoring/joint-review-mission-
ssa-1/joint-review-mission-ssa
Accessed on January 25, 2011.
SSA Portal, Minutes of 22nd Quarterly Review
Meeting of Finance Controllers http://ssa.nic.in/
financial-mgmt-docs/22nd-quarterly-review-
meeting/Annex%20D%20-%20Amita%20Singla%20-
%20FM%20Presentation%20on%20financial
%20progress.ppt Annex D, Amita Singla - FM
Presentation on financial progress
Accessed on January 10, 2011.
SSA Portal, DMU Report http://ssa.nic.in/news/
report-for-delivery-monitoring-unit-dmu-of-pmo
Accessed on January 10, 2011.
District Information Systems for Education (DISE)
http://www.dise.in/
School Report Cards
http://www.schoolreportcards.in/
Useful Tips
This volume provides total ministry-wise and department-
wise allocations as well as disaggregated data according to
sectors and schemes from 1998-99. The data has both
revised and budget estimates and should be calculated
according to the Major-Head and Sub Major-Head. For
elementary education, the head is 2202.01.
Month-wise and scheme-wise statement of expenditure for
2007-08 and 2008-09 (till January 2009), Grants in Aid for
State Government (07-08 and 08-09 till May 08). It is
important to note that there is a discrepancy between this
website (according to which there has been no release for
SSA) and the SSA Portal which gives details of the actual
releases.
State-wise allocation, release and expenditures for SSA and
Component-Wise break-up of allocation and expenditures
from 2005-06 till 2009-10. Data for 2010-11 is up to
September 2010.
10th Joint Review Mission has updated expenditure data for
2008-09. 12th Joint Review Mission has updated expenditure
data for 2009-10.
A power point presentation giving state-wise trends
including expenditure trends for 2008-09.
Has information on access, enrolment, retention and status
of facilities and teachers.
Has district and state report cards which gives information
on a number of educational indicators including enrolment,
access, facilities, teachers etc. DISE flash statistics is a
consolidation of the above and has some analysis as well.
The latest Flash Statistics available is for 2009-10.
Has school wise information on basic indicators.
Budget Briefs is an attempt to undertake basic analysis on social sector budget data including trends in allocationand expenditure patterns and collate and make accessible budget data sources. Information from this documentmay be reproduced or redistributed for non-commercial purposes in part or in full with due acknowledgement toAccountability Initiative (“AI”). The opinions expressed are those of the author(s). More information on BudgetBriefs can be found at http://www.accountabilityindia.in/budget-briefs