Embed Size (px)
Citation preview
KIPP Academy of Opportunity
By February 1 of each year, every school in California is required by state law to publish a School Accountability Report Card (SARC).The SARC contains information aboutthe condit ion and performance of each California public school. Under the Local Control Funding Formula (LCFF) all local educat ional agencies (LEAs) are required toprepare a Local Control Accountability Plan (LCAP), which describes how they intend to meet annual school-specific goals for all pupils, w ith specific act ivit ies to addressstate and local priorit ies. Addit ionally, data reported in an LCAP is to be consistent w ith data reported in the SARC.
For more information about SARC requirements, see the California Department of Educat ion (CDE) SARC Web page at http://www.cde.ca.gov/ta/ac/sa/.
For more information about the LCFF or LCAP, see the CDE LCFF Web page at http://www.cde.ca.gov/fg/aa/lc/.
For addit ional information about the school, parents/guardians, and community members should contact the school principal or the district office.
DataQuest
Internet Access
California Department of Education
School Accountability Report CardReported Using Data from the 2015-16 School Year
DataQuest is an online data tool located on the CDE DataQuest Web page that contains addit ional information about this school and comparisons of the school tothe district and the county. Specifically, DataQuest is a dynamic system that provides reports for accountability (e.g., test data, enrollment, high school graduates,dropouts, course enrollments, staffing, and data regarding English learners).
Internet access is available at public libraries and other locat ions that are publicly accessible (e.g., the California State Library). Access to the Internet at librariesand public locat ions is generally provided on a first-come, first-served basis. Other use restrict ions may include the hours of operat ion, the length of t ime that aworkstat ion may be used (depending on availability), the types of software programs available on a workstat ion, and the ability to print documents.
Tanya Gray, School LeaderPrincipal, KIPP Academy of Opportunity
KIPP Academy of Opportunity is a community school committed to serving students and families in South Los Angeles. Weteach the the academic skills, intellectual habits and character traits necessary for success in high school, college and life.Our school is driven a deep belief that all children deserve an excellent, college-preparatory educat ion. Our students arehard working, eager to learn and demonstrate leadership and cit izenship daily. As a team and family, we are dedicated toconstant growth, pursuit of excellence and building a better future for our students and our society.
KIPP Academy of Opportunity7019 South Van Ness Ave.Los Angeles, CA 90047-1659
Phone: 323-778-0125E-mail: [email protected]
About Our SchoolAbout Our School
ContactContact
Last updated: 1/17/2017
Last updated: 1/17/2017
About This School
Contact Information (School Year 2016-17)Contact Information (School Year 2016-17)
District Contact Information (School Year 2016-17)
District Name Los Angeles Unified
Phone Number (213) 241-1000
Superintendent Michelle King
E-mail Address [email protected]
Web Site www.lausd.net
School Contact Information (School Year 2016-17)
School Name KIPP Academy of Opportunity
Street 7019 South Van Ness Ave.
City, State, Zip Los Angeles, Ca, 90047-1659
Phone Number 323-778-0125
Principal Tanya Gray, School Leader
E-mail Address [email protected]
Web Site www.kippla.org/kao
County-District-School (CDS) Code
19647330101444
School Description and Mission Statement (School Year 2016-17)School Description and Mission Statement (School Year 2016-17)
KAO’s mission is to ensure that students develop the academic skills, character, and intellectual habits necessary to succeed in competit ive high schools, colleges,and the world beyond. Our six guiding principles are: respect, hard work, results, constant learning, determinat ion, and teamwork.
2015-16 SARC - KIPP Academy of Opportunity
Page 2 of 30
Last updated: 1/17/2017
Last updated: 1/20/2017
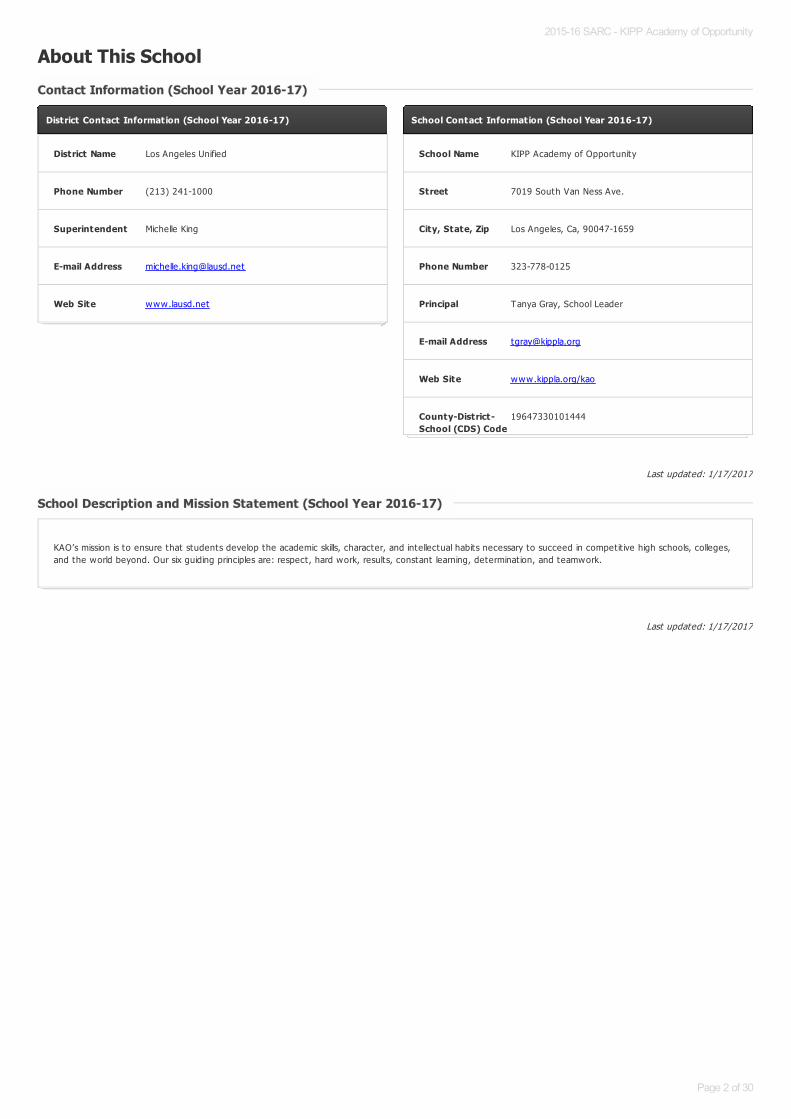
Student Enrollment by Grade Level (School Year 2015-16)Student Enrollment by Grade Level (School Year 2015-16)
Grade Level Number of Students
Grade 5 65
Grade 6 107
Grade 7 100
Grade 8 95
Total Enrollment 367
Grade 5 Grade 6 Grade 7 Grade 80
20
40
60
80
100
120
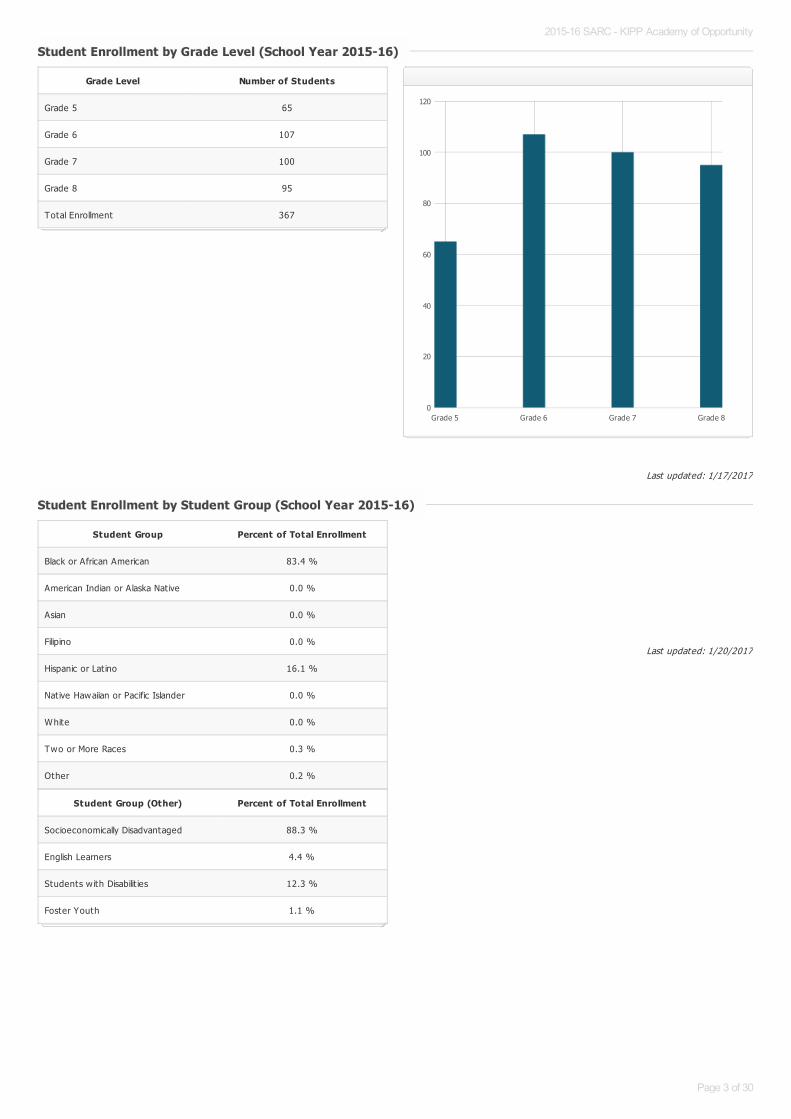
Student Enrollment by Student Group (School Year 2015-16)Student Enrollment by Student Group (School Year 2015-16)
Student Group Percent of Total Enrollment
Black or African American 83.4 %
American Indian or Alaska Nat ive 0.0 %
Asian 0.0 %
Filipino 0.0 %
Hispanic or Lat ino 16.1 %
Native Hawaiian or Pacific Islander 0.0 %
White 0.0 %
Two or More Races 0.3 %
Other 0.2 %
Student Group (Other) Percent of Total Enrollment
Socioeconomically Disadvantaged 88.3 %
English Learners 4.4 %
Students w ith Disabilit ies 12.3 %
Foster Youth 1.1 %
2015-16 SARC - KIPP Academy of Opportunity
Page 3 of 30
Last updated: 2/1/2017
Last updated: 2/1/2017
A. Conditions of Learning
State Priority: Basic
The SARC provides the follow ing information relevant to the State priority: Basic (Priority 1):
Degree to which teachers are appropriately assigned and fully credent ialed in the subject area and for the pupils they are teaching;Pupils have access to standards-aligned instruct ional materials; andSchool facilit ies are maintained in good repair
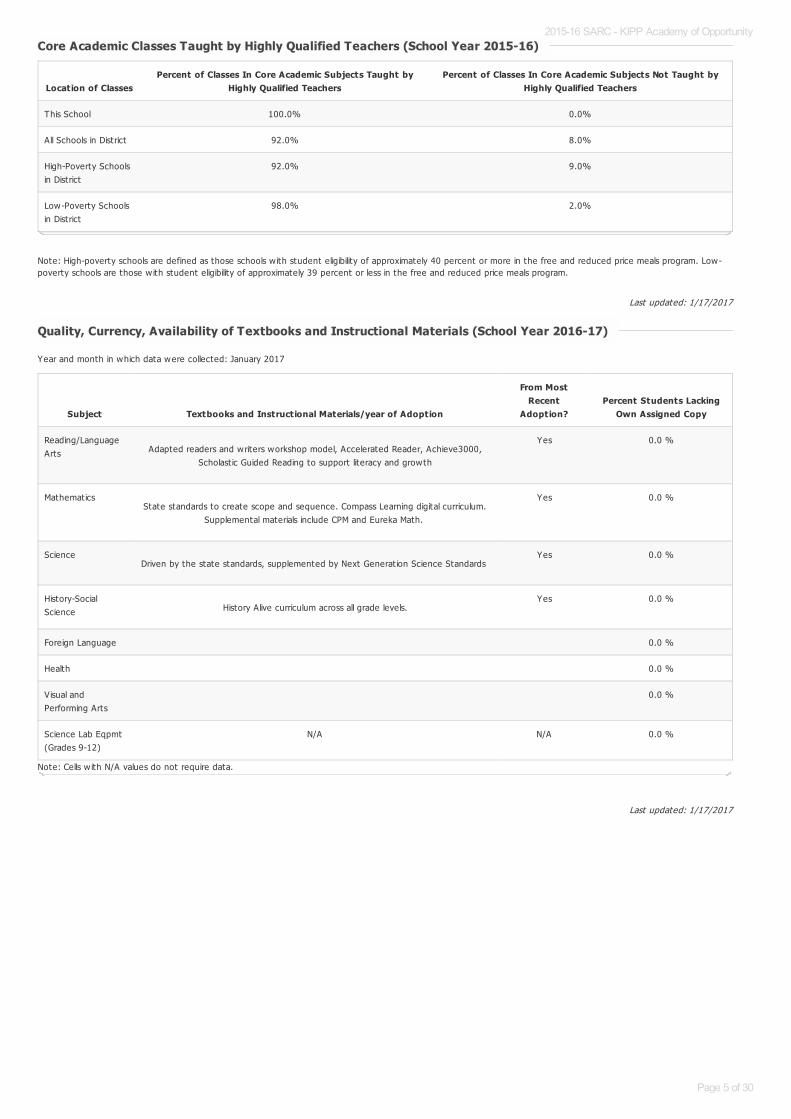
Note: “Misassignments” refers to the number of posit ions filled by teachers who lack legal authorizat ion to teach that grade level, subject area, student group, etc.
* Total Teacher Misassignments includes the number of Misassignments of Teachers of English learners.
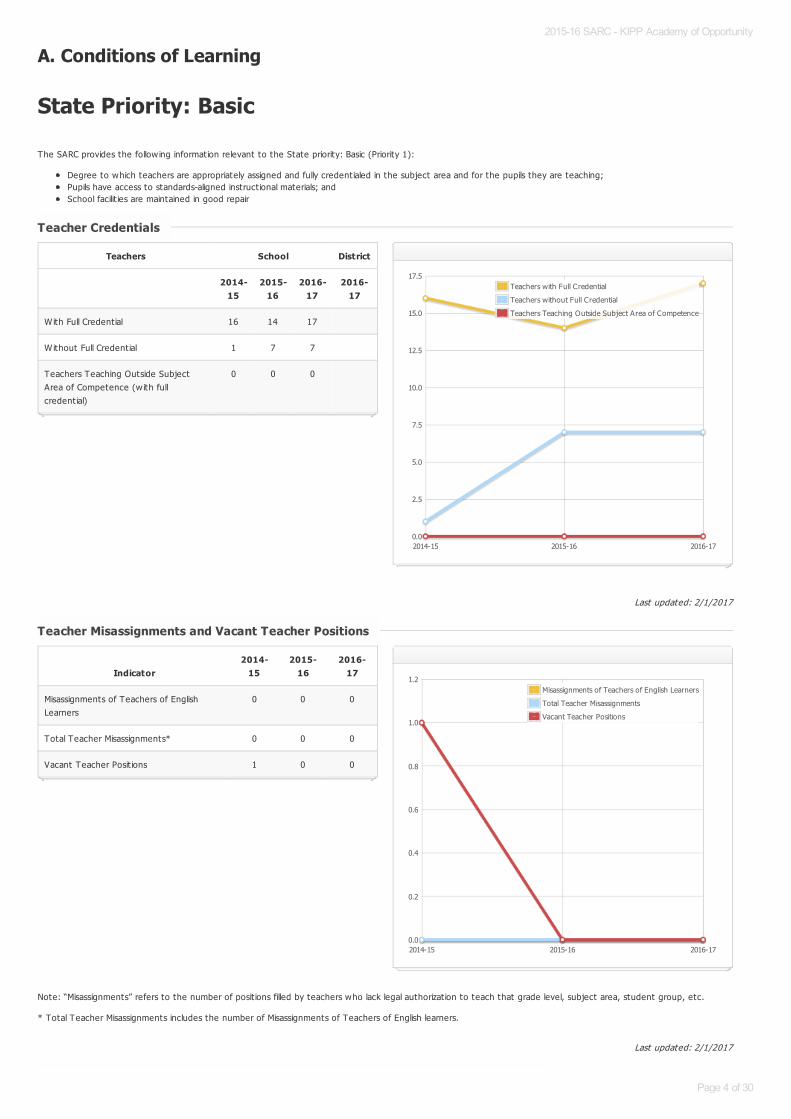
Teacher CredentialsTeacher Credentials
Teachers School District
2014-15
2015-16
2016-17
2016-17
With Full Credent ial 16 14 17
Without Full Credent ial 1 7 7
Teachers Teaching Outside SubjectArea of Competence (w ith fullcredent ial)
0 0 0
2014-15 2015-16 2016-170.0
2.5
5.0
7.5
10.0
12.5
15.0
17.5Teachers with Full Credential
Teachers without Full Credential
Teachers Teaching Outside Subject Area of Competence
Teacher Misassignments and Vacant Teacher PositionsTeacher Misassignments and Vacant Teacher Positions
Indicator2014-
152015-
162016-
17
Misassignments of Teachers of EnglishLearners
0 0 0
Total Teacher Misassignments* 0 0 0
Vacant Teacher Posit ions 1 0 0
2014-15 2015-16 2016-170.0
0.2
0.4
0.6
0.8
1.0
1.2Misassignments of Teachers of English Learners
Total Teacher Misassignments
Vacant Teacher Positions
2015-16 SARC - KIPP Academy of Opportunity
Page 4 of 30
Last updated: 1/17/2017
Last updated: 1/17/2017
Note: High-poverty schools are defined as those schools w ith student eligibility of approximately 40 percent or more in the free and reduced price meals program. Low-poverty schools are those w ith student eligibility of approximately 39 percent or less in the free and reduced price meals program.
Year and month in which data were collected: January 2017
Core Academic Classes Taught by Highly Qualified Teachers (School Year 2015-16)Core Academic Classes Taught by Highly Qualified Teachers (School Year 2015-16)
Location of ClassesPercent of Classes In Core Academic Subjects Taught by
Highly Qualified TeachersPercent of Classes In Core Academic Subjects Not Taught by
Highly Qualified Teachers
This School 100.0% 0.0%
All Schools in District 92.0% 8.0%
High-Poverty Schoolsin District
92.0% 9.0%
Low-Poverty Schoolsin District
98.0% 2.0%
Quality, Currency, Availability of Textbooks and Instructional Materials (School Year 2016-17)Quality, Currency, Availability of Textbooks and Instructional Materials (School Year 2016-17)
Note: Cells w ith N/A values do not require data.
Subject Textbooks and Instructional Materials/year of Adoption
From MostRecent
Adoption?Percent Students Lacking
Own Assigned Copy
Reading/LanguageArts Adapted readers and writers workshop model, Accelerated Reader, Achieve3000,
Scholast ic Guided Reading to support literacy and growth
Yes 0.0 %
MathematicsState standards to create scope and sequence. Compass Learning digital curriculum.
Supplemental materials include CPM and Eureka Math.
Yes 0.0 %
ScienceDriven by the state standards, supplemented by Next Generat ion Science Standards
Yes 0.0 %
History-SocialScience History Alive curriculum across all grade levels.
Yes 0.0 %
Foreign Language 0.0 %
Health 0.0 %
Visual andPerforming Arts
0.0 %
Science Lab Eqpmt(Grades 9-12)
N/A N/A 0.0 %
2015-16 SARC - KIPP Academy of Opportunity
Page 5 of 30
Last updated: 1/17/2017
Last updated: 1/20/2017
School Facility Good Repair StatusYear and month of the most recent FIT report: August 2016
Overall Facility RateYear and month of the most recent FIT report: August 2016
School Facility Conditions and Planned ImprovementsSchool Facility Conditions and Planned Improvements
We strive to keep our school in the best quality for our students. Construct ion of our new building for the 17-18 school year is ongoing and scheduled to becompleted in April 2017.
System Inspected Rating
Repair Needed andAction Taken or
Planned
Systems: Gas Leaks, Mechanical/HVAC,Sewer
FairOne furnace needs
repair.
Interior: Interior Surfaces Good
Cleanliness: Overall Cleanliness,Pest/Vermin Infestat ion
Good
Electrical: Electrical Good
Restrooms/Fountains: Restrooms,Sinks/Fountains
Good
Safety: Fire Safety, Hazardous Materials Good
Structural: Structural Damage, Roofs Good
External: Playground/School Grounds,W indows/Doors/Gates/Fences
Good
Overall Rat ing Good
2015-16 SARC - KIPP Academy of Opportunity
Page 6 of 30
Last updated: 1/17/2017
B. Pupil Outcomes
State Priority: Pupil Achievement
The SARC provides the follow ing information relevant to the State priority: Pupil Achievement (Priority 4):
Statewide assessments (i.e., California Assessment of Student Performance and Progress [CAASPP] System, which includes the Smarter Balanced SummativeAssessments for students in the general educat ion populat ion and the California Alternate Assessments [CAAs] for English language arts/literacy [ELA] andmathematics given in grades three through eight and grade eleven. The CAAs have replaced the California Alternate Performance Assessment [CAPA] for ELA andmathematics, which were eliminated in 2015. Only eligible students may part icipate in the administrat ion of the CAAs. CAA items are aligned w ith alternateachievement standards, which are linked w ith the Common Core State Standards [CCSS] for students w ith significant cognit ive disabilit ies); and
The percentage of students who have successfully completed courses that sat isfy the requirements for entrance to the University of California and the CaliforniaState University, or career technical educat ion sequences or programs of study.
Note: Percentages are not calculated when the number of students tested is ten or less, either because the number of students in this category is too small forstat ist ical accuracy or to protect student privacy.
CAASPP Test Results in English Language Arts/Literacy (ELA) and Mathematics for All StudentsCAASPP Test Results in English Language Arts/Literacy (ELA) and Mathematics for All Students
Subject
Percent of Students Meeting or Exceeding the State Standards
School District State
2014-15 2015-16 2014-15 2015-16 2014-15 2015-16
English Language Arts / Literacy (grades 3-8 and 11) 29.0% 38.0% 34.0% 39.0% 44.0% 48.0%
Mathematics (grades 3-8 and 11) 18.0% 24.0% 25.0% 29.0% 34.0% 36.0%
2015-16 SARC - KIPP Academy of Opportunity
Page 7 of 30
Last updated: 1/17/2017
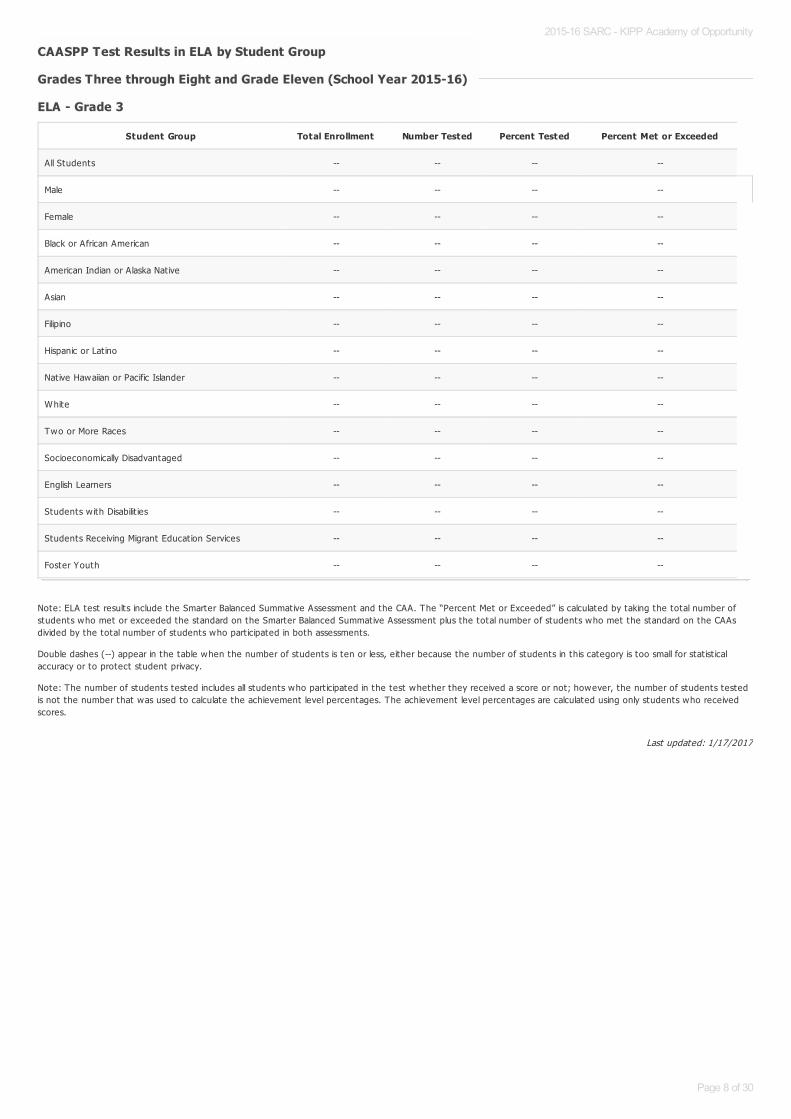
Note: ELA test results include the Smarter Balanced Summative Assessment and the CAA. The “Percent Met or Exceeded” is calculated by taking the total number ofstudents who met or exceeded the standard on the Smarter Balanced Summative Assessment plus the total number of students who met the standard on the CAAsdivided by the total number of students who part icipated in both assessments.
Double dashes (--) appear in the table when the number of students is ten or less, either because the number of students in this category is too small for stat ist icalaccuracy or to protect student privacy.
Note: The number of students tested includes all students who part icipated in the test whether they received a score or not; however, the number of students testedis not the number that was used to calculate the achievement level percentages. The achievement level percentages are calculated using only students who receivedscores.
CAASPP Test Results in ELA by Student Group CAASPP Test Results in ELA by Student Group
Grades Three through Eight and Grade Eleven (School Year 2015-16)Grades Three through Eight and Grade Eleven (School Year 2015-16)
ELA - Grade 3ELA - Grade 3
Student Group Total Enrollment Number Tested Percent Tested Percent Met or Exceeded
All Students -- -- -- --
Male -- -- -- --
Female -- -- -- --
Black or African American -- -- -- --
American Indian or Alaska Nat ive -- -- -- --
Asian -- -- -- --
Filipino -- -- -- --
Hispanic or Lat ino -- -- -- --
Nat ive Hawaiian or Pacific Islander -- -- -- --
White -- -- -- --
Two or More Races -- -- -- --
Socioeconomically Disadvantaged -- -- -- --
English Learners -- -- -- --
Students w ith Disabilit ies -- -- -- --
Students Receiving Migrant Educat ion Services -- -- -- --
Foster Youth -- -- -- --
2015-16 SARC - KIPP Academy of Opportunity
Page 8 of 30

Last updated: 1/17/2017
Note: ELA test results include the Smarter Balanced Summative Assessment and the CAA. The “Percent Met or Exceeded” is calculated by taking the total number ofstudents who met or exceeded the standard on the Smarter Balanced Summative Assessment plus the total number of students who met the standard on the CAAsdivided by the total number of students who part icipated in both assessments.
Double dashes (--) appear in the table when the number of students is ten or less, either because the number of students in this category is too small for stat ist icalaccuracy or to protect student privacy.
Note: The number of students tested includes all students who part icipated in the test whether they received a score or not; however, the number of students testedis not the number that was used to calculate the achievement level percentages. The achievement level percentages are calculated using only students who receivedscores.
ELA - Grade 4ELA - Grade 4
Student Group Total Enrollment Number Tested Percent Tested Percent Met or Exceeded
All Students -- -- -- --
Male -- -- -- --
Female -- -- -- --
Black or African American -- -- -- --
American Indian or Alaska Nat ive -- -- -- --
Asian -- -- -- --
Filipino -- -- -- --
Hispanic or Lat ino -- -- -- --
Nat ive Hawaiian or Pacific Islander -- -- -- --
White -- -- -- --
Two or More Races -- -- -- --
Socioeconomically Disadvantaged -- -- -- --
English Learners -- -- -- --
Students w ith Disabilit ies -- -- -- --
Students Receiving Migrant Educat ion Services -- -- -- --
Foster Youth -- -- -- --
2015-16 SARC - KIPP Academy of Opportunity
Page 9 of 30

Last updated: 1/17/2017
Note: ELA test results include the Smarter Balanced Summative Assessment and the CAA. The “Percent Met or Exceeded” is calculated by taking the total number ofstudents who met or exceeded the standard on the Smarter Balanced Summative Assessment plus the total number of students who met the standard on the CAAsdivided by the total number of students who part icipated in both assessments.
Double dashes (--) appear in the table when the number of students is ten or less, either because the number of students in this category is too small for stat ist icalaccuracy or to protect student privacy.
Note: The number of students tested includes all students who part icipated in the test whether they received a score or not; however, the number of students testedis not the number that was used to calculate the achievement level percentages. The achievement level percentages are calculated using only students who receivedscores.
ELA - Grade 5ELA - Grade 5
Student Group Total Enrollment Number Tested Percent Tested Percent Met or Exceeded
All Students 61 61 100.0% 47.5%
Male 28 28 100.0% 42.9%
Female 33 33 100.0% 51.5%
Black or African American 50 50 100.0% 46.0%
American Indian or Alaska Nat ive -- -- -- --
Asian -- -- -- --
Filipino -- -- -- --
Hispanic or Lat ino -- -- -- --
Nat ive Hawaiian or Pacific Islander -- -- -- --
White -- -- -- --
Two or More Races -- -- -- --
Socioeconomically Disadvantaged 57 57 100.0% 47.4%
English Learners -- -- -- --
Students w ith Disabilit ies -- -- -- --
Students Receiving Migrant Educat ion Services -- -- -- --
Foster Youth -- -- -- --
2015-16 SARC - KIPP Academy of Opportunity
Page 10 of 30
Last updated: 1/17/2017
Note: ELA test results include the Smarter Balanced Summative Assessment and the CAA. The “Percent Met or Exceeded” is calculated by taking the total number ofstudents who met or exceeded the standard on the Smarter Balanced Summative Assessment plus the total number of students who met the standard on the CAAsdivided by the total number of students who part icipated in both assessments.
Double dashes (--) appear in the table when the number of students is ten or less, either because the number of students in this category is too small for stat ist icalaccuracy or to protect student privacy.
Note: The number of students tested includes all students who part icipated in the test whether they received a score or not; however, the number of students testedis not the number that was used to calculate the achievement level percentages. The achievement level percentages are calculated using only students who receivedscores.
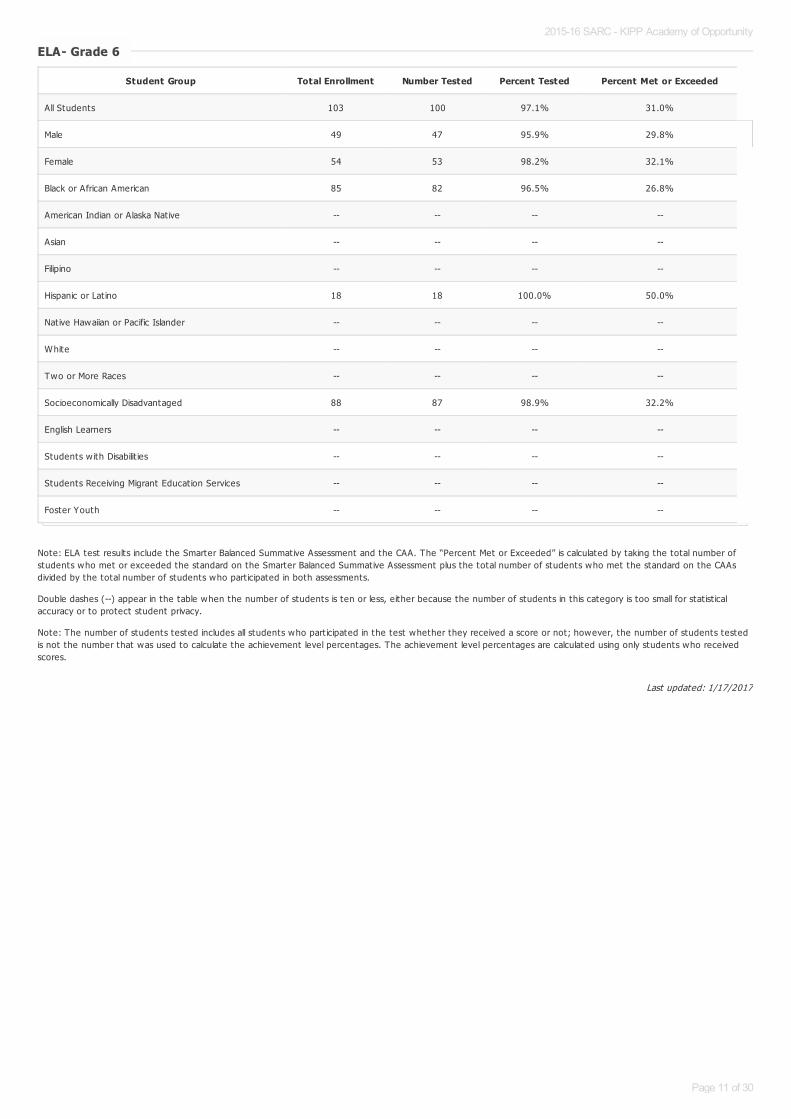
ELA- ELA- Grade 6Grade 6
Student Group Total Enrollment Number Tested Percent Tested Percent Met or Exceeded
All Students 103 100 97.1% 31.0%
Male 49 47 95.9% 29.8%
Female 54 53 98.2% 32.1%
Black or African American 85 82 96.5% 26.8%
American Indian or Alaska Nat ive -- -- -- --
Asian -- -- -- --
Filipino -- -- -- --
Hispanic or Lat ino 18 18 100.0% 50.0%
Native Hawaiian or Pacific Islander -- -- -- --
White -- -- -- --
Two or More Races -- -- -- --
Socioeconomically Disadvantaged 88 87 98.9% 32.2%
English Learners -- -- -- --
Students w ith Disabilit ies -- -- -- --
Students Receiving Migrant Educat ion Services -- -- -- --
Foster Youth -- -- -- --
2015-16 SARC - KIPP Academy of Opportunity
Page 11 of 30
Last updated: 1/17/2017
Note: ELA test results include the Smarter Balanced Summative Assessment and the CAA. The “Percent Met or Exceeded” is calculated by taking the total number ofstudents who met or exceeded the standard on the Smarter Balanced Summative Assessment plus the total number of students who met the standard on the CAAsdivided by the total number of students who part icipated in both assessments.
Double dashes (--) appear in the table when the number of students is ten or less, either because the number of students in this category is too small for stat ist icalaccuracy or to protect student privacy.
Note: The number of students tested includes all students who part icipated in the test whether they received a score or not; however, the number of students testedis not the number that was used to calculate the achievement level percentages. The achievement level percentages are calculated using only students who receivedscores.
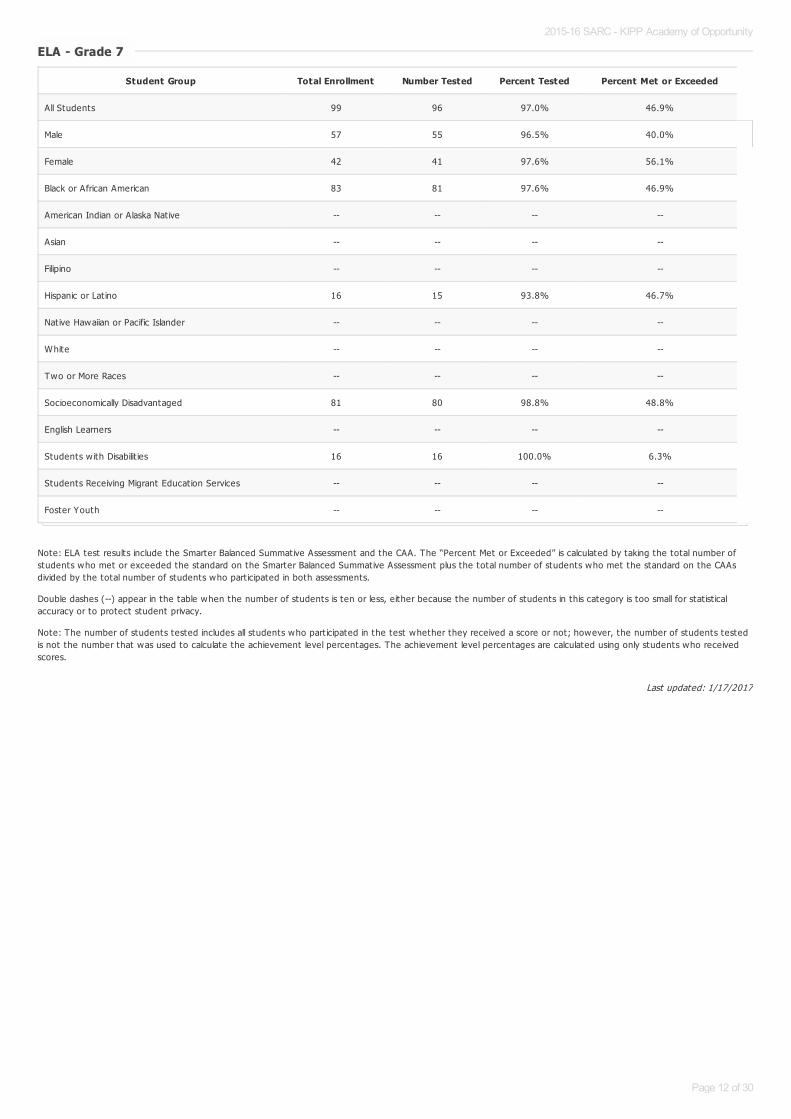
ELA - Grade 7ELA - Grade 7
Student Group Total Enrollment Number Tested Percent Tested Percent Met or Exceeded
All Students 99 96 97.0% 46.9%
Male 57 55 96.5% 40.0%
Female 42 41 97.6% 56.1%
Black or African American 83 81 97.6% 46.9%
American Indian or Alaska Nat ive -- -- -- --
Asian -- -- -- --
Filipino -- -- -- --
Hispanic or Lat ino 16 15 93.8% 46.7%
Native Hawaiian or Pacific Islander -- -- -- --
White -- -- -- --
Two or More Races -- -- -- --
Socioeconomically Disadvantaged 81 80 98.8% 48.8%
English Learners -- -- -- --
Students w ith Disabilit ies 16 16 100.0% 6.3%
Students Receiving Migrant Educat ion Services -- -- -- --
Foster Youth -- -- -- --
2015-16 SARC - KIPP Academy of Opportunity
Page 12 of 30

Last updated: 1/17/2017
Note: ELA test results include the Smarter Balanced Summative Assessment and the CAA. The “Percent Met or Exceeded” is calculated by taking the total number ofstudents who met or exceeded the standard on the Smarter Balanced Summative Assessment plus the total number of students who met the standard on the CAAsdivided by the total number of students who part icipated in both assessments.
Double dashes (--) appear in the table when the number of students is ten or less, either because the number of students in this category is too small for stat ist icalaccuracy or to protect student privacy.
Note: The number of students tested includes all students who part icipated in the test whether they received a score or not; however, the number of students testedis not the number that was used to calculate the achievement level percentages. The achievement level percentages are calculated using only students who receivedscores.
ELA - Grade 8ELA - Grade 8
Student Group Total Enrollment Number Tested Percent Tested Percent Met or Exceeded
All Students 91 89 97.8% 30.3%
Male 42 40 95.2% 25.0%
Female 49 49 100.0% 34.7%
Black or African American 76 74 97.4% 28.4%
American Indian or Alaska Nat ive -- -- -- --
Asian -- -- -- --
Filipino -- -- -- --
Hispanic or Lat ino 15 15 100.0% 40.0%
Native Hawaiian or Pacific Islander -- -- -- --
White -- -- -- --
Two or More Races -- -- -- --
Socioeconomically Disadvantaged 76 74 97.4% 31.1%
English Learners -- -- -- --
Students w ith Disabilit ies 15 15 100.0% 6.7%
Students Receiving Migrant Educat ion Services -- -- -- --
Foster Youth -- -- -- --
2015-16 SARC - KIPP Academy of Opportunity
Page 13 of 30

Last updated: 1/17/2017
Note: ELA test results include the Smarter Balanced Summative Assessment and the CAA. The “Percent Met or Exceeded” is calculated by taking the total number ofstudents who met or exceeded the standard on the Smarter Balanced Summative Assessment plus the total number of students who met the standard on the CAAsdivided by the total number of students who part icipated in both assessments.
Double dashes (--) appear in the table when the number of students is ten or less, either because the number of students in this category is too small for stat ist icalaccuracy or to protect student privacy.
Note: The number of students tested includes all students who part icipated in the test whether they received a score or not; however, the number of students testedis not the number that was used to calculate the achievement level percentages. The achievement level percentages are calculated using only students who receivedscores.
ELA - Grade 11ELA - Grade 11
Student Group Total Enrollment Number Tested Percent Tested Percent Met or Exceeded
All Students -- -- -- --
Male -- -- -- --
Female -- -- -- --
Black or African American -- -- -- --
American Indian or Alaska Nat ive -- -- -- --
Asian -- -- -- --
Filipino -- -- -- --
Hispanic or Lat ino -- -- -- --
Nat ive Hawaiian or Pacific Islander -- -- -- --
White -- -- -- --
Two or More Races -- -- -- --
Socioeconomically Disadvantaged -- -- -- --
English Learners -- -- -- --
Students w ith Disabilit ies -- -- -- --
Students Receiving Migrant Educat ion Services -- -- -- --
Foster Youth -- -- -- --
2015-16 SARC - KIPP Academy of Opportunity
Page 14 of 30
Last updated: 1/17/2017
Note: Mathematics test results include the Smarter Balanced Summative Assessment and the CAA. The “Percent Met or Exceeded” is calculated by taking the totalnumber of students who met or exceeded the standard on the Smarter Balanced Summative Assessment plus the total number of students who met the standard onthe CAAs divided by the total number of students who part icipated in both assessments.
Double dashes (--) appear in the table when the number of students is ten or less, either because the number of students in this category is too small for stat ist icalaccuracy or to protect student privacy.
Note: The number of students tested includes all students who part icipated in the test whether they received a score or not; however, the number of students testedis not the number that was used to calculate the achievement level percentages. The achievement level percentages are calculated using only students who receivedscores.
CAASPP Test Results in Mathematics by Student GroupCAASPP Test Results in Mathematics by Student Group
Grades Three through Eight and Grade Eleven (School Year 2015-16)Grades Three through Eight and Grade Eleven (School Year 2015-16)
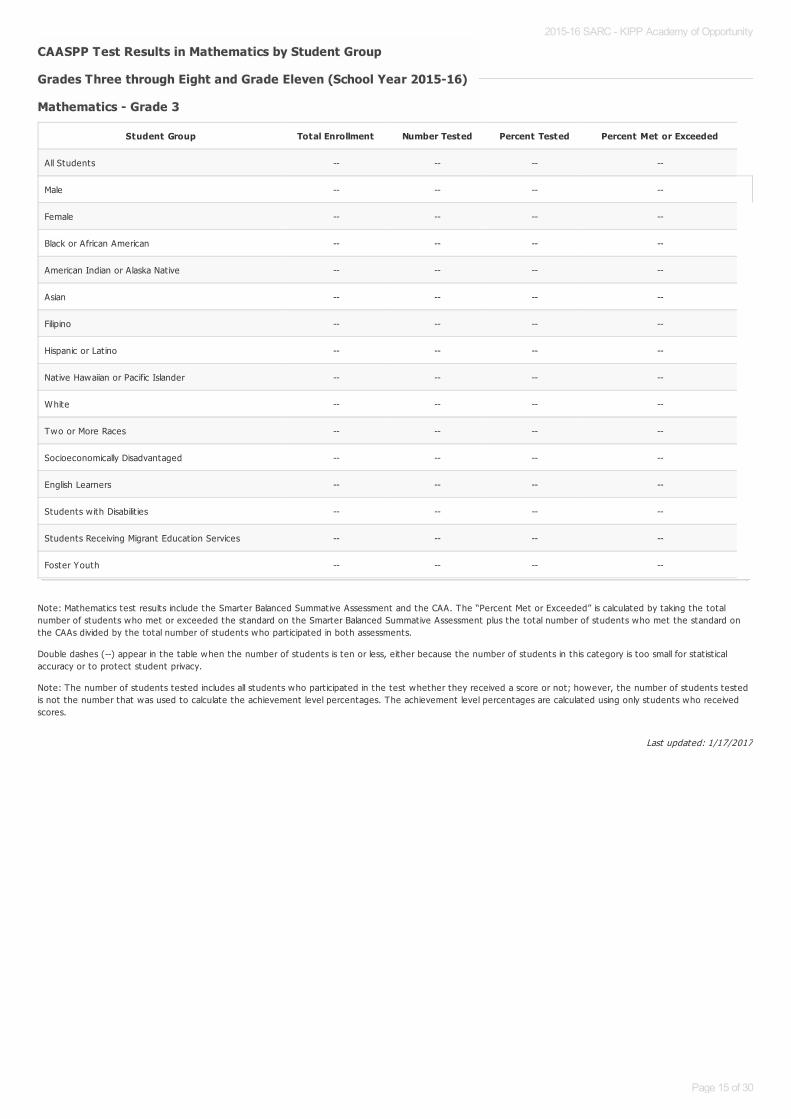
Mathematics - Grade 3Mathematics - Grade 3
Student Group Total Enrollment Number Tested Percent Tested Percent Met or Exceeded
All Students -- -- -- --
Male -- -- -- --
Female -- -- -- --
Black or African American -- -- -- --
American Indian or Alaska Nat ive -- -- -- --
Asian -- -- -- --
Filipino -- -- -- --
Hispanic or Lat ino -- -- -- --
Nat ive Hawaiian or Pacific Islander -- -- -- --
White -- -- -- --
Two or More Races -- -- -- --
Socioeconomically Disadvantaged -- -- -- --
English Learners -- -- -- --
Students w ith Disabilit ies -- -- -- --
Students Receiving Migrant Educat ion Services -- -- -- --
Foster Youth -- -- -- --
2015-16 SARC - KIPP Academy of Opportunity
Page 15 of 30

Last updated: 1/17/2017
Note: Mathematics test results include the Smarter Balanced Summative Assessment and the CAA. The “Percent Met or Exceeded” is calculated by taking the totalnumber of students who met or exceeded the standard on the Smarter Balanced Summative Assessment plus the total number of students who met the standard onthe CAAs divided by the total number of students who part icipated in both assessments.
Double dashes (--) appear in the table when the number of students is ten or less, either because the number of students in this category is too small for stat ist icalaccuracy or to protect student privacy.
Note: The number of students tested includes all students who part icipated in the test whether they received a score or not; however, the number of students testedis not the number that was used to calculate the achievement level percentages. The achievement level percentages are calculated using only students who receivedscores.
Mathematics - Grade 4Mathematics - Grade 4
Student Group Total Enrollment Number Tested Percent Tested Percent Met or Exceeded
All Students -- -- -- --
Male -- -- -- --
Female -- -- -- --
Black or African American -- -- -- --
American Indian or Alaska Nat ive -- -- -- --
Asian -- -- -- --
Filipino -- -- -- --
Hispanic or Lat ino -- -- -- --
Nat ive Hawaiian or Pacific Islander -- -- -- --
White -- -- -- --
Two or More Races -- -- -- --
Socioeconomically Disadvantaged -- -- -- --
English Learners -- -- -- --
Students w ith Disabilit ies -- -- -- --
Students Receiving Migrant Educat ion Services -- -- -- --
Foster Youth -- -- -- --
2015-16 SARC - KIPP Academy of Opportunity
Page 16 of 30
Last updated: 1/17/2017
Note: Mathematics test results include the Smarter Balanced Summative Assessment and the CAA. The “Percent Met or Exceeded” is calculated by taking the totalnumber of students who met or exceeded the standard on the Smarter Balanced Summative Assessment plus the total number of students who met the standard onthe CAAs divided by the total number of students who part icipated in both assessments.
Double dashes (--) appear in the table when the number of students is ten or less, either because the number of students in this category is too small for stat ist icalaccuracy or to protect student privacy.
Note: The number of students tested includes all students who part icipated in the test whether they received a score or not; however, the number of students testedis not the number that was used to calculate the achievement level percentages. The achievement level percentages are calculated using only students who receivedscores.
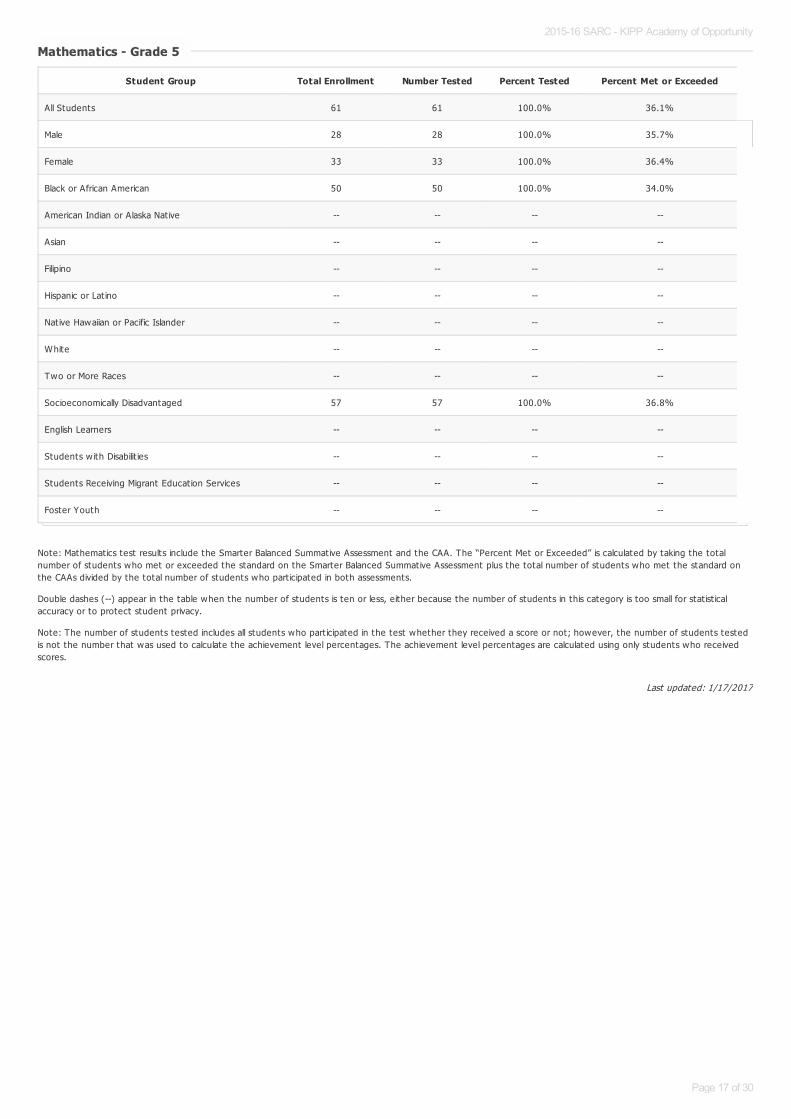
Mathematics - Grade 5Mathematics - Grade 5
Student Group Total Enrollment Number Tested Percent Tested Percent Met or Exceeded
All Students 61 61 100.0% 36.1%
Male 28 28 100.0% 35.7%
Female 33 33 100.0% 36.4%
Black or African American 50 50 100.0% 34.0%
American Indian or Alaska Nat ive -- -- -- --
Asian -- -- -- --
Filipino -- -- -- --
Hispanic or Lat ino -- -- -- --
Nat ive Hawaiian or Pacific Islander -- -- -- --
White -- -- -- --
Two or More Races -- -- -- --
Socioeconomically Disadvantaged 57 57 100.0% 36.8%
English Learners -- -- -- --
Students w ith Disabilit ies -- -- -- --
Students Receiving Migrant Educat ion Services -- -- -- --
Foster Youth -- -- -- --
2015-16 SARC - KIPP Academy of Opportunity
Page 17 of 30

Last updated: 1/17/2017
Note: Mathematics test results include the Smarter Balanced Summative Assessment and the CAA. The “Percent Met or Exceeded” is calculated by taking the totalnumber of students who met or exceeded the standard on the Smarter Balanced Summative Assessment plus the total number of students who met the standard onthe CAAs divided by the total number of students who part icipated in both assessments.
Double dashes (--) appear in the table when the number of students is ten or less, either because the number of students in this category is too small for stat ist icalaccuracy or to protect student privacy.
Note: The number of students tested includes all students who part icipated in the test whether they received a score or not; however, the number of students testedis not the number that was used to calculate the achievement level percentages. The achievement level percentages are calculated using only students who receivedscores.
Mathematics - Grade 6Mathematics - Grade 6
Student Group Total Enrollment Number Tested Percent Tested Percent Met or Exceeded
All Students 103 100 97.1% 22.0%
Male 49 47 95.9% 25.5%
Female 54 53 98.2% 18.9%
Black or African American 85 82 96.5% 19.5%
American Indian or Alaska Nat ive -- -- -- --
Asian -- -- -- --
Filipino -- -- -- --
Hispanic or Lat ino 18 18 100.0% 33.3%
Native Hawaiian or Pacific Islander -- -- -- --
White -- -- -- --
Two or More Races -- -- -- --
Socioeconomically Disadvantaged 88 87 98.9% 23.0%
English Learners -- -- -- --
Students w ith Disabilit ies -- -- -- --
Students Receiving Migrant Educat ion Services -- -- -- --
Foster Youth -- -- -- --
2015-16 SARC - KIPP Academy of Opportunity
Page 18 of 30

Last updated: 1/17/2017
Note: Mathematics test results include the Smarter Balanced Summative Assessment and the CAA. The “Percent Met or Exceeded” is calculated by taking the totalnumber of students who met or exceeded the standard on the Smarter Balanced Summative Assessment plus the total number of students who met the standard onthe CAAs divided by the total number of students who part icipated in both assessments.
Double dashes (--) appear in the table when the number of students is ten or less, either because the number of students in this category is too small for stat ist icalaccuracy or to protect student privacy.
Note: The number of students tested includes all students who part icipated in the test whether they received a score or not; however, the number of students testedis not the number that was used to calculate the achievement level percentages. The achievement level percentages are calculated using only students who receivedscores.
Mathematics - Grade 7Mathematics - Grade 7
Student Group Total Enrollment Number Tested Percent Tested Percent Met or Exceeded
All Students 99 96 97.0% 29.2%
Male 57 55 96.5% 30.9%
Female 42 41 97.6% 26.8%
Black or African American 83 81 97.6% 29.6%
American Indian or Alaska Nat ive -- -- -- --
Asian -- -- -- --
Filipino -- -- -- --
Hispanic or Lat ino 16 15 93.8% 26.7%
Native Hawaiian or Pacific Islander -- -- -- --
White -- -- -- --
Two or More Races -- -- -- --
Socioeconomically Disadvantaged 81 80 98.8% 32.5%
English Learners -- -- -- --
Students w ith Disabilit ies 16 16 100.0% --
Students Receiving Migrant Educat ion Services -- -- -- --
Foster Youth -- -- -- --
2015-16 SARC - KIPP Academy of Opportunity
Page 19 of 30
Last updated: 1/17/2017
Note: Mathematics test results include the Smarter Balanced Summative Assessment and the CAA. The “Percent Met or Exceeded” is calculated by taking the totalnumber of students who met or exceeded the standard on the Smarter Balanced Summative Assessment plus the total number of students who met the standard onthe CAAs divided by the total number of students who part icipated in both assessments.
Double dashes (--) appear in the table when the number of students is ten or less, either because the number of students in this category is too small for stat ist icalaccuracy or to protect student privacy.
Note: The number of students tested includes all students who part icipated in the test whether they received a score or not; however, the number of students testedis not the number that was used to calculate the achievement level percentages. The achievement level percentages are calculated using only students who receivedscores.
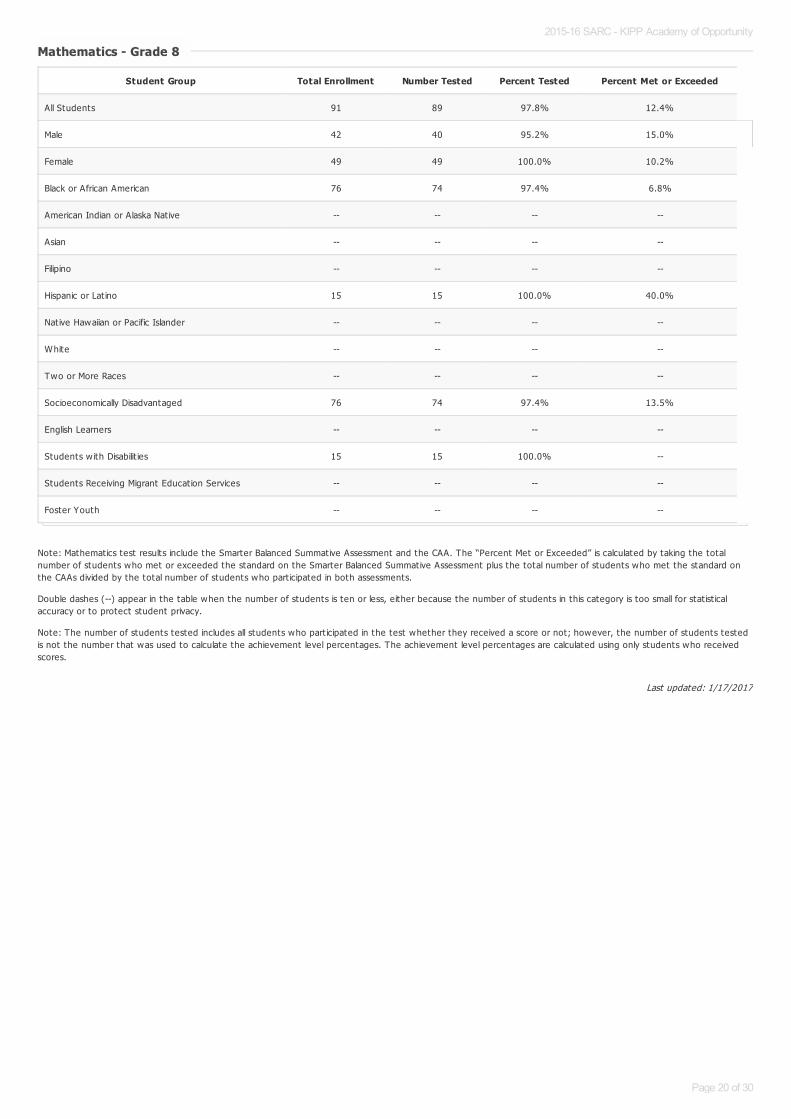
Mathematics - Grade 8Mathematics - Grade 8
Student Group Total Enrollment Number Tested Percent Tested Percent Met or Exceeded
All Students 91 89 97.8% 12.4%
Male 42 40 95.2% 15.0%
Female 49 49 100.0% 10.2%
Black or African American 76 74 97.4% 6.8%
American Indian or Alaska Nat ive -- -- -- --
Asian -- -- -- --
Filipino -- -- -- --
Hispanic or Lat ino 15 15 100.0% 40.0%
Native Hawaiian or Pacific Islander -- -- -- --
White -- -- -- --
Two or More Races -- -- -- --
Socioeconomically Disadvantaged 76 74 97.4% 13.5%
English Learners -- -- -- --
Students w ith Disabilit ies 15 15 100.0% --
Students Receiving Migrant Educat ion Services -- -- -- --
Foster Youth -- -- -- --
2015-16 SARC - KIPP Academy of Opportunity
Page 20 of 30
Last updated: 1/17/2017
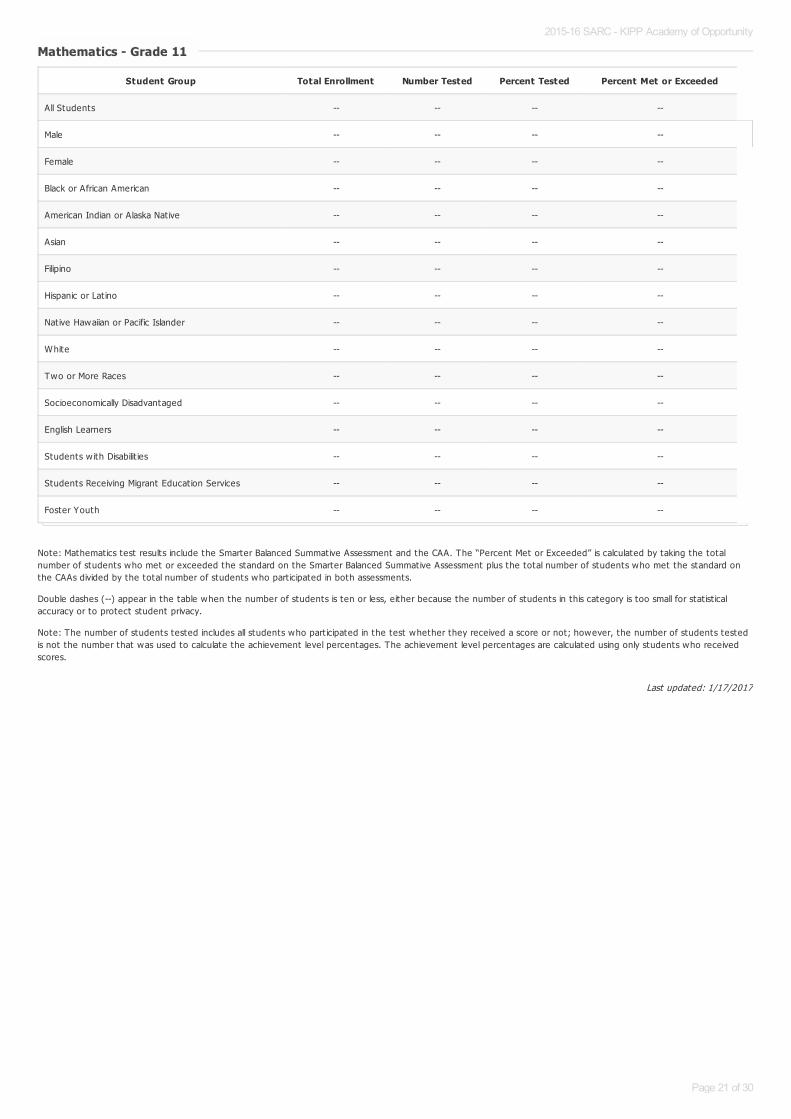
Note: Mathematics test results include the Smarter Balanced Summative Assessment and the CAA. The “Percent Met or Exceeded” is calculated by taking the totalnumber of students who met or exceeded the standard on the Smarter Balanced Summative Assessment plus the total number of students who met the standard onthe CAAs divided by the total number of students who part icipated in both assessments.
Double dashes (--) appear in the table when the number of students is ten or less, either because the number of students in this category is too small for stat ist icalaccuracy or to protect student privacy.
Note: The number of students tested includes all students who part icipated in the test whether they received a score or not; however, the number of students testedis not the number that was used to calculate the achievement level percentages. The achievement level percentages are calculated using only students who receivedscores.
Mathematics - Grade 11Mathematics - Grade 11
Student Group Total Enrollment Number Tested Percent Tested Percent Met or Exceeded
All Students -- -- -- --
Male -- -- -- --
Female -- -- -- --
Black or African American -- -- -- --
American Indian or Alaska Nat ive -- -- -- --
Asian -- -- -- --
Filipino -- -- -- --
Hispanic or Lat ino -- -- -- --
Nat ive Hawaiian or Pacific Islander -- -- -- --
White -- -- -- --
Two or More Races -- -- -- --
Socioeconomically Disadvantaged -- -- -- --
English Learners -- -- -- --
Students w ith Disabilit ies -- -- -- --
Students Receiving Migrant Educat ion Services -- -- -- --
Foster Youth -- -- -- --
2015-16 SARC - KIPP Academy of Opportunity
Page 21 of 30
Last updated: 1/17/2017
Last updated: 1/17/2017
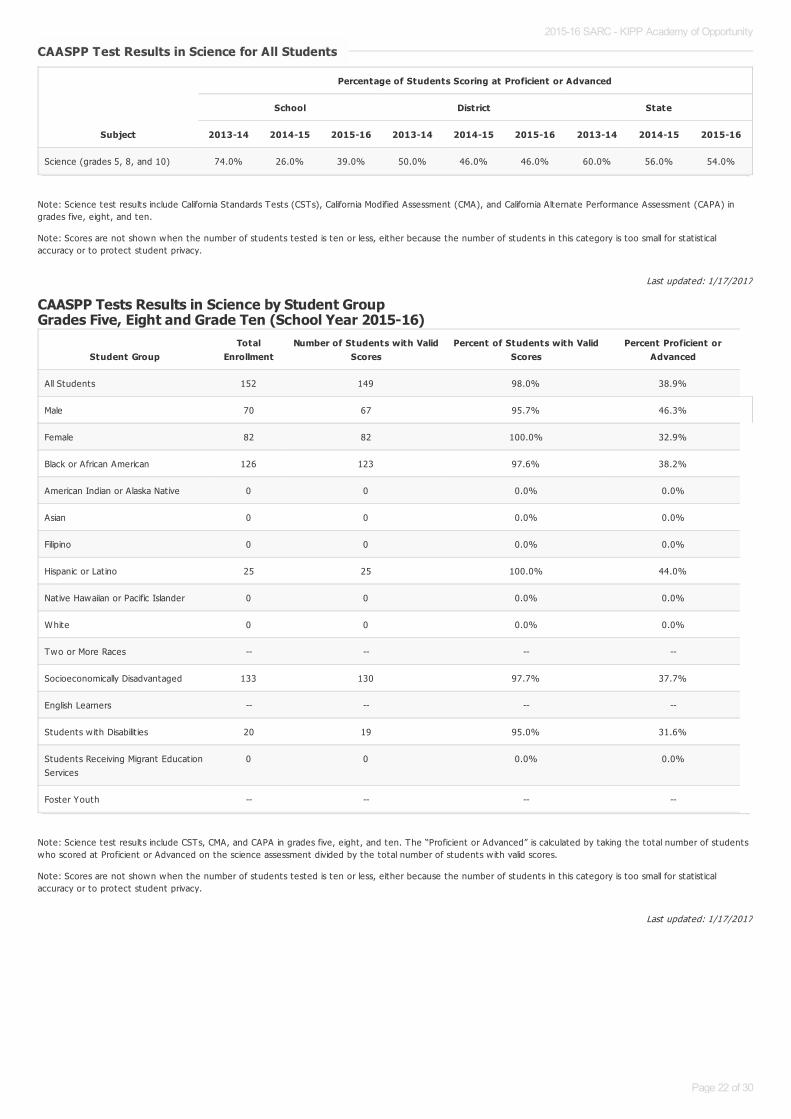
Note: Science test results include California Standards Tests (CSTs), California Modified Assessment (CMA), and California Alternate Performance Assessment (CAPA) ingrades five, eight, and ten.
Note: Scores are not shown when the number of students tested is ten or less, either because the number of students in this category is too small for stat ist icalaccuracy or to protect student privacy.
CAASPP Tests Results in Science by Student GroupGrades Five, Eight and Grade Ten (School Year 2015-16)
Note: Science test results include CSTs, CMA, and CAPA in grades five, eight, and ten. The “Proficient or Advanced” is calculated by taking the total number of studentswho scored at Proficient or Advanced on the science assessment divided by the total number of students w ith valid scores.
Note: Scores are not shown when the number of students tested is ten or less, either because the number of students in this category is too small for stat ist icalaccuracy or to protect student privacy.
CAASPP Test Results in Science for All StudentsCAASPP Test Results in Science for All Students
Subject
Percentage of Students Scoring at Proficient or Advanced
School District State
2013-14 2014-15 2015-16 2013-14 2014-15 2015-16 2013-14 2014-15 2015-16
Science (grades 5, 8, and 10) 74.0% 26.0% 39.0% 50.0% 46.0% 46.0% 60.0% 56.0% 54.0%
Student GroupTotal
EnrollmentNumber of Students with Valid
ScoresPercent of Students with Valid
ScoresPercent Proficient or
Advanced
All Students 152 149 98.0% 38.9%
Male 70 67 95.7% 46.3%
Female 82 82 100.0% 32.9%
Black or African American 126 123 97.6% 38.2%
American Indian or Alaska Nat ive 0 0 0.0% 0.0%
Asian 0 0 0.0% 0.0%
Filipino 0 0 0.0% 0.0%
Hispanic or Lat ino 25 25 100.0% 44.0%
Native Hawaiian or Pacific Islander 0 0 0.0% 0.0%
White 0 0 0.0% 0.0%
Two or More Races -- -- -- --
Socioeconomically Disadvantaged 133 130 97.7% 37.7%
English Learners -- -- -- --
Students w ith Disabilit ies 20 19 95.0% 31.6%
Students Receiving Migrant Educat ionServices
0 0 0.0% 0.0%
Foster Youth -- -- -- --
2015-16 SARC - KIPP Academy of Opportunity
Page 22 of 30
Last updated: 1/17/2017
Last updated: 1/17/2017
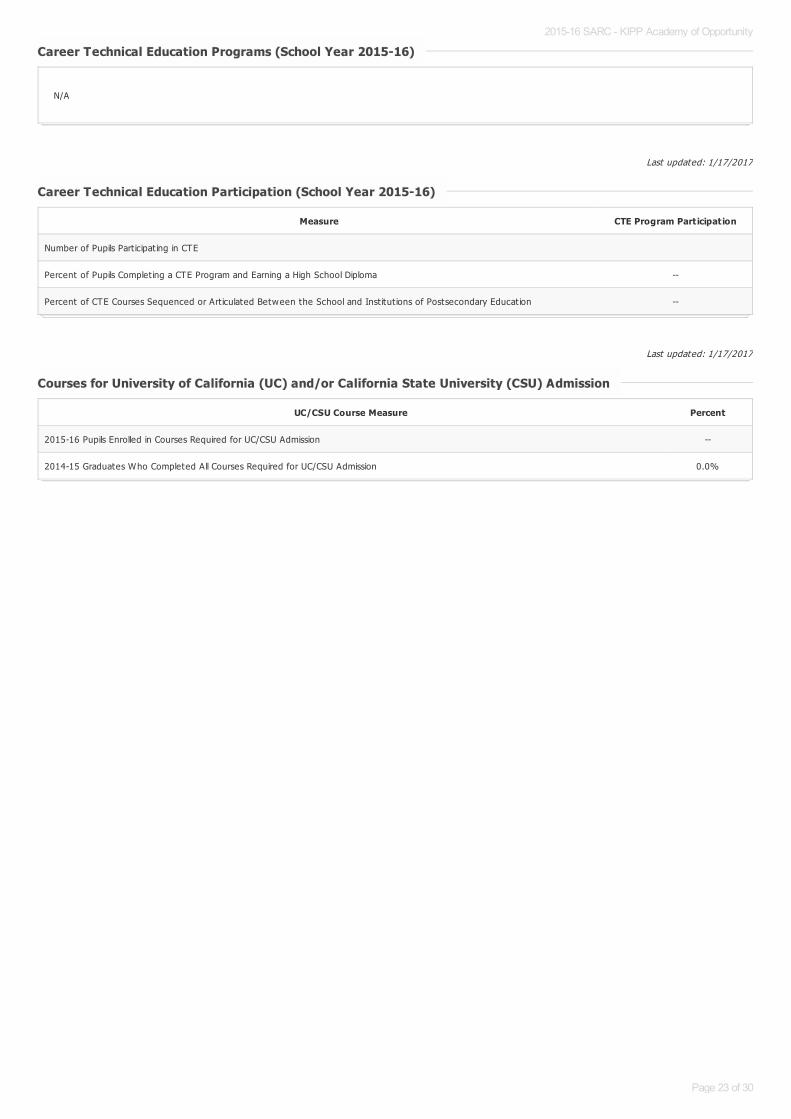
Career Technical Education Programs (School Year 2015-16)Career Technical Education Programs (School Year 2015-16)
N/A
Career Technical Education Participation (School Year 2015-16)Career Technical Education Participation (School Year 2015-16)
Measure CTE Program Participation
Number of Pupils Part icipat ing in CTE
Percent of Pupils Complet ing a CTE Program and Earning a High School Diploma --
Percent of CTE Courses Sequenced or Art iculated Between the School and Inst itut ions of Postsecondary Educat ion --
Courses for University of California (UC) and/or California State University (CSU) AdmissionCourses for University of California (UC) and/or California State University (CSU) Admission
UC/CSU Course Measure Percent
2015-16 Pupils Enrolled in Courses Required for UC/CSU Admission --
2014-15 Graduates Who Completed All Courses Required for UC/CSU Admission 0.0%
2015-16 SARC - KIPP Academy of Opportunity
Page 23 of 30
Last updated: 1/17/2017
Last updated: 1/20/2017
State Priority: Other Pupil Outcomes
The SARC provides the follow ing information relevant to the State priority: Other Pupil Outcomes (Priority 8):
Pupil outcomes in the subject area of physical educat ion
Note: Percentages are not calculated when the number of students tested is ten or less, either because the number of students in this category is too small forstat ist ical accuracy or to protect student privacy.
California Physical Fitness Test Results (School Year 2015-16)California Physical Fitness Test Results (School Year 2015-16)
Grade Level
Percentage of Students Meeting Fitness Standards
Four of Six Standards Five of Six Standards Six of Six Standards
2015-16 SARC - KIPP Academy of Opportunity
Page 24 of 30
Last updated: 1/20/2017
C. Engagement
State Priority: Parental Involvement
The SARC provides the follow ing information relevant to the State priority: Parental Involvement (Priority 3):
Efforts the school district makes to seek parent input in making decisions for the school district and each schoolsite
State Priority: Pupil Engagement
The SARC provides the follow ing information relevant to the State priority: Pupil Engagement (Priority 5):
High school dropout rates; andHigh school graduat ion rates
Opportunities for Parental Involvement (School Year 2016-17)Opportunities for Parental Involvement (School Year 2016-17)
KIPP Academy of Opportunity provides various volunteer opportunit ies for parents inside and outside the classroom environment. Parents are welcome to helpteachers during instruct ional t ime to help support the cont inual growth of students. We also encourage families to volunteer during our school w ide events thatwe host throughout the year. Parents have part icipated in our monthly Coffee w ith the Principal, our It-Takes-A-Village Parent meetings, amongst other things.Our goal is to cont inue to work closely w ith our families to help our students get to and through college. Annually we engage our parents in the review anddevelopment of our schools' LCAP.
2015-16 SARC - KIPP Academy of Opportunity
Page 25 of 30
Last updated: 1/17/2017
Last updated: 1/20/2017
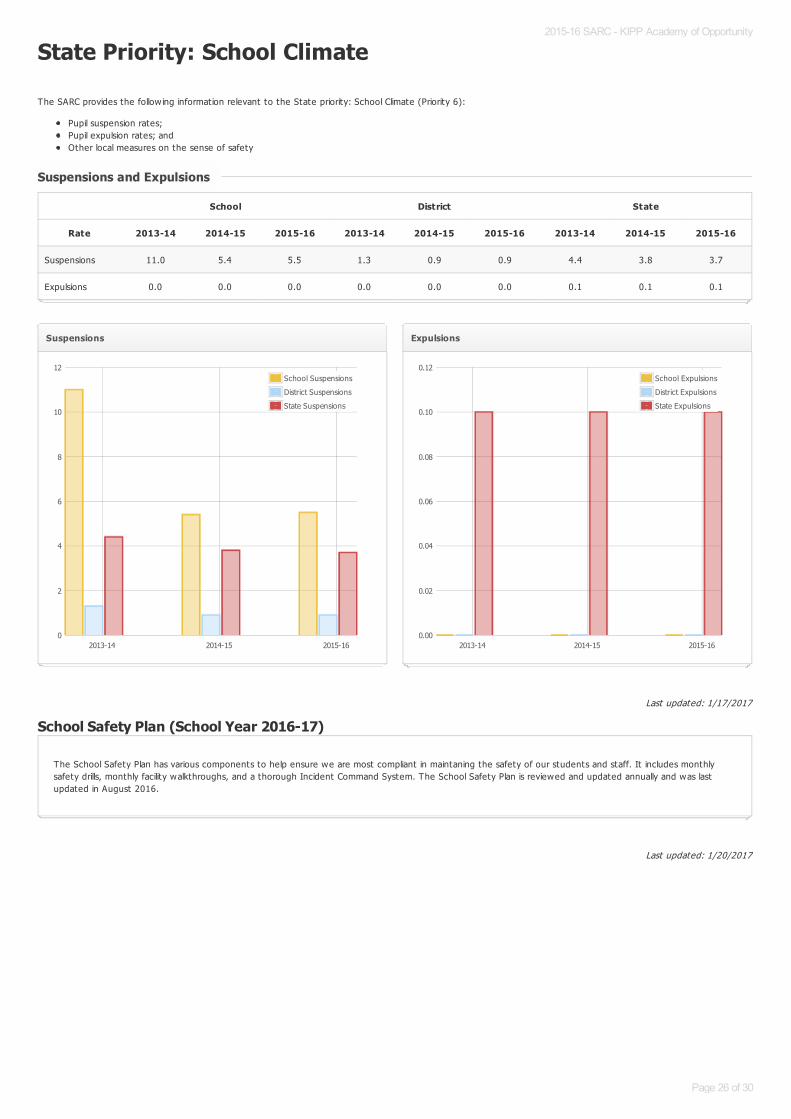
State Priority: School Climate
The SARC provides the follow ing information relevant to the State priority: School Climate (Priority 6):
Pupil suspension rates;Pupil expulsion rates; andOther local measures on the sense of safety
School Safety Plan (School Year 2016-17)
Suspensions and ExpulsionsSuspensions and Expulsions
School District State
Rate 2013-14 2014-15 2015-16 2013-14 2014-15 2015-16 2013-14 2014-15 2015-16
Suspensions 11.0 5.4 5.5 1.3 0.9 0.9 4.4 3.8 3.7
Expulsions 0.0 0.0 0.0 0.0 0.0 0.0 0.1 0.1 0.1
Suspensions
2013-14 2014-15 2015-160
2
4
6
8
10
12School Suspensions
District Suspensions
State Suspensions
Expulsions
2013-14 2014-15 2015-160.00
0.02
0.04
0.06
0.08
0.10
0.12School Expulsions
District Expulsions
State Expulsions
The School Safety Plan has various components to help ensure we are most compliant in maintaning the safety of our students and staff. It includes monthlysafety drills, monthly facility walkthroughs, and a thorough Incident Command System. The School Safety Plan is reviewed and updated annually and was lastupdated in August 2016.
2015-16 SARC - KIPP Academy of Opportunity
Page 26 of 30
Last updated: 1/20/2017
Last updated: 1/24/2017
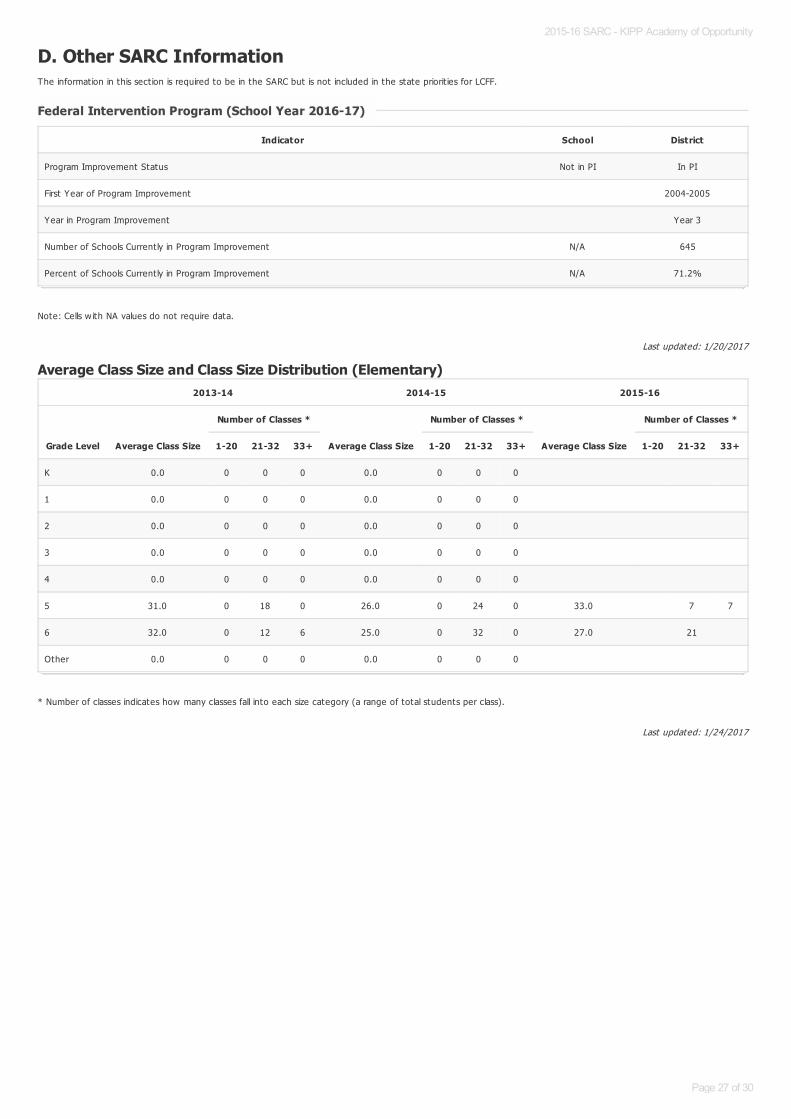
D. Other SARC InformationThe information in this sect ion is required to be in the SARC but is not included in the state priorit ies for LCFF.
Note: Cells w ith NA values do not require data.
Average Class Size and Class Size Distribution (Elementary)
* Number of classes indicates how many classes fall into each size category (a range of total students per class).
Federal Intervention Program (School Year 2016-17)Federal Intervention Program (School Year 2016-17)
Indicator School District
Program Improvement Status Not in PI In PI
First Year of Program Improvement 2004-2005
Year in Program Improvement Year 3
Number of Schools Current ly in Program Improvement N/A 645
Percent of Schools Current ly in Program Improvement N/A 71.2%
2013-14 2014-15 2015-16
Grade Level Average Class Size
Number of Classes *
Average Class Size
Number of Classes *
Average Class Size
Number of Classes *
1-20 21-32 33+ 1-20 21-32 33+ 1-20 21-32 33+
K 0.0 0 0 0 0.0 0 0 0
1 0.0 0 0 0 0.0 0 0 0
2 0.0 0 0 0 0.0 0 0 0
3 0.0 0 0 0 0.0 0 0 0
4 0.0 0 0 0 0.0 0 0 0
5 31.0 0 18 0 26.0 0 24 0 33.0 7 7
6 32.0 0 12 6 25.0 0 32 0 27.0 21
Other 0.0 0 0 0 0.0 0 0 0
2015-16 SARC - KIPP Academy of Opportunity
Page 27 of 30
Last updated: 1/24/2017
Last updated: 1/17/2017
Last updated: 1/24/2017
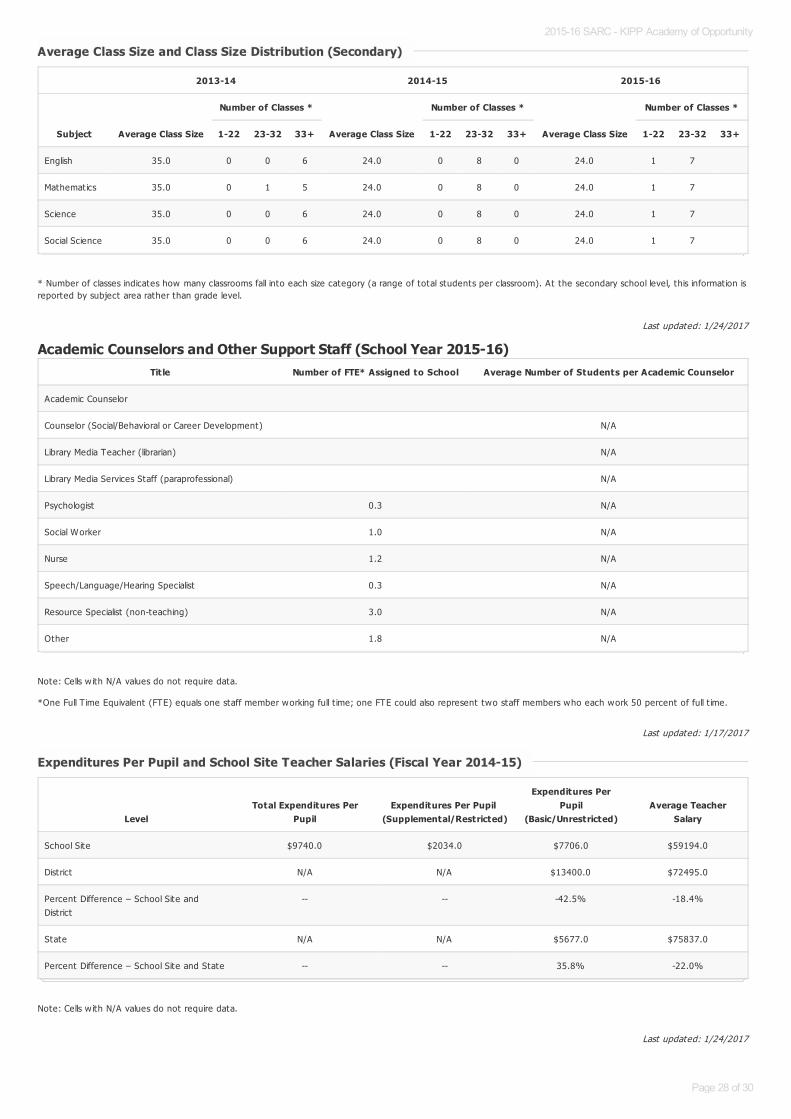
* Number of classes indicates how many classrooms fall into each size category (a range of total students per classroom). At the secondary school level, this information isreported by subject area rather than grade level.
Academic Counselors and Other Support Staff (School Year 2015-16)
Note: Cells w ith N/A values do not require data.
*One Full T ime Equivalent (FTE) equals one staff member working full t ime; one FTE could also represent two staff members who each work 50 percent of full t ime.
Note: Cells w ith N/A values do not require data.
Average Class Size and Class Size Distribution (Secondary)Average Class Size and Class Size Distribution (Secondary)
2013-14 2014-15 2015-16
Subject Average Class Size
Number of Classes *
Average Class Size
Number of Classes *
Average Class Size
Number of Classes *
1-22 23-32 33+ 1-22 23-32 33+ 1-22 23-32 33+
English 35.0 0 0 6 24.0 0 8 0 24.0 1 7
Mathematics 35.0 0 1 5 24.0 0 8 0 24.0 1 7
Science 35.0 0 0 6 24.0 0 8 0 24.0 1 7
Social Science 35.0 0 0 6 24.0 0 8 0 24.0 1 7
Title Number of FTE* Assigned to School Average Number of Students per Academic Counselor
Academic Counselor
Counselor (Social/Behavioral or Career Development) N/A
Library Media Teacher (librarian) N/A
Library Media Services Staff (paraprofessional) N/A
Psychologist 0.3 N/A
Social Worker 1.0 N/A
Nurse 1.2 N/A
Speech/Language/Hearing Specialist 0.3 N/A
Resource Specialist (non-teaching) 3.0 N/A
Other 1.8 N/A
Expenditures Per Pupil and School Site Teacher Salaries (Fiscal Year 2014-15)Expenditures Per Pupil and School Site Teacher Salaries (Fiscal Year 2014-15)
LevelTotal Expenditures Per
PupilExpenditures Per Pupil
(Supplemental/Restricted)
Expenditures PerPupil
(Basic/Unrestricted)Average Teacher
Salary
School Site $9740.0 $2034.0 $7706.0 $59194.0
District N/A N/A $13400.0 $72495.0
Percent Difference – School Site andDistrict
-- -- -42.5% -18.4%
State N/A N/A $5677.0 $75837.0
Percent Difference – School Site and State -- -- 35.8% -22.0%
2015-16 SARC - KIPP Academy of Opportunity
Page 28 of 30
Last updated: 1/17/2017
Last updated: 1/17/2017
For detailed information on salaries, see the CDE Cert ificated Salaries & Benefits Web page at http://www.cde.ca.gov/ds/fd/cs/ .
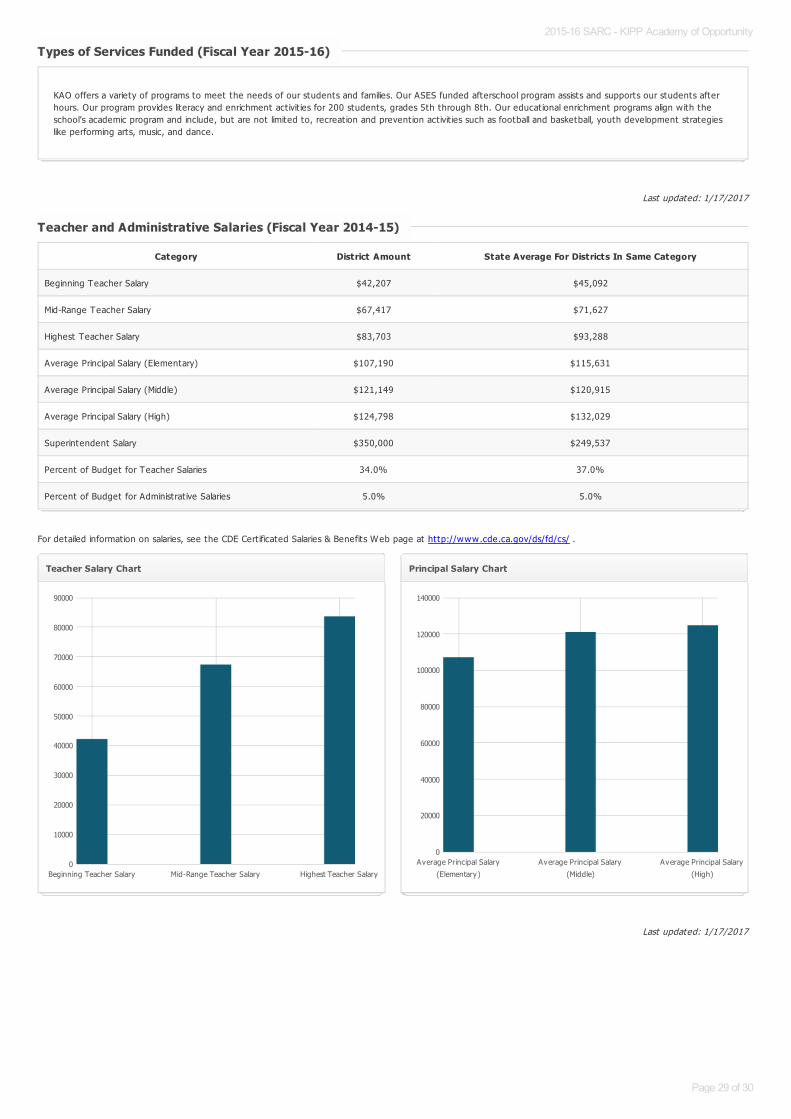
Types of Services Funded (Fiscal Year 2015-16)Types of Services Funded (Fiscal Year 2015-16)
KAO offers a variety of programs to meet the needs of our students and families. Our ASES funded afterschool program assists and supports our students afterhours. Our program provides literacy and enrichment act ivit ies for 200 students, grades 5th through 8th. Our educat ional enrichment programs align w ith theschool’s academic program and include, but are not limited to, recreat ion and prevent ion act ivit ies such as football and basketball, youth development strategieslike performing arts, music, and dance.
Teacher and Administrative Salaries (Fiscal Year 2014-15)Teacher and Administrative Salaries (Fiscal Year 2014-15)
Category District Amount State Average For Districts In Same Category
Beginning Teacher Salary $42,207 $45,092
Mid-Range Teacher Salary $67,417 $71,627
Highest Teacher Salary $83,703 $93,288
Average Principal Salary (Elementary) $107,190 $115,631
Average Principal Salary (Middle) $121,149 $120,915
Average Principal Salary (High) $124,798 $132,029
Superintendent Salary $350,000 $249,537
Percent of Budget for Teacher Salaries 34.0% 37.0%
Percent of Budget for Administrat ive Salaries 5.0% 5.0%
Teacher Salary Chart
Beginning Teacher Salary Mid-Range Teacher Salary Highest Teacher Salary0
10000
20000
30000
40000
50000
60000
70000
80000
90000
Principal Salary Chart
Average Principal Salary
(Elementary)
Average Principal Salary
(Middle)
Average Principal Salary
(High)
0
20000
40000
60000
80000
100000
120000
140000
2015-16 SARC - KIPP Academy of Opportunity
Page 29 of 30

Last updated: 1/17/2017
Professional DevelopmentProfessional Development
Our professional development is highly individualized and driven by core competencies of the KIPP Framework for Excellent Teaching and a focus on data-driveninstruct ion. Each teacher has a set of personal goals that include performance metrics as well as development goals. These align w ith whole-school priorit ies andcombine to drive professional development planning. Weekly staff PD occurs in modules consist ing of 4-6 week focus areas and include whole school topics,individualized strands and professional learning communit ies by department.
2015-16 SARC - KIPP Academy of Opportunity
Page 30 of 30