Embed Size (px)
Citation preview
Dr. Lewis Dolphin Stallworth Sr. Charter
By February 1 of each year, every school in California is required by state law to publish a School Accountability Report Card (SARC).The SARC contains information aboutthe condit ion and performance of each California public school. Under the Local Control Funding Formula (LCFF) all local educat ional agencies (LEAs) are required toprepare a Local Control Accountability Plan (LCAP), which describes how they intend to meet annual school-specific goals for all pupils, w ith specific act ivit ies to addressstate and local priorit ies. Addit ionally, data reported in an LCAP is to be consistent w ith data reported in the SARC.
For more information about SARC requirements, see the California Department of Educat ion (CDE) SARC Web page at http://www.cde.ca.gov/ta/ac/sa/.
For more information about the LCFF or LCAP, see the CDE LCFF Web page at http://www.cde.ca.gov/fg/aa/lc/.
For addit ional information about the school, parents/guardians, and community members should contact the school principal or the district office.
DataQuest
Internet Access
California Department of Education
School Accountability Report CardReported Using Data from the 2014-15 School Year
Published During 2015-16
DataQuest is an online data tool located on the CDE DataQuest Web page that contains addit ional information about this school and comparisons of the school tothe district , the county, and the state. Specifically, DataQuest is a dynamic system that provides reports for accountability (e.g., test data, enrollment, highschool graduates, dropouts, course enrollments, staffing, and data regarding English learners.
Internet access is available at public libraries and other locat ions that are publicly accessible (e.g., the California State Library). Access to the Internet at librariesand public locat ions is generally provided on a first-come, first-served basis. Other use restrict ions may include the hours of operat ion, the length of t ime that aworkstat ion may be used (depending on availability), the types of software programs available on a workstat ion, and the ability to print documents.
Robin Moorezaid, PrincipalPrincipal, Dr. Lewis Dolphin Stallworth Sr. Charter
January 26, 2016
Robin MooreZaid Stallworth Charter School1610 East Main Street
The goal of Stallworth Charter School’s New “Pyramid of Learning” program now serving students from TK-8 grade is toprovide an instruct ional program that reflects the personal concerns and high expectat ions of all students using aResponse to Intervent ion (RTI) model align to the Common Core State Standards. This data-driven program allows staffto track performance, collaborate, and set quarterly goals using a comprehensive planning system that is studentcentered focusing on their individual academic and social needs. Our curriculum is designed to be interact ive w ith asupplemental blended learning component that diagnosis and track progress. A partnership between home, school andthe community ensures an environment that is a posit ive experience for all. Teachers work in teams to promote highexpectat ions and academic achievement.Robin MooreZaidPrincipalStallworth Charter School
A NOTE ABOUT THE SCHOOL: Stallworth Charter services a new TK-8 program start ing in the 2013/14 fiscal year thatcombines elementary and middle school together ending its former K-12 program. For this reason, the past API scores donot reflect the current student body.
The Mission To produce students who w ill be academically sound and socially responsible while embracing the rapid environmentalchanges and diversit ies of the 21st Century.
About Our SchoolAbout Our School

The new Pyramid of Learning program that serves TK-8 grades implements a set of problem solving strategies andprocesses used to build upon the school’s exist ing strengths. Embedded w ithin the curriculum is a school-w ide Posit iveBehavioral Intervent ion Support (PBIS) system, which has characterist ics that overlap w ith other init iat ives designed toenhance the PLC (Professional Learning Community) concept. For example, a shared vision and values that lead to acollect ive commitment of school staff, which is expressed in day-to-day pract ices that encourage act ively sought solut ions;openness to new ideas; working teams cooperate to achieve common goals; encouragement of experimentat ion as anopportunity to learn; cont inuous improvement based on evaluat ion of outcomes; and reflect ion in order to study theoperat ion and impacts of act ions taken while aggressive, unsafe behaviors are discouraged. We emphasize respect,responsibility, reflect ion, cooperat ion, and other highly valued character traits, which are taught, encouraged, andpract iced..
T ier I It is est imated that the first t ier reach 80% of the student populat ion w ith a curriculum designed to meet the challengesof the Common Core State Standards (CCSS). Our curriculum materials are more digitally interact ive w ith an adequateamount of online resources adaptable to the revisions of the Common Core Standards. Formative and summativeassessments are embedded w ithin the materials alongside the school-w ide benchmarks (what the students should knowat grade level) so that teachers focus on student learning. This allows students the opportunity to use what they havelearned in new situat ions or new texts so that they transfer and apply their understanding. The reading materials make iteasy to different iate, manage groups, and personalize instruct ion. The math material combines a comprehensive mathcurriculum, powerful best pract ices in teaching, and easy to use technology for personalized instruct ion that effect ivelyaddresses the students' specific need.
T ier II Targeted Intervent ion is the second t ier of the program designed for an est imated 15% of students who are strugglingw ith either learning deficits or behavioral hindrances. At this level students are provided w ith support in small groups insideor outside the classrooms under the teacher or educat ional leader's direct ions. This allows for assistance w ith areas ofneed using instruments such as an electronic instruct ion program, tutors, counselors, or resource specialists. This t ier alsoallows for more targeted yet posit ive focus for enhancing the culture, which includes a leadership componentimplemented for specific groups. The leadership component is designed to empower students to recognize their intrinsicabilit ies to lead in all areas of their life. Leadership development training helps students connect w ith the essence of theirunique gifts and talents by recognizing and embracing strengths while breaking free from the barriers of self-imposedlimits. The main purpose of this program is to prepare students for the next phase in their journey towards being collegeand careers ready. Another init iat ive that enhances this level is the extra-curricular act ivit ies designed specifically for interest groups. Studentswho have various act ivit ies and interests are encouraged to vote and or design clubs of concentrat ion.
T ier III This level services students needing Intensive support. We have implemented a 3rd t ier that promotes the success ofstudents whose learning have been impacted by learning and behavioral deficits on several areas of development. Theyalso require intense and frequent supports to opt imize their learning achievements. At this level, we reach-out to anest imated 5% of the populat ion.
What do intensive supports include? • professional services from speech and language pathologists, psychologists, occupat ional therapists, social workers, etc.; • extra help from student support teachers; • medical or community-based services/referrals; and, • assist ive technologies such as computer software or hardware
Dr. Lew is Dolphin Stallworth Sr. Charter1610 East Main St.Stockton, CA 95205-5521
Phone: 209-948-4511E-mail: [email protected]
ContactContact
2014-15 SARC - Dr. Lewis Dolphin Stallworth Sr. Charter
Page 2 of 39

Last updated: 2/1/2016
Last updated: 2/1/2016
About This School
Contact Information - Most Recent YearContact Information - Most Recent Year
District Contact Information - Most Recent Year
District Name Stockton Unified
Phone Number (209) 933-7000
Superintendent Julie Penn
E-mail Address [email protected]
Web Site www.stocktonusd.net
School Contact Information - Most Recent Year
School Name Dr. Lew is Dolphin Stallworth Sr. Charter
Street 1610 East Main St.
City, State, Zip Stockton, Ca, 95205-5521
Phone Number 209-948-4511
Principal Robin Moorezaid, Principal
E-mail Address [email protected]
Web Site www.stallworthcharter.org
County-District-School (CDS) Code
39686760117853
School Description and Mission Statement - Most Recent YearSchool Description and Mission Statement - Most Recent Year
Dr. Lew is D. Stallworth Sr., Charter School, Inc. (DLDSSCSI) is an Independent Charter. Dr. Lew is Dolphin Stallworth, Sr., founded this Charter School to providea safe environment where students can develop into competent, responsible, adapt ive cit izens who are physically fit , healthy lifelong learners and capable problemsolvers.
The Vision for Stallworth Charter is one that fosters unity, honors interdependence, and encourages a sense of purpose through the educat ional process in a waythat benefits the community and family.
The Mission Statement: To produce students who w ill be academically sound and socially responsible, while embracing the rapid environment changes anddiversity in this 21st Century.
2014-15 SARC - Dr. Lewis Dolphin Stallworth Sr. Charter
Page 3 of 39

Last updated: 2/1/2016
Last updated: 2/1/2016
Student Enrollment by Grade Level (School Year 2014-15)Student Enrollment by Grade Level (School Year 2014-15)
Grade Level Number of Students
Kindergarten 56
Grade 1 27
Grade 2 25
Grade 3 23
Grade 4 23
Grade 5 19
Grade 6 11
Grade 7 17
Grade 8 14
Total Enrollment 215
KindergartenGrade 1 Grade 2 Grade 3 Grade 4 Grade 5 Grade 6 Grade 7 Grade 80
10
20
30
40
50
60
Student Enrollment by Student Group (School Year 2014-15)Student Enrollment by Student Group (School Year 2014-15)
Student Group Percent of Total Enrollment
Black or African American 30.7 %
American Indian or Alaska Nat ive 1.9 %
Asian 0.0 %
Filipino 0.0 %
Hispanic or Lat ino 53.5 %
Native Hawaiian or Pacific Islander 0.0 %
White 6.5 %
Two or More Races 7.4 %
Socioeconomically Disadvantaged 100.0 %
English Learners 22.3 %
Students w ith Disabilit ies 8.8 %
Foster Youth 5.6 %
Black or African American
American Indian or A laska Native
Asian
Filipino
Hispanic or Latino
Native Hawaiian or Pacific Islander
White
Two or More Races
Socioeconomically Disadvantaged
English Learners
Students with Disabilities
Foster Youth
30%
1%
53%
6%7%
100%
22%
8%5%
2014-15 SARC - Dr. Lewis Dolphin Stallworth Sr. Charter
Page 4 of 39

Last updated: 2/1/2016
Last updated: 2/1/2016
A. Conditions of Learning
State Priority: Basic
The SARC provides the follow ing information relevant to the State priority: Basic (Priority 1):
Degree to which teachers are appropriately assigned and fully credent ialed in the subject area and for the pupils they are teaching;Pupils have access to standards-aligned instruct ional materials; andSchool facilit ies are maintained in good repair
Note: “Misassignments” refers to the number of posit ions filled by teachers who lack legal authorizat ion to teach that grade level, subject area, student group, etc.
* Total Teacher Misassignments includes the number of Misassignments of Teachers of English learners.
Teacher CredentialsTeacher Credentials
Teachers School District
2013-14
2014-15
2015-16
2015-16
With Full Credent ial 7 4 5
W ithout Full Credent ial 2 4 5
Teachers Teaching Outside SubjectArea of Competence (w ith fullcredent ial)
0 1 0
2013-14 2014-15 2015-160
1
2
3
4
5
6
7
8Teachers with Full Credential
Teachers without Full Credential
Teachers Teaching Outside Subject Area of Competence
Teacher Misassignments and Vacant Teacher PositionsTeacher Misassignments and Vacant Teacher Positions
Indicator2013-
142014-
152015-
16
Misassignments of Teachers of EnglishLearners
1 2 5
Total Teacher Misassignments* 1 2 5
Vacant Teacher Posit ions 1 1 2
2013-14 2014-15 2015-160.5
1.0
1.5
2.0
2.5
3.0
3.5
4.0
4.5
5.0
5.5Misassignments of Teachers of English Learners
Total Teacher Misassignments
Vacant Teacher Positions
2014-15 SARC - Dr. Lewis Dolphin Stallworth Sr. Charter
Page 5 of 39

Note: High-poverty schools are defined as those schools w ith student eligibility of approximately 40 percent or more in the free and reduced price meals program. Low-poverty schools are those w ith student eligibility of approximately 39 percent or less in the free and reduced price meals program.
Year and month in which data were collected: July 2014
Core Academic Classes Taught by Highly Qualified Teachers (School Year 2014-15)Core Academic Classes Taught by Highly Qualified Teachers (School Year 2014-15)
Location of ClassesPercent of Classes In Core Academic Subjects Taught by
Highly Qualified TeachersPercent of Classes In Core Academic Subjects Not Taught by
Highly Qualified Teachers
This School 100.0% 0.0%
All Schools in District 96.0% 4.0%
High-Poverty Schoolsin District
96.0% 4.0%
Low-Poverty Schoolsin District
0.0% 0.0%
Quality, Currency, Availability of Textbooks and Instructional Materials - Most Recent YearQuality, Currency, Availability of Textbooks and Instructional Materials - Most Recent Year
SubjectTextbooks and Instructional Materials/year of
AdoptionFrom Most Recent
Adoption?Percent Students Lacking Own Assigned
Copy
Reading/Language ArtsReading Street Text (Grade K-6)
Reading & Writ ing Street Student Notebook (Grades K- 6)
Literature Volume 1 and 2 (Grade 7-8)
Teacher Addit ions Reading accompanied each StudentText
Yes 0.0 %
MathematicsenVision Math (Grades K - 5)
Digits (Grades 6 - 8)
enVision Math Student Workbook
enVision Math Student Comparison Workbook
Teachers Editon ot accompany Student Text
Industruct ional CD's fo each Grade
Yes 0.0 %
ScienceNav Energy Foundat ions
Nav Energy in Physcial Systems
Science Navigator Process Skills
Science Nav Energy Foundat ions Teacher Kit
Science Nav Energy in Living Systems Teacher Kit
Science Nav in Physical Process Skills Teacher Kit
0.0 %
History-Social ScienceReflect ions: Making a New Nation (Grade 5)
Reflect ions: Ancient Civizat ins (Grade 6)
Medieval and Early Modern T imes (Grade 7)
America: History of Our Nat ion (Grade 8)
0.0 %
Foreign Language 0.0 %
Health 0.0 %
Visual and Performing Arts 0.0 %
Science Lab Eqpmt (Grades9-12)
0.0 %
2014-15 SARC - Dr. Lewis Dolphin Stallworth Sr. Charter
Page 6 of 39

Last updated: 2/1/2016
2014-15 SARC - Dr. Lewis Dolphin Stallworth Sr. Charter
Page 7 of 39
Last updated: 2/1/2016
Last updated: 2/1/2016
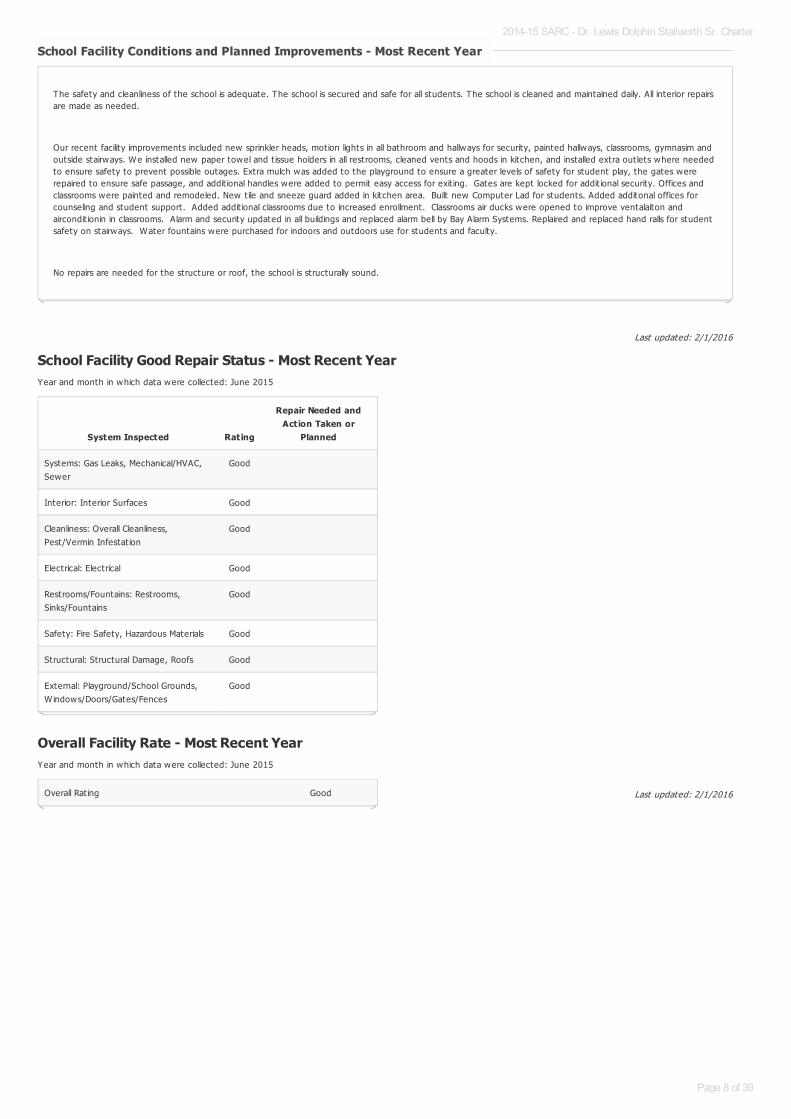
School Facility Good Repair Status - Most Recent YearYear and month in which data were collected: June 2015
Overall Facility Rate - Most Recent YearYear and month in which data were collected: June 2015
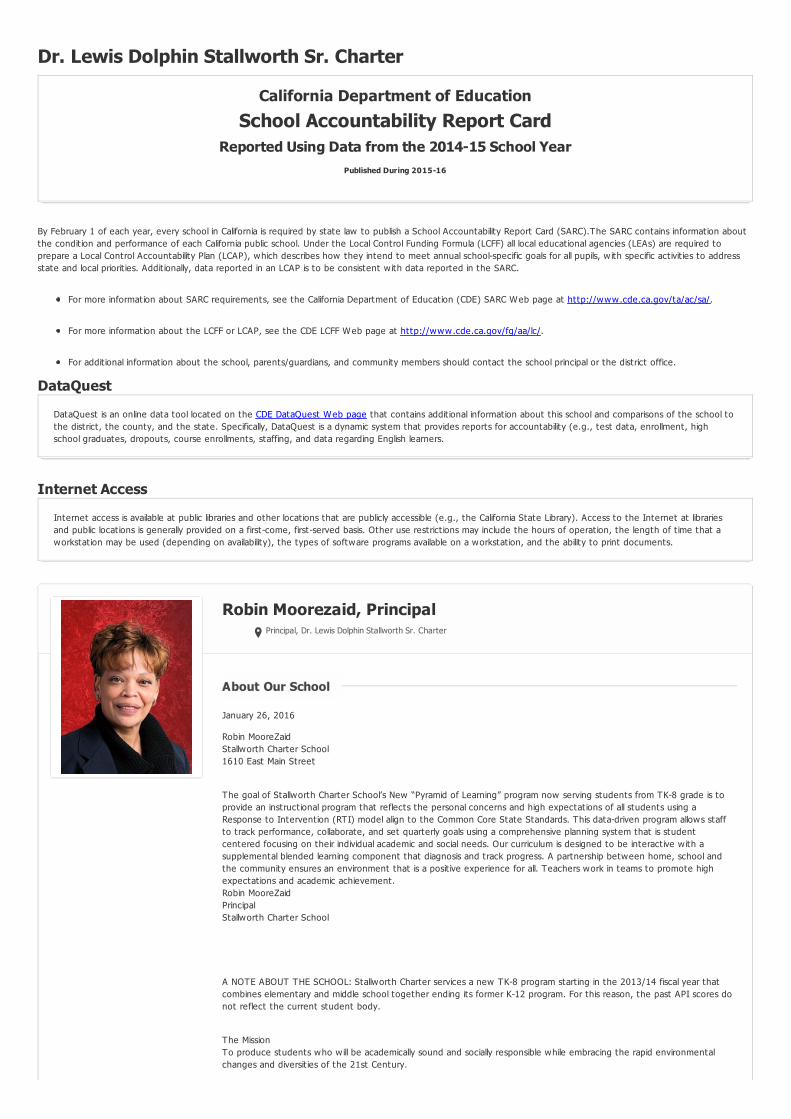
School Facility Conditions and Planned Improvements - Most Recent YearSchool Facility Conditions and Planned Improvements - Most Recent Year
The safety and cleanliness of the school is adequate. The school is secured and safe for all students. The school is cleaned and maintained daily. All interior repairsare made as needed.
Our recent facility improvements included new sprinkler heads, motion lights in all bathroom and hallways for security, painted hallways, classrooms, gymnasim andoutside stairways. We installed new paper towel and t issue holders in all restrooms, cleaned vents and hoods in kitchen, and installed extra out lets where neededto ensure safety to prevent possible outages. Extra mulch was added to the playground to ensure a greater levels of safety for student play, the gates wererepaired to ensure safe passage, and addit ional handles were added to permit easy access for exit ing. Gates are kept locked for addit ional security. Offices andclassrooms were painted and remodeled. New t ile and sneeze guard added in kitchen area. Built new Computer Lad for students. Added additonal offices forcounseling and student support. Added addit ional classrooms due to increased enrollment. Classrooms air ducks were opened to improve ventalaiton andaircondit ionin in classrooms. Alarm and security updated in all buildings and replaced alarm bell by Bay Alarm Systems. Replaired and replaced hand ralls for studentsafety on stairways. Water fountains were purchased for indoors and outdoors use for students and faculty.
No repairs are needed for the structure or roof, the school is structurally sound.
System Inspected Rating
Repair Needed andAction Taken or
Planned
Systems: Gas Leaks, Mechanical/HVAC,Sewer
Good
Interior: Interior Surfaces Good
Cleanliness: Overall Cleanliness,Pest/Vermin Infestat ion
Good
Electrical: Electrical Good
Restrooms/Fountains: Restrooms,Sinks/Fountains
Good
Safety: Fire Safety, Hazardous Materials Good
Structural: Structural Damage, Roofs Good
External: Playground/School Grounds,W indows/Doors/Gates/Fences
Good
Overall Rat ing Good
2014-15 SARC - Dr. Lewis Dolphin Stallworth Sr. Charter
Page 8 of 39

Last updated: 2/1/2016
B. Pupil Outcomes
State Priority: Pupil Achievement
The SARC provides the follow ing information relevant to the State priority: Pupil Achievement (Priority 4):
Statew ide assessments (i.e., California Assessment of Student Performance and Progress [CAASPP], Science California Standards Tests); andThe percentage of pupils who have successfully completed courses that sat isfy the requirements for entrance to the University of California and the CaliforniaState University, or career technical educat ion sequences or programs of study
Test Resuts are as follows
Note: Percentages are not calculated when the number of students tested is ten or less, either because the number of students in this category is too small forstat ist ical accuracy or to protect student privacy. Double dashes (--) appear in the table when the number of students tested is ten or less.
California Assessment of Student Performance and Progress Results for All Students (School Year 2014-15)California Assessment of Student Performance and Progress Results for All Students (School Year 2014-15)
Subject
Percent of Students Meeting or Exceeding the State Standards
School District State
English Language Arts / Literacy (grades 3-8 and 11) 0.0% 23.0% 44.0%
Mathematics (grades 3-8 and 11) 0.0% 17.0% 33.0%
2014-15 SARC - Dr. Lewis Dolphin Stallworth Sr. Charter
Page 9 of 39

Last updated: 2/1/2016
Double dashes (--) appear in the table when the number of students is ten or less, either because the number of students in this category is too small for stat ist icalaccuracy or to protect student privacy.
Note: The number of students tested includes students that did not receive a score; however the number of students tested is not the number that was used tocalculate the achievement level percentages. The achievement level percentages are calculated using students w ith scores.
* Level 1 = Standard not met Level 2 = Standard nearly met Level 3 = Standard met Level 4 = Standard exceeded
CAASPP Assessment Results - English Language Arts (ELA) CAASPP Assessment Results - English Language Arts (ELA)
Disaggregated by Student Groups, Grades Three through Eight and Eleven (School Year 2014-15)Disaggregated by Student Groups, Grades Three through Eight and Eleven (School Year 2014-15)
ELA - Grade 3ELA - Grade 3
Student GroupTotal
EnrollmentNumberTested
PercentTested
PercentAchievement
Level 1*
PercentAchievement
Level 2*
PercentAchievement
Level 3*
PercentAchievement
Level 4*
All Students 30 29 96.7% 3.0% 0.0% 0.0% 0.0%
Male 30 16 53.3% 0.0% 0.0% 0.0% 0.0%
Female 30 13 43.3% 8.0% 0.0% 0.0% 0.0%
Black or African American 30 12 40.0% 8.0% 0.0% 0.0% 0.0%
American Indian or Alaska Nat ive 0 0 0.0% 0.0% 0.0% 0.0% 0.0%
Asian 30 0 0.0% -- -- -- --
Filipino 0 0 0.0% 0.0% 0.0% 0.0% 0.0%
Hispanic or Lat ino 30 10 33.3% -- -- -- --
Nat ive Hawaiian or Pacific Islander 0 0 0.0% 0.0% 0.0% 0.0% 0.0%
White 30 3 10.0% -- -- -- --
Two or More Races 30 4 13.3% -- -- -- --
Socioeconomically Disadvantaged 30 28 93.3% 4.0% 0.0% 0.0% 0.0%
English Learners 30 5 16.7% -- -- -- --
Students w ith Disabilit ies 30 4 13.3% -- -- -- --
Students Receiving MigrantEducat ion Services
0 0 0.0% 0.0% 0.0% 0.0% 0.0%
Foster Youth -- -- -- -- -- -- --
2014-15 SARC - Dr. Lewis Dolphin Stallworth Sr. Charter
Page 10 of 39

Last updated: 2/1/2016
Double dashes (--) appear in the table when the number of students is ten or less, either because the number of students in this category is too small for stat ist icalaccuracy or to protect student privacy.
Note: The number of students tested includes students that did not receive a score; however the number of students tested is not the number that was used tocalculate the achievement level percentages. The achievement level percentages are calculated using students w ith scores.
* Level 1 = Standard not met Level 2 = Standard nearly met Level 3 = Standard met Level 4 = Standard exceeded
ELA - Grade 4ELA - Grade 4
Student GroupTotal
EnrollmentNumberTested
PercentTested
PercentAchievement
Level 1*
PercentAchievement
Level 2*
PercentAchievement
Level 3*
PercentAchievement
Level 4*
All Students 28 23 82.1% 0.0% 0.0% 0.0% 0.0%
Male 28 14 50.0% 0.0% 0.0% 0.0% 0.0%
Female 28 9 32.1% -- -- -- --
Black or African American 28 9 32.1% -- -- -- --
American Indian or Alaska Nat ive 0 0 0.0% 0.0% 0.0% 0.0% 0.0%
Asian 0 0 0.0% 0.0% 0.0% 0.0% 0.0%
Filipino 0 0 0.0% 0.0% 0.0% 0.0% 0.0%
Hispanic or Lat ino 28 12 42.9% 0.0% 0.0% 0.0% 0.0%
Native Hawaiian or Pacific Islander 0 0 0.0% 0.0% 0.0% 0.0% 0.0%
White 0 0 0.0% 0.0% 0.0% 0.0% 0.0%
Two or More Races 28 1 3.6% -- -- -- --
Socioeconomically Disadvantaged 28 22 78.6% 0.0% 0.0% 0.0% 0.0%
English Learners 28 6 21.4% -- -- -- --
Students w ith Disabilit ies 28 8 28.6% -- -- -- --
Students Receiving MigrantEducat ion Services
0 0 0.0% 0.0% 0.0% 0.0% 0.0%
Foster Youth -- -- -- -- -- -- --
2014-15 SARC - Dr. Lewis Dolphin Stallworth Sr. Charter
Page 11 of 39

Last updated: 2/1/2016
Double dashes (--) appear in the table when the number of students is ten or less, either because the number of students in this category is too small for stat ist icalaccuracy or to protect student privacy.
Note: The number of students tested includes students that did not receive a score; however the number of students tested is not the number that was used tocalculate the achievement level percentages. The achievement level percentages are calculated using students w ith scores.
* Level 1 = Standard not met Level 2 = Standard nearly met Level 3 = Standard met Level 4 = Standard exceeded
ELA - Grade 5ELA - Grade 5
Student GroupTotal
EnrollmentNumberTested
PercentTested
PercentAchievement
Level 1*
PercentAchievement
Level 2*
PercentAchievement
Level 3*
PercentAchievement
Level 4*
All Students 20 20 100.0% 0.0% 0.0% 0.0% 0.0%
Male 20 9 45.0% -- -- -- --
Female 20 11 55.0% 0.0% 0.0% 0.0% 0.0%
Black or African American 20 6 30.0% -- -- -- --
American Indian or Alaska Nat ive 20 1 5.0% -- -- -- --
Asian 0 0 0.0% 0.0% 0.0% 0.0% 0.0%
Filipino 0 0 0.0% 0.0% 0.0% 0.0% 0.0%
Hispanic or Lat ino 20 7 35.0% -- -- -- --
Nat ive Hawaiian or Pacific Islander 0 0 0.0% 0.0% 0.0% 0.0% 0.0%
White 20 1 5.0% -- -- -- --
Two or More Races 20 5 25.0% -- -- -- --
Socioeconomically Disadvantaged 20 20 100.0% 0.0% 0.0% 0.0% 0.0%
English Learners 20 6 30.0% -- -- -- --
Students w ith Disabilit ies 20 3 15.0% -- -- -- --
Students Receiving MigrantEducat ion Services
0 0 0.0% 0.0% 0.0% 0.0% 0.0%
Foster Youth -- -- -- -- -- -- --
2014-15 SARC - Dr. Lewis Dolphin Stallworth Sr. Charter
Page 12 of 39

Last updated: 2/1/2016
Double dashes (--) appear in the table when the number of students is ten or less, either because the number of students in this category is too small for stat ist icalaccuracy or to protect student privacy.
Note: The number of students tested includes students that did not receive a score; however the number of students tested is not the number that was used tocalculate the achievement level percentages. The achievement level percentages are calculated using students w ith scores.
* Level 1 = Standard not met Level 2 = Standard nearly met Level 3 = Standard met Level 4 = Standard exceeded
ELA- ELA- Grade 6Grade 6
Student GroupTotal
EnrollmentNumberTested
PercentTested
PercentAchievement
Level 1*
PercentAchievement
Level 2*
PercentAchievement
Level 3*
PercentAchievement
Level 4*
All Students 13 12 92.3% 8.0% 0.0% 0.0% 0.0%
Male 13 6 46.2% -- -- -- --
Female 13 6 46.2% -- -- -- --
Black or African American 13 4 30.8% -- -- -- --
American Indian or Alaska Nat ive 0 0 0.0% 0.0% 0.0% 0.0% 0.0%
Asian 0 0 0.0% 0.0% 0.0% 0.0% 0.0%
Filipino 0 0 0.0% 0.0% 0.0% 0.0% 0.0%
Hispanic or Lat ino 13 6 46.2% -- -- -- --
Nat ive Hawaiian or Pacific Islander 0 0 0.0% 0.0% 0.0% 0.0% 0.0%
White 13 1 7.7% -- -- -- --
Two or More Races 13 1 7.7% -- -- -- --
Socioeconomically Disadvantaged 13 11 84.6% 0.0% 0.0% 0.0% 0.0%
English Learners 13 3 23.1% -- -- -- --
Students w ith Disabilit ies 13 1 7.7% -- -- -- --
Students Receiving MigrantEducat ion Services
0 0 0.0% 0.0% 0.0% 0.0% 0.0%
Foster Youth -- -- -- -- -- -- --
2014-15 SARC - Dr. Lewis Dolphin Stallworth Sr. Charter
Page 13 of 39

Last updated: 2/1/2016
Double dashes (--) appear in the table when the number of students is ten or less, either because the number of students in this category is too small for stat ist icalaccuracy or to protect student privacy.
Note: The number of students tested includes students that did not receive a score; however the number of students tested is not the number that was used tocalculate the achievement level percentages. The achievement level percentages are calculated using students w ith scores.
* Level 1 = Standard not met Level 2 = Standard nearly met Level 3 = Standard met Level 4 = Standard exceeded
ELA - Grade 7ELA - Grade 7
Student GroupTotal
EnrollmentNumberTested
PercentTested
PercentAchievement
Level 1*
PercentAchievement
Level 2*
PercentAchievement
Level 3*
PercentAchievement
Level 4*
All Students 17 14 82.4% 0.0% 0.0% 0.0% 0.0%
Male 17 6 35.3% -- -- -- --
Female 17 8 47.1% -- -- -- --
Black or African American 17 4 23.5% -- -- -- --
American Indian or Alaska Nat ive 0 0 0.0% 0.0% 0.0% 0.0% 0.0%
Asian 0 0 0.0% 0.0% 0.0% 0.0% 0.0%
Filipino 0 0 0.0% 0.0% 0.0% 0.0% 0.0%
Hispanic or Lat ino 17 7 41.2% -- -- -- --
Nat ive Hawaiian or Pacific Islander 0 0 0.0% 0.0% 0.0% 0.0% 0.0%
White 17 1 5.9% -- -- -- --
Two or More Races 17 1 5.9% -- -- -- --
Socioeconomically Disadvantaged 17 14 82.4% 0.0% 0.0% 0.0% 0.0%
English Learners 17 4 23.5% -- -- -- --
Students w ith Disabilit ies 17 4 23.5% -- -- -- --
Students Receiving MigrantEducat ion Services
0 0 0.0% 0.0% 0.0% 0.0% 0.0%
Foster Youth -- -- -- -- -- -- --
2014-15 SARC - Dr. Lewis Dolphin Stallworth Sr. Charter
Page 14 of 39

Last updated: 2/1/2016
Double dashes (--) appear in the table when the number of students is ten or less, either because the number of students in this category is too small for stat ist icalaccuracy or to protect student privacy.
Note: The number of students tested includes students that did not receive a score; however the number of students tested is not the number that was used tocalculate the achievement level percentages. The achievement level percentages are calculated using students w ith scores.
* Level 1 = Standard not met Level 2 = Standard nearly met Level 3 = Standard met Level 4 = Standard exceeded
ELA - Grade 8ELA - Grade 8
Student GroupTotal
EnrollmentNumberTested
PercentTested
PercentAchievement
Level 1*
PercentAchievement
Level 2*
PercentAchievement
Level 3*
PercentAchievement
Level 4*
All Students 13 11 84.6% 0.0% 0.0% 0.0% 0.0%
Male 13 6 46.2% -- -- -- --
Female 13 5 38.5% -- -- -- --
Black or African American 13 5 38.5% -- -- -- --
American Indian or Alaska Nat ive 13 1 7.7% -- -- -- --
Asian 0 0 0.0% 0.0% 0.0% 0.0% 0.0%
Filipino 0 0 0.0% 0.0% 0.0% 0.0% 0.0%
Hispanic or Lat ino 13 5 38.5% -- -- -- --
Nat ive Hawaiian or Pacific Islander 0 0 0.0% 0.0% 0.0% 0.0% 0.0%
White 0 0 0.0% 0.0% 0.0% 0.0% 0.0%
Two or More Races 0 0 0.0% 0.0% 0.0% 0.0% 0.0%
Socioeconomically Disadvantaged 13 11 84.6% 0.0% 0.0% 0.0% 0.0%
English Learners 13 3 23.1% -- -- -- --
Students w ith Disabilit ies 13 2 15.4% -- -- -- --
Students Receiving MigrantEducat ion Services
0 0 0.0% 0.0% 0.0% 0.0% 0.0%
Foster Youth -- -- -- -- -- -- --
2014-15 SARC - Dr. Lewis Dolphin Stallworth Sr. Charter
Page 15 of 39

Last updated: 2/1/2016
Double dashes (--) appear in the table when the number of students is ten or less, either because the number of students in this category is too small for stat ist icalaccuracy or to protect student privacy.
Note: The number of students tested includes students that did not receive a score; however the number of students tested is not the number that was used tocalculate the achievement level percentages. The achievement level percentages are calculated using students w ith scores.
* Level 1 = Standard not met Level 2 = Standard nearly met Level 3 = Standard met Level 4 = Standard exceeded
ELA - Grade 11ELA - Grade 11
Student GroupTotal
EnrollmentNumberTested
PercentTested
PercentAchievement
Level 1*
PercentAchievement
Level 2*
PercentAchievement
Level 3*
PercentAchievement
Level 4*
All Students -- -- -- -- -- -- --
Male -- -- -- -- -- -- --
Female -- -- -- -- -- -- --
Black or African American -- -- -- -- -- -- --
American Indian or Alaska Nat ive -- -- -- -- -- -- --
Asian -- -- -- -- -- -- --
Filipino -- -- -- -- -- -- --
Hispanic or Lat ino -- -- -- -- -- -- --
Nat ive Hawaiian or Pacific Islander -- -- -- -- -- -- --
White -- -- -- -- -- -- --
Two or More Races -- -- -- -- -- -- --
Socioeconomically Disadvantaged -- -- -- -- -- -- --
English Learners -- -- -- -- -- -- --
Students w ith Disabilit ies -- -- -- -- -- -- --
Students Receiving MigrantEducat ion Services
-- -- -- -- -- -- --
Foster Youth -- -- -- -- -- -- --
2014-15 SARC - Dr. Lewis Dolphin Stallworth Sr. Charter
Page 16 of 39

Last updated: 2/1/2016
Double dashes (--) appear in the table when the number of students is ten or less, either because the number of students in this category is too small for stat ist icalaccuracy or to protect student privacy.
Note: The number of students tested includes students that did not receive a score; however the number of students tested is not the number that was used tocalculate the achievement level percentages. The achievement level percentages are calculated using students w ith scores.
* Level 1 = Standard not met Level 2 = Standard nearly met Level 3 = Standard met Level 4 = Standard exceeded
CAASPP Assessment Results - Mathematics CAASPP Assessment Results - Mathematics
Disaggregated by Student Groups, Grades Three through Eight and Eleven (School Year 2014-15)Disaggregated by Student Groups, Grades Three through Eight and Eleven (School Year 2014-15)
Mathematics - Grade 3Mathematics - Grade 3
Student GroupTotal
EnrollmentNumberTested
PercentTested
PercentAchievement
Level 1*
PercentAchievement
Level 2*
PercentAchievement
Level 3*
PercentAchievement
Level 4*
All Students 30 27 90.0% 0.0% 0.0% 0.0% 0.0%
Male 30 15 50.0% 0.0% 0.0% 0.0% 0.0%
Female 30 12 40.0% 0.0% 0.0% 0.0% 0.0%
Black or African American 30 10 33.3% -- -- -- --
American Indian or Alaska Nat ive 0 0 0.0% 0.0% 0.0% 0.0% 0.0%
Asian 30 0 0.0% -- -- -- --
Filipino 0 0 0.0% 0.0% 0.0% 0.0% 0.0%
Hispanic or Lat ino 30 10 33.3% -- -- -- --
Nat ive Hawaiian or Pacific Islander 0 0 0.0% 0.0% 0.0% 0.0% 0.0%
White 30 3 10.0% -- -- -- --
Two or More Races 30 4 13.3% -- -- -- --
Socioeconomically Disadvantaged 30 26 86.7% 0.0% 0.0% 0.0% 0.0%
English Learners 30 5 16.7% -- -- -- --
Students w ith Disabilit ies 30 4 13.3% -- -- -- --
Students Receiving MigrantEducat ion Services
0 0 0.0% 0.0% 0.0% 0.0% 0.0%
Foster Youth -- -- -- -- -- -- --
2014-15 SARC - Dr. Lewis Dolphin Stallworth Sr. Charter
Page 17 of 39

Last updated: 2/1/2016
Double dashes (--) appear in the table when the number of students is ten or less, either because the number of students in this category is too small for stat ist icalaccuracy or to protect student privacy.
Note: The number of students tested includes students that did not receive a score; however the number of students tested is not the number that was used tocalculate the achievement level percentages. The achievement level percentages are calculated using students w ith scores.
* Level 1 = Standard not met Level 2 = Standard nearly met Level 3 = Standard met Level 4 = Standard exceeded
Mathematics - Grade 4Mathematics - Grade 4
Student GroupTotal
EnrollmentNumberTested
PercentTested
PercentAchievement
Level 1*
PercentAchievement
Level 2*
PercentAchievement
Level 3*
PercentAchievement
Level 4*
All Students 28 23 82.1% 0.0% 0.0% 0.0% 0.0%
Male 28 14 50.0% 0.0% 0.0% 0.0% 0.0%
Female 28 9 32.1% -- -- -- --
Black or African American 28 9 32.1% -- -- -- --
American Indian or Alaska Nat ive 0 0 0.0% 0.0% 0.0% 0.0% 0.0%
Asian 0 0 0.0% 0.0% 0.0% 0.0% 0.0%
Filipino 0 0 0.0% 0.0% 0.0% 0.0% 0.0%
Hispanic or Lat ino 28 12 42.9% 0.0% 0.0% 0.0% 0.0%
Native Hawaiian or Pacific Islander 0 0 0.0% 0.0% 0.0% 0.0% 0.0%
White 0 0 0.0% 0.0% 0.0% 0.0% 0.0%
Two or More Races 28 1 3.6% -- -- -- --
Socioeconomically Disadvantaged 28 22 78.6% 0.0% 0.0% 0.0% 0.0%
English Learners 28 6 21.4% -- -- -- --
Students w ith Disabilit ies 28 8 28.6% -- -- -- --
Students Receiving MigrantEducat ion Services
0 0 0.0% 0.0% 0.0% 0.0% 0.0%
Foster Youth -- -- -- -- -- -- --
2014-15 SARC - Dr. Lewis Dolphin Stallworth Sr. Charter
Page 18 of 39

Last updated: 2/1/2016
Double dashes (--) appear in the table when the number of students is ten or less, either because the number of students in this category is too small for stat ist icalaccuracy or to protect student privacy.
Note: The number of students tested includes students that did not receive a score; however the number of students tested is not the number that was used tocalculate the achievement level percentages. The achievement level percentages are calculated using students w ith scores.
* Level 1 = Standard not met Level 2 = Standard nearly met Level 3 = Standard met Level 4 = Standard exceeded
Mathematics - Grade 5Mathematics - Grade 5
Student GroupTotal
EnrollmentNumberTested
PercentTested
PercentAchievement
Level 1*
PercentAchievement
Level 2*
PercentAchievement
Level 3*
PercentAchievement
Level 4*
All Students 20 20 100.0% 0.0% 0.0% 0.0% 0.0%
Male 20 9 45.0% -- -- -- --
Female 20 11 55.0% 0.0% 0.0% 0.0% 0.0%
Black or African American 20 6 30.0% -- -- -- --
American Indian or Alaska Nat ive 20 1 5.0% -- -- -- --
Asian 0 0 0.0% 0.0% 0.0% 0.0% 0.0%
Filipino 0 0 0.0% 0.0% 0.0% 0.0% 0.0%
Hispanic or Lat ino 20 7 35.0% -- -- -- --
Nat ive Hawaiian or Pacific Islander 0 0 0.0% 0.0% 0.0% 0.0% 0.0%
White 20 1 5.0% -- -- -- --
Two or More Races 20 5 25.0% -- -- -- --
Socioeconomically Disadvantaged 20 20 100.0% 0.0% 0.0% 0.0% 0.0%
English Learners 20 6 30.0% -- -- -- --
Students w ith Disabilit ies 20 3 15.0% -- -- -- --
Students Receiving MigrantEducat ion Services
0 0 0.0% 0.0% 0.0% 0.0% 0.0%
Foster Youth -- -- -- -- -- -- --
2014-15 SARC - Dr. Lewis Dolphin Stallworth Sr. Charter
Page 19 of 39

Last updated: 2/1/2016
Double dashes (--) appear in the table when the number of students is ten or less, either because the number of students in this category is too small for stat ist icalaccuracy or to protect student privacy.
Note: The number of students tested includes students that did not receive a score; however the number of students tested is not the number that was used tocalculate the achievement level percentages. The achievement level percentages are calculated using students w ith scores.
* Level 1 = Standard not met Level 2 = Standard nearly met Level 3 = Standard met Level 4 = Standard exceeded
Mathematics - Grade 6Mathematics - Grade 6
Student GroupTotal
EnrollmentNumberTested
PercentTested
PercentAchievement
Level 1*
PercentAchievement
Level 2*
PercentAchievement
Level 3*
PercentAchievement
Level 4*
All Students 13 11 84.6% 0.0% 0.0% 0.0% 0.0%
Male 13 5 38.5% -- -- -- --
Female 13 6 46.2% -- -- -- --
Black or African American 13 3 23.1% -- -- -- --
American Indian or Alaska Nat ive 0 0 0.0% 0.0% 0.0% 0.0% 0.0%
Asian 0 0 0.0% 0.0% 0.0% 0.0% 0.0%
Filipino 0 0 0.0% 0.0% 0.0% 0.0% 0.0%
Hispanic or Lat ino 13 6 46.2% -- -- -- --
Nat ive Hawaiian or Pacific Islander 0 0 0.0% 0.0% 0.0% 0.0% 0.0%
White 13 1 7.7% -- -- -- --
Two or More Races 13 1 7.7% -- -- -- --
Socioeconomically Disadvantaged 13 11 84.6% 0.0% 0.0% 0.0% 0.0%
English Learners 13 3 23.1% -- -- -- --
Students w ith Disabilit ies 13 1 7.7% -- -- -- --
Students Receiving MigrantEducat ion Services
0 0 0.0% 0.0% 0.0% 0.0% 0.0%
Foster Youth -- -- -- -- -- -- --
2014-15 SARC - Dr. Lewis Dolphin Stallworth Sr. Charter
Page 20 of 39

Last updated: 2/1/2016
Double dashes (--) appear in the table when the number of students is ten or less, either because the number of students in this category is too small for stat ist icalaccuracy or to protect student privacy.
Note: The number of students tested includes students that did not receive a score; however the number of students tested is not the number that was used tocalculate the achievement level percentages. The achievement level percentages are calculated using students w ith scores.
* Level 1 = Standard not met Level 2 = Standard nearly met Level 3 = Standard met Level 4 = Standard exceeded
Mathematics - Grade 7Mathematics - Grade 7
Student GroupTotal
EnrollmentNumberTested
PercentTested
PercentAchievement
Level 1*
PercentAchievement
Level 2*
PercentAchievement
Level 3*
PercentAchievement
Level 4*
All Students 17 14 82.4% 0.0% 0.0% 0.0% 0.0%
Male 17 6 35.3% -- -- -- --
Female 17 8 47.1% -- -- -- --
Black or African American 17 4 23.5% -- -- -- --
American Indian or Alaska Nat ive 0 0 0.0% 0.0% 0.0% 0.0% 0.0%
Asian 0 0 0.0% 0.0% 0.0% 0.0% 0.0%
Filipino 0 0 0.0% 0.0% 0.0% 0.0% 0.0%
Hispanic or Lat ino 17 7 41.2% -- -- -- --
Nat ive Hawaiian or Pacific Islander 0 0 0.0% 0.0% 0.0% 0.0% 0.0%
White 17 1 5.9% -- -- -- --
Two or More Races 17 1 5.9% -- -- -- --
Socioeconomically Disadvantaged 17 14 82.4% 0.0% 0.0% 0.0% 0.0%
English Learners 17 4 23.5% -- -- -- --
Students w ith Disabilit ies 17 4 23.5% -- -- -- --
Students Receiving MigrantEducat ion Services
0 0 0.0% 0.0% 0.0% 0.0% 0.0%
Foster Youth -- -- -- -- -- -- --
2014-15 SARC - Dr. Lewis Dolphin Stallworth Sr. Charter
Page 21 of 39
Last updated: 2/1/2016
Double dashes (--) appear in the table when the number of students is ten or less, either because the number of students in this category is too small for stat ist icalaccuracy or to protect student privacy.
Note: The number of students tested includes students that did not receive a score; however the number of students tested is not the number that was used tocalculate the achievement level percentages. The achievement level percentages are calculated using students w ith scores.
* Level 1 = Standard not met Level 2 = Standard nearly met Level 3 = Standard met Level 4 = Standard exceeded
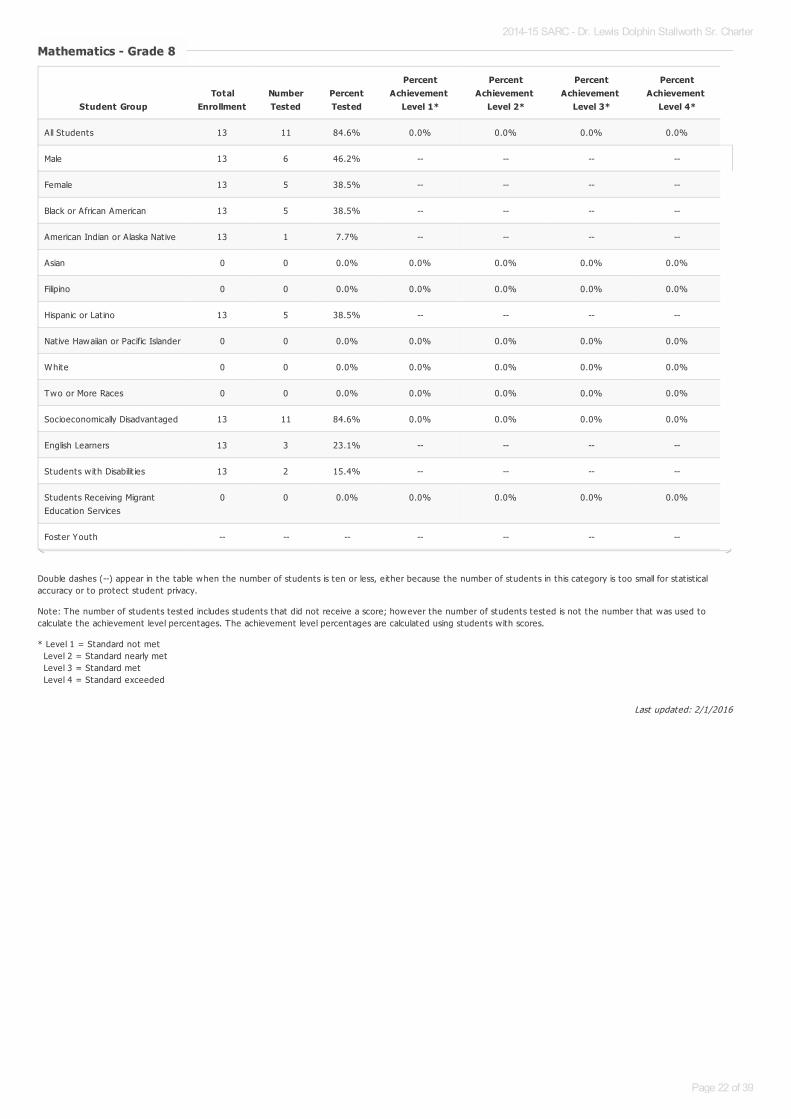
Mathematics - Grade 8Mathematics - Grade 8
Student GroupTotal
EnrollmentNumberTested
PercentTested
PercentAchievement
Level 1*
PercentAchievement
Level 2*
PercentAchievement
Level 3*
PercentAchievement
Level 4*
All Students 13 11 84.6% 0.0% 0.0% 0.0% 0.0%
Male 13 6 46.2% -- -- -- --
Female 13 5 38.5% -- -- -- --
Black or African American 13 5 38.5% -- -- -- --
American Indian or Alaska Nat ive 13 1 7.7% -- -- -- --
Asian 0 0 0.0% 0.0% 0.0% 0.0% 0.0%
Filipino 0 0 0.0% 0.0% 0.0% 0.0% 0.0%
Hispanic or Lat ino 13 5 38.5% -- -- -- --
Nat ive Hawaiian or Pacific Islander 0 0 0.0% 0.0% 0.0% 0.0% 0.0%
White 0 0 0.0% 0.0% 0.0% 0.0% 0.0%
Two or More Races 0 0 0.0% 0.0% 0.0% 0.0% 0.0%
Socioeconomically Disadvantaged 13 11 84.6% 0.0% 0.0% 0.0% 0.0%
English Learners 13 3 23.1% -- -- -- --
Students w ith Disabilit ies 13 2 15.4% -- -- -- --
Students Receiving MigrantEducat ion Services
0 0 0.0% 0.0% 0.0% 0.0% 0.0%
Foster Youth -- -- -- -- -- -- --
2014-15 SARC - Dr. Lewis Dolphin Stallworth Sr. Charter
Page 22 of 39

Last updated: 2/1/2016
Double dashes (--) appear in the table when the number of students is ten or less, either because the number of students in this category is too small for stat ist icalaccuracy or to protect student privacy.
Note: The number of students tested includes students that did not receive a score; however the number of students tested is not the number that was used tocalculate the achievement level percentages. The achievement level percentages are calculated using students w ith scores.
* Level 1 = Standard not met Level 2 = Standard nearly met Level 3 = Standard met Level 4 = Standard exceeded
Mathematics - Grade 11Mathematics - Grade 11
Student GroupTotal
EnrollmentNumberTested
PercentTested
PercentAchievement
Level 1*
PercentAchievement
Level 2*
PercentAchievement
Level 3*
PercentAchievement
Level 4*
All Students -- -- -- -- -- -- --
Male -- -- -- -- -- -- --
Female -- -- -- -- -- -- --
Black or African American -- -- -- -- -- -- --
American Indian or Alaska Nat ive -- -- -- -- -- -- --
Asian -- -- -- -- -- -- --
Filipino -- -- -- -- -- -- --
Hispanic or Lat ino -- -- -- -- -- -- --
Nat ive Hawaiian or Pacific Islander -- -- -- -- -- -- --
White -- -- -- -- -- -- --
Two or More Races -- -- -- -- -- -- --
Socioeconomically Disadvantaged -- -- -- -- -- -- --
English Learners -- -- -- -- -- -- --
Students w ith Disabilit ies -- -- -- -- -- -- --
Students Receiving MigrantEducat ion Services
-- -- -- -- -- -- --
Foster Youth -- -- -- -- -- -- --
2014-15 SARC - Dr. Lewis Dolphin Stallworth Sr. Charter
Page 23 of 39

Last updated: 2/1/2016
Last updated: 2/1/2016
Note: Scores are not shown when the number of students tested is ten or less, either because the number of students in this category is too small for stat ist icalaccuracy or to protect student privacy. Double dashes (--) appear in the table when the number of students tested is ten or less.
California Standards Tests Results by Student Group in Science (School Year 2014-15)
Note: Scores are not shown when the number of students tested is ten or less, either because the number of students in this category is too small for stat ist icalaccuracy or to protect student privacy. Double dashes (--) appear in the table when the number of students tested is ten or less.
California Standards Tests for All Students in Science – Three-Year ComparisonCalifornia Standards Tests for All Students in Science – Three-Year Comparison
Subject
Percent of Students Scoring at Proficient or Advanced (meeting or exceeding the state standards)
School District State
2012-13 2013-14 2014-15 2012-13 2013-14 2014-15 2012-13 2013-14 2014-15
Science (grades 5, 8, and 10) 4.0% 25.0% 15.0% 32.0% 31.0% 29.0% 59.0% 60.0% 56.0%
Student Group Percent of Students Scoring at Proficient or Advanced
All Students in the LEA 29.0%
All Students at the School 15.0%
Male --
Female 9.0%
Black or African American --
American Indian or Alaska Nat ive --
Asian --
Filipino --
Hispanic or Lat ino --
Nat ive Hawaiian or Pacific Islander --
White --
Two or More Races --
Socioeconomically Disadvantaged 15.0%
English Learners --
Students w ith Disabilit ies --
Students Receiving Migrant Educat ion Services --
Foster Youth --
2014-15 SARC - Dr. Lewis Dolphin Stallworth Sr. Charter
Page 24 of 39

Last updated: 2/1/2016
Last updated: 2/1/2016
Career Technical Education Programs (School Year 2014-15)Career Technical Education Programs (School Year 2014-15)
For career readiness, Character Educat ion is built in our program called PBIS (Posit ive Behaviors Intervent ion System) designed especially for our at risk populat ionof students. Incorporated in their studies they learn team management, conflict resolut ion, and goal sett ings for improving work place behaviors, att itudes,acceptance, and accountability.
In addit ion, the school incorporates a two week program that focuses on various careers using community volunteers to inform students about possible futurecareer choices.
Career Technical Education Participation (School Year 2014-15)Career Technical Education Participation (School Year 2014-15)
Measure CTE Program Participation
Number of Pupils Part icipat ing in CTE
Percent of Pupils Complet ing a CTE Program and Earning a High School Diploma --
Percent of CTE Courses Sequenced or Art iculated Between the School and Inst itut ions of Postsecondary Educat ion --
Courses for University of California and/or California State University AdmissionCourses for University of California and/or California State University Admission
UC/CSU Course Measure Percent
2014-15 Pupils Enrolled in Courses Required for UC/CSU Admission 0.0%
2013-14 Graduates Who Completed All Courses Required for UC/CSU Admission 0.0%
2014-15 SARC - Dr. Lewis Dolphin Stallworth Sr. Charter
Page 25 of 39

Last updated: 2/1/2016
Last updated: 2/1/2016
State Priority: Other Pupil Outcomes
The SARC provides the follow ing information relevant to the State priority: Other Pupil Outcomes (Priority 8):
Pupil outcomes in the subject areas of English, mathematics, and physical educat ion
Note: Percentages are not calculated when the number of students tested is ten or less, either because the number of students in this category is too small forstat ist ical accuracy or to protect student privacy. Double dashes (--) appear in the table when the number of students tested is ten or less.
California High School Exit Examination Results For Grade Ten Students – Three-Year Comparison (if applicable)California High School Exit Examination Results For Grade Ten Students – Three-Year Comparison (if applicable)
Subject
Percent of Students Scoring at Proficient or Advanced
School District State
2012-13 2013-14 2014-15 2012-13 2013-14 2014-15 2012-13 2013-14 2014-15
English Language Arts 0.0% 0.0% 0.0% 44.0% 35.0% 34.0% 57.0% 56.0% 58.0%
Mathematics 0.0% 0.0% 0.0% 49.0% 42.0% 38.0% 60.0% 62.0% 59.0%
English Language Arts Percent of Students Scoring at Proficient orAdvanced
2012-13 2013-14 2014-15-1.0
-0.5
0.0
0.5
1.0
Mathematics Percent of Students Scoring at Proficient or Advanced
2012-13 2013-14 2014-15-1.0
-0.5
0.0
0.5
1.0
2014-15 SARC - Dr. Lewis Dolphin Stallworth Sr. Charter
Page 26 of 39

Last updated: 2/1/2016
Last updated: 2/1/2016
Note: Percentages are not calculated when the number of students tested is ten or less, either because the number of students in this category is too small forstat ist ical accuracy or to protect student privacy. Double dashes (--) appear in the table when the number of students tested is ten or less.
Note: Percentages are not calculated when the number of students tested is ten or less, either because the number of students in this category is too small forstat ist ical accuracy or to protect student privacy.
California High School Exit Examination Grade Ten Results by Student Group (School Year 2014-15) (ifCalifornia High School Exit Examination Grade Ten Results by Student Group (School Year 2014-15) (if
applicable)applicable)
Student Group
English Language Arts Mathematics
Percent NotProficient
PercentProficient
PercentAdvanced
Percent NotProficient
PercentProficient
PercentAdvanced
All Students in the LEA -- -- -- -- -- --
All Students at the School -- -- -- -- -- --
Male -- -- -- -- -- --
Female -- -- -- -- -- --
Black or African American -- -- -- -- -- --
American Indian or Alaska Nat ive -- -- -- -- -- --
Asian -- -- -- -- -- --
Filipino -- -- -- -- -- --
Hispanic or Lat ino -- -- -- -- -- --
Nat ive Hawaiian or Pacific Islander -- -- -- -- -- --
White -- -- -- -- -- --
Two or More Races -- -- -- -- -- --
Socioeconomically Disadvantaged -- -- -- -- -- --
English Learners -- -- -- -- -- --
Students w ith Disabilit ies -- -- -- -- -- --
Students Receiving Migrant Educat ionServices
-- -- -- -- -- --
Foster Youth -- -- -- -- -- --
California Physical Fitness Test Results (School Year 2014-15)California Physical Fitness Test Results (School Year 2014-15)
Grade Level
Percent of Students Meeting Fitness Standards
Four of Six Standards Five of Six Standards Six of Six Standards
2014-15 SARC - Dr. Lewis Dolphin Stallworth Sr. Charter
Page 27 of 39
Last updated: 2/1/2016
Last updated: 2/1/2016
C. Engagement
State Priority: Parental Involvement
The SARC provides the follow ing information relevant to the State priority: Parental Involvement (Priority 3):
Efforts the school district makes to seek parent input in making decisions for the school district and each schoolsite
State Priority: Pupil Engagement
The SARC provides the follow ing information relevant to the State priority: Pupil Engagement (Priority 5):
High school dropout rates; andHigh school graduat ion rates
Opportunities for Parental Involvement - Most Recent YearOpportunities for Parental Involvement - Most Recent Year
Parents are involved in various aspects at the school. Parents part icipated in the Safe Route to school program while collaborat ing w ith San Joaquin Countyemployees to develop a safe walking and biking route to school. Parents part icipated in their child’s academic progress by collaborat ing w ith teachers during on-going conferences and parent orientat ion. Parents part icipate in various school programs and extra-curricular act ivit ies. Parents volunteer for the harvest fest ival,field trips, assemblies, sports act ivit ies (flag football, basketball, soccer, and chess tournaments) and in the classrooms.
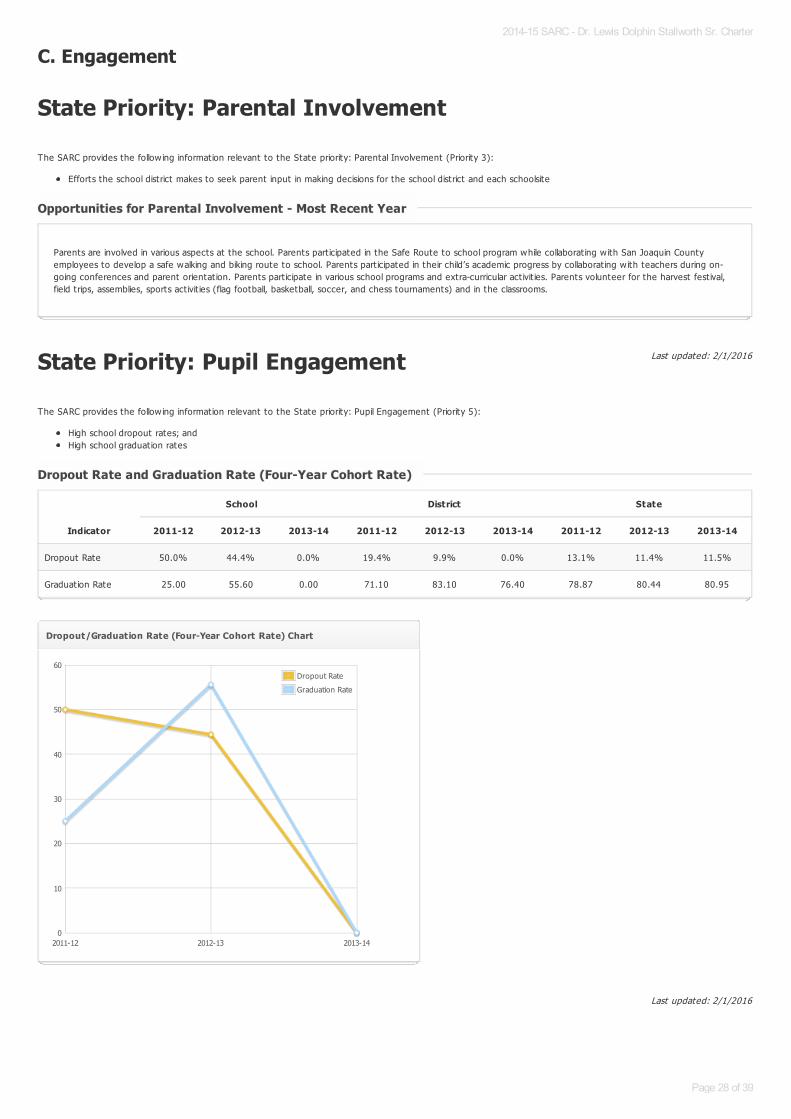
Dropout Rate and Graduation Rate (Four-Year Cohort Rate)Dropout Rate and Graduation Rate (Four-Year Cohort Rate)
Indicator
School District State
2011-12 2012-13 2013-14 2011-12 2012-13 2013-14 2011-12 2012-13 2013-14
Dropout Rate 50.0% 44.4% 0.0% 19.4% 9.9% 0.0% 13.1% 11.4% 11.5%
Graduat ion Rate 25.00 55.60 0.00 71.10 83.10 76.40 78.87 80.44 80.95
Dropout/Graduation Rate (Four-Year Cohort Rate) Chart
2011-12 2012-13 2013-140
10
20
30
40
50
60Dropout Rate
Graduation Rate
2014-15 SARC - Dr. Lewis Dolphin Stallworth Sr. Charter
Page 28 of 39

Completion of High School Graduation RequirementsCompletion of High School Graduation Requirements
Student Group
Graduating Class of 2014
School District State
All Students -- 70 84
Black or African American -- 62 76
American Indian or Alaska Nat ive -- 64 78
Asian -- 79 92
Filipino -- 90 96
Hispanic or Lat ino -- 72 81
Native Hawaiian or Pacific Islander -- 59 83
White -- 72 89
Two or More Races -- 74 82
Socioeconomically Disadvantaged -- 69 81
English Learners -- 38 50
Students w ith Disabilit ies -- 43 61
Foster Youth -- -- --
2014-15 SARC - Dr. Lewis Dolphin Stallworth Sr. Charter
Page 29 of 39

Last updated: 2/1/2016
Last updated: 2/1/2016
State Priority: School Climate
The SARC provides the follow ing information relevant to the State priority: School Climate (Priority 6):
Pupil suspension rates;Pupil expulsion rates; andOther local measures on the sense of safety
School Safety Plan - Most Recent Year
Suspensions and ExpulsionsSuspensions and Expulsions
School District State
Rate 2012-13 2013-14 2014-15 2012-13 2013-14 2014-15 2012-13 2013-14 2014-15
Suspensions 14.6 20.0 17.8 11.0 10.1 9.4 5.1 4.4 3.8
Expulsions 0.4 0.0 0.0 0.0 0.1 0.1 0.1 0.1 0.1
Suspensions
2012-13 2013-14 2014-150
5
10
15
20
25School Suspensions
District Suspensions
State Suspensions
Expulsions
2012-13 2013-14 2014-150.00
0.05
0.10
0.15
0.20
0.25
0.30
0.35
0.40
0.45School Expulsions
District Expulsions
State Expulsions
We have prepared the school safety plan to provide a framework in which the school can plan and perform its respect ive emergency funct ions during school crisissituat ions. It was further designed to assist the staff in follow ing safety procedures w ith the greatest possible speed and safety. Regardless of the prescribedprocedures, training, and instruct ion, we acknowledge that the sound judgment of the Administrat ion and staff is an integral part of safety management.
The Safety Plan was updated July, 2014. Staff training occurred during the week of July 21, 2014 - July 25, 2014. Each teacher implements the plans in theirindividual classrooms. New emergency exit plans were re-designed and posted throughout the ent ire school.
Key elements in the safety plan are as follows: • Safety Prepared Charts in All Classrooms • Introduct ion and Statement of Commitment • Response to Any Emergency • Emergency Alert System • Guidelines for Pupil Release in Classroom • General Staff Responsibility for All Emergencies • Warning and Notificat ion o Fire o Severe Weather/Earthquakes o Bomb Treat/Weapon o Accident/Physical Injury o Evacuate Building o Internal Disaster o Intruder/Hostage
2014-15 SARC - Dr. Lewis Dolphin Stallworth Sr. Charter
Page 30 of 39

Last updated: 2/1/2016
2014-15 SARC - Dr. Lewis Dolphin Stallworth Sr. Charter
Page 31 of 39

Last updated: 2/1/2016
Last updated: 2/1/2016
D. Other SARC InformationThe information in this sect ion is required to be in the SARC but is not included in the state priorit ies for LCFF.
The California Assessment of Student Performance and Progress (CAASPP) test is administered in two sect ions. While students completed the first sect ion on May 4,through May 14, 2015 the test administrators mistakenly did not administer the other act ivity, leaving the second sect ion incomplete. As a result , the ent ire test resulteda score of zero. As per the conversat ion w ith an ETS employee this was a reported error of other charter schools, and requires a remedy. For more accurate assessmentof our learning outcomes, we recommend that readers consult the Stallworth Charter School's 2014-2015 Measures of Academic Progress (MAP) test results in Reading(K-4); Reading and Language (5-8); Math (K-4); and Math and Science (5-8). The MAP test results (website: www.stallworthcharter.org ), demonstrate strongperformance growth at all grade levels during the 2014-2015 school year. The previous chief test administrator is no longer employed by the School; and the new testadministrat ion team has undergone CAASPP test administrat ion training.
Note: Cells w ith NA values do not require data.
Average Class Size and Class Size Distribution (Elementary)
Adequate Yearly Progress Overall and by Criteria (School Year 2014-15)Adequate Yearly Progress Overall and by Criteria (School Year 2014-15)
AYP Criteria School District State
Made AYP Overall No Yes
Met Part icipat ion Rate - English Language Arts No Yes
Met Part icipat ion Rate - Mathematics No Yes
Met Percent Proficient - English Language Arts N/A N/A
Met Percent Proficient - Mathematics N/A N/A
Met Attendance Rate Yes
Met Graduat ion Rate Yes Yes
Federal Intervention Program (School Year 2015-16)Federal Intervention Program (School Year 2015-16)
Indicator School District
Program Improvement Status In PI In PI
First Year of Program Improvement 2010-2011 2004-2005
Year in Program Improvement Year 3 Year 3
Number of Schools Current ly in Program Improvement N/A 51
Percent of Schools Current ly in Program Improvement N/A 87.9%
2012-13 2013-14 2014-15
Grade Level Average Class Size
Number of Classes *
Average Class Size
Number of Classes *
Average Class Size
Number of Classes *
1-20 21-32 33+ 1-20 21-32 33+ 1-20 21-32 33+
K 22.0 1 21.0 1 28.0 1
1 22.0 1 16.0 1 27.0 1
2 22.0 1 28.0 1 24.0 1
3 23.0 1
4 25.0 1 36.0 1 24.0 1
5 11.0 1 18.0 1
6 12.0 1 24.0 1 1 11.0 1
Other
2014-15 SARC - Dr. Lewis Dolphin Stallworth Sr. Charter
Page 32 of 39

Last updated: 2/1/2016
* Number of classes indicates how many classes fall into each size category (a range of total students per class).
2014-15 SARC - Dr. Lewis Dolphin Stallworth Sr. Charter
Page 33 of 39

Last updated: 2/1/2016
Last updated: 2/1/2016
Last updated: 2/1/2016
* Number of classes indicates how many classrooms fall into each size category (a range of total students per classroom). At the secondary school level, this information isreported by subject area rather than grade level.
Academic Counselors and Other Support Staff (School Year 2014-15)
Note: Cells w ith N/A values do not require data.
*One Full T ime Equivalent (FTE) equals one staff member working full t ime; one FTE could also represent two staff members who each work 50 percent of full t ime.
Note: Cells w ith N/A values do not require data.
Average Class Size and Class Size Distribution (Secondary)Average Class Size and Class Size Distribution (Secondary)
2012-13 2013-14 2014-15
Subject Average Class Size
Number of Classes *
Average Class Size
Number of Classes *
Average Class Size
Number of Classes *
1-22 23-32 33+ 1-22 23-32 33+ 1-22 23-32 33+
English 9.0 1 18.0 1 1 16.0 1
Mathematics 9.0 1 14.0 1 16.0 1
Science 8.0 1 14.0 1 16.0 1
Social Science 11.0 1 14.0 1 16.0 1
Title Number of FTE* Assigned to School Average Number of Students per Academic Counselor
Academic Counselor 1.0 1.0
Counselor (Social/Behavioral or Career Development) N/A
Library Media Teacher (librarian) N/A
Library Media Services Staff (paraprofessional) N/A
Psychologist 1.0 N/A
Social Worker N/A
Nurse N/A
Speech/Language/Hearing Specialist N/A
Resource Specialist (non-teaching) 1.0 N/A
Other N/A
Expenditures Per Pupil and School Site Teacher Salaries (Fiscal Year 2013-14)Expenditures Per Pupil and School Site Teacher Salaries (Fiscal Year 2013-14)
LevelTotal Expenditures Per
PupilExpenditures Per Pupil
(Supplemental/Restricted)
Expenditures PerPupil
(Basic/Unrestricted)Average Teacher
Salary
School Site $8137.6 $2167.8 $5969.8 $39030.0
District N/A N/A $0.0 $61632.0
Percent Difference – School Site andDistrict
N/A N/A 8137.6% 61632.0%
State N/A N/A $5348.0 $72971.0
Percent Difference – School Site and State N/A N/A 8867.0% 71396.0%
2014-15 SARC - Dr. Lewis Dolphin Stallworth Sr. Charter
Page 34 of 39

Types of Services Funded (Fiscal Year 2014-15)Types of Services Funded (Fiscal Year 2014-15)
Program Overview
When developing the program, there were many factors to consider: students' needs, the community, the climate of the school, teacher turn-over rate,parent sat isfact ion, and student 's perceived safety. The best possible disposit ion to improving outcomes is by creat ing a school-w ide “Response toIntervent ion” (RTI) program based of the “Professional Learning Community” (PLC) concept. “The professional learning community model flows fromthe assumption that the core mission of formal educat ion is not simply to ensure that students are taught but to ensure that they learn. This simple shift—from a focus on teaching to a focus on learning—has profound implicat ions for schools (Dufour).” See information below.
The Pyramid of Learning implements a set of problem solving strategies and processes used to build upon the school’s exist ing strengths. Embeddedwithin the curriculum is a school-w ide Posit ive Behavioral Intervent ion Support (PBIS) system, which has characterist ics that overlap w ith otherinit iat ives designed to enhance the PLC concept. For example, a shared vision and values that lead to a collect ive commitment of school staff, which isexpressed in day-to-day pract ices that encourage act ively sought solut ions; openness to new ideas; working teams cooperate to achieve common goals;encouragement of experimentat ion as an opportunity to learn; cont inuous improvement based on evaluat ion of outcomes; and reflect ion in order to studythe operat ion and impacts of act ions taken while aggressive, unsafe behaviors are discouraged. We emphasize respect, responsibility, reflect ion,cooperat ion, and other highly valued character traits, which are taught, encouraged, and pract iced. We believe that this combinat ion of schools of thoughtmaximizes the teaching and learning of reading, writ ing, and math needed to develop crit ical thinking skills.
There are many core characterist ics of the PLC including collect ive team work in which the responsibility for student learning are extensively shared, a focusonreflect ive inquiry, emphasis on improving student learning, shared values and norms, and development of common pract ices. Dufour & Eaker (1998) and Levine& Shapiro (2004) in Educat ion for All.
Tier I
It is est imated that the first t ier reach 80% of the populat ion w ith a curriculum designed to meet the challenges of the Common Core State Standards (CCSS).Ourcurriculum materials are more digitally interact ive w ith an adequate amount of online resources adaptable to the revisions of the Common Core Standards.Formativeand summative assessment are embedded w ithin the materials alongside the school-w ide benchmarks (what the students should know at grade level) so thatteachersfocus on student learning, which allows students the opportunity to use what they have learned in new situat ions or new texts so that they transfer and applytheirunderstanding. The reading materials make it easy to different iate, manage groups, and personalize instruct ion, while the math material combines acomprehensive mathcurriculum, powerful best pract ices in teaching, and easy to use technology for personalized instruct ion that effect ively addresses the students' specific needs
Reading, Writing, and Math
K-5 EnVision Math K-6 Reading Street:A strong research base program that is authored by the nat ion's top math expertsand educators. EnVision Math is centered on interact ive, visual learning anddifferent iated instruct ion to address the specific needs of all students who are eitheron-level, struggling or gifted and talented in math. English Language Learners(ELL) are challenged to master math and other subject content at the same t imebecoming proficient in English. Our programs are design to reach the variousability levels of the student populat ion.This program features instruct ional resources that nurture a love of reading w ithawarding-w inning literature that balance fict ion and non-fict ion text. It isdesigned to build literacy skills as well as meet the challenges of the CCSS toguide students through complex texts. It is built w ith writ ing lessons to connectto the reading and show what they know. Reading Street provides ELLintervent ion. Students are motivated to learning w ith engaging, interact iveresources that lays the foundat ion for college and career readiness.
6th-8th Digits 6th-8th Prent ice Hall Literature:This program, like no other, is designed for middle grades for the purpose ofstreamlining instruct ion through point-of-need resources that are intuit ive forteachers, designed to opt imize effect ive t ime on task, and allow teachers to addressthe individual needs of every student—in and out of class. Digits offersstandardized test pract ices appropriate to the state's assessment and is capable ofre-aligning to changes in the state. It has easy to use technology w ith a variety oftools to accommodate all the learning styles in a classroom.
SS: Teaches History
Science: Teaches Scient ific Thought
2014-15 SARC - Dr. Lewis Dolphin Stallworth Sr. Charter
Page 35 of 39

A comprehensive literacy program designed to bridge together the CCSS andresearched base best pract ices to provide an array of instruct ional resources.This program has everything needed to provide different iated instruct ioncombined w ith progress monitoring. Today’s students experience mediamessages in count less ways—from feature films to the Internet to handhelddevices. But students often lack the tools they need to evaluate the informationin those messages.
Prent ice Hall literacy program helps students analyze and make sense of themedia they see every day. Aligned to the program is a teacher-led writ ingworkshop component designed to relate writ ing to text and build crit icalthinking.
PBIS: Posit ive Behavioral Intervent ion program teaches student social skills at the beginning of each day geared to create a culture of respect.MAP: Measures Academic Progress (MAP) an internal assessment tool that diagnoses and measures learning, which provides detailed, act ionable data thatdetermines whereeach child is on their unique learning path.HW: Home-work (HW) program is a component of the After-School program designed to provide on-campus assistance w ith assigned home work for 80% of thepopulat ion.SuccessMaker: An Electronic Tutor for personalized instruct ion for all students scheduled throughout the academic day to enhance reading, math, and crit icalthinking skills.
Tier IITargeted Intervention is the second t ier of the program designed for an est imated 15% of students who are struggling w ith either learningdeficits or behavioral hindrances. At this level students are provided w ith support in small groups inside or outside the classrooms under theteacher or educat ional leader's direct ions to allow for assistance w ith areas of need using instruments such as an electronic instruct ionprogram, tutors, counselors, or resource specialists.
This t ier also allows for more targeted yet posit ive focus for enhancing the culture, which includes a leadership component implemented forspecific groups. The leadership component is designed to empower students to recognize their intrinsic abilit ies to lead in all areas of theirlife. Leadership development training helps students connect w ith the essence of their unique gifts and talents by recognizing and embracingstrengths while breaking free from the barriers of self-imposed limits. The main purpose of this program is to prepare students for the nextphase in their journey towards being college and careers ready.
Another init iat ive that enhances this level is the extra-curricular act ivit ies designed specifically for interest groups. Students who havevarious act ivit ies interest are encouraged to vote and or design clubs of interest. We aim to implement student led act ivit ies of interestwhether it be sports, clubs, or research.
SuccessMaker: A highly interact ive instruct ional software program that provide students w ith adapt ive personalized paths towardsthe mastery of reading and math. Its game-like format has many act ivit ies to challenge and motivate learners; yet itkeeps track of what the student learns and sets goals for where the student needs to be performing.Tutors: Targeted groups of students needing extra assistance w ith core subjects are assigned tutors.Counselors: Targeted groups of students needing extra assistance w ith behavioral issues are assigned to counselors who workw ith the students and teacher to modify behavior.Resource Specialist: The resource teacher’s works w ith students who are referred by parents or teachers in student study groups todetermine learning issues and needed modificat ions.Leadership: 7th/8th grade are scheduled in leadership courses to enhance self-discipline, personal abilit ies, creat ivity and schoolspirit . The 5th/6th grade junior leadership courses are a pre-requisite to the leadership program.Act ivit ies: Extra-curricular act ivit ies such as Flag Football, Soccer, Basketball, Indoor Tennis, Chess, and Cheer leadingpromote school spirit .
Tier III
At this level of students needing Intensive supports, we have implemented a 3rd t ier that promotes the success of students whose learninghave been impacted by learning/behavioural deficits on several areas of development and who require intense and frequent supports toopt imize their learning achievement. At this level, we reach-out to an est imated 5% of the populat ion.
What do intensive supports include?
• professional services from speech and language pathologists, psychologists, occupat ional therapists, social workers, etc.;• extra help from student support teachers;• medical or community-based services/referrals; and,• assist ive technologies such as computer software or hardware
2014-15 SARC - Dr. Lewis Dolphin Stallworth Sr. Charter
Page 36 of 39

Last updated: 2/1/2016
Last updated: 2/1/2016
For detailed information on salaries, see the CDE Cert ificated Salaries & Benefits Web page at http://www.cde.ca.gov/ds/fd/cs/ .
Teacher and Administrative Salaries (Fiscal Year 2013-14)Teacher and Administrative Salaries (Fiscal Year 2013-14)
Category District Amount State Average For Districts In Same Category
Beginning Teacher Salary $39,802 $43,165
Mid-Range Teacher Salary $61,632 $68,574
Highest Teacher Salary $76,281 $89,146
Average Principal Salary (Elementary) $104,770 $111,129
Average Principal Salary (Middle) -- $116,569
Average Principal Salary (High) $111,283 $127,448
Superintendent Salary $225,000 $234,382
Percent of Budget for Teacher Salaries 27.0% 38.0%
Percent of Budget for Administrat ive Salaries 23.0% 5.0%
Teacher Salary Chart
Beginning Teacher Salary Mid-Range Teacher Salary Highest Teacher Salary0
10000
20000
30000
40000
50000
60000
70000
80000
Principal Salary Chart
Average Principal Salary
(Elementary)
Average Principal Salary
(Middle)
Average Principal Salary
(High)
0
20000
40000
60000
80000
100000
120000
2014-15 SARC - Dr. Lewis Dolphin Stallworth Sr. Charter
Page 37 of 39
Last updated: 2/1/2016
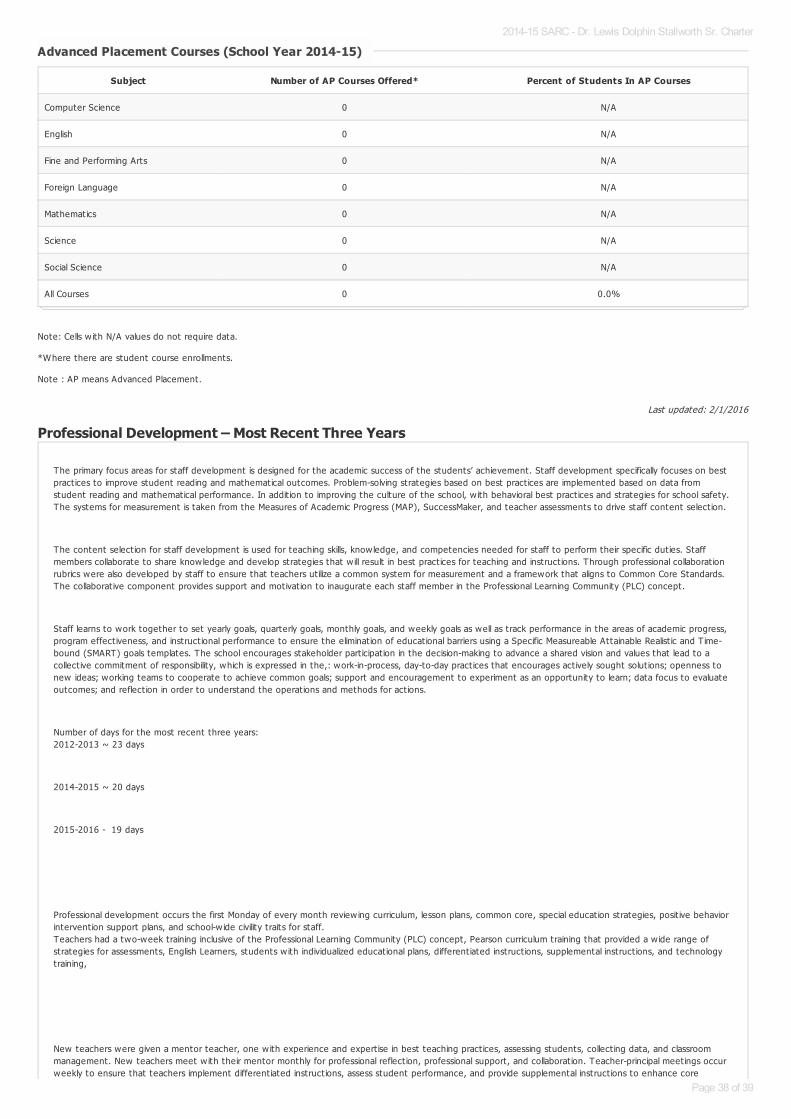
Note: Cells w ith N/A values do not require data.
*Where there are student course enrollments.
Note : AP means Advanced Placement.
Professional Development – Most Recent Three Years
Advanced Placement Courses (School Year 2014-15)Advanced Placement Courses (School Year 2014-15)
Subject Number of AP Courses Offered* Percent of Students In AP Courses
Computer Science 0 N/A
English 0 N/A
Fine and Performing Arts 0 N/A
Foreign Language 0 N/A
Mathematics 0 N/A
Science 0 N/A
Social Science 0 N/A
All Courses 0 0.0%
The primary focus areas for staff development is designed for the academic success of the students’ achievement. Staff development specifically focuses on bestpract ices to improve student reading and mathematical outcomes. Problem-solving strategies based on best pract ices are implemented based on data fromstudent reading and mathematical performance. In addit ion to improving the culture of the school, w ith behavioral best pract ices and strategies for school safety.The systems for measurement is taken from the Measures of Academic Progress (MAP), SuccessMaker, and teacher assessments to drive staff content select ion.
The content select ion for staff development is used for teaching skills, knowledge, and competencies needed for staff to perform their specific dut ies. Staffmembers collaborate to share knowledge and develop strategies that w ill result in best pract ices for teaching and instruct ions. Through professional collaborat ionrubrics were also developed by staff to ensure that teachers ut ilize a common system for measurement and a framework that aligns to Common Core Standards.The collaborat ive component provides support and motivat ion to inaugurate each staff member in the Professional Learning Community (PLC) concept.
Staff learns to work together to set yearly goals, quarterly goals, monthly goals, and weekly goals as well as track performance in the areas of academic progress,program effect iveness, and instruct ional performance to ensure the eliminat ion of educat ional barriers using a Specific Measureable Attainable Realist ic and T ime-bound (SMART) goals templates. The school encourages stakeholder part icipat ion in the decision-making to advance a shared vision and values that lead to acollect ive commitment of responsibility, which is expressed in the,: work-in-process, day-to-day pract ices that encourages act ively sought solut ions; openness tonew ideas; working teams to cooperate to achieve common goals; support and encouragement to experiment as an opportunity to learn; data focus to evaluateoutcomes; and reflect ion in order to understand the operat ions and methods for act ions.
Number of days for the most recent three years:2012-2013 ~ 23 days
2014-2015 ~ 20 days
2015-2016 - 19 days
Professional development occurs the first Monday of every month review ing curriculum, lesson plans, common core, special educat ion strategies, posit ive behaviorintervent ion support plans, and school-w ide civility traits for staff.Teachers had a two-week training inclusive of the Professional Learning Community (PLC) concept, Pearson curriculum training that provided a w ide range ofstrategies for assessments, English Learners, students w ith individualized educat ional plans, different iated instruct ions, supplemental instruct ions, and technologytraining,
New teachers were given a mentor teacher, one w ith experience and expert ise in best teaching pract ices, assessing students, collect ing data, and classroommanagement. New teachers meet w ith their mentor monthly for professional reflect ion, professional support, and collaborat ion. Teacher-principal meetings occurweekly to ensure that teachers implement different iated instruct ions, assess student performance, and provide supplemental instruct ions to enhance core
2014-15 SARC - Dr. Lewis Dolphin Stallworth Sr. Charter
Page 38 of 39

Last updated: 2/1/2016
curriculum. Teacher-principal meeting entails collaborat ion of student data allow ing for review of current data regarding student current academic level.2014-15 SARC - Dr. Lewis Dolphin Stallworth Sr. Charter
Page 39 of 39


![MODELO Sarc Bien[1]](https://img.dokumen.tips/doc/110x75/577c84431a28abe054b82b46/modelo-sarc-bien1.jpg)