Embed Size (px)
Citation preview
Norbert Egger, Jean-Marie R. Fiechter,Jens Rohlf, Jörg Rose, Oliver Schrüffer
SAP BW Reporting and Analysis
5Contents
Contents
Preface 13
Foreword 15
Introduction and Overview 17
Introduction ...................................................................................................... 17
Structure of the Book ...................................................................................... 18
Working with This Book ................................................................................. 19
After You’ve Read the Book … ...................................................................... 20
Acknowledgements ......................................................................................... 20
Special Thanks .................................................................................................. 22
1 Data Warehousing and SAP BW 23
1.1 Introduction ...................................................................................................... 23
1.2 The Data Warehouse Concept ....................................................................... 23
1.3 Basic Characteristics of a Data Warehouse Solution ................................. 261.3.1 Data Acquisition Layer ...................................................................... 271.3.2 Metadata Management .................................................................... 311.3.3 Data Storage Layer ............................................................................ 331.3.4 Data Presentation Layer .................................................................... 37
1.4 Architecture of SAP BW: Overview ............................................................... 381.4.1 Data Acquisition in SAP BW ............................................................ 411.4.2 InfoSources ......................................................................................... 431.4.3 Update Rules ...................................................................................... 441.4.4 Requesting the Data Transfer and Monitoring .............................. 451.4.5 Data Storage in SAP BW ................................................................... 461.4.6 Reporting and Analysis Tools ........................................................... 51
2 Data Retrieval Concepts and Their Implementation in SAP BW 53
2.1 Introduction ...................................................................................................... 532.1.1 Deductive versus Inductive Analyses .............................................. 57
Contents6
2.2 Process Steps Involved in Data Retrieval ..................................................... 582.2.1 Preparation ......................................................................................... 582.2.2 Presentation ....................................................................................... 602.2.3 Information Distribution ................................................................... 612.2.4 Data Mining and Advanced Analytics ............................................. 63
2.3 The Data Retrieval Components of SAP BW ............................................... 662.3.1 Overview ............................................................................................. 672.3.2 SAP Business Explorer Query Designer ........................................... 692.3.3 SAP Business Explorer Web Application Designer ........................ 732.3.4 The SAP Business Explorer Web Applications ................................ 752.3.5 SAP Business Explorer Analyzer ....................................................... 762.3.6 SAP Business Explorer Information Broadcasting .......................... 772.3.7 Additional SAP BW Reporting Functions of
SAP Business Explorer ....................................................................... 792.3.8 The Analysis Process Designer and the
Data Mining Workbench .................................................................. 802.3.9 The Reporting Agent ......................................................................... 832.3.10 Frontends for SAP BW ...................................................................... 86
3 Sample Scenario 87
3.1 The Model Company: “CubeServ Engines” .................................................. 873.1.1 Company Structure ........................................................................... 873.1.2 Infrastructure ...................................................................................... 88
3.2 Requirements of the Case Study ................................................................... 893.2.1 Requirements of the Analytical Applications ................................. 903.2.2 Planning Requirements ..................................................................... 92
3.3 Procedure and the SAP Components Involved ........................................... 92
3.4 Details of Reporting Requirements ............................................................... 943.4.1 Queries and Query Components ..................................................... 943.4.2 Web Templates and Web Items ...................................................... 963.4.3 Information Broadcasting ................................................................. 97
4 The SAP Business Explorer Query Designer 99
4.1 Data Analysis with SAP Business Information Warehouse—The Query Concept .......................................................................................... 994.1.1 Functional Overview of the BEx Query Designer .......................... 1004.1.2 Overview of Query Elements ........................................................... 1084.1.3 Global and Local Query Definition .................................................. 109
4.2 Reusable Query Elements ............................................................................... 1114.2.1 Flexible Query Control with Variables ............................................ 1124.2.2 Calculated Key Figures ...................................................................... 1134.2.3 Restricted Key Figures ....................................................................... 1174.2.4 Restricted and Calculated Key Figures with
Mutual Dependencies ....................................................................... 1224.2.5 Global Structures ............................................................................... 124
7Contents
4.3 Definition of Data ............................................................................................ 1284.3.1 Filtering Characteristics (Selections) ............................................... 1284.3.2 Calculation in Formulas .................................................................... 1344.3.3 Calculation in the Display ................................................................. 1494.3.4 Data Definition in Cells ..................................................................... 1524.3.5 Currency Translation ......................................................................... 1564.3.6 Constant Selections ........................................................................... 162
4.4 Presentation and Formatting ......................................................................... 1654.4.1 Hierarchies—an Overview ................................................................ 1654.4.2 Presentation of the Structure ........................................................... 1684.4.3 Presentation of Structure Elements ................................................. 1684.4.4 Presentation of Characteristics ........................................................ 1714.4.5 Tabular Presentation ......................................................................... 1754.4.6 Query Properties ............................................................................... 177
4.5 Variable Definitions in Detail ......................................................................... 1784.5.1 Characteristic Value Variables .......................................................... 1814.5.2 Hierarchy Variables and Hierarchy Node Variables ....................... 1824.5.3 Text Variables ..................................................................................... 1834.5.4 Formula Variables .............................................................................. 1844.5.5 SAP and Customer Exit Variables .................................................... 187
4.6 Analysis Functions ........................................................................................... 1904.6.1 Conditions .......................................................................................... 1904.6.2 Exceptions .......................................................................................... 193
4.7 Query Views ...................................................................................................... 196
4.8 Conclusion ......................................................................................................... 198
5 The BEx Web 199
5.1 The Web Framework of SAP: Terms and Functions ................................... 2005.1.1 Web Items .......................................................................................... 2015.1.2 Data Provider ..................................................................................... 2055.1.3 Web Templates and Web Applications .......................................... 2055.1.4 Web Report ........................................................................................ 2065.1.5 Object Tags ......................................................................................... 2065.1.6 Query versus Query Views ............................................................... 2065.1.7 Command URLs ................................................................................. 2115.1.8 Cascading Style Sheets ...................................................................... 2115.1.9 JavaScript ............................................................................................ 214
5.2 The BEx Web Application Designer .............................................................. 2165.2.1 The Menu Bar .................................................................................... 2175.2.2 The “Web Items” Window ............................................................... 2215.2.3 The “Template” Window .................................................................. 2225.2.4 The “Properties” Window ................................................................. 224
5.3 The BEx Web Analyzer .................................................................................... 227
5.4 The BEx Web Application Design ................................................................. 2315.4.1 Customizing Settings for Web Reporting ....................................... 2315.4.2 Object Tags ......................................................................................... 239
Contents8
5.4.3 Language Dependency of Web Applications ................................. 2435.4.4 The Properties of the Web Template .............................................. 2495.4.5 Data Providers .................................................................................... 257
5.5 Web Items in Detail ......................................................................................... 2605.5.1 Table .................................................................................................... 2715.5.2 Chart .................................................................................................... 2765.5.3 Dropdown Box ................................................................................... 2815.5.4 Generic Navigation Block ................................................................. 2845.5.5 Label .................................................................................................... 2875.5.6 Alert Monitor ..................................................................................... 2895.5.7 Role Menu .......................................................................................... 2925.5.8 Ticker ................................................................................................... 2965.5.9 Object Catalog of the Web Application ......................................... 2975.5.10 Data Providers—Information ........................................................... 2995.5.11 Individual Document ......................................................................... 3005.5.12 Web Template .................................................................................... 3035.5.13 Query View Selection ........................................................................ 3055.5.14 Ad-hoc Query Designer .................................................................... 3095.5.15 Example: Sales Analysis with “Query View Selection” .................. 3155.5.16 Example: Menu-Controlled Web Cockpit Providing Maps
and Hierarchical Filter Selection ...................................................... 3215.5.17 Example: Simple Web Cockpit for Personnel Administration ...... 335
5.6 Web Item Library .............................................................................................. 345
5.7 Command URLs ................................................................................................ 350
5.8 Web Design API for Tables ............................................................................. 354
5.9 BEx Mobile Intelligence .................................................................................. 362
6 Information Broadcasting 365
6.1 Problem .............................................................................................................. 365
6.2 Sending Reports via Information Broadcasting .......................................... 3676.2.1 Direct Delivery of Offline Reports via E-mail ................................. 3676.2.2 Periodic Delivery of Offline Reports via E-Mail ............................. 3726.2.3 Sending Offline Reports Containing Filter Navigation
via E-Mail ............................................................................................ 3786.2.4 Direct Delivery of Navigation Statuses as Online Links ................ 385
6.3 Publishing Reports in SAP Enterprise Portal via Information Broadcasting ...................................................................................................... 3906.3.1 SAP BW Components and the SAP Enterprise Portal ................... 3906.3.2 Publishing Online Reports into the User-Specific
”My Portfolio“ .................................................................................... 3926.3.3 Publishing Offline Reports into the User-Specific
“My Portfolio” .................................................................................... 3956.3.4 Publishing Online Reports in the BEx Portfolio ............................. 399
6.4 Publishing Reports in SAP Enterprise Portal via BEx Broadcaster ........... 4026.4.1 The BEx Broadcaster in SAP Enterprise Portal ............................... 402
9Contents
6.4.2 Publishing Web Templates in SAP Enterprise Portal via the BEx Broadcaster .................................................................... 403
6.4.3 Publishing Web Templates in SAP Enterprise Portal via the BEx Broadcaster .................................................................... 406
6.5 Finding Content in SAP Enterprise Portal ................................................... 412
6.6 Information Broadcasting During Report Execution .................................. 4156.6.1 Publishing Reports Directly from Running Web Applications ..... 415
7 SAP Business Content 423
7.1 Elements of SAP Business Content ............................................................... 424
7.2 Using SAP Business Content for Reporting ................................................. 424
7.3 SAP Business Content Roles .......................................................................... 425
7.4 SAP Business Explorer Workbooks ............................................................... 428
7.5 SAP Business Explorer Web Templates ........................................................ 4307.5.1 Web Items .......................................................................................... 435
7.6 Queries ............................................................................................................... 4377.6.1 Query Views ....................................................................................... 4387.6.2 Query Elements ................................................................................. 439
7.7 Currency Translation Types ............................................................................ 441
7.8 Conclusion ......................................................................................................... 443
A Abbreviations 445
B Queries 447
B.1 Query ZECOPAM1Q00003 ............................................................................. 448
B.2 Query ZECOPAM1Q00005 ............................................................................. 451
B.3 Query ZEKDABC1Q00001 .............................................................................. 454
B.4 Query ZECOPAM1Q0001 ............................................................................... 456
B.5 Query ZEC0PAM1Q0003 ................................................................................ 458
B.6 Query ZEKDABC1Q0001 ................................................................................ 460
B.7 Query 0CSAL_C03_Q0003 ............................................................................. 462
B.8 Query 0PCA_C01_Q0005 ............................................................................... 464
B.9 Query 0PCA_C01_Q0012 ............................................................................... 466
B.10 Query 0PUR_C01_Q0011 ............................................................................... 468
B.11 Query 0SD_C01_Q030 .................................................................................... 469
B.12 Query 0SD_C05_Q0007 .................................................................................. 471
Contents10
C Formula Operators 473
C.1 Percentage Operators ...................................................................................... 473C.1.1 Deviation Percentage (%) ................................................................. 473C.1.2 Percentage (%A) ................................................................................ 473C.1.3 Percentage in Preliminary Result (%CT) ......................................... 473C.1.4 Percentage in Overall Result (%CT) ................................................ 473C.1.5 Percentage in Reporting Result (%RT) ............................................ 474
C.2 Data Functions .................................................................................................. 474C.2.1 COUNT () ............................................................................................ 474C.2.2 NDIV0 () ............................................................................................. 474C.2.3 NODIM () ........................................................................................... 475C.2.4 NOERR () ............................................................................................ 475
C.3 Totals Operators ............................................................................................... 475C.3.1 Subtotal ............................................................................................... 475C.3.2 Total ..................................................................................................... 475C.3.3 Report Total ........................................................................................ 475
C.4 Boolean Operators ........................................................................................... 476C.4.1 Relational operators ==, <>, <, >, <=, >= ....................................... 476C.4.2 Logical And (AND) ............................................................................. 476C.4.3 Logical Or (OR) .................................................................................. 476C.4.4 Logical Exclusive Or (XOR) ............................................................... 476C.4.5 Logical Not (NOT) ............................................................................. 476C.4.6 LEAF () ................................................................................................. 477
D Attributes and Values of BEx Web 479
D.1 CSS Formats ...................................................................................................... 479
D.2 Web Items: General Attributes ...................................................................... 485
D.3 Web Items: Specific Attributes ...................................................................... 486D.3.1 Table .................................................................................................... 486D.3.2 Chart .................................................................................................... 487D.3.3 Dropdown Box ................................................................................... 488D.3.4 Radio Button Group .......................................................................... 488D.3.5 Checkboxes ........................................................................................ 488D.3.6 Generic Navigation Block ................................................................. 489D.3.7 Hierarchical Filter Selection .............................................................. 490D.3.8 Filters ................................................................................................... 490D.3.9 Label .................................................................................................... 491D.3.10 Text Elements ..................................................................................... 491D.3.11 Alert Monitor ..................................................................................... 492D.3.12 Role Menu .......................................................................................... 493D.3.13 Ticker ................................................................................................... 494D.3.14 Map ..................................................................................................... 495D.3.15 Individual Document ......................................................................... 496D.3.16 List of Documents ............................................................................. 497D.3.17 Data Provider—Information ............................................................. 497
11Contents
D.3.18 Object Catalog of the Web Application ......................................... 498D.3.19 Web Template ................................................................................... 498D.3.20 Broadcasters ....................................................................................... 499D.3.21 Key Figures—Overview .................................................................... 499D.3.22 Query View—Selection ..................................................................... 500D.3.23 Ad-Hoc Query Designer ................................................................... 501D.3.24 ABC Classification .............................................................................. 501D.3.25 Simulation Prediction ........................................................................ 502
D.4 Properties of the Web Template ................................................................... 502
E Transaction Codes 505
E.1 Transactions in SAP BW .................................................................................. 505
E.2 SAP R/3 Transactions Relevant to SAP BW ................................................. 508
F Metadata Tables 509
F.1 InfoObject ......................................................................................................... 509
F.2 InfoCube ............................................................................................................ 509
F.3 Aggregate .......................................................................................................... 510
F.4 ODS Object ....................................................................................................... 510
F.5 PSA ..................................................................................................................... 510
F.6 DataSource (= OLTP Source) .......................................................................... 510
F.7 InfoSource ......................................................................................................... 511
F.8 Communications Structure ............................................................................. 511
F.9 Transfer Structure ............................................................................................. 511
F.10 Mapping ............................................................................................................ 511
F.11 SAP BW Statistics ............................................................................................ 512
G Glossary 513
H Literature 561
I The Authors 563
Index 567
99The SAP Business Explorer Query Designer
4 The SAP Business Explorer Query Designer
Queries are the core of the reporting and analysis functional-ity in SAP BW. They provide a flexible and intuitive platform for data analysis that can be developed using the SAP Busi-ness Explorer (BEx) Query Designer. The following chapter will present all essential functionalities of an SAP BW query, as well as the corresponding design tools.
4.1 Data Analysis with SAP Business Information Warehouse—The Query Concept
Business intelligence tools are intended to support users in understandingthe enterprise performance and to help users make appropriate decisionsbased on their understanding. One critical aspect here that you shouldnote is the need to give all users an equal insight into the enterprise—aninsight based on consistent data and standard analytical definitions. Forconsistent enterprise control, a unified view of information for all users isindispensable.
On the one hand, this is achieved by the SAP Business Information Ware-house (SAP BW) functionality for extraction and data warehousing via aconsistent data basis. Conversely, queries can provide a unified and flexi-ble analysis platform according to the Single Point of Truth concept. Thismeans that within an enterprise, a piece of information (or a dataset)exists once as a reference and cannot be falsified by locally changed vari-ants.
Essentially, a query is a database research action with interesting addi-tional functionality like currency scenarios, complex calculation options,and analysis functions. However, analyses born out of queries can beapplied flexibly to a multitude of areas in a multidimensional dataset of anSAP BW InfoProvider. This is enabled by combining analytical functional-ity with the provided drilldowns and filter options. Therefore, one queryor few queries can often map an entire analytical application.
Within this chapter, all essential functionalities of an SAP BW query andthe associated design tool are introduced, both in terms of their concep-tual design and in examples that increasingly build on each other. The
The SAP Business Explorer Query Designer100
examples are analysis solutions for the data model that was already devel-oped in the first two volumes of the SAP BW Library.1
4.1.1 Functional Overview of the BEx Query Designer
The Query Designer is a standalone tool that—to a great extent—can behandled intuitively. A look at the Query Designer’s user interface helps toillustrate its functionality.
First Steps in the Query Designer
Open theQuery Designer
Therefore, the first practical step should be to open the Query Designer inorder to gain a quick overview of its different areas.
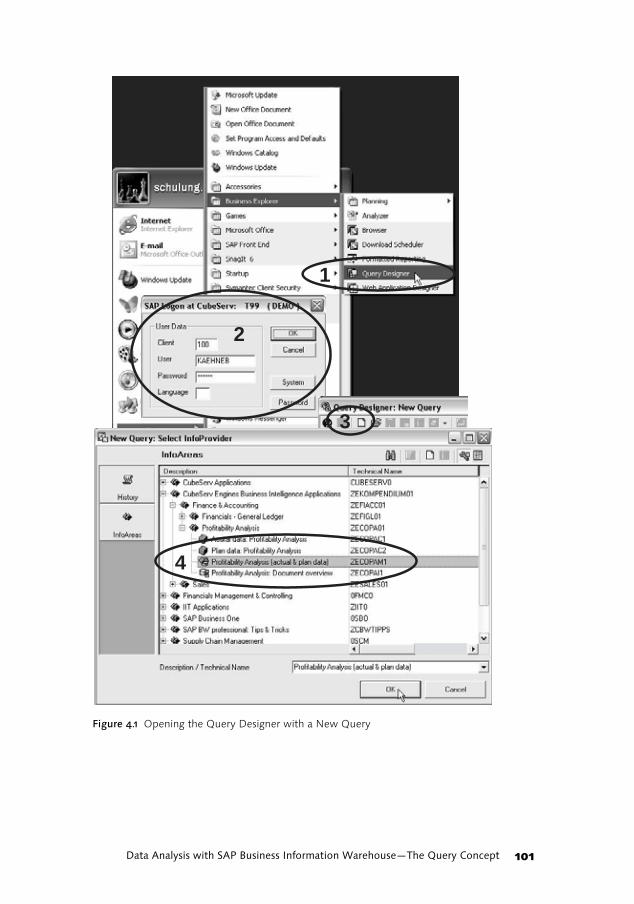
� You can start the Query Designer directly from the Windows programmenu via Business Explorer • Query Designer (see Figure 4.1, Step 1).
� In the logon dialog, log onto your system (Step 2).
� Start by creating a query on the MultiProvider ZECOPAM1 ProfitabilityAnalysis (actual & plan data) (Steps 3 and 4).
Areas of theQuery Designer
The Query Designer interface is divided into three main areas that aredescribed in detail in the following sections:
� Available elements of the InfoProvider (see Figure 4.2, 1)
� Query definition (2)
� Toolbar (3)
1 See Chapter 3, Sample Scenario, and Appendix H, The SAP BW Library.
The Open dialog (Step 4) allows you to display objects according todifferent perspectives. These can be recently opened objects, favorites,roles or InfoAreas. InfoAreas form the global folder structure, which istechnically stored in the system. Additionally, roles and favorites canmap individual folder structures.
101Data Analysis with SAP Business Information Warehouse—The Query Concept
Figure 4.1 Opening the Query Designer with a New Query
1
2
3
4
The SAP Business Explorer Query Designer102
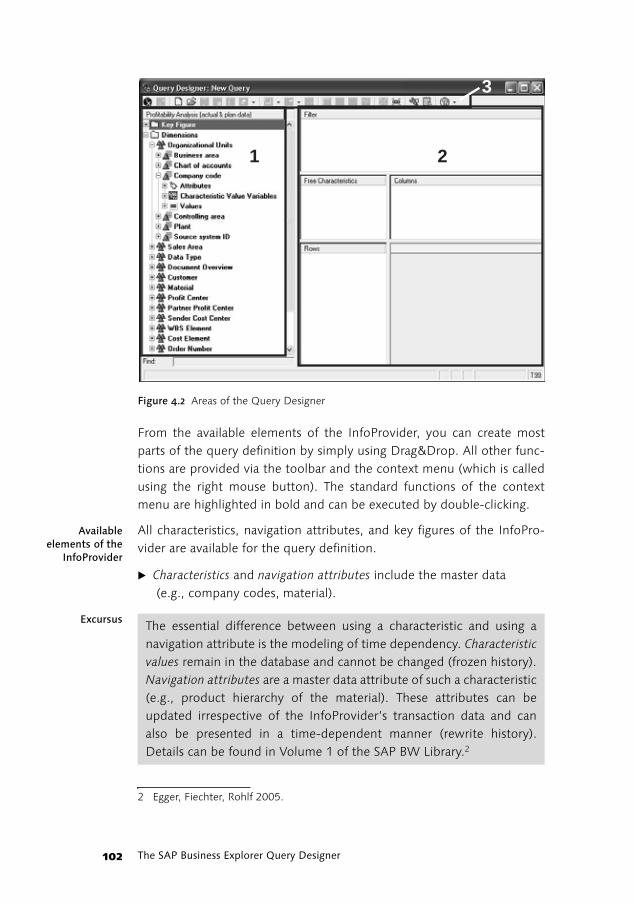
Figure 4.2 Areas of the Query Designer
From the available elements of the InfoProvider, you can create mostparts of the query definition by simply using Drag&Drop. All other func-tions are provided via the toolbar and the context menu (which is calledusing the right mouse button). The standard functions of the contextmenu are highlighted in bold and can be executed by double-clicking.
Availableelements of the
InfoProvider
All characteristics, navigation attributes, and key figures of the InfoPro-vider are available for the query definition.
� Characteristics and navigation attributes include the master data (e.g., company codes, material).2
Excursus
3
21
2 Egger, Fiechter, Rohlf 2005.
The essential difference between using a characteristic and using anavigation attribute is the modeling of time dependency. Characteristicvalues remain in the database and cannot be changed (frozen history).Navigation attributes are a master data attribute of such a characteristic(e.g., product hierarchy of the material). These attributes can beupdated irrespective of the InfoProvider’s transaction data and canalso be presented in a time-dependent manner (rewrite history).Details can be found in Volume 1 of the SAP BW Library.2
103Data Analysis with SAP Business Information Warehouse—The Query Concept
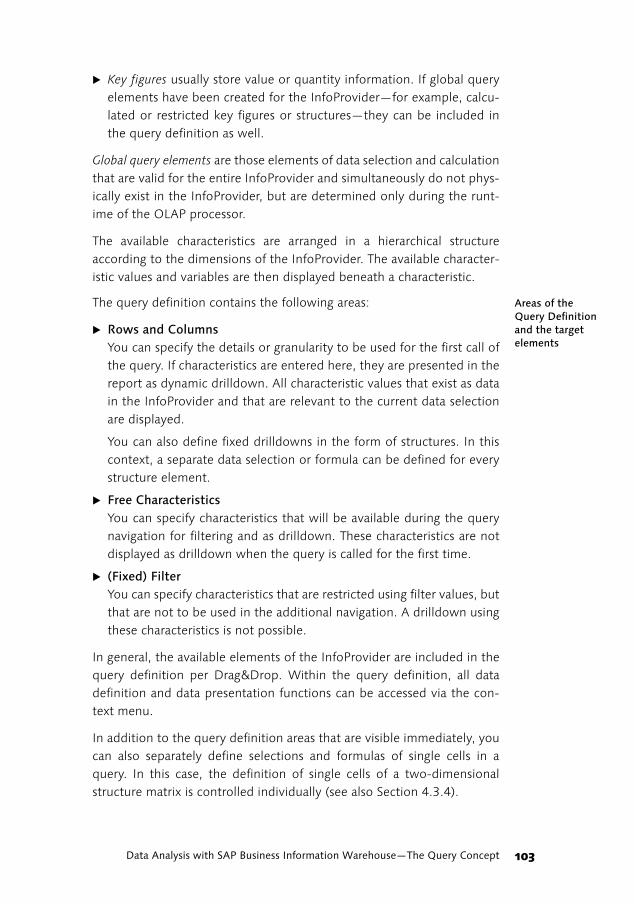
� Key figures usually store value or quantity information. If global queryelements have been created for the InfoProvider—for example, calcu-lated or restricted key figures or structures—they can be included inthe query definition as well.
Global query elements are those elements of data selection and calculationthat are valid for the entire InfoProvider and simultaneously do not phys-ically exist in the InfoProvider, but are determined only during the runt-ime of the OLAP processor.
The available characteristics are arranged in a hierarchical structureaccording to the dimensions of the InfoProvider. The available character-istic values and variables are then displayed beneath a characteristic.
Areas of the Query Definition and the target elements
The query definition contains the following areas:
� Rows and ColumnsYou can specify the details or granularity to be used for the first call ofthe query. If characteristics are entered here, they are presented in thereport as dynamic drilldown. All characteristic values that exist as datain the InfoProvider and that are relevant to the current data selectionare displayed.
You can also define fixed drilldowns in the form of structures. In thiscontext, a separate data selection or formula can be defined for everystructure element.
� Free CharacteristicsYou can specify characteristics that will be available during the querynavigation for filtering and as drilldown. These characteristics are notdisplayed as drilldown when the query is called for the first time.
� (Fixed) FilterYou can specify characteristics that are restricted using filter values, butthat are not to be used in the additional navigation. A drilldown usingthese characteristics is not possible.
In general, the available elements of the InfoProvider are included in thequery definition per Drag&Drop. Within the query definition, all datadefinition and data presentation functions can be accessed via the con-text menu.
In addition to the query definition areas that are visible immediately, youcan also separately define selections and formulas of single cells in aquery. In this case, the definition of single cells of a two-dimensionalstructure matrix is controlled individually (see also Section 4.3.4).
The SAP Business Explorer Query Designer104
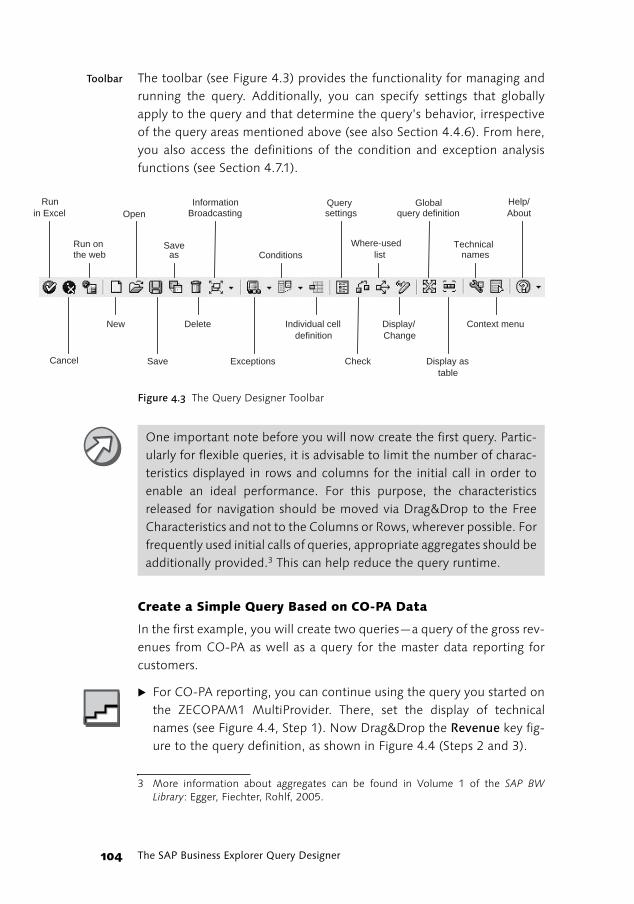
Toolbar The toolbar (see Figure 4.3) provides the functionality for managing andrunning the query. Additionally, you can specify settings that globallyapply to the query and that determine the query’s behavior, irrespectiveof the query areas mentioned above (see also Section 4.4.6). From here,you also access the definitions of the condition and exception analysisfunctions (see Section 4.7.1).
Figure 4.3 The Query Designer Toolbar 3
Create a Simple Query Based on CO-PA Data
In the first example, you will create two queries—a query of the gross rev-enues from CO-PA as well as a query for the master data reporting forcustomers.
� For CO-PA reporting, you can continue using the query you started onthe ZECOPAM1 MultiProvider. There, set the display of technicalnames (see Figure 4.4, Step 1). Now Drag&Drop the Revenue key fig-ure to the query definition, as shown in Figure 4.4 (Steps 2 and 3).
Runin Excel
Run onthe web
Cancel
New
Open
Save
Saveas
Delete
InformationBroadcasting
Exceptions
Conditions
Individual celldefinition
Querysettings
Check
Where-usedlist
Display/Change
Globalquery definition
Display astable
Technicalnames
Help/About
Context menu
3 More information about aggregates can be found in Volume 1 of the SAP BWLibrary: Egger, Fiechter, Rohlf, 2005.
One important note before you will now create the first query. Partic-ularly for flexible queries, it is advisable to limit the number of charac-teristics displayed in rows and columns for the initial call in order toenable an ideal performance. For this purpose, the characteristicsreleased for navigation should be moved via Drag&Drop to the FreeCharacteristics and not to the Columns or Rows, wherever possible. Forfrequently used initial calls of queries, appropriate aggregates should beadditionally provided.3 This can help reduce the query runtime.
105Data Analysis with SAP Business Information Warehouse—The Query Concept
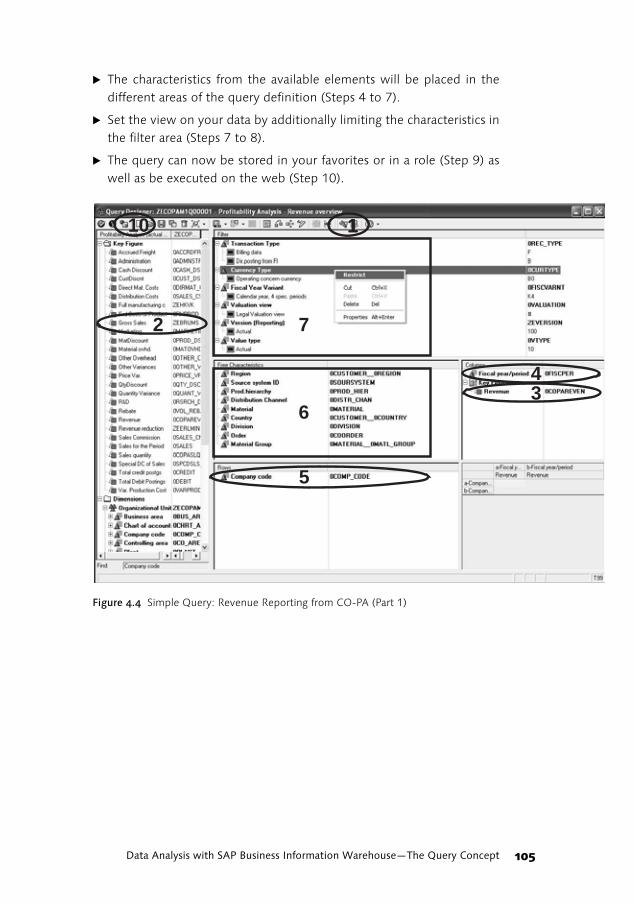
� The characteristics from the available elements will be placed in thedifferent areas of the query definition (Steps 4 to 7).
� Set the view on your data by additionally limiting the characteristics inthe filter area (Steps 7 to 8).
� The query can now be stored in your favorites or in a role (Step 9) aswell as be executed on the web (Step 10).
Figure 4.4 Simple Query: Revenue Reporting from CO-PA (Part 1)
11
2
43
5
6
7
10
The SAP Business Explorer Query Designer106
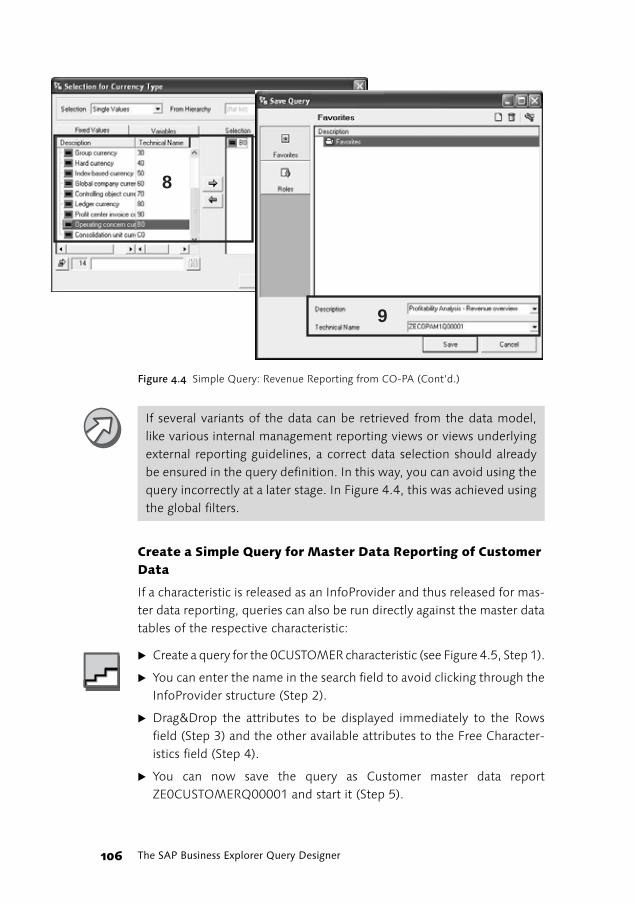
Figure 4.4 Simple Query: Revenue Reporting from CO-PA (Cont’d.)
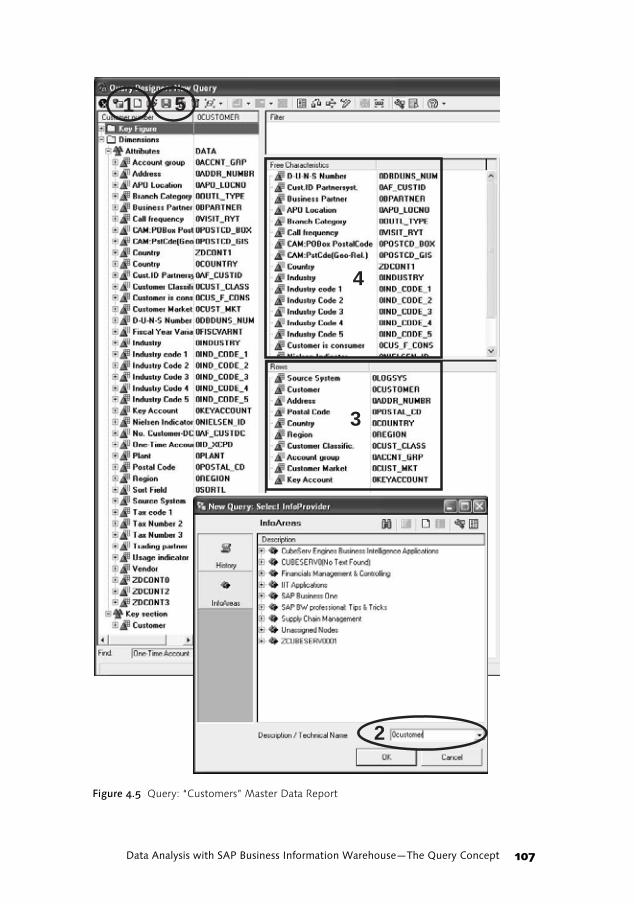
Create a Simple Query for Master Data Reporting of Customer Data
If a characteristic is released as an InfoProvider and thus released for mas-ter data reporting, queries can also be run directly against the master datatables of the respective characteristic:
� Create a query for the 0CUSTOMER characteristic (see Figure 4.5, Step 1).
� You can enter the name in the search field to avoid clicking through theInfoProvider structure (Step 2).
� Drag&Drop the attributes to be displayed immediately to the Rowsfield (Step 3) and the other available attributes to the Free Character-istics field (Step 4).
� You can now save the query as Customer master data reportZE0CUSTOMERQ00001 and start it (Step 5).
8
9
If several variants of the data can be retrieved from the data model,like various internal management reporting views or views underlyingexternal reporting guidelines, a correct data selection should alreadybe ensured in the query definition. In this way, you can avoid using thequery incorrectly at a later stage. In Figure 4.4, this was achieved usingthe global filters.
107Data Analysis with SAP Business Information Warehouse—The Query Concept
Figure 4.5 Query: “Customers” Master Data Report
4
3
1 5
2
The SAP Business Explorer Query Designer108
The queries created here can still be substantially optimized, which is fur-ther explained in the following sections.
4.1.2 Overview of Query Elements
You can use different elements in the definition of a query. If these ele-ments are visible, they are assigned a corresponding icon in the QueryDesigner (as illustrated in the figures of the following examples). Here is ashort overview of the various elements:
� CharacteristicsCharacteristics define the available level of details (also called granular-ity) of the database. Therefore, you can filter data and define details fordrilldowns.
� SelectionsSelections usually query the value or quantity information of the data-base stored in key figures. Additionally, filter restrictions can beincluded for user-definable characteristic values so that the key figurevalue is issued for only these characteristic values. During the execu-tion of the query, amounts can be converted using currency scenarios.
� FormulasIn formulas, further calculations can be carried out using the valuesdetermined by selections and other formulas. Several previouslydefined selections or formula results can be combined and included inthe results of a formula.
� StructuresEvery selection or formula is embedded in a structure as an element.From the user’s perspective, these structures seem like characteristicsthat enable the selection of single structure elements. These structuresoften map the analytical functionality of the query.
� Filter valuesThe values of a characteristic that are available at query runtime can bedetermined in the query definition by using filter values.
� VariablesIn most cases, characteristic variables are used to determine the char-acteristic values to be filtered before executing the query instead ofspecifying them already in the query definition. Additionally, text vari-ables provide the possibility to dynamically determine the descriptionof structure elements.
109Data Analysis with SAP Business Information Warehouse—The Query Concept
� HierarchiesCharacteristic values or structure elements can be displayed hierarchi-cally during the execution of the query. It is also possible to navigate inhierarchies by displaying and filtering subtrees.
However, there might be elements in the query definition that are notimmediately visible:
� Data definition in cellsIf a query possesses two structures, single cells of the matrix formed bythese structures can be defined separately. These can be either inde-pendent data selections or formulas that refer to other cells of thematrix.
� ConditionsThe display of details can be controlled not only by selecting character-istics, but also depending on the value or quantity information instructures. For example, this enables typical top n analyses.
� ExceptionsExceptions can be used to highlight data depending on the value orquantity information. Additionally, status information can be deter-mined, which can be analyzed in separate exception reports.
The following sections discuss these elements in detail. They will then beintegrated in the reporting solutions of the case study.
4.1.3 Global and Local Query Definition
Within the query definition, elements that are valid for all users can bedistinguished from those elements that can be varied on demand. The lat-ter can be changed both in the global and in the local query definitions.For the application of the query in Excel, for example, this is a significantadvantage.
Open the Query Designer from Excel
The Query Designer can also be started from the BEx Analyzer in Excel.Open it via the Windows program menu by selecting Business Explorer •Analyzer.
� Using the Business Explorer menu in Excel, change to the global querydefinition. The functionality available here is identical to the function-ality available when opening the Query Designer directly—in this case,however, the query can also be executed in Excel.
The SAP Business Explorer Query Designer110
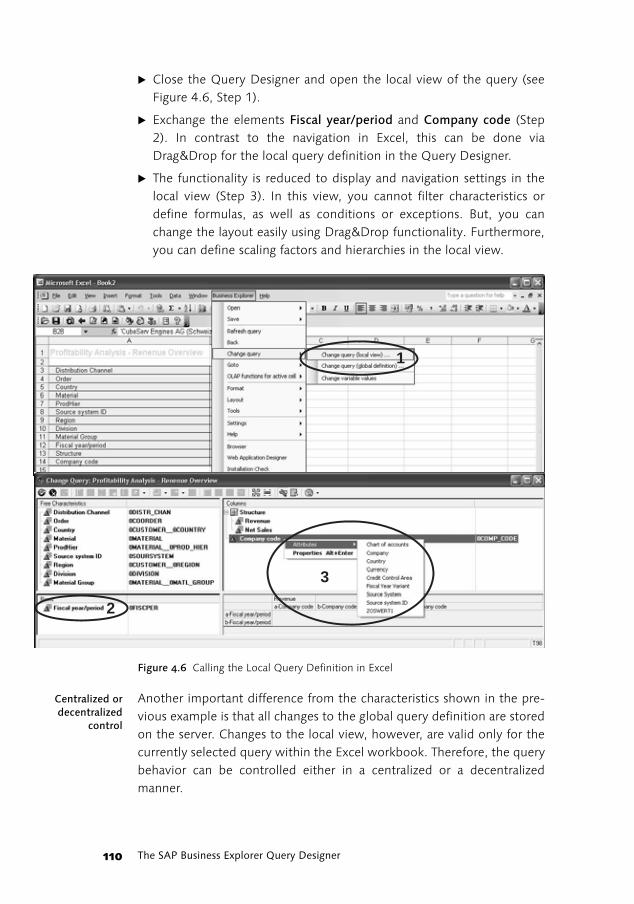
� Close the Query Designer and open the local view of the query (seeFigure 4.6, Step 1).
� Exchange the elements Fiscal year/period and Company code (Step2). In contrast to the navigation in Excel, this can be done viaDrag&Drop for the local query definition in the Query Designer.
� The functionality is reduced to display and navigation settings in thelocal view (Step 3). In this view, you cannot filter characteristics ordefine formulas, as well as conditions or exceptions. But, you canchange the layout easily using Drag&Drop functionality. Furthermore,you can define scaling factors and hierarchies in the local view.
Figure 4.6 Calling the Local Query Definition in Excel
Centralized ordecentralized
control
Another important difference from the characteristics shown in the pre-vious example is that all changes to the global query definition are storedon the server. Changes to the local view, however, are valid only for thecurrently selected query within the Excel workbook. Therefore, the querybehavior can be controlled either in a centralized or a decentralizedmanner.
1
2
3
111Reusable Query Elements
However, you can also store local views centrally on the server. As of BWRelease 3.5, this can be on the web as well. Starting with BW 3.5, thenavigational states stored in this way can be used for easily controllingflexible web cockpits.
Authorization and Transport
Another important aspect is the authorization for changing the twoviews. While changing the global view requires the authorization forchanging the query definition on the server, changing the local viewrequires only the authorization for running the query. If a query is definedon the development system and transported to the production system,which is common practice, the aforementioned authorization aspect alsoapplies to the change options of the query. All changes to the global viewmust take place on the development system. The local view, however,can be adapted as necessary on every system on which the query may beexecuted.
4.2 Reusable Query ElementsModularizationTo make the design of queries within reporting solutions efficient, you
can modularize and reuse various query elements. You can use these ele-ments across several queries. A one-time central change of the elementimmediately affects all queries using the respective element.
In the following section, the special aspects of these elements are pre-sented, in particular, regarding their reusability. The corresponding defini-tion and presentation possibilities are discussed in detail in later sections.
This different validity area can be very useful for complex solutions,but also rather confusing at first. In simple solutions and at the begin-ning, it is therefore advisable to work with only the global query defi-nition.
This modularization option is a very effective means for centrally con-trolling the functionality of reporting solutions and for avoiding multi-ple development. But, clear guidelines for design and naming conven-tions—as well as the communication of requirements and responsibil-ities—are important prerequisites to ensure efficiency for several querydevelopers.
The SAP Business Explorer Query Designer112
4.2.1 Flexible Query Control with Variables
If a query was developed for particular analyses, its parameters should becontrollable in a flexible way and without the necessity to change. Inmany cases, this is achieved using variables.
You can find detailed background information about variables in Section4.5. The following examples (up to Section 4.5) can be edited withouthaving this information.
Include Variables in a Query
Now you’ll create the restriction for fiscal period and other characteristicsusing variables for the ZECOPAM1Q00001 query that you just defined.
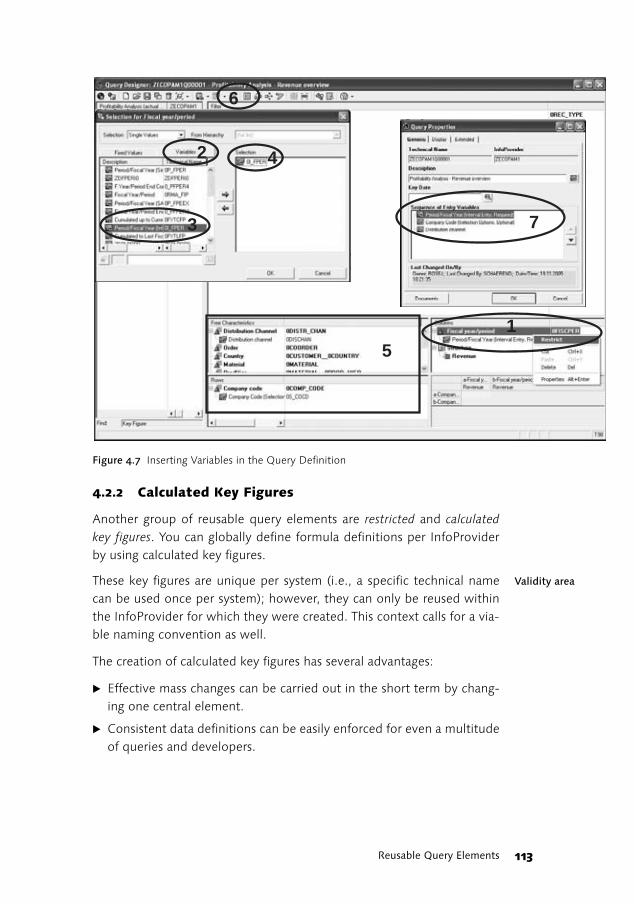
� For this purpose, open the global query definition. Using the contextmenu of the 0FISCPER characteristic, go to the filter menu (see Figure4.7, Step 1).
� On the Variables tab (Step 2), select the 0I_FPER variable (Step 4). Thisvariable of the “Interval” type is delivered by SAP as Business Content.
� To find the variable, you can first display technical names using thecontext menu (Step 3). You can also define variables.
� Restrict further characteristics of the query definition (Step 5).
� The variables now selected are marked as ready for input and will bedisplayed in a popup before the query is executed.
� You can specify the order of the variable query (Step 7) in the queryproperties (Step 6). For background information about the definitionof user-defined variables and the available parameters, as well as anexample of a variable popup, see Section 4.5.
Variables are created globally per BW. Once a variable exists in the sys-tem, it can be used in all queries. Particularly in this context, it is rec-ommended that you use naming conventions that are intuitive, that is,the name that you’ve assigned to the variable is synonymous with itsfunction. Consequently, the obvious advantages of this principle canbe used to their full extent, and all developers can work with the samevariables.
113Reusable Query Elements
Figure 4.7 Inserting Variables in the Query Definition
4.2.2 Calculated Key Figures
Another group of reusable query elements are restricted and calculatedkey figures. You can globally define formula definitions per InfoProviderby using calculated key figures.
Validity areaThese key figures are unique per system (i.e., a specific technical namecan be used once per system); however, they can only be reused withinthe InfoProvider for which they were created. This context calls for a via-ble naming convention as well.
The creation of calculated key figures has several advantages:
� Effective mass changes can be carried out in the short term by chang-ing one central element.
� Consistent data definitions can be easily enforced for even a multitudeof queries and developers.
1
2
3
4
5
6
7
The SAP Business Explorer Query Designer114
� The reuse of the same variables can be ensured. This allows for thecombination of variable inputs when running several queries simulta-neously.
� The largest part of the query definition can be effected by dragging anddropping predefined, frequently used selections, which simplifies theprocess considerably.
These arguments also apply to the restricted key figures and global struc-tures described in the following section.
Availablefunctions
The formula definition in calculated key figures corresponds to the defini-tion of normal formula elements of a structure. Besides the usual mathe-matical operators, further functions provided by SAP can be utilized.However, results-based calculations are not available (see also Section4.3.2).4
Calculation time In general, formulas are analyzed after reading the data and its aggrega-tion. This is advisable particularly for performance-related reasons. Insimpler formulas, the calculation can be carried out even before theaggregation. As a prerequisite, only constants, basic key figures, or othersimple calculated key figures with the same aggregation can be used asoperands of the formula.
To avoid a loss of performance, as a solution alternative to mapping thereporting requirements, you should precalculate the value to be deter-mined and, if possible, store it in the InfoProvider. If the data required forthe calculation is stored as an attribute of a characteristic used in thereport, you can also implement a formula using a formula variable with asubstitution from the attribute data (see Section 4.6.4).
Create a Calculated Key Figure for Net Sales from CO-PA
In the following example, the sales analysis just created from the resultscalculation will be extended by the net sales and methodically optimized.For this purpose, you will extend the previously createdZECOPAM1Q00001 query by a calculated key figure for analyzing the netsales:
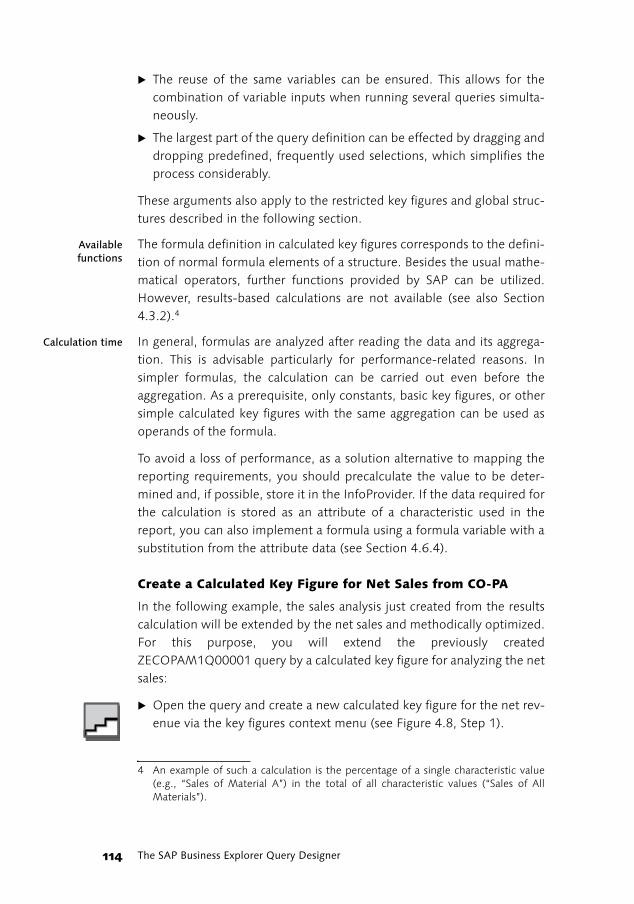
� Open the query and create a new calculated key figure for the net rev-enue via the key figures context menu (see Figure 4.8, Step 1).
4 An example of such a calculation is the percentage of a single characteristic value(e.g., “Sales of Material A”) in the total of all characteristic values (“Sales of AllMaterials”).
115Reusable Query Elements
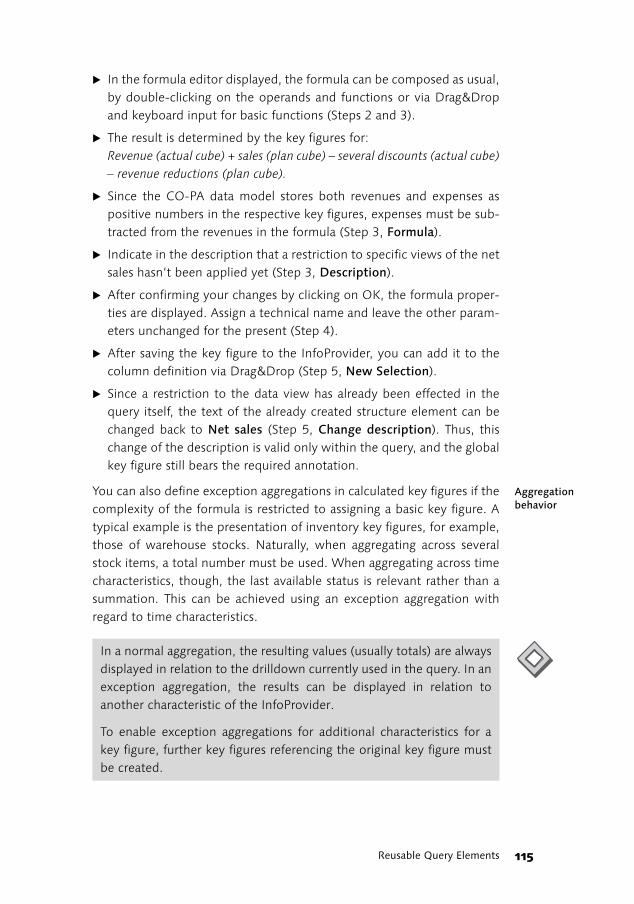
� In the formula editor displayed, the formula can be composed as usual,by double-clicking on the operands and functions or via Drag&Dropand keyboard input for basic functions (Steps 2 and 3).
� The result is determined by the key figures for:Revenue (actual cube) + sales (plan cube) – several discounts (actual cube)– revenue reductions (plan cube).
� Since the CO-PA data model stores both revenues and expenses aspositive numbers in the respective key figures, expenses must be sub-tracted from the revenues in the formula (Step 3, Formula).
� Indicate in the description that a restriction to specific views of the netsales hasn’t been applied yet (Step 3, Description).
� After confirming your changes by clicking on OK, the formula proper-ties are displayed. Assign a technical name and leave the other param-eters unchanged for the present (Step 4).
� After saving the key figure to the InfoProvider, you can add it to thecolumn definition via Drag&Drop (Step 5, New Selection).
� Since a restriction to the data view has already been effected in thequery itself, the text of the already created structure element can bechanged back to Net sales (Step 5, Change description). Thus, thischange of the description is valid only within the query, and the globalkey figure still bears the required annotation.
Aggregation behavior
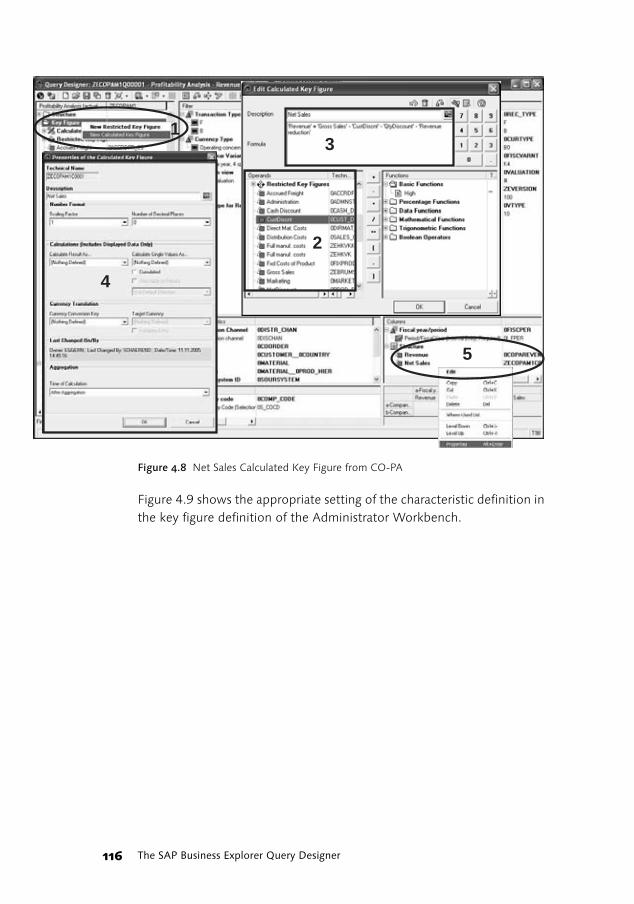
You can also define exception aggregations in calculated key figures if thecomplexity of the formula is restricted to assigning a basic key figure. Atypical example is the presentation of inventory key figures, for example,those of warehouse stocks. Naturally, when aggregating across severalstock items, a total number must be used. When aggregating across timecharacteristics, though, the last available status is relevant rather than asummation. This can be achieved using an exception aggregation withregard to time characteristics.
In a normal aggregation, the resulting values (usually totals) are alwaysdisplayed in relation to the drilldown currently used in the query. In anexception aggregation, the results can be displayed in relation toanother characteristic of the InfoProvider.
To enable exception aggregations for additional characteristics for akey figure, further key figures referencing the original key figure mustbe created.
The SAP Business Explorer Query Designer116
Figure 4.8 Net Sales Calculated Key Figure from CO-PA
Figure 4.9 shows the appropriate setting of the characteristic definition inthe key figure definition of the Administrator Workbench.
1
2
3
4
5
117Reusable Query Elements
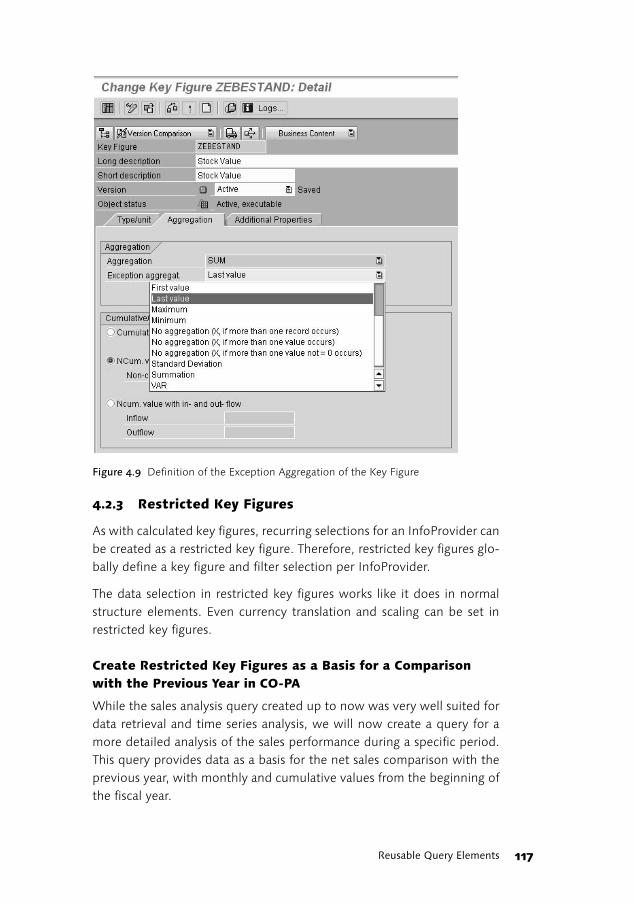
Figure 4.9 Definition of the Exception Aggregation of the Key Figure
4.2.3 Restricted Key Figures
As with calculated key figures, recurring selections for an InfoProvider canbe created as a restricted key figure. Therefore, restricted key figures glo-bally define a key figure and filter selection per InfoProvider.
The data selection in restricted key figures works like it does in normalstructure elements. Even currency translation and scaling can be set inrestricted key figures.
Create Restricted Key Figures as a Basis for a Comparison with the Previous Year in CO-PA
While the sales analysis query created up to now was very well suited fordata retrieval and time series analysis, we will now create a query for amore detailed analysis of the sales performance during a specific period.This query provides data as a basis for the net sales comparison with theprevious year, with monthly and cumulative values from the beginning ofthe fiscal year.
The SAP Business Explorer Query Designer118
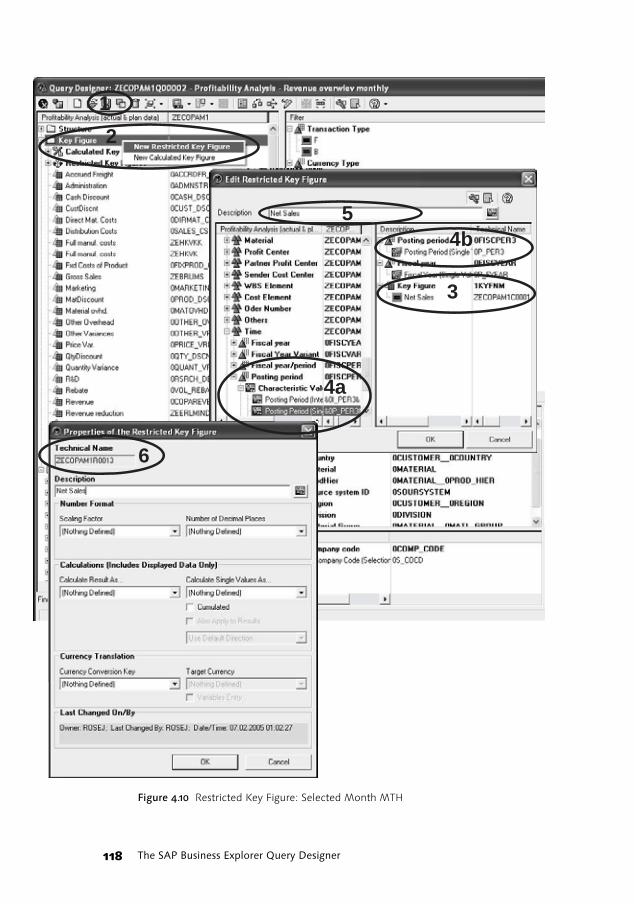
Figure 4.10 Restricted Key Figure: Selected Month MTH
1
2
4a
4b
3
5
6
119Reusable Query Elements
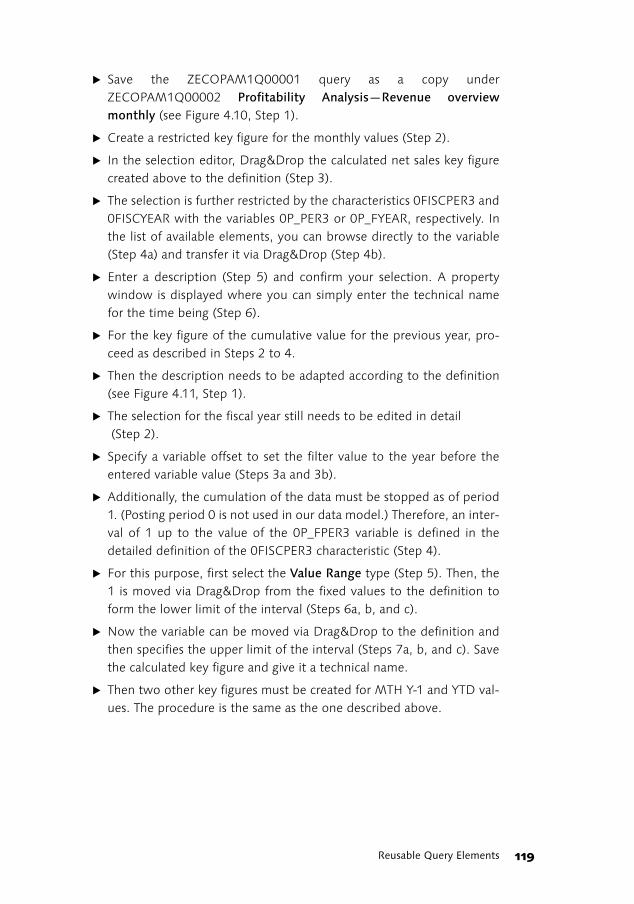
� Save the ZECOPAM1Q00001 query as a copy underZECOPAM1Q00002 Profitability Analysis—Revenue overviewmonthly (see Figure 4.10, Step 1).
� Create a restricted key figure for the monthly values (Step 2).
� In the selection editor, Drag&Drop the calculated net sales key figurecreated above to the definition (Step 3).
� The selection is further restricted by the characteristics 0FISCPER3 and0FISCYEAR with the variables 0P_PER3 or 0P_FYEAR, respectively. Inthe list of available elements, you can browse directly to the variable(Step 4a) and transfer it via Drag&Drop (Step 4b).
� Enter a description (Step 5) and confirm your selection. A propertywindow is displayed where you can simply enter the technical namefor the time being (Step 6).
� For the key figure of the cumulative value for the previous year, pro-ceed as described in Steps 2 to 4.
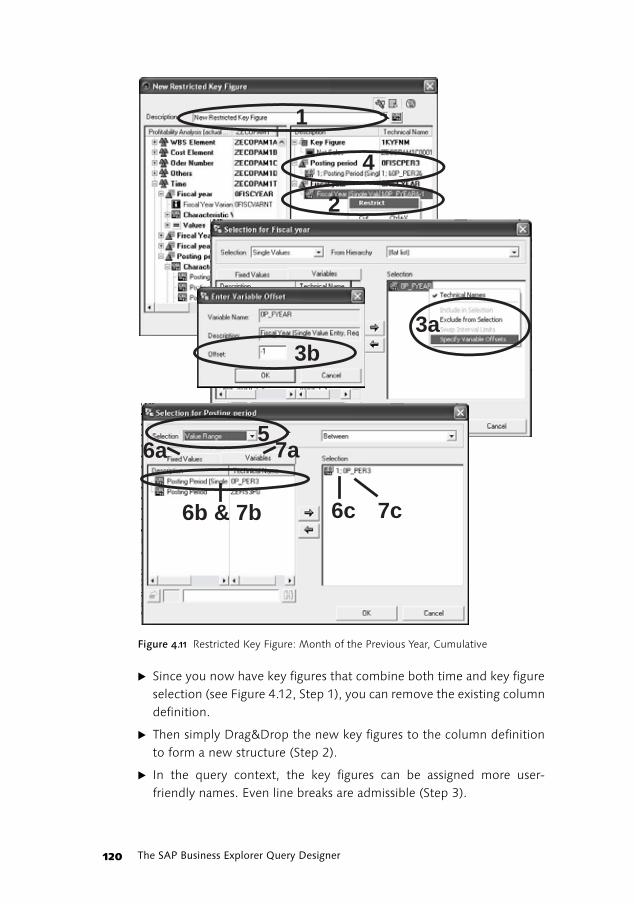
� Then the description needs to be adapted according to the definition(see Figure 4.11, Step 1).
� The selection for the fiscal year still needs to be edited in detail (Step 2).
� Specify a variable offset to set the filter value to the year before theentered variable value (Steps 3a and 3b).
� Additionally, the cumulation of the data must be stopped as of period1. (Posting period 0 is not used in our data model.) Therefore, an inter-val of 1 up to the value of the 0P_FPER3 variable is defined in thedetailed definition of the 0FISCPER3 characteristic (Step 4).
� For this purpose, first select the Value Range type (Step 5). Then, the1 is moved via Drag&Drop from the fixed values to the definition toform the lower limit of the interval (Steps 6a, b, and c).
� Now the variable can be moved via Drag&Drop to the definition andthen specifies the upper limit of the interval (Steps 7a, b, and c). Savethe calculated key figure and give it a technical name.
� Then two other key figures must be created for MTH Y-1 and YTD val-ues. The procedure is the same as the one described above.
The SAP Business Explorer Query Designer120
Figure 4.11 Restricted Key Figure: Month of the Previous Year, Cumulative
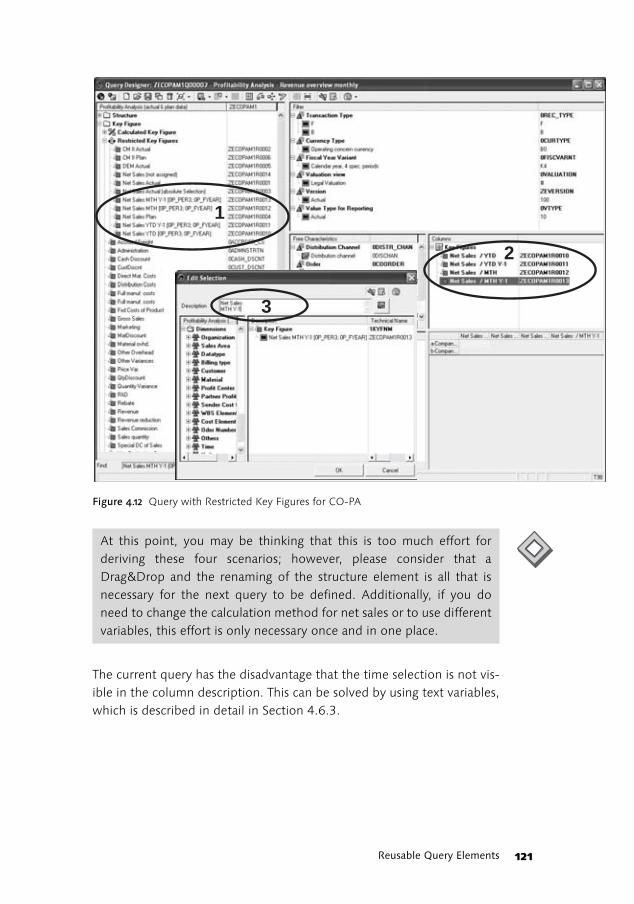
� Since you now have key figures that combine both time and key figureselection (see Figure 4.12, Step 1), you can remove the existing columndefinition.
� Then simply Drag&Drop the new key figures to the column definitionto form a new structure (Step 2).
� In the query context, the key figures can be assigned more user-friendly names. Even line breaks are admissible (Step 3).
1
4
2
3b
5
3a
7c6c6b & 7b
7a6a
121Reusable Query Elements
Figure 4.12 Query with Restricted Key Figures for CO-PA
The current query has the disadvantage that the time selection is not vis-ible in the column description. This can be solved by using text variables,which is described in detail in Section 4.6.3.
3
1
2
At this point, you may be thinking that this is too much effort forderiving these four scenarios; however, please consider that aDrag&Drop and the renaming of the structure element is all that isnecessary for the next query to be defined. Additionally, if you doneed to change the calculation method for net sales or to use differentvariables, this effort is only necessary once and in one place.
The SAP Business Explorer Query Designer122
4.2.4 Restricted and Calculated Key Figures with Mutual Dependencies
Since BW 3.0, you can use restricted and calculated key figures in anycombination. In the previous example, a calculated key figure was alreadyused within a restricted key figure. Even more complex combinations aretheoretically possible.
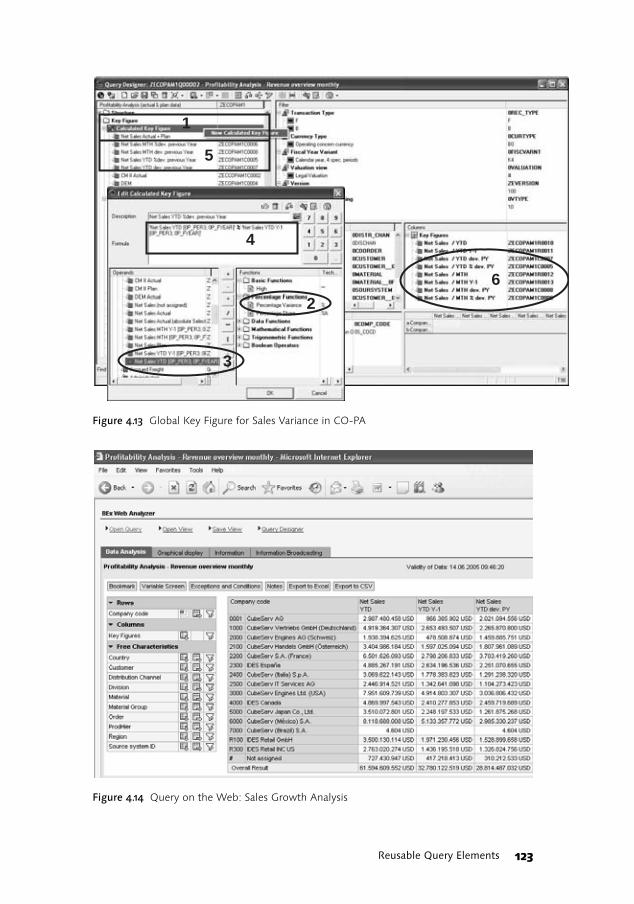
Complex Calculated Key Figure for Sales Variance in CO-PA
In the following example, for the sales analysis based on CO-PA data, thevariance percentage—as compared to the previous year—is stored on theInfoProvider using global key figures. In this way, these key figures can beeasily added to other queries at a later stage. The queryZECOPAM1Q00002 Profitability Analysis—Revenue overview monthlythat has just been created is then extended by these key figures:
� Create a new calculated key figure (see Figure 4.13, Step 1).
� The formula result is the Percentage Variance function (Step 2)between the Net Sales YTD operands of the current and the previousyear (Step 3).
� The individual elements can be re-inserted using Drag&Drop or bydouble-clicking (Step 4).
� Save the calculated key figure. When saving, you should set the scalingfactor in the properties; otherwise, the OLAP processor will return thenumbers with the highest possible accuracy.
� Repeat this procedure to determine additional key figures for themonthly sales variance percentage—as compared to the previousyear—as well as the monthly and the cumulative absolute variances(Step 5).
� You can now transfer the available key figures for the sales variance tothe query structure using Drag&Drop functionality (Step 6).
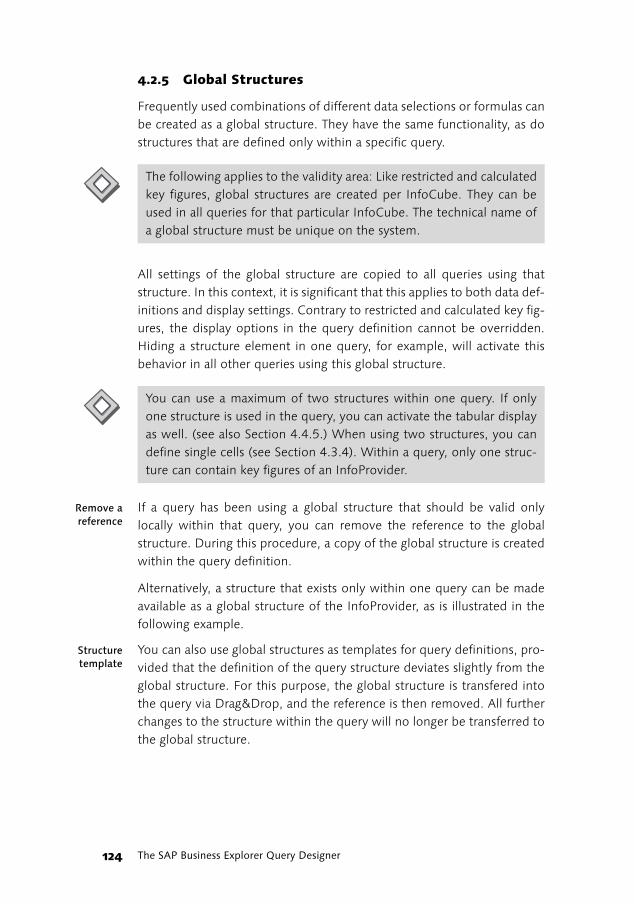
� Figure 4.14 shows the result on the web. Here you have all the naviga-tion options; for example, exchanging or adding drilldowns or sortingby sales growth.
This ability to nest one key figure within another key figure, in partic-ular, allows for very flexible solution approaches. But, you should notethat more complex nesting can negatively affect the performance ofthe OLAP processor.
123Reusable Query Elements
Figure 4.13 Global Key Figure for Sales Variance in CO-PA
Figure 4.14 Query on the Web: Sales Growth Analysis
1
2
5
6
4
3
The SAP Business Explorer Query Designer124
4.2.5 Global Structures
Frequently used combinations of different data selections or formulas canbe created as a global structure. They have the same functionality, as dostructures that are defined only within a specific query.
All settings of the global structure are copied to all queries using thatstructure. In this context, it is significant that this applies to both data def-initions and display settings. Contrary to restricted and calculated key fig-ures, the display options in the query definition cannot be overridden.Hiding a structure element in one query, for example, will activate thisbehavior in all other queries using this global structure.
Remove areference
If a query has been using a global structure that should be valid onlylocally within that query, you can remove the reference to the globalstructure. During this procedure, a copy of the global structure is createdwithin the query definition.
Alternatively, a structure that exists only within one query can be madeavailable as a global structure of the InfoProvider, as is illustrated in thefollowing example.
Structuretemplate
You can also use global structures as templates for query definitions, pro-vided that the definition of the query structure deviates slightly from theglobal structure. For this purpose, the global structure is transfered intothe query via Drag&Drop, and the reference is then removed. All furtherchanges to the structure within the query will no longer be transferred tothe global structure.
The following applies to the validity area: Like restricted and calculatedkey figures, global structures are created per InfoCube. They can beused in all queries for that particular InfoCube. The technical name ofa global structure must be unique on the system.
You can use a maximum of two structures within one query. If onlyone structure is used in the query, you can activate the tabular displayas well. (see also Section 4.4.5.) When using two structures, you candefine single cells (see Section 4.3.4). Within a query, only one struc-ture can contain key figures of an InfoProvider.
125Reusable Query Elements
Create a Global Structure for Determining the Local Contribution Margin
The following example uses the full data range of CO-PA to create a con-tribution margin calculation. In our data model, this contribution margincalculation can be used for analyzing subsidiaries. It does not yet includeany consolidated sales or expenses where the intercompany sales havebeen eliminated:
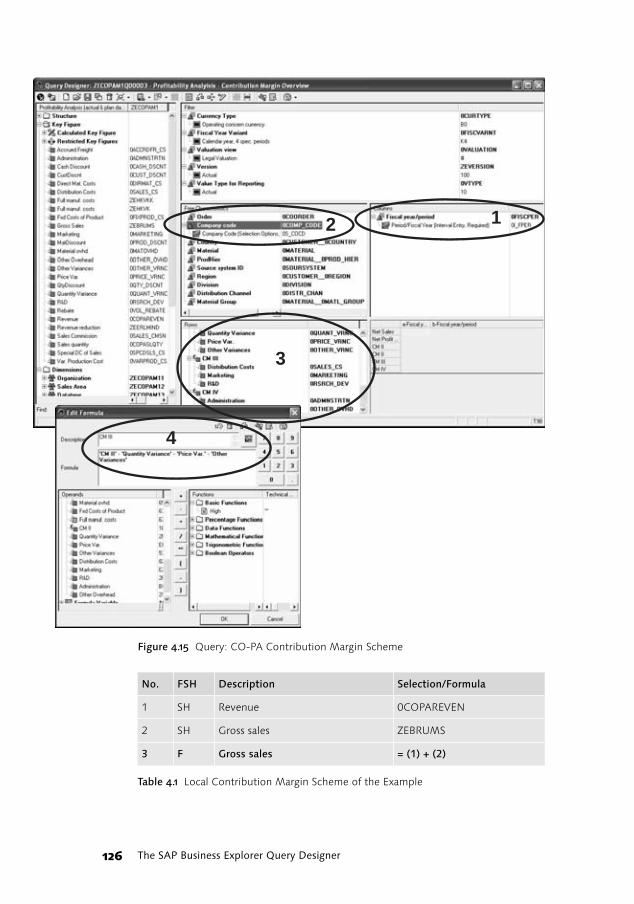
� Create a second copy of the query ZECOPAM1Q00001 as ProfitabilityAnalysis—Contribution Margin Overview with the technical nameZECOPAM1Q00003.
� Remove the key figure structure from the columns. Only the Fiscalyear/period characteristic should be included (see Figure 4.15, Step 1).
� Drag&Drop the Company code characteristic from the Rows field tothe Free Characteristics field (Step 2).
� In the Rows field, create a new structure to contain the contributionmargin scheme (Step 3).
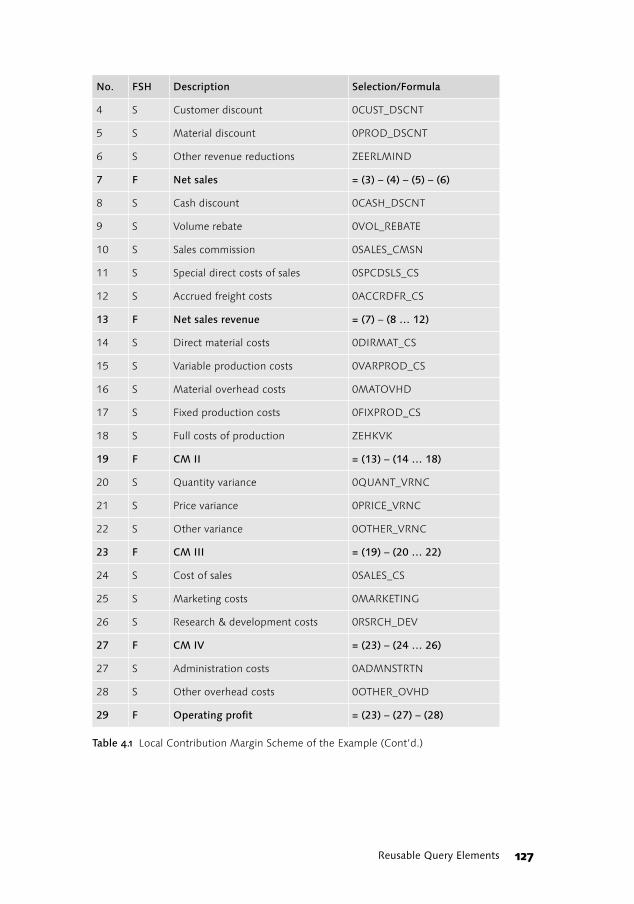
� Define the structure characteristics as shown in Table 4.1. Every row ofthis table contains a structure element and its definition.
� The first column describes the row number in the structure.
� Column 2 contains S for a selection and F for a formula. The rowshould be hidden if this column additionally contains the letter H(for Hide).
� Columns 3 and 4 contain the description and definition of the struc-ture element.
Figure 4.15, Step 4, contains the example formula for contributionmargin III (see table entry no. 23). For all other structure elements, youcan proceed as shown in this example.
� The structure can now be saved globally as ZECOPAM1S00001 Struc-ture Contribution Margin I-V (local) and then be used in other que-ries.
When working with locally stored Excel workbooks, however, youmust be careful when removing and creating global structure refer-ences. This process changes the (generated) technical name of thestructure. If a workbook previously existed with a local view of thisstructure, this view is lost and the new structure will be displayed.
The SAP Business Explorer Query Designer126
Figure 4.15 Query: CO-PA Contribution Margin Scheme
12
3
4
No. FSH Description Selection/Formula
1 SH Revenue 0COPAREVEN
2 SH Gross sales ZEBRUMS
3 F Gross sales = (1) + (2)
Table 4.1 Local Contribution Margin Scheme of the Example
127Reusable Query Elements
4 S Customer discount 0CUST_DSCNT
5 S Material discount 0PROD_DSCNT
6 S Other revenue reductions ZEERLMIND
7 F Net sales = (3) – (4) – (5) – (6)
8 S Cash discount 0CASH_DSCNT
9 S Volume rebate 0VOL_REBATE
10 S Sales commission 0SALES_CMSN
11 S Special direct costs of sales 0SPCDSLS_CS
12 S Accrued freight costs 0ACCRDFR_CS
13 F Net sales revenue = (7) – (8 … 12)
14 S Direct material costs 0DIRMAT_CS
15 S Variable production costs 0VARPROD_CS
16 S Material overhead costs 0MATOVHD
17 S Fixed production costs 0FIXPROD_CS
18 S Full costs of production ZEHKVK
19 F CM II = (13) – (14 … 18)
20 S Quantity variance 0QUANT_VRNC
21 S Price variance 0PRICE_VRNC
22 S Other variance 0OTHER_VRNC
23 F CM III = (19) – (20 … 22)
24 S Cost of sales 0SALES_CS
25 S Marketing costs 0MARKETING
26 S Research & development costs 0RSRCH_DEV
27 F CM IV = (23) – (24 … 26)
27 S Administration costs 0ADMNSTRTN
28 S Other overhead costs 0OTHER_OVHD
29 F Operating profit = (23) – (27) – (28)
No. FSH Description Selection/Formula
Table 4.1 Local Contribution Margin Scheme of the Example (Cont’d.)
567Index
Index
AABAP 187, 216, 246
class 276program 243programming 187
ABAP/4 coding 44, 45, 72ABC analysis 260ABC classes 81ABC classification 66, 83, 262ABC/XYZ analysis 58Account group 142ActiveX control 242Actual & plan data 100Actual cube 115Addition 44Ad-hoc analysis 37, 61, 78, 233, 391Ad-hoc Query Designer 76, 260, 262,
309Ad-hoc reporting 233Ad-hoc reports 73Administrative functions 26Administrative metadata 32Administrator Workbench 39, 41, 46,
116, 141, 243, 391Advanced analytics 54, 63
tools 54Advanced search function 414Aggregate 33Aggregated key figures 92Aggregation 37, 115
behavior 115hierarchies 35layer 35tables 33types 168
Alert Monitor 73, 75, 84, 260, 262, 289Analyses and reports 39Analysis 123
functions 104, 190methods 57Process Designer 80, 81scenarios 152tools 51, 59types 191
Analyze 53
Analyzer 51APD 81Application landscape 425Architecture of SAP BW 38Assess and deploy 66Assessment and deployment 64Assignment of a constant 45Assignment of a constant value 44Association analysis 65, 82Associations 59Attribute name 288Attributes 171, 319, 427Authorization 111, 178Auxiliary cells 152Axis labels 281
BBackup 32BarChart 435Basic InfoCube 49BasisCube 144Best-practice OLAP 66BEx 68, 77, 238BEx (Analyzer) Workbook 406, 409BEx Analyzer 78, 227, 391BEx Broadcaster 77, 78, 367, 373, 392,
402, 406, 409settings 377wizard 368
BEx Download Scheduler 200BEx History 238BEx Information Broadcasting 77BEx Mobile Intelligence 200BEx Portfolio 78, 392, 394, 399, 409,
410BEx query 403BEx Query Designer 78, 99, 200, 216,
391BEx Web 199BEx Web Analyzer 199, 206, 227, 233,
372, 391, 392BEx web application 78, 391BEx Web Application Designer 78,
199, 216, 227, 231, 391BEx web template 403
Index568
BEx workbook 429BI application 391Bitmap index 35Bookmark 227Boolean comparison 35Boolean operators 35Border type 266Break-even analysis 58Broadcast settings 373, 380Broadcasters 260, 262Broadcasting 233Browser plug-in 301Browser window 302, 391BSP application 256Business Add-In 344Business budgeting 37, 61Business Content 139, 149, 187
InfoCube 425object 233roles 425web templates 430
Business Explorer 77, 392Analyzer 67, 73, 76, 93Information Broadcasting 77queries 76query 367Query Designer 367web applications 93workbooks 76
Business intelligence applications 87Business Intelligence cockpit 207, 244Business intelligence content 390, 412,
413Business intelligence solutions 90Business intelligence tools 54, 99Business metadata 32Business planning 37, 61Business planning and budgeting 37,
61Business Server Pages 216Business unit analyst 425BW architecture 41BW document 391BW query 99, 136, 391BW reporting functions 79BW workbook 391BW-BPS 391
CCalculated key figure 113, 116, 122, 424Calculation behavior 191Calculation in formulas 134Calculation in the display 149Calculation time 114Calling the online link 388Calling the online report 401Caption 290Cascading Style Sheets 211Case study 87Cell definition 152Cell reference 152Centralized control 110CFO 378, 392Channels 62Characteristic/structure 288Characteristics 47, 76, 102, 108, 128,
149, 171, 179, 192, 243, 301definition 116hierarchies 47, 90master data 47texts 47time-dependent texts 47value variables 181values 102, 152, 179
Chart 74, 201, 207, 262, 276, 435Chart Designer 277Checkboxes 262Class name 264Classical master data hierarchy 165Cleanliness of the data 45Closed-loop business analytics process
53Closed-loop process 55Cluster model 82Clustering 59, 65, 82Cockpit 432Collaboration Room 410Collaborative BI 392Column 275, 290
definition 115headers 274selection 72
Combined filter values 129Command URLs 205, 211, 223, 263, 350Communication structure 44Company code 89, 133, 148, 174, 207
569Index
Company fixed costs 91Conditions 109, 190, 191, 192, 262Configuring offline reporting 378Consolidated contribution margin
139, 146Consolidated key figures 148Consolidation 90
currency 160hierarchy 160paths 37
Constant selection 162Context menu 288, 419Contribution margin 95, 125, 131, 147,
194element 154levels 153overview 133scheme 125, 153, 170structure 95
Controlling 92Controlling–Profitability Analysis 92,
93Cookie 256CO-PA 104, 114, 117, 122, 153
contribution margin scheme 125, 153
data 104, 162data model 115, 139, 141extension 142reporting 104
Cost center reporting 365Cross tables 58CSS 201, 212CSS formats 212, 214CSV 229Cube 36Cumulation 149Cumulative values 117Currency scenarios 128, 157Currency simulations 162Currency translation 156, 160
methods 157types 156, 424, 441
Customer data 106Customer exit 72, 178, 187
variables 187Customizing 231
DData acquisition 28
components 18layer 26
Data auditing tools 30Data capture 61Data cells 275Data cleansing 27, 30
tools 30Data cube 36Data definition 109, 152Data distribution 61Data exploration 63, 64Data mart systems 31Data marts 37, 38, 59Data migration tools 30Data mining 37, 61, 63
functions 82Integration 82models 63, 82process 63solutions 63, 82tools 59, 63Workbench 80, 82
Data model 106, 115, 139, 141, 149enhancements 94
Data modeling 148, 424Data presentation 40
layer 26, 37Data provider 74, 204, 205, 224, 254,
257, 268, 284, 291, 298, 312information 262, 299initialization 305
Data retrieval 53, 58, 60, 66, 565components 53
Data scrubbing tools 30Data sources
database systems 41non-SAP systems 41SAP systems 41structured interface files 41XML data 41
Data storage 39, 40layer 26, 33
Data transfer 27, 30, 45Data warehouse 23, 26, 33, 365
architecture 26, 39components 23
Index570
concept 23, 24environment 26systems 23, 34
Data warehousing process 53Data warehousing product 423Database operations 29Database systems 41DataSource 41, 43
business content 43Datastage 41Data-warehouse solution 66Date of translation 157DB Connect 41Decentralized control 110Decimal places 169Decision modeling 54Decision tree 65, 82Deductive analyses 57Default 303
values 178, 179Deliveries 91Delivery status analysis 95, 185, 192Delta load 28Delta upload 45Design tools 99Detail data layer 34Deviation analysis 58Differential snapshot algorithm 29Dimension 37, 553
hierarchy 37tables 553
Direct configuration 374Direct delivery of offline reports 367Direct transfer 44, 45Displaying offline reports 382Distribution by e-mail 369, 416Distribution via Enterprise Portal 416Document browser 228, 234Document class 300Document display 302Document type 300Drag&Drop 81, 110, 115, 122, 222Drag&Relate 178Drilldown 99, 122, 152, 162
functionality 179state 385
Dropdown box 75, 207, 226, 281, 306DWH 23, 30
Dynamic currency translation 160Dynamic master data hierarchies 165
EEIS 59EIS tools 59E-mail attachment 418E-mail dispatch 406Empirical curves 57Enterprise Portal 78Error message 136Error suppression 136ETL 424
process 32, 38, 42requirements 94
Excel 76, 109, 125, 174, 177workbook 76, 110, 125, 166, 407, 409
Exception 52, 69, 84, 95, 104, 109, 190, 193, 262aggregation 115reporting 84
Exchange infrastructure 41Exchange rate type 157Existence check 185Exit variables 440Expert mode 218Export 229Export into the Enterprise Portal 394Extended sales analysis 151External systems 93External tools 168Extraction 28, 29, 38Extraction methods 93
FFact table 36, 553Favorites 100, 105, 403, 407Filter 27, 230, 262, 293
fixed 103functionality 179navigation 378, 380, 385selection 128, 327settings 149values 108, 128, 129, 308
Financial Accounting–General Ledger Accounting 93
Financial reporting 90, 91, 365, 409Financial statement analysis 58
571Index
Finding content 412Fiscal year variant 89, 427Flat file 41Flexible drilldown 152Flexible queries 104Flexible query control 112Flexible time series 131Flow control 138Flow logic 72Folder structure 100, 401Forecasting 55, 61Form 296Formatting 165Formatting options 165Formula 44, 108, 126, 134, 149
collision 134definition 154editor 115, 134, 138variable 71, 114, 184, 185
Frame 301Frame Name 286Frameset 223, 333Free characteristics 103Frontend tool 69Frozen history 102Full costs of production 91Full manufacturing costs 144, 146Full upload 45Fuzzy logic 59
GGap analysis 57General Ledger Accounting 90, 93, 95Generic Attributes 263Generic navigation block 262, 284Geographical reporting 321Global filter 179Global folder structure 100Global query definition 109, 149, 174Global query elements 103Global query properties 136Global restricted key figure 179Global structure 124, 125Granularity 37, 92Gross revenue 104
HHead of controlling 392, 395, 403, 415Head of controlling department 367,
385Hidden Form 296Hierarchical filter selection 262, 327Hierarchy 71, 90, 109, 165, 166, 182
attribute 185filter 129level 172navigation 272node 182, 278node variables 71, 129, 182properties 174time 182variables 71, 182variant 182
Historical data 395History 403, 407HR analyses 365HTML 80, 200, 202, 215, 218, 223, 378,
382, 383browser 67code 206, 219editor 216, 222elements 212frame 301mode 223, 240standard functionality 73technology 73with separate MIME files 378, 382,
383Hypercube 36
IIFrame 294If-then query 139Inbox 370, 382, 418Incremental load 28Independent HTML File 396Index.htm 382Indexing schemes 35Individual document 262, 300Individual folder structure 100Inductive analyses 57InfoArea 48, 49, 100InfoCube 49, 144, 425, 551
aggregate 51star schema 49
Index572
InfoObject 44, 46, 169, 248InfoObjectCatalogs 48, 49InfoPackage 45InfoProvider 44, 48, 70, 99, 100, 106,
115, 128, 425InfoSet 50master-data-bearing characteristics
49RemoteCube 49SAP RemoteCube 49Virtual InfoCube 49
Informatica 41Information Broadcasting 51, 62, 77,
94, 97, 365, 372, 375, 386, 390, 392, 415
Information consumer 62Information distribution 61Information producer 62InfoSet 49, 551InfoSource 43Initial load 28Input help 180, 286Input validation 180Input variables 177Integrated architecture 67Integration 24, 42Integrity constraints 31Intercompany sales 140Interval variables 71Intervals 128, 183Invoices 91ITS 75iView 80, 216, 227, 391, 402, 430
JJavaScript 73, 200, 214, 216, 252, 296
calendar 215function 296
Join index 35Jump target 257
KKey 230, 264
account 165date 177figure 116, 118
Key figures 47, 76, 92, 103, 113, 243, 553definition 116
hierarchies 90non-cumulative 47overview 260, 262structures 76to be planned 92
KM folder 391KM iView 402, 404, 409KM navigation iView 391Knowledge management 391, 402, 412
components 392functions 412search function 413
LLabel 262, 282, 287Language dependency 168Language-dependent texts 279Layout 202, 223, 224, 427Library 222, 226, 260, 316, 345Lifecycle 58LineChart 435Link generation 387List comparison 191List of conditions 262List of documents 262List of exceptions 262Load 27Loading 30Local contribution margin 125, 146Local key figures 148Local query definition 109Log files 29Logical nesting 138Logical relational operators 139Logistics analyses 365Logo 235, 236, 295, 303, 331Logo icon 295Logs 29Lower-level nodes 172
MMachine learning 59Maintenance requirements 429Management cockpits 73Management function 154Management information systems 59Management reporting 90, 91Management reporting views 106
573Index
Manipulation 65Manual feedback 57Map 75, 262Mapping 144Master data 171, 269
attribute 102hierarchies 165, 171, 192maintenance 300read mode 269reporting 95, 104tables 106
Master web item 222, 260Materialized views 33Mathematical operations 135Measures 36Message text 380Metadata 32, 391, 423
management 27, 31repository 26, 40
Microsoft Excel 67, 76, 86, 391, 407, 409
Microsoft Excel 2000 229Microsoft FrontPage 241Microsoft Outlook 370, 382, 408, 418MIME files 378, 382, 383MIME Repository 213, 217, 220MIS 59MIS tools 59Mobile Intelligence 362Model 53Modeling 65Modification of the operational appli-
cation systems 29Modification table 29Modifications 29Modularization 111Monitor 45Monitor programs 29Monitoring 32, 39, 45Month-end closing 367Monthly analysis 95Multidimensional analysis tools 59Multidimensional data sources 41Multidimensional detail data layer 35MultiProvider 49, 50, 93, 144, 551Multivariant statistics 58My Portfolio 392, 405
NNaming conventions 111, 112Navigation 170, 252
attributes 102block 286components 73options 175status 385, 398
Navigational state 166Nesting depth 302Net revenue 91Net sales 114, 115NetWeaver 38, 41Neural networks 65Node 166, 172Non-volatility 26Notes 228
OObject catalog 260Object catalog of the web application
262, 297Object tag attributes 259Object Tags 202, 206, 239ODS 31
layer 93objects 44, 49tables 31
Offline report 97, 367, 370, 372, 377, 378, 382, 383, 395, 418
Offsets 183OLAP 23, 31, 32, 36, 55, 59, 175, 201
analysis 55data model 36functionality 49, 77presentation 175processor 122reporting 66, 73
OLE DB for OLAP interface 69Online Analytical Processing 23, 36, 59Online execution 395Online link 97, 385, 387, 391, 392, 399,
403Online report 392Open hub 39Operands 115, 134Operating profit 91Operational application system 29Operational data store 31
Index574
Operational metadata 32Optimization 33, 55Optimization potential 108Optional default values 72Organizational structure 172Output optimization 256
PP+L 165P+L Performance Analysis 162Parameter tags 240Parameter variables 71Part segment analysis 129Partial sections 183PDA 362Performance 114, 122, 431
aspects 128improvement 178overview 154
Periodic delivery 372Periodic delivery of offline reports 372Personalization 233, 238Personalization options 239Personnel administration 335Plan cost rates 92Plan cube 115Plan data 92Plan prices 92Planning functions 92Planning horizon 92Planning interface 94Plus/minus sign presentation 177Plus/minus sign reversal 169Popup 112, 179Portal configuration 413Portal frame 405Portal Integration 390Portal integration 94Portal role 392Portals 61Portfolio analysis 58Posted nodes 172Posting period 385PowerCenter 41Pre-aggregation 33, 128Precalculated value set 129, 178Prefix 303Preparation 58
Presentation 60objects 73options 165tools 38
Previous year, comparison 117Print layout 212Print stylesheet 212, 213, 219Proactive information distribution 62Process chains 45Process steps 58Processing types 178, 181, 182, 183, 184Profit and loss statement 203, 244Profit center 423
accounting 425group 427hierarchy 427reporting 365, 423
Profit margin 91Profitability 153
analysis 90, 92, 93, 95, 100monitor 153
Prototype 435Publish and subscribe 62Publish and subscribe process 61Publishing offline reports 395Publishing online reports 392, 399Publishing reports 390, 402, 415Publishing web templates 406
QQualitative data 36Quality assurance 61Quantitative data 36Queries 74, 76, 77, 78, 93, 94, 200, 424Queries in workbooks 76Query 59, 99, 104, 120, 146, 148, 160,
177, 206, 207, 224, 382, 386, 392, 399, 425, 437call 237components 94, 430concept 99definition 100, 108, 109, 124, 149, 167design 148Designer 51, 73, 99, 104, 109, 139,
156, 367elements 71, 103, 108, 111, 243, 248,
424, 439execution 135, 168
575Index
optimization 33precalculation 234properties 112result 133, 149, 152runtime 104, 108structure 122tools 59view 74, 196, 206, 207, 224, 254, 306,
424, 438view selection 262, 305, 315
RR/3 upstream systems 92Ranked List 150Ranked List (Olympic) 150Ranking 149, 151Read mode 254Read permission 412Readability 431Ready for input status 179Real-time data 33Receive and Display 371Recovery 29Reference, remove 124Regressions 59Relational data sources 41Relational detail data layer 34Relational operators 139Released characteristics 104Reloading 28Remote access 51RemoteCube 49, 551Repeated texts 273Report tools 59Reporting 37, 50, 61, 79, 423, 437Reporting agent 51, 73, 83Reporting and analysis 18Reporting and analysis tools 51Reporting functions 79Reporting layer 149Reporting objects 79Reporting requirements 94Reporting solutions 111Reporting tools 93Reports 40, 423, 425Repository 26, 40, 213, 220Restricted key figures 117, 118, 122, 424Restrictions 437
Result position 177Result suppression 171Results column 148Retraction 57Revenue reductions 91, 92Revenue reporting 105, 106Risk analysis 55, 58Role 100, 105, 292, 403, 407, 424, 425Role menu 75, 76, 206, 260, 262, 292,
332, 428Rollup 35Routines 44, 45, 144Row headers 274Rows 103
SSales & Distribution 90, 93, 95Sales analysis 95, 114, 117, 136, 151, 166,
167, 175, 207, 365, 432Sales growth 122Sales order stock 372, 399Sales revenue 315Sales variance 122Sampling 64SAP APO 41SAP Business Content 40, 93, 423
objects 437query 437web item 435web item library 435web template 435workbooks 429
SAP Business Explorer 68ad-hoc queries 76Analyzer 66, 68, 76bookmarks 84calculated key figures 70conditions 73Exception 73Execution of queries 73formulas 70Information Broadcasting 68, 77iView 80master data reporting 70mobile reporting 68, 79personalization 68, 79query 69Query Designer 68, 69, 70, 99, 227
Index576
Reporting Agent 83restricted key figures 70structures 70tabular reporting 70URLs specific to SAP BW 75variables 71web Application Designer 73web application designer 68web Applications 75web applications 68, 75web Templates 430web templates 73workbooks 428
SAP Business Information Warehouse 39
SAP BW 18, 19, 40, 41, 45, 53, 87, 93, 99, 156, 227, 232, 391, 423, 428
SAP BW 2.0 66SAP BW 3.0 66SAP BW background job 376SAP BW Business Explorer Web
Reporting 402SAP BW components 40, 390SAP BW data targets 93SAP BW object 242SAP BW query 99SAP BW release 425SAP BW Release 3.5 39SAP BW reporting functions 79SAP BW role 78SAP BW server 178SAP BW standard functionality 80SAP BW web template 212SAP components 87SAP CRM 41SAP Enterprise Portal 77, 78, 80, 89,
97, 216, 227, 365, 390, 394, 402, 406, 409, 419
SAP exit 72, 178, 187SAP exit variables 187SAP G/L accounting 160SAP Internet Transaction Server 75SAP ITS 75SAP NetWeaver 41, 89, 232, 365SAP R/3 29, 41, 49, 92, 423
core functions 40SAP R/3 Basis technology 40SAP R/3 upstream systems 92
SAP Reference IMG 232SAP RemoteCubes 49, 551SAP Reporting Agent 69SAP SEM 41SAP standard version 138SAP systems 41, 42SAP Web Application Server 75, 256
technology 75SAP Web reporting 75SAP XI 41Scaling 169Scaling factors 177, 192Scheduling 27, 39, 45, 374, 376Scoring 66, 82Scoring information 81Scroll area 274Search function 392Segment analysis 95, 129Select option variables 71Selection 108, 126, 128Selection objects 73Sending reports 367Sensitivity analysis 58Session cookies 257Session encoding 256, 257Session management 253Setting the start date 374Simple query 105, 106Simple search function 413Simulation 55, 61Simulation prediction 260, 262Single cell definition 153Single point of truth concept 99Single Sign-on 80Single values 128Source currency 157Source system 28, 41, 42Source system types 41Specific navigation status 386, 388,
398SQL 29SQL triggers 29Staging BAPIs 41Standard deviation 150Standard iView 402Standard reporting 37, 61Standard SAP Business Content web
template 430
577Index
Standard SAP web template 372Standard SOAP protocol 41Standard template 233Standard web template 73, 233, 391,
429, 430Standardization 149Star index 36Start drilldown 437Start views 79Starting the offline report 370, 377,
382, 420Stateful mode 253Stateless mode 253Stateless navigation 252Static filter 230Structural component 288Structure element 148, 149, 168, 179,
192, 193Structure hierarchy 166, 169Structure presentation 168Structure selections 129Structure template 124Structures 108, 424Style sheet 73, 212, 213, 217, 219, 237,
252class 214, 295files 212
Subject-orientation 24Substitution path 178, 180, 184Suffix 213Summation 150Sums 277Syntax 240, 265Syntax elements 223System messages 254
TTable 74, 201, 260, 271, 286, 435Table interface class 286, 361Tabular presentation 175Tabular report 70Target currency 157Target elements 103Target frame 294Technical metadata 32Template 206, 222, 290, 310Template properties 206Text elements 75, 247, 262
Text variables 71, 121, 183Textmodus 223Third-party frontend tools 67Third-party reporting tools 52, 69Third-party systems 41Third-party tool 41, 45, 67, 69, 86Threshold 191Ticker 262, 296Ticker text 297Tile view 401Time selection 121, 153Time series analysis 58Time variance 25Toolbar 100, 104Trace 53Transaction data 102Transactional InfoCubes 93Transfer rules 44Transfer structure 43Transform 27Transformation 27Transport 111
UUnion operation 50Unit precision 136Unit suppression 138Unitless calculation 136Universal Data Connect 41Update rule 44, 45, 144Upflow 35Upstream systems 92
VValidity 192
area 113, 124period 25
Value row 275Value set 178Variables 108, 112, 129, 158, 178, 191,
238, 254, 424, 439assignment 385editor 180offsets 129popup 112screen 428screen display 253, 431type 178, 179, 180
Index578
values 187, 230wizard 179
Variance 150VBScript 216Views 33Virtual InfoCubes 49, 551
WWAD 216Web API 355Web application 75, 77, 78, 79, 205,
215, 222, 227, 238, 303, 415, 416, 418, 428, 430
Web application design 200Web Application Designer 51, 74, 203,
205, 215, 257, 293Web browser 73, 208, 221, 296Web Cockpit 216, 253, 335, 433Web crawler 412Web design API 75Web design API for tables 200, 354Web elements 248Web framework 200Web interface 94, 391Web item 74, 96, 200, 201, 221, 226,
260, 303, 402, 424, 435class 264initialization 305library 345
Web Report 206
Web reporting 75, 202, 231Web server 61Web standard technologies 199Web template 73, 74, 78, 93, 96, 201,
202, 205, 223, 237, 249, 262, 298, 303, 338, 402, 424, 425, 432properties 298selection 403wizard 216
Weighted score tables 82Wizard 368, 372WML 80Workbench function 81Workbook 76, 402, 406, 424, 426Workbook selection 407Workflow management 61Writing and publishing an e-mail 369WYSIWYG 216
XXML 201, 218, 297XML data 41XMLA interface 69
ZZero column suppression 168Zero presentation 177Zero row suppression 168Zero suppression 177


![Sappress Financial Reporting[1]](https://img.dokumen.tips/doc/110x75/54122c617bef0ab9058b462a/sappress-financial-reporting1.jpg)