Embed Size (px)
Citation preview

8/16/2019 Santander Pulp
http://slidepdf.com/reader/full/santander-pulp 1/78
Santander Pulp & Paper DayMay 25th, 2016
8/16/2019 Santander Pulp
http://slidepdf.com/reader/full/santander-pulp 2/78
2
The information contained in this presentation may include statements whichconstitute forward-looking statements, within the meaning of Section 27A of the U.S.
Securities Act of 1933, as amended, and Section 21E of the U.S. Securities Exchange
Act of 1934, as amended. Such forward-looking statements involve a certain degree of
risk and uncertainty with respect to business, financial, trend, strategy and other
forecasts, and are based on assumptions, data or methods that, although considered
reasonable by the company at the time, may turn out to be incorrect or imprecise, or
may not be possible to realize. The company gives no assurance that expectations
disclosed in this presentation will be confirmed. Prospective investors are cautioned
that any such forward-looking statements are not guarantees of future performance
and involve risks and uncertainties, and that actual results may differ materially from
those in the forward-looking statements, due to a variety of factors, including, but not
limited to, the risks of international business and other risks referred to in the
company’s filings with the CVM and SEC. The company does not undertake, and
specifically disclaims any obligation to update any forward-looking statements, which
speak only for the date on which they are made.
Disclaimer
8/16/2019 Santander Pulp
http://slidepdf.com/reader/full/santander-pulp 3/78
3
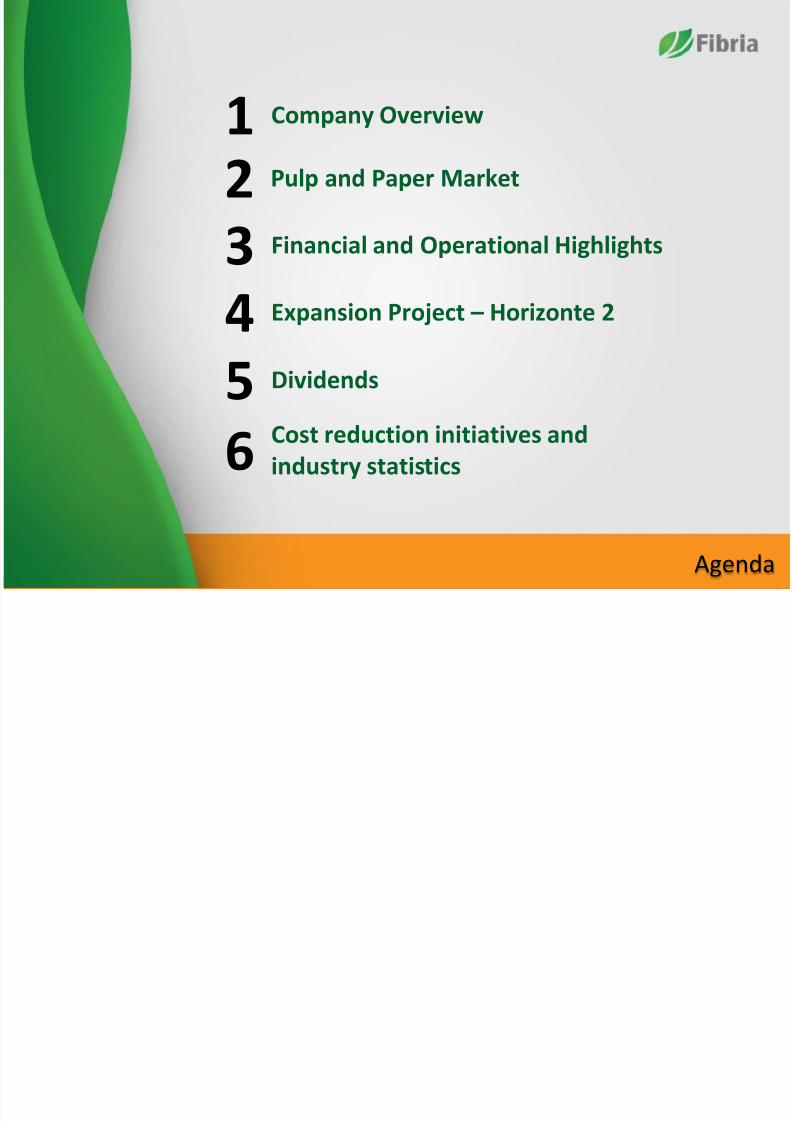
Pulp and Paper Market2Financial and Operational Highlights3
Agenda
Company Overview
1
Expansion Project – Horizonte 24Dividends5Cost reduction initiatives andindustry statistics6

8/16/2019 Santander Pulp
http://slidepdf.com/reader/full/santander-pulp 4/78
4
Company Overview
8/16/2019 Santander Pulp
http://slidepdf.com/reader/full/santander-pulp 5/78
5
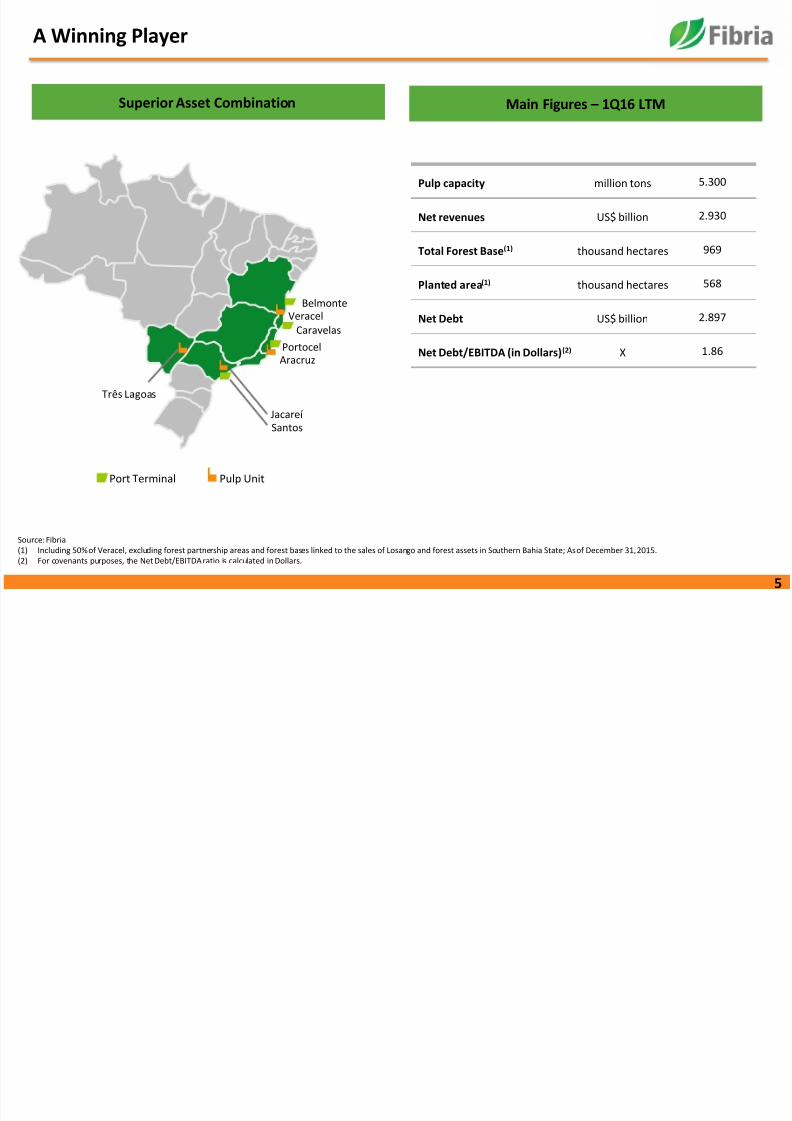
A Winning Player
Port Terminal Pulp Unit
Três Lagoas
Santos
AracruzPortocel
Caravelas
BelmonteVeracel
Jacareí
Superior Asset Combination Main Figures – 1Q16 LTM
Pulp capacity million tons 5.300
Net revenues US$ billion 2.930
Total Forest Base(1) thousand hectares 969
Planted area(1) thousand hectares 568
Net Debt US$ billion 2.897
Net Debt/EBITDA (in Dollars)(2) X 1.86
Source: Fibria
(1) Including 50% of Veracel, excluding forest partnership areas and forest bases linked to the sales of Losango and forest assets in Southern Bahia State; As of December 31, 2015.(2) For covenants purposes, the Net Debt/EBITDA ratio is calculated in Dollars.
8/16/2019 Santander Pulp
http://slidepdf.com/reader/full/santander-pulp 6/78
6
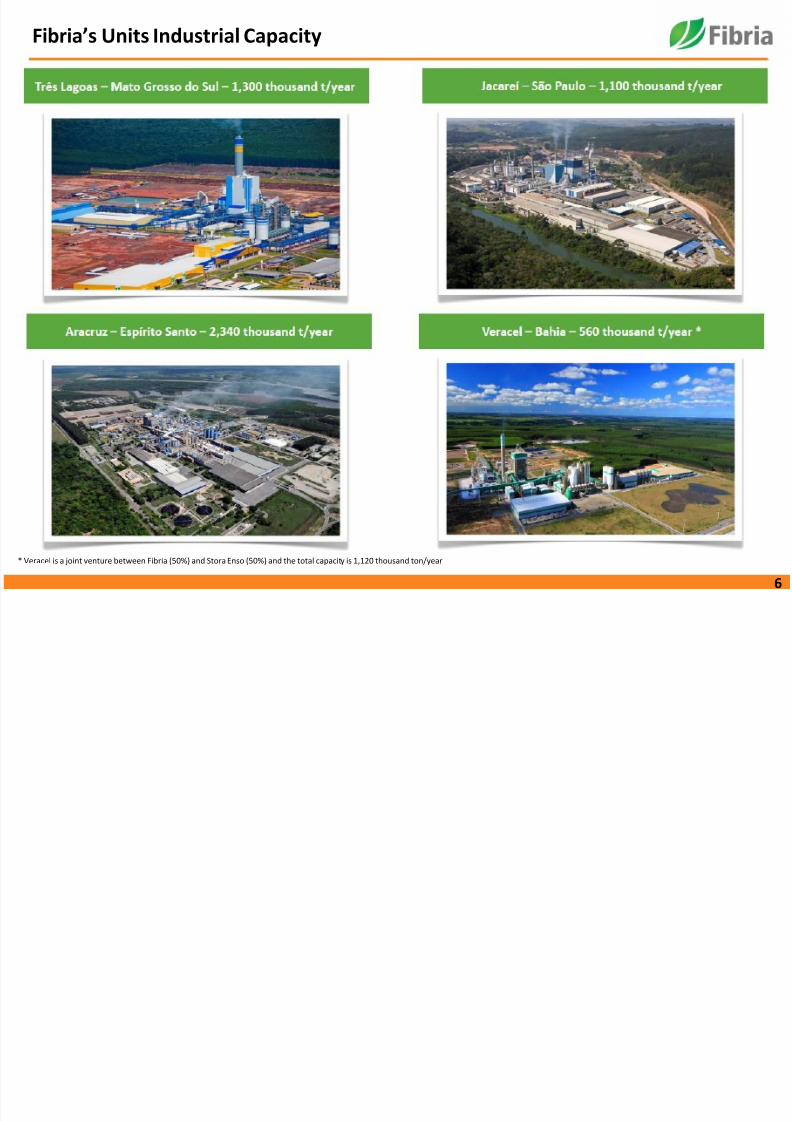
Fibria’s Units Industrial Capacity
* Veracel is a joint venture between Fibria (50%) and Stora Enso (50%) and the total capacity is 1,120 thousand ton/year
8/16/2019 Santander Pulp
http://slidepdf.com/reader/full/santander-pulp 7/78
7
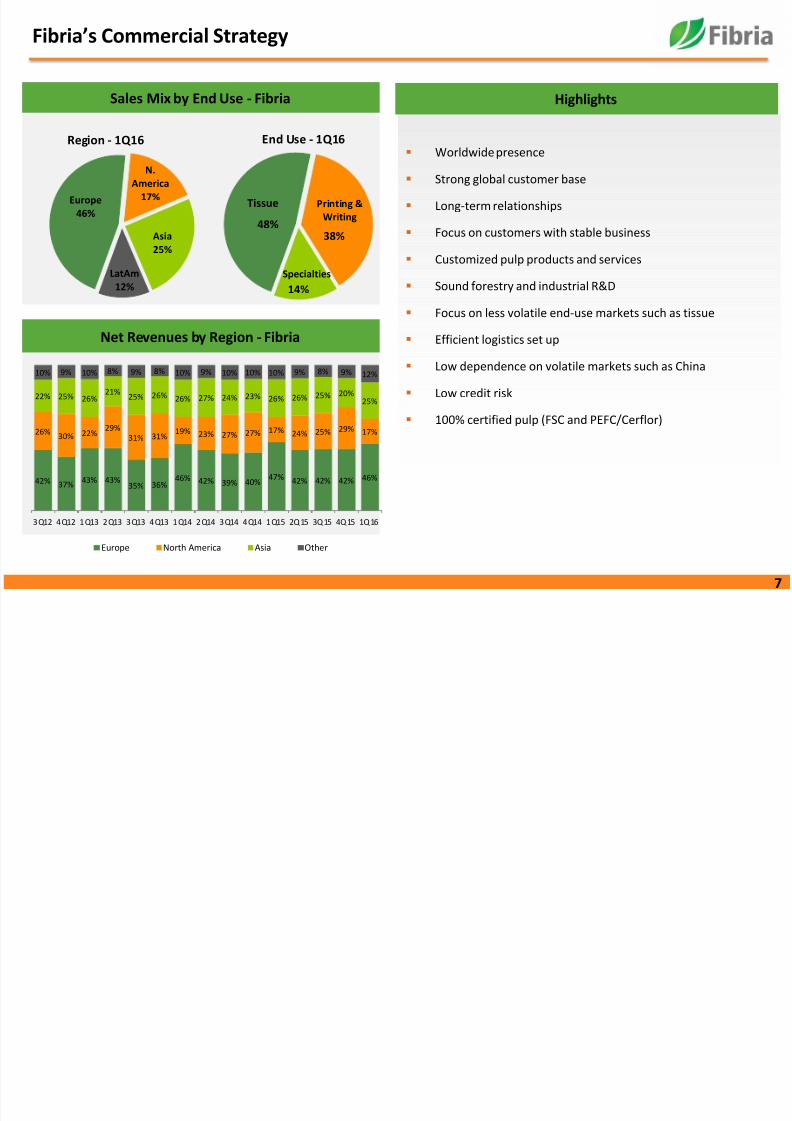
Worldwide presence
Strong global customer base
Long-term relationships
Focus on customers with stable business
Customized pulp products and services
Sound forestry and industrial R&D
Focus on less volatile end-use markets such as tissue
Efficient logistics set up
Low dependence on volatile markets such as China
Low credit risk
100% certified pulp (FSC and PEFC/Cerflor)
Sales Mix by End Use - Fibria Highlights
Fibria’s Commercial Strategy
Net Revenues by Region - Fibria
Region - 1Q16 End Use - 1Q16
42% 37%43% 43%
35% 36%46% 42% 39% 40%
47% 42% 42% 42% 46%
26%30% 22%
29%31% 31%
19% 23% 27% 27% 17% 24% 25% 29% 17%
22% 25% 26%21%
25% 26% 26% 27% 24% 23% 26% 26% 25% 20%25%
10% 9% 10% 8% 9% 8% 10% 9% 10% 10% 10% 9% 8% 9% 12%
3Q12 4Q12 1Q13 2Q13 3Q13 4Q13 1Q14 2Q14 3Q14 4Q14 1Q15 2Q15 3Q15 4Q15 1Q16
Europe North America Asia Other
48%38%
14%
Printing &Writing
Specialties
TissueEurope46%
N.America
17%
Asia25%
LatAm12%

8/16/2019 Santander Pulp
http://slidepdf.com/reader/full/santander-pulp 8/78
8
Pulp Supply Agreement: Puma Project
► Pulp volumes:► Minimum of 900 kt of hardwood for the first 4 years
► 75% of 900 kt for the fifth year (phase out 1)
► 50% of 900 kt for the sixth year (phase out 2)
► Selling price based on the average net price charged byFibria at the Port of Paranaguá (FOB Paranaguá)
► Sales destination: Globally, except for South America
► Operational startup: Mar/2016
► Agreement benefits:
Puma Project
Mutual value creation, with better servicing for both Companies customer’s base
Logistics and commercial
structure synergies;
Ensure sales volumes;
Ensure pulp market access with
Klabin brand.
Logistics and commercial
optimization and synergies;
Support customers’ growth and
enhance customers’ needs;
Potential development of new customers.
8/16/2019 Santander Pulp
http://slidepdf.com/reader/full/santander-pulp 9/78
9Pulp and Paper Market
8/16/2019 Santander Pulp
http://slidepdf.com/reader/full/santander-pulp 10/7810
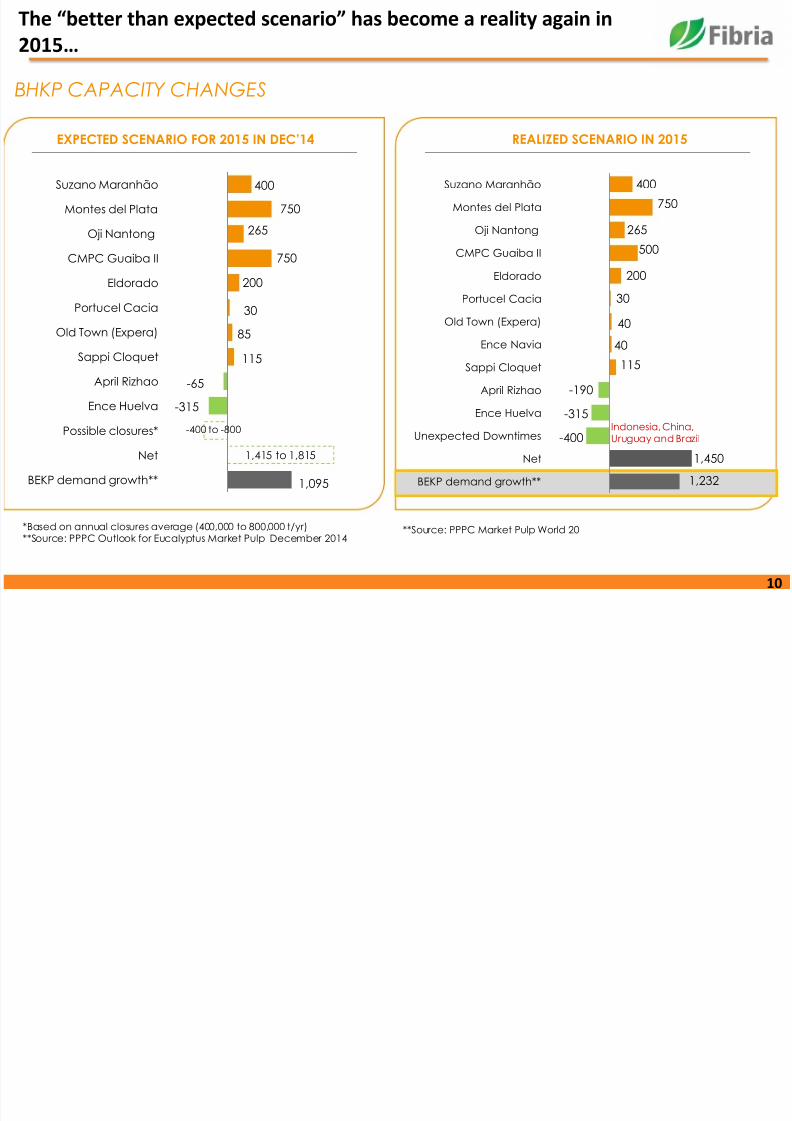
The “better than expected scenario” has become a reality again in
2015…
BHKP CAPACITY CHANGES
EXPECTED SCENARIO FOR 2015 IN DEC’14 REALIZED SCENARIO IN 2015
1,095
-315
-65
115
85
30
200
750
265
750
400
BEKP demand growth**
Net
Possible closures*
Ence Huelva
April Rizhao
Sappi Cloquet
Old Town (Expera)
Portucel Cacia
Eldorado
CMPC Guaiba II
Oji Nantong
Montes del Plata
Suzano Maranhão
-400 to -800
1,415 to 1,815
*Based on annual closures average (400,000 to 800,000 t/yr)**Source: PPPC Outlook for Eucalyptus Market Pulp December 2014
1,232
1,450
-400
-315
-190
115
40
40
30
200
500
265
750
400
BEKP demand growth**
Net
Unexpected Downtimes
Ence Huelva
April Rizhao
Sappi Cloquet
Ence Navia
Old Town (Expera)
Portucel Cacia
Eldorado
CMPC Guaiba II
Oji Nantong
Montes del Plata
Suzano Maranhão
Indonesia, China,Uruguay and Brazil
**Source: PPPC Market Pulp World 20
8/16/2019 Santander Pulp
http://slidepdf.com/reader/full/santander-pulp 11/7811
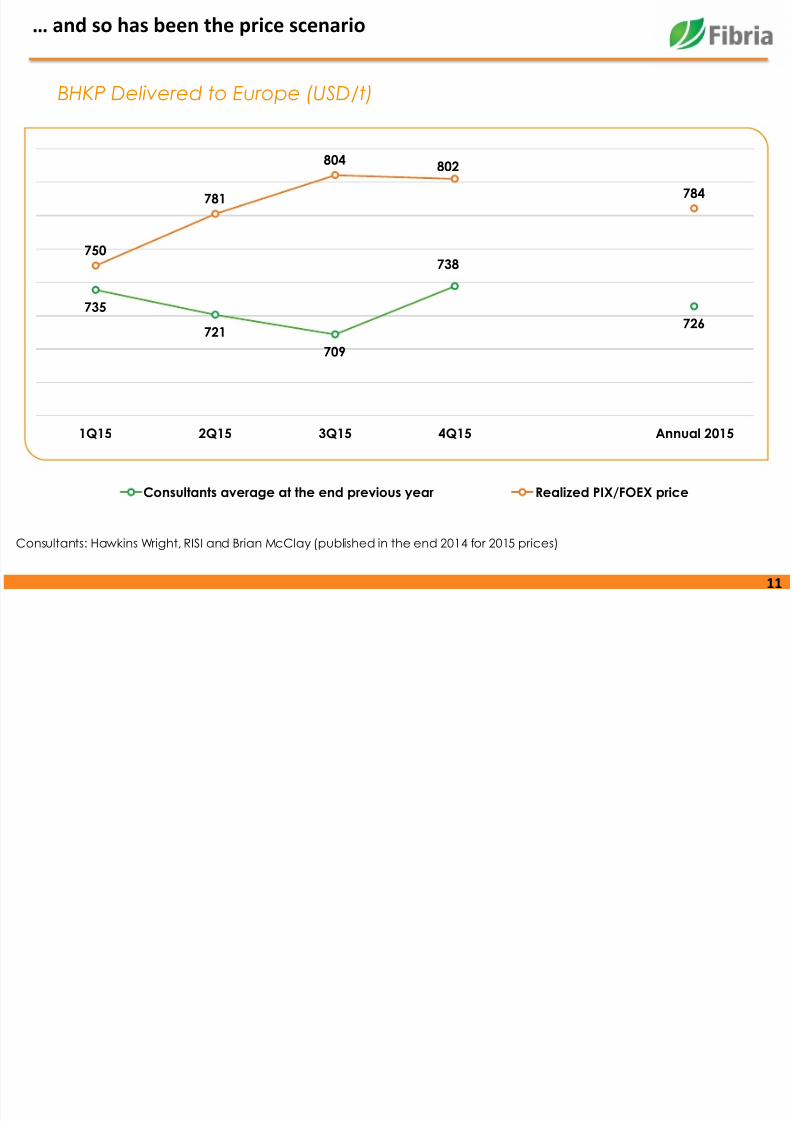
… and so has been the price scenario
BHKP Delivered to Europe (USD/t)
735
721
709
738
726
750
781
804 802
784
1Q15 2Q15 3Q15 4Q15 Annual 2015
Consultants average at the end previous year Realized PIX/FOEX price
Consultants: Hawkins Wright, RISI and Brian McClay (published in the end 2014 for 2015 prices)
8/16/2019 Santander Pulp
http://slidepdf.com/reader/full/santander-pulp 12/7812
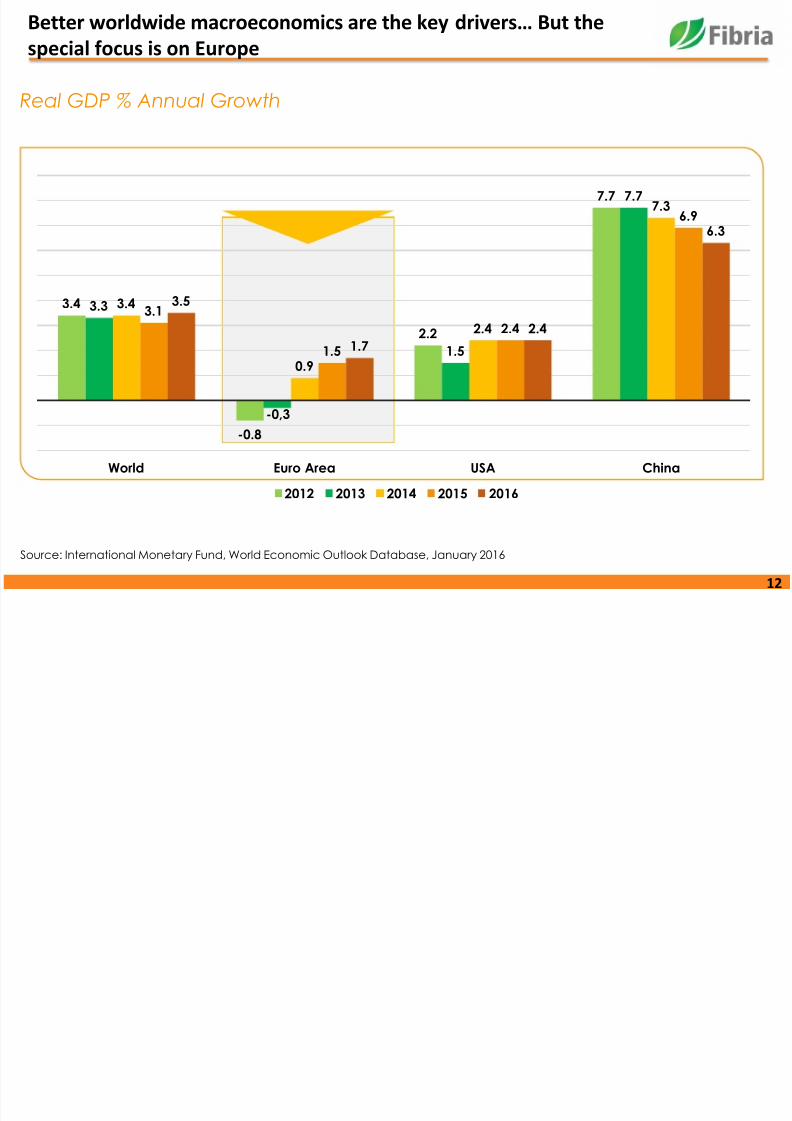
Better worldwide macroeconomics are the key drivers… But the
special focus is on Europe
Real GDP % Annual Growth
Source: International Monetary Fund, World Economic Outlook Database, January 2016
3.4
-0.8
2.2
7.7
3.3
-0,3
1.5
7.7
3.4
0.9
2.4
7.3
3.1
1.5
2.4
6.9
3.5
1.7
2.4
6.3
World Euro Area USA China
2012 2013 2014 2015 2016
8/16/2019 Santander Pulp
http://slidepdf.com/reader/full/santander-pulp 13/7813
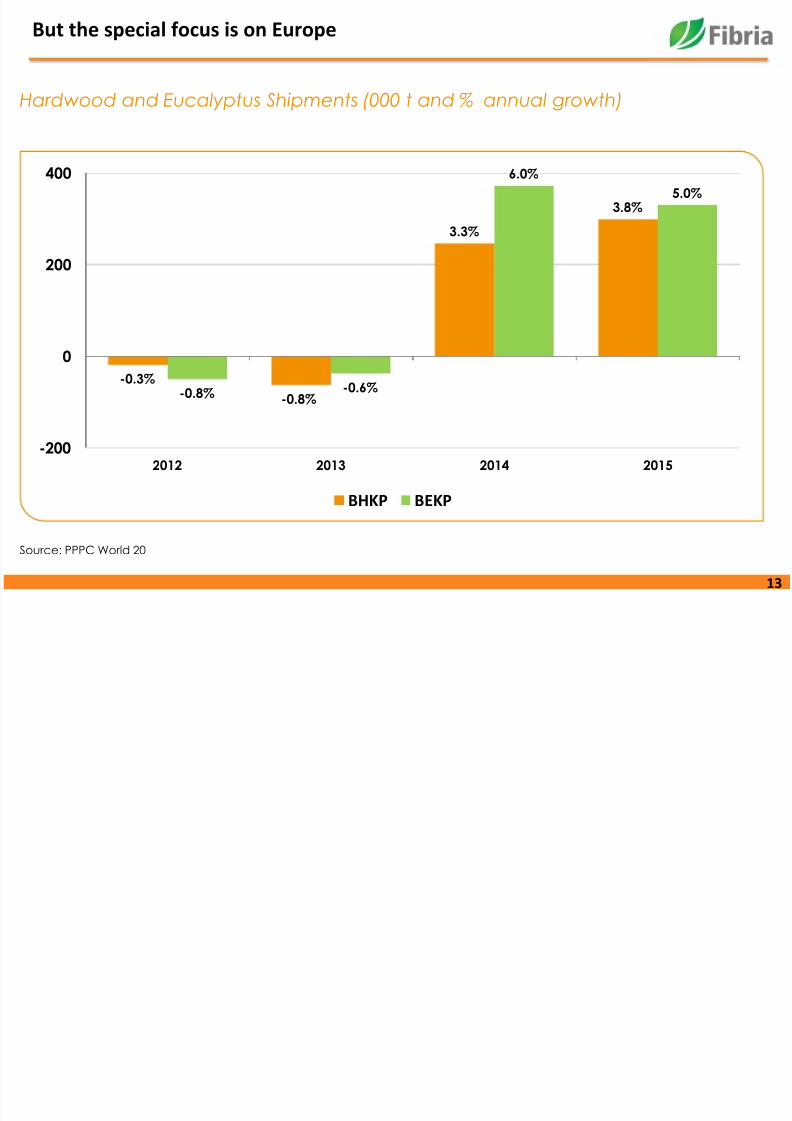
But the special focus is on Europe
Hardwood and Eucalyptus Shipments (000 t and % annual growth)
Source: PPPC World 20
-0.3%
-0.8%
3.3%
3.8%
-0.8% -0.6%
6.0%
5.0%
-200
0
200
400
2012 2013 2014 2015
BHKP BEKP
8/16/2019 Santander Pulp
http://slidepdf.com/reader/full/santander-pulp 14/7814
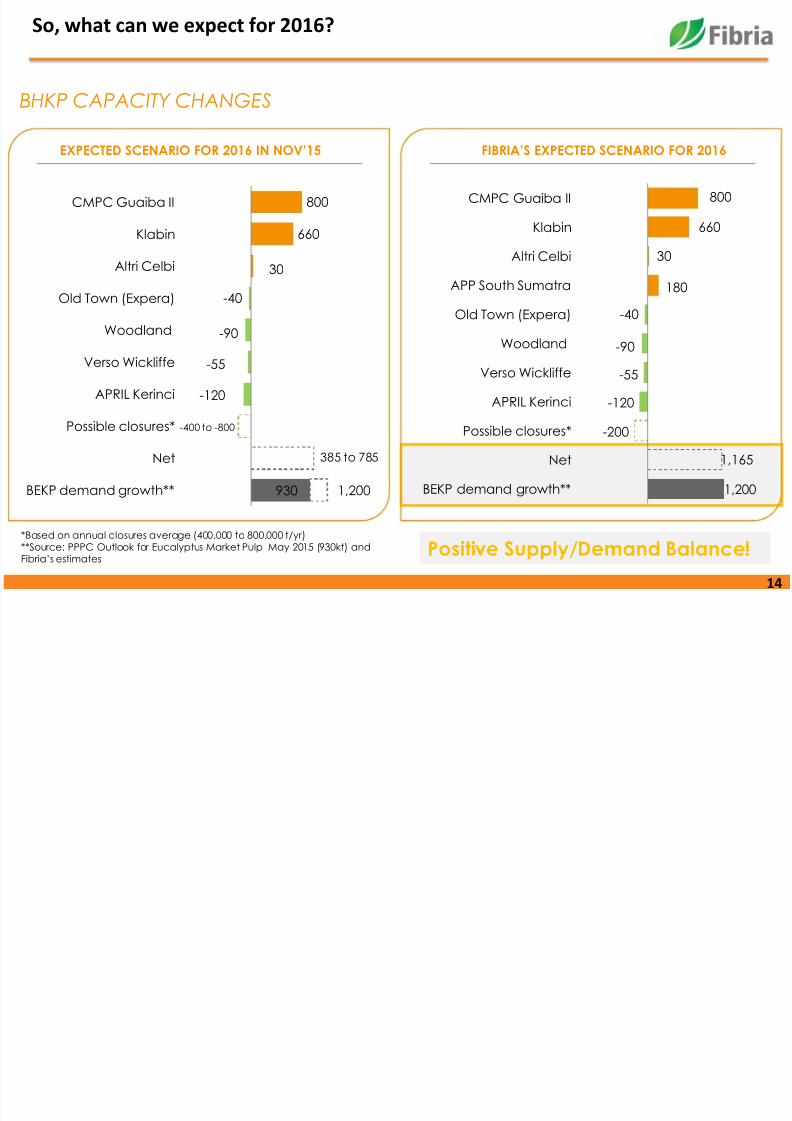
So, what can we expect for 2016?
BHKP CAPACITY CHANGES
EXPECTED SCENARIO FOR 2016 IN NOV’15 FIBRIA’S EXPECTED SCENARIO FOR 2016
930
-120
-55
-90
-40
30
660
800
BEKP demand growth**
Net
Possible closures*
APRIL Kerinci
Verso Wickliffe
Woodland
Old Town (Expera)
Altri Celbi
Klabin
CMPC Guaiba II
-400 to -800
385 to 785
1,200
*Based on annual closures average (400,000 to 800,000 t/yr)**Source: PPPC Outlook for Eucalyptus Market Pulp May 2015 (930kt) andFibria’s estimates
1,200
1,165
-200
-120
-55
-90
-40
180
30
660
800
BEKP demand growth**
Net
Possible closures*
APRIL Kerinci
Verso Wickliffe
Woodland
Old Town (Expera)
APP South Sumatra
Altri Celbi
Klabin
CMPC Guaiba II
Positive Supply/Demand Balance!
8/16/2019 Santander Pulp
http://slidepdf.com/reader/full/santander-pulp 15/7815
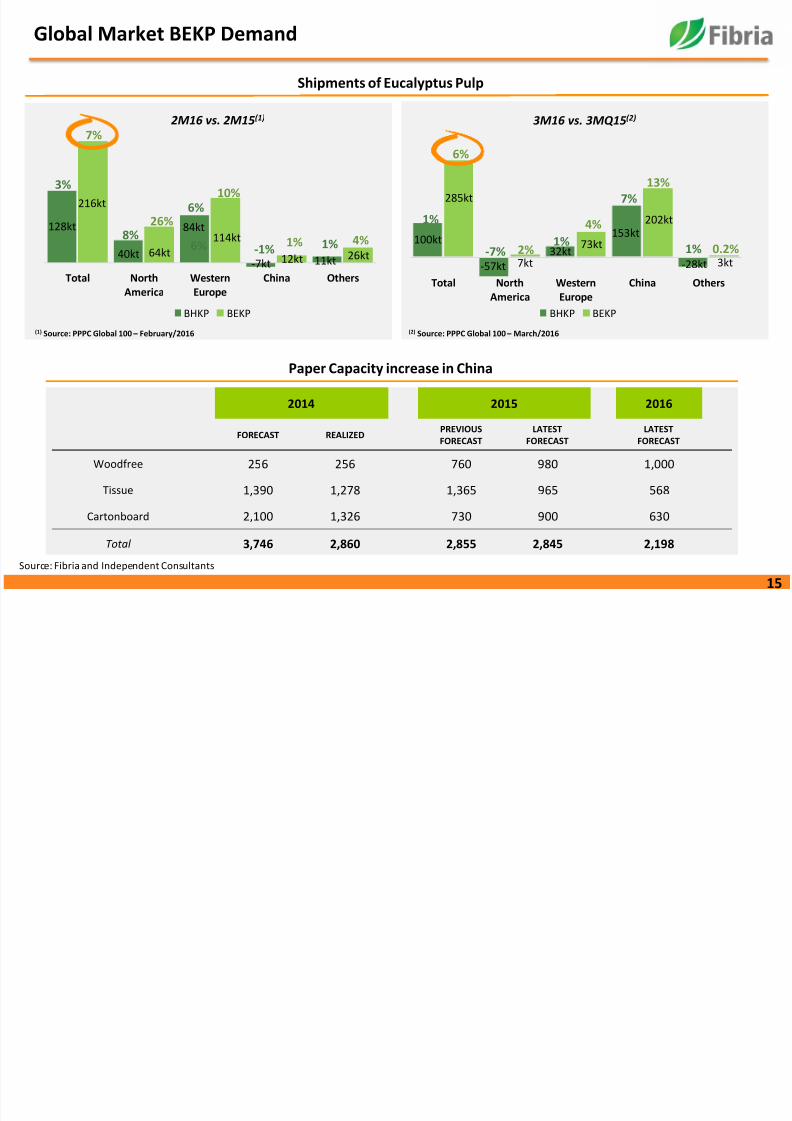
Shipments of Eucalyptus Pulp
(1) Source: PPPC World 20 – January/2015
Global Market BEKP Demand
Paper Capacity increase in China
2014 2015 2016
FORECAST REALIZEDPREVIOUSFORECAST
LATESTFORECAST
LATESTFORECAST
Woodfree 256 256 760 980 1,000
Tissue 1,390 1,278 1,365 965 568
Cartonboard 2,100 1,326 730 900 630
Total 3,746 2,860 2,855 2,845 2,198
Source: Fibria and Independent Consultants
3M16 vs. 3MQ15(2)
(2) Source: PPPC Global 100 – March/2016
2M16 vs. 2M15(1)
100kt
-57kt
32kt
153kt
-28kt
285kt
7kt
73kt
202kt
3kt
Total NorthAmerica
WesternEurope
China Others
BHKP BEKP
1%
6%
-7% 2%1%
4%
7%13%
1% 0.2%
128kt
40kt
84kt
-7kt 11kt
216kt
64kt
114kt
12kt 26kt
Total NorthAmerica
WesternEurope
China Others
BHKP BEKP
(1) Source: PPPC Global 100 – February/2016
3%
7%
8%26%
6%
10%
-1%1% 1% 4%
6%
8/16/2019 Santander Pulp
http://slidepdf.com/reader/full/santander-pulp 16/7816
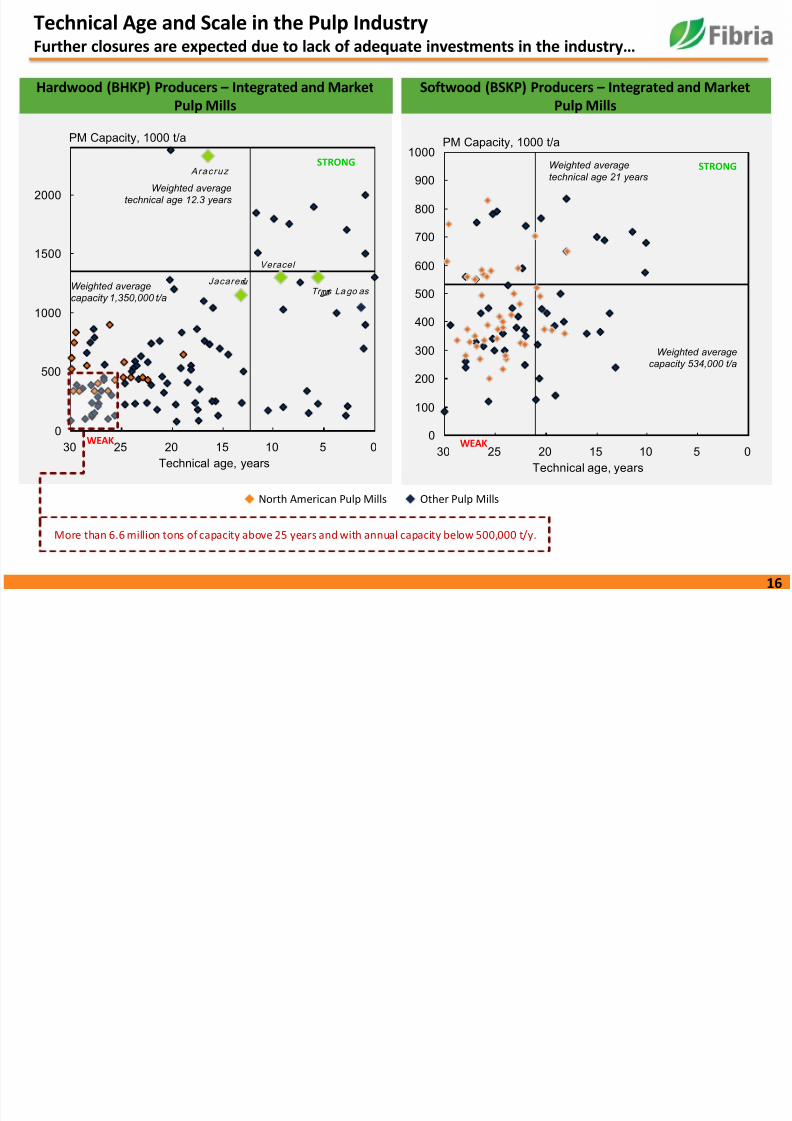
Technical Age and Scale in the Pulp IndustryFurther closures are expected due to lack of adequate investments in the industry…
Hardwood (BHKP) Producers – Integrated and MarketPulp Mills
Softwood (BSKP) Producers – Integrated and MarketPulp Mills
STRONG
Weighted average
technical age 12.3 years
Weighted average
capacity 1,350,000 t/a
Aracruz
Três Lago as
Veracel
Jacareí
WEAK
STRONGWeighted average
technical age 21 years
Weighted average
capacity 534,000 t/a
North American Pulp Mills Other Pulp Mills
WEAK
More than 6.6 million tons of capacity above 25 years and with annual capacity below 500,000 t/y.
PM Capacity, 1000 t/a
0
500
1000
1500
2000
051015202530
Technical age, years
PM Capacity, 1000 t/a
0
100
200
300
400
500
600
700
800
900
1000
051015202530
Technical age, years
8/16/2019 Santander Pulp
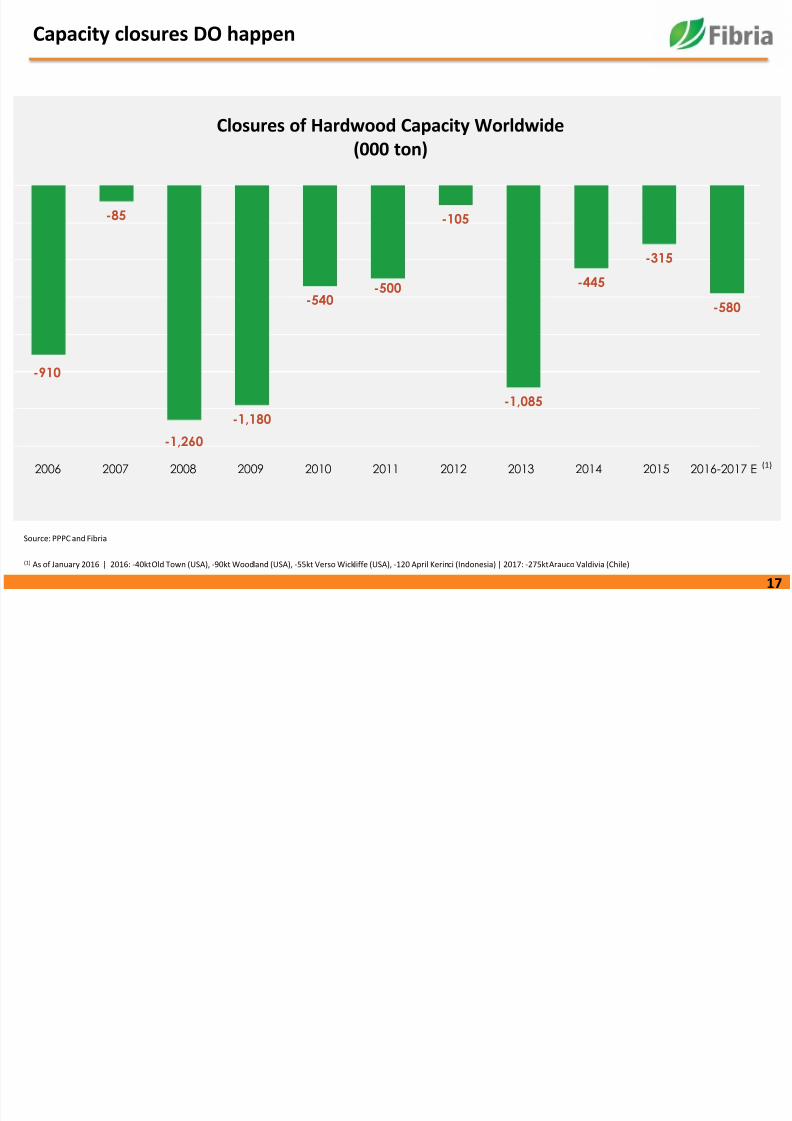
http://slidepdf.com/reader/full/santander-pulp 17/7817
Source: PPPC and Fibria
Closures of Hardwood Capacity Worldwide
(000 ton)
Capacity closures DO happen
-910
-85
-1,260
-1,180
-540-500
-105
-1,085
-445
-315
-580
2006 2007 2008 2009 2010 2011 2012 2013 2014 2015 2016-2017 E (1)
(1) As of January 2016 | 2016: -40kt Old Town (USA), -90kt Woodland (USA), -55kt Verso Wickliffe (USA), -120 April Kerinci (Indonesia) | 2017: -275kt Arauco Valdivia (Chile)

8/16/2019 Santander Pulp
http://slidepdf.com/reader/full/santander-pulp 18/7818
Even more competitive cash production cost w/ H2BHKP (US$/t)
Source: Hawkins Wright (Price Forecast April 2016) and Fibria’s 1Q16 Earnings Release - FX considered by the consultant at R$/US$3.54. H2 cash cost wasestimated according to weighted average cost, after mill balance, converted at R$/US$3.54. Includes energy sales.
460 428375 347
299 295217 184 152
87
55100
2549 60
5851
547
483 475
372
348 355
275
404
10016
19414
USA China Canada Iberia Indonesia Chile/Uruguay Brazil Fibria 1Q16 LTM Fibria w/ H2 -2018
Cash Cost (US$/t) Delivery CIF Europe
BHKP (US$/t)
InterestCapex
SG&A
Income Tax
1,130 2,075 1,095 2,290 3,420 4,915 15,275 Total: 30,200BHKP
capacity(000’ t)
Working Capital

8/16/2019 Santander Pulp
http://slidepdf.com/reader/full/santander-pulp 19/7819
Gross capacity addition should not be counted as the only factorinfluencing pulp price volatility….(1)
List Price bottoming at US$650/t in 2011 and US$724/t in 2014
C a p a c i t y ( 0 0 0 t o n )
0,0
0,2
0,4
0,6
0,8
1,0
1,2
1,4
1,6
1,8
2,0
0
100
200
300
400
500
600
700
800
900
1.000
2002 2003 2004 2005 2006 2007 2008 2009 2010 2011 2012 2013 2014 2015 2016 2017 2018
Valdivia
APP
Hainan
Veracel Nueva Aldea
Santa Fé
Mucuri
Fray
Bentos
Kerinci
PL3
Três
Lagoas
Rizhao
APP Guangxi
Chenming
Zhanjiang
Eldorado
Montes
del Plata
Maranhão
Guaíba II
APP South
Sumatra(2)
Klabin
Oji
Nantong
Horizonte II
B H K P p r i c e s - C I F E u r o p e
( U S $ / t o n )
(1) Source: Hawkins Wright , Poyry and Fibria Analysis. Pulp price estimates according to Hawkins Wright (Dec/15), Brian McClay (Feb/16) and RISI (Feb/16)(2) Partially integrated production.
8/16/2019 Santander Pulp
http://slidepdf.com/reader/full/santander-pulp 20/78
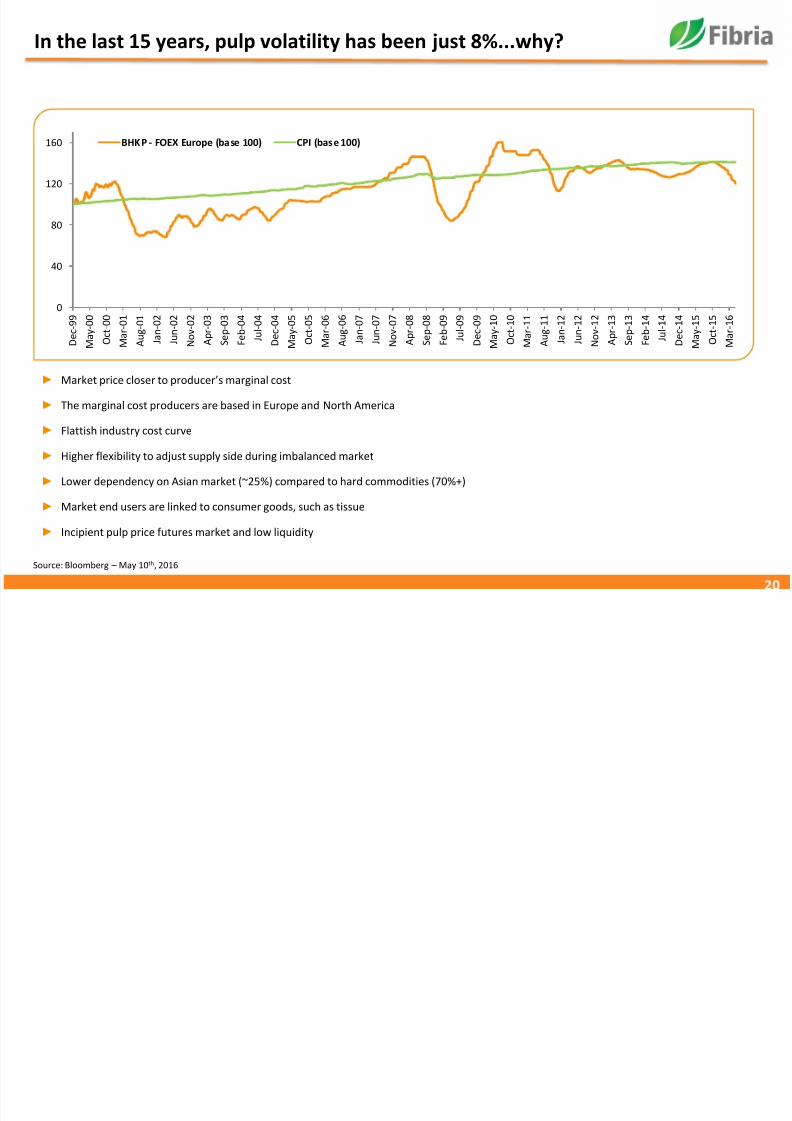
In the last 15 years, pulp volatility has been just 8%...why?
► Market price closer to producer’s marginal cost
► The marginal cost producers are based in Europe and North America
► Flattish industry cost curve
► Higher flexibility to adjust supply side during imbalanced market
► Lower dependency on Asian market (~25%) compared to hard commodities (70%+)
► Market end users are linked to consumer goods, such as tissue
► Incipient pulp price futures market and low liquidity
Source: Bloomberg – May 10th, 2016
0
40
80
120
160
D e c - 9 9
M a y - 0 0
O c t - 0 0
M a r - 0 1
A u g - 0 1
J a n - 0 2
J u n - 0 2
N o v - 0 2
A p r - 0 3
S e p - 0 3
F e b - 0 4
J u l - 0 4
D e c - 0 4
M a y - 0 5
O c t - 0 5
M a r - 0 6
A u g - 0 6
J a n - 0 7
J u n - 0 7
N o v - 0 7
A p r - 0 8
S e p - 0 8
F e b - 0 9
J u l - 0 9
D e c - 0 9
M a y - 1 0
O c t - 1 0
M a r - 1 1
A u g - 1 1
J a n - 1 2
J u n - 1 2
N o v - 1 2
A p r - 1 3
S e p - 1 3
F e b - 1 4
J u l - 1 4
D e c - 1 4
M a y - 1 5
O c t - 1 5
M a r - 1 6
BHKP - FOEX Europe (base 100) CPI (base 100)
8/16/2019 Santander Pulp
http://slidepdf.com/reader/full/santander-pulp 21/7821
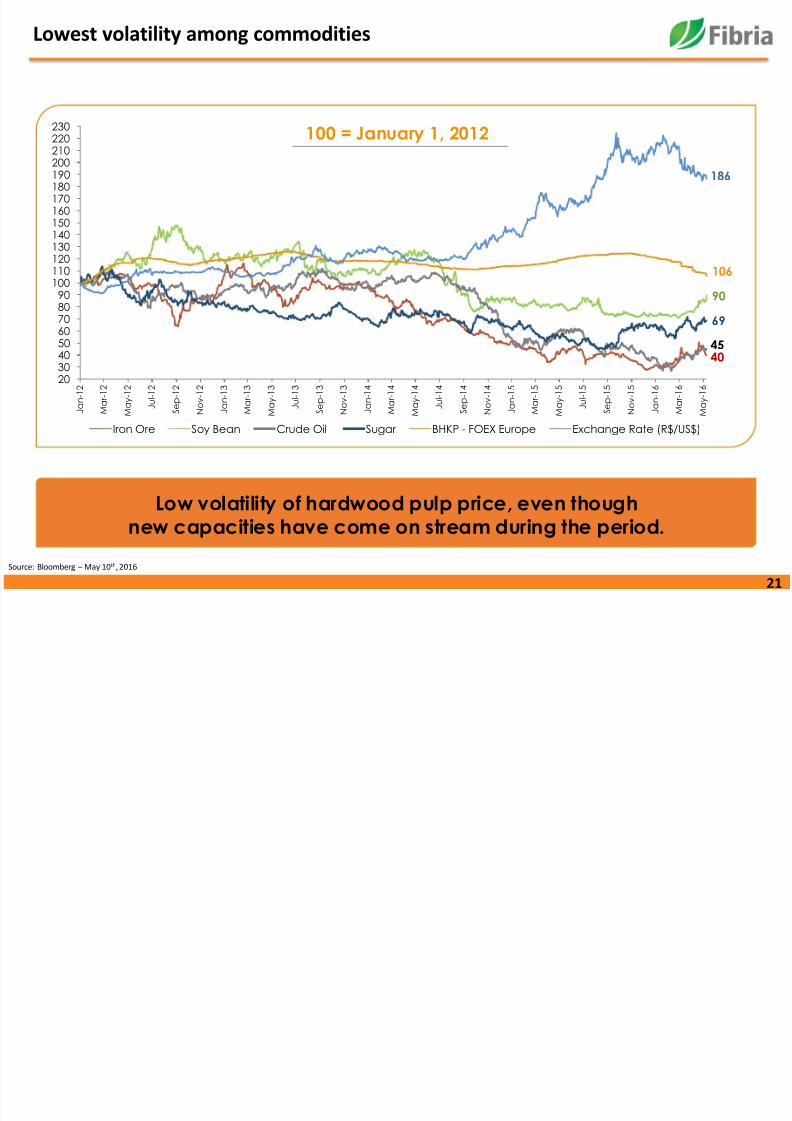
Lowest volatility among commodities
Source: Bloomberg – May 10th, 2016
Low volatility of hardwood pulp price, even thoughnew capacities have come on stream during the period.
2030405060708090
100110120130140150160170180190200210220
230
J a n - 1 2
M a r - 1 2
M a y - 1 2
J u l - 1 2
S e p - 1 2
N o v - 1 2
J a n - 1 3
M a r - 1 3
M a y - 1 3
J u l - 1 3
S e p - 1 3
N o v - 1 3
J a n - 1 4
M a r - 1 4
M a y - 1 4
J u l - 1 4
S e p - 1 4
N o v - 1 4
J a n - 1 5
M a r - 1 5
M a y - 1 5
J u l - 1 5
S e p - 1 5
N o v - 1 5
J a n - 1 6
M a r - 1 6
M a y - 1 6
Iron Ore Soy Bean Crude Oil Sugar BHKP - FOEX Europe Exchange Rate (R$/US$)
106
186
90
69
4045
100 = January 1, 2012
8/16/2019 Santander Pulp
http://slidepdf.com/reader/full/santander-pulp 22/78
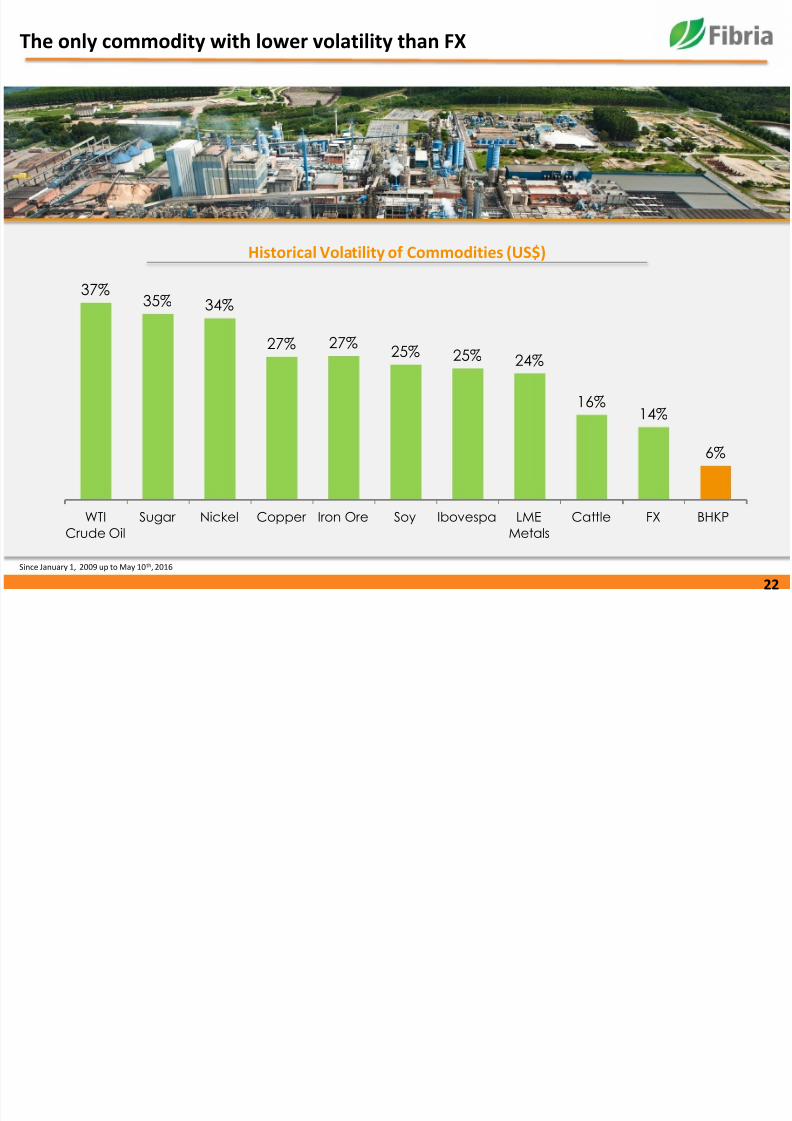
The only commodity with lower volatility than FX
Historical Volatility of Commodities (US$)
Since January 1, 2009 up to May 10th, 2016
22
37%35% 34%
27% 27%25% 25% 24%
16%
14%
6%
WTI
Crude Oil
Sugar Nickel Copper Iron Ore Soy Ibovespa LME
Metals
Cattle FX BHKP

8/16/2019 Santander Pulp
http://slidepdf.com/reader/full/santander-pulp 23/7823Financial and Operational Highlights
E h 5% d i ti f th R l i EBITDA b d

8/16/2019 Santander Pulp
http://slidepdf.com/reader/full/santander-pulp 24/7824
Each 5% depreciation of the Real increases EBITDA by aroundR$420m and FCF by R$550m
815
1,488
1,173 1,1531,295
1,185
1,560 1,558
2009 2010 2011 2012 2013 2014 2015 1Q16 LTM 2016 (e)
Exchange Rate
Average (R$/US$)
EBITDA Margin
EBITDA (US$ million)
Fibria net pulp price(US$/t)
Fibria net pulp price(R$/t)
2.00 1.76 1.67 1.95 2.16 2.353.33 3.59 3.65(1)
456
670 639 581 610 572582 577 536(2)
29%
40%34% 36%
40% 39%
53% 53%
912 1,179 1,067 1,133 1,311 1,3441,951 2,071 1,956
(1) According to Focus Report (Br azilian Central Bank – May 6th, 2016) I (2) 2016 market consensus
8/16/2019 Santander Pulp
http://slidepdf.com/reader/full/santander-pulp 25/7825
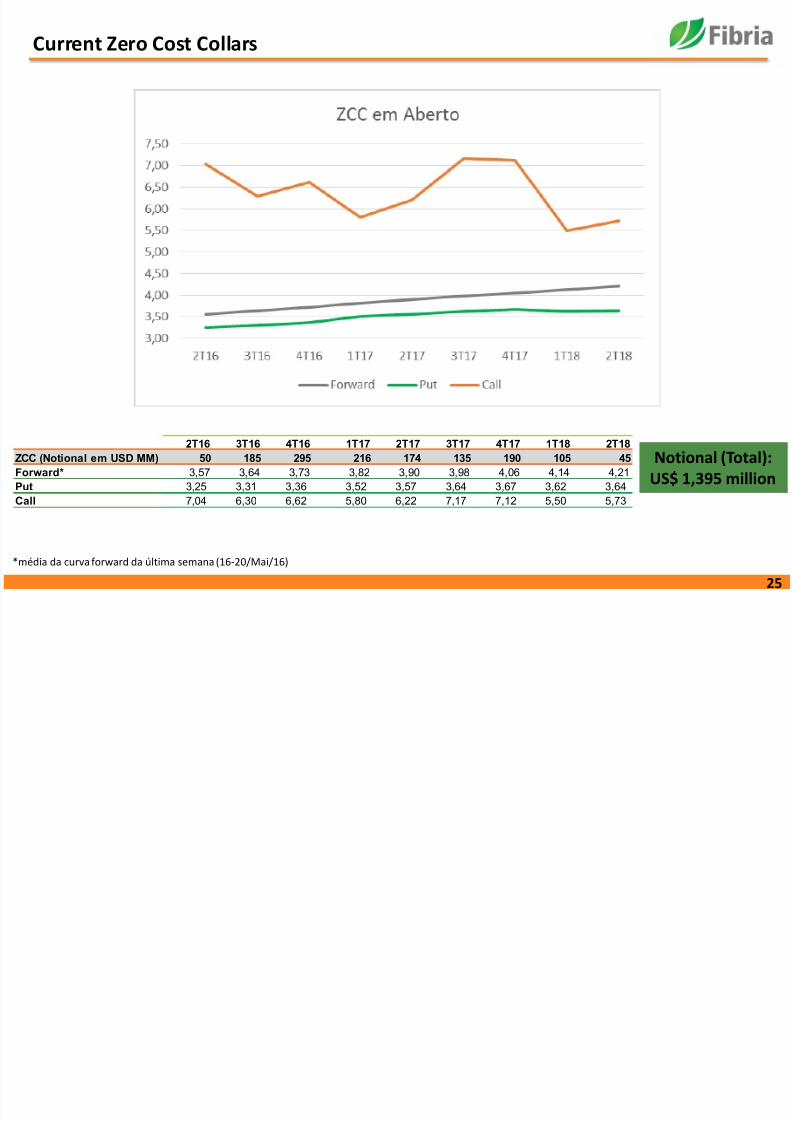
Notional (Total):US$ 1,395 million
Current Zero Cost Collars
2T16 3T16 4T16 1T17 2T17 3T17 4T17 1T18 2T18
ZCC (Notional em USD MM) 50 185 295 216 174 135 190 105 45
Forward* 3,57 3,64 3,73 3,82 3,90 3,98 4,06 4,14 4,21
Put 3,25 3,31 3,36 3,52 3,57 3,64 3,67 3,62 3,64
Call 7,04 6,30 6,62 5,80 6,22 7,17 7,12 5,50 5,73
*média da curva forward da última semana (16-20/Mai/16)
8/16/2019 Santander Pulp
http://slidepdf.com/reader/full/santander-pulp 26/7826
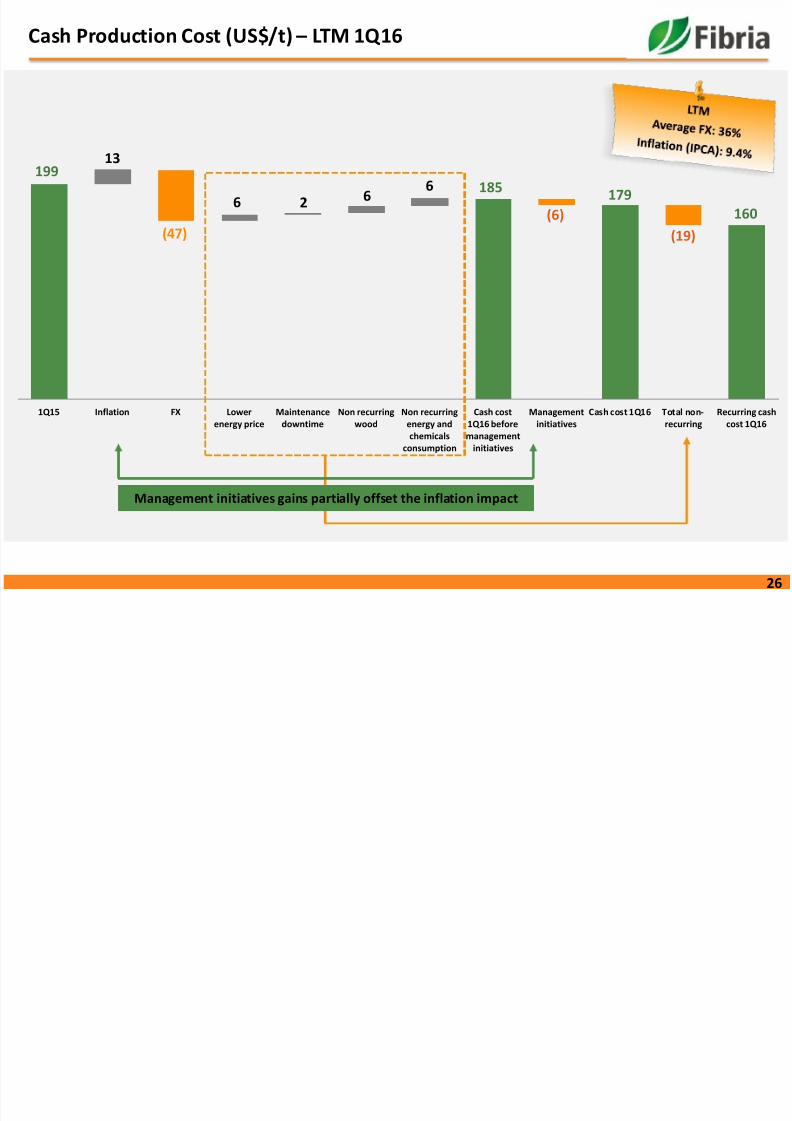
Cash Production Cost (US$/t) – LTM 1Q16
199185 179
160
13
(47)
6 2 66
(6)
(19)
1Q15 Inflation FX Lowerenergy price
Maintenancedowntime
Non recurringwood
Non recurringenergy andchemicals
consumption
Cash cost1Q16 beforemanagement
initiatives
Managementinitiatives
Cash cost 1Q16 Total non-recurring
Recurring cashcost 1Q16
Management initiatives gains partially offset the inflation impact

8/16/2019 Santander Pulp
http://slidepdf.com/reader/full/santander-pulp 27/78
Fibria Cash Production Cost(1) (US$/ton)
Consistentlycontrolling the
cashproduction
cost
27
Cash Production Cost in dollars saw a decrease over the past 7 years
231
264281
242
234 220
186 182
2009 (2) 2010 (2) 2011 2012 2013 2014 2015 1Q16LTM
(1) Constant Currency (2) Excludes Conpacel
8/16/2019 Santander Pulp
http://slidepdf.com/reader/full/santander-pulp 28/7828
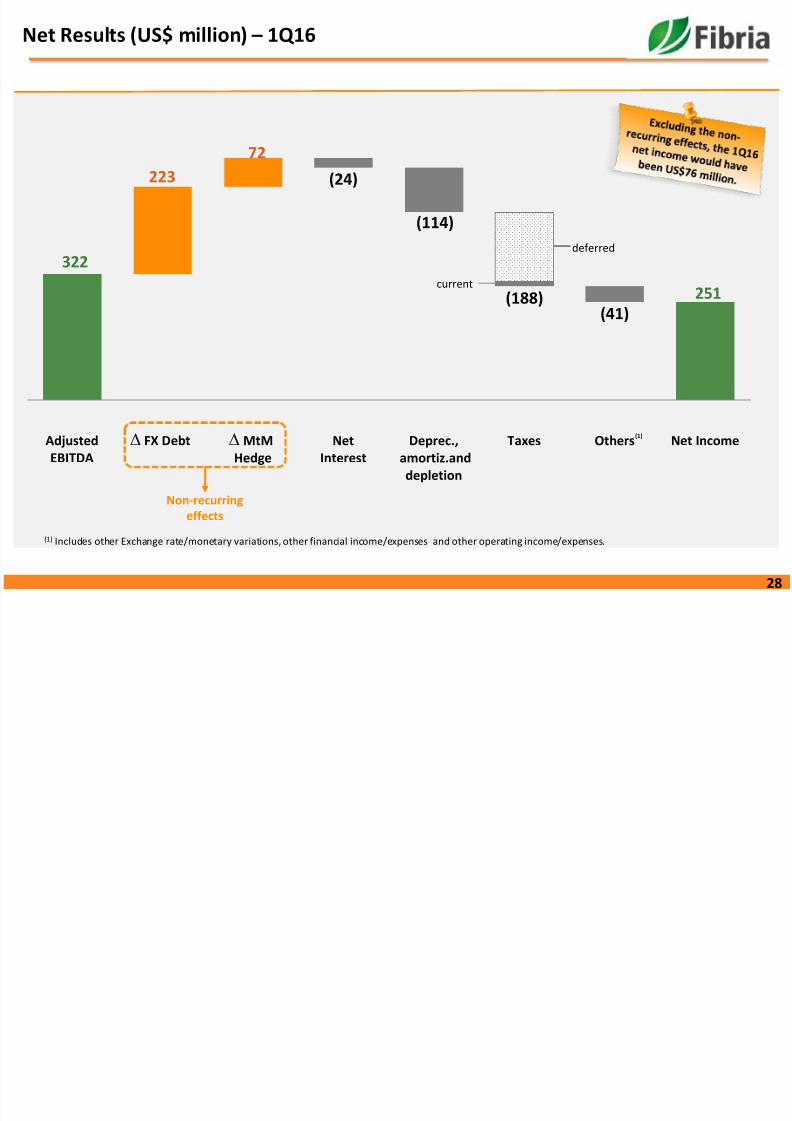
Net Results (US$ million) – 1Q16
322
251
223
72
(24)
(114)
(188)(41)
AdjustedEBITDA
FX Debt MtMHedge
NetInterest
Deprec., amortiz.and
depletion
Taxes Others Net Income∆∆ (1)
(1) Includes other Exchange rate/monetary variations, other financial income/expenses and other operating income/expenses.
Non-recurringeffects
current
deferred
8/16/2019 Santander Pulp
http://slidepdf.com/reader/full/santander-pulp 29/78
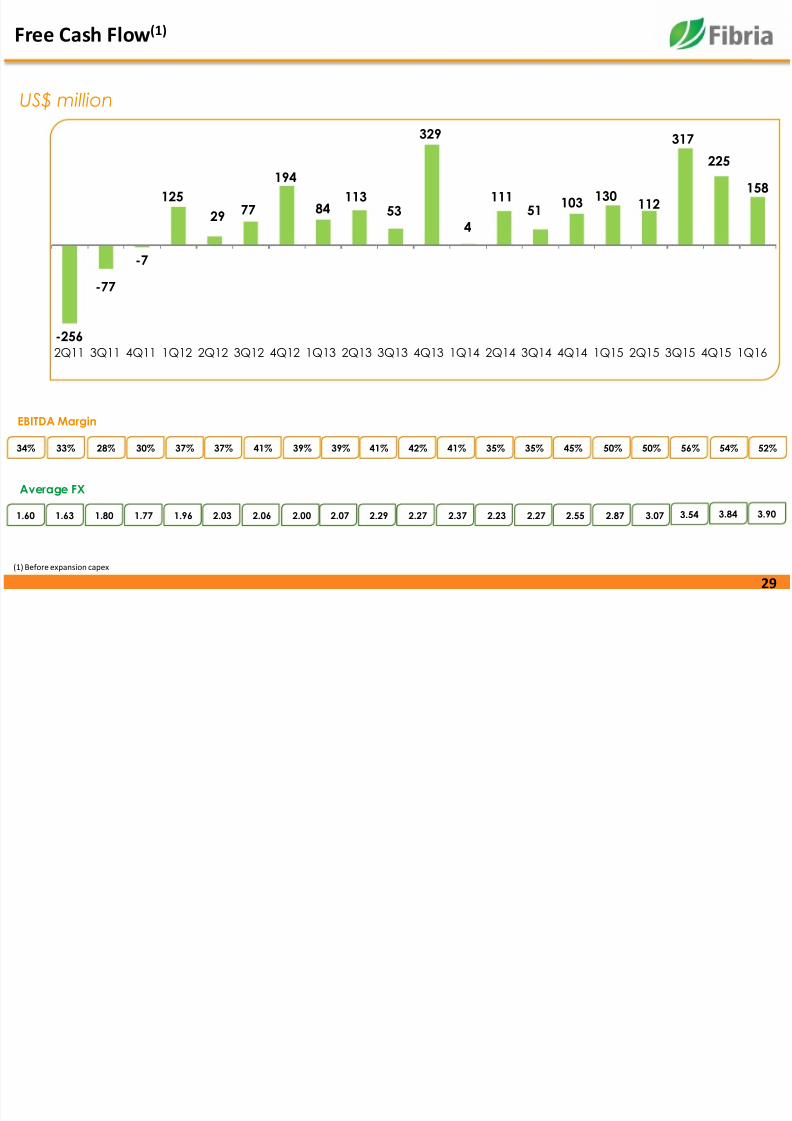
Free Cash Flow(1)
29(1) Before expansion capex
US$ million
EBITDA Margin
Average FX
-256
-77
-7
125
29 77
194
84113
53
329
4
11151
103130
112
317225
158
2Q11 3Q11 4Q11 1Q12 2Q12 3Q12 4Q12 1Q13 2Q13 3Q13 4Q13 1Q14 2Q14 3Q14 4Q14 1Q15 2Q15 3Q15 4Q15 1Q16
34% 33% 28% 30% 37% 37% 41% 39% 39% 41% 42% 41% 35% 35% 45% 50% 50% 56%
1.60 1.63 1.80 1.77 1.96 2.03 2.06 2.00 2.07 2.29 2.27 2.37 2.23 2.27 2.55 2.87 3.07 3.54
54%
3.84
52%
3.90
8/16/2019 Santander Pulp
http://slidepdf.com/reader/full/santander-pulp 30/78
30
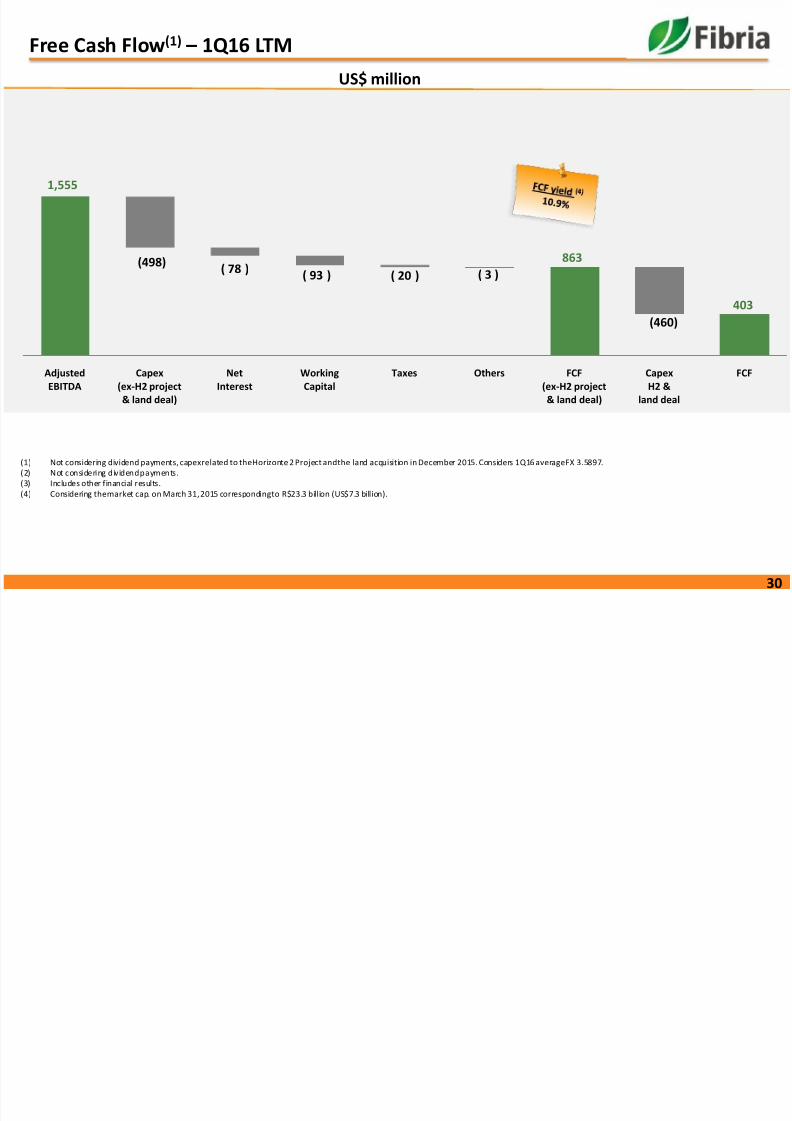
Free Cash Flow(1) – 1Q16 LTM
US$ million
(1) Not considering dividend payments, capexrelated to theHorizonte 2 Project andthe land acquisition in December 2015. Considers 1Q16 averageFX 3.5897.
(2) Not considering dividendpayments.
(3) Includes other financial results.
(4) Considering themarket cap. on March 31, 2015 correspondingto R$23.3 billion (US$7.3 billion).
1,555
863
403
(498)( 78 )
( 93 ) ( 20 ) ( 3 )
(460)
AdjustedEBITDA
Capex(ex-H2 project& land deal)
NetInterest
WorkingCapital
Taxes Others FCF(ex-H2 project& land deal)
CapexH2 &
land deal
FCF
8/16/2019 Santander Pulp
http://slidepdf.com/reader/full/santander-pulp 31/78
31
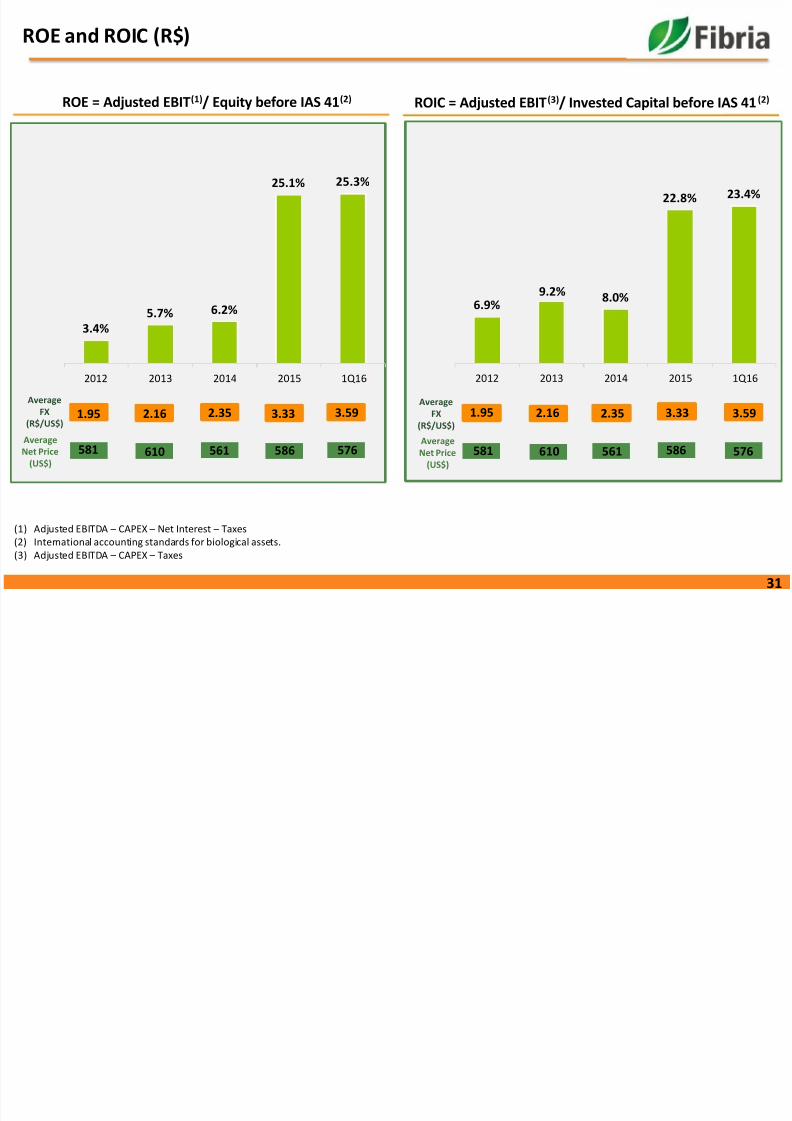
ROE and ROIC (R$)
ROE = Adjusted EBIT(1)/ Equity before IAS 41(2) ROIC = Adjusted EBIT(3)/ Invested Capital before IAS 41(2)
(1) Adjusted EBITDA – CAPEX – Net Interest – Taxes
(2) International accounting standards for biological assets.
(3) Adjusted EBITDA – CAPEX – Taxes
3.4%5.7% 6.2%
25.1% 25.3%
2012 2013 2014 2015 1Q16
6.9%9.2% 8.0%
22.8% 23.4%
2012 2013 2014 2015 1Q16
AverageFX
(R$/US$) 1.95 2.16 2.35 3.33 3.591.95
2.16 2.35 3.33 3.59AverageNet Price
(US$)
581 610 561 586 576 581 610 561 586 576
AverageFX
(R$/US$)
AverageNet Price
(US$)
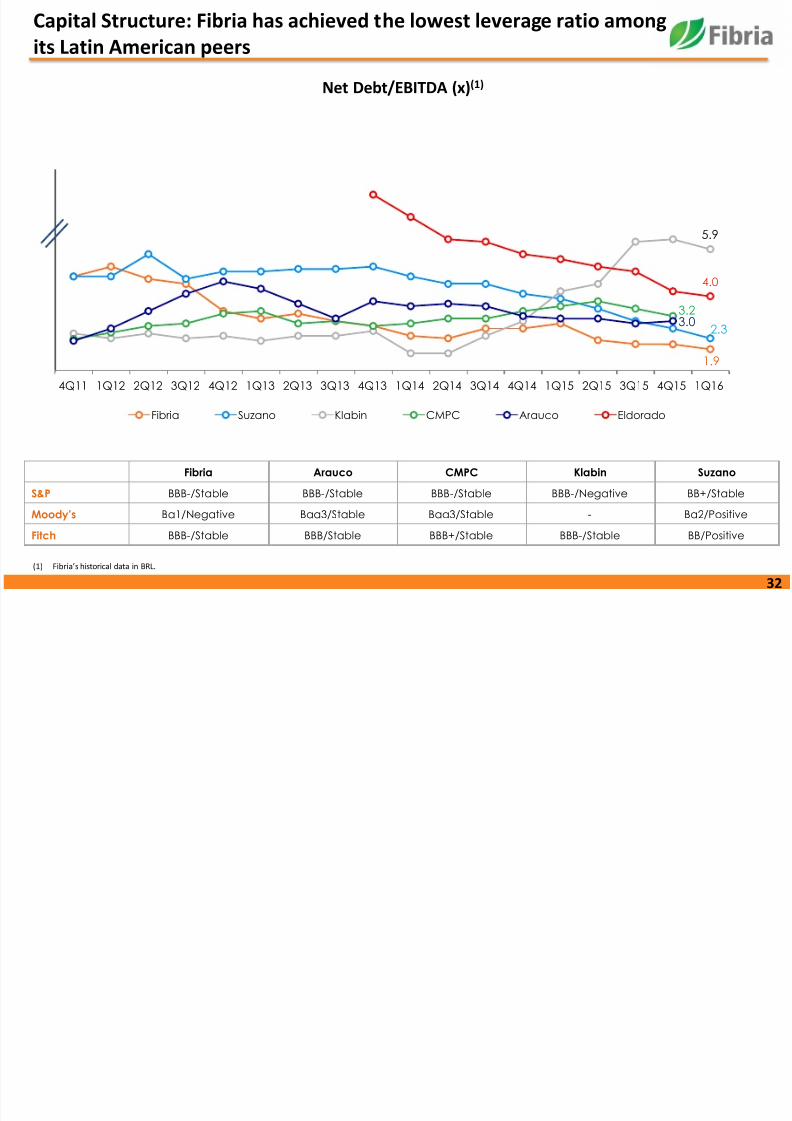
Capital Structure: Fibria has achieved the lowest leverage ratio among
8/16/2019 Santander Pulp
http://slidepdf.com/reader/full/santander-pulp 32/78
32
Capital Structure: Fibria has achieved the lowest leverage ratio amongits Latin American peers
Net Debt/EBITDA (x)(1)
Fibria Arauco CMPC Klabin Suzano
S&P BBB-/Stable BBB-/Stable BBB-/Stable BBB-/Negative BB+/Stable
Moody’s Ba1/Negative Baa3/Stable Baa3/Stable - Ba2/Positive
Fitch BBB-/Stable BBB/Stable BBB+/Stable BBB-/Stable BB/Positive
(1) Fibria’s historical data in BRL.
1.9
2.3
5.9
3.23.0
4.0
4Q11 1Q12 2Q12 3Q12 4Q12 1Q13 2Q13 3Q13 4Q13 1Q14 2Q14 3Q14 4Q14 1Q15 2Q15 3Q15 4Q15 1Q16
Fibria Suzano Klabin CMPC Arauco Eldorado
8/16/2019 Santander Pulp
http://slidepdf.com/reader/full/santander-pulp 33/78
33
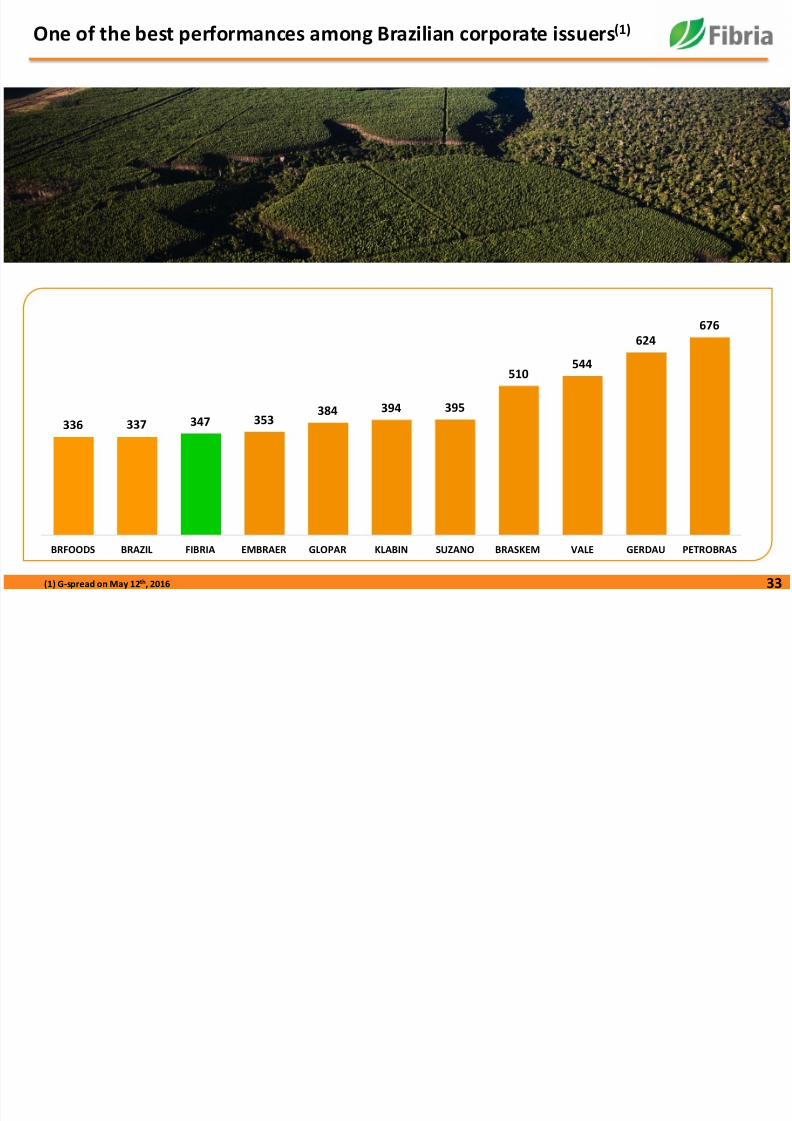
One of the best performances among Brazilian corporate issuers(1)
(1) G-spread on May 12th, 2016
336 337 347 353384 394 395
510544
624676
BRFOODS BRAZIL FIBRIA EMBRAER GLOPAR KLABIN SUZANO BRASKEM VALE GERDAU PETROBRAS
di li
8/16/2019 Santander Pulp
http://slidepdf.com/reader/full/santander-pulp 34/78
34
200
400
600
800
1.000
1.200
1.400
2010 2011 2012 2013 2014 2015
Fibria 2020 Fibria 2021 Fibria 2024
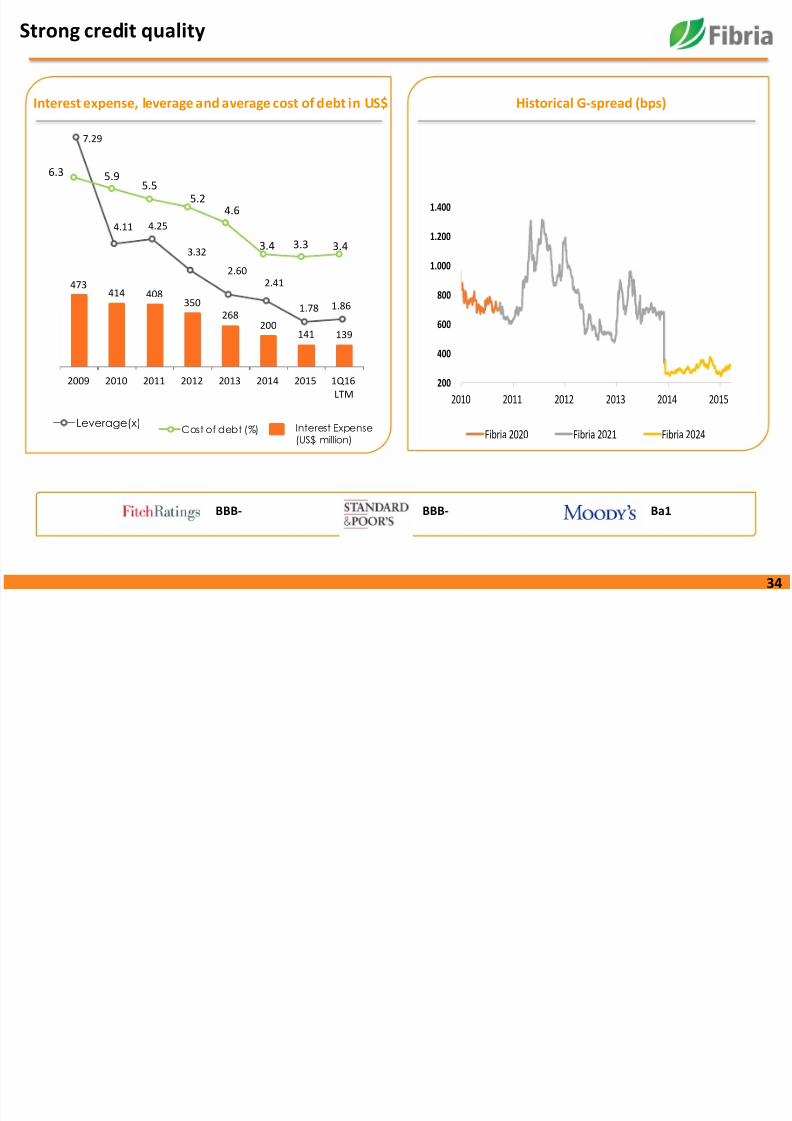
Interest expense, leverage and average cost of debt in US$ Historical G-spread (bps)
Strong credit quality
7.29
4.11 4.25
3.32
2.60
2.41
1.78 1.86
Leverage(x)
6.3 5.95.5
5.24.6
3.4 3.3 3.4
473414 408
350268
200141 139
2009 2010 2011 2012 2013 2014 2015 1Q16
LTM
Interest Expense(US$ million)
Cost of debt (%)
BBB- BBB- Ba1

8/16/2019 Santander Pulp
http://slidepdf.com/reader/full/santander-pulp 35/78
35
Fibria is able to create value for its shareholders with capital discipline
INDUSTRY
CONSOLIDATION ?
PULP
Growth with discipline
Best portfolio of projects
DIVIDENDS
BIO-ENERGY AND
OTHER OPPORTUNITIES
Complementary to pulp
Portocel
Land and forest
FREE CASH FLOW
WITHOUT JEOPARDIZING CREDITMETRICS

8/16/2019 Santander Pulp
http://slidepdf.com/reader/full/santander-pulp 36/78
36BACK UP
8/16/2019 Santander Pulp
http://slidepdf.com/reader/full/santander-pulp 37/78
37Expansion Project – Horizonte 2

8/16/2019 Santander Pulp
http://slidepdf.com/reader/full/santander-pulp 38/78
38
• Follow the growth of strategic customers
• Developing new customers
• Distribution to new geographic markets
• Efficiency and competitiveness gains in logistics
• Higher quality in customer service
• Greater ability to capture new expansion market windows
• Strong M&A position
Competitiveness
Commercialpositioning
Long-term growthpotential
What is the importance of growth for Fibria?
• Wider fixed costs dilution
• Cost curve position improvement
• Greater bargaining power with suppliers
8/16/2019 Santander Pulp
http://slidepdf.com/reader/full/santander-pulp 39/78
39
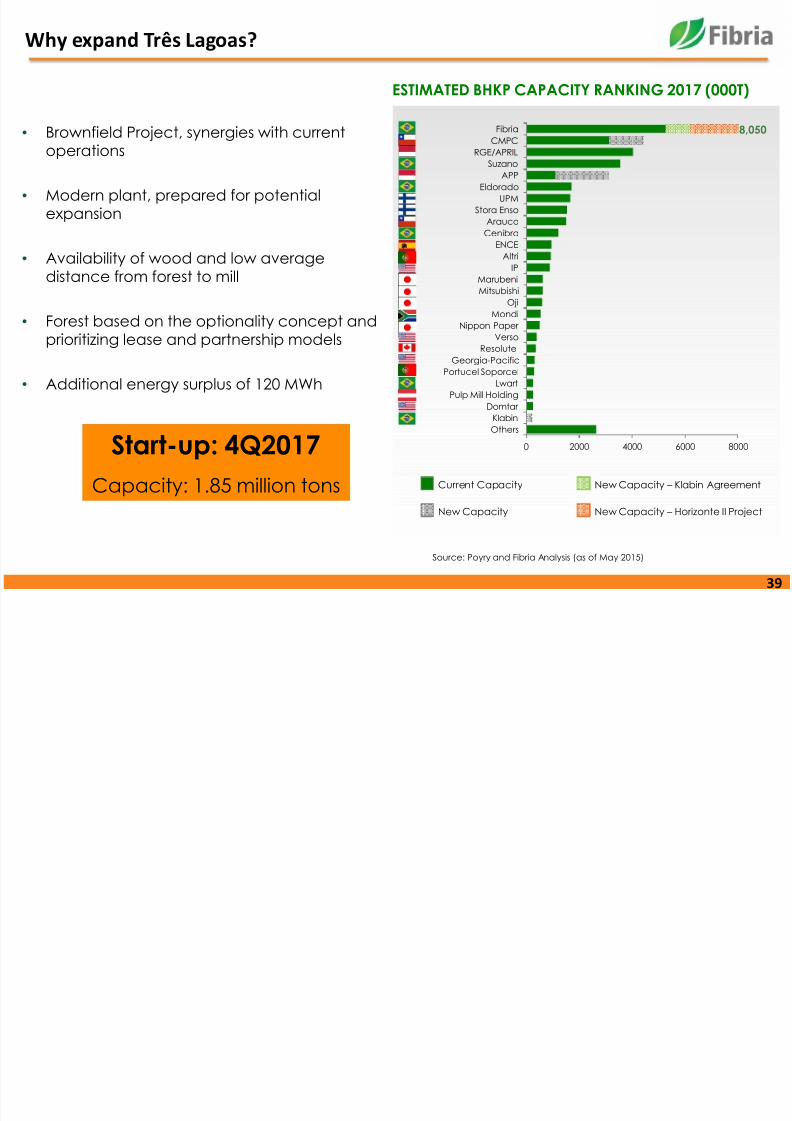
Why expand Três Lagoas?
• Brownfield Project, synergies with currentoperations
• Modern plant, prepared for potentialexpansion
• Availability of wood and low average
distance from forest to mill
• Forest based on the optionality concept andprioritizing lease and partnership models
• Additional energy surplus of 120 MWh
Start-up: 4Q2017
Capacity: 1.85 million tons
ESTIMATED BHKP CAPACITY RANKING 2017 (000T)
Source: Poyry and Fibria Analysis (as of May 2015)
0 2000 4000 6000 8000
OthersKlabin
Domtar
Pulp Mill Holding
Lwart
Portucel Soporcel
Georgia-Pacific
Resolute
Verso
Nippon Paper
Mondi
Oji
MitsubishiMarubeni
IP
Altri
ENCE
Cenibra
Arauco
Stora Enso
UPM
Eldorado
APP
Suzano
RGE/APRILCMPC
Fibria 8,050
Current Capacity
New Capacity
New Capacity – Klabin Agreement
New Capacity – Horizonte II Project
8/16/2019 Santander Pulp
http://slidepdf.com/reader/full/santander-pulp 40/78
40
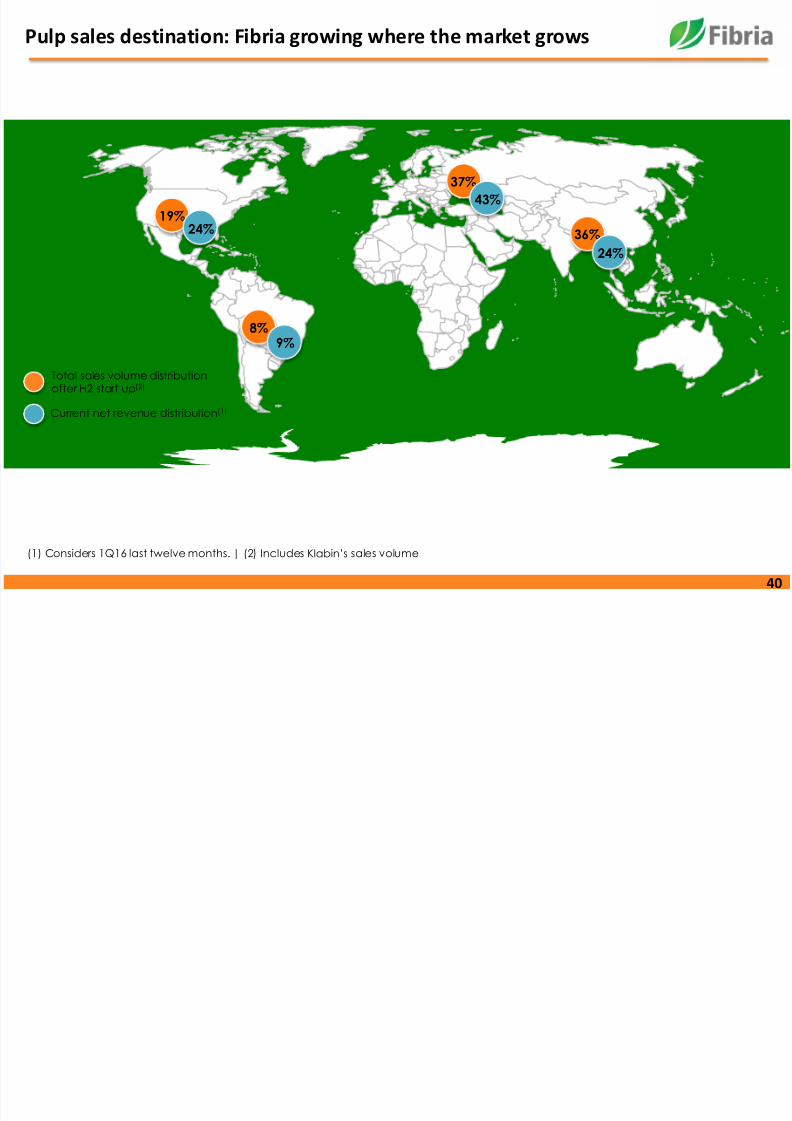
Pulp sales destination: Fibria growing where the market grows
(1) Considers 1Q16 last twelve months. | (2) Includes Klabin’s sales volume
37%
36%
43%
24%
19%24%
8%9%
Total sales volume distributionafter H2 start up(2)
Current net revenue distribution(1)

8/16/2019 Santander Pulp
http://slidepdf.com/reader/full/santander-pulp 41/78
41
Schedule
Startup
Utilities clearanceand commissioningL1 interconnections
during maintenancedowntime
Initial hiring of harvestworkers
Hiring of operationalteam
Negotiations withconcession holders and
Port of Santos tendering
2Q15 3Q15 4Q15 1Q16 2Q16 3Q16 4Q16 1Q17 2Q17 3Q17 4Q17
2015 2016 2017
Beginning ofinfrastructure and
purchase of the TGs
Purchase of theindustrial plants
Beginning of construction
Beginning of assembly
Beginning of forest
machinery deliveries
Beginning ofharvest
Definition of outboundlogistics formats
Updated video
H2 Project will have the forest base ready for the start up
8/16/2019 Santander Pulp
http://slidepdf.com/reader/full/santander-pulp 42/78
42
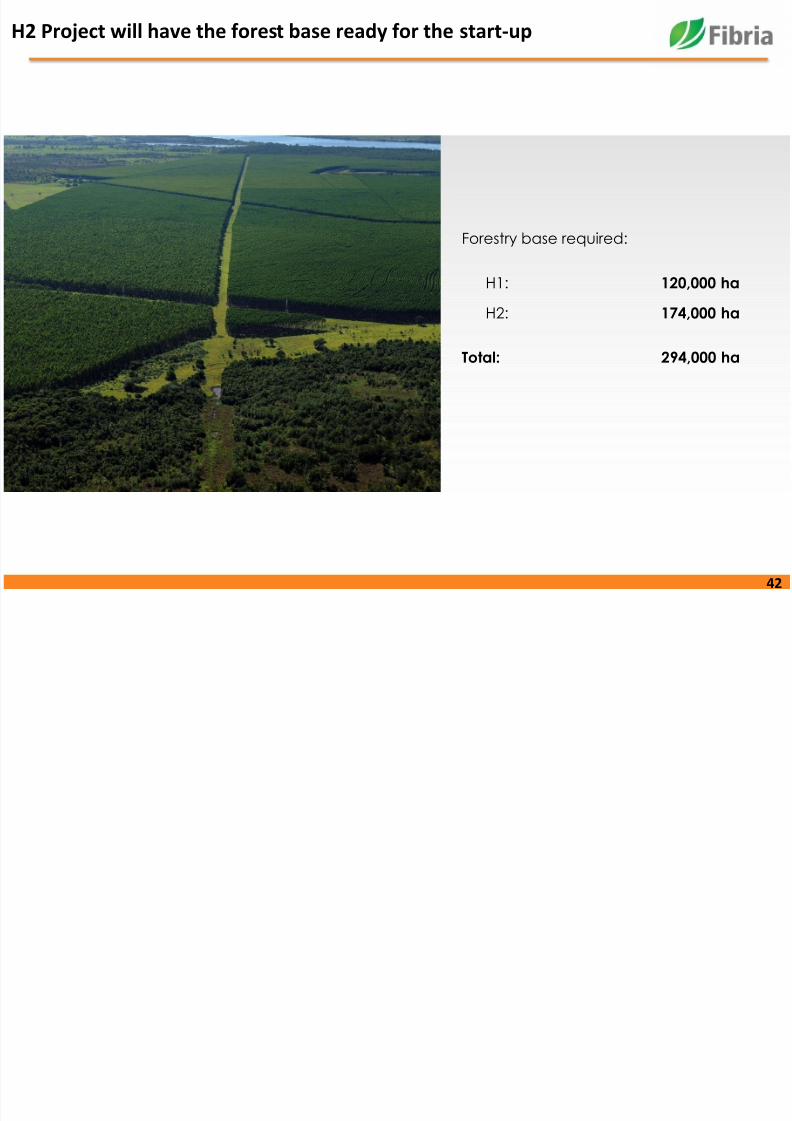
H2 Project will have the forest base ready for the start-up
Forestry base required:
H1: 120,000 ha
H2: 174,000 ha
Total: 294,000 ha
Forestry Logistics
8/16/2019 Santander Pulp
http://slidepdf.com/reader/full/santander-pulp 43/78
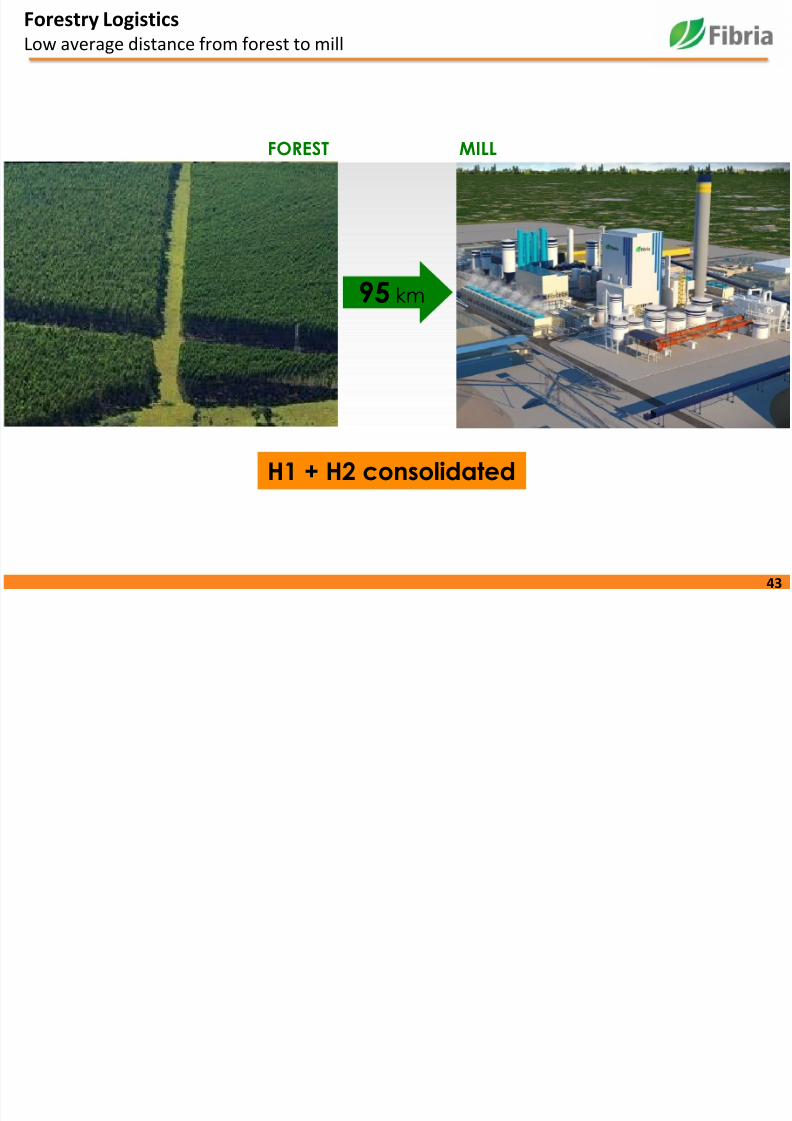
43
y gLow average distance from forest to mill
FOREST MILL
95 km
H1 + H2 consolidated
Outbound logistics
8/16/2019 Santander Pulp
http://slidepdf.com/reader/full/santander-pulp 44/78
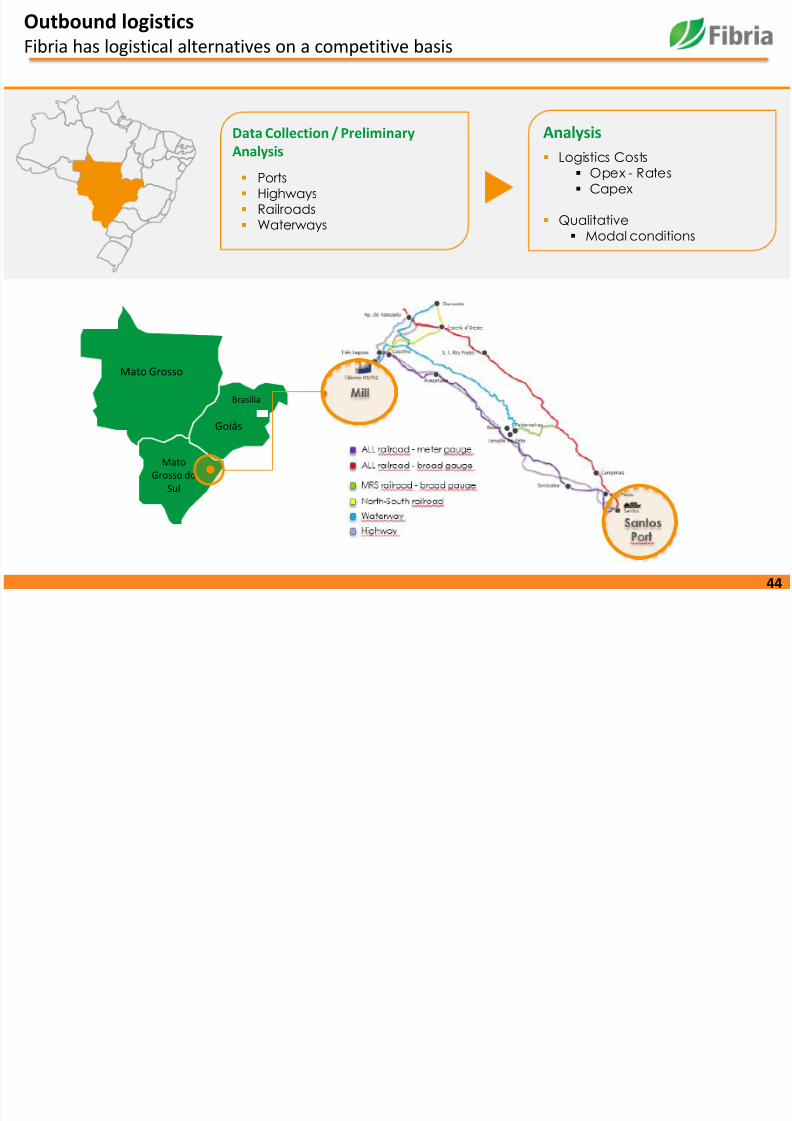
44
gFibria has logistical alternatives on a competitive basis
Ports Highways Railroads Waterways
Data Collection / Preliminary
Analysis Logistics Costs Opex - Rates Capex
Qualitative Modal conditions
Analysis
Mato Grosso
Mato
Grosso do
Sul
Goiás
Brasilia
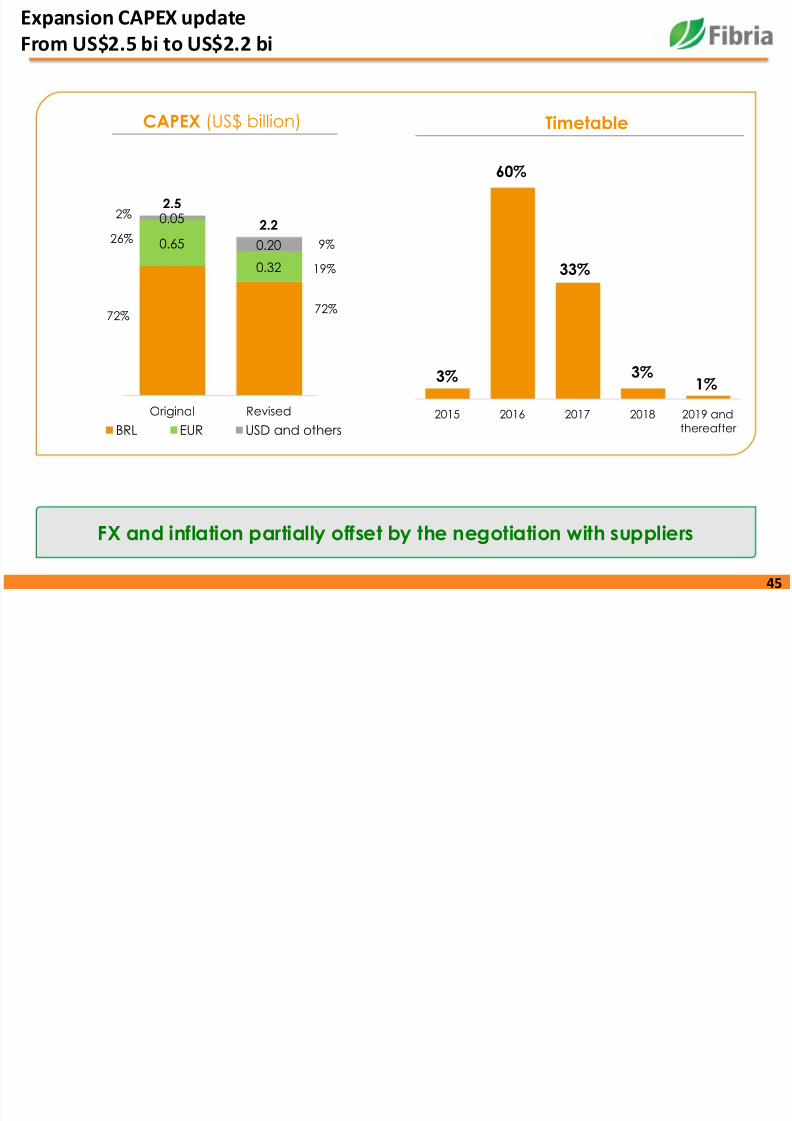
Expansion CAPEX update
8/16/2019 Santander Pulp
http://slidepdf.com/reader/full/santander-pulp 45/78
45
From US$2.5 bi to US$2.2 bi
0.65
0.32
0.05
0.20
2.5
2.2
Original Revised
BRL EUR USD and others
72%
26%
2%
72%
19%
9%
FX and inflation partially offset by the negotiation with suppliers
CAPEX (US$ billion)
3%
60%
33%
3%1%
2015 2016 2017 2018 2019 andthereafter
Timetable
F di
8/16/2019 Santander Pulp
http://slidepdf.com/reader/full/santander-pulp 46/78
46
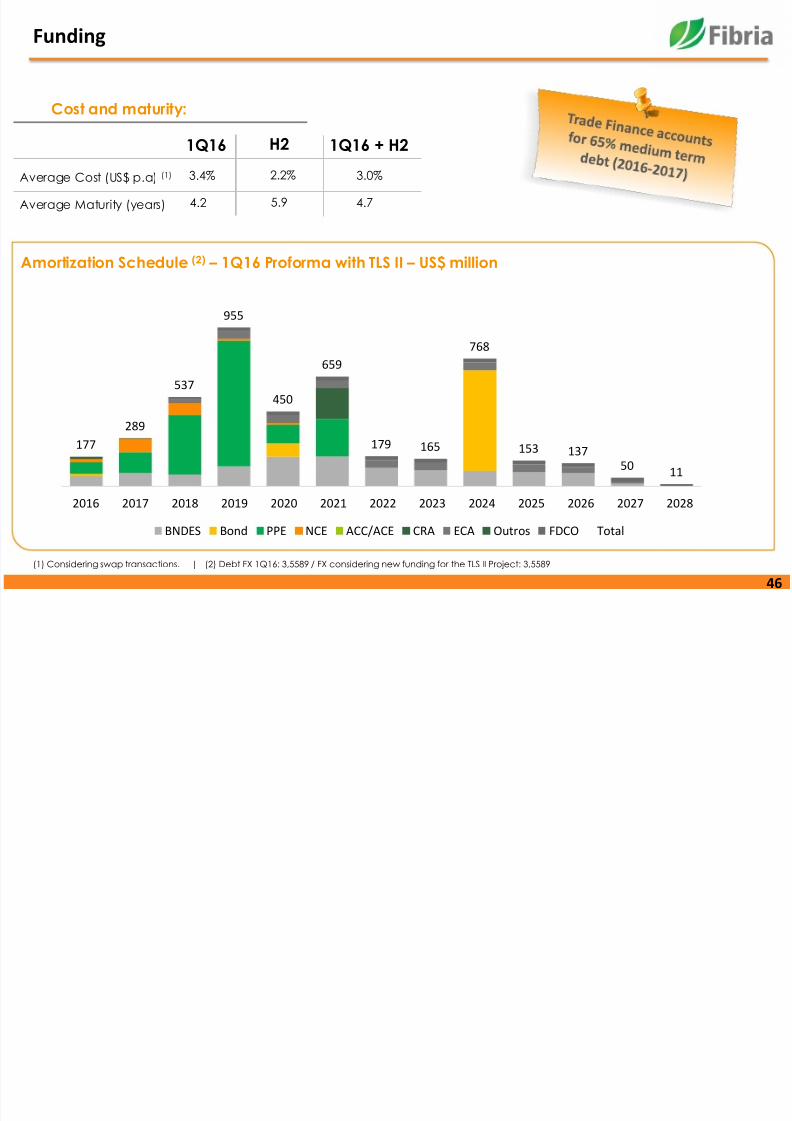
Funding
Amortization Schedule (2) – 1Q16 Proforma with TLS II – US$ million
Cost and maturity:
1Q16 1Q16 + H2
Average Cost (US$ p.a) (1)
Average Maturity (years)
3.4%
4.2
3.0%
4.7
H2
2.2%
5.9
(1) Considering swap transactions. | (2) Debt FX 1Q16: 3,5589 / FX considering new funding for the TLS II Project: 3,5589
177
289
537
955
450
659
179 165
768
153 13750
11
2016 2017 2018 2019 2020 2021 2022 2023 2024 2025 2026 2027 2028
BNDES Bond PPE NCE ACC/ACE CRA ECA Outros FDCO Total
Funding Sources
8/16/2019 Santander Pulp
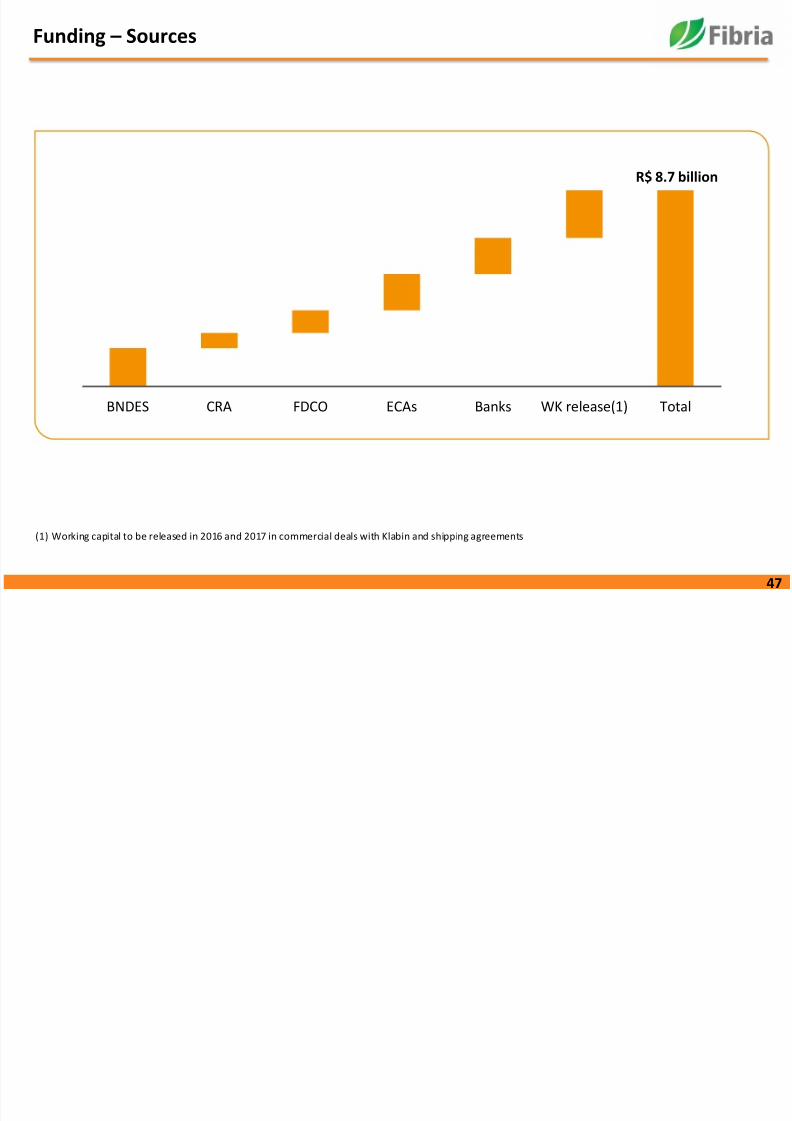
http://slidepdf.com/reader/full/santander-pulp 47/78
47
Funding – Sources
(1) Working capital to be released in 2016 and 2017 in commercial deals with Klabin and shipping agreements
R$ 8.7 billion
BNDES CRA FDCO ECAs Banks WK release(1) Total
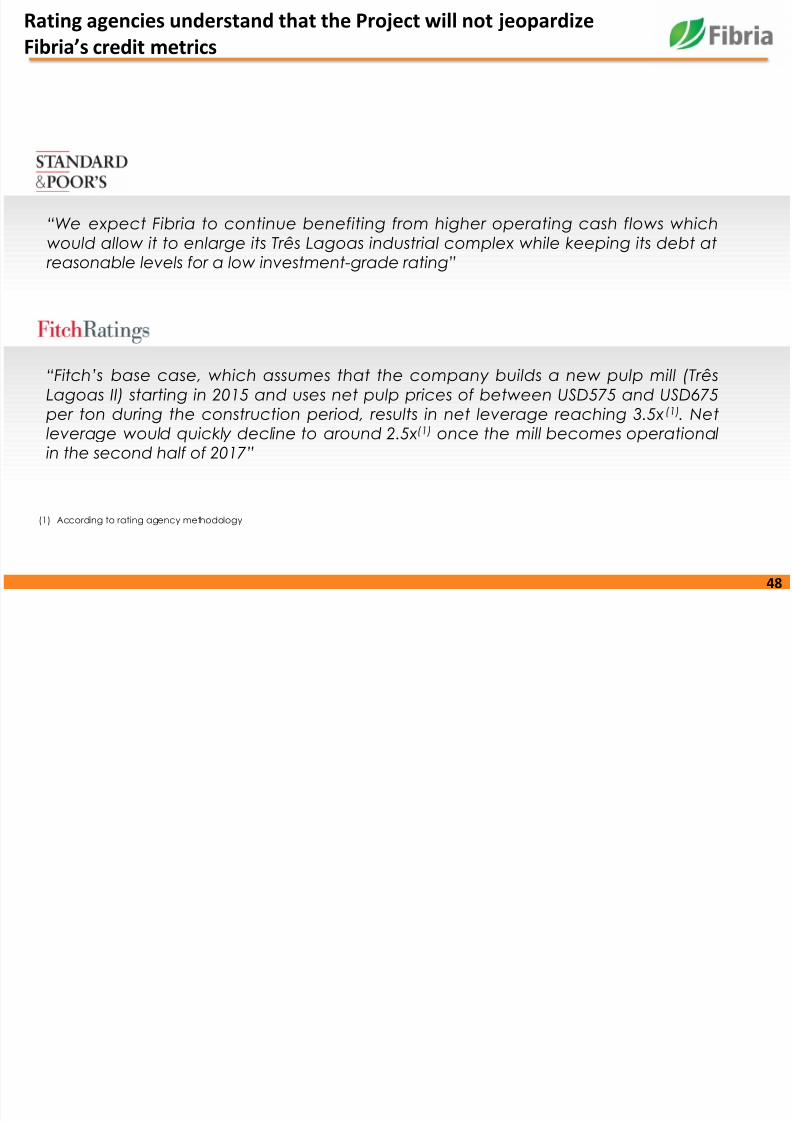
Rating agencies understand that the Project will not jeopardize
8/16/2019 Santander Pulp
http://slidepdf.com/reader/full/santander-pulp 48/78
48
Fibria’s credit metrics
“We expect Fibria to continue benefiting from higher operating cash flows whichwould allow it to enlarge its Três Lagoas industrial complex while keeping its debt at
reasonable levels for a low investment-grade rating”
“Fitch’s base case, which assumes that the company builds a new pulp mill (TrêsLagoas II) starting in 2015 and uses net pulp prices of between USD575 and USD675
per ton during the construction period, results in net leverage reaching 3.5x(1)
. Netleverage would quickly decline to around 2.5x(1) once the mill becomes operationalin the second half of 2017”
(1) According to rating agency methodology
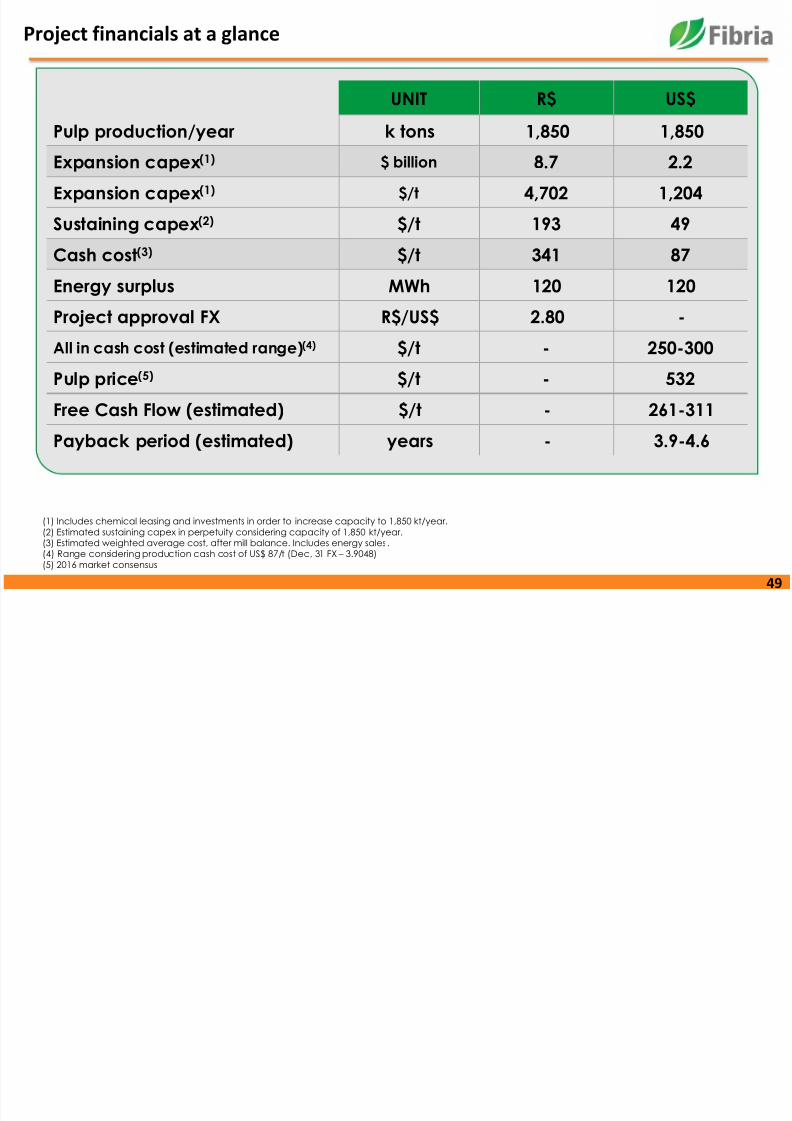
Project financials at a glance
8/16/2019 Santander Pulp
http://slidepdf.com/reader/full/santander-pulp 49/78
49
Project financials at a glance
UNIT R$ US$
Pulp production/year k tons 1,850 1,850
Expansion capex(1) $ billion 8.7 2.2
Expansion capex(1) $/t 4,702 1,204
Sustaining capex(2) $/t 193 49
Cash cost(3) $/t 341 87
Energy surplus MWh 120 120
Project approval FX R$/US$ 2.80 -
All in cash cost (estimated range)(4) $/t - 250-300
Pulp price(5) $/t - 532
Free Cash Flow (estimated) $/t - 261-311
Payback period (estimated) years - 3.9-4.6
(1) Includes chemical leasing and investments in order to increase capacity to 1,850 kt/year.(2) Estimated sustaining capex in perpetuity considering capacity of 1,850 kt/year.(3) Estimated weighted average cost, after mill balance. Includes energy sales .(4) Range considering production cash cost of US$ 87/t (Dec, 31 FX – 3.9048)(5) 2016 market consensus
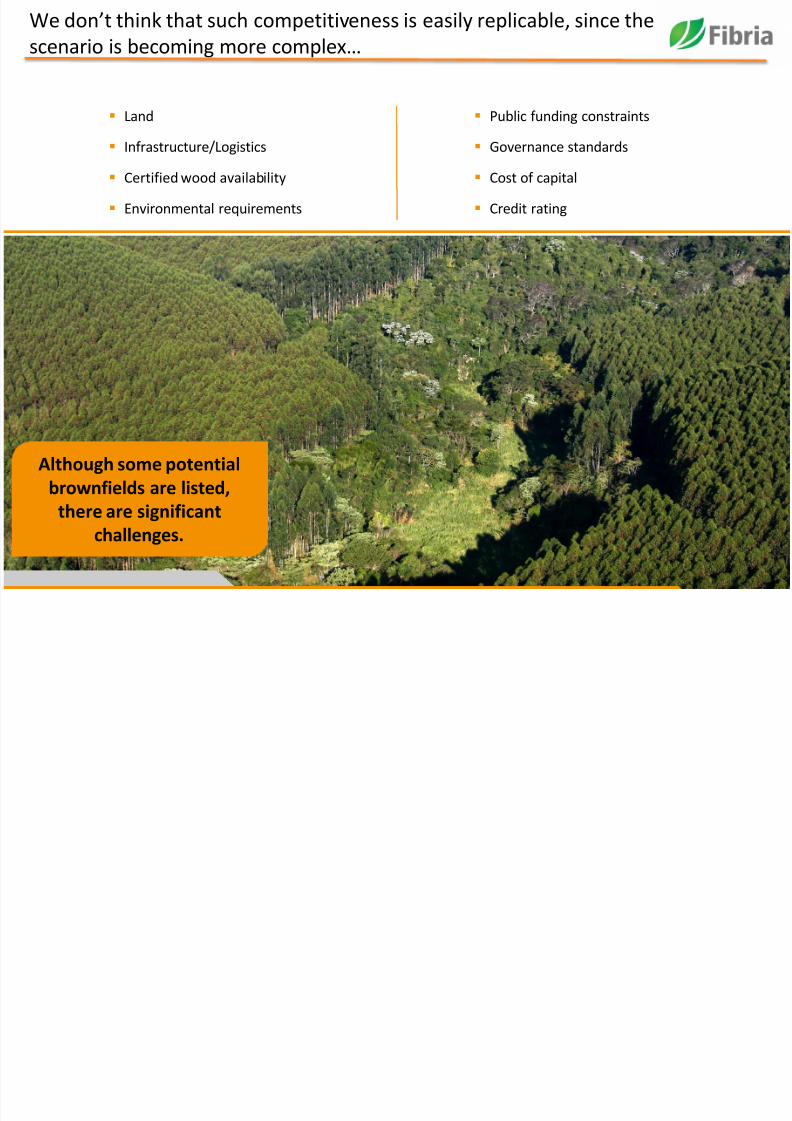
We don’t think that such competitiveness is easily replicable, since the
8/16/2019 Santander Pulp
http://slidepdf.com/reader/full/santander-pulp 50/78
Although some potentialbrownfields are listed,
there are significantchallenges.
scenario is becoming more complex…
Land
Infrastructure/Logistics
Certified wood availability
Environmental requirements
Public funding constraints
Governance standards
Cost of capital
Credit rating
8/16/2019 Santander Pulp
http://slidepdf.com/reader/full/santander-pulp 51/78
51Dividends
Policies approved by the Board of Directors
8/16/2019 Santander Pulp
http://slidepdf.com/reader/full/santander-pulp 52/78
52
►Indebtedness and Liquidity►Market Risk Management
►Risk Management
►Corporate Governance
►Related Parties Transactions
►Anti-Corruption►Information Disclosure
►Securities Trading
►Antitrust
►Genetically Modified Eucalyptus
►
Dividend Policy►Sustainability
Policies approved by the Board of Directors
Approval of Dividend Policy

8/16/2019 Santander Pulp
http://slidepdf.com/reader/full/santander-pulp 53/78
53
Approval of Dividend Policy
►Proposed dividends based on cash generation, taking into considerationthe company’s strategic planning and in line with its policies, notably the
Indebtness and Risk Management policies.
►Preserving Investment Grade.
Commitment to Corporate Governance best practices.
Extraordinary dividend if Policy criteria are met.
Dividends
8/16/2019 Santander Pulp
http://slidepdf.com/reader/full/santander-pulp 54/78
54
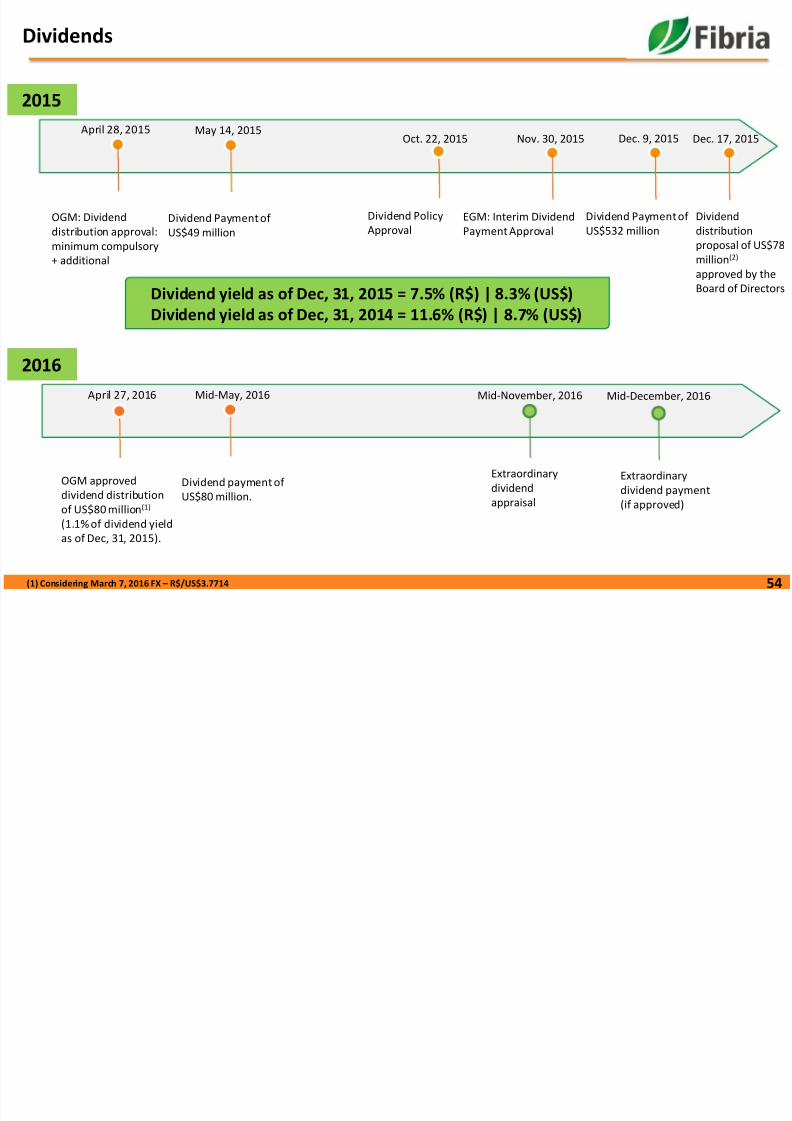
Dividends
Dividend yield as of Dec, 31, 2015 = 7.5% (R$) | 8.3% (US$)Dividend yield as of Dec, 31, 2014 = 11.6% (R$) | 8.7% (US$)
OGM: Dividend
distribution approval:
minimum compulsory
+ additional
April 28, 2015 May 14, 2015
Dividend Paymentof
US$49 million
EGM: Interim Dividend
Payment Approval
Nov. 30, 2015 Dec. 9, 2015
Dividend Paymentof
US$532 million
Oct. 22, 2015
Dividend Policy
Approval
April 27, 2016
Dec. 17, 2015
Dividend
distribution
proposal of US$78
million(2)
approved by the
Board of Directors
OGM approved
dividend distribution
of US$80 million(1)
(1.1% of dividend yield
as of Dec, 31, 2015).
Mid-May, 2016
Dividend payment of
US$80 million.
2015
2016
Mid-November, 2016
Extraordinary
dividend
appraisal
Mid-December, 2016
Extraordinary
dividend payment
(if approved)
(1) Considering March 7, 2016 FX – R$/US$3.7714
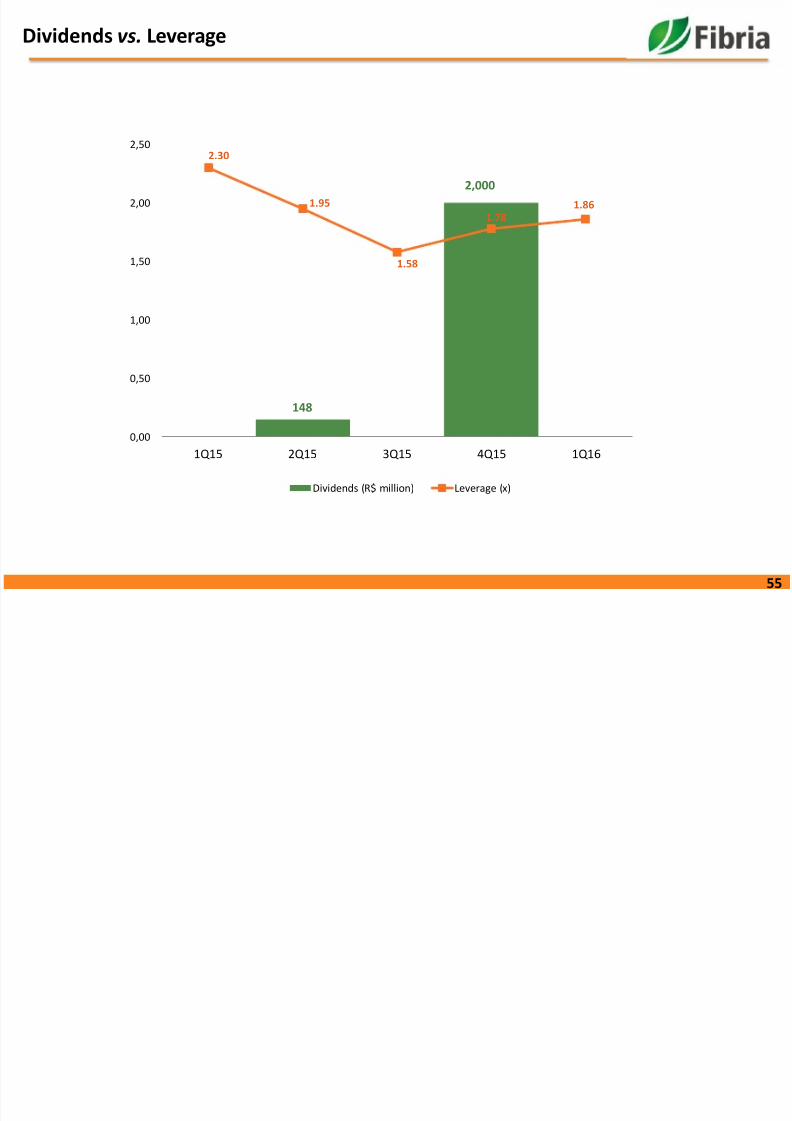
Dividends vs Leverage
8/16/2019 Santander Pulp
http://slidepdf.com/reader/full/santander-pulp 55/78
55
Dividends vs. Leverage
148
2,000
2.30
1.95
1.58
1.781.86
0,00
0,50
1,00
1,50
2,00
2,50
1Q15 2Q15 3Q15 4Q15 1Q16
Dividends (R$ million) Leverage (x)
Historical Dividend Yield(1)
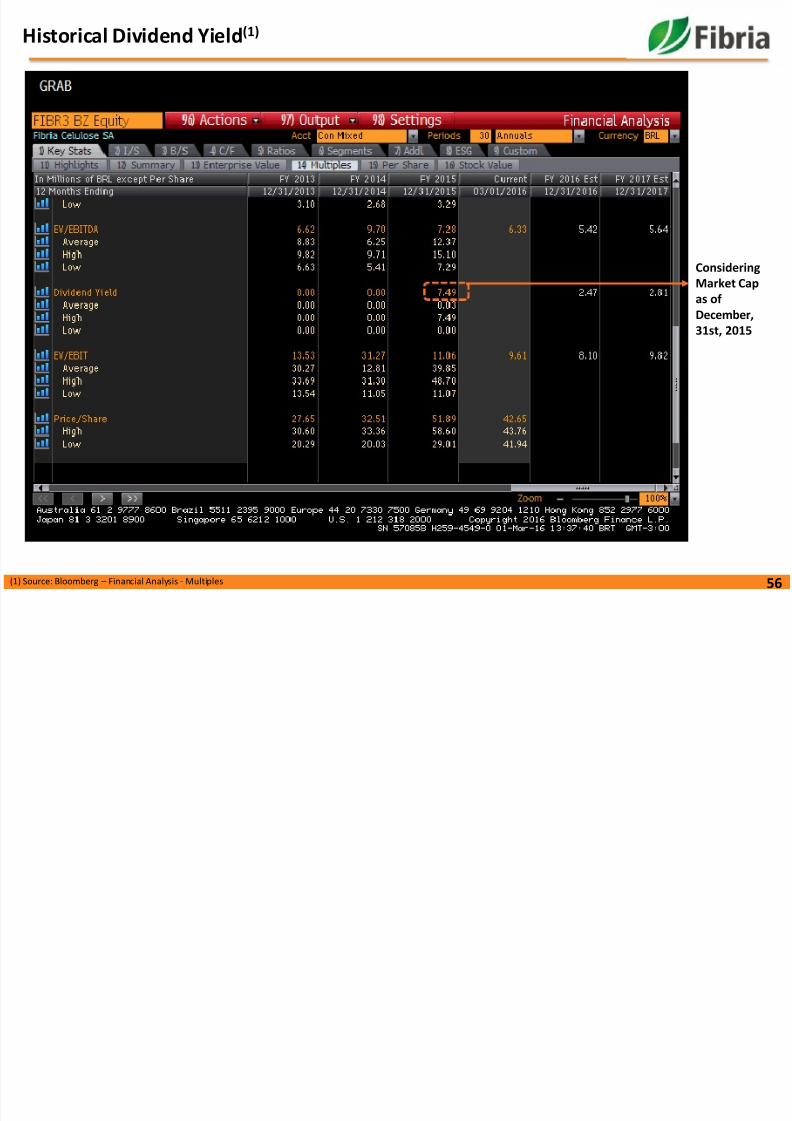
8/16/2019 Santander Pulp
http://slidepdf.com/reader/full/santander-pulp 56/78
56
Historical Dividend Yield
(1) Source: Bloomberg – Financial Analysis - Multiples
Considering
Market Capas of December,31st, 2015
Best dividend yields of 2015 among Brazilian corporate issuers
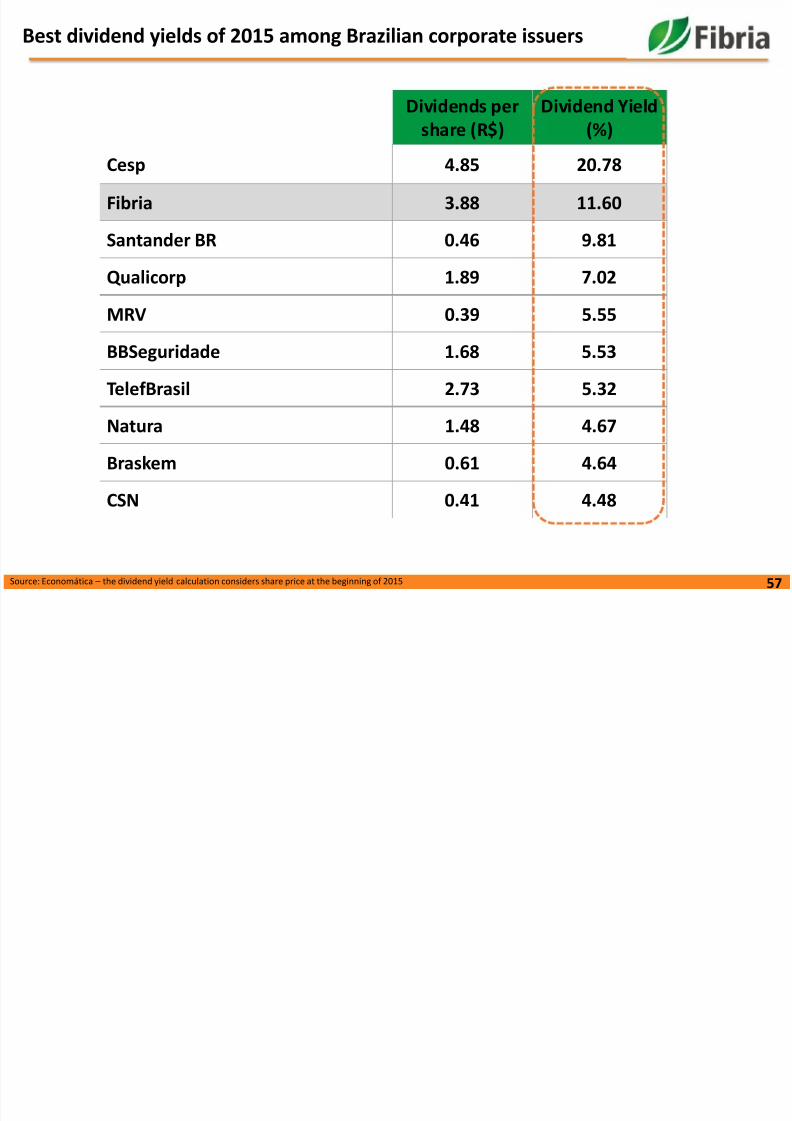
8/16/2019 Santander Pulp
http://slidepdf.com/reader/full/santander-pulp 57/78
57
Best dividend yields of 2015 among Brazilian corporate issuers
Source: Economática – the dividend yield calculation considers share price at the beginning of 2015
Dividends pershare (R$)
Dividend Yield(%)
Cesp 4.85 20.78
Fibria 3.88 11.60
Santander BR 0.46 9.81
Qualicorp 1.89 7.02MRV 0.39 5.55
BBSeguridade 1.68 5.53
TelefBrasil 2.73 5.32
Natura 1.48 4.67
Braskem 0.61 4.64
CSN 0.41 4.48

8/16/2019 Santander Pulp
http://slidepdf.com/reader/full/santander-pulp 58/78
58
Cost reduction initiatives and industry statistics
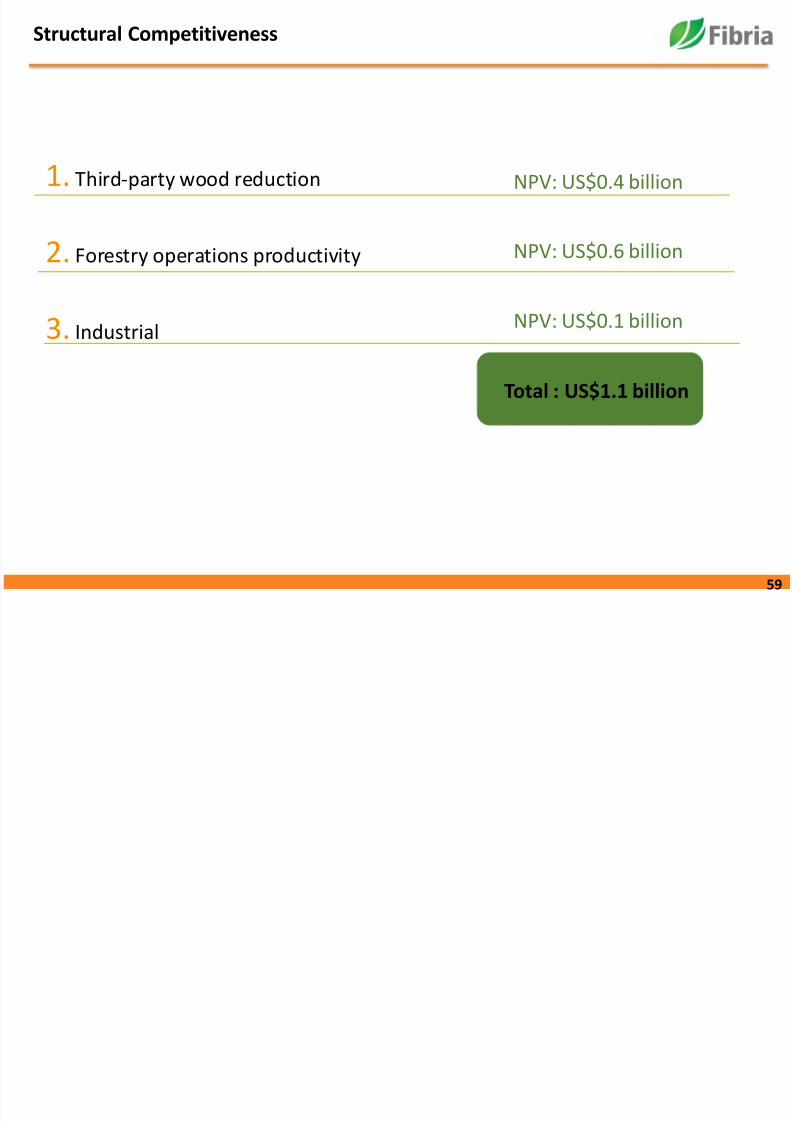
Structural Competitiveness
8/16/2019 Santander Pulp
http://slidepdf.com/reader/full/santander-pulp 59/78
59
p
1. Third-party wood reduction
2. Forestry operations productivity
3. Industrial
NPV: US$0.4 billion
NPV: US$0.6 billion
NPV: US$0.1 billion
Total : US$1.1 billion
1. Third-party wood reduction
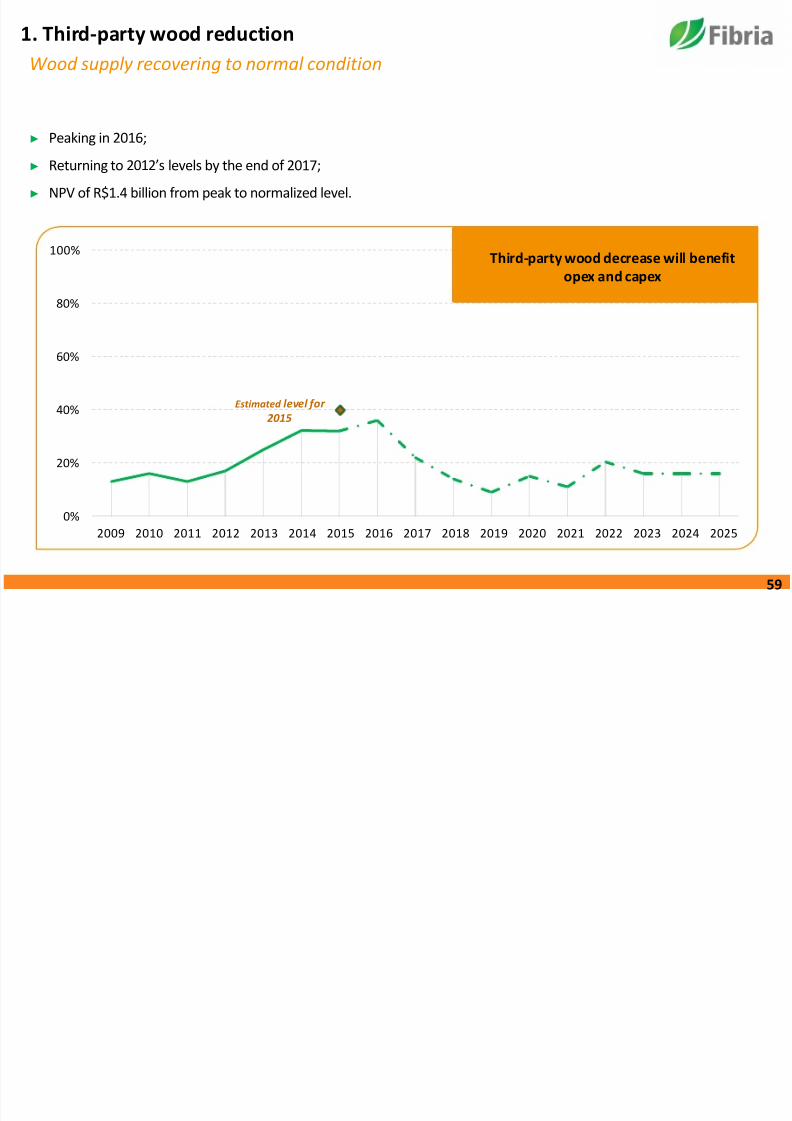
8/16/2019 Santander Pulp
http://slidepdf.com/reader/full/santander-pulp 60/78
0%
20%
40%
60%
80%
100%
2009 2010 2011 2012 2013 2014 2015 2016 2017 2018 2019 2020 2021 2022 2023 2024 2025
p y
Wood supply recovering to normal condition
► Peaking in 2016;
► Returning to 2012’s levels by the end of 2017;
► NPV of R$1.4 billion from peak to normalized level.
Estimated level for
2015
Third-party wood decrease will benefitopex and capex
59
1. Third-party wood reduction

8/16/2019 Santander Pulp
http://slidepdf.com/reader/full/santander-pulp 61/78
► Most part of the standing wood was already paid
► Despite the higher forest to mill distance, the wood from Losango is less expensive than the
available wood from around Espírito Santo and Bahia States
► Positive impact over industrial costs due to better productivity
Losango
60
2. Forestry operations productivity
8/16/2019 Santander Pulp
http://slidepdf.com/reader/full/santander-pulp 62/78
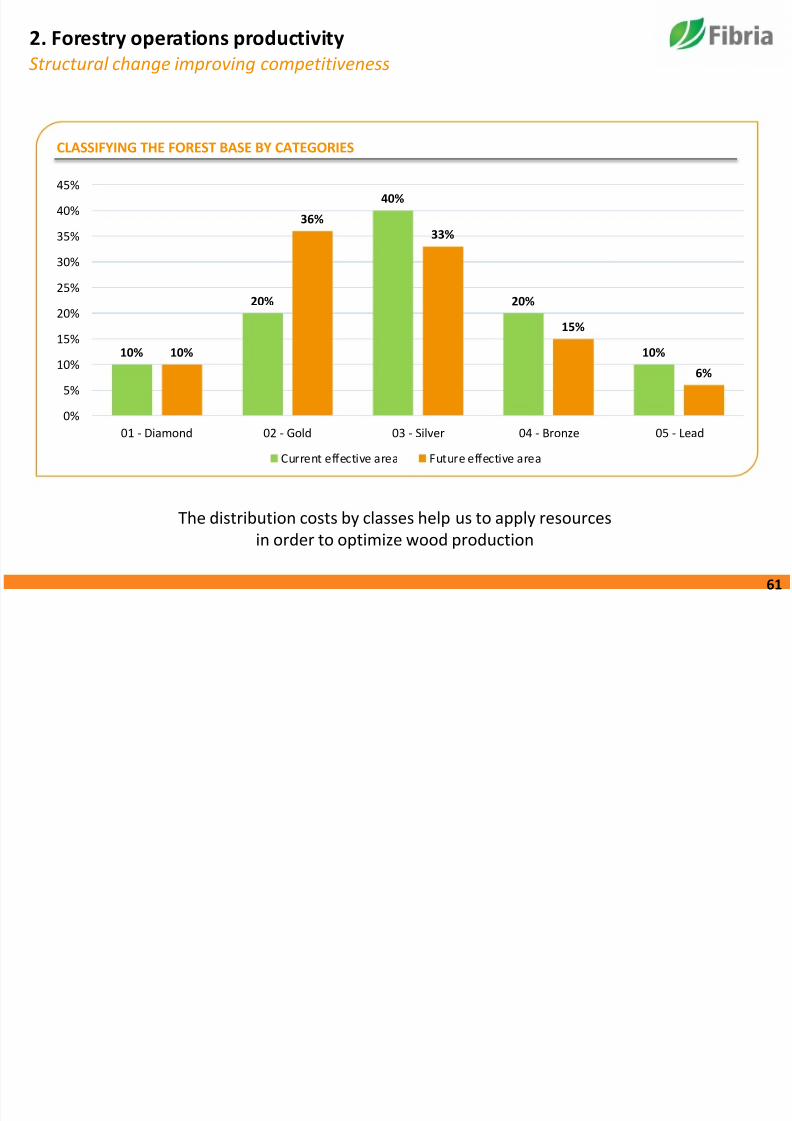
The distribution costs by classes help us to apply resources
in order to optimize wood production
10%
20%
40%
20%
10%10%
36%33%
15%
6%
0%
5%
10%
15%
20%
25%
30%
35%
40%
45%
01 - Diamond 02 - Gold 03 - Silver 04 - Bronze 05 - Lead
Current effective area Future effective area
2. Forestry operations productivity
CLASSIFYING THE FOREST BASE BY CATEGORIES
Structural change improving competitiveness
61
2. Forestry operations productivity
8/16/2019 Santander Pulp
http://slidepdf.com/reader/full/santander-pulp 63/78
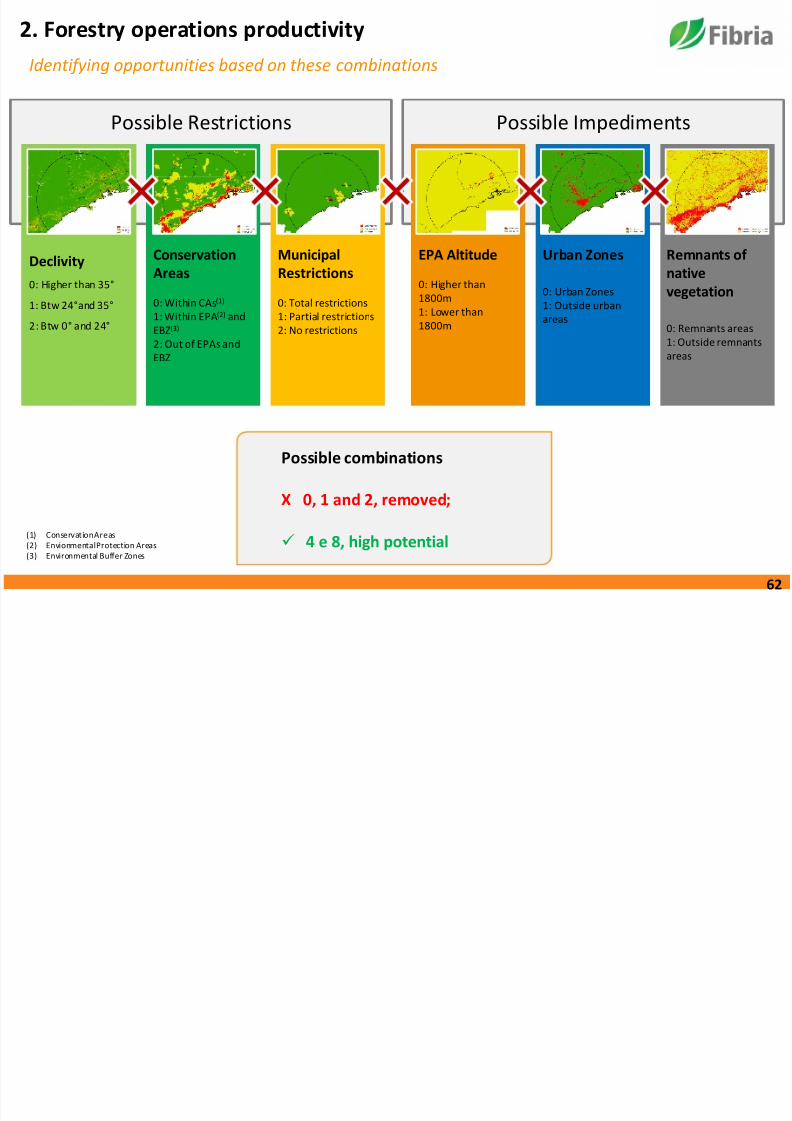
Possible Restrictions
Declivity
0: Higher than 35°
1: Btw 24°and 35°
2: Btw 0° and 24°
ConservationAreas
0: Within CAs(1)
1: Within EPA(2) and
EBZ(3)
2: Out of EPAs and
EBZ
MunicipalRestrictions
0: Total restrictions
1: Partial restrictions
2: No restrictions
EPA Altitude
0: Higher than1800m
1: Lower than
1800m
Urban Zones
0: Urban Zones
1: Outside urban
areas
Remnants of native
vegetation
0: Remnants areas
1: Outside remnants
areas
Possible Impediments
Possible combinations
X 0, 1 and 2, removed;
4 e 8, high potential(1) ConservationAreas
(2) EnvionmentalProtection Areas
(3) Environmental Buffer Zones
Identifying opportunities based on these combinations
62
2. Forestry operations productivity
8/16/2019 Santander Pulp
http://slidepdf.com/reader/full/santander-pulp 64/78
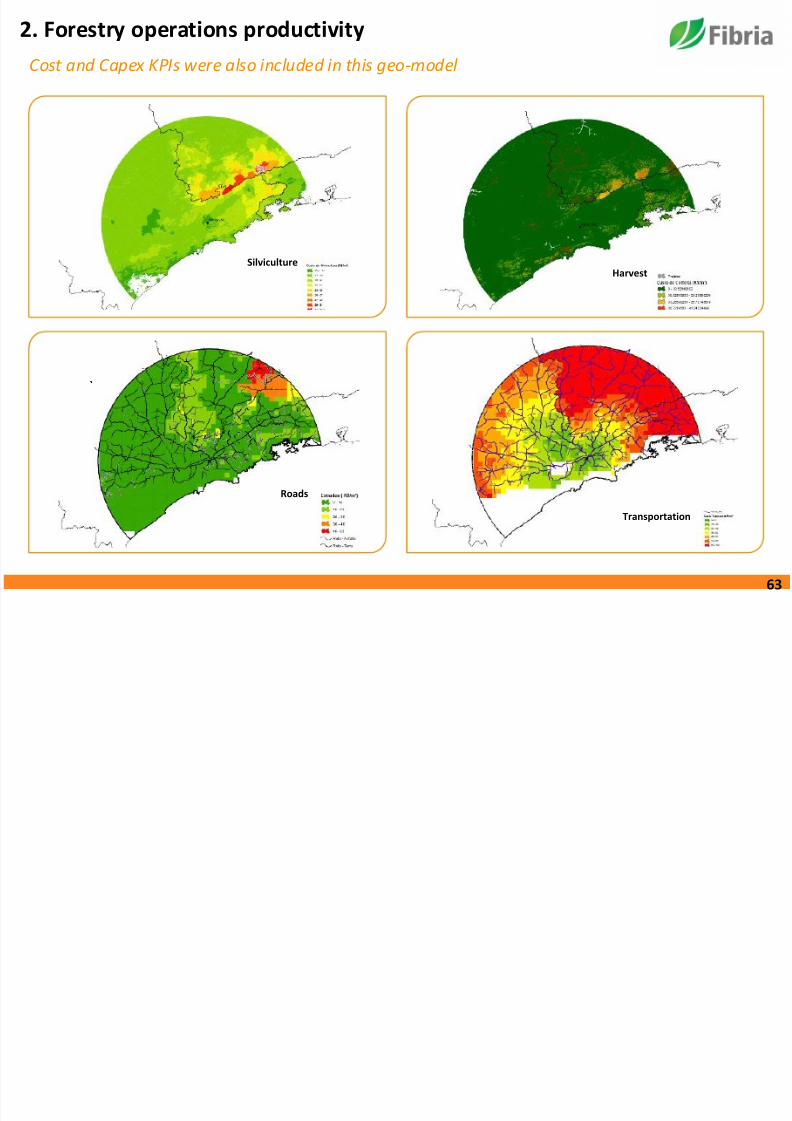
Roads
Transportation
SilvicultureHarvest
Cost and Capex KPIs were also included in this geo-model
63
2. Forestry operations productivity
8/16/2019 Santander Pulp
http://slidepdf.com/reader/full/santander-pulp 65/78
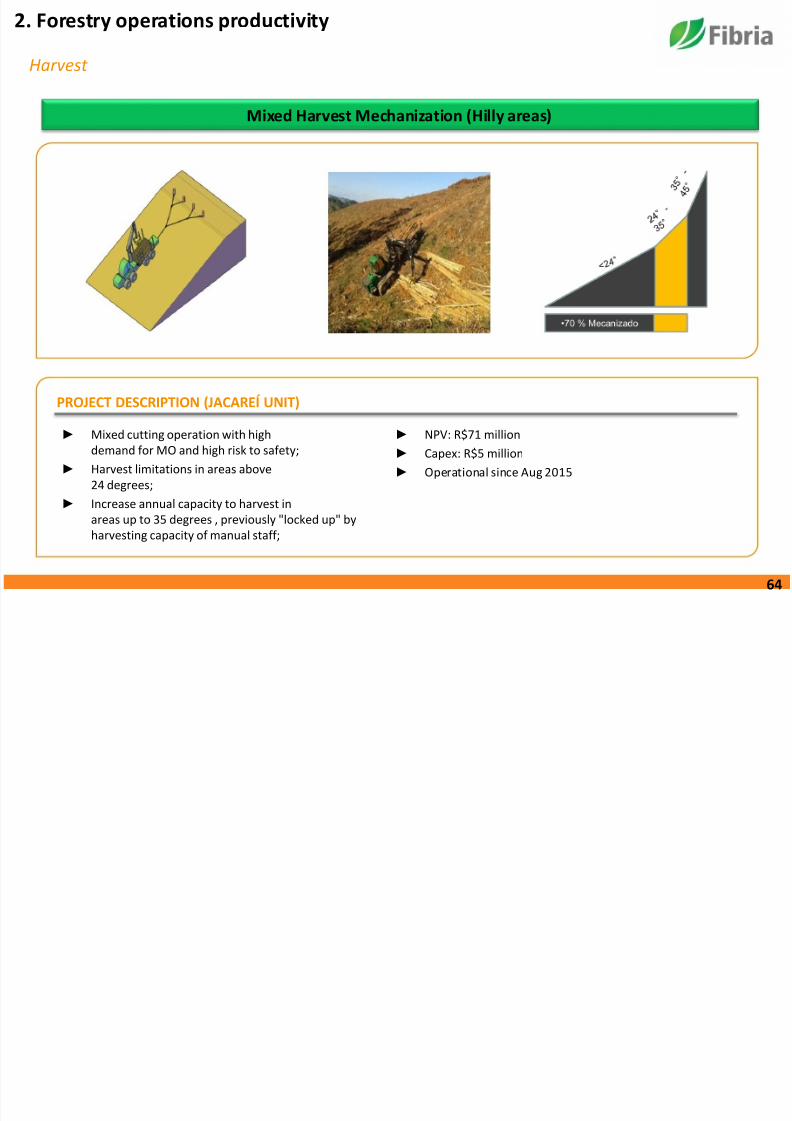
Mixed Harvest Mechanization (Hilly areas)
► Mixed cutting operation with high
demand for MO and high risk to safety;
► Harvest limitations in areas above
24 degrees;
► Increase annual capacity to harvest in
areas up to 35 degrees , previously "locked up" by
harvesting capacity of manual staff;
► NPV: R$71 million
► Capex: R$5 million
► Operational since Aug 2015
PROJECT DESCRIPTION (JACAREÍ UNIT)
Harvest
64
2. Forestry operations productivity

8/16/2019 Santander Pulp
http://slidepdf.com/reader/full/santander-pulp 66/78
PIFF
► Freight cost reduction;
► Increased load box for timber/woodchiptransport
► Use of lightweight steel;
► Operational risk reduction (flipping);
► Investment: R$33 million
► NPV: R$139 million
► Startup: 2015 / 2016
PROJECT DESCRIPTION (ARACRUZ, JACAREÍ AND TRÊS LAGOAS UNITS)
Timber transportation Woodchip transportation
Transportation
65
2. Forestry operations productivity
8/16/2019 Santander Pulp
http://slidepdf.com/reader/full/santander-pulp 67/78
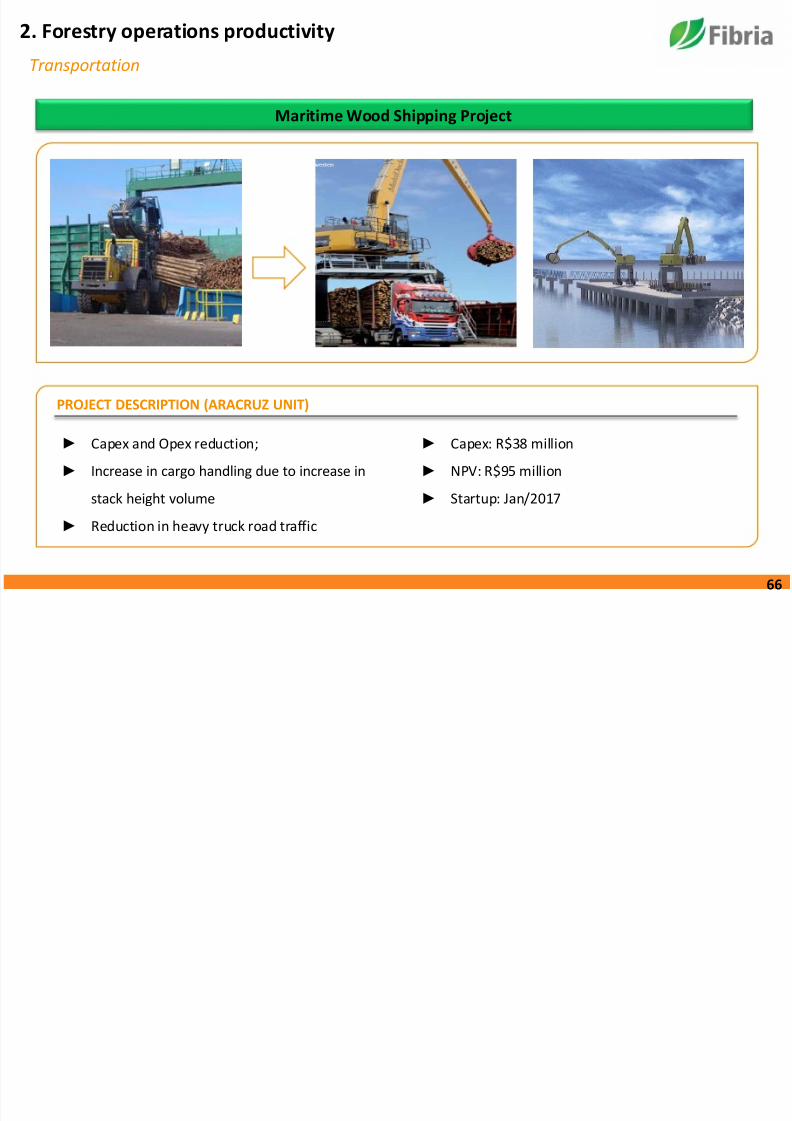
Maritime Wood Shipping Project
► Capex and Opex reduction;
► Increase in cargo handling due to increase in
stack height volume
► Reduction in heavy truck road traffic
► Capex: R$38 million
► NPV: R$95 million
► Startup: Jan/2017
PROJECT DESCRIPTION (ARACRUZ UNIT)
Transportation
66
2 St t l h i f t ti d ti it
8/16/2019 Santander Pulp
http://slidepdf.com/reader/full/santander-pulp 68/78
10%
30%
50%
70%
90%
100%
0%
20%
40%
60%
80%
100%
2015 2016 2017 2018 2019 2020
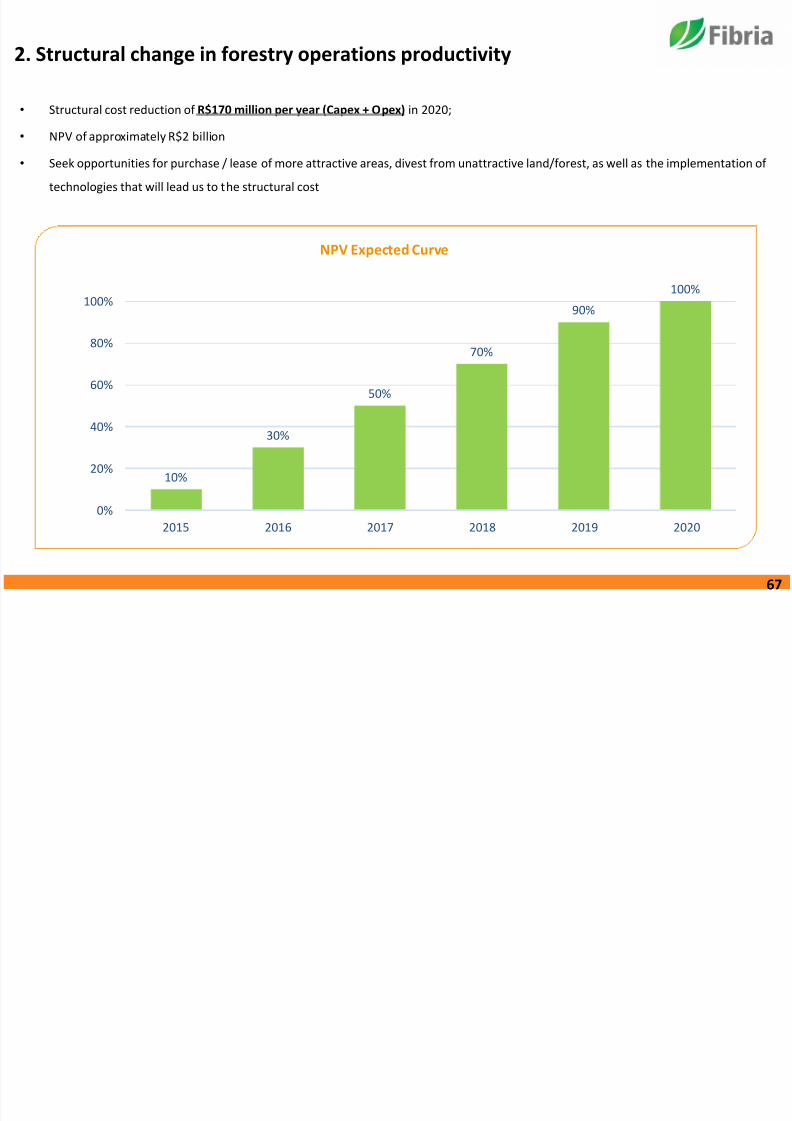
2. Structural change in forestry operations productivity
• Structural cost reduction of R$170 million per year (Capex + Opex) in 2020;
• NPV of approximately R$2 billion
• Seek opportunities for purchase / lease of more attractive areas, divest from unattractive land/forest, as well as the implementation of
technologies that will lead us to the structural cost
NPV Expected Curve
67
3 I d t i l i t d ti h d l h
8/16/2019 Santander Pulp
http://slidepdf.com/reader/full/santander-pulp 69/78
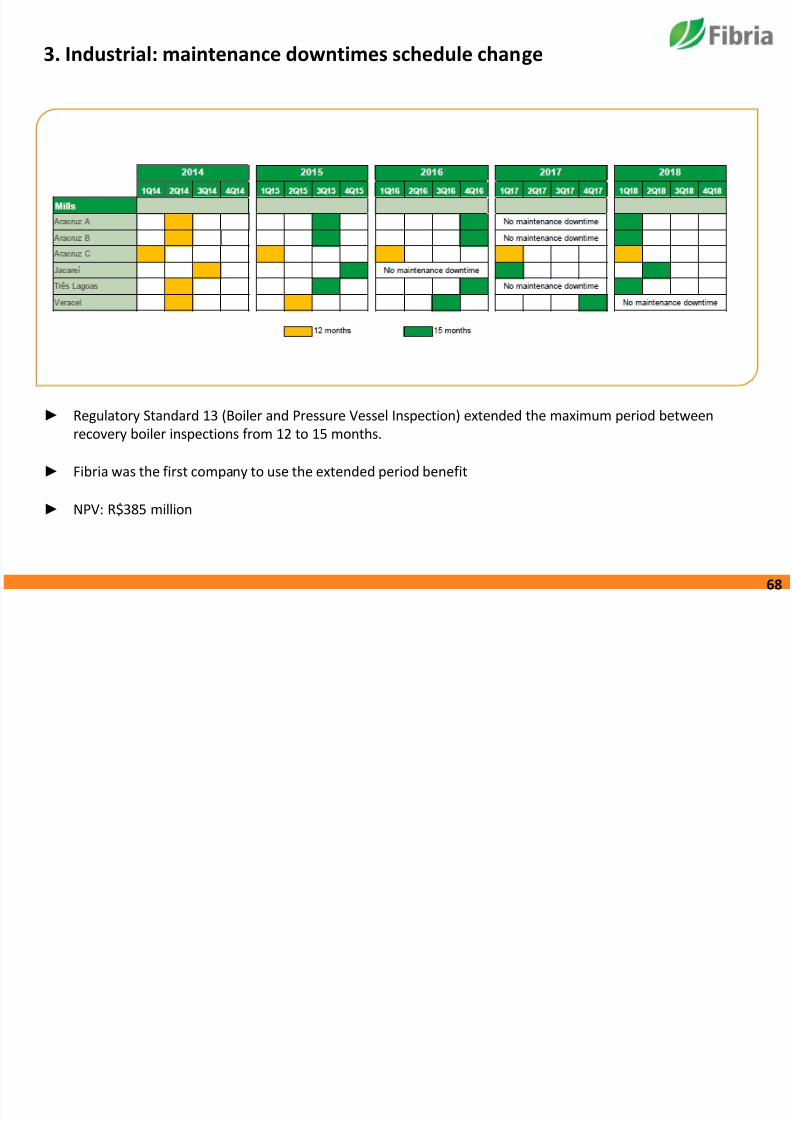
3. Industrial: maintenance downtimes schedule change
► Regulatory Standard 13 (Boiler and Pressure Vessel Inspection) extended the maximum period between
recovery boiler inspections from 12 to 15 months.
► Fibria was the first company to use the extended period benefit
► NPV: R$385 million
68
3 I d t i l Bi l i l Sl d D
8/16/2019 Santander Pulp
http://slidepdf.com/reader/full/santander-pulp 70/78
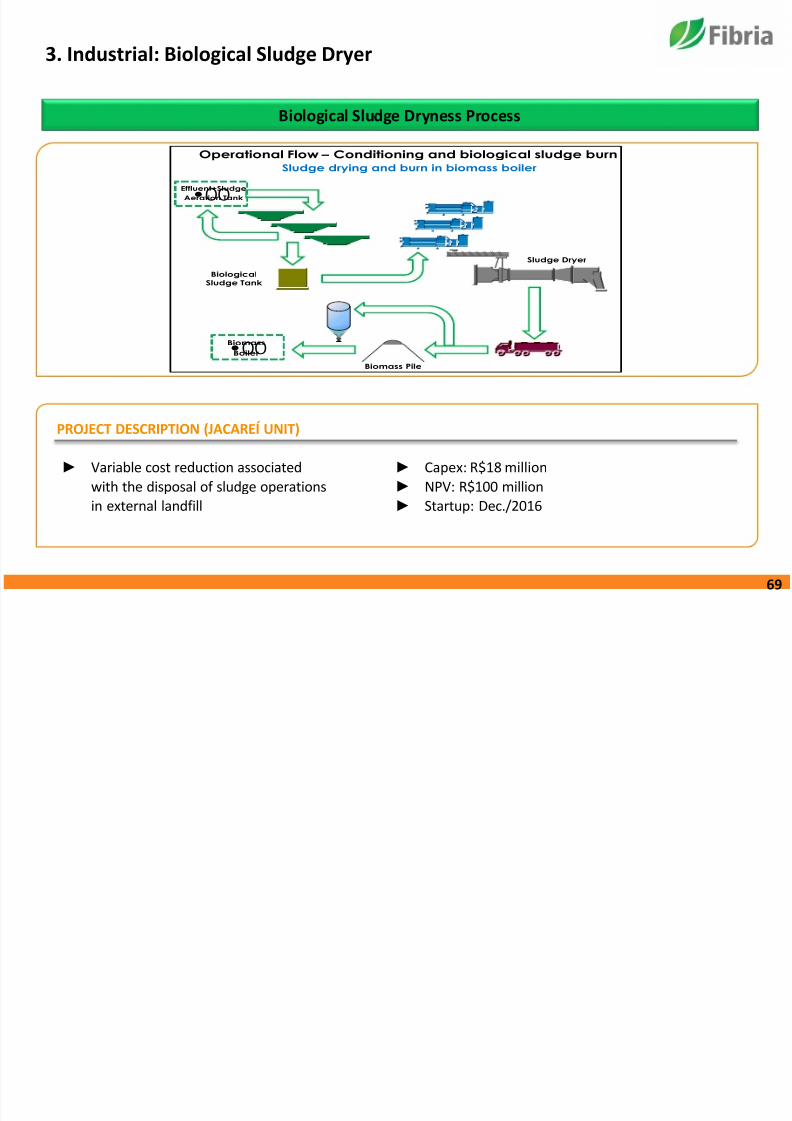
Biological Sludge Dryness Process
3. Industrial: Biological Sludge Dryer
► Variable cost reduction associated
with the disposal of sludge operations
in external landfill
► Capex: R$18 million
► NPV: R$100 million
► Startup: Dec./2016
PROJECT DESCRIPTION (JACAREÍ UNIT)
Operational Flow –
Conditioning and biological sludge burn
•00Effluent+Sludge
Aeration Tank
Biological
Sludge Tank
•00Biomass Pile
Sludge Dryer
Biomass
Boiler
Sludge drying and burn in biomass boiler
69
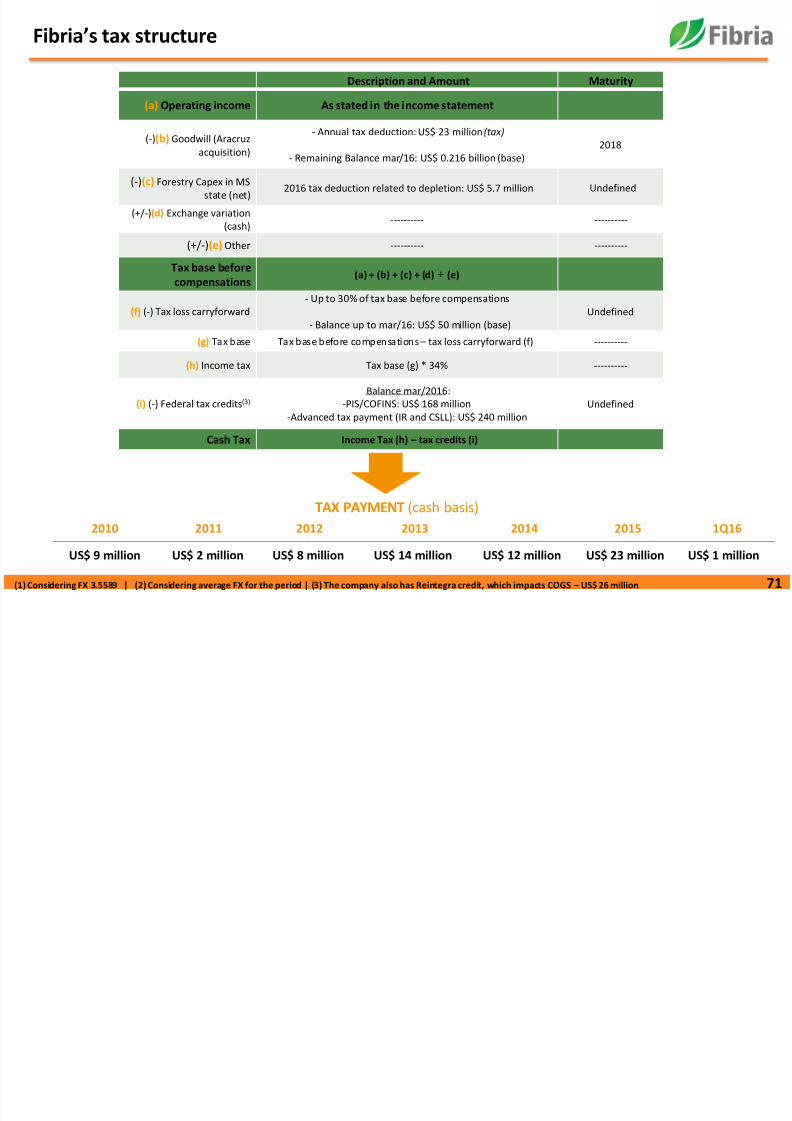
Fibria’s tax structure
8/16/2019 Santander Pulp
http://slidepdf.com/reader/full/santander-pulp 71/78
71
Description and Amount Maturity
(a) Operating income As stated in the income statement
(-)(b) Goodwill (Aracruz
acquisition)
- Annual tax deduction: US$ 23 million (tax)
- Remaining Balance mar/16: US$ 0.216 billion (base) 2018
(-)(c) Forestry Capex in MS
state (net)2016 tax deduction related to depletion: US$ 5.7 million Undefined
(+/-)(d) Exchange variation
(cash)---------- ----------
(+/-)(e) Other ---------- ----------
Tax base before
compensations
(a) + (b) + (c) + (d) + (e)
(f) (-) Tax loss carryforward
- Up to 30% of tax base before compensations
- Balance up to mar/16: US$ 50 million (base)
Undefined
(g) Tax base Tax base before compensations – tax loss carryforward (f) ----------
(h) Income tax Tax base (g) * 34% ----------
(i) (-) Federal tax credits(3)
Balance mar/2016:
-PIS/COFINS: US$ 168 million
-Advanced tax payment (IR and CSLL): US$ 240 million
Undefined
Cash Tax Income Tax (h) – tax credits (i)
2010 2011 2012 2013 2014 2015 1Q16
US$ 9 million US$ 2 million US$ 8 million US$ 14 million US$ 12 million US$ 23 million US$ 1 million
TAX PAYMENT (cash basis)
(1) Considering FX 3.5589 | (2) Considering average FX for the period | (3) The company also has Reintegra credit, which impacts COGS – US$ 26 million
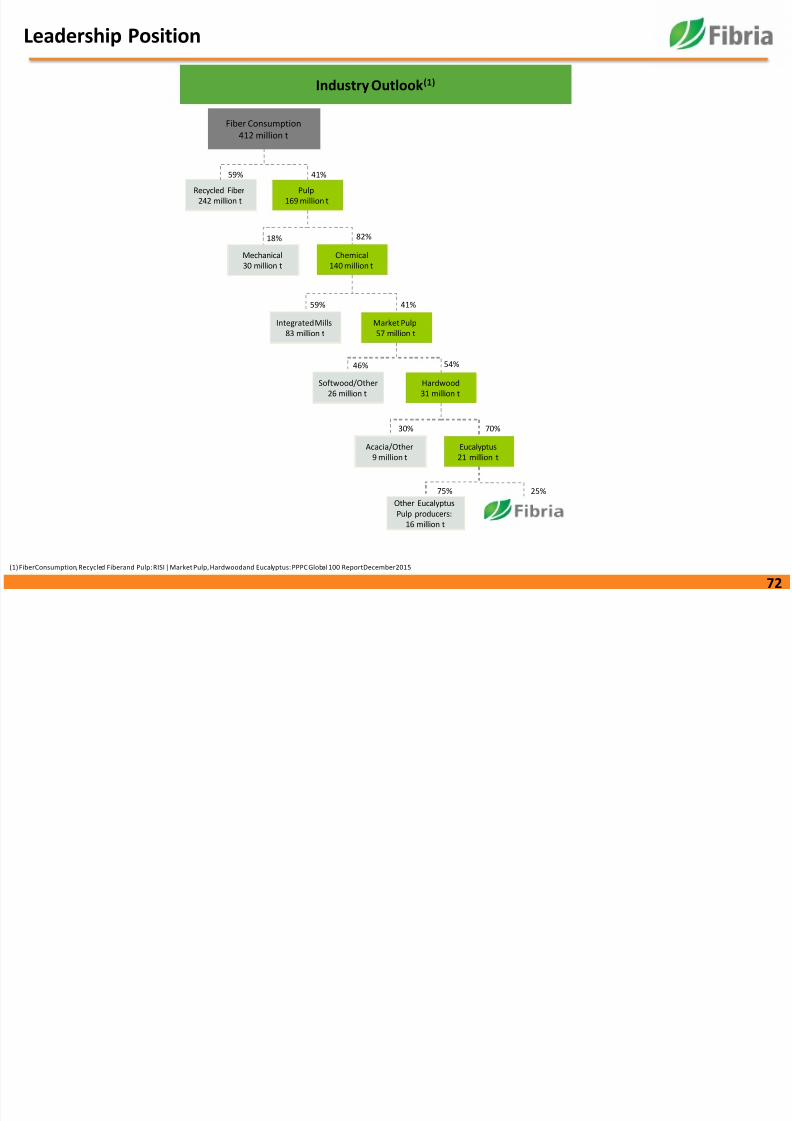
Leadership Position
8/16/2019 Santander Pulp
http://slidepdf.com/reader/full/santander-pulp 72/78
72(1) FiberConsumption, Recycled Fiberand Pulp: RISI | Market Pulp, Hardwoodand Eucalyptus: PPPC Global 100 ReportDecember2015
Recycled Fiber
242 million t
46% 54%
59%
18% 82%
59% 41%
41%
30% 70%
25%75%
Fiber Consumption
412 million t
Pulp
169 million t
Chemical
140 million t
Mechanical
30 million t
Integrated Mills
83 million t
Market Pulp
57 million t
Hardwood
31 million t
Other Eucalyptus
Pulp producers:
16 million t
Softwood/Other
26 million t
Acacia/Other
9 million t
Eucalyptus
21 million t
Industry Outlook(1)
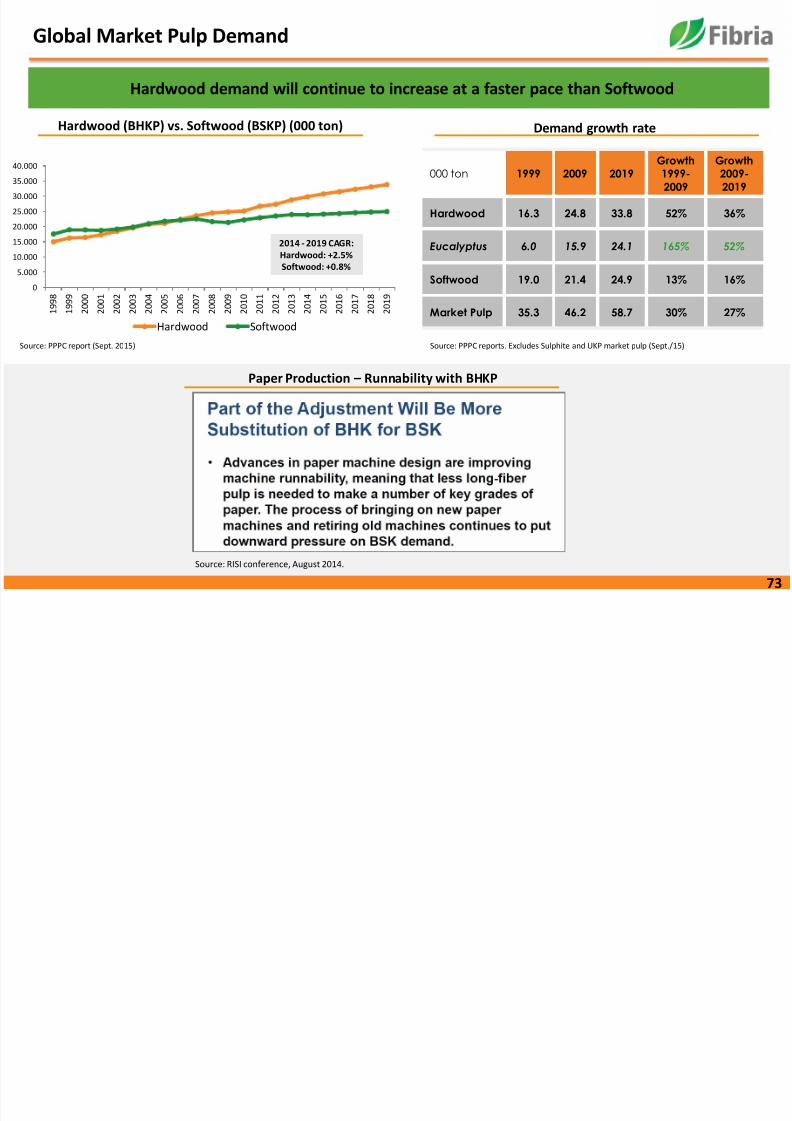
Global Market Pulp Demand
8/16/2019 Santander Pulp
http://slidepdf.com/reader/full/santander-pulp 73/78
73
Demand growth rateHardwood (BHKP) vs. Softwood (BSKP) (000 ton)
Hardwood demand will continue to increase at a faster pace than Softwood
Source: PPPC report (Sept. 2015) Source: PPPC reports. Excludes Sulphite and UKP market pulp (Sept./15)
0
5.000
10.000
15.000
20.000
25.000
30.000
35.000
40.000
1 9 9 8
1 9 9 9
2 0 0 0
2 0 0 1
2 0 0 2
2 0 0 3
2 0 0 4
2 0 0 5
2 0 0 6
2 0 0 7
2 0 0 8
2 0 0 9
2 0 1 0
2 0 1 1
2 0 1 2
2 0 1 3
2 0 1 4
2 0 1 5
2 0 1 6
2 0 1 7
2 0 1 8
2 0 1 9
Hardwood Softwood
2014 - 2019 CAGR:Hardwood: +2.5%Softwood: +0.8%
000 ton 1999 2009 2019Growth1999-2009
Growth2009-2019
Hardwood 16.3 24.8 33.8 52% 36%
Eucalyptus 6.0 15.9 24.1 165% 52%
Softwood 19.0 21.4 24.9 13% 16%
Market Pulp 35.3 46.2 58.7 30% 27%
Paper Production – Runnability with BHKP
Source: RISI conference, August 2014.
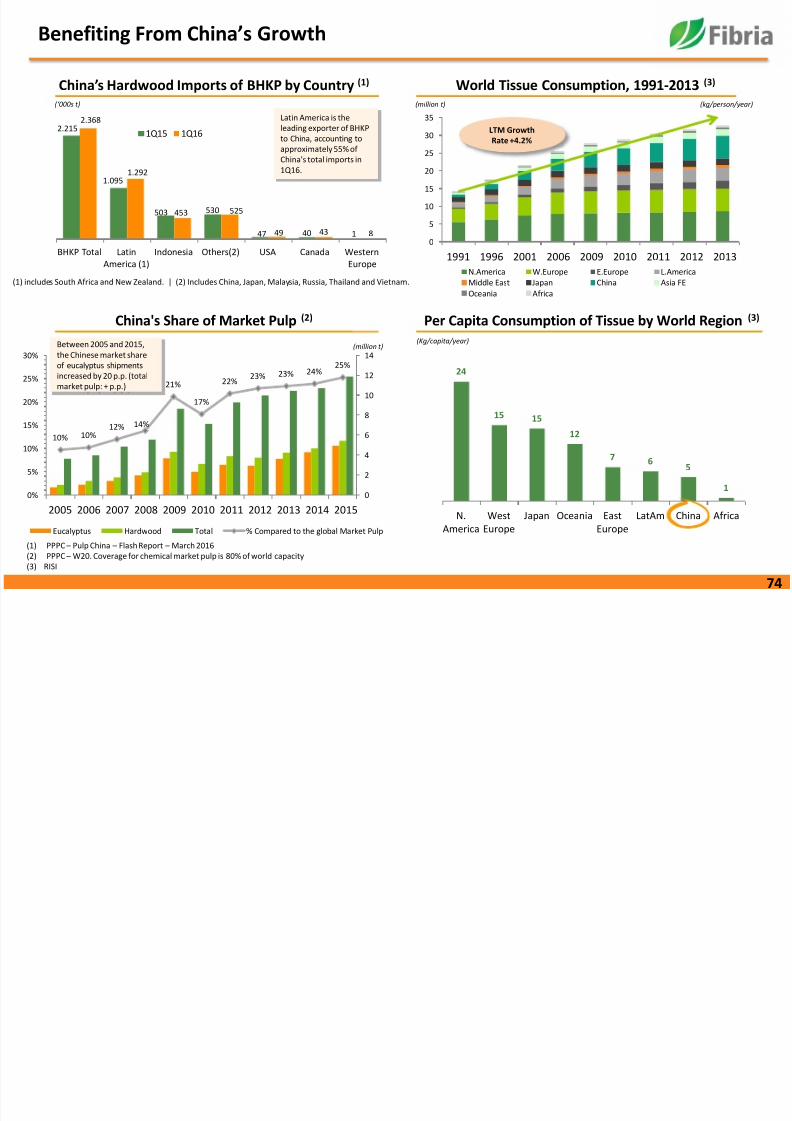
Benefiting From China’s Growth
8/16/2019 Santander Pulp
http://slidepdf.com/reader/full/santander-pulp 74/78
74
World Tissue Consumption, 1991-2013 (3)
Per Capita Consumption of Tissue by World Region (3)China's Share of Market Pulp (2)
24
15 15
12
7 65
1
N.
America
West
Europe
Japan Oceania East
Europe
LatAm China Africa
10% 10%12% 14%
21%
17%
22%23% 23% 24%
25%
0
2
4
6
8
10
12
14
0%
5%
10%
15%
20%
25%
30%
2005 2006 2007 2008 2009 2010 2011 2012 2013 2014 2015
Eucalyptus Hardwood Total % Compared to the global Market Pulp
(Kg/capita/year)
(million t) (kg/person/year)
Between 2005 and 2015,
the Chinese market share
of eucalyptus shipments
increased by 20 p.p. (total
market pulp: + p.p.)
0
5
10
15
20
25
30
35
1991 1996 2001 2006 2009 2010 2011 2012 2013
N.America W.Europe E.Europe L.America
Middle East Japan China Asia FE
Oceania Africa
LTM GrowthRate +4.2%
(1) PPPC – Pulp China – Flash Report – March 2016
(2) PPPC – W20. Coverage for chemical market pulp is 80% of world capacity
(3) RISI
(million t)
2.215
1.095
503 530
47 40 1
2.368
1.292
453 525
49 43 8
BHKP Total Latin
America (1)
Indonesia Others(2) USA Canada Western
Europe
1Q15 1Q16
Latin America is the
leading exporter of BHKP
to China, accounting to
approximately 55% ofChina's total imports in
1Q16.
(‘000s t)
(1) includes South Africa and New Zealand. | (2) Includes China, Japan, Malaysia, Russia, Thailand and Vietnam.
China’s Hardwood Imports of BHKP by Country (1)
Growth rate Chinese GDP vs. Eucalyptus Shipments to China
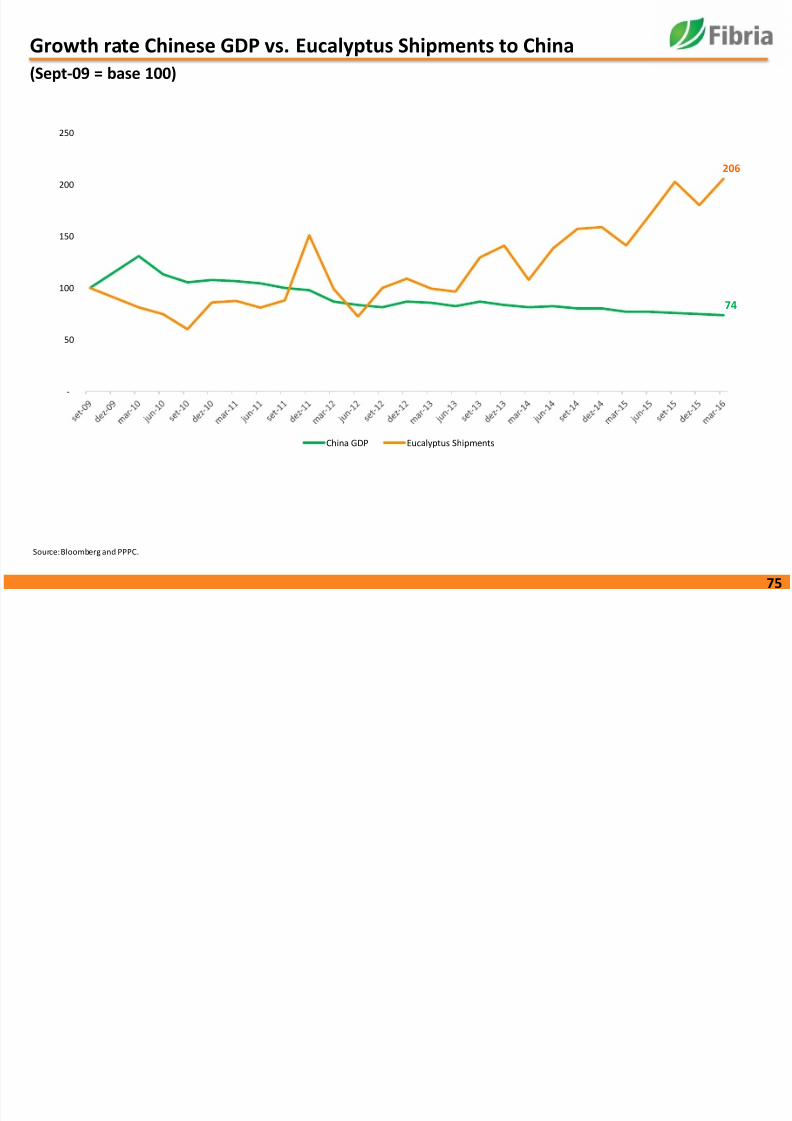
8/16/2019 Santander Pulp
http://slidepdf.com/reader/full/santander-pulp 75/78
75
yp p(Sept-09 = base 100)
Source: Bloomberg and PPPC.
74
206
-
50
100
150
200
250
China GDP Eucalyptus Shipments
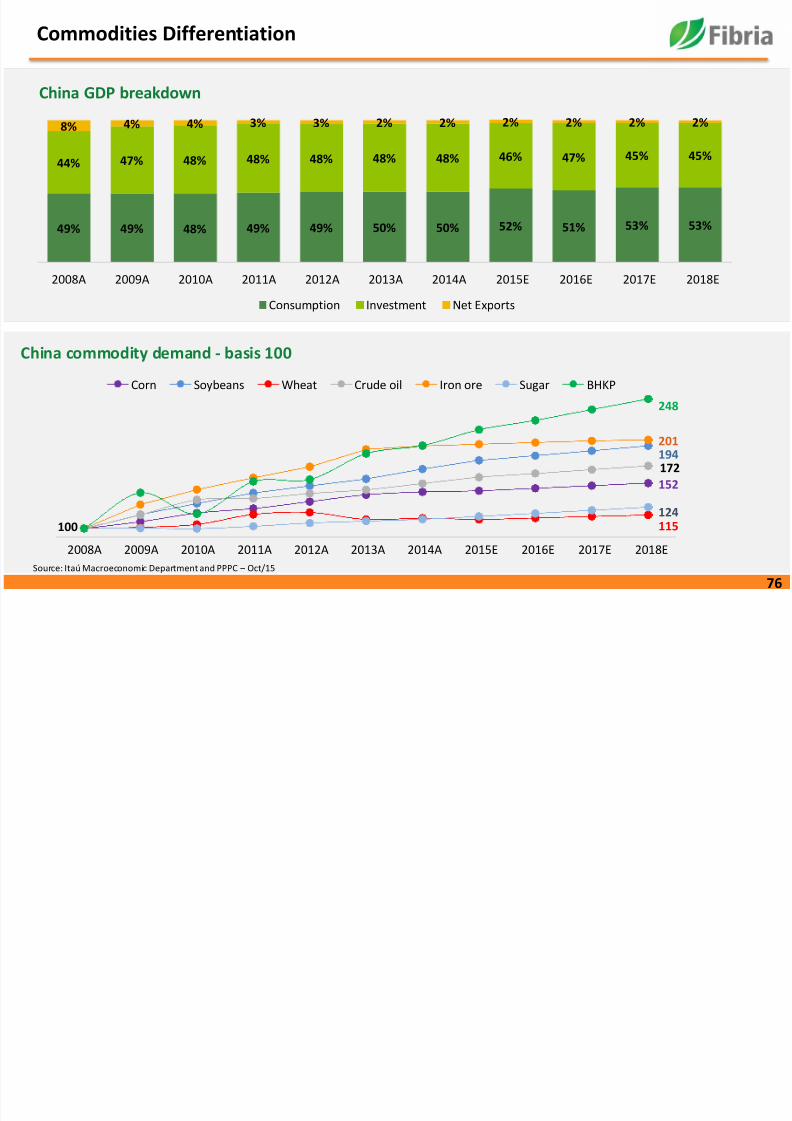
Commodities Differentiation
8/16/2019 Santander Pulp
http://slidepdf.com/reader/full/santander-pulp 76/78
76
China GDP breakdown
China commodity demand - basis 100
49% 49% 48% 49% 49% 50% 50% 52% 51% 53% 53%
44% 47% 48% 48% 48% 48% 48% 46% 47% 45% 45%
8% 4% 4% 3% 3% 2% 2% 2% 2% 2% 2%
2008A 2009A 2010A 2011A 2012A 2013A 2014A 2015E 2016E 2017E 2018E
Consumption Investment Net Exports
2008A 2009A 2010A 2011A 2012A 2013A 2014A 2015E 2016E 2017E 2018E
Corn Soybeans Wheat Crude oil Iron ore Sugar BHKP
100
248
201194172
152
124115
Source: Itaú Macroeconomic Department and PPPC – Oct/15
Global Paper Consumption
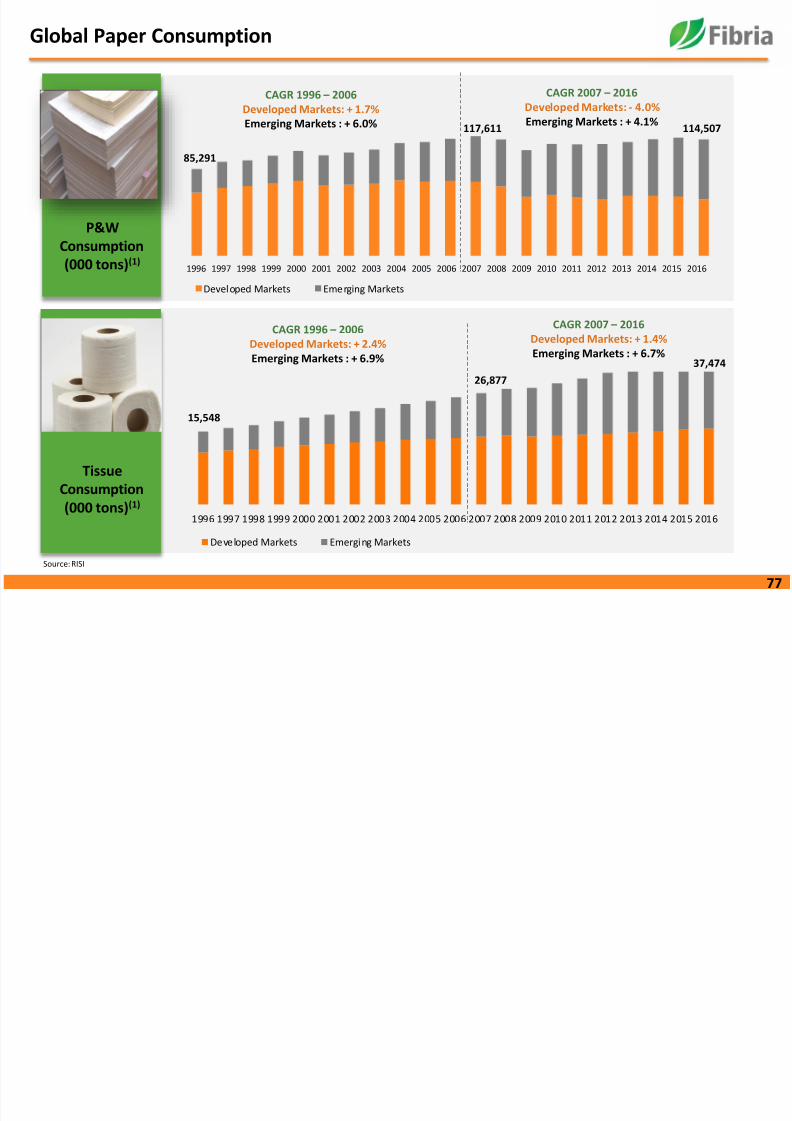
8/16/2019 Santander Pulp
http://slidepdf.com/reader/full/santander-pulp 77/78
77
1996 1997 1998 1999 2000 2001 2002 2003 2004 2005 2006 2007 2008 2009 2010 2011 2012 2013 2014 2015 2016
Developed Markets Emerging Markets
1996 1997 1998 1999 2000 2001 2002 2003 2004 2005 2006 2007 2008 2009 2010 2011 2012 2013 2014 2015 2016
Developed Markets Emerging Markets
CAGR 1996 – 2006Developed Markets: + 1.7%Emerging Markets : + 6.0%
85,291
117,611
15,548
37,474
P&WConsumption(000 tons)(1)
TissueConsumption(000 tons)(1)
114,507
CAGR 2007 – 2016Developed Markets: - 4.0%Emerging Markets : + 4.1%
CAGR 1996 – 2006Developed Markets: + 2.4%Emerging Markets : + 6.9%
CAGR 2007 – 2016Developed Markets: + 1.4%Emerging Markets : + 6.7%
26,877
Source: RISI
Global Market BEKP Demand
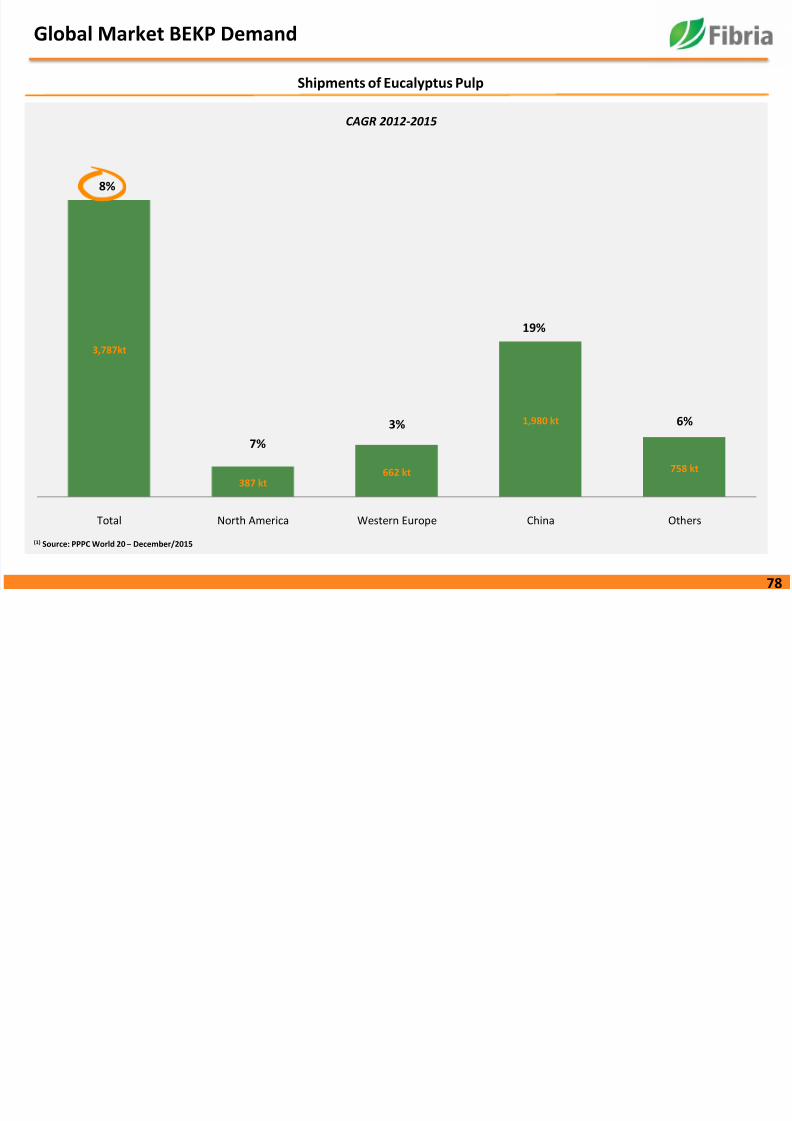
8/16/2019 Santander Pulp
http://slidepdf.com/reader/full/santander-pulp 78/78
Shipments of Eucalyptus Pulp
(1) Source: PPPC World 20 – January/2015
CAGR 2012-2015
3,787kt
387 kt662 kt
1,980 kt
758 kt
8%
7%3%
19%
6%
Total North America Western Europe China Others