Embed Size (px)
Citation preview
11.30.2016
SANTANDER CONSUMER USA HOLDINGS INC.J.P. Morgan FinTech & Specialty Finance Conference
2IMPORTANT INFORMATION
Forward-Looking StatementsThis presentation contains forward-looking statements within the meaning of the Private Securities Litigation Reform Act of 1995. Any statements about our
expectations, beliefs, plans, predictions, forecasts, objectives, assumptions, or future events or performance are not historical facts and may be forward-looking.
These statements are often, but not always, made through the use of words or phrases such as anticipates, believes, can, could, may, predicts, potential, should,
will, estimates, plans, projects, continuing, ongoing, expects, intends, and similar words or phrases. Although we believe that the expectations reflected in these
forward-looking statements are reasonable, these statements are not guarantees of future performance and involve risks and uncertainties that are subject to
change based on various important factors, some of which are beyond our control. For additional discussion of these risks, refer to the section entitled Risk Factors
and elsewhere in our Annual Report on Form 10-K and our Quarterly Reports on Form 10-Q filed by us with the U.S. Securities and Exchange Commission (SEC).
Among the factors that could cause the forward-looking statements in this press release and/or our financial performance to differ materially from that suggested
by the forward-looking statements are: (a) the inherent limitations in internal controls over financial reporting; (b) our ability to remediate any material
weaknesses in internal controls over financial reporting completely and in a timely manner; (c) continually changing federal, state, and local laws and regulations
could materially adversely affect our business; (d) adverse economic conditions in the United States and worldwide may negatively impact our results; (e) our
business could suffer if our access to funding is reduced; (f) significant risks we face implementing our growth strategy, some of which are outside our control; (g)
unexpected costs and delays in connection with exiting our personal lending business; (h) our agreement with Fiat Chrysler Automobiles US LLC may not result in
currently anticipated levels of growth and is subject to certain performance conditions that could result in termination of the agreement; (i) our business could
suffer if we are unsuccessful in developing and maintaining relationships with automobile dealerships; (j) our financial condition, liquidity, and results of operations
depend on the credit performance of our loans; (k) loss of our key management or other personnel, or an inability to attract such management and personnel; (l)
certain regulations, including but not limited to oversight by the Office of the Comptroller of the Currency, the Consumer Financial Protection Bureau, the
European Central Bank, the Federal Reserve, and state regulators whose oversight and regulation may limit certain of our activities, including the timing and
amount of dividends and other limitations on our business; and (m) future changes in our relationship with Banco Santander that could adversely affect our
operations. If one or more of the factors affecting our forward-looking information and statements proves incorrect, our actual results, performance or
achievements could differ materially from those expressed in, or implied by, forward-looking information and statements. Therefore, we caution not to place
undue reliance on any forward-looking information or statements. The effect of these factors is difficult to predict. Factors other than these also could adversely
affect our results, and the reader should not consider these factors to be a complete set of all potential risks or uncertainties. New factors emerge from time to
time, and management cannot assess the impact of any such factor on our business or the extent to which any factor, or combination of factors, may cause results
to differ materially from those contained in any forward-looking statement. Any forward-looking statements only speak as of the date of this document, and we
undertake no obligation to update any forward-looking information or statements, whether written or oral, to reflect any change, except as required by law. All
forward-looking statements attributable to us are expressly qualified by these cautionary statements.
3SPEAKERS
Jason KulasPresident and Chief Executive Officer
Mr. Kulas has served as the company's Chief Executive Officer and a member of
our Board of Directors since July 2015. He was named President in 2013 and was
the company’s Chief Financial Officer from 2007 to 2015. He also served on our
Board of Directors from 2007 to 2012. Mr. Kulas joined the company after serving
as a Managing Director in investment banking for J.P. Morgan Securities Inc.,
where he was employed from 1995 to 2007. In addition to his current service on
our Board, he serves as a director of the nonprofit Santander Consumer USA, Inc.
Foundation and for Santander Consumer International Puerto Rico LLC. Mr. Kulas
received his Bachelor’s Degree from Southern Methodist University and his MBA
from Texas Christian University.

4
VEHICLE FINANCE
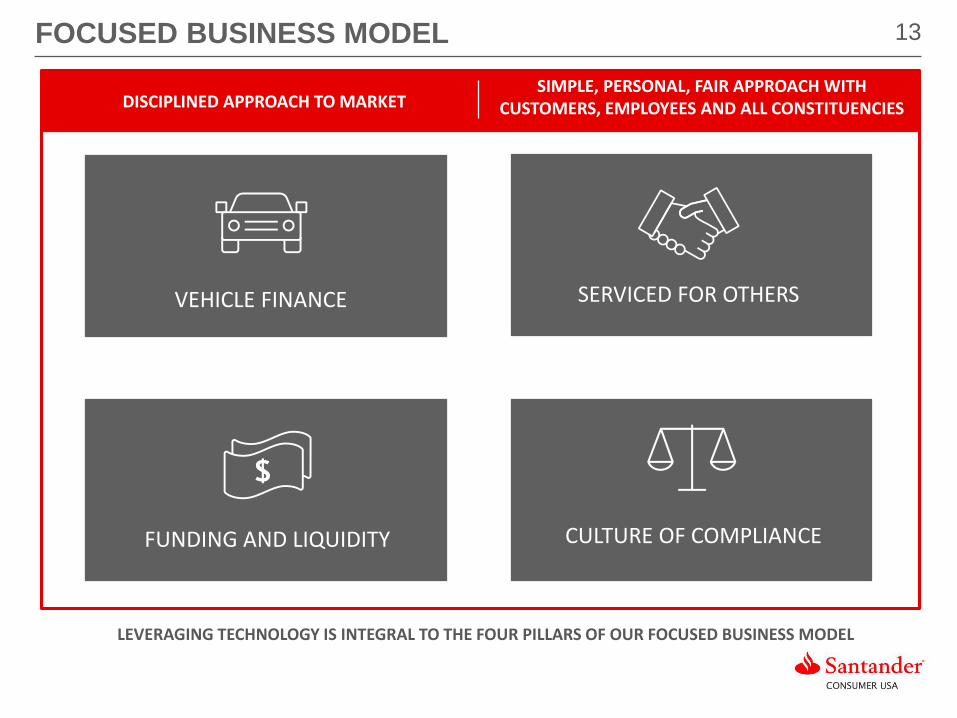
LEVERAGING TECHNOLOGY IS INTEGRAL TO THE FOUR PILLARS OF OUR FOCUSED BUSINESS MODEL
FOCUSED BUSINESS MODEL
DISCIPLINED APPROACH TO MARKETSIMPLE, PERSONAL, FAIR APPROACH WITH
CUSTOMERS, EMPLOYEES AND ALL CONSTITUENCIES
SERVICED FOR OTHERS
FUNDING AND LIQUIDITY CULTURE OF COMPLIANCE
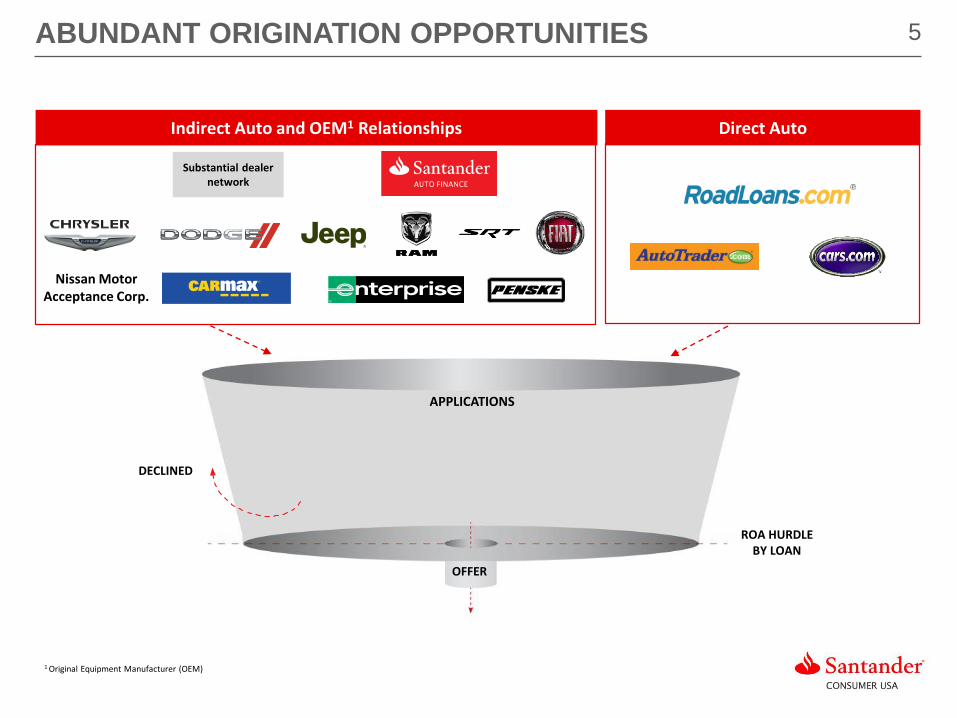
5ABUNDANT ORIGINATION OPPORTUNITIES
APPLICATIONS
ROA HURDLEBY LOAN
DECLINED
OFFER
Substantial dealer network
1 Original Equipment Manufacturer (OEM)
Direct AutoIndirect Auto and OEM1 Relationships
Nissan Motor Acceptance Corp.
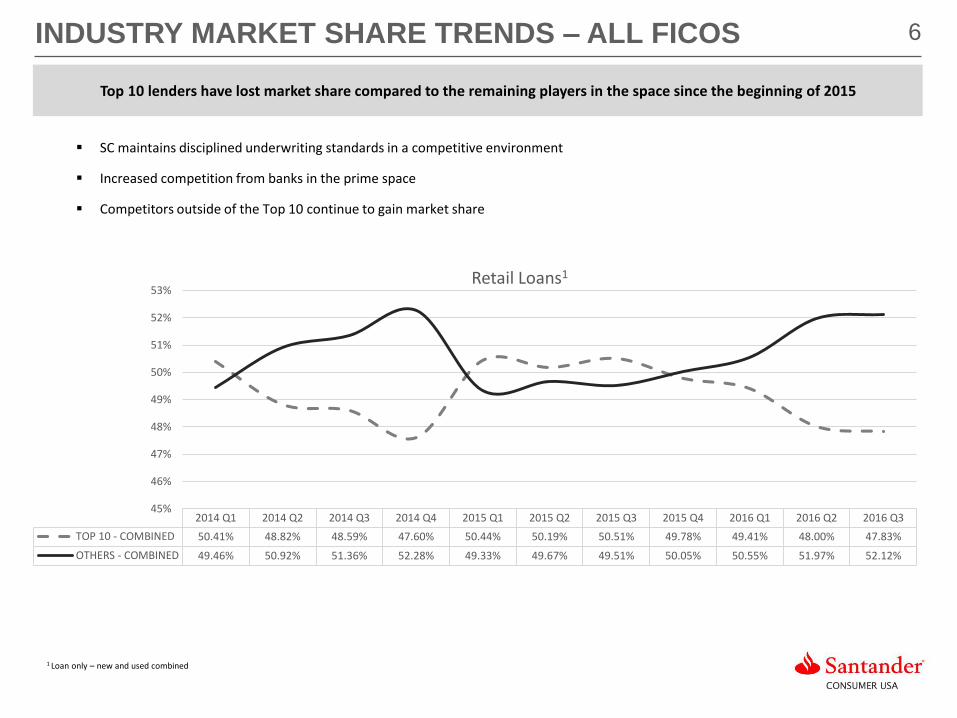
6INDUSTRY MARKET SHARE TRENDS – ALL FICOS
2014 Q1 2014 Q2 2014 Q3 2014 Q4 2015 Q1 2015 Q2 2015 Q3 2015 Q4 2016 Q1 2016 Q2 2016 Q3
TOP 10 - COMBINED 50.41% 48.82% 48.59% 47.60% 50.44% 50.19% 50.51% 49.78% 49.41% 48.00% 47.83%
OTHERS - COMBINED 49.46% 50.92% 51.36% 52.28% 49.33% 49.67% 49.51% 50.05% 50.55% 51.97% 52.12%
45%
46%
47%
48%
49%
50%
51%
52%
53%Retail Loans1
Top 10 lenders have lost market share compared to the remaining players in the space since the beginning of 2015
SC maintains disciplined underwriting standards in a competitive environment
Increased competition from banks in the prime space
Competitors outside of the Top 10 continue to gain market share
1 Loan only – new and used combined
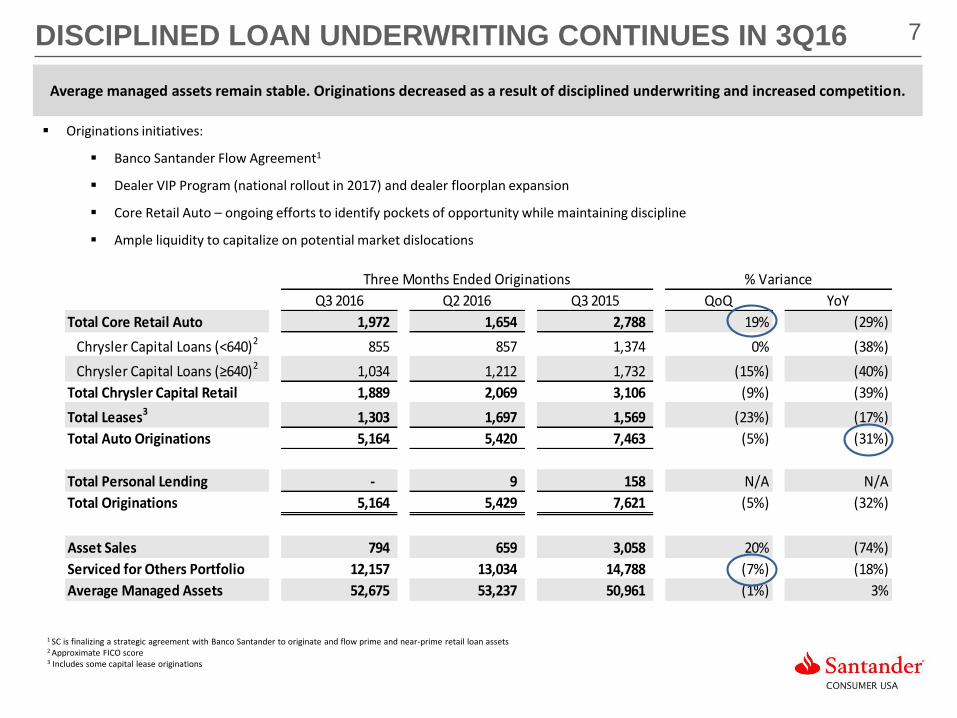
7DISCIPLINED LOAN UNDERWRITING CONTINUES IN 3Q16
1 SC is finalizing a strategic agreement with Banco Santander to originate and flow prime and near-prime retail loan assets2 Approximate FICO score3 Includes some capital lease originations
Average managed assets remain stable. Originations decreased as a result of disciplined underwriting and increased competition.
Q3 2016 Q2 2016 Q3 2015 QoQ YoY
Total Core Retail Auto 1,972 1,654 2,788 19% (29%)
Chrysler Capital Loans (<640)2 855 857 1,374 0% (38%)
Chrysler Capital Loans (≥640)2 1,034 1,212 1,732 (15%) (40%)
Total Chrysler Capital Retail 1,889 2,069 3,106 (9%) (39%)
Total Leases3 1,303 1,697 1,569 (23%) (17%)
Total Auto Originations 5,164 5,420 7,463 (5%) (31%)
Total Personal Lending - 9 158 N/A N/A
Total Originations 5,164 5,429 7,621 (5%) (32%)
Asset Sales 794 659 3,058 20% (74%)
Serviced for Others Portfolio 12,157 13,034 14,788 (7%) (18%)
Average Managed Assets 52,675 53,237 50,961 (1%) 3%
Three Months Ended Originations % Variance
Originations initiatives:
Banco Santander Flow Agreement1
Dealer VIP Program (national rollout in 2017) and dealer floorplan expansion
Core Retail Auto – ongoing efforts to identify pockets of opportunity while maintaining discipline
Ample liquidity to capitalize on potential market dislocations

8STRATEGIC APPROACH TO PORTFOLIO OPTIMIZATION
SELL
FICO Ranges (Approx.) <640 (Nonprime) 640-720 (Near-Prime) 720+ (Prime/Super-Prime)
Decision
Assets held for investment at
origination
Once assets have aged, nonprime
assets may be sold
Near-Prime loans pass through hold
versus sell decisioning process
Assets designated as held for sale
at origination
Provisions
More upfront provisioning, higher
yielding assets, higher ongoing
reserve percentage
Mix of high and low provisioning/
yielding assets No provision required
Funding Strategy
Assets pledged to conduit
facilities/warehouses and
securitized via DRIVE and SDART
platforms
Assets pledged to conduit
facilities/warehouses, sold to third
parties through one-time sales or
strategic flow programs and
securitized via CCART platform
Sold through various bank flow
programs and one-time sales
Serviced for Others N/A
Retaining servicing rights creates a steady stream of capital-efficient fee
income
Banco Santander Flow
Agreement1 N/A Vertical slice of Near-Prime through Super-Prime originations
RETAIN
Leverage historical expertise in nonprime to retain higher margin assets, while also being uniquely positioned to sell assets through
flow agreements.
1 SC is finalizing a strategic agreement with Banco Santander to originate and flow prime and near-prime retail loan assets
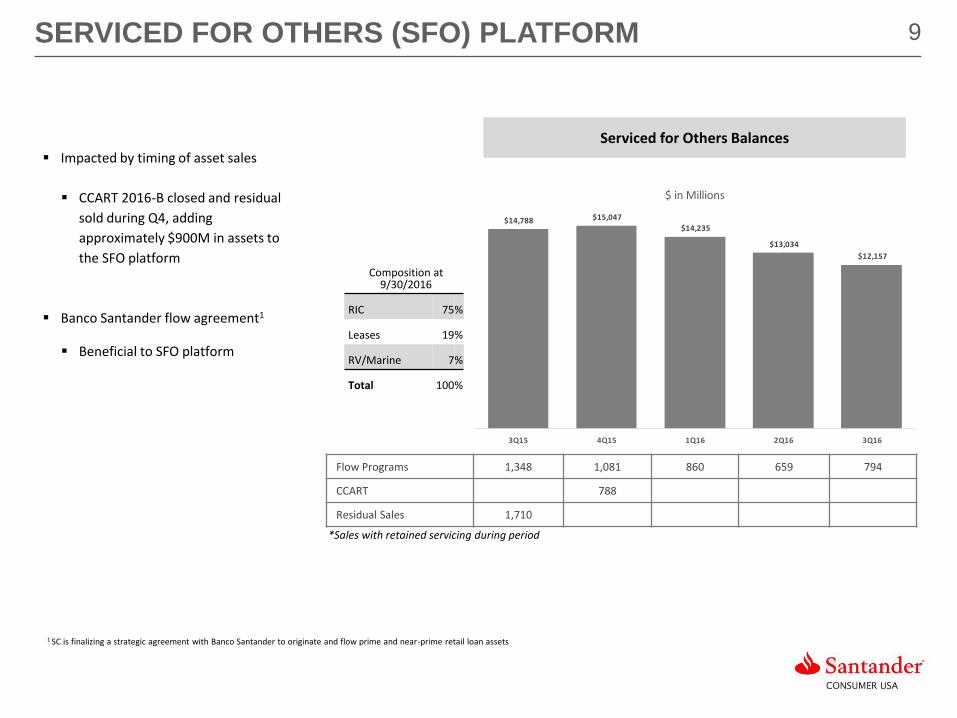
9
$14,788 $15,047
$14,235
$13,034
$12,157
3Q15 4Q15 1Q16 2Q16 3Q16
$ in Millions
Flow Programs 1,348 1,081 860 659 794
CCART 788
Residual Sales 1,710
Impacted by timing of asset sales
CCART 2016-B closed and residual
sold during Q4, adding
approximately $900M in assets to
the SFO platform
Banco Santander flow agreement1
Beneficial to SFO platform
SERVICED FOR OTHERS (SFO) PLATFORM
Composition at 9/30/2016
RIC 75%
Leases 19%
RV/Marine 7%
Total 100%
Serviced for Others Balances
*Sales with retained servicing during period
1 SC is finalizing a strategic agreement with Banco Santander to originate and flow prime and near-prime retail loan assets
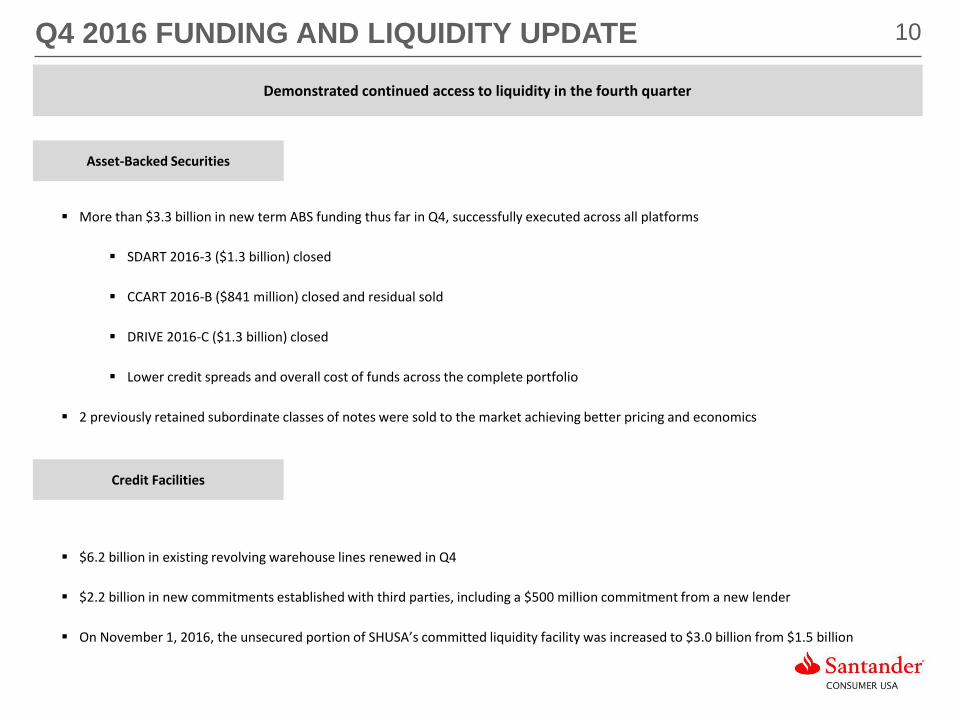
10Q4 2016 FUNDING AND LIQUIDITY UPDATE
More than $3.3 billion in new term ABS funding thus far in Q4, successfully executed across all platforms
SDART 2016-3 ($1.3 billion) closed
CCART 2016-B ($841 million) closed and residual sold
DRIVE 2016-C ($1.3 billion) closed
Lower credit spreads and overall cost of funds across the complete portfolio
2 previously retained subordinate classes of notes were sold to the market achieving better pricing and economics
$6.2 billion in existing revolving warehouse lines renewed in Q4
$2.2 billion in new commitments established with third parties, including a $500 million commitment from a new lender
On November 1, 2016, the unsecured portion of SHUSA’s committed liquidity facility was increased to $3.0 billion from $1.5 billion
Demonstrated continued access to liquidity in the fourth quarter
Asset-Backed Securities
Credit Facilities
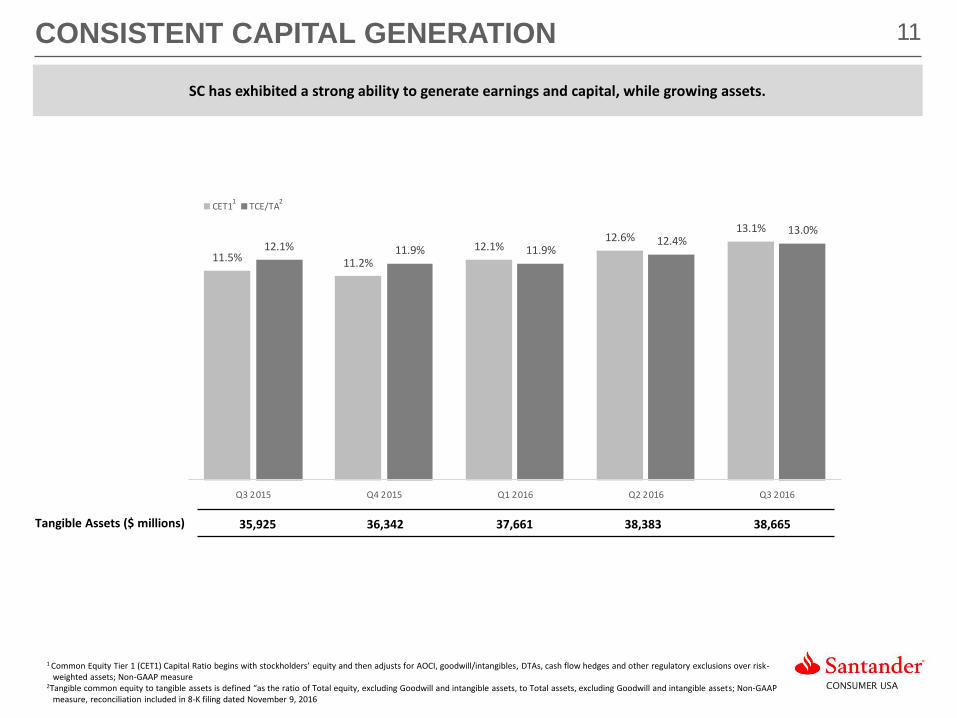
11CONSISTENT CAPITAL GENERATION
1 Common Equity Tier 1 (CET1) Capital Ratio begins with stockholders’ equity and then adjusts for AOCI, goodwill/intangibles, DTAs, cash flow hedges and other regulatory exclusions over risk-weighted assets; Non-GAAP measure
2Tangible common equity to tangible assets is defined “as the ratio of Total equity, excluding Goodwill and intangible assets, to Total assets, excluding Goodwill and intangible assets; Non-GAAP measure, reconciliation included in 8-K filing dated November 9, 2016
1 2
SC has exhibited a strong ability to generate earnings and capital, while growing assets.
Tangible Assets ($ millions) 35,925 36,342 37,661 38,383 38,665
11.5% 11.2%
12.1%12.6%
13.1%
12.1% 11.9% 11.9%12.4%
13.0%
Q3 2015 Q4 2015 Q1 2016 Q2 2016 Q3 2016
CET1 TCE/TA
12
0%
2%
4%
6%
8%
10%
1 2 3 4 5 6 7 8 9
10
11
12
13
14
15
16
17
18
19
20
21
22
23
24
Months on book
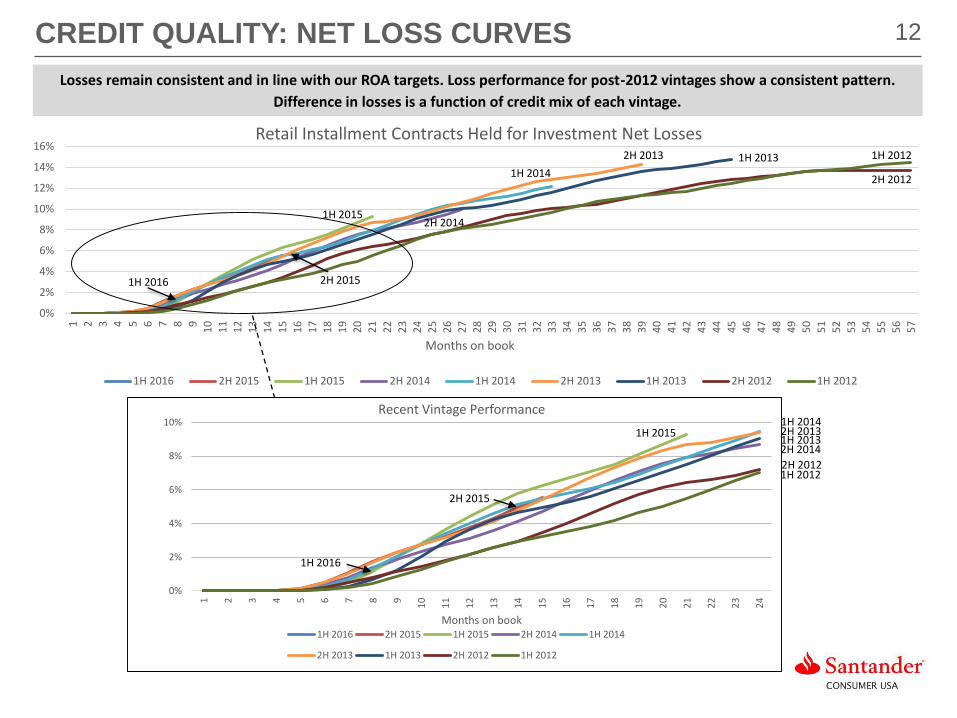
Recent Vintage Performance
1H 2016 2H 2015 1H 2015 2H 2014 1H 2014
2H 2013 1H 2013 2H 2012 1H 2012
CREDIT QUALITY: NET LOSS CURVES
Losses remain consistent and in line with our ROA targets. Loss performance for post-2012 vintages show a consistent pattern.
Difference in losses is a function of credit mix of each vintage.
0%
2%
4%
6%
8%
10%
12%
14%
16%
1 2 3 4 5 6 7 8 91
0
11
12
13
14
15
16
17
18
19
20
21
22
23
24
25
26
27
28
29
30
31
32
33
34
35
36
37
38
39
40
41
42
43
44
45
46
47
48
49
50
51
52
53
54
55
56
57
Months on book
Retail Installment Contracts Held for Investment Net Losses
1H 2016 2H 2015 1H 2015 2H 2014 1H 2014 2H 2013 1H 2013 2H 2012 1H 2012
1H 2012
1H 2012
2H 2012
2H 2012
1H 20132H 2013
1H 2014
1H 20132H 20131H 2014
2H 2014
2H 2014
1H 2015
1H 2015
2H 2015
2H 20151H 2016
1H 2016
13
VEHICLE FINANCE
LEVERAGING TECHNOLOGY IS INTEGRAL TO THE FOUR PILLARS OF OUR FOCUSED BUSINESS MODEL
FOCUSED BUSINESS MODEL
DISCIPLINED APPROACH TO MARKETSIMPLE, PERSONAL, FAIR APPROACH WITH
CUSTOMERS, EMPLOYEES AND ALL CONSTITUENCIES
SERVICED FOR OTHERS
FUNDING AND LIQUIDITY CULTURE OF COMPLIANCE