Embed Size (px)
Citation preview
San Leandro Unified School District
School Board Presentation
Academic Achievement, Part III
Looking Closely at Our District & School Assessment Data
April 5, 2011
Prepared & Presented by: Daniel Chaja,
Assistant Director of Research and Program Evaluation
Review Academic Achievement, Part I
1. Reviewed AYP Proficiency Targets by School-level & Content Area (ELA & Math)
2. District 2010 STAR CST Results by Grade & Content Area (ELA, MATH, Science, Social Science)
• Highlights of Proficiency Successes & Challenges
• ELA & Math 2-Year and 4-Year Comparison of Percent Proficient
3. 2010 STAR CST Percent Proficient by School & Content Area• 2-Year Comparison (ELA, MATH, Science, Social Science)
4. 2010 STAR CST Change in Percent Proficient by School & Content Area• 2-Year Comparison (ELA, MATH, Science, Social Science)
5. District 2010 STAR Results by Grade, Content Area, & Racial Subgroup (ELA & Math)
6. District 2010 STAR Results by Grade, Content Area, & EL Subgroup• 3-Year Trends (ELA & MATH)
7. Alameda County School Districts Comparison (ELA & Math)
• Ranking by Percent Proficient
• Ranking by Change in Percent Proficient
8. Appendix of Additional Data
• AMO Charts
• 7-Year CST Data
• Racial Subgroups 3-5 Year Trends
• Individual School CST Data
• Administrator Data Workbook
2
Review Academic Achievement, Part II
1. Overview of 2009-10 Accountability Progress Reporting (APR) System
2. Overview of Academic Performance Index (API) Report Cycle
3. District, School, and Student Subgroup API• Comparing 2009 Base API and 2010 Growth API
• Comparing Elementary and Secondary Average API Scores
• SLUSD 2010 API Consolidated Report by District, School & Student Subgroups
• Trends in Growth API by District, School & Student Subgroups
4. Trends in District, School, and Student Subgroup API Scores
5. Growth API Trends in Neighboring School Districts
6. Overview of Adequate Yearly Progress (AYP) Reports
7. District and School AYP Reports• 2-Year AYP Proficiency Targets
• 4-Year Trends of District Percent Proficient
• AYP Consolidated Report by District, School & Student Subgroup
• Other AYP Indicators: API Scores & Graduation Rate
• District AYP Criteria and Grade Spans3
Review Academic Achievement, Part II
8. Program Improvement (PI) Overview• AYP Criteria and Grade Spans
9. SLUSD 2010-11 PI Reports• SLUSD 2010-11 PI Status Consolidated Report with District, School & Student
Subgroups
• Timeline for District PI Mandates/Requirements
• Timeline for School PI Mandates/Requirements
10. APR Data Analysis, Reflection, and Plan of Action• So how did we do?
• What are we doing now?
4
Academic Achievement, Part III
1. California Alternate Performance Assessment (CAPA) (ELA, Math, Science)
• Percent Proficient by CAPA Level
2. California Modified Assessment (CMA) (ELA, Math, Science)
• 2-Year Comparison
• Participation Chart
3. California High School Exit Exam (CAHSEE) (ELA, Math)
• February 2011 Results
• 6-Year Comparison
4. Advance Placement (AP) Assessments (All AP Courses Combined)
• 2-Year District Comparison
5. SAT Reasoning Test (SAT) (Critical Reading, Math, Writing)
• SLUSD 2009-10 Results
• 2-Year District Comparison
6. AYP Graduation Rates• New Growth Target Structure
• SLUSD 3-Year Trends by Student Subgroup
7. Appendix of Additional Data 5
STAR 2011
CAPA Overview
6
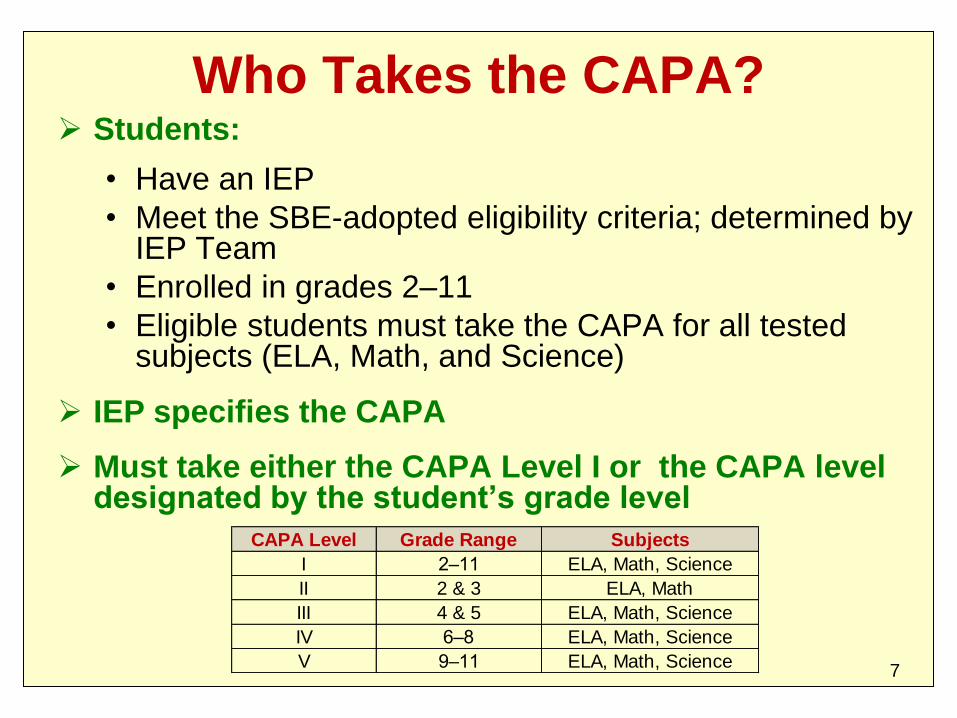
Who Takes the CAPA? Students:
• Have an IEP
• Meet the SBE-adopted eligibility criteria; determined by IEP Team
• Enrolled in grades 2–11
• Eligible students must take the CAPA for all tested subjects (ELA, Math, and Science)
IEP specifies the CAPA
Must take either the CAPA Level I or the CAPA level designated by the student’s grade level
CAPA Level Grade Range Subjects
I 2–11 ELA, Math, Science
II 2 & 3 ELA, Math
III 4 & 5 ELA, Math, Science
IV 6–8 ELA, Math, Science
V 9–11 ELA, Math, Science7
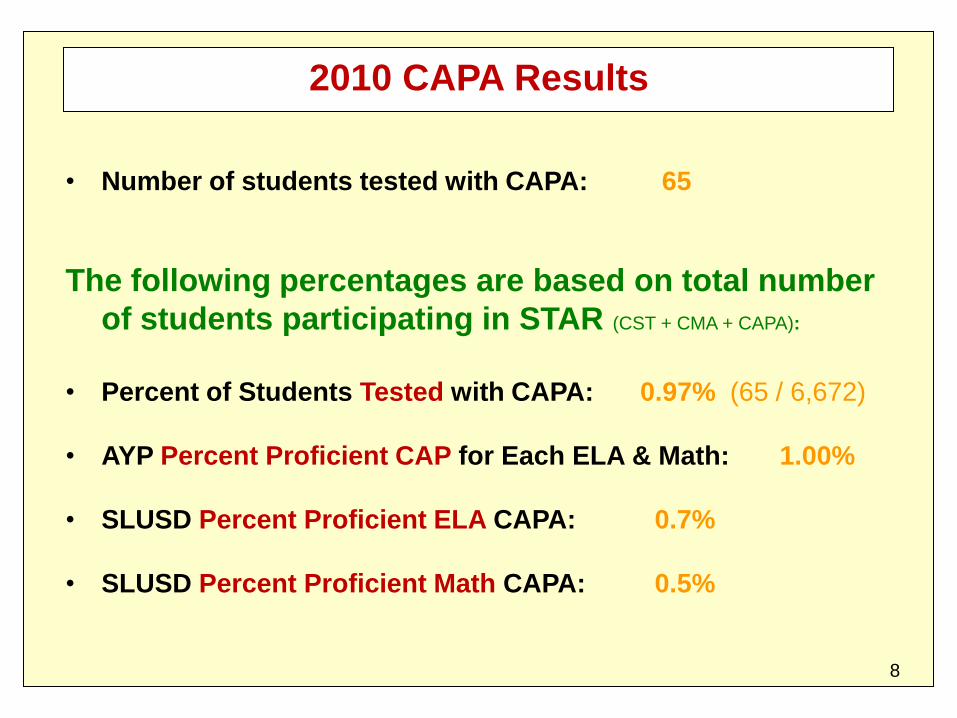
2010 CAPA Results
• Number of students tested with CAPA: 65
The following percentages are based on total number
of students participating in STAR (CST + CMA + CAPA):
• Percent of Students Tested with CAPA: 0.97% (65 / 6,672)
• AYP Percent Proficient CAP for Each ELA & Math: 1.00%
• SLUSD Percent Proficient ELA CAPA: 0.7%
• SLUSD Percent Proficient Math CAPA: 0.5%
8
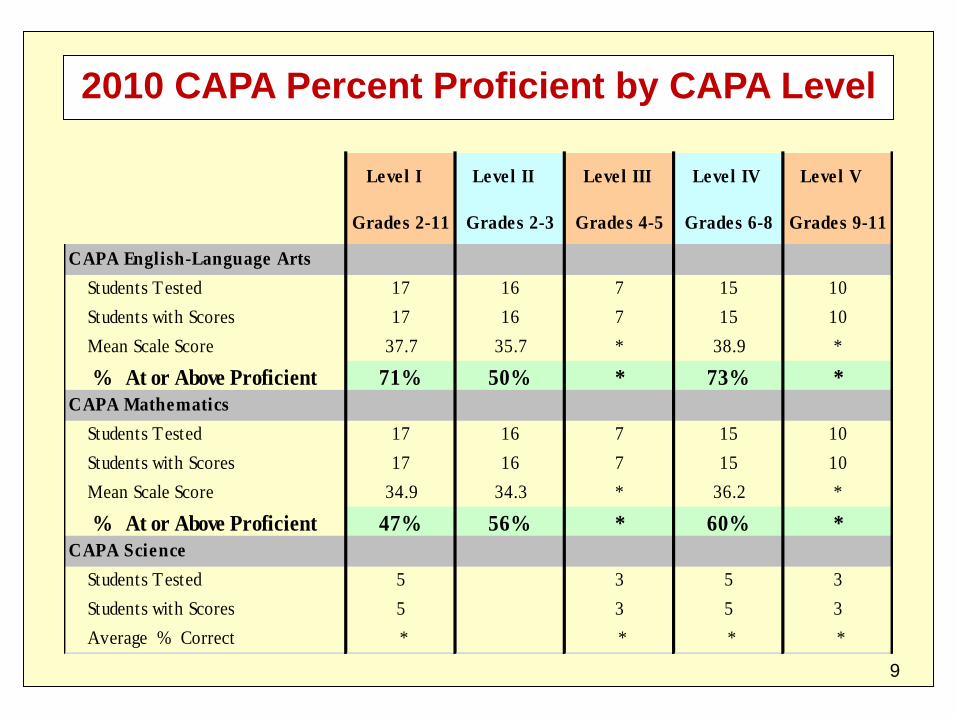
2010 CAPA Percent Proficient by CAPA Level
Level I Level II Level III Level IV Level V
Grades 2-11 Grades 2-3 Grades 4-5 Grades 6-8 Grades 9-11
CAPA English-Language Arts
Students Tested 17 16 7 15 10
Students with Scores 17 16 7 15 10
Mean Scale Score 37.7 35.7 * 38.9 *
% At or Above Proficient 71% 50% * 73% *
CAPA Mathematics
Students Tested 17 16 7 15 10
Students with Scores 17 16 7 15 10
Mean Scale Score 34.9 34.3 * 36.2 *
% At or Above Proficient 47% 56% * 60% *
CAPA Science
Students Tested 5 3 5 3
Students with Scores 5 3 5 3
Average % Correct * * * *
9
STAR 2011
CMA Overview
10
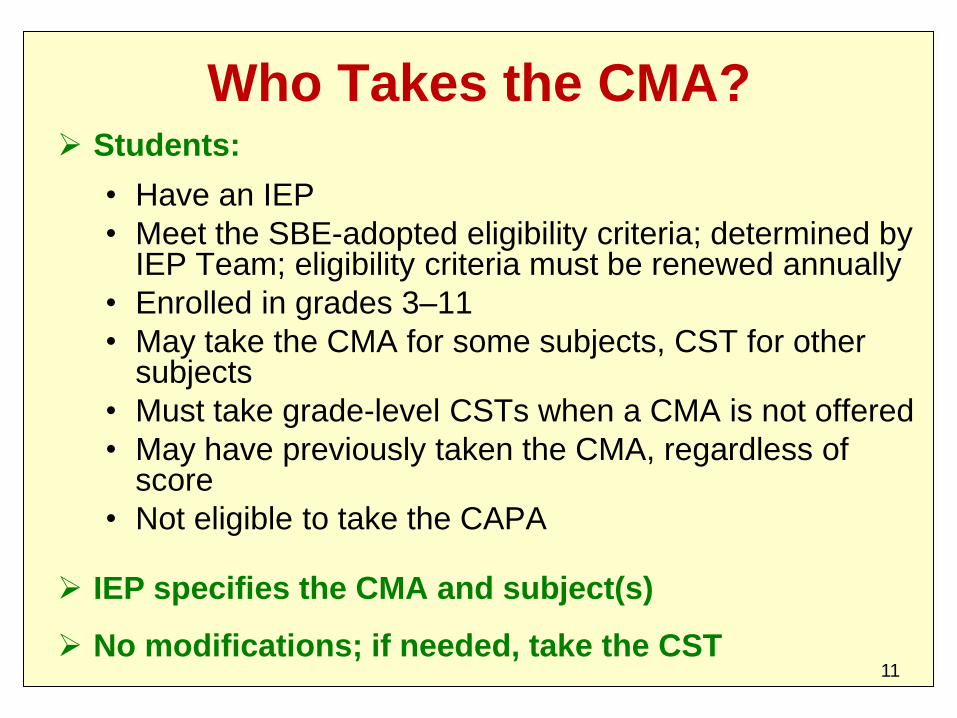
Who Takes the CMA? Students:
• Have an IEP
• Meet the SBE-adopted eligibility criteria; determined by IEP Team; eligibility criteria must be renewed annually
• Enrolled in grades 3–11
• May take the CMA for some subjects, CST for other subjects
• Must take grade-level CSTs when a CMA is not offered
• May have previously taken the CMA, regardless of score
• Not eligible to take the CAPA
IEP specifies the CMA and subject(s)
No modifications; if needed, take the CST11
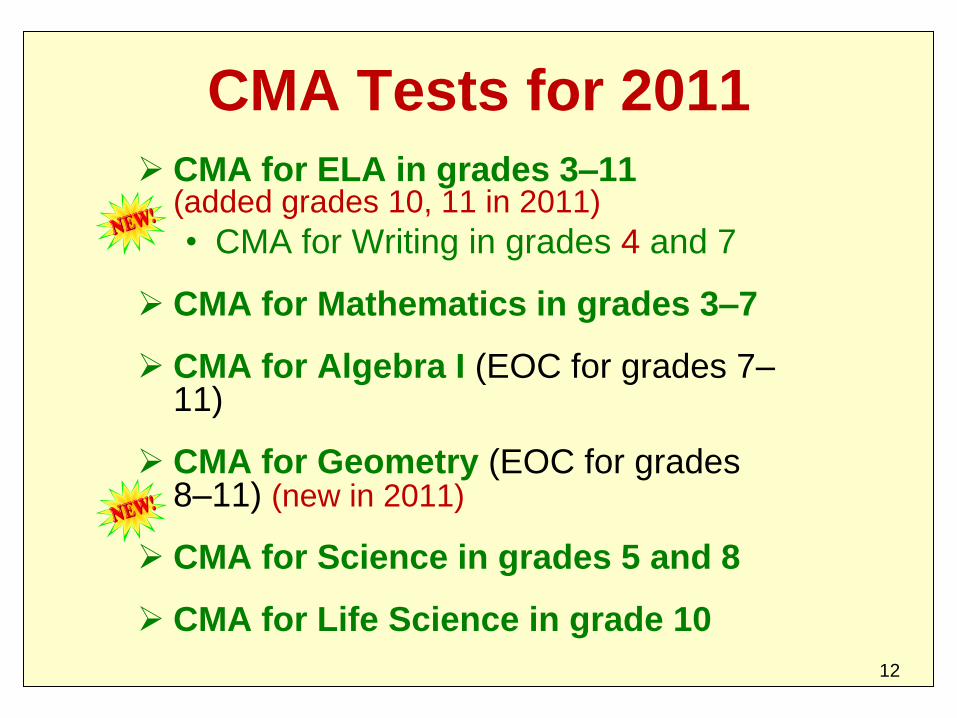
CMA Tests for 2011
CMA for ELA in grades 3–11 (added grades 10, 11 in 2011)
• CMA for Writing in grades 4 and 7
CMA for Mathematics in grades 3–7
CMA for Algebra I (EOC for grades 7–11)
CMA for Geometry (EOC for grades 8–11) (new in 2011)
CMA for Science in grades 5 and 8
CMA for Life Science in grade 10
12
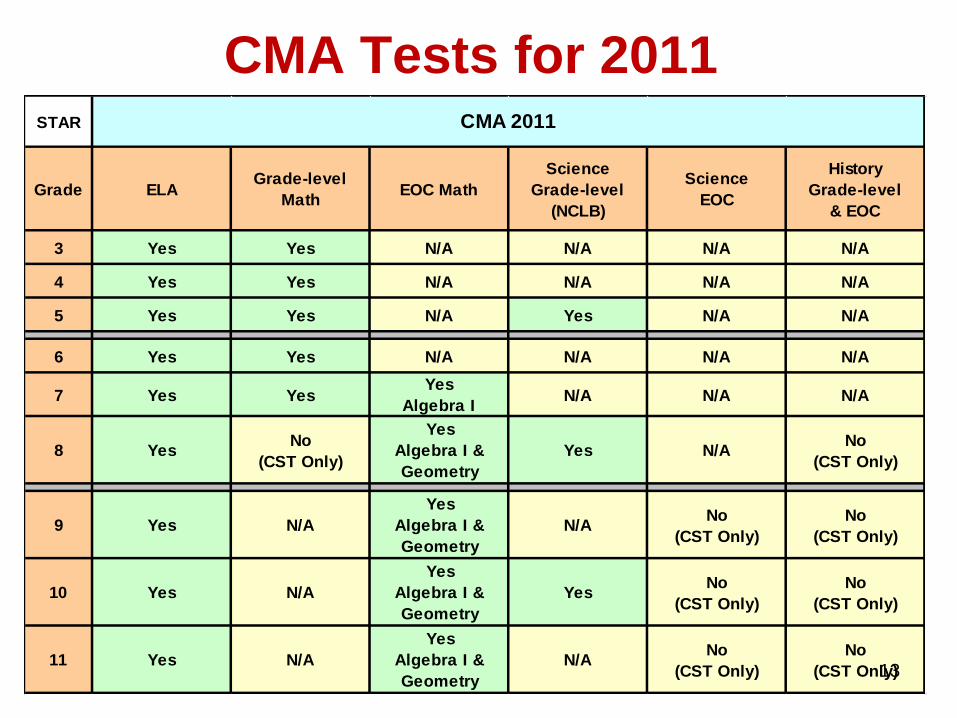
CMA Tests for 2011STAR
Grade ELAGrade-level
MathEOC Math
Science
Grade-level
(NCLB)
Science
EOC
History
Grade-level
& EOC
3 Yes Yes N/A N/A N/A N/A
4 Yes Yes N/A N/A N/A N/A
5 Yes Yes N/A Yes N/A N/A
6 Yes Yes N/A N/A N/A N/A
7 Yes YesYes
Algebra IN/A N/A N/A
8 YesNo
(CST Only)
Yes
Algebra I &
Geometry
Yes N/ANo
(CST Only)
9 Yes N/A
Yes
Algebra I &
Geometry
N/ANo
(CST Only)
No
(CST Only)
10 Yes N/A
Yes
Algebra I &
Geometry
YesNo
(CST Only)
No
(CST Only)
11 Yes N/A
Yes
Algebra I &
Geometry
N/ANo
(CST Only)
No
(CST Only)
CMA 2011
13
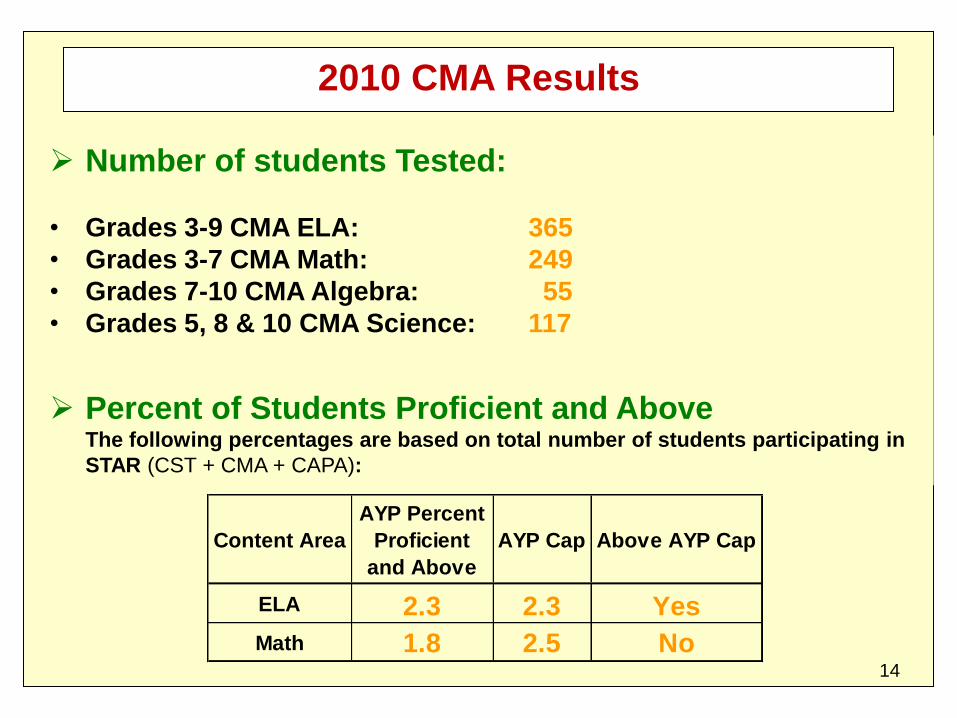
2010 CMA Results
Number of students Tested:
• Grades 3-9 CMA ELA: 365
• Grades 3-7 CMA Math: 249
• Grades 7-10 CMA Algebra: 55
• Grades 5, 8 & 10 CMA Science: 117
Percent of Students Proficient and AboveThe following percentages are based on total number of students participating in
STAR (CST + CMA + CAPA):
Content Area
AYP Percent
Proficient
and Above
AYP Cap Above AYP Cap
ELA 2.3 2.3 Yes
Math 1.8 2.5 No14
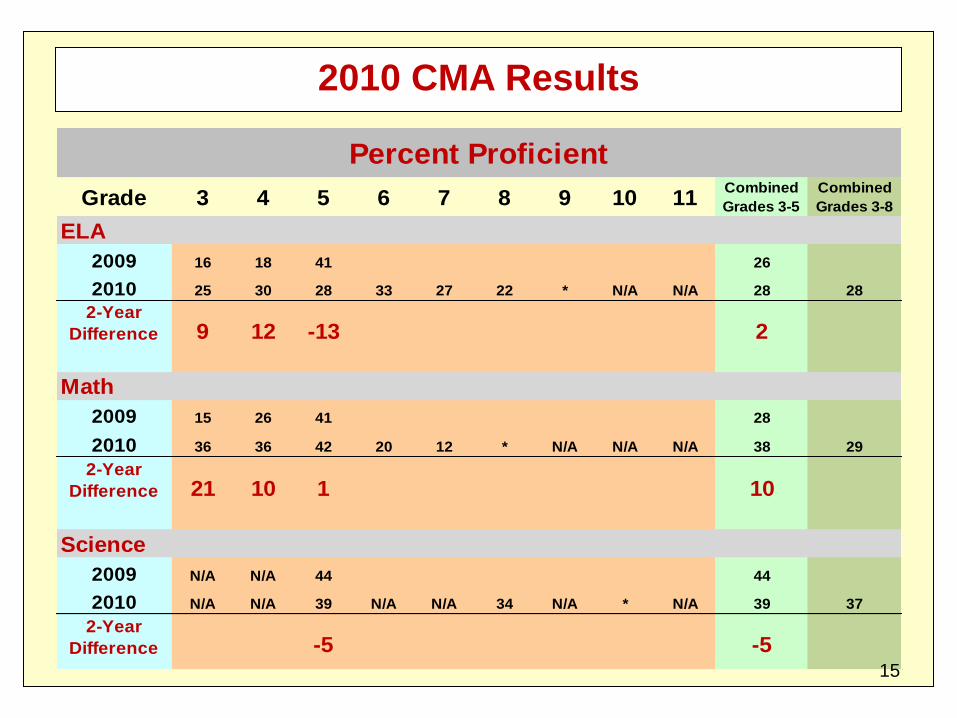
2010 CMA Results
Grade 3 4 5 6 7 8 9 10 11Combined
Grades 3-5
Combined
Grades 3-8
ELA
2009 16 18 41 26
2010 25 30 28 33 27 22 * N/A N/A 28 28
2-Year
Difference 9 12 -13 2
Math
2009 15 26 41 28
2010 36 36 42 20 12 * N/A N/A N/A 38 29
2-Year
Difference 21 10 1 10
Science
2009 N/A N/A 44 44
2010 N/A N/A 39 N/A N/A 34 N/A * N/A 39 37
2-Year
Difference -5 -5
Percent Proficient
15

CAHSEE
Overview
16
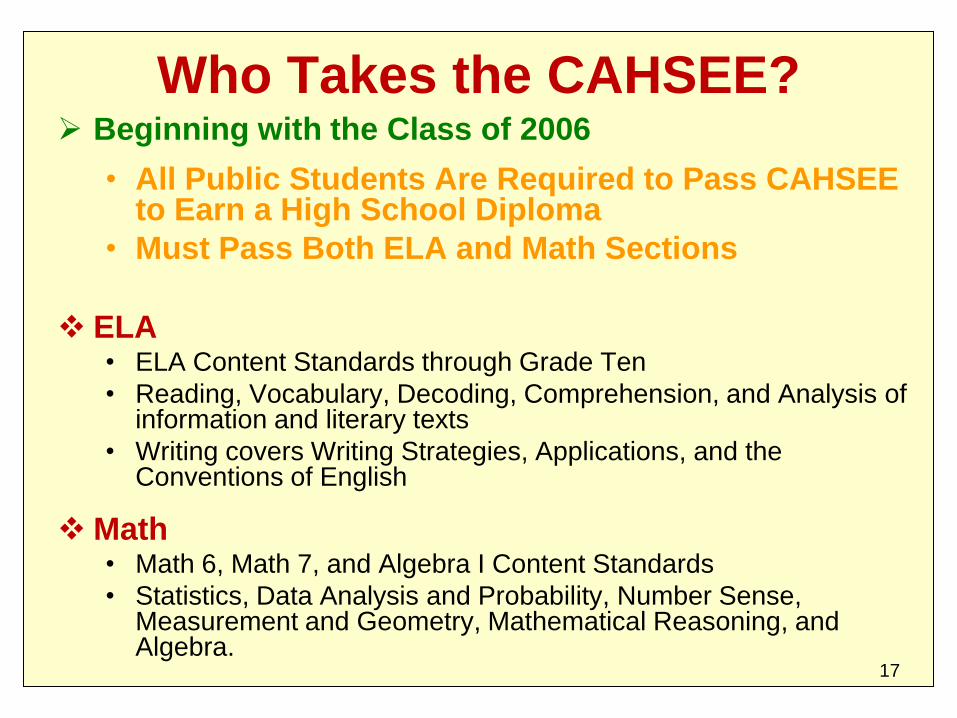
Who Takes the CAHSEE? Beginning with the Class of 2006
• All Public Students Are Required to Pass CAHSEE to Earn a High School Diploma
• Must Pass Both ELA and Math Sections
ELA• ELA Content Standards through Grade Ten
• Reading, Vocabulary, Decoding, Comprehension, and Analysis of information and literary texts
• Writing covers Writing Strategies, Applications, and the Conventions of English
Math• Math 6, Math 7, and Algebra I Content Standards
• Statistics, Data Analysis and Probability, Number Sense, Measurement and Geometry, Mathematical Reasoning, and Algebra.
17
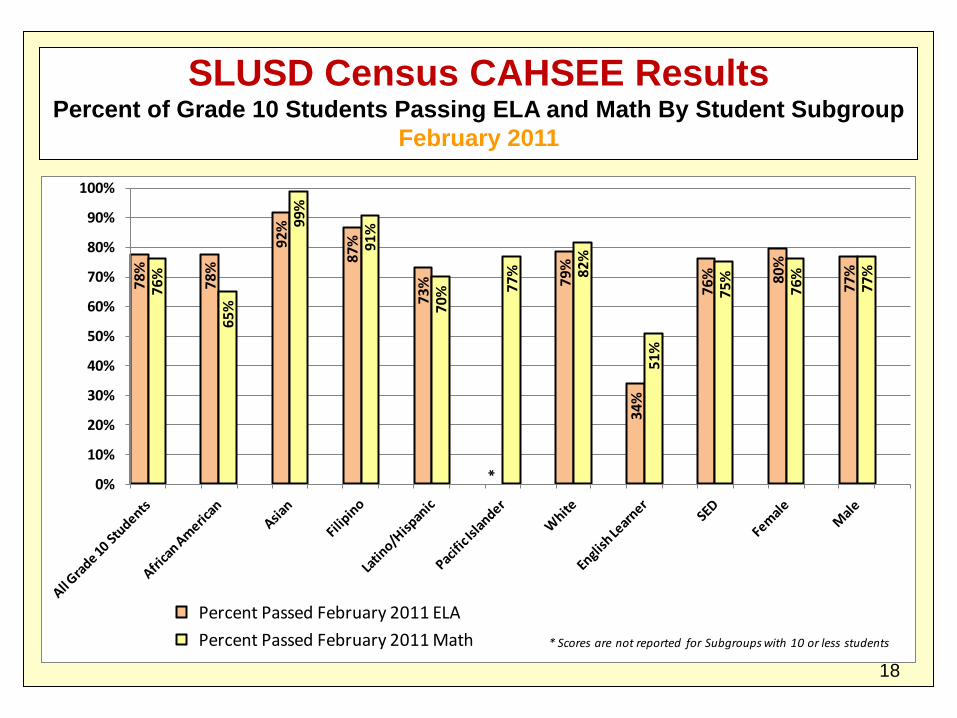
SLUSD Census CAHSEE ResultsPercent of Grade 10 Students Passing ELA and Math By Student Subgroup
February 20117
8%
78
%
92%
87
%
73%
*
79
%
34
%
76% 80
%
77%
76%
65
%
99%
91
%
70% 77
% 82
%
51%
75
%
76%
77%
0%
10%
20%
30%
40%
50%
60%
70%
80%
90%
100%
Percent Passed February 2011 ELA
Percent Passed February 2011 Math * Scores are not reported for Subgroups with 10 or less students
18
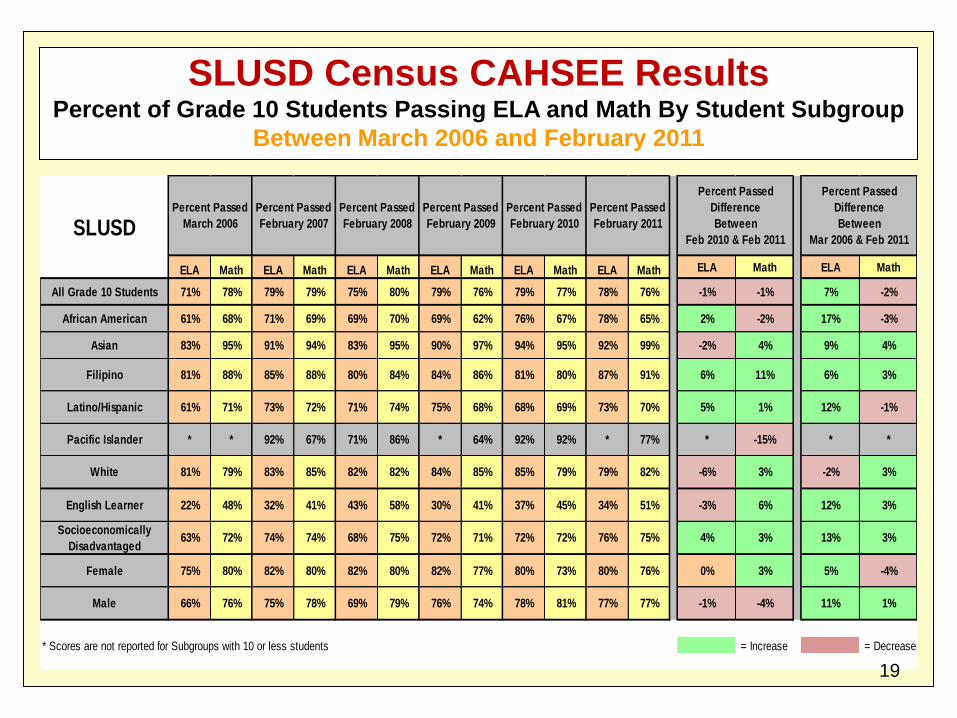
SLUSD Census CAHSEE ResultsPercent of Grade 10 Students Passing ELA and Math By Student Subgroup
Between March 2006 and February 2011
ELA Math ELA Math ELA Math ELA Math ELA Math ELA Math ELA Math ELA Math
* Scores are not reported for Subgroups with 10 or less students = Increase = Decrease
Percent Passed
February 2007
79% 79%
71% 69%
91% 94%
85% 88%
Male 66% 76% 69% 79% 77% 77% -1% -4%75% 78% 76% 74% 78% 81%
6%
82% 80% 80% 76%
Percent Passed
February 2008
Percent Passed
Difference
Between
Feb 2010 & Feb 2011
-1% -1%75% 80%
0% 3%
97%
84% 86%
75% 68%
80% 73%
Percent Passed
February 2010
79% 77%
76%
Percent Passed
March 2006
91%
Percent Passed
February 2009
79% 76%
11%
69% 70%
71% 74%
83% 95%
80% 84%
69%
Percent Passed
February 2011
78% 76%
2% -2%
5% 1%
-2% 4%
All Grade 10 Students 71% 78%
Filipino 81% 88%
African American 61% 68%
Female 75% 80%
78% 65%
73% 70%
92% 99%
87%
Latino/Hispanic 61% 71%
Asian 83% 95%
73% 72%
82% 80% 82% 77%
62%
90%
*Pacific Islander * * 92% 67% 71%
80%
68% 69%
82%
86% * 64% 92% 92%
67%
94% 95%
81%
32% 41% 43% 58% 30% 41%
-6% 3%
SLUSD
84% 85% 85% 79% 79% 82%
77% * -15%
White 81% 79% 83% 85% 82%
37% 45% 34% 51% -3% 6%
Socioeconomically
Disadvantaged63% 72% 74% 74% 68% 75% 72% 71% 72% 72% 76% 75% 4% 3%
English Learner 22% 48%
Percent Passed
Difference
Between
Mar 2006 & Feb 2011
7% -2%
17% -3%
9% 4%
6% 3%
5% -4%
11% 1%
12% -1%
* *
-2% 3%
12% 3%
13% 3%
19
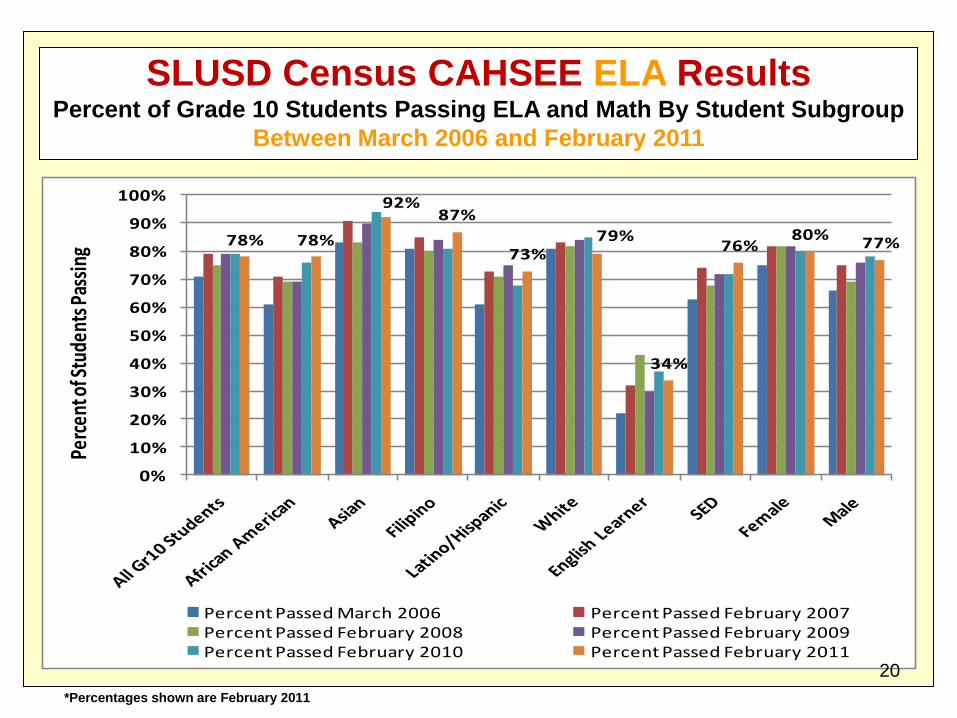
SLUSD Census CAHSEE ELA ResultsPercent of Grade 10 Students Passing ELA and Math By Student Subgroup
Between March 2006 and February 2011
78% 78%
92%87%
73%79%
34%
76%80%
77%
0%
10%
20%
30%
40%
50%
60%
70%
80%
90%
100%
Percent Passed March 2006 Percent Passed February 2007Percent Passed February 2008 Percent Passed February 2009Percent Passed February 2010 Percent Passed February 2011
Perc
ent o
f Stu
dent
s Pas
sing
20
*Percentages shown are February 2011
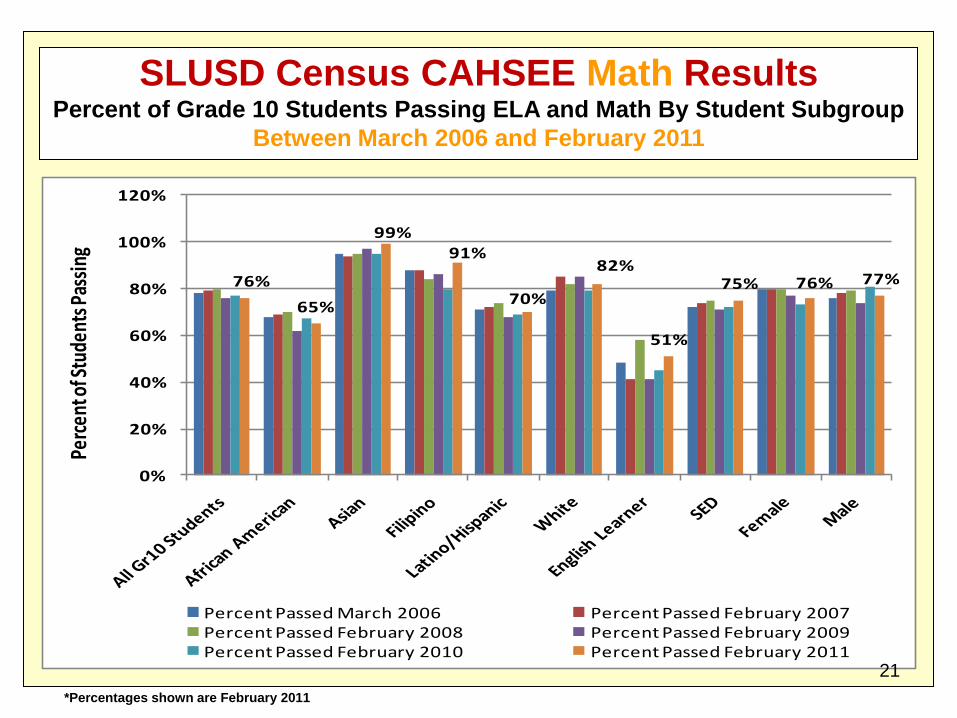
SLUSD Census CAHSEE Math ResultsPercent of Grade 10 Students Passing ELA and Math By Student Subgroup
Between March 2006 and February 2011
76%
65%
99%91%
70%
82%
51%
75% 76% 77%
0%
20%
40%
60%
80%
100%
120%
Percent Passed March 2006 Percent Passed February 2007Percent Passed February 2008 Percent Passed February 2009Percent Passed February 2010 Percent Passed February 2011
Perc
ent o
f Stu
dent
s Pas
sing
21
*Percentages shown are February 2011
Advance Placement Exams
Overview
22
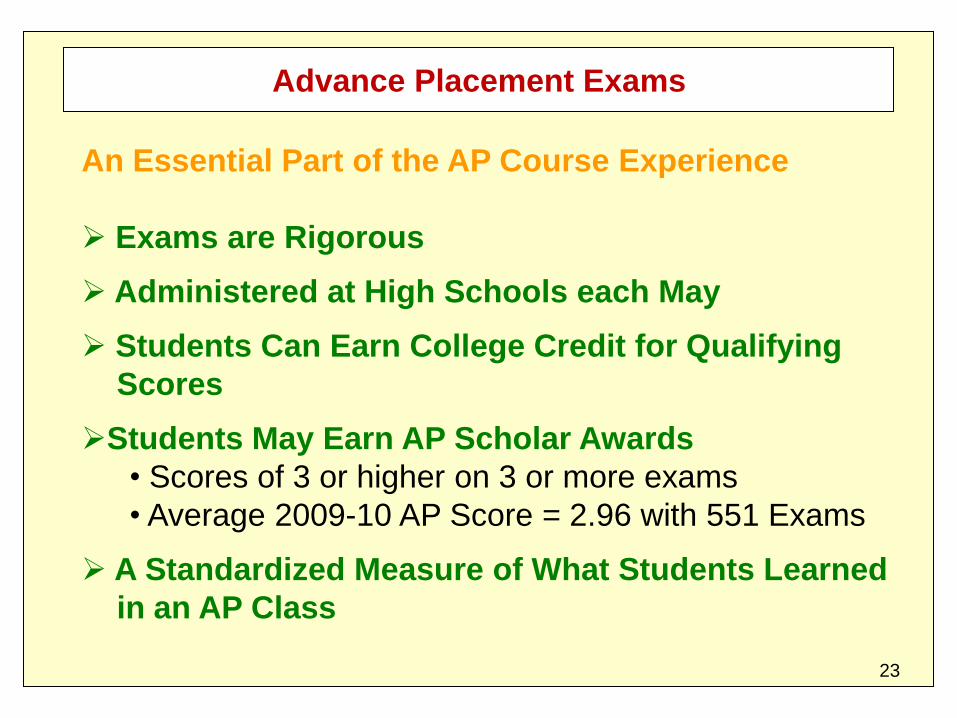
Advance Placement Exams
An Essential Part of the AP Course Experience
Exams are Rigorous
Administered at High Schools each May
Students Can Earn College Credit for Qualifying
Scores
Students May Earn AP Scholar Awards
• Scores of 3 or higher on 3 or more exams
• Average 2009-10 AP Score = 2.96 with 551 Exams
A Standardized Measure of What Students Learned
in an AP Class
23
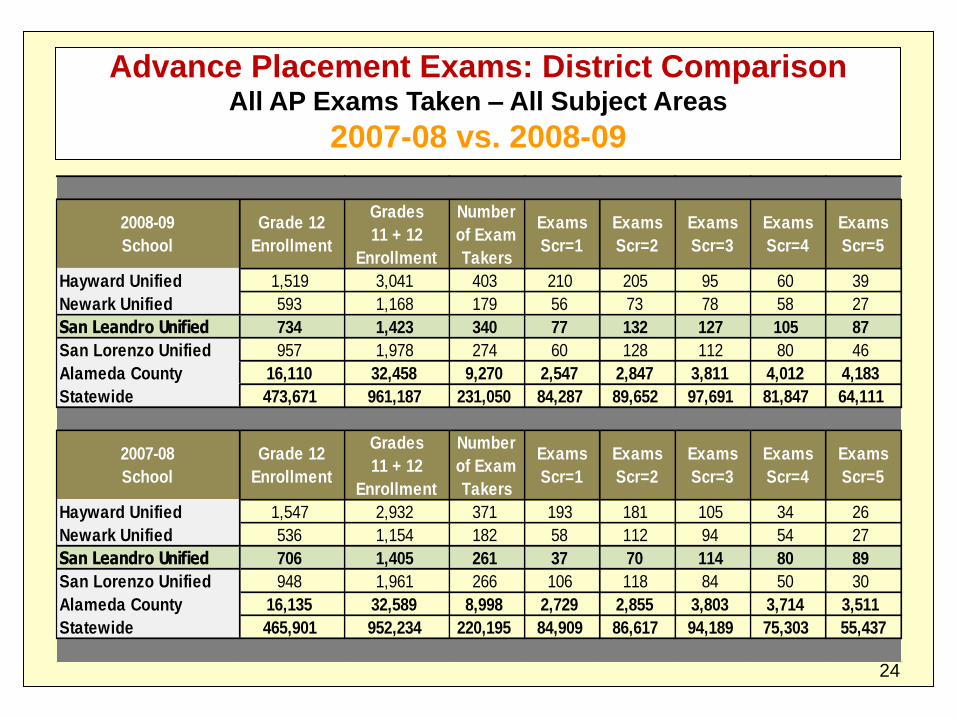
Advance Placement Exams: District ComparisonAll AP Exams Taken – All Subject Areas
2007-08 vs. 2008-09
2008-09
School
Grade 12
Enrollment
Grades
11 + 12
Enrollment
Number
of Exam
Takers
Exams
Scr=1
Exams
Scr=2
Exams
Scr=3
Exams
Scr=4
Exams
Scr=5
Hayward Unified 1,519 3,041 403 210 205 95 60 39
Newark Unified 593 1,168 179 56 73 78 58 27
San Leandro Unified 734 1,423 340 77 132 127 105 87
San Lorenzo Unified 957 1,978 274 60 128 112 80 46
Alameda County 16,110 32,458 9,270 2,547 2,847 3,811 4,012 4,183
Statewide 473,671 961,187 231,050 84,287 89,652 97,691 81,847 64,111
2007-08
School
Grade 12
Enrollment
Grades
11 + 12
Enrollment
Number
of Exam
Takers
Exams
Scr=1
Exams
Scr=2
Exams
Scr=3
Exams
Scr=4
Exams
Scr=5
Hayward Unified 1,547 2,932 371 193 181 105 34 26
Newark Unified 536 1,154 182 58 112 94 54 27
San Leandro Unified 706 1,405 261 37 70 114 80 89
San Lorenzo Unified 948 1,961 266 106 118 84 50 30
Alameda County 16,135 32,589 8,998 2,729 2,855 3,803 3,714 3,511
Statewide 465,901 952,234 220,195 84,909 86,617 94,189 75,303 55,437
24
SAT Reasoning Test
Overview
25
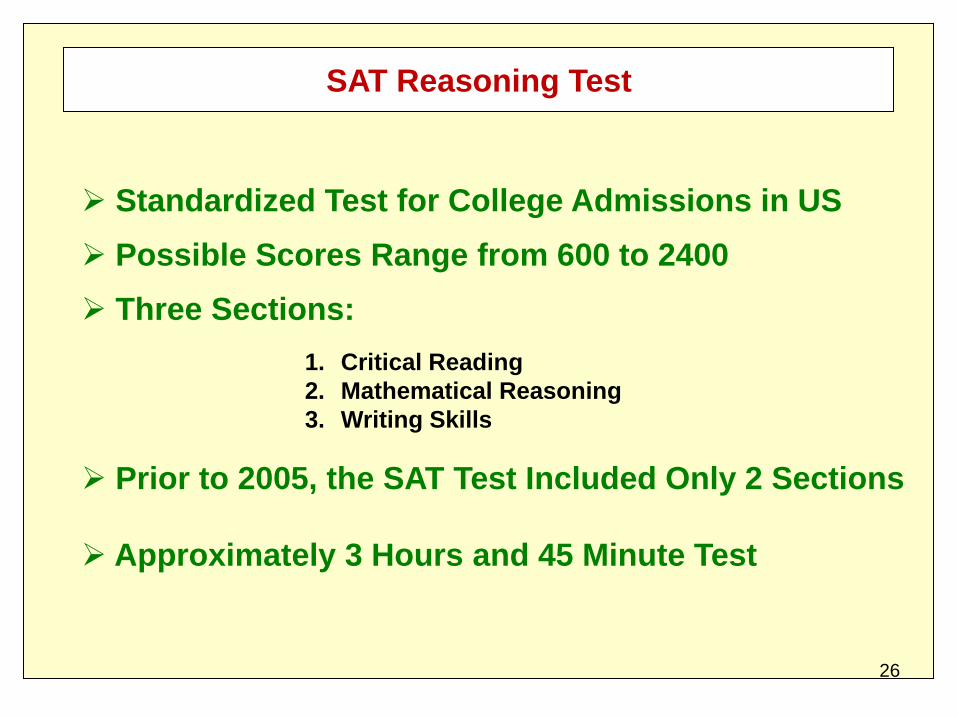
SAT Reasoning Test
Standardized Test for College Admissions in US
Possible Scores Range from 600 to 2400
Three Sections:
Prior to 2005, the SAT Test Included Only 2 Sections
Approximately 3 Hours and 45 Minute Test
1. Critical Reading
2. Mathematical Reasoning
3. Writing Skills
26
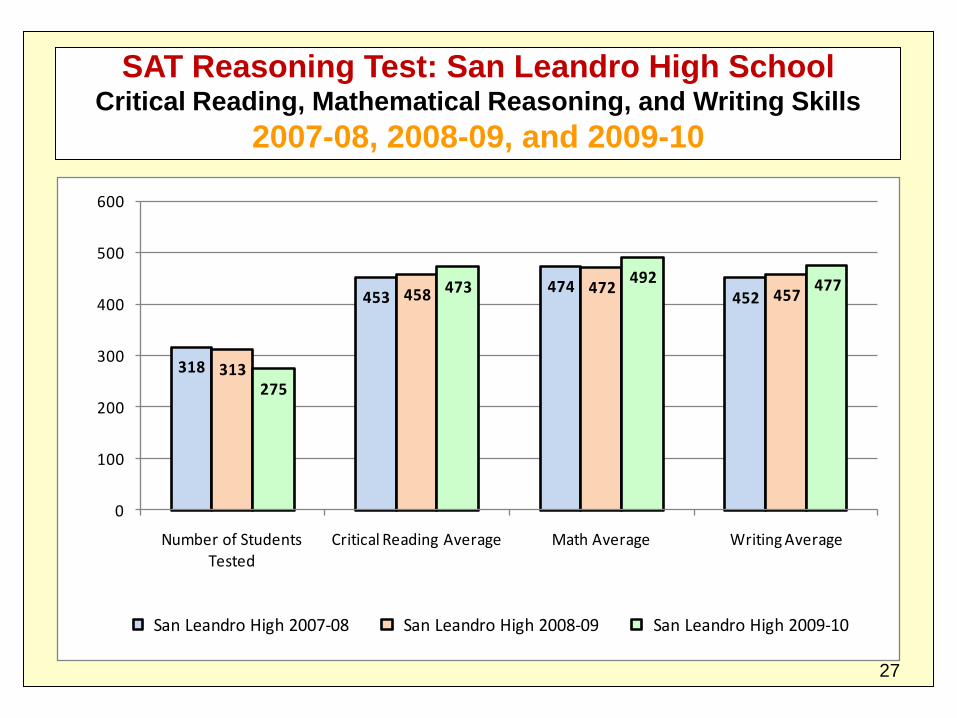
SAT Reasoning Test: San Leandro High SchoolCritical Reading, Mathematical Reasoning, and Writing Skills
2007-08, 2008-09, and 2009-10
318
453474
452
313
458 472 457
275
473492 477
0
100
200
300
400
500
600
Number of Students Tested
Critical Reading Average Math Average Writing Average
San Leandro High 2007-08 San Leandro High 2008-09 San Leandro High 2009-10
27
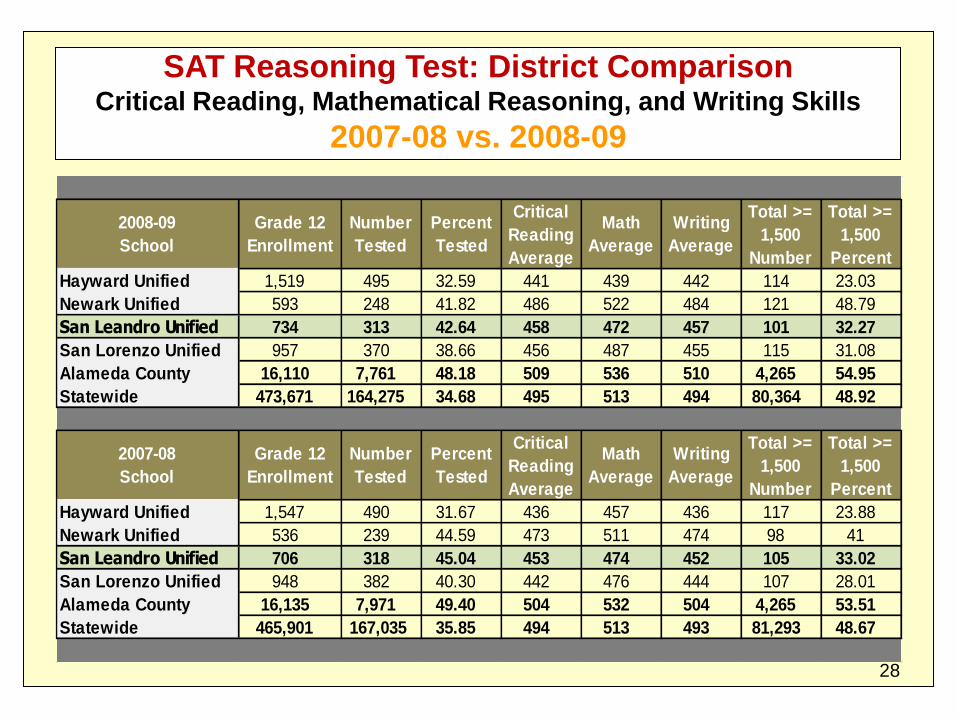
SAT Reasoning Test: District ComparisonCritical Reading, Mathematical Reasoning, and Writing Skills
2007-08 vs. 2008-09
2008-09
School
Grade 12
Enrollment
Number
Tested
Percent
Tested
Critical
Reading
Average
Math
Average
Writing
Average
Total >=
1,500
Number
Total >=
1,500
Percent
Hayward Unified 1,519 495 32.59 441 439 442 114 23.03
Newark Unified 593 248 41.82 486 522 484 121 48.79
San Leandro Unified 734 313 42.64 458 472 457 101 32.27
San Lorenzo Unified 957 370 38.66 456 487 455 115 31.08
Alameda County 16,110 7,761 48.18 509 536 510 4,265 54.95
Statewide 473,671 164,275 34.68 495 513 494 80,364 48.92
2007-08
School
Grade 12
Enrollment
Number
Tested
Percent
Tested
Critical
Reading
Average
Math
Average
Writing
Average
Total >=
1,500
Number
Total >=
1,500
Percent
Hayward Unified 1,547 490 31.67 436 457 436 117 23.88
Newark Unified 536 239 44.59 473 511 474 98 41
San Leandro Unified 706 318 45.04 453 474 452 105 33.02
San Lorenzo Unified 948 382 40.30 442 476 444 107 28.01
Alameda County 16,135 7,971 49.40 504 532 504 4,265 53.51
Statewide 465,901 167,035 35.85 494 513 493 81,293 48.67
28
Graduation Rate
Overview
29
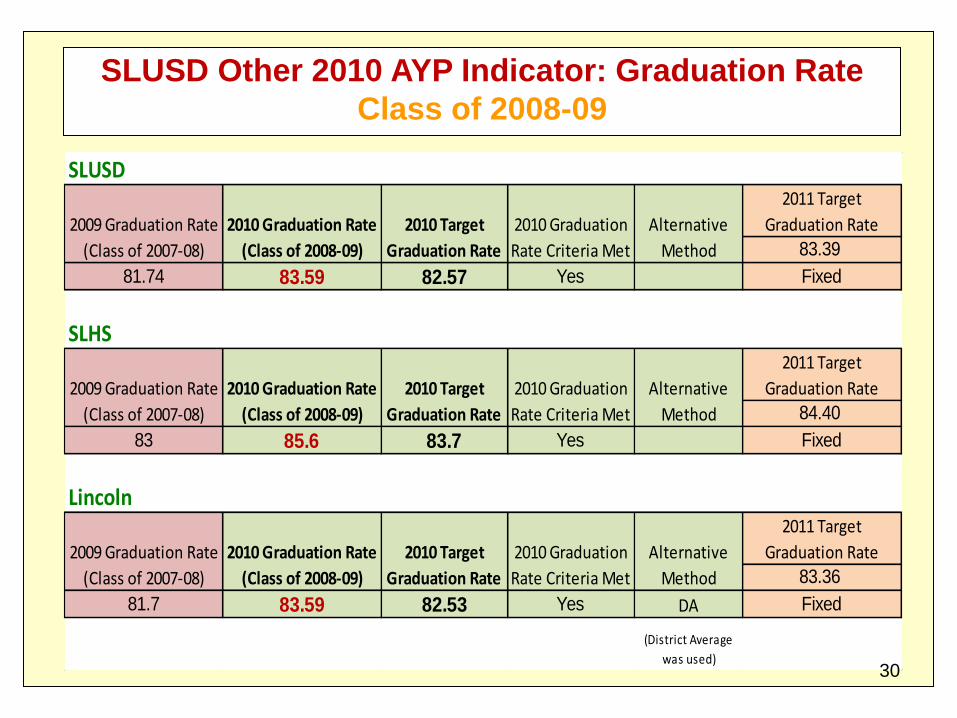
SLUSD
2009 Graduation Rate 2010 Graduation Rate
2011 Target
Graduation Rate
(Class of 2007-08) (Class of 2008-09) 83.39
81.74 83.59 82.57 Yes Fixed
SLHS
2009 Graduation Rate 2010 Graduation Rate
2011 Target
Graduation Rate
(Class of 2007-08) (Class of 2008-09) 84.40
83 85.6 83.7 Yes Fixed
Lincoln
2009 Graduation Rate 2010 Graduation Rate
2011 Target
Graduation Rate
(Class of 2007-08) (Class of 2008-09) 83.36
81.7 83.59 82.53 Yes DA Fixed
2010 Target
Graduation Rate
2010 Graduation
Rate Criteria Met
Alternative
Method
(District Average
was used)
2010 Target
Graduation Rate
2010 Graduation
Rate Criteria Met
Alternative
Method
2010 Target
Graduation Rate
2010 Graduation
Rate Criteria Met
Alternative
Method
SLUSD Other 2010 AYP Indicator: Graduation Rate
Class of 2008-09
30
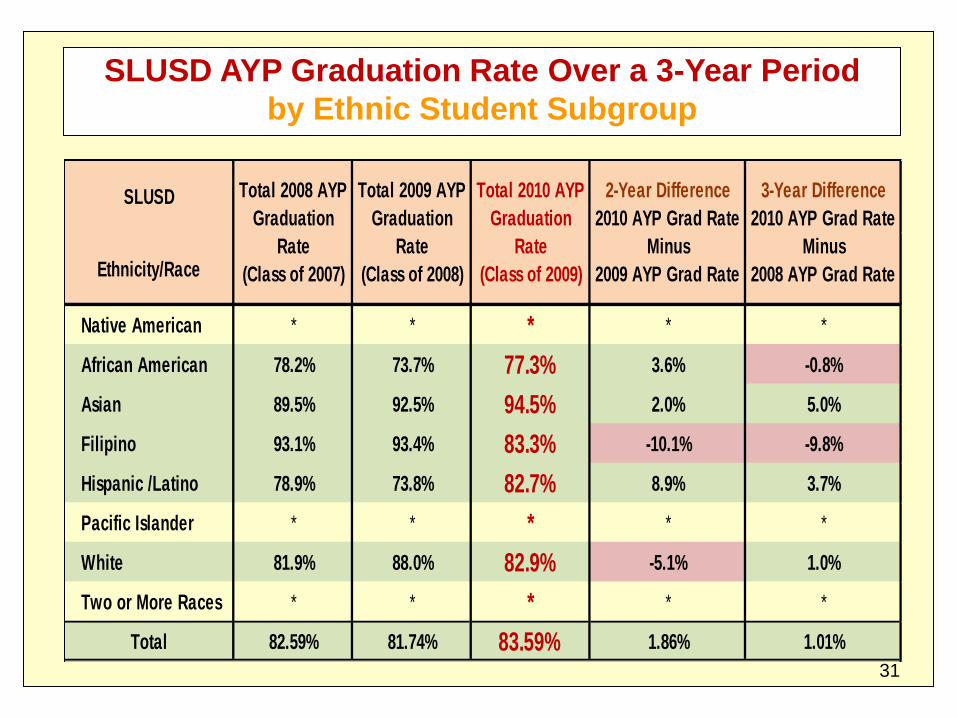
SLUSD AYP Graduation Rate Over a 3-Year Period
by Ethnic Student Subgroup
SLUSD
Ethnicity/Race
Native American * * * * *
African American 78.2% 73.7% 77.3% 3.6% -0.8%
Asian 89.5% 92.5% 94.5% 2.0% 5.0%
Filipino 93.1% 93.4% 83.3% -10.1% -9.8%
Hispanic /Latino 78.9% 73.8% 82.7% 8.9% 3.7%
Pacific Islander * * * * *
White 81.9% 88.0% 82.9% -5.1% 1.0%
Two or More Races * * * * *
Total 82.59% 81.74% 83.59% 1.86% 1.01%
Total 2008 AYP
Graduation
Rate
(Class of 2007)
Total 2009 AYP
Graduation
Rate
(Class of 2008)
Total 2010 AYP
Graduation
Rate
(Class of 2009)
2-Year Difference
2010 AYP Grad Rate
Minus
2009 AYP Grad Rate
3-Year Difference
2010 AYP Grad Rate
Minus
2008 AYP Grad Rate
31
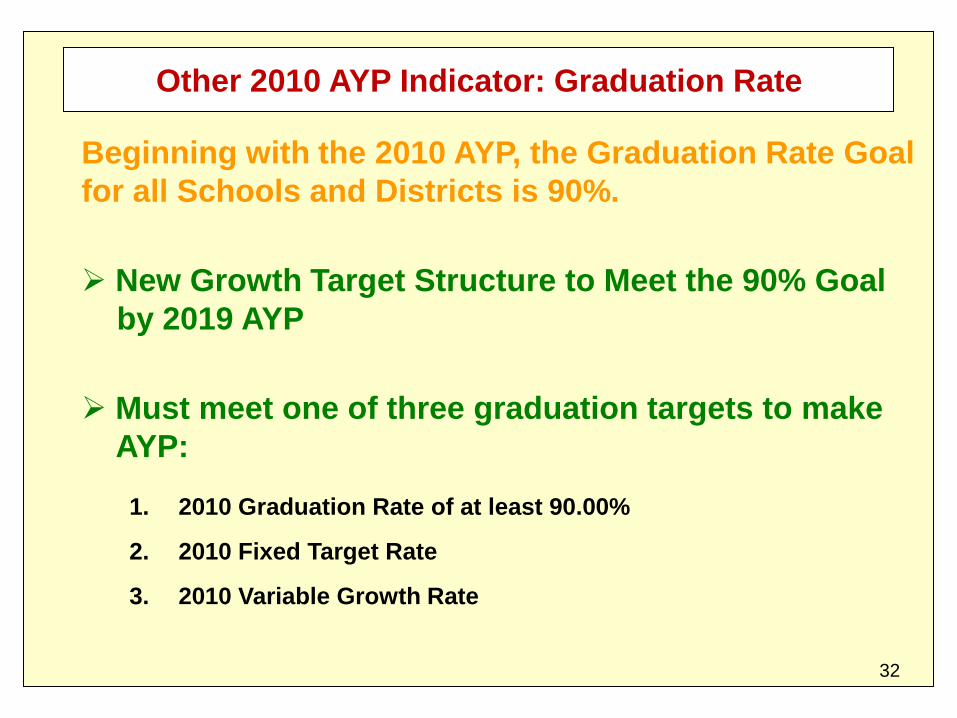
Other 2010 AYP Indicator: Graduation Rate
Beginning with the 2010 AYP, the Graduation Rate Goal
for all Schools and Districts is 90%.
New Growth Target Structure to Meet the 90% Goal
by 2019 AYP
Must meet one of three graduation targets to make
AYP:
1. 2010 Graduation Rate of at least 90.00%
2. 2010 Fixed Target Rate
3. 2010 Variable Growth Rate
32
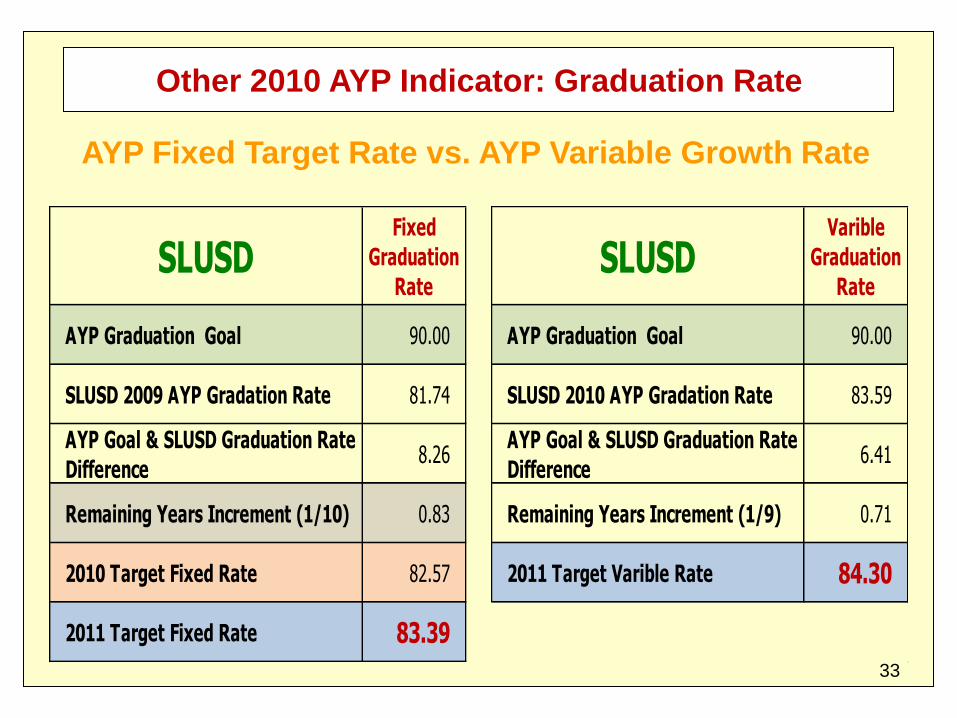
Other 2010 AYP Indicator: Graduation Rate
AYP Fixed Target Rate vs. AYP Variable Growth Rate
SLUSDFixed
Graduation
RateSLUSD
Varible
Graduation
Rate
AYP Graduation Goal 90.00 AYP Graduation Goal 90.00
SLUSD 2009 AYP Gradation Rate 81.74 SLUSD 2010 AYP Gradation Rate 83.59
AYP Goal & SLUSD Graduation Rate
Difference8.26
AYP Goal & SLUSD Graduation Rate
Difference6.41
Remaining Years Increment (1/10) 0.83 Remaining Years Increment (1/9) 0.71
2010 Target Fixed Rate 82.57 2011 Target Varible Rate 84.30
2011 Target Fixed Rate 83.3933
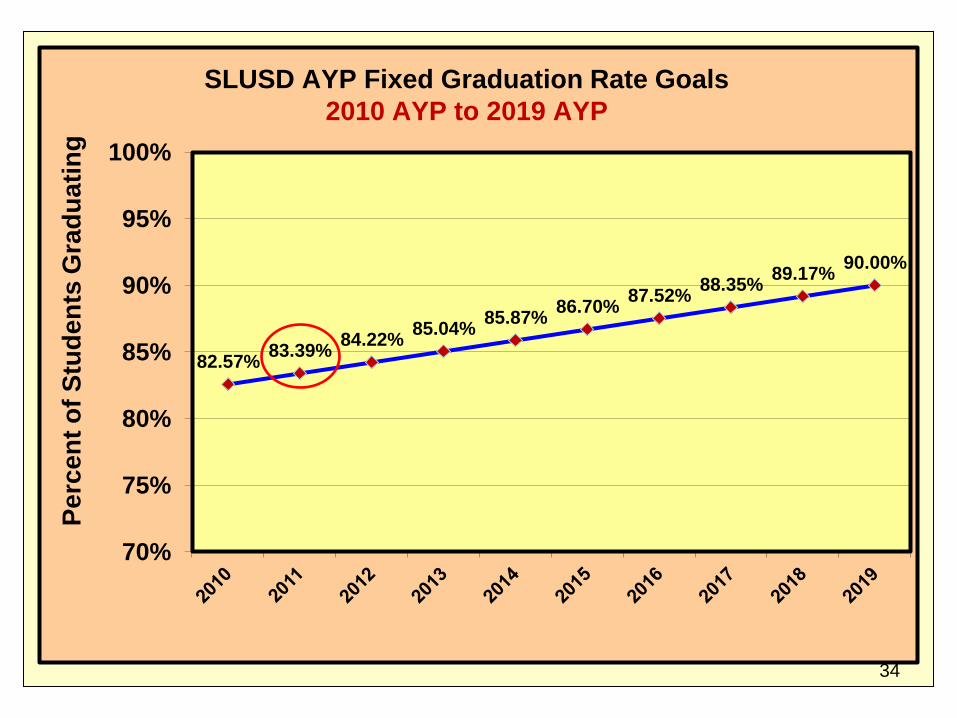
82.57%83.39%
84.22%85.04%
85.87%86.70%
87.52%88.35%
89.17%90.00%
70%
75%
80%
85%
90%
95%
100%
SLUSD AYP Fixed Graduation Rate Goals
2010 AYP to 2019 AYP
Pe
rce
nt
of
Stu
de
nts
Gra
du
ati
ng
34
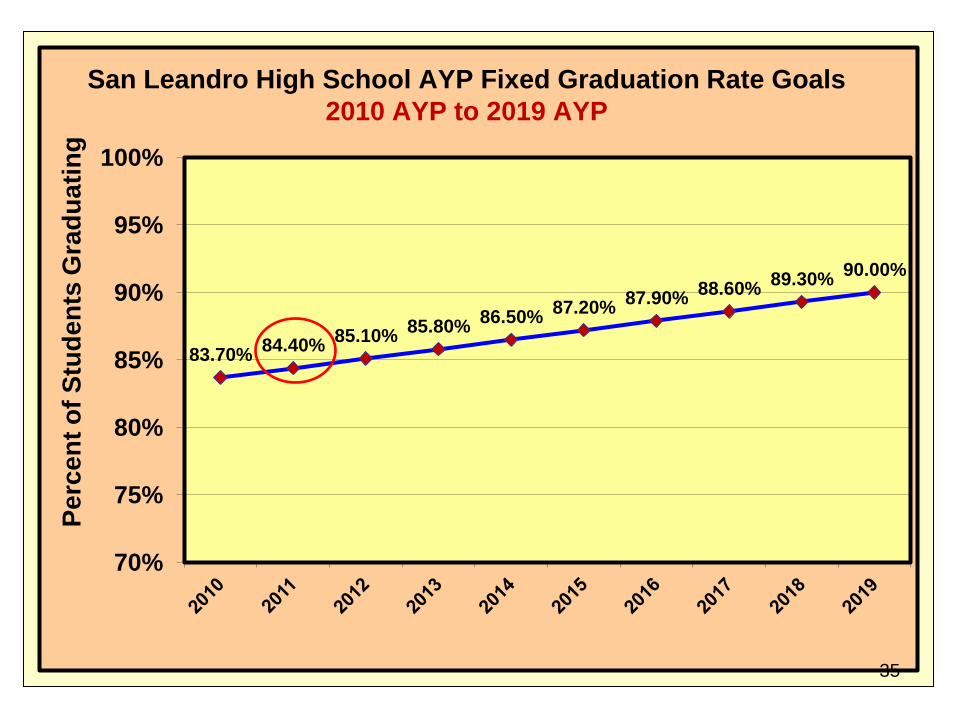
83.70%84.40%
85.10%85.80%
86.50%87.20%
87.90%88.60%
89.30%90.00%
70%
75%
80%
85%
90%
95%
100%
San Leandro High School AYP Fixed Graduation Rate Goals
2010 AYP to 2019 AYP
Pe
rce
nt
of
Stu
de
nts
Gra
du
ati
ng
35
What Are We Doing Now?
Will be outlined in upcoming School Board presentations:
• Academic Tiered Intervention System Update
• Program Improvement LEAP Addendum/IPA Update
36

The End
37
Appendix
38
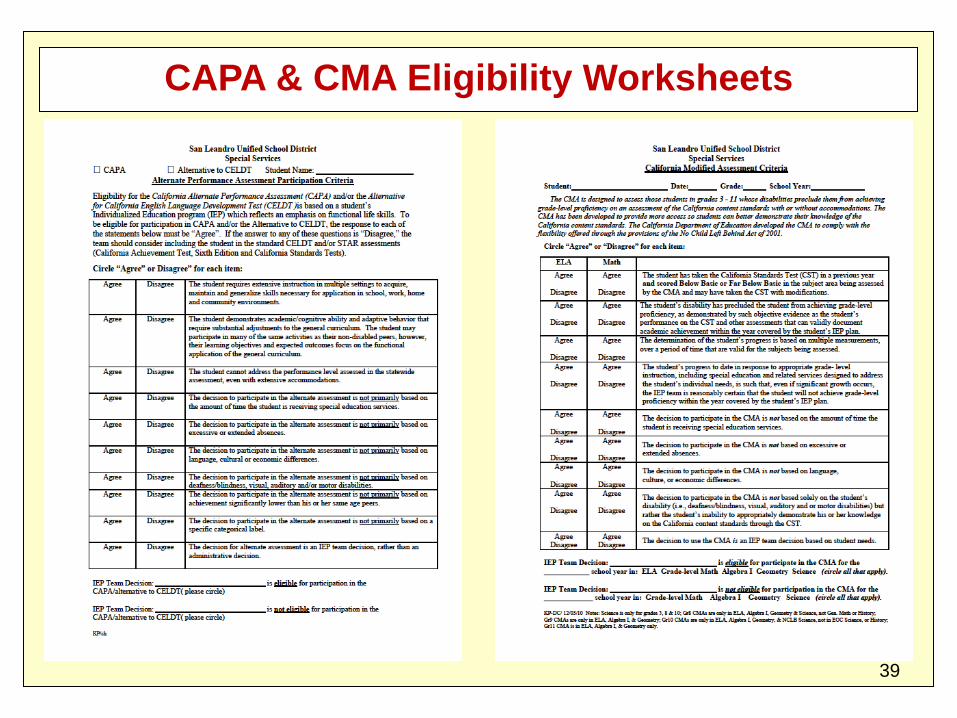
CAPA & CMA Eligibility Worksheets
39
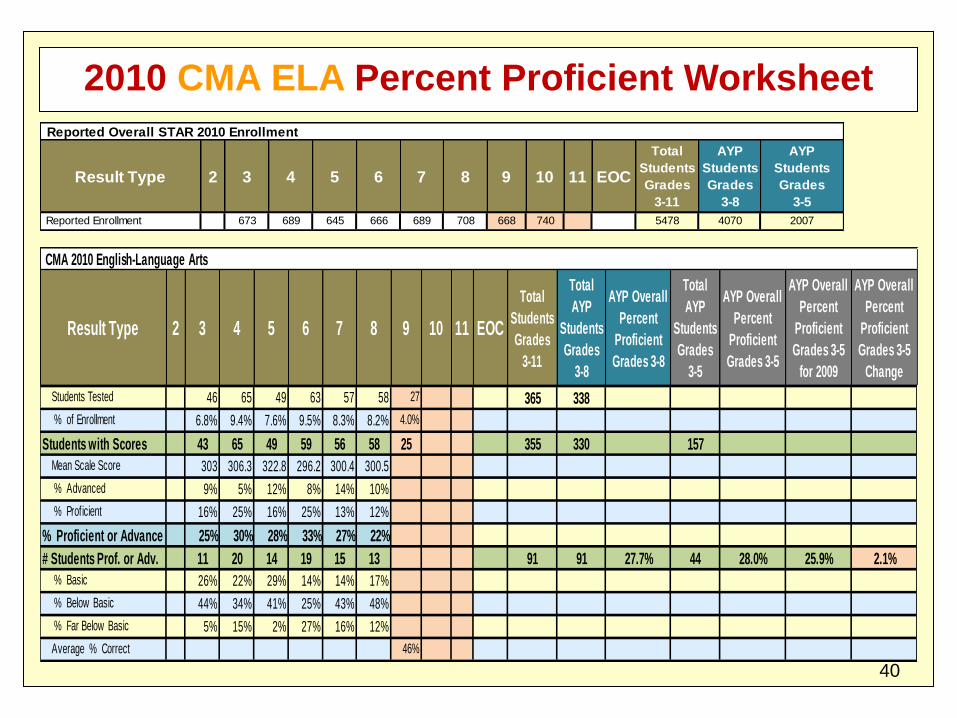
2010 CMA ELA Percent Proficient Worksheet
Reported Overall STAR 2010 Enrollment
Result Type 2 3 4 5 6 7 8 9 10 11 EOC
Total
Students
Grades
3-11
AYP
Students
Grades
3-8
AYP
Students
Grades
3-5
Reported Enrollment 673 689 645 666 689 708 668 740 5478 4070 2007
CMA 2010 English-Language Arts
Result Type 2 3 4 5 6 7 8 9 10 11 EOC
Total
Students
Grades
3-11
Total
AYP
Students
Grades
3-8
AYP Overall
Percent
Proficient
Grades 3-8
Total
AYP
Students
Grades
3-5
AYP Overall
Percent
Proficient
Grades 3-5
AYP Overall
Percent
Proficient
Grades 3-5
for 2009
AYP Overall
Percent
Proficient
Grades 3-5
Change
Students Tested 46 65 49 63 57 58 27 365 338
% of Enrollment 6.8% 9.4% 7.6% 9.5% 8.3% 8.2% 4.0%
Students with Scores 43 65 49 59 56 58 25 355 330 157
Mean Scale Score 303 306.3 322.8 296.2 300.4 300.5
% Advanced 9% 5% 12% 8% 14% 10%
% Proficient 16% 25% 16% 25% 13% 12%
% Proficient or Advance 25% 30% 28% 33% 27% 22%
# Students Prof. or Adv. 11 20 14 19 15 13 91 91 27.7% 44 28.0% 25.9% 2.1%
% Basic 26% 22% 29% 14% 14% 17%
% Below Basic 44% 34% 41% 25% 43% 48%
% Far Below Basic 5% 15% 2% 27% 16% 12%
Average % Correct 46%
40
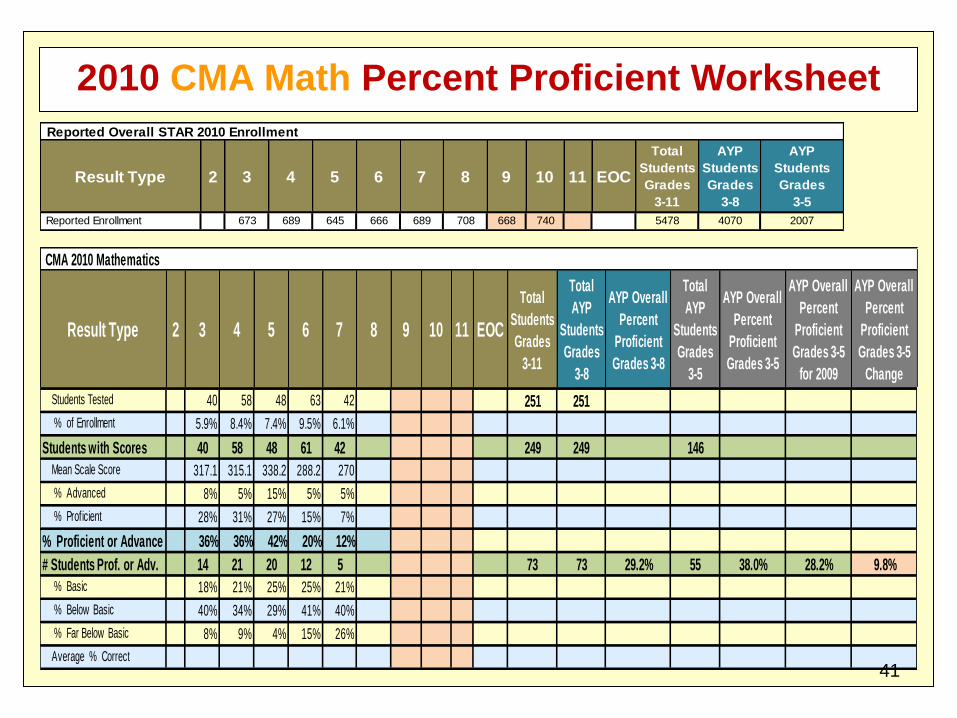
2010 CMA Math Percent Proficient Worksheet
Reported Overall STAR 2010 Enrollment
Result Type 2 3 4 5 6 7 8 9 10 11 EOC
Total
Students
Grades
3-11
AYP
Students
Grades
3-8
AYP
Students
Grades
3-5
Reported Enrollment 673 689 645 666 689 708 668 740 5478 4070 2007
CMA 2010 Mathematics
Result Type 2 3 4 5 6 7 8 9 10 11 EOC
Total
Students
Grades
3-11
Total
AYP
Students
Grades
3-8
AYP Overall
Percent
Proficient
Grades 3-8
Total
AYP
Students
Grades
3-5
AYP Overall
Percent
Proficient
Grades 3-5
AYP Overall
Percent
Proficient
Grades 3-5
for 2009
AYP Overall
Percent
Proficient
Grades 3-5
Change
Students Tested 40 58 48 63 42 251 251
% of Enrollment 5.9% 8.4% 7.4% 9.5% 6.1%
Students with Scores 40 58 48 61 42 249 249 146
Mean Scale Score 317.1 315.1 338.2 288.2 270
% Advanced 8% 5% 15% 5% 5%
% Proficient 28% 31% 27% 15% 7%
% Proficient or Advance 36% 36% 42% 20% 12%
# Students Prof. or Adv. 14 21 20 12 5 73 73 29.2% 55 38.0% 28.2% 9.8%
% Basic 18% 21% 25% 25% 21%
% Below Basic 40% 34% 29% 41% 40%
% Far Below Basic 8% 9% 4% 15% 26%
Average % Correct41
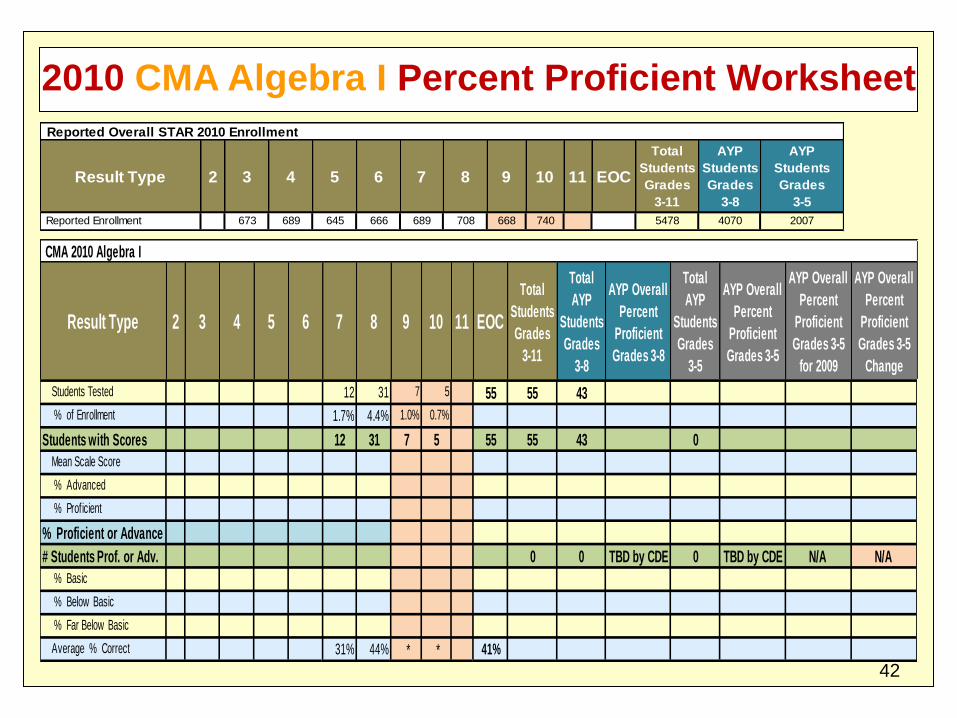
2010 CMA Algebra I Percent Proficient Worksheet
Reported Overall STAR 2010 Enrollment
Result Type 2 3 4 5 6 7 8 9 10 11 EOC
Total
Students
Grades
3-11
AYP
Students
Grades
3-8
AYP
Students
Grades
3-5
Reported Enrollment 673 689 645 666 689 708 668 740 5478 4070 2007
CMA 2010 Algebra I
Result Type 2 3 4 5 6 7 8 9 10 11 EOC
Total
Students
Grades
3-11
Total
AYP
Students
Grades
3-8
AYP Overall
Percent
Proficient
Grades 3-8
Total
AYP
Students
Grades
3-5
AYP Overall
Percent
Proficient
Grades 3-5
AYP Overall
Percent
Proficient
Grades 3-5
for 2009
AYP Overall
Percent
Proficient
Grades 3-5
Change
Students Tested 12 31 7 5 55 55 43
% of Enrollment 1.7% 4.4% 1.0% 0.7%
Students with Scores 12 31 7 5 55 55 43 0
Mean Scale Score
% Advanced
% Proficient
% Proficient or Advance
# Students Prof. or Adv. 0 0 TBD by CDE 0 TBD by CDE N/A N/A
% Basic
% Below Basic
% Far Below Basic
Average % Correct 31% 44% * * 41%
42
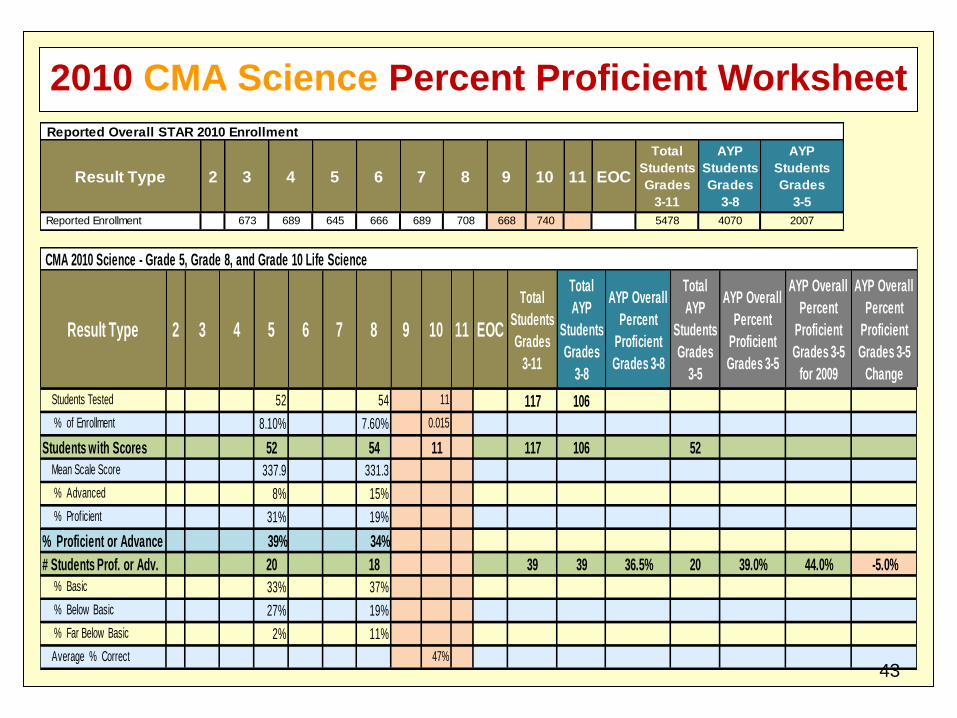
2010 CMA Science Percent Proficient Worksheet
Reported Overall STAR 2010 Enrollment
Result Type 2 3 4 5 6 7 8 9 10 11 EOC
Total
Students
Grades
3-11
AYP
Students
Grades
3-8
AYP
Students
Grades
3-5
Reported Enrollment 673 689 645 666 689 708 668 740 5478 4070 2007
CMA 2010 Science - Grade 5, Grade 8, and Grade 10 Life Science
Result Type 2 3 4 5 6 7 8 9 10 11 EOC
Total
Students
Grades
3-11
Total
AYP
Students
Grades
3-8
AYP Overall
Percent
Proficient
Grades 3-8
Total
AYP
Students
Grades
3-5
AYP Overall
Percent
Proficient
Grades 3-5
AYP Overall
Percent
Proficient
Grades 3-5
for 2009
AYP Overall
Percent
Proficient
Grades 3-5
Change
Students Tested 52 54 11 117 106
% of Enrollment 8.10% 7.60% 0.015
Students with Scores 52 54 11 117 106 52
Mean Scale Score 337.9 331.3
% Advanced 8% 15%
% Proficient 31% 19%
% Proficient or Advance 39% 34%
# Students Prof. or Adv. 20 18 39 39 36.5% 20 39.0% 44.0% -5.0%
% Basic 33% 37%
% Below Basic 27% 19%
% Far Below Basic 2% 11%
Average % Correct 47%43
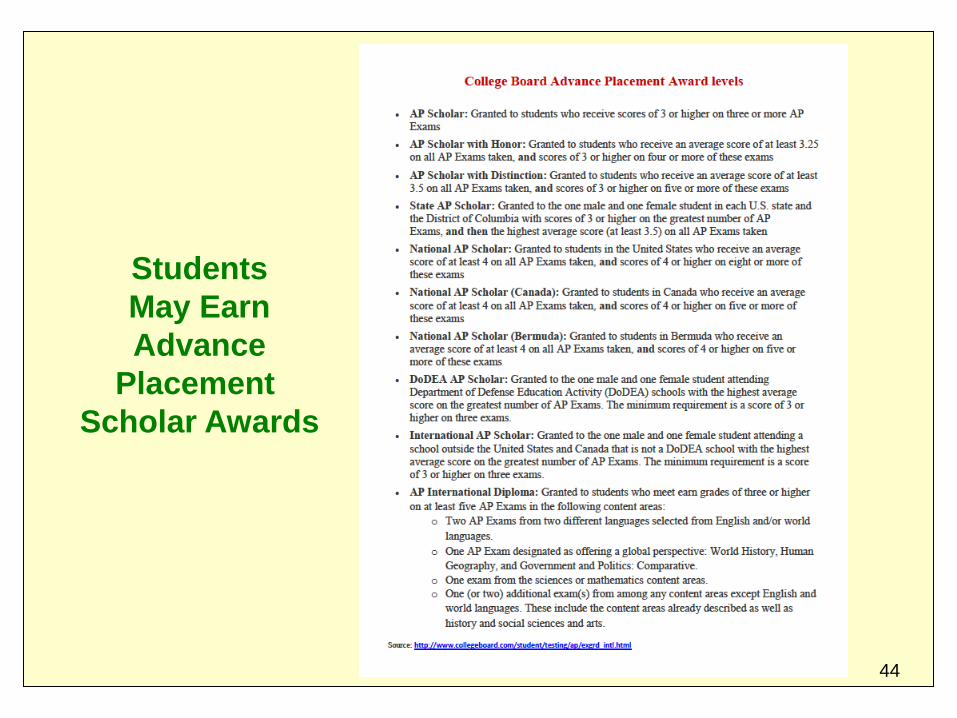
Students
May Earn
Advance
Placement
Scholar Awards
44
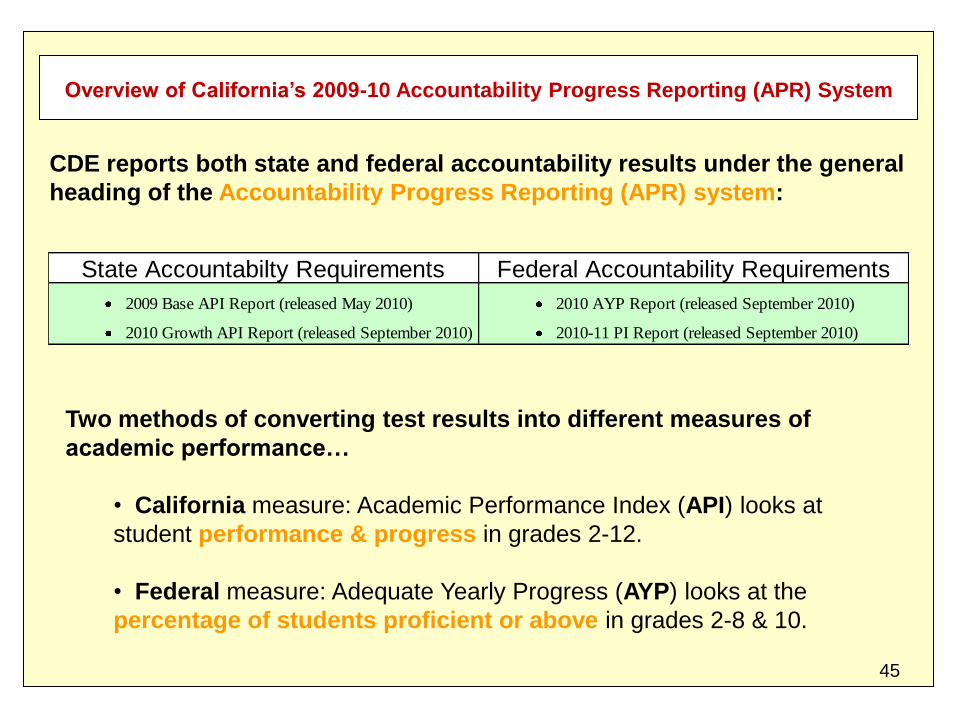
Overview of California’s 2009-10 Accountability Progress Reporting (APR) System
CDE reports both state and federal accountability results under the general
heading of the Accountability Progress Reporting (APR) system:
State Accountabilty Requirements Federal Accountability Requirements
2009 Base API Report (released May 2010) 2010 AYP Report (released September 2010)
2010 Growth API Report (released September 2010) 2010-11 PI Report (released September 2010)
Two methods of converting test results into different measures of
academic performance…
• California measure: Academic Performance Index (API) looks at
student performance & progress in grades 2-12.
• Federal measure: Adequate Yearly Progress (AYP) looks at the
percentage of students proficient or above in grades 2-8 & 10.
45
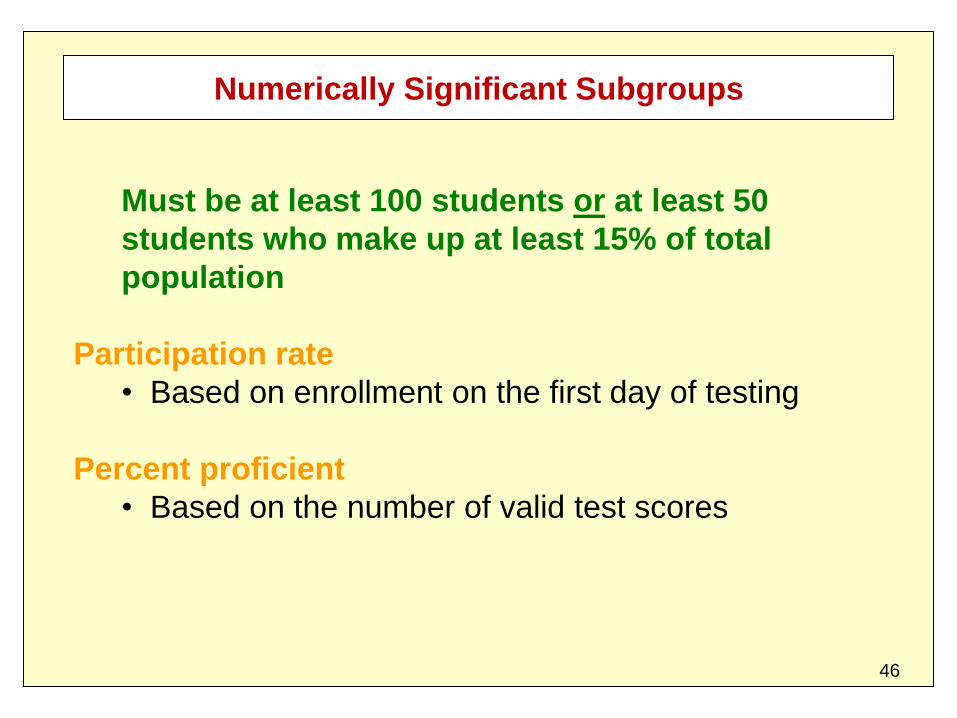
Numerically Significant Subgroups
Must be at least 100 students or at least 50
students who make up at least 15% of total
population
Participation rate
• Based on enrollment on the first day of testing
Percent proficient
• Based on the number of valid test scores
46
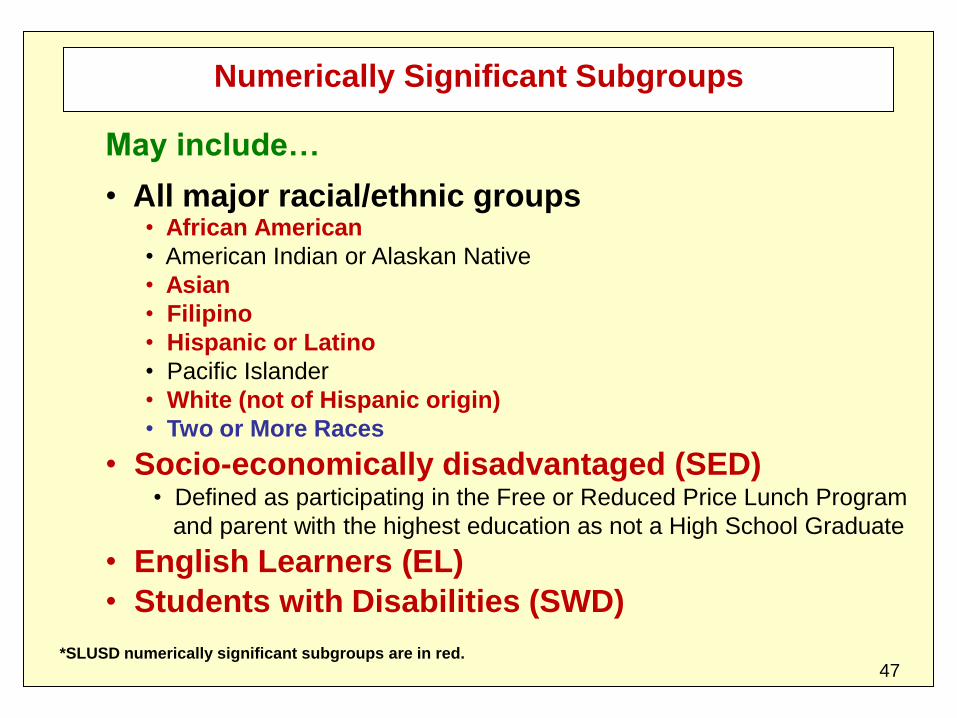
Numerically Significant Subgroups
May include…
• All major racial/ethnic groups
• Socio-economically disadvantaged (SED)• Defined as participating in the Free or Reduced Price Lunch Program
and parent with the highest education as not a High School Graduate
• English Learners (EL)
• Students with Disabilities (SWD)
• African American
• American Indian or Alaskan Native
• Asian
• Filipino
• Hispanic or Latino
• Pacific Islander
• White (not of Hispanic origin)
• Two or More Races
47*SLUSD numerically significant subgroups are in red.
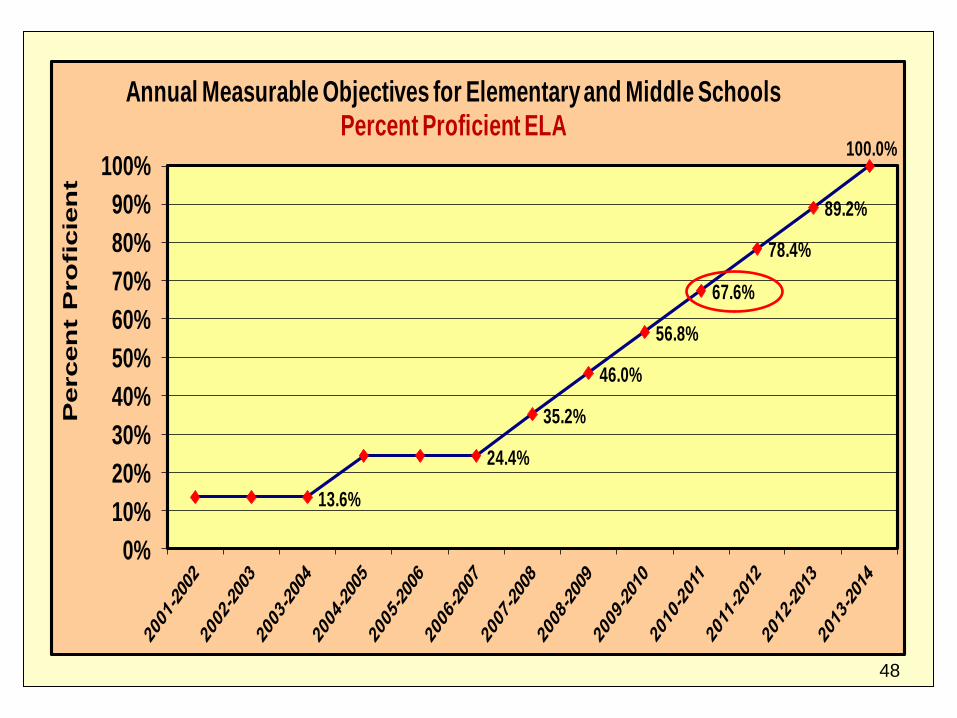
13.6%
24.4%
35.2%
46.0%
56.8%
67.6%
78.4%
89.2%
100.0%
0%
10%
20%
30%
40%
50%
60%
70%
80%
90%
100%
Annual Measurable Objectives for Elementary and Middle SchoolsPercent Proficient ELA
Percen
t P
ro
fic
ien
t
48
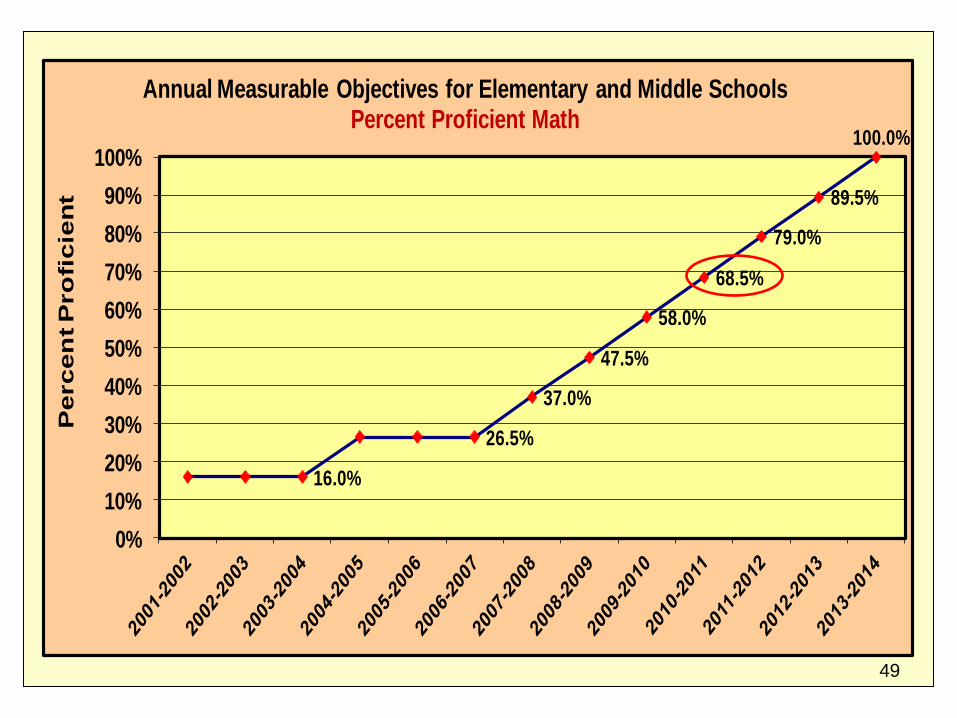
16.0%
26.5%
37.0%
47.5%
58.0%
68.5%
79.0%
89.5%
100.0%
0%
10%
20%
30%
40%
50%
60%
70%
80%
90%
100%
Annual Measurable Objectives for Elementary and Middle SchoolsPercent Proficient Math
Percen
t P
ro
ficie
nt
49
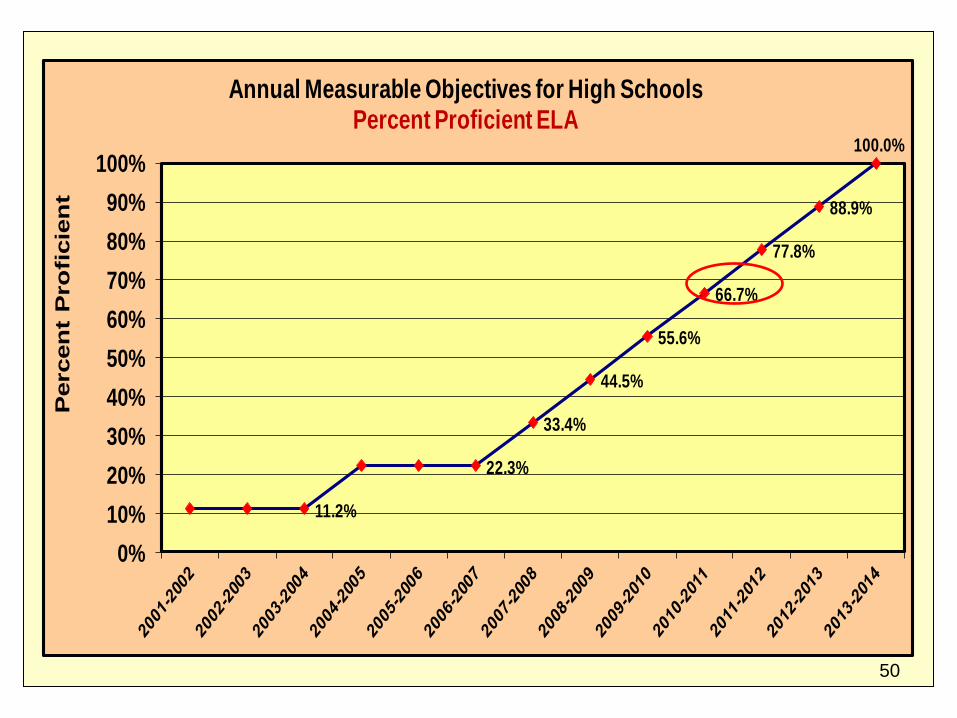
11.2%
22.3%
33.4%
44.5%
55.6%
66.7%
77.8%
88.9%
100.0%
0%
10%
20%
30%
40%
50%
60%
70%
80%
90%
100%
Annual Measurable Objectives for High SchoolsPercent Proficient ELA
Percen
t P
ro
ficie
nt
50

9.6%
20.9%
32.2%
43.5%
54.8%
66.1%
77.4%
88.7%
100.0%
0%
10%
20%
30%
40%
50%
60%
70%
80%
90%
100%
Annual Measurable Objectives for High SchoolsPercent Proficient Math
Percen
t P
ro
ficie
nt
51
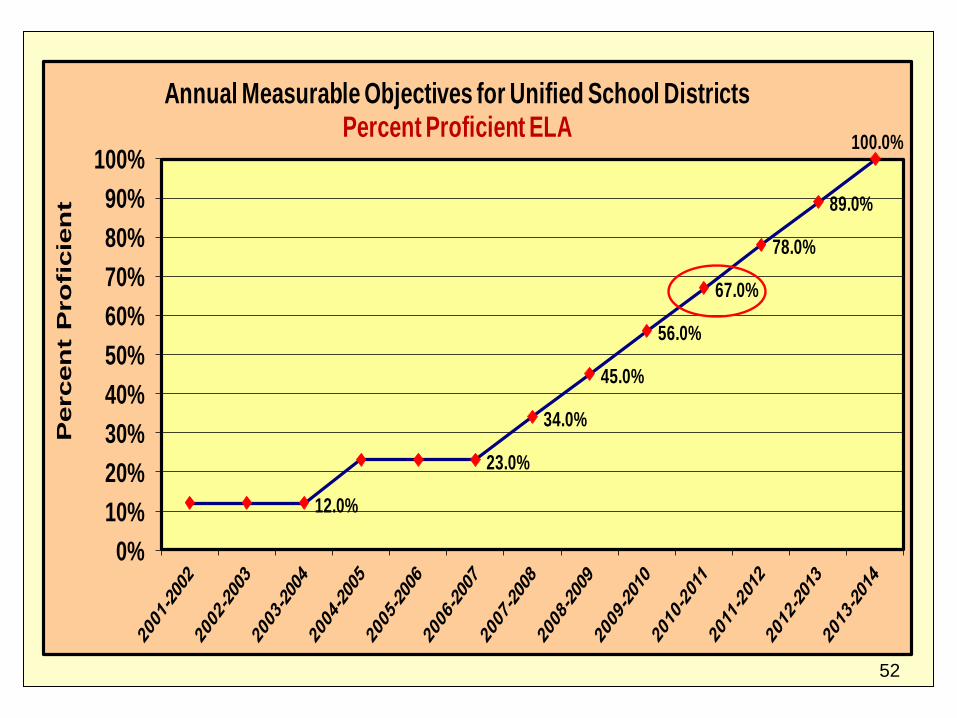
12.0%
23.0%
34.0%
45.0%
56.0%
67.0%
78.0%
89.0%
100.0%
0%
10%
20%
30%
40%
50%
60%
70%
80%
90%
100%
Annual Measurable Objectives for Unified School DistrictsPercent Proficient ELA
Percen
t P
ro
fic
ien
t
52
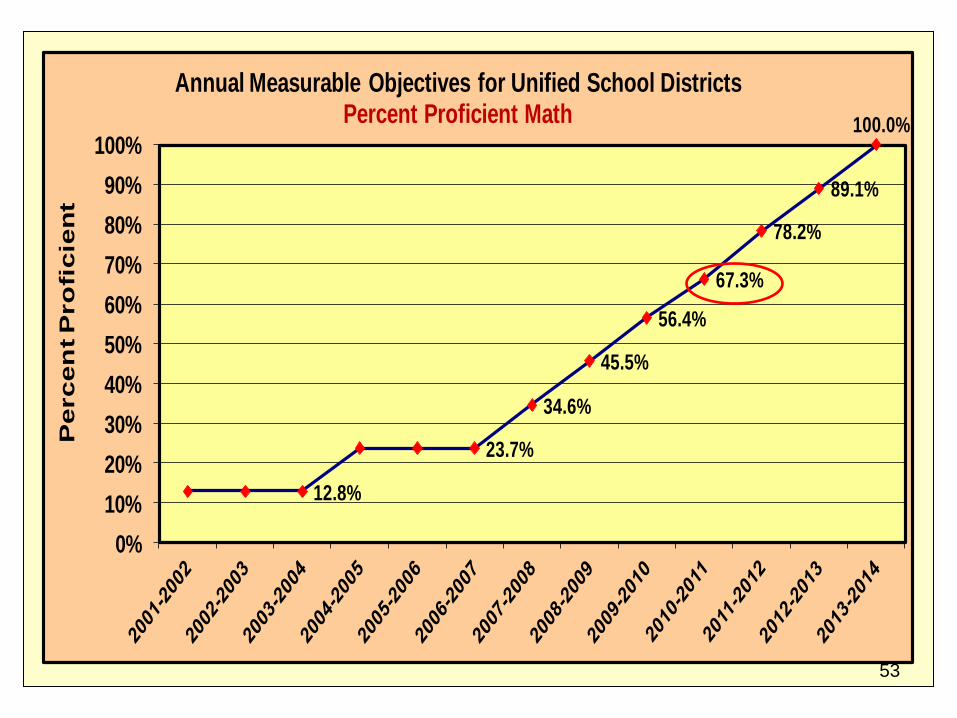
12.8%
23.7%
34.6%
45.5%
56.4%
67.3%
78.2%
89.1%
100.0%
0%
10%
20%
30%
40%
50%
60%
70%
80%
90%
100%
Annual Measurable Objectives for Unified School DistrictsPercent Proficient Math
Pe
rc
en
t P
ro
fic
ien
t
53