Embed Size (px)
Citation preview
Sample Se lec t ion Model Assessing Profess iona l Scout ing P r o g r a m s a n d Pes t i c ide Use
i n Cotton Product ion Jet Yee
Walter Ferguson
A sample selection model is estimated using data from a 1989 survey of cotton farmers in the 14 major producing states to assess the efects of the farmer5 participation in a professional scouting program on pesticide use in cotton production. Our results, based on 1989 conditions, indicate that participation in a professional scouting program increases yield and the number of treatments per acre of pesticides (broadly defined to include herbicides, insecticides, fungicides, desiccants/defoliants, and growth regulators). Use of pest-resistant plants reduces the number of pesticide treatments per acre and irrigation increases the number of treatments per acre. 01996 John Wiley & Sons, Inc.*
There is increasing demand by the general public for the agricultural sector to reduce its use of pes- ticides and accompanying adverse impacts on wa- ter quality, food and applicator safety, wildlife, and other environmental and human health ef- fects. Integrated pest management (IPM) is gener-
...................................................... Request for reprints should be sent to J . Yee, Economic Research
Service, US Department of Agriculture, 1301 New York Ave. NW, Room 532, Washington, DC 20005-4788.
ally advocated as an important potential vehicle for reducing pesticide use while maintaining yield. The Clinton Administration has set a goal of im- plementing IPM on 75% of US total crop acreage by the year 2000. Research results on the econom- ic effects of IPM, however, have been mixed, part- ly because of differences in how IPM is defined.1 Cotton is a leading candidate as a study crop on the issue of reducing pesticides because it is a heavy user of pesticides. This study uses survey data collected from cotton producers to assess the effect of IPM use in a professional scouting pro- gram on pesticide use.2
By most definitions of IPM, scouting is an impor- tant component of an IPM program.3.4 Scouting consists of monitoring the presence and population counts of various pests and recommending specific pest control practices. The importance of profes- sional scouting calls for research on the economic and environmental effects of professional scouting programs. Results from the analysis may be useful in evaluating the current debate on the impact of professional scouting and other IPM practices on pesticide use in cotton production, and to target those geographical areas and production practices
............................................................................................................... The views expressed are the authors and do not necessarily represent the policies or views of the USDA.
The authors are Agricultural Economists with the Economic Research Service, US Department of Agriculture, Washington, DC. ...............................................................................................................
Agribusiness, Vol. 12, No. 3, 291-300 (1996) 0 1996 b y John Wdey & Sons, Inc. *This article is a US Government work, and, as such, is in the public domain in the United States of America.
291 CCC 0742-4477/96/030291-10
Yee and Ferguson
that are heavy users of pesticide. Other IPM tac- tics developed against cotton pests (insects, nema- todes, plant pathogens, and weeds) include crop site selection, crop rotation, tillage, varietal resis- tance, short season production, fertility manage- ment, water management, time of planting, time of harvest, crop residue destruction, intensive scout- ing, trapping, natural enemy preservation, and pesticide selection and timing.
In this article, the term “professional scouting” refers only to scouting under the supervision of a professional scouting firm and thus excludes scout- ing done by the farmer and pesticide representa- tives or salesmen employed by chemical companies. Professional scouts use crop system information to integrate biological, cultural, and chemical control methods with the objectives of enhancing yield while preventing pest resistance to pesticides. As emphasized by Miranowski and Carlson,5 avoiding pest resistance to pesticides, or preserving pest susceptibility, is influenced by pest mobility, pest detection, farm size, available arrays of chemical and nonchemical control, and other factors. A major objective of IPM is applying pesticides with respect to the economic threshold, the level at which the marginal benefits of control equals the marginal cost of control. In cotton production, this level of pest control is usually accomplished by stressing application of chemical pesticides.6 In recent years, there has been an increased focus on the use of nonchemical practices to reduce pesticide use while maintaining yield.
participate in a professional scouting program are made by each farmer, farm-level data are needed to analyze the decision-making process. The analysis includes some important variables not included in previous studies and is based on data from a 1989 survey of cotton farmers by the US Department of Agriculture.* Previous studies have used case study data limited to producers in a few states o r aggregate data at the county or regional level. This study uses over a dozen independent variables and 1,448 observations. In contrast, B u r r o w ~ , ~ using techniques similar to ours, used 47 cotton growers in California to assess the impact of IPM on pesticide use. In case study evaluations of IPM cotton programs, Napit et a1.8
Because input choices and decisions to
used 135 producers in Mississippi and Texas, Wetzstein et al.9 30 producers in Georgia, and Carlson’o 17 producers in North Carolina.
Production in 1989 in the 14 states covered by the survey was estimated to be 12.2 million bales on 10.5 million planted acres. Cotton acreage scouted by professional scouts increased to 55% of the cotton acreage in the 14 major producing states in 1989 from 41% in 1982, an average increase of about 2% per year.
The plan for the remainder of this article is as follows. First, we discuss the survey employed. The sample selection model and variables are then discussed, followed by the model results. The article closes with concluding remarks.
Data and Methodology
Survey Discussion and Results
The data used in the analysis are from a 1989 US Department of Agriculture survey of cotton pro- ducers. The data include the 14 major production states, which were divided for analysis into four regions: Southeast (Alabama, Georgia, North Car- olina, South Carolina), Delta (Arkansas, Louisi- ana, Missouri, Mississippi, Tennessee), Southern Plains (Oklahoma, Texas, New Mexico), and West (Arizona, California). The survey collected de- tailed data on agricultural chemical use, produc- tion practices, and resource conditions associated with cotton production. A stratified sample was taken to be representative of cotton cropland. The survey was field based; that is, data on agricul- tural chemical use and resource characteristics are relevant for the sample field. Some additional eco- nomic and demographic data were collected that pertain to the farm operation as a whole. Com- plete details on the data and collection methods, as well as a copy of the survey questionnaire, are available in Crutchfield et al.ll
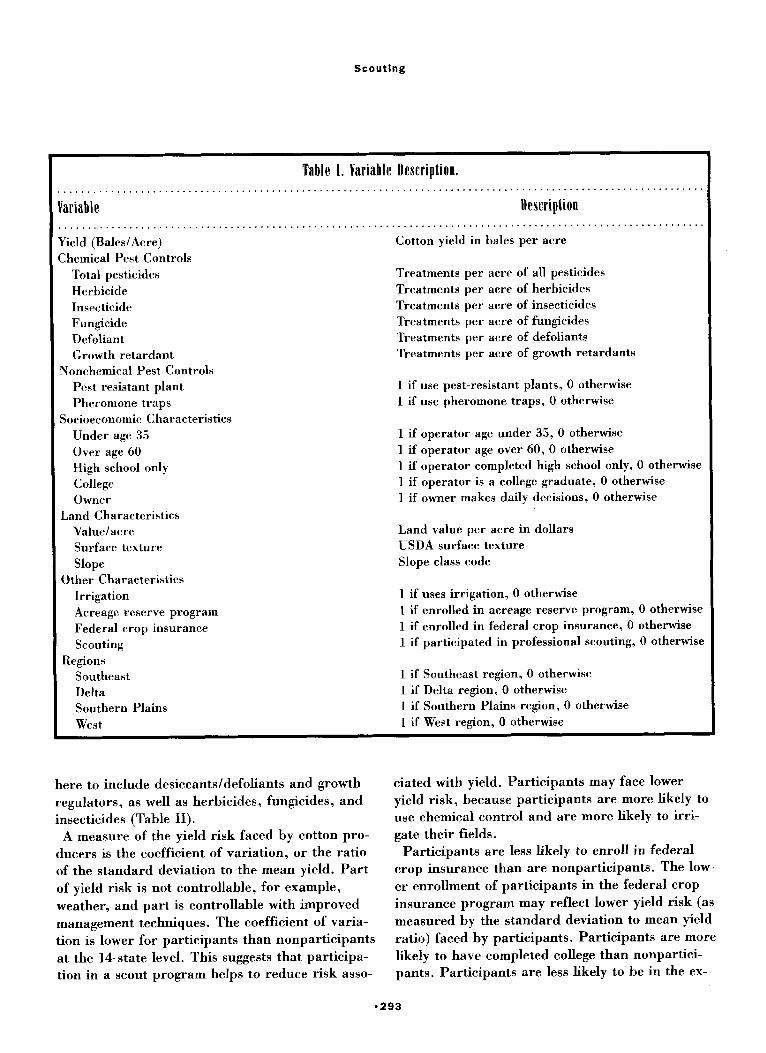
The variables considered in the study are defined in Table I. At the national level (14 states), the producers in a professional scout program reported higher mean yields than farmers not participating. Producers in a professional scout program also make greater use of pesticides, broadly defined
0292
Scouting
Table I. Variable Description. I . . . . . . . . . . . . . . . . . . . . . . . . . . . . . . . . . . . . . . . . . . . . . . . . . . . . . . . . . . . . . . . . . . . . . . . . . . . . . . . . . . . . . . . . . . . . . . . . . . . . . . . . . . . . . Variable Description . . . . . . . . . . . . . . . . . . . . . . . . . . . . . . . . . . . . . . . . . . . . . . . . . . . . . . . . . . . . . . . . . . . . . . . . . . . . . . . . . . . . . . . . . . . . . . . . . . . . . . . . . . . . . Yield (BaledAcre) Chemical Pest Controls
Total pesticides Herbicide Insecticide Fungicide Defoliant Growth retardant
Pest resistant plant Pheromone traps
Under age 35 Over age 60 High school only College Owner
Valuelacre Surface texture USDA surface texture Slope Slope class code
Irrigation Acreage reserve program Federal crop insurance Scouting
Regions Southeast Delta Southern Plains West
Cotton yield in bales per acre
Treatments per acre of all pesticides Treatments per acre of herbicides Treatments per acre of insecticides Treatments per acre of fungicides Treatments per acre of defoliants Treatments per acre of growth retardants
1 if use pest-resistant plants, 0 otherwise 1 if use pheromone traps, 0 otherwise
1 if operator age under 35, 0 otherwise 1 if operator age over 60, 0 otherwise 1 if operator completed high school only, 0 otherwise 1 if operator is a college graduate, 0 otherwise 1 if owner makes daily decisions, 0 otherwise
Land value per acre in dollars
Nonchemical Pest Controls
Socioeconomic Characteristics
Land Characteristics
Other Characteristics 1 if uses irrigation, 0 otherwise 1 if enrolled in acreage reserve program, 0 otherwise 1 if enrolled in federal crop insurance, 0 otherwise 1 if participated in professional scouting, 0 otherwise
1 if Southeast region, 0 otherwise 1 if Delta region, 0 otherwise 1 if Southern Plains region, 0 otherwise 1 if West region, 0 otherwise
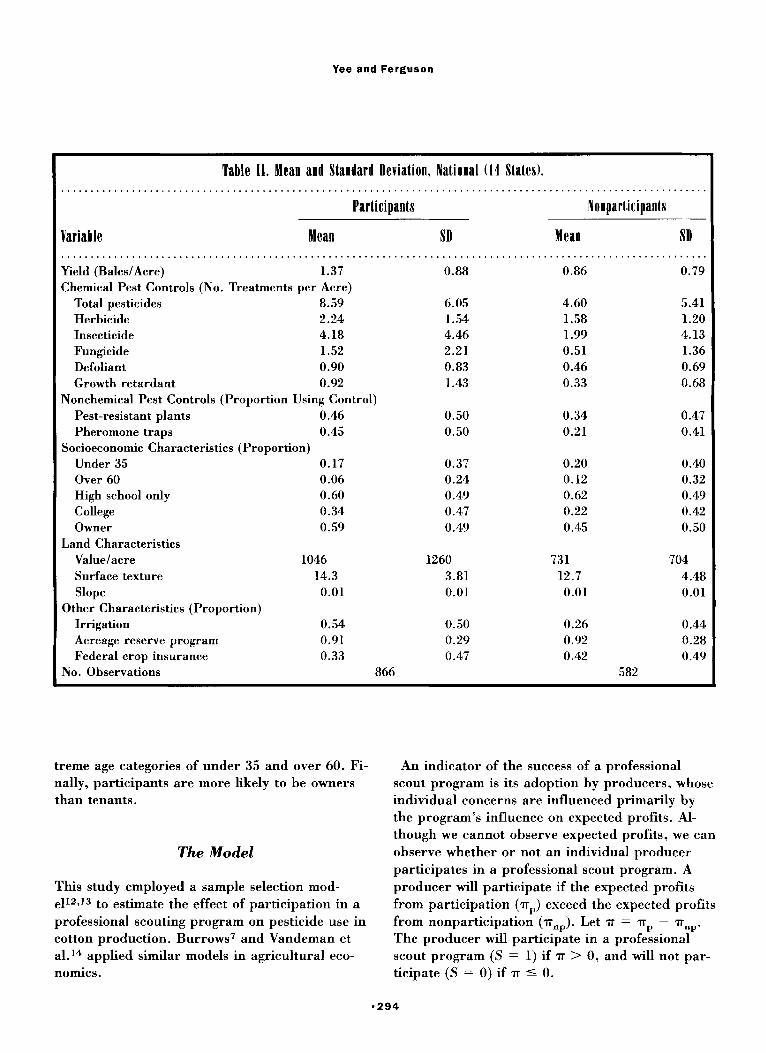
here to include desiccants/defoliants and growth ciated with yield. Participants may face lower regulators, as well as herbicides, fungicides, and insecticides (Table 11).
A measure of the yield risk faced by cotton pro- ducers is the coefficient of variation, or the ratio of the standard deviation to the mean yield. Part of yield risk is not controllable, for example, weather, and part is controllable with improved management techniques. The coefficient of varia- tion is lower for participants than nonparticipants at the 14-state level. This suggests that participa- tion in a scout program helps to reduce risk asso-
yield risk, because participants are more likely to use chemical control and are more likely to irri- gate their fields.
Participants are less likely to enroll in federal crop insurance than are nonparticipants. The low- er enrollment of participants in the federal crop insurance program may reflect lower yield risk (as measured by the standard deviation to mean yield ratio) faced by participants. Participants are more likely to have completed college than nonpartici- pants. Participants are less likely to be in the ex-
*293
Yee and Ferguson
Table 11. Mean and Standard Deviation, National (14 Slales). . . . . . . . . . . . . . . . . . . . . . . . . . . . . . . . . . . . . . . . . . . . . . . . . . . . . . . . . . . . . . . . . . . . . . . . . . . . . . . . . . . . . . . . . . . . . . . . . . . . . . . . . . . . . .
Participants Nonparticipants
Var i a b I e Mean SD Mean SD . . . . . . . . . . . . . . . . . . . . . . . . . . . . . . . . . . . . . . . . . . . . . . . . . . . . . . . . . . . . . . . . . . . . . . . . . . . . . . . . . . . . . . . . . . . . . . . . . . . . . . . . . . . . . Yield (BalesIAcre) 1.37 0.88 0.86 0.79 Chemical Pest Controls (No. Treatments per Acre)
Total pesticides 8.59 6.05 4.60 5.41 Herbicide 2.24 1.54 1.58 1.20 Insecticide 4.18 4.46 1.99 4.13 Fungicide 1.52 2.21 0.51 1.36 Defoliant 0.90 0.83 0.46 0.69 Growth retardant 0.92 1.43 0.33 0.68
Pest-resistant plants 0.46 0.50 0.34 0.47 Pheromone traps 0.45 0.50 0.21 0.41
Under 35 0.17 0.37 0.20 0.40 Over 60 0.06 0.24 0.12 0.32 High school only 0.60 0.49 0.62 0.49 College 0.34 0.47 0.22 0.42 Owner 0.59 0.49 0.45 0.50
Valuelacre 1046 1260 731 704 Surface texture 14.3 3.81 12.7 4.48
Nonchemical Pest Controls (Proportion Using Control)
Socioeconomic Characteristics (Proportion)
Land Characteristics
Slope 0.01 0.01 0.01 0.01 Other Characteristics (Proportion)
Irrigation 0.54 0.50 0.26 0.44 Acreage reserve program 0.91 0.29 0.92 0.28 Federal crop insurance 0.33 0.47 0.42 0.49
No. Observations 866 582
treme age categories of under 35 and over 60. Fi- nally, participants are more likely to be owners than tenants.
The Model
This study employed a sample selection mod- ell2+l3 to estimate the effect of participation in a professional scouting program on pesticide use in cotton production. Burrows7 and Vandeman et al.14 applied similar models in agricultural eco- nomics.
An indicator of the success of a professional scout program is its adoption by producers, whose individual concerns are influenced primarily by the program’s influence on expected profits. Al- though we cannot observe expected profits, we can observe whether or not an individual producer participates in a professional scout program. A producer will participate if the expected profits from participation (n,) exceed the expected profits from nonparticipation (nnp). Let IT = nP - nnP. The producer will participate in a professional scout program (S = 1) if n > 0, and will not par- ticipate (S = 0) if n 5 0.
0294
Scouting
The sample selection model we thus employ con- sists of the following two equations:
.rr=yz+u (2)
where P is pesticide use; X is a vector of variables affecting P; S is a binary (0, 1) variable represent- ing the decision to participate in a professional scouting program; Z is a vector of variables affect- ing IT; and E , u are error terms.
Because P and .rr both depend on many of the same explanatory variables, any measurement er- rors in the explanatory variables or omitted vari- ables influencing both P and IT may lead to a correlation between the two error terms u and E .
We assume that u and E have a bivariate normal distribution with mean 0, standard deviations U,
= 1 and uE, and correlation p. The difference in expected pesticide use between
participants and nonparticipants is (see Greene, l3
p. 748)
E [ P I s = 11 - E [ P 1 s = 01
(3)
where cp and are, respectively, the density and distribution function for a standard normal vari- able evaluated at yZ in Eq. (2). However, single equation estimation of the pesticide use Eq. (1) assumes that the difference in pesticide use be- tween participants and nonparticipants is only 6, and ignores the second term on the right-hand side of Eq. (3) holding all other variables con- stant.
We see from Eq. (3) that single-equation estima- tion of the pesticide use Eq. (1) leads to a biased estimate of the effect of scouting on pesticide use because it does not consider the second term on the right-hand side of Eq. (3). This bias is elimi- nated by the use of our sample selection model, which consists of both Eqs. (1) and (2).
the sample selection feature in LIMDEP (see Greene,15 p. 609). The sample selection process
The sample selection model was estimated using
involves Heckman’sI2 two-step estimation proce- dure:
1. Estimate the scouting equation, Eq. (2), as a pro- bit model using maximum likelihood to obtain es- timates of y. For each observation, compute
and
(4)
2. Regress P on X, S, and A by ordinary least squares. The single-equation model omits X as an explanatory variable, and thus produces biased and inconsistent estimates of the coefficients.
Discussion of Variables
The explanatory variables considered in the Z vec- tor include variables that impact the individual farmer’s decision to participate or not participate. These variables may include use of pesticide, non- chemical pest control, irrigation, and participation in the federal crop insurance and acreage reserve programs. However, it is not possible, given the current state of knowledge in econometric tech- niques, to estimate our system of two equations, Eqs. (1) and (2), if pesticide use (P) is included in the Z ~ e c t o r . ~ , ’ ~ P is thus excluded from the 2 vector.
The vector Z may also include socioeconomic characteristics of the decision maker that affect the probability of the farmer’s participation in a professional scout program. Farmer features in- cluded education, age, and tenure. As hypothe- sized by Napit et a1.,8 education may increase the ability of farmers to assess the merits of an IPM program, and is included as three discrete catego- ries: less than high school, high school graduate, and college graduate.
35, 35 to 60, and over 60. Hypothetically, these age groups could reflect differences in risk aver-
The age variable includes three categories: under
-295
Yee and Ferguson
sion and flexibility in adoption of new technol- ogy. Compared with farmers nearing retirement, younger farmers may be less risk averse in adopt- ing new technology, but more constrained if new technology represents increased costs.
may also have an effect on participation in a pro- fessional scout program. The owner’s greater pro- pensity toward participation may reflect the need for longer range planning to take full advantage of longer range IPM strategies.
Additional variables in the Z vector, which are statistically significant in the estimation, are land value per acre and land surface texture. Finally, regional dummy variables are included in the Z vector to account for differences among the re- gions in climate and pest populations.
Pesticide use P is measured in terms of pesticide treatments per acre. The explanatory variables in Eq. (1) used to explain pesticide use include pest- resistant plants, pheromone traps, irrigation, fed- eral crop insurance, land value per acre, land slope, regional dummy variables, and more impor- tantly for our purpose, participation in a profes- sional scouting program. While many professional scouting programs include the use of pest-resistant plants and pheromone traps, we include these two variables in the model because they may not be in- cluded in a few scouting programs, and because these two practices may also be used by nonpar- ticipants (see Table 11).
Whether a farmer is an owner or tenant operator
Results and Discussion
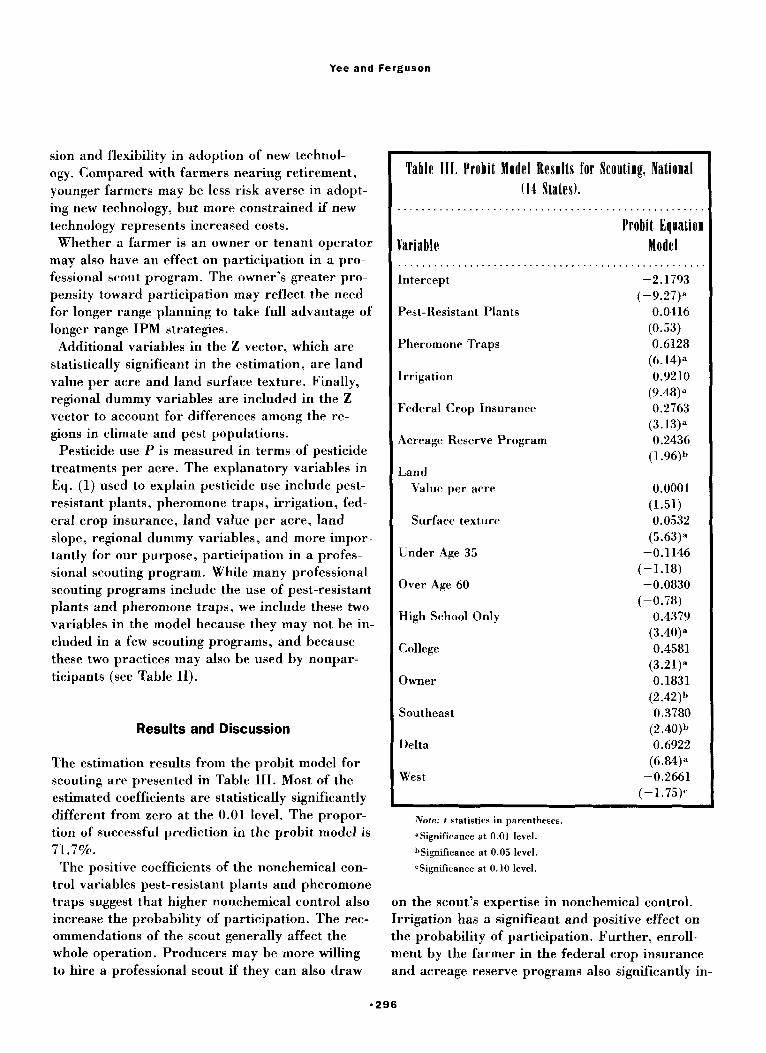
The estimation results from the probit model for scouting are presented in Table 111. Most of the estimated coefficients are statistically significantly different from zero at the 0.01 level. The propor- tion of successful prediction in the probit model is 71.7%.
The positive coefficients of the nonchemical con- trol variables pest-resistant plants and pheromone traps suggest that higher nonchemical control also increase the probability of participation. The rec- ommendations of the scout generally affect the whole operation. Producers may be more willing to hire a professional scout if they can also draw
_ _ ~ ~ __ ~
Table 111 . Probit Model Results for Scouting, National (14 States).
. . . . . . . . . . . . . . . . . . . . . . . . . . . . . . . . . . . . . . . . . . . . . . . . . . . .
Variable . . . . . . . . . ..................... Intercept
Pest-Resistant Plants
Pheromone Traps
Irrigation
Federal Crop Insurance
Acreage Reserve Program
Land Value per acre
Surface texture
Under Age 35
Over Age 60
High School Only
College
Owner
Southeast
Delta
West
Probit Equation Model
. . . . . . . . . . . . . . . . . . . -2.1793
(-9.27)a 0.0416
(0.53) 0.6128
(6.14.p 0.9210
(9.48)” 0.2763
0.2436 (1.96)b
(3.13p
0.0001 (1.51) 0.0532
(5.63)a -0.1146
(-1.18)
(-0.78) -0.0830
0.4379 (3 .40)a 0.4581
0.1831 (2.42)b 0.3780
(2.40)b 0.6922
- 0.2661 ( - 1 . 75)c
(3.21)=
(6.84) a
Note: t statistics in parentheses.
PSignificance at 0.01 level.
hSignificance at 0.05 level.
CSignificance at 0.10 level.
on the scout’s expertise in nonchemical control. Irrigation has a significant and positive effect on the probability of participation. Further, enroll- ment by the farmer in the federal crop insurance and acreage reserve programs also significantly in-
* 296
Scouting
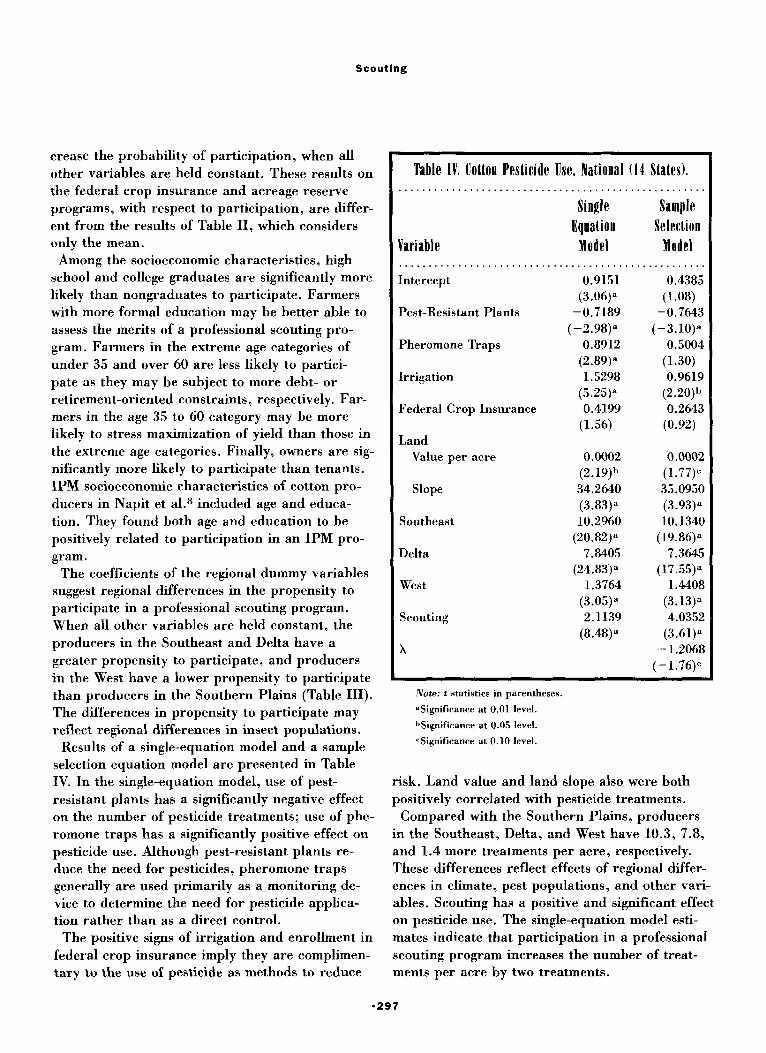
crease the probability of participation, when all other variables are held constant. These results on the federal crop insurance and acreage reserve programs, with respect to participation, are differ- ent from the results of Table 11, which considers only the mean.
Among the socioeconomic characteristics, high school and college graduates are significantly more likely than nongraduates to participate. Farmers with more formal education may be better able to assess the merits of a professional scouting pro- gram. Farmers in the extreme age categories of under 35 and over 60 are less likely to partici- pate as they may be subject to more debt- or retirement-oriented constraints, respectively. Far- mers in the age 35 to 60 category may be more likely to stress maximization of yield than those in the extreme age categories. Finally, owners are sig- nificantly more likely to participate than tenants. IPM socioeconomic characteristics of cotton pro- ducers in Napit et a1.8 included age and educa- tion. They found both age and education to be positively related to participation in an IPM pro- gram.
The coefficients of the regional dummy variables suggest regional differences in the propensity to participate in a professional scouting program. When all other variables are held constant, the producers in the Southeast and Delta have a greater propensity to participate, and producers in the West have a lower propensity to participate than producers in the Southern Plains (Table 111). The differences in propensity to participate may reflect regional differences in insect populations.
selection equation model are presented in Table Results of a single-equation model and a sample
Table IV. Cotton Pesticide Use, National (14 States). ....................................................
Variable .......................... Intercept
Pest-Resistant Plants
Pheromone Traps
Irrigation
Federal Crop Insurance
Land Value per acre
Slope
Southeast
Delta
West
Scouting
x
Single Equation
Model . . . . . . . . . . . . .
0.9151
- 0.7 189 (-2.98)"
0.8912 (2.89)" 1.5298
0.4199 (1.56)
0.0002 (2.19)b 34.2640
10.2960 (20.82) a
7.8405 (24.83)"
1.3764
2.1139
(3.06)=
(5.25p
(3.83)a
(3.05)"
(8.48) a
. . .
Sample Selection
Model . . . . . . . . . .
0.4385 (1.08)
-0.7643 (-3. 10)"
0.5004 (1.30) 0.9619
0.2643 (0.92)
0.0002 (1.77)c 35.0950
10.1340 (19.86)a
7.3645 (17.55)a
1.4408 (3.13)" 4.0352
(3 .61)" - 1.2068
(2.20)b
(3.93)"
(- 1.76)c
Note: t statistics in parentheses. aSignificance at 0.01 level. bsignificance at 0.05 level. cSignificance at 0.10 level.
IV. In the single-equation model, use of pest- resistant plants has a significantly negative effect on the number of pesticide treatments; use of phe- romone traps has a significantly positive effect on pesticide use. Although pest-resistant plants re- duce the need for pesticides, pheromone traps generally are used primarily as a monitoring de- vice to determine the need for pesticide applica- tion rather than as a direct control.
The positive signs of irrigation and enrollment in federal crop insurance imply they are complimen- tary to the use of pesticide as methods to reduce
risk. Land value and land slope also were both positively correlated with pesticide treatments.
Compared with the Southern Plains, producers in the Southeast, Delta, and West have 10.3, 7.8, and 1.4 more treatments per acre, respectively. These differences reflect effects of regional differ- ences in climate, pest populations, and other vari- ables. Scouting has a positive and significant effect on pesticide use. The single-equation model esti- mates indicate that participation in a professional scouting program increases the number of treat- ments per acre by two treatments.
0297
Yee and Ferguson
The results of the single-equation model are sub- ject to bias because the single-equation model ig- nores the correlation between the error terms in Eqs. (1) and (2). Thus, we next discuss the results of the sample selection model, which does take into account the correlation in the error terms. All of the variable signs are the same as in the single- equation model, but are in general slightly less sig- nificant.
Use of pest-resistant plants reduces the number of pesticide treatments by about three-fourths of a treatment per acre, and use of pheromone traps increases the number of treatments by one-half treatment per acre. Irrigation increases the num- ber of treatments by about one.
Compared with those in the Southern Plains, producers in the Southeast, Delta, and West have 10.1, 7.4, and 1.4 more treatments per acre, re- spectively. The sample selection model estimates indicate that participation in a professional scout- ing program increases the number of treatments per acre by four treatments, as compared with an increase of two treatments in the single-equation model. Thus, the use of a single-equation model underestimates the increase in additional treat- ments as a result of participation in a scouting program. The statistical significance of the coeffi- cient of h implies that there is correlation between the error terms in Eqs. (1) and (2). Thus use of the sample selection model was necessary to obtain unbiased estimates of the coefficients, including the effect of scouting on pesticide use.
In a literature review, Norton and Mullenl sum- marized the economic effects of IPM programs in cotton. They found that generally yield increased and pesticide use decreased with IPM use. Sum- marizing the economic effects of IPM programs is difficult, however, because of differences in loca- tions, time periods, and practices considered in the studies.
Napit et a1.8 used complete budget analysis to evaluate IPM cotton programs in Mississippi and Georgia and found higher and less variable net re- turns per acre for IPM users, than for nonusers, with increased pesticide cost per acre with each increase in level of TPM use. In a 1987 Extension Service evaluation of IPM,3 costs and returns were indicated for low and high users of IPM,
each classification defined primarily by extent of crop acreage scouted. Although the high users of IPM had higher yields and net returns than the low users, the high user expenditures for pesti- cides were higher in Mississippi and Texas by $18 and $10 per acre, respectively.
Use of professional scouting services can be im- portant in carrying out long-term IPM programs, such as the boll weevil eradication program. Stud- ies by Carlson et al.17 and Ohouissoussi et a1.18 found that a boll weevil eradication program was successful in increasing yield with reduced control cost17 and no significant effect on control costI8 in several of the southeastern states.
Burrows7 examined IPM on cotton in California’s San Joaquin Valley, where it is typically offered to growers on a fee-per-acre basis by consultants. He used techniques similar to ours to examine the ef- fect of IPM on pesticide expenditures per acre. Most of the variables in Burrows’ model were not significant as judged by the low t statistics. In con- trast, the majority of our variables are significant at the 1% level. Burrows found that IPM signifi- cantly reduced pesticide use. We found that par- ticipation in a professional scouting program significantly increases the number of pesticide treatments per acre.
There are several possible reasons why our re- sults differ from Burrows. His measure of pesti- cide use, pesticide expenditure per acre, differed from our measure of pesticide use, treatments per acre. Most of his explanatory variables are differ- ent from ours. His model did not contain demo- graphic variables, such as age and education. Further, we have a much larger sample size of 1,448 observations encompassing the 14 major producing states, but Burrows considered only 47 producers in the San Joaquin Valley.
Concluding Remarks
In summary, this study employed a sample selec- tion model to assess the effect of participation in a professional cotton scouting program on pesticide use in cotton production. Use of pest-resistant plants reduces the number of pesticide treatments by about three-fourths of a treatment. Irrigation
Scouting
increases the number of treatments by about one treatment. Compared with those in the Southern Plains, producers in the Southeast, Delta, and West have, respectively, 10.1, 7.4, and 1.4 more pesticide treatments per acre. The sample selec- tion model estimates indicate that participation in a professional scouting program increases the number of treatments per acre by four treat- ments. This increase in number of treatments is partly because of applying pesticides in response to the economic threshold, rather than applying nonchemical control practices. Use of the econom- ic threshold has also increased yield.
There are several caveats to the interpretation of our results. There are several variables that may affect pesticide use that we omitted from the mod- el because of lack of data. These variables include farm size and pest population density. Big farms may have more to lose and may be more likely to use scouting and make greater use of pesticides as
insurance. Our results are based only on 1989 conditions, and may be different for other years. On the other hand, estimates a t the regional levels generally supported the results obtained at the na- tional level. The t statistics were in general lower than the t statistics for the national model.
The evidence in the literature on the effect of IPM use on pesticide use in cotton production is inconclusive. More research is needed to deter- mine the robustness of our results using alterna- tive IPM definitions and data sets for other years and other crops. More research also is needed to examine policies that allow reducing pesticide use while maintaining yield. For example, more atten- tion could be paid to market-oriented solutions to enhance nonchemical use in cotton. Examples in- clude tax credits to cover the cost of nonchemical use and extension of the life of patents on nonche- mica1 control.
1. G. Norton and J. Mullen, Economic Evaluation of Inte- grated Pest Management Programs, Virginia Polytechnic and State University, Publ. 448-120, 1994.
2. US Department of Agriculture, “Water Quality Survey, 1989,” National Agricultural Statistics Service, Agricul- ture Statistics Board, Washington, DC, 1989.
3. W.A. Allen (Program Leader), The National Evaluation of Extension’s Integrated Pest Management ( I P M ) Pro- grams, Virginia Cooperative Extension Service, Virginia Tech, and Virginia State in cooperation with US Depart- ment of Agriculture, Extension Service, VCES 491-011-024, 1987.
B. Lin, Adoption of Integrated Pest Management in U.S. Agriculture, USDA, Economic Research Service, Agricul- ture Information Bulletin 707, Washington, DC, Septem- ber 1994.
4. A. Vandeman, J . Fernandez-Cornejo, S. Jans, and
5. J . Miranowski and G. Carlson, “Economic Issues in Puh- lic and Private Approaches to Preserving Pest Suscep- tibility,” in Pesticide Resistance, Strategies and Tactics for Management, National Academy Press, Washington, DC, 1986.
6. E. Rajotte (Research Leader), The National Evaluation of Extension’s Integrated Pest Management (IPM) Pro- grams, Virginia Cooperative Extension Service, VCES 491-011-024, personal communication, 1992.
References
-299
7. T.M. Burrows, “Pesticide Demand and Integrated Pest Man- agement: A Limited Dependent Variable Analysis,” American Journal of Agricultural Economics, 65, 806 (1983).
8. K.B. Napit, G.W. Norton, R.F. Kazmierczak, and E.G. Rajotte, “Economic Impacts of Extension Integrated Pest Management Programs in Several States,” Journal of Economic Entomology, 81, 251 (1988).
9. M. Wetzstein, W. Musser, D. Linder, and K. Douce, “An Evaluation of Integrated Pest Management with Hetero- geneous Participation,” Western Journal of Agricultural Economics, 10, 344 (1985).
10. G. Carlson. “IPM Experience in North Carolina Crops,” in Tar Heel Economist, North Carolina Agricultural Ex- tension Service, North Carolina State University a t Raleigh, 1981.
11. S. Crutchfield, M. Ribaudo. P. Setia, D. Letson, and L. Hansen, Cotton Production and Water Quality, Staff Re- port AGES 9105, USDA, Washington, DC, January 1991.
12. J . Heckman, “Sample Selection Bias as a Specification Bias,” Econometrica, 47, 153 (1979).
13. W.H. Greene, Econometric Analysis, Macmillan, New York, 1990.
14. A. Vandeman, E. Sadoulet, and A. de Janvry, “Labor Contracting and a Theory of Contract Choice in Califor- nia Agriculture,” Amsriran Journal Agricultural Eco- nomics, 73, 681 (1991).
Yee and Ferguson
15. W.H. Greene, LIMDEP, User’s Manual and Reference Report 621, Economic Research Service, USDA, Wash- ington, DC, 1989.
18. N. Ohouissoussi, M. Wetzstein, and P. Duffy, “Economic Returns to the Boll Weevil Eradication Program,” lour- na.1 of Agricultural and Applied Economics, 25(2), 46 (1993).
Guide, Version 6.0, Econometric Software, Inc. New York, 1992.
16. W.H. Greene, Personal Communication, 1992. 17. G. Carlson, G. Sappie, and M. Hammig, Economic Re-
turns to Boll Weevil Eradication, Agricultural Economic
300