Embed Size (px)
Citation preview

SA-SV-05-1
UNIVERSITY OF CALIFORNIA - COOPERATIVE EXTENSION
2005
SAMPLE COSTS TO PRODUCE
SAFFLOWER
in the Sacramento Valley Dryland
Prepared by Jerry Schmierer UC Cooperative Extension Farm Advisor, Colusa, Sutter & Yuba Counties Doug Munier UC Cooperative Extension Farm Advisor, Glenn, Tehama & Butte Counties Kent Brittan UC Cooperative Extension Farm Advisor, Yolo, Solano, & Sacramento Counties Rachael Long UC Cooperative Extension Farm Advisor, Yolo, Solano, & Sacramento Counties Karen M. Klonsky UC Cooperative Extension Economist, Department of Agriculture and Resource
Economics, UC Davis Pete Livingston UC Cooperative Extension Staff Research Associate, Department of Agriculture
and Resource Economics, UC Davis
2005 Safflower Dryland Costs and Returns Study Sacramento Valley UC Cooperative Extension 2
UNIVERSITY OF CALIFORNIA COOPERATIVE EXTENSION 2005
SAMPLE COST TO PRODUCE SAFFLOWER In the Sacramento Valley
Dryland
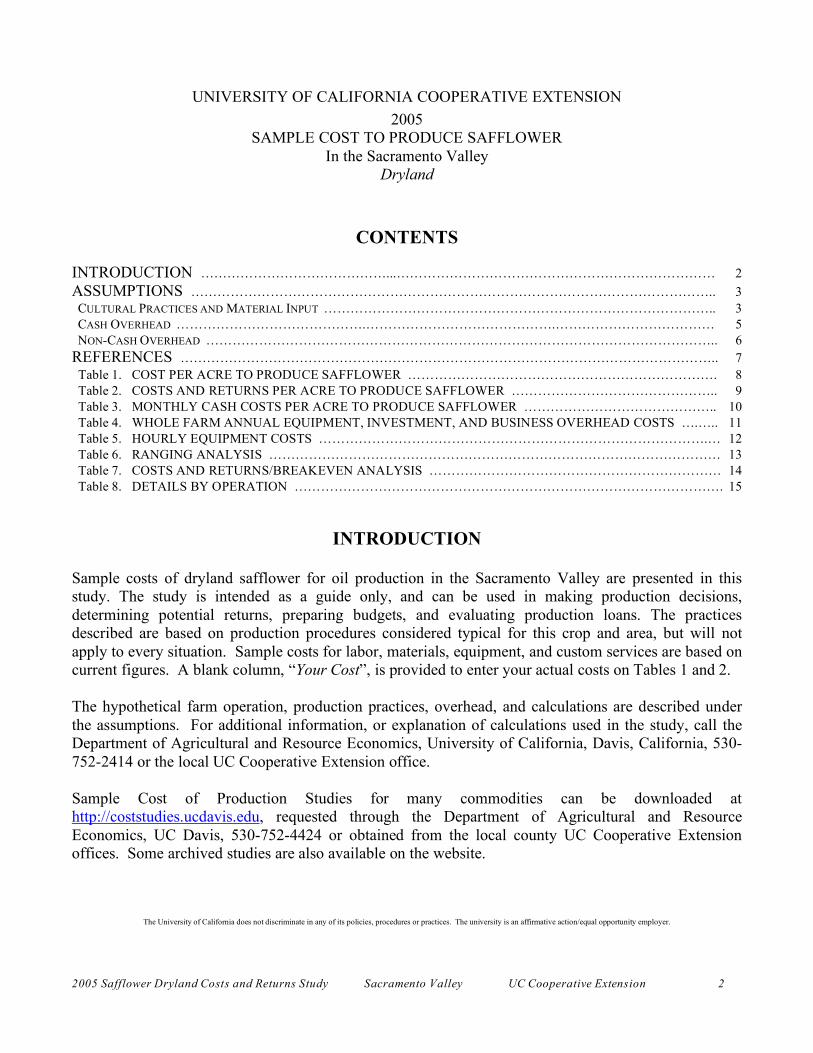
CONTENTS INTRODUCTION ……………………………………...……………………………………………………………… 2 ASSUMPTIONS ……………………………………………………………………………………………………….. 3 CULTURAL PRACTICES AND MATERIAL INPUT …………………………………………………………………………….. 3 CASH OVERHEAD …………………………………….…………………………………….……………………………… 5 NON-CASH OVERHEAD …………………………………………………………………………………………………….. 6 REFERENCES ………………………………………………………………………………………………………….. 7 Table 1. COST PER ACRE TO PRODUCE SAFFLOWER ……………………………………………………………. 8 Table 2. COSTS AND RETURNS PER ACRE TO PRODUCE SAFFLOWER ……………………………………….. 9 Table 3. MONTHLY CASH COSTS PER ACRE TO PRODUCE SAFFLOWER …………………………………….. 10 Table 4. WHOLE FARM ANNUAL EQUIPMENT, INVESTMENT, AND BUSINESS OVERHEAD COSTS ….….. 11 Table 5. HOURLY EQUIPMENT COSTS …………………………………………………………………………….… 12 Table 6. RANGING ANALYSIS ………………………………………………………………………………………… 13 Table 7. COSTS AND RETURNS/BREAKEVEN ANALYSIS ………………………………………………………… 14 Table 8. DETAILS BY OPERATION ……………………………………………………………………………………. 15
INTRODUCTION Sample costs of dryland safflower for oil production in the Sacramento Valley are presented in this study. The study is intended as a guide only, and can be used in making production decisions, determining potential returns, preparing budgets, and evaluating production loans. The practices described are based on production procedures considered typical for this crop and area, but will not apply to every situation. Sample costs for labor, materials, equipment, and custom services are based on current figures. A blank column, “Your Cost”, is provided to enter your actual costs on Tables 1 and 2. The hypothetical farm operation, production practices, overhead, and calculations are described under the assumptions. For additional information, or explanation of calculations used in the study, call the Department of Agricultural and Resource Economics, University of California, Davis, California, 530-752-2414 or the local UC Cooperative Extension office. Sample Cost of Production Studies for many commodities can be downloaded at http://coststudies.ucdavis.edu, requested through the Department of Agricultural and Resource Economics, UC Davis, 530-752-4424 or obtained from the local county UC Cooperative Extension offices. Some archived studies are also available on the website.
The University of California does not discriminate in any of its policies, procedures or practices. The university is an affirmative action/equal opportunity employer.
2005 Safflower Dryland Costs and Returns Study Sacramento Valley UC Cooperative Extension 3
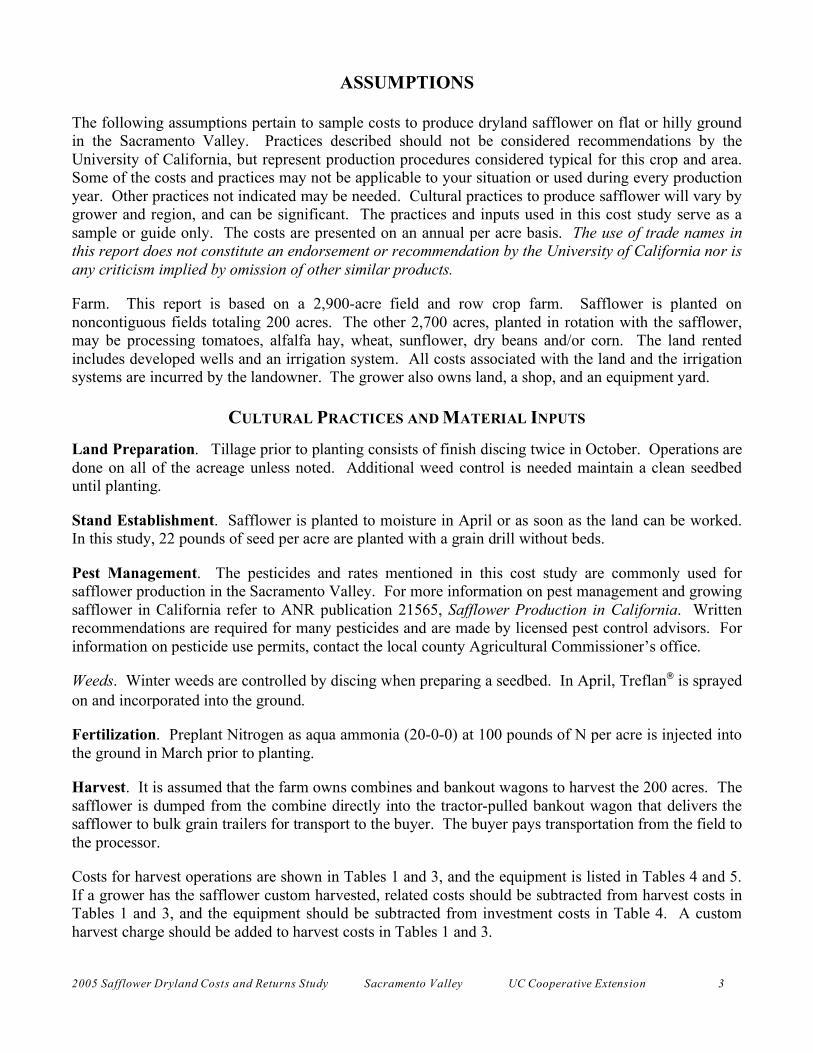
ASSUMPTIONS The following assumptions pertain to sample costs to produce dryland safflower on flat or hilly ground in the Sacramento Valley. Practices described should not be considered recommendations by the University of California, but represent production procedures considered typical for this crop and area. Some of the costs and practices may not be applicable to your situation or used during every production year. Other practices not indicated may be needed. Cultural practices to produce safflower will vary by grower and region, and can be significant. The practices and inputs used in this cost study serve as a sample or guide only. The costs are presented on an annual per acre basis. The use of trade names in this report does not constitute an endorsement or recommendation by the University of California nor is any criticism implied by omission of other similar products. Farm. This report is based on a 2,900-acre field and row crop farm. Safflower is planted on noncontiguous fields totaling 200 acres. The other 2,700 acres, planted in rotation with the safflower, may be processing tomatoes, alfalfa hay, wheat, sunflower, dry beans and/or corn. The land rented includes developed wells and an irrigation system. All costs associated with the land and the irrigation systems are incurred by the landowner. The grower also owns land, a shop, and an equipment yard.
CULTURAL PRACTICES AND MATERIAL INPUTS
Land Preparation. Tillage prior to planting consists of finish discing twice in October. Operations are done on all of the acreage unless noted. Additional weed control is needed maintain a clean seedbed until planting. Stand Establishment. Safflower is planted to moisture in April or as soon as the land can be worked. In this study, 22 pounds of seed per acre are planted with a grain drill without beds. Pest Management. The pesticides and rates mentioned in this cost study are commonly used for safflower production in the Sacramento Valley. For more information on pest management and growing safflower in California refer to ANR publication 21565, Safflower Production in California. Written recommendations are required for many pesticides and are made by licensed pest control advisors. For information on pesticide use permits, contact the local county Agricultural Commissioner’s office. Weeds. Winter weeds are controlled by discing when preparing a seedbed. In April, Treflan® is sprayed on and incorporated into the ground. Fertilization. Preplant Nitrogen as aqua ammonia (20-0-0) at 100 pounds of N per acre is injected into the ground in March prior to planting. Harvest. It is assumed that the farm owns combines and bankout wagons to harvest the 200 acres. The safflower is dumped from the combine directly into the tractor-pulled bankout wagon that delivers the safflower to bulk grain trailers for transport to the buyer. The buyer pays transportation from the field to the processor. Costs for harvest operations are shown in Tables 1 and 3, and the equipment is listed in Tables 4 and 5. If a grower has the safflower custom harvested, related costs should be subtracted from harvest costs in Tables 1 and 3, and the equipment should be subtracted from investment costs in Table 4. A custom harvest charge should be added to harvest costs in Tables 1 and 3.
2005 Safflower Dryland Costs and Returns Study Sacramento Valley UC Cooperative Extension 4
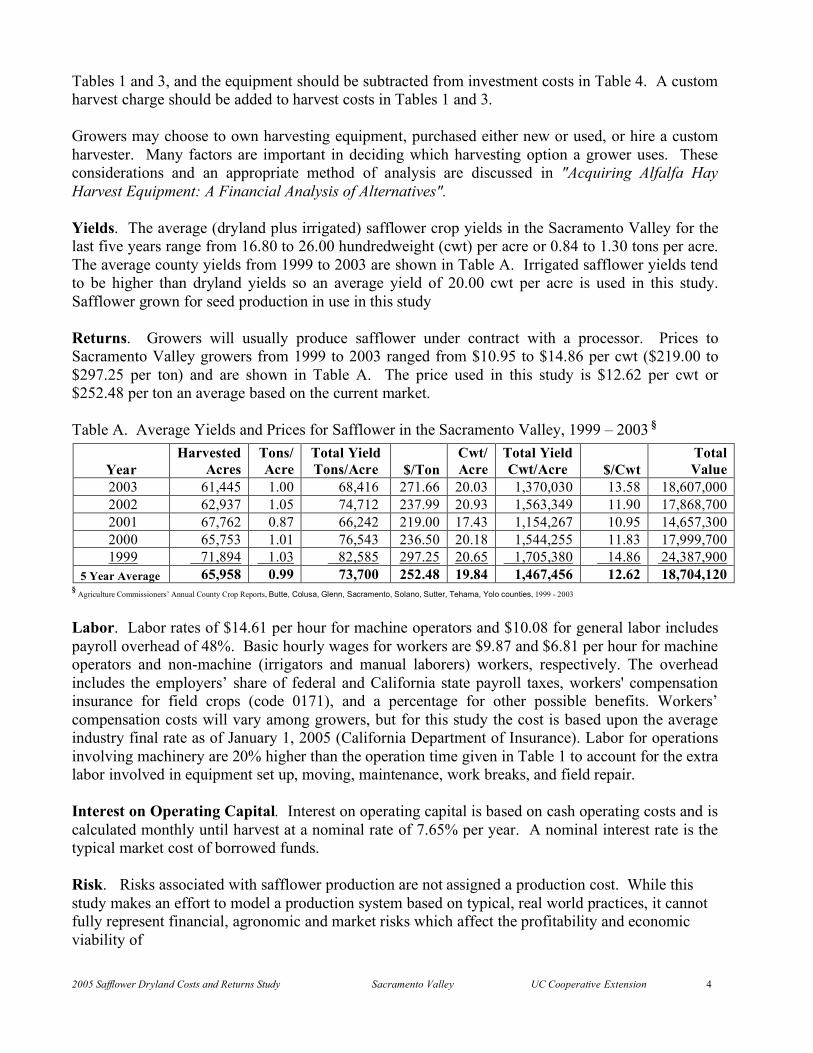
Tables 1 and 3, and the equipment should be subtracted from investment costs in Table 4. A custom harvest charge should be added to harvest costs in Tables 1 and 3. Growers may choose to own harvesting equipment, purchased either new or used, or hire a custom harvester. Many factors are important in deciding which harvesting option a grower uses. These considerations and an appropriate method of analysis are discussed in "Acquiring Alfalfa Hay Harvest Equipment: A Financial Analysis of Alternatives". Yields. The average (dryland plus irrigated) safflower crop yields in the Sacramento Valley for the last five years range from 16.80 to 26.00 hundredweight (cwt) per acre or 0.84 to 1.30 tons per acre. The average county yields from 1999 to 2003 are shown in Table A. Irrigated safflower yields tend to be higher than dryland yields so an average yield of 20.00 cwt per acre is used in this study. Safflower grown for seed production in use in this study Returns. Growers will usually produce safflower under contract with a processor. Prices to Sacramento Valley growers from 1999 to 2003 ranged from $10.95 to $14.86 per cwt ($219.00 to $297.25 per ton) and are shown in Table A. The price used in this study is $12.62 per cwt or $252.48 per ton an average based on the current market. Table A. Average Yields and Prices for Safflower in the Sacramento Valley, 1999 – 2003
§
§ Agriculture Commissioners’ Annual County Crop Reports, Butte, Colusa, Glenn, Sacramento, Solano, Sutter, Tehama, Yolo counties, 1999 - 2003
Labor. Labor rates of $14.61 per hour for machine operators and $10.08 for general labor includes payroll overhead of 48%. Basic hourly wages for workers are $9.87 and $6.81 per hour for machine operators and non-machine (irrigators and manual laborers) workers, respectively. The overhead includes the employers’ share of federal and California state payroll taxes, workers' compensation insurance for field crops (code 0171), and a percentage for other possible benefits. Workers’ compensation costs will vary among growers, but for this study the cost is based upon the average industry final rate as of January 1, 2005 (California Department of Insurance). Labor for operations involving machinery are 20% higher than the operation time given in Table 1 to account for the extra labor involved in equipment set up, moving, maintenance, work breaks, and field repair. Interest on Operating Capital. Interest on operating capital is based on cash operating costs and is calculated monthly until harvest at a nominal rate of 7.65% per year. A nominal interest rate is the typical market cost of borrowed funds. Risk. Risks associated with safflower production are not assigned a production cost. While this study makes an effort to model a production system based on typical, real world practices, it cannot fully represent financial, agronomic and market risks which affect the profitability and economic viability of
Year Harvested
Acres Tons/Acre
Total Yield Tons/Acre $/Ton
Cwt/Acre
Total Yield Cwt/Acre $/Cwt
Total Value
2003 61,445 1.00 68,416 271.66 20.03 1,370,030 13.58 18,607,000 2002 62,937 1.05 74,712 237.99 20.93 1,563,349 11.90 17,868,700 2001 67,762 0.87 66,242 219.00 17.43 1,154,267 10.95 14,657,300 2000 65,753 1.01 76,543 236.50 20.18 1,544,255 11.83 17,999,700 1999 71,894 1.03 82,585 297.25 20.65 1,705,380 14.86 24,387,900 5 Year Average 65,958 0.99 73,700 252.48 19.84 1,467,456 12.62 18,704,120

2005 Safflower Dryland Costs and Returns Study Sacramento Valley UC Cooperative Extension 5
CASH OVERHEAD COSTS
Cash overhead consists of various cash expenses paid out during the year that are assigned to the whole farm and not to a particular operation. These costs include property taxes, interest on operating capital, office expense, liability and property insurance, and equipment repairs.
Property Taxes. Counties charge a base property tax rate of 1% on the assessed value of the property. In some counties special assessment districts exist and charge additional taxes on property including equipment, buildings, and improvements. For this study, county taxes are calculated as 1% of the average value of the property. Average value equals new cost plus salvage value divided by 2 on a per acre basis. Insurance. Insurance for farm investments vary depending on the assets included and the amount of coverage. Property insurance provides coverage for property loss and is charged at 0.723% of the average value of the assets over their useful life. Liability insurance covers accidents on the farm and costs $1,360 for the entire farm or $0.47 per acre.
Office Expense. Office and business expenses are estimated at $15 per acre. These expenses include office supplies, telephones, bookkeeping, accounting, legal fees, and road maintenance. Cash overhead costs are found in Tables 1, 2, 3 and 4. Share Rent. Rental contracts and rates for land suitable for safflower production can range widely in Sacramento Valley. Land in this study is leased on a share-rent basis with the landowner receiving 20% of the gross returns. Supervisor Salary. Wages for supervisors are included as a cash overhead cost. Supervisor salaries, including benefits, are $100,000 per year for two supervisors and are allocated amongst the farm’s other crops on a gross returns basis. Safflower is assumed to provide 4.45% of the farm’s gross returns. Therefore, the supervisor’s salary allocated to safflower is $4,450 per year or $22.25 per acre. Any returns above total costs are considered returns to investment. Field Sanitation. Sanitation services provide portable toilets and washing facilities and cost the farm $1,360 annually or $0.47 per acre. The cost includes delivery and regular servicing of the units. Equipment Operating Costs. Repair costs are based on purchase price, annual hours of use, total hours of life, and repair coefficients formulated by American Society of Agricultural Engineers (ASAE). Fuel and lubrication costs are also determined by ASAE equations based on maximum Power Take Off (PTO) horsepower, and fuel type. Prices for on-farm delivery of diesel and gasoline are $1.51 and $2.05 per gallon, respectively. Costs are based on current delivery prices quoted by distributors and 2004 monthly price data. The cost includes a 2% local sales tax on diesel fuel and 8% sales tax on gasoline. Gasoline also includes federal and state excise taxes that are refundable for on-farm use when filing income tax return. The fuel, lube, and repair cost per acre for each operation in Table 2 is determined by multiplying the total hourly operating cost in Table 7 for each piece of equipment used for the selected operation by the hours per acre. Tractor time is 10% higher than implement time for a given operation to account for setup, travel and down time.

2005 Safflower Dryland Costs and Returns Study Sacramento Valley UC Cooperative Extension 6
NON-CASH OVERHEAD COSTS Non-cash overhead is calculated as the capital recovery cost for equipment and other farm investments. Although farm equipment used on farms in the Sacramento Valley might be purchased new or used, this study shows the current purchase price for new equipment. The new purchase price is adjusted to 60% of new value to indicate a mix of new and used equipment. Annual ownership costs (equipment and investments) are shown in Tables 1-3, and 5. They represent the capital recovery cost for investments on an annual per acre basis.
Capital Recovery Costs. Capital recovery cost is the annual depreciation and interest costs for a capital investment. It is the amount of money required each year to recover the difference between the purchase price and salvage value (unrecovered capital). Put another way, it is equivalent to the annual payment on a loan for the investment with the down payment equal to the discounted salvage value. This is a more complex method of calculating ownership costs than straight-line depreciation and opportunity costs, but more accurately represents the annual costs of ownership because it takes the time value of money into account. The calculation for the annual capital recovery costs is as follows.
!
Purchase " SalvagePr ice Value
#
$ %
&
' ( )
Factor
Capital
Recovery#
$ % %
&
' ( (
*
+ , ,
-
. / /
+ Salvage ) InterestValue Rate
*
+ ,
-
. /
Salvage Value. Salvage value is an estimate of the remaining value of an investment at the end of its useful life. For farm machinery (e.g., tractors and implements) the remaining value is a percentage of the new cost of the investment (Boehlje and Eidman). The percent remaining value is calculated from equations developed by the American Society of Agricultural Engineers (ASAE) based on equipment type and years of life. The life in years is estimated by dividing the wearout life, as given by ASAE by the annual hours of use in this operation. For other investments including irrigation systems, buildings, and miscellaneous equipment, the value at the end of its useful life is zero. The salvage value for land is equal to the purchase price because land does not depreciate. The purchase price and salvage value for certain equipment and investments are shown in Table 5.
Capital Recovery Factor. Capital recovery factor is the amortization factor or annual payment whose present value at compound interest is 1. The amortization factor is a table value that corresponds to the interest rate used and the life of the machine.
Interest Rate. The interest rate of 6.01% used to calculate capital recovery cost is the United States Department of Agriculture-Economic Reporting Service’s (USDA-ERS) ten-year average of California’s agricultural sector long run rate of return to production assets from current income. It is used to reflect the long-term realized rate of return to these specialized resources that can only be used effectively in the agricultural sector. In other words, the next best alternative use for these resources is in another agricultural enterprise. Table Values. Due to rounding, the totals may be slightly different from the sum of the components.

2005 Safflower Dryland Costs and Returns Study Sacramento Valley UC Cooperative Extension 7
REFERENCES
American Society of Agricultural Engineers. 2003. American Society of Agricultural Engineers Standards Yearbook. St. Joseph, MO.
Barker, Doug. January 17, 2005. California Worker’ Compensation Rating Data for Selected
Agricultural Classifications as of January 1, 2005. California Department of Insurance, Rate Regulation Branch.
Blank, Steve, Karen Klonsky, Kim Norris, and Steve Orloff. 1992. Acquiring Alfalfa Hay Equipment: A
Financial Analysis of Alternatives. Giannini Information Series No. 92-1. University of California. Oakland, CA.
Boehlje, Michael D., and Vernon R. Eidman. 1984. Farm Management. John Wiley and Sons. New
York, NY California Department of Food and Agriculture. 1999 - 2003. Agricultural Commissioners’ Data.
http://www.nass.usda.gov/ca/bul/agcom/indexcac.htm. Internet accessed March, 2005. California State Automobile Association. 2005. Gas Price Survey 2004. AAA Public Affairs, San
Francisco, California State Board of Equalization. Fuel Tax Division Tax Rates. Internet accessed January 2005.
http://www.boe.ca.gov/sptaxprog/spftdrates.htm. Energy Information Administration. 2005. Retail On-Highway Diesel Prices.
http://tonto.eia.doe.gov/oog/info/gdu/gasdiesel.asp Internet accessed: January 2005. Kafka, Steven, 1999, Safflower Production in California, Pub. 21565, University of California, Division
of Agriculture and Natural Resources. Oakland, CA. Kearney, Tom, Karen Klonsky, Rich De Moura. 2000. Sample Cost to Produce Safflower in the
Sacramento Valley - Yolo County. University of California Cooperative Extension, Department of Agricultural and Resource Economics. Davis, CA.
USDA-ERS. 2005. Farm Sector: Farm Financial Ratios. Agriculture and Rural Economics Division,
ERS. USDA. Washington, DC. http://usda.mannlib.cornell.edu/reports/nassr/price/zap-bb/agpran04.txt; Internet; accessed May, 2005.
For information concerning the above mentioned University of California publications contact UC DANR Communications Services (1-800-994-8849) or your local county UC Cooperative Extension office.
2005 Safflower Dryland Costs and Returns Study Sacramento Valley UC Cooperative Extension 8
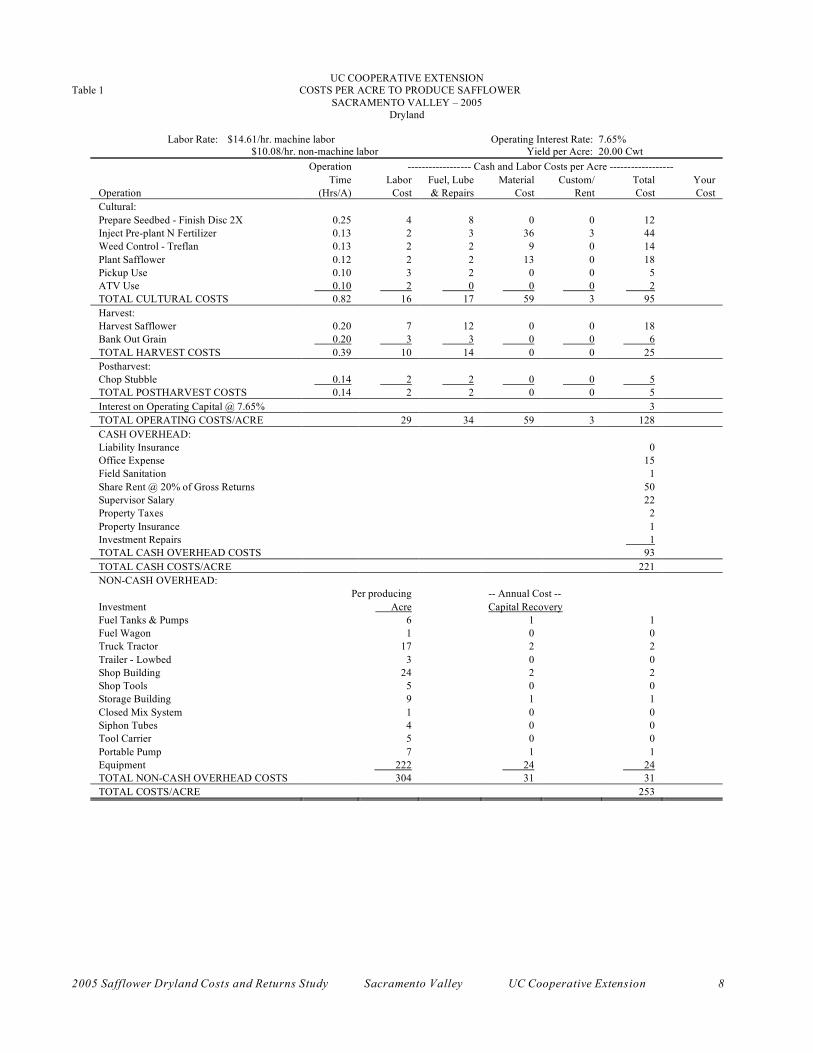
UC COOPERATIVE EXTENSION Table 1 COSTS PER ACRE TO PRODUCE SAFFLOWER
SACRAMENTO VALLEY – 2005 Dryland
Labor Rate: $14.61/hr. machine labor Operating Interest Rate: 7.65% $10.08/hr. non-machine labor Yield per Acre: 20.00 Cwt
Operation ------------------ Cash and Labor Costs per Acre ------------------ Time Labor Fuel, Lube Material Custom/ Total Your Operation (Hrs/A) Cost & Repairs Cost Rent Cost Cost Cultural: Prepare Seedbed - Finish Disc 2X 0.25 4 8 0 0 12 Inject Pre-plant N Fertilizer 0.13 2 3 36 3 44 Weed Control - Treflan 0.13 2 2 9 0 14 Plant Safflower 0.12 2 2 13 0 18 Pickup Use 0.10 3 2 0 0 5 ATV Use 0.10 2 0 0 0 2 TOTAL CULTURAL COSTS 0.82 16 17 59 3 95 Harvest: Harvest Safflower 0.20 7 12 0 0 18 Bank Out Grain 0.20 3 3 0 0 6 TOTAL HARVEST COSTS 0.39 10 14 0 0 25 Postharvest: Chop Stubble 0.14 2 2 0 0 5 TOTAL POSTHARVEST COSTS 0.14 2 2 0 0 5 Interest on Operating Capital @ 7.65% 3 TOTAL OPERATING COSTS/ACRE 29 34 59 3 128 CASH OVERHEAD: Liability Insurance 0 Office Expense 15 Field Sanitation 1 Share Rent @ 20% of Gross Returns 50 Supervisor Salary 22 Property Taxes 2 Property Insurance 1 Investment Repairs 1 TOTAL CASH OVERHEAD COSTS 93 TOTAL CASH COSTS/ACRE 221 NON-CASH OVERHEAD: Per producing -- Annual Cost -- Investment Acre Capital Recovery Fuel Tanks & Pumps 6 1 1 Fuel Wagon 1 0 0 Truck Tractor 17 2 2 Trailer - Lowbed 3 0 0 Shop Building 24 2 2 Shop Tools 5 0 0 Storage Building 9 1 1 Closed Mix System 1 0 0 Siphon Tubes 4 0 0 Tool Carrier 5 0 0 Portable Pump 7 1 1 Equipment 222 24 24 TOTAL NON-CASH OVERHEAD COSTS 304 31 31 TOTAL COSTS/ACRE 253

2005 Safflower Dryland Costs and Returns Study Sacramento Valley UC Cooperative Extension 9
UC COOPERATIVE EXTENSION Table 2. COSTS AND RETURNS PER ACRE TO PRODUCE SAFFLOWER
SACRAMENTO VALLEY – 2005 Dryland
Labor Rate: $14.61/hr. machine labor Operating Interest Rate: 7.65% $10.08/hr. non-machine labor
Price or Value or Your Quantity/Acre Unit Cost/Unit Cost/Acre Cost GROSS RETURNS Safflower 20.00 Cwt 12.62 252 TOTAL GROSS RETURNS FOR SAFFLOWER 252 OPERATING COSTS Fertilizer: Aqua Ammonia 100.00 Lb N 0.36 36 Rent: Fertilizer Applicator 1.00 Acre 2.75 3 Herbicide: Treflan HFP 2.00 Pint 4.74 9 Seed: Safflower Seed 22.00 Lb 0.61 13 Labor (machine) 1.98 Hrs 14.61 29 Labor (non-machine) 0.00 Hrs 0.00 0 Fuel - Gas 0.66 Gal 2.05 1 Fuel - Diesel 12.87 Gal 1.51 19 Lube 3 Machinery repair 10 Interest on operating capital @ 7.65% 3 TOTAL OPERATING COSTS/ACRE 128 NET RETURNS ABOVE OPERATING COSTS' 124 CASH OVERHEAD COSTS: Liability Insurance 0 Office Expense 15 Field Sanitation 1 Share Rent @ 20% of Gross Returns 50 Supervisor Salary 22 Property Taxes 2 Property Insurance 1 Investment Repairs 1 TOTAL CASH OVERHEAD COSTS/ACRE 93 TOTAL CASH COSTS/ACRE 221 NON-CASH OVERHEAD COSTS (CAPITAL RECOVERY): Fuel Tanks & Pumps 1 Fuel Wagon 0 Truck Tractor 2 Trailer - Lowbed 0 Shop Building 2 Shop Tools 0 Storage Building 1 Closed Mix System 0 Siphon Tubes 0 Tool Carrier 0 Portable Pump 1 Equipment 24 TOTAL NON-CASH OVERHEAD COSTS/ACRE 31 TOTAL COSTS/ACRE 253 NET RETURNS ABOVE TOTAL COSTS 0

2005 Safflower Dryland Costs and Returns Study Sacramento Valley UC Cooperative Extension 10
UC COOPERATIVE EXTENSION Table 3. MONTHLY CASH COSTS PER ACRE TO PRODUCE SAFFLOWER
SACRAMENTO VALLEY – 2005 Dryland
Beginning SEP 04 SEP OC
T NOV DE
C JAN FEB MAR APR MAY JUN JUL AUG TOTAL Ending AUG 05 04 04 04 04 05 05 05 05 05 05 05 05 Cultural: Prepare Seedbed - Finish Disc 2X 12 12 Inject Pre-plant N Fertilizer 44 44 Weed Control - Treflan 14 14 Plant Safflower 18 18 Pickup Use 0 0 0 0 0 0 0 0 0 0 0 0 5 ATV Use 0 0 0 0 0 0 0 0 0 0 0 0 2 TOTAL CULTURAL COSTS 1 1 57 32 1 1 1 1 1 1 1 1 95 Harvest: Harvest Safflower 18 18 Bank Out Grain 6 6 TOTAL HARVEST COSTS 25 25 Postharvest: Chop Stubble 5 5 TOTAL POSTHARVEST COSTS 5 5 Interest on Operating Capital @ 7.65% 0 0 0 1 1 1 1 1 0 0 0 0 3 TOTAL OPERATING COSTS/ACRE 1 1 58 33 1 1 1 31 1 1 1 1 128 OVERHEAD: Liability Insurance 0 0 Office Expense 3 3 3 3 3 3 15 Field Sanitation 0 0 0 0 0 0 1 Share Rent @ 20% of Gross Returns 50 50 Supervisor Salary 4 4 4 4 4 4 22 Property Taxes 1 1 2 Property Insurance 1 1 1
Investment Repairs 0
0 0
0 0
0 0
0 0
0 0 0 1 TOTAL CASH OVERHEAD COSTS 2 0 6 6 6 6 8 57 0 0 0 0 93 TOTAL CASH COSTS/ACRE 3 1 64 39 8 8 9 88 1 1 1 1 221

2005 Safflower Dryland Costs and Returns Study Sacramento Valley UC Cooperative Extension 11
UC COOPERATIVE EXTENSION Table 4. WHOLE FARM ANNUAL EQUIPMENT, INVESTMENT AND BUSINESS OVERHEAD COSTS
SACRAMENTO VALLEY – 2005 Dryland
ANNUAL EQUIPMENT COSTS - Cash Overhead - Yrs Salvage Capital Insur-
Yr Description Price Life Value Recovery ance Taxes Total 05 200 HP Crawler 168,891 10 49,888 19,175 755 1,094 21,023 05 90 HP 2WD Tractor 64,227 10 18,972 7,292 287 416 7,995 05 ATV 5,700 7 2,162 764 27 39 830 05 Bankout Wagon - 30 Ton - Pull Type 17,072 10 3,019 2,092 69 100 2,261 05 Combine - No Header 162,890 15 16,681 16,066 620 898 17,584 05 Disc - Finish 18' 24,300 10 4,297 2,977 99 143 3,219 05 Grain Drill - 20' 24,480 10 4,329 2,999 99 144 3,243 05 Grain Platform 20' 15,383 20 855 1,319 56 81 1,456 05 Mower - Flail 15' 12,107 10 2,141 1,483 49 71 1,604 05 Pickup - 1/2 Ton 21,825 5 9,781 3,448 109 158 3,715 05 Pickup - 3/4 Ton 26,357 5 11,813 4,164 132 191 4,486 05 Saddle Tank - 300 Gallon 3,417 10 604 419 14 20 453 TOTAL 546,649 124,542 62,198 2,316 3,356 67,869 60% of New Cost * 327,989 74,725 37,319 1,389 2,014 40,722
* Used to reflect a mix of new and used equipment.
ANNUAL INVESTMENT COSTS
------ Cash Overhead ------ Yrs Salvage Capital Insur- Description Price Life Value Recovery ance Taxes Repairs Total INVESTMENT Closed Mix System 4,150 10 415 533 16 23 210 781 Fuel Tanks & Pumps 17,196 20 1,720 1,454 65 95 232 1,846 Fuel Wagon 2,085 10 209 268 8 11 41 328 Portable Pump 20,974 20 2,097 1,773 80 115 576 2,544 Shop Building 69,694 25 6,969 5,330 264 383 940 6,918 Shop Tools 13,333 20 1,333 1,127 51 73 135 1,386 Siphon Tubes 10,404 20 1,040 880 39 57 100 1,076 Storage Building 27,370 20 2,737 2,314 104 151 550 3,118 Tool Carrier 15,420 15 15,420 927 106 154 365 1,552 Trailer - Lowbed 7,850 15 785 775 30 43 105 953 Truck Tractor 49,825 15 4,983 4,920 189 274 385 5,768 TOTAL INVESTMENT 238,301 37,708 20,299 952 1,380 3,639 26,271
ANNUAL BUSINESS OVERHEAD COSTS Units/ Price/ Total Description Farm Unit Unit Cost Field Sanitation 2,900 Acre 0.73 2,117 Liability Insurance 2,900 Acre 0.47 1,363 Office Expense 2,900 Acre 15.00 43,500 Share Rent @ 20% of Gross Returns 200 Acre 50.40 10,080 Supervisor Salary 200 Acre 22.25 4,450

2005 Safflower Dryland Costs and Returns Study Sacramento Valley UC Cooperative Extension 12
UC COOPERATIVE EXTENSION Table 5. HOURLY EQUIPMENT COSTS
SACRAMENTO VALLEY – 2005 Dryland
------------------------- COSTS PER HOUR ----------------------------------- Actual - Cash Overhead - -------- Operating -------- Hours Capital Insur- Fuel & Total Total
Yr Description Used Recovery ance Taxes Repairs Lube Oper. Costs/Hr. 05 200 HP Crawler 1,565.8 7.35 0.29 0.42 4.40 20.16 24.56 32.61 05 90 HP 2WD Tractor 1,199.4 3.65 0.14 0.21 2.93 7.67 10.60 14.60 05 ATV 283.6 1.62 0.06 0.08 0.42 2.83 3.25 5.01 05 Bankout Wagon - 30 Ton - Pull Type 199.2 6.30 0.21 0.30 2.32 0.00 2.32 9.13 05 Combine - No Header 199.1 48.41 1.87 2.71 11.10 21.67 32.77 85.75 05 Disc - Finish 18' 199.2 8.97 0.30 0.43 3.94 0.00 3.94 13.64 05 Grain Drill - 20' 149.6 12.03 0.40 0.58 6.59 0.00 6.59 19.60 05 Grain Platform 20' 149.1 5.31 0.23 0.33 0.99 20.16 21.15 27.01 05 Mower - Flail 15' 199.6 4.46 0.15 0.21 5.02 0.00 5.02 9.84 05 Pickup - 1/2 Ton 283.6 7.29 0.23 0.33 1.42 5.89 7.31 15.16 05 Pickup - 3/4 Ton 283.6 8.81 0.28 0.40 1.71 7.07 8.78 18.27 05 Saddle Tank - 300 Gallon 149.4 1.68 0.06 0.08 0.91 0.00 0.91 2.73
2005 Safflower Dryland Costs and Returns Study Sacramento Valley UC Cooperative Extension 13
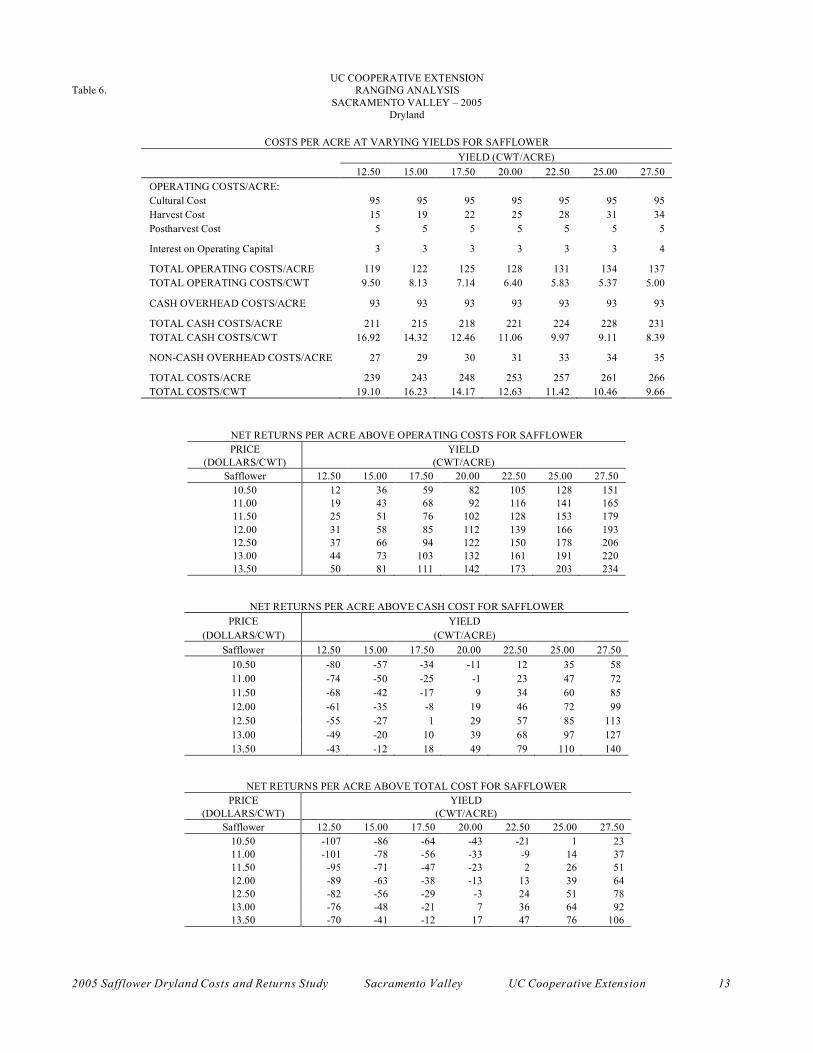
UC COOPERATIVE EXTENSION Table 6. RANGING ANALYSIS
SACRAMENTO VALLEY – 2005 Dryland
COSTS PER ACRE AT VARYING YIELDS FOR SAFFLOWER
YIELD (CWT/ACRE) 12.50 15.00 17.50 20.00 22.50 25.00 27.50 OPERATING COSTS/ACRE: Cultural Cost 95 95 95 95 95 95 95 Harvest Cost 15 19 22 25 28 31 34 Postharvest Cost 5 5 5 5 5 5 5
Interest on Operating Capital 3 3 3 3 3 3 4
TOTAL OPERATING COSTS/ACRE 119 122 125 128 131 134 137 TOTAL OPERATING COSTS/CWT 9.50 8.13 7.14 6.40 5.83 5.37 5.00
CASH OVERHEAD COSTS/ACRE 93 93 93 93 93 93 93
TOTAL CASH COSTS/ACRE 211 215 218 221 224 228 231 TOTAL CASH COSTS/CWT 16.92 14.32 12.46 11.06 9.97 9.11 8.39
NON-CASH OVERHEAD COSTS/ACRE 27 29 30 31 33 34 35
TOTAL COSTS/ACRE 239 243 248 253 257 261 266 TOTAL COSTS/CWT 19.10 16.23 14.17 12.63 11.42 10.46 9.66
NET RETURNS PER ACRE ABOVE OPERATING COSTS FOR SAFFLOWER PRICE YIELD
(DOLLARS/CWT) (CWT/ACRE) Safflower 12.50 15.00 17.50 20.00 22.50 25.00 27.50
10.50 12 36 59 82 105 128 151 11.00 19 43 68 92 116 141 165 11.50 25 51 76 102 128 153 179 12.00 31 58 85 112 139 166 193 12.50 37 66 94 122 150 178 206 13.00 44 73 103 132 161 191 220 13.50 50 81 111 142 173 203 234
NET RETURNS PER ACRE ABOVE CASH COST FOR SAFFLOWER PRICE YIELD
(DOLLARS/CWT) (CWT/ACRE) Safflower 12.50 15.00 17.50 20.00 22.50 25.00 27.50
10.50 -80 -57 -34 -11 12 35 58 11.00 -74 -50 -25 -1 23 47 72 11.50 -68 -42 -17 9 34 60 85 12.00 -61 -35 -8 19 46 72 99 12.50 -55 -27 1 29 57 85 113 13.00 -49 -20 10 39 68 97 127 13.50 -43 -12 18 49 79 110 140
NET RETURNS PER ACRE ABOVE TOTAL COST FOR SAFFLOWER PRICE YIELD
(DOLLARS/CWT) (CWT/ACRE) Safflower 12.50 15.00 17.50 20.00 22.50 25.00 27.50
10.50 -107 -86 -64 -43 -21 1 23 11.00 -101 -78 -56 -33 -9 14 37 11.50 -95 -71 -47 -23 2 26 51 12.00 -89 -63 -38 -13 13 39 64 12.50 -82 -56 -29 -3 24 51 78 13.00 -76 -48 -21 7 36 64 92 13.50 -70 -41 -12 17 47 76 106

2005 Safflower Dryland Costs and Returns Study Sacramento Valley UC Cooperative Extension 14
U.C. COOPERATIVE EXTENSION Table 7. COSTS AND RETURNS / BREAKEVEN ANALYSIS
SACRAMENTO VALLEY – 2005 Dryland
COSTS AND RETURNS - PER ACRE BASIS 1. Gross 2. Operating 3. Net Returns 4. Cash 5. Net Returns 6. Total 7. Net Returns Returns Costs Above Oper. Costs Above Cash Costs Above Total Crop Costs (1-2) Costs (1-4) Costs (1-6) Safflower 252 128 124 221 31 253 0
COSTS AND RETURNS - TOTAL ACREAGE 1. Gross 2. Operating 3. Net Returns 4. Cash 5. Net Returns 6. Total 7. Net Returns Returns Costs Above Oper. Costs Above Cash Costs Above Total Crop Costs (1-2) Costs (1-4) Costs (1-6) Safflower 50,480 25,618 24,862 44,239 6,241 50,506 -26
BREAKEVEN PRICES PER YIELD UNIT -------- Breakeven Price To Cover -------- Base Yield Yield Operating Cash Total CROP (Units/Acre) Units Costs Costs Costs ------------ $ per Yield Unit ------------ Safflower 20.0 Cwt 6.40 11.06 12.63
BREAKEVEN YIELDS PER ACRE -------- Breakeven Yield To Cover -------- Yield Base Price Operating Cash Total CROP Units ($/Unit) Costs Costs Costs ----------- Yield Units / Acre ----------- Safflower Cwt 12.62 10.1 17.5 20.0
2005 Safflower Dryland Costs and Returns Study Sacramento Valley UC Cooperative Extension 15
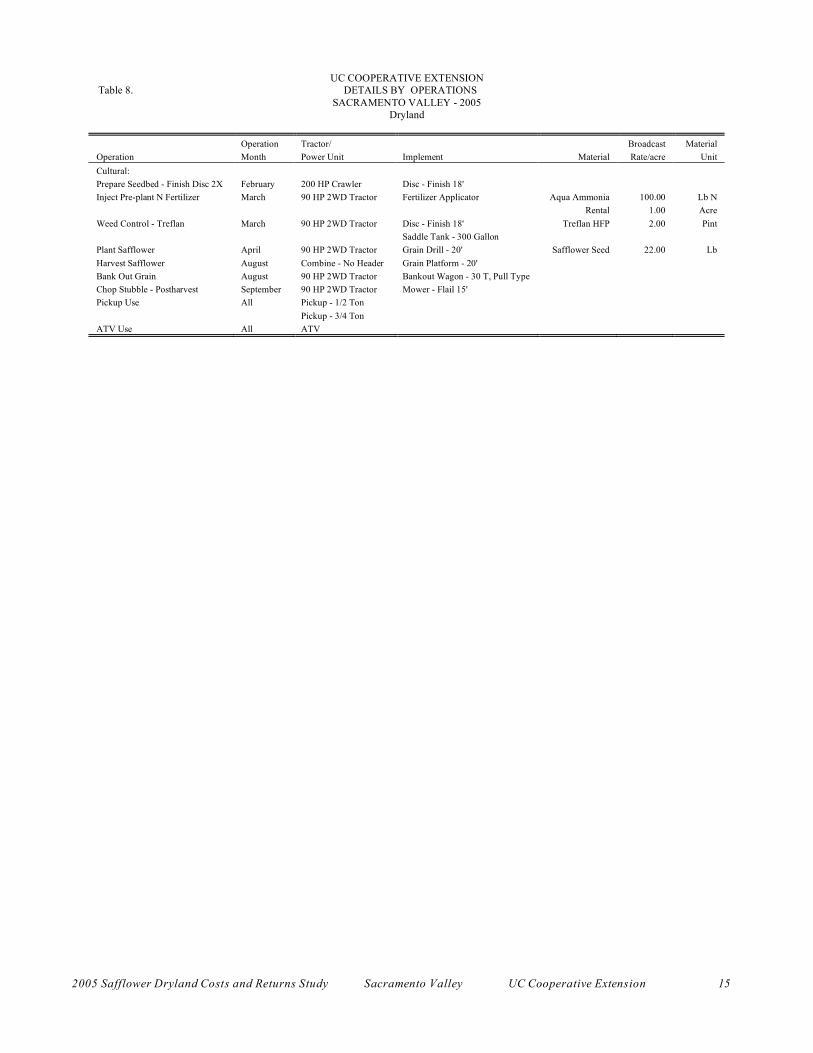
UC COOPERATIVE EXTENSION Table 8. DETAILS BY OPERATIONS
SACRAMENTO VALLEY - 2005 Dryland
Operation Tractor/ Broadcast Material Operation Month Power Unit Implement Material Rate/acre Unit Cultural: Prepare Seedbed - Finish Disc 2X February 200 HP Crawler Disc - Finish 18' Inject Pre-plant N Fertilizer March 90 HP 2WD Tractor Fertilizer Applicator Aqua Ammonia 100.00 Lb N Rental 1.00 Acre Weed Control - Treflan March 90 HP 2WD Tractor Disc - Finish 18' Treflan HFP 2.00 Pint Saddle Tank - 300 Gallon Plant Safflower April 90 HP 2WD Tractor Grain Drill - 20' Safflower Seed 22.00 Lb Harvest Safflower August Combine - No Header Grain Platform - 20' Bank Out Grain August 90 HP 2WD Tractor Bankout Wagon - 30 T, Pull Type Chop Stubble - Postharvest September 90 HP 2WD Tractor Mower - Flail 15' Pickup Use All Pickup - 1/2 Ton Pickup - 3/4 Ton ATV Use All ATV