Embed Size (px)
Citation preview
Salesforce1 Reporting REST APIDeveloper Guide
Version 34.0, Summer ’15
@salesforcedocsLast updated: July 13, 2015

© Copyright 2000–2015 salesforce.com, inc. All rights reserved. Salesforce is a registered trademark of salesforce.com, inc.,as are other names and marks. Other marks appearing herein may be trademarks of their respective owners.
CONTENTS
Chapter 1: Introducing the Salesforce1 Reporting REST API . . . . . . . . . . . . . . . . . . . . . . 1
Requirements and Limitations . . . . . . . . . . . . . . . . . . . . . . . . . . . . . . . . . . . . . . . . . . . . . 2
Chapter 2: Understanding Reports REST API Resources . . . . . . . . . . . . . . . . . . . . . . . . 3
Run Reports Synchronously or Asynchronously . . . . . . . . . . . . . . . . . . . . . . . . . . . . . . . . . . 4Get Report Metadata . . . . . . . . . . . . . . . . . . . . . . . . . . . . . . . . . . . . . . . . . . . . . . . . . . . 13List Asynchronous Runs of a Report . . . . . . . . . . . . . . . . . . . . . . . . . . . . . . . . . . . . . . . . . 17Filter Reports on Demand . . . . . . . . . . . . . . . . . . . . . . . . . . . . . . . . . . . . . . . . . . . . . . . . 17List Recently Viewed Reports . . . . . . . . . . . . . . . . . . . . . . . . . . . . . . . . . . . . . . . . . . . . . . 21Decode the Fact Map . . . . . . . . . . . . . . . . . . . . . . . . . . . . . . . . . . . . . . . . . . . . . . . . . . 22Save Changes to Reports . . . . . . . . . . . . . . . . . . . . . . . . . . . . . . . . . . . . . . . . . . . . . . . 24Clone Reports . . . . . . . . . . . . . . . . . . . . . . . . . . . . . . . . . . . . . . . . . . . . . . . . . . . . . . . 26Delete Reports . . . . . . . . . . . . . . . . . . . . . . . . . . . . . . . . . . . . . . . . . . . . . . . . . . . . . . . 27
Chapter 3: Understanding Dashboards REST API Resources . . . . . . . . . . . . . . . . . . . 28
Get List of Recently Used Dashboards . . . . . . . . . . . . . . . . . . . . . . . . . . . . . . . . . . . . . . . 29Get Dashboard Results . . . . . . . . . . . . . . . . . . . . . . . . . . . . . . . . . . . . . . . . . . . . . . . . . 29Filter Dashboard Results . . . . . . . . . . . . . . . . . . . . . . . . . . . . . . . . . . . . . . . . . . . . . . . . 33Get Dashboard Status . . . . . . . . . . . . . . . . . . . . . . . . . . . . . . . . . . . . . . . . . . . . . . . . . . 34Refresh a Dashboard . . . . . . . . . . . . . . . . . . . . . . . . . . . . . . . . . . . . . . . . . . . . . . . . . . 34Delete a Dashboard . . . . . . . . . . . . . . . . . . . . . . . . . . . . . . . . . . . . . . . . . . . . . . . . . . . 35
Chapter 4: Reports API Resource Reference . . . . . . . . . . . . . . . . . . . . . . . . . . . . . . . 36
Report . . . . . . . . . . . . . . . . . . . . . . . . . . . . . . . . . . . . . . . . . . . . . . . . . . . . . . . . . . . . 37Describe . . . . . . . . . . . . . . . . . . . . . . . . . . . . . . . . . . . . . . . . . . . . . . . . . . . . . . . . . . . 49Execute Sync . . . . . . . . . . . . . . . . . . . . . . . . . . . . . . . . . . . . . . . . . . . . . . . . . . . . . . . . 59Execute Async . . . . . . . . . . . . . . . . . . . . . . . . . . . . . . . . . . . . . . . . . . . . . . . . . . . . . . . 65Instances List . . . . . . . . . . . . . . . . . . . . . . . . . . . . . . . . . . . . . . . . . . . . . . . . . . . . . . . . 69Instance Results . . . . . . . . . . . . . . . . . . . . . . . . . . . . . . . . . . . . . . . . . . . . . . . . . . . . . . 70Report List . . . . . . . . . . . . . . . . . . . . . . . . . . . . . . . . . . . . . . . . . . . . . . . . . . . . . . . . . . 72Report Error Codes . . . . . . . . . . . . . . . . . . . . . . . . . . . . . . . . . . . . . . . . . . . . . . . . . . . . 76
Chapter 5: Dashboards API Resource Reference . . . . . . . . . . . . . . . . . . . . . . . . . . . . 79
Dashboard List . . . . . . . . . . . . . . . . . . . . . . . . . . . . . . . . . . . . . . . . . . . . . . . . . . . . . . 80Dashboard Results . . . . . . . . . . . . . . . . . . . . . . . . . . . . . . . . . . . . . . . . . . . . . . . . . . . . 80Dashboard Status . . . . . . . . . . . . . . . . . . . . . . . . . . . . . . . . . . . . . . . . . . . . . . . . . . . . 87Dashboard and Component Error Codes . . . . . . . . . . . . . . . . . . . . . . . . . . . . . . . . . . . . . 89
Index . . . . . . . . . . . . . . . . . . . . . . . . . . . . . . . . . . . . . . . . . . . . . . . . . . . . . . . . . . . . . 91

CHAPTER 1 Introducing the Salesforce1 Reporting RESTAPI
The REST-based Salesforce1 Reporting API gives you programmatic access to your report and dashboarddata as defined in the report builder and dashboard builder. The API lets you integrate the data into any
In this chapter ...
• Requirements andLimitations
web or mobile application, inside or outside the Salesforce platform. For example, you might use theAPI to trigger a Chatter post with a snapshot of top-performing reps each quarter.
The Salesforce1 Reporting API will revolutionize the way you access and visualize your data. You can:
• Integrate report data into custom objects.
• Define rich visualizations on top of the API to animate the data.
• Build custom dashboards.
• Automate reporting tasks.
At a high level, the API resources let you query and filter report data. You can:
• Run tabular, summary, or matrix reports synchronously or asynchronously.
• Filter for specific data on the fly.
• Query report metadata.
You can also work with dashboard resources to:
• Get a list of recently used dashboards.
• Get dashboard metadata and data.
• Query dashboard status.
• Refresh dashboards.
1
Requirements and Limitations
The Salesforce1 Reporting API is available for any organization that has API enabled. You must establish an authenticated session usingOAuth in order to access the Salesforce1 Reporting API. When working with the Salesforce1 Reporting API, consider these restrictionsin addition to general API limits.
Note: Responses and requests are in JSON. While using the Salesforce1 Reporting API with a POST request body, you mustuse content-type: application/json. You might get unexpected results if you don’t use this content type.
Reports Limits
• Cross filters, standard report filters, and filtering by row limit are unavailable when filtering data.
• Historical trend reports are only supported for matrix reports.
• The API can process only reports that contain up to 100 fields selected as columns.
• A list of up to 200 recently viewed reports can be returned.
• Your organization can request up to 500 synchronous report runs per hour.
• The API supports up to 20 synchronous report run requests at a time.
• A list of up to 2,000 instances of a report that was run asynchronously can be returned.
• The API supports up to 200 requests at a time to get results of asynchronous report runs.
• Your organization can request up to 1,200 asynchronous requests per hour.
• Asynchronous report run results are available within a 24-hour rolling period.
• The API returns up to the first 2,000 report rows. You can narrow results using filters.
• You can add up to 20 custom field filters when you run a report.
Dashboards Limits
• Your organization can request up to 200 dashboard refreshes per hour.
• Your organization can request results for up to 5,000 dashboards per hour.
Note: All limits that apply to reports created in the report builder also apply to the API, as do limits for dashboards created in thedashboard builder. For more information, see “Salesforce1 Reporting Limits” in the Salesforce online help.
2
Requirements and LimitationsIntroducing the Salesforce1 Reporting REST API
CHAPTER 2 Understanding Reports REST API Resources
The Reports API is designed to let you query report data easily. Use the Reports API to:In this chapter ...• Run Reports Synchronously or Asynchronously.
Run a report immediately or asynchronously to get summary data with or without details. Werecommend that you run reports asynchronously to avoid report timeouts and other API limits.
• Run ReportsSynchronously orAsynchronously
• Get Report Metadata • Get Report Metadata.
Get information about fields in the report and report type. This includes information about fieldsused for report groupings, summaries, detailed data, and filters.
• List AsynchronousRuns of a Report
• Filter Reports onDemand • List Asynchronous Runs of a Report.
Get a list of all instances of a report run asynchronously.• List Recently ViewedReports
• Filter Reports on Demand.
Get specific data back by running a report with filter changes in the metadata.• Decode the Fact Map
• Save Changes toReports
• List Recently Viewed Reports
Get most recently viewed reports that you have permission to access.• Clone Reports
• Delete Reports• Decode the Fact Map.
Get a visualized view of your report data.
• Save Changes to Reports
Save changes to reports.
• Clone Reports
Make copies of existing reports.
• Delete Reports
Clean up unused and obsolete reports.
3
Run Reports Synchronously or Asynchronously
Get summary data with or without details by running a report synchronously or asynchronously through the API. When you run a report,the API returns data for the same number of records that are available when the report is run in the Salesforce user interface.
Run a report synchronously if you expect it to finish running quickly. Otherwise, we recommend that you run reports through the APIasynchronously for these reasons:
• Long running reports have a lower risk of reaching the timeout limit when run asynchronously.
• The 2-minute overall Salesforce API timeout limit doesn’t apply to asynchronous runs.
• The Salesforce1 Reporting API can handle a higher number of asynchronous run requests at a time.
• Since the results of an asynchronously run report are stored for a 24-hr rolling period, they’re available for recurring access.
To run a report synchronously:
• Send a GET or POST request to the Execute Sync resource to get data.
• Use a POST request to get specific results on the fly by passing filters in the report metadata.
To fetch report data asynchronously:
1. Send a POST request to the Execute Async resource. If you’re passing filters, include them in the POST request metadata. The requestreturns the instance ID where results of the run are stored.
2. Send a GET request to the Instance Results resource to fetch data using the instance ID.
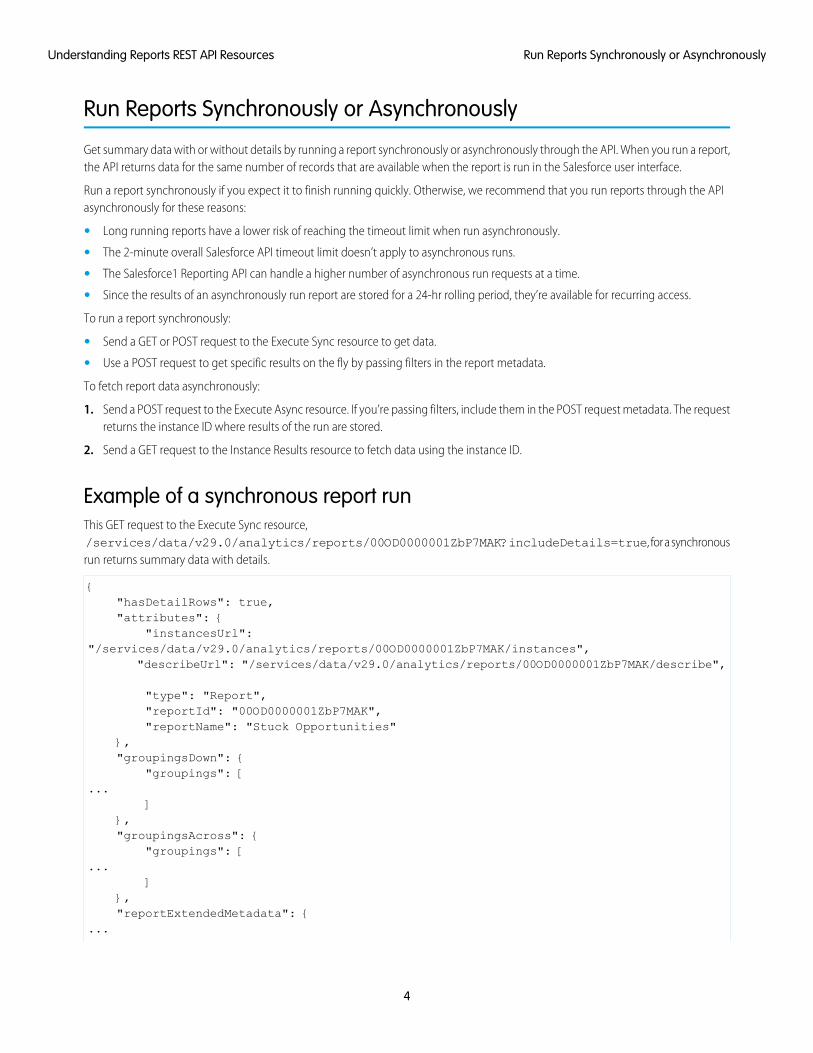
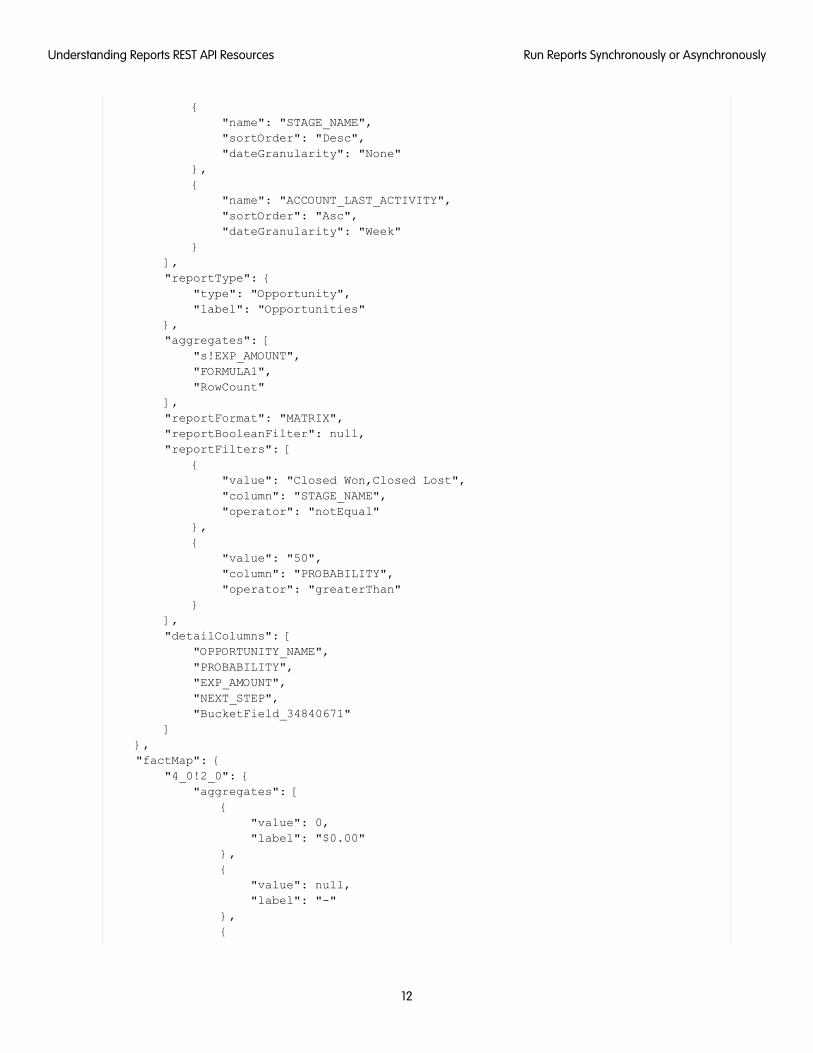
Example of a synchronous report runThis GET request to the Execute Sync resource,/services/data/v29.0/analytics/reports/00OD0000001ZbP7MAK?includeDetails=true, for a synchronousrun returns summary data with details.
{"hasDetailRows": true,"attributes": {
"instancesUrl":"/services/data/v29.0/analytics/reports/00OD0000001ZbP7MAK/instances",
"describeUrl": "/services/data/v29.0/analytics/reports/00OD0000001ZbP7MAK/describe",
"type": "Report","reportId": "00OD0000001ZbP7MAK","reportName": "Stuck Opportunities"
},"groupingsDown": {
"groupings": [...
]},"groupingsAcross": {
"groupings": [...
]},"reportExtendedMetadata": {
...
4
Run Reports Synchronously or AsynchronouslyUnderstanding Reports REST API Resources
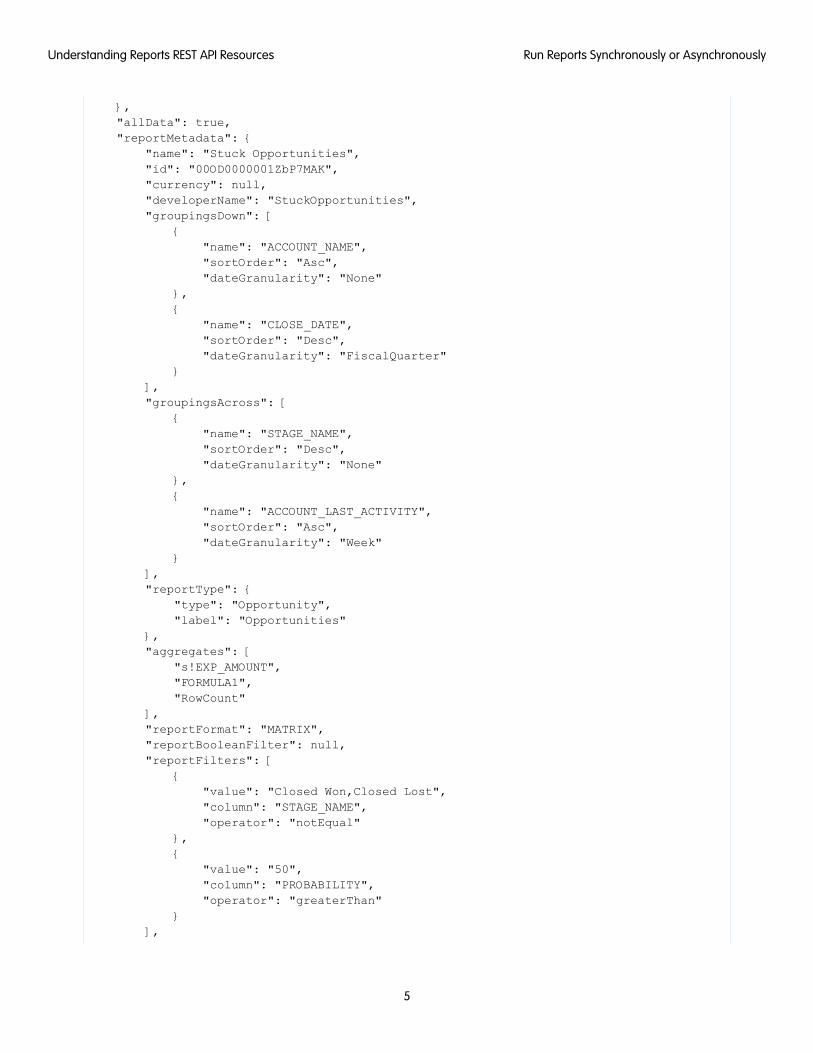
},"allData": true,"reportMetadata": {
"name": "Stuck Opportunities","id": "00OD0000001ZbP7MAK","currency": null,"developerName": "StuckOpportunities","groupingsDown": [
{"name": "ACCOUNT_NAME","sortOrder": "Asc","dateGranularity": "None"
},{
"name": "CLOSE_DATE","sortOrder": "Desc","dateGranularity": "FiscalQuarter"
}],"groupingsAcross": [
{"name": "STAGE_NAME","sortOrder": "Desc","dateGranularity": "None"
},{
"name": "ACCOUNT_LAST_ACTIVITY","sortOrder": "Asc","dateGranularity": "Week"
}],"reportType": {
"type": "Opportunity","label": "Opportunities"
},"aggregates": [
"s!EXP_AMOUNT","FORMULA1","RowCount"
],"reportFormat": "MATRIX","reportBooleanFilter": null,"reportFilters": [
{"value": "Closed Won,Closed Lost","column": "STAGE_NAME","operator": "notEqual"
},{
"value": "50","column": "PROBABILITY","operator": "greaterThan"
}],
5
Run Reports Synchronously or AsynchronouslyUnderstanding Reports REST API Resources
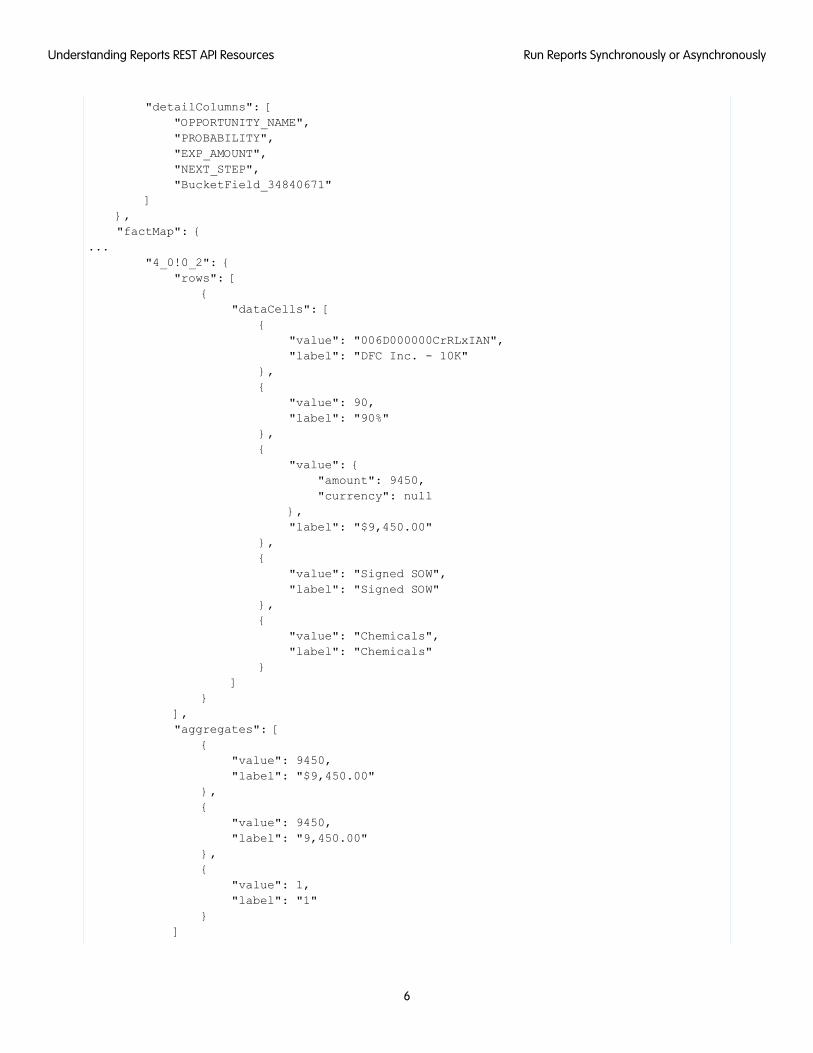
"detailColumns": ["OPPORTUNITY_NAME","PROBABILITY","EXP_AMOUNT","NEXT_STEP","BucketField_34840671"
]},"factMap": {
..."4_0!0_2": {
"rows": [{
"dataCells": [{
"value": "006D000000CrRLxIAN","label": "DFC Inc. - 10K"
},{
"value": 90,"label": "90%"
},{
"value": {"amount": 9450,"currency": null
},"label": "$9,450.00"
},{
"value": "Signed SOW","label": "Signed SOW"
},{
"value": "Chemicals","label": "Chemicals"
}]
}],"aggregates": [
{"value": 9450,"label": "$9,450.00"
},{
"value": 9450,"label": "9,450.00"
},{
"value": 1,"label": "1"
}]
6
Run Reports Synchronously or AsynchronouslyUnderstanding Reports REST API Resources
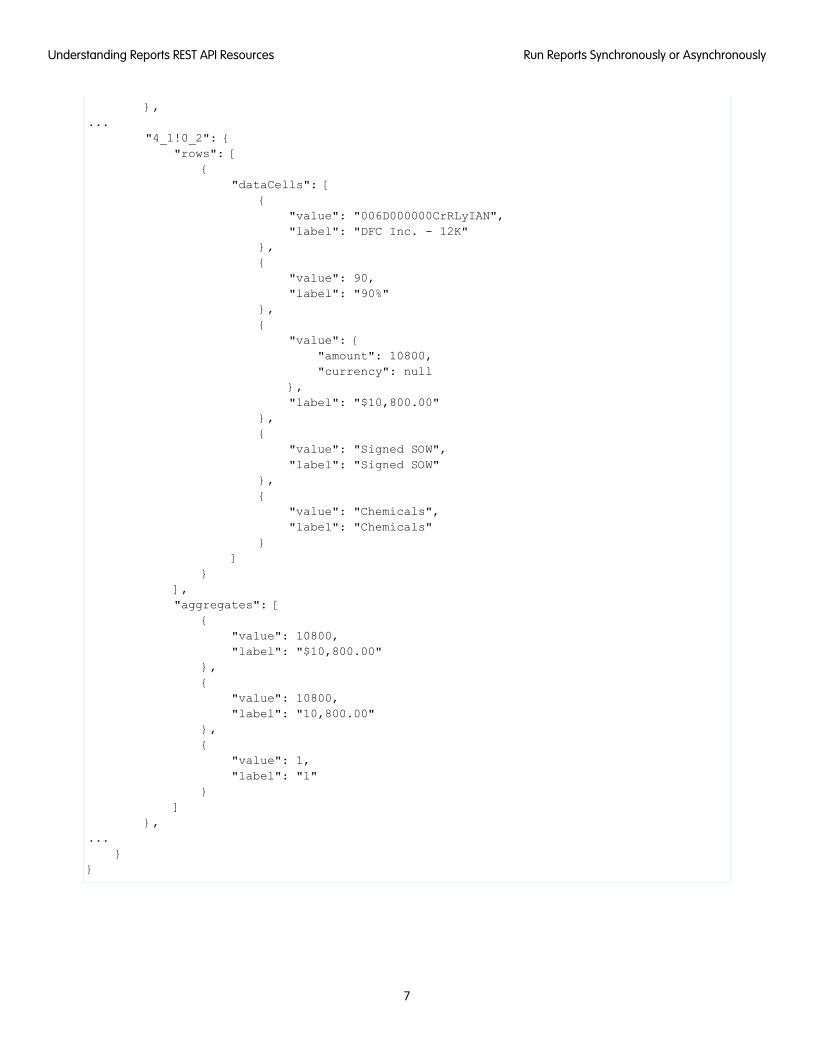
},...
"4_1!0_2": {"rows": [
{"dataCells": [
{"value": "006D000000CrRLyIAN","label": "DFC Inc. - 12K"
},{
"value": 90,"label": "90%"
},{
"value": {"amount": 10800,"currency": null
},"label": "$10,800.00"
},{
"value": "Signed SOW","label": "Signed SOW"
},{
"value": "Chemicals","label": "Chemicals"
}]
}],"aggregates": [
{"value": 10800,"label": "$10,800.00"
},{
"value": 10800,"label": "10,800.00"
},{
"value": 1,"label": "1"
}]
},...
}}
7
Run Reports Synchronously or AsynchronouslyUnderstanding Reports REST API Resources
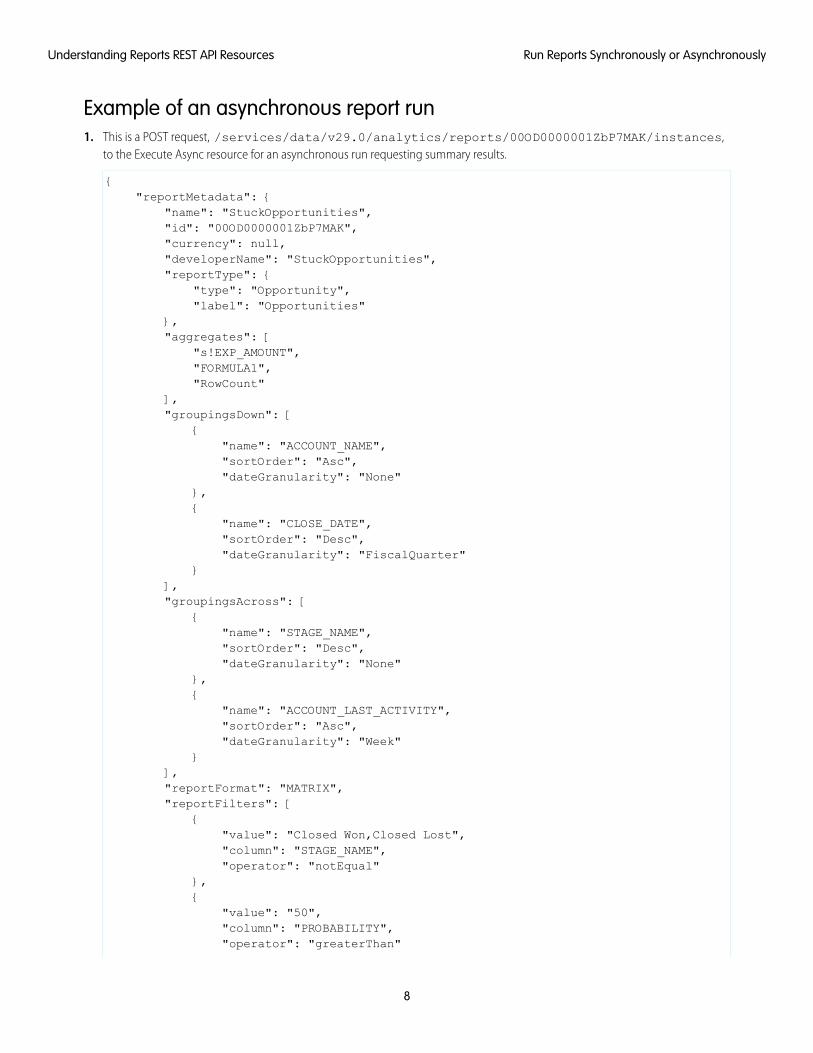
Example of an asynchronous report run1. This is a POST request, /services/data/v29.0/analytics/reports/00OD0000001ZbP7MAK/instances,
to the Execute Async resource for an asynchronous run requesting summary results.
{"reportMetadata": {
"name": "StuckOpportunities","id": "00OD0000001ZbP7MAK","currency": null,"developerName": "StuckOpportunities","reportType": {
"type": "Opportunity","label": "Opportunities"
},"aggregates": [
"s!EXP_AMOUNT","FORMULA1","RowCount"
],"groupingsDown": [
{"name": "ACCOUNT_NAME","sortOrder": "Asc","dateGranularity": "None"
},{
"name": "CLOSE_DATE","sortOrder": "Desc","dateGranularity": "FiscalQuarter"
}],"groupingsAcross": [
{"name": "STAGE_NAME","sortOrder": "Desc","dateGranularity": "None"
},{
"name": "ACCOUNT_LAST_ACTIVITY","sortOrder": "Asc","dateGranularity": "Week"
}],"reportFormat": "MATRIX","reportFilters": [
{"value": "Closed Won,Closed Lost","column": "STAGE_NAME","operator": "notEqual"
},{
"value": "50","column": "PROBABILITY","operator": "greaterThan"
8
Run Reports Synchronously or AsynchronouslyUnderstanding Reports REST API Resources
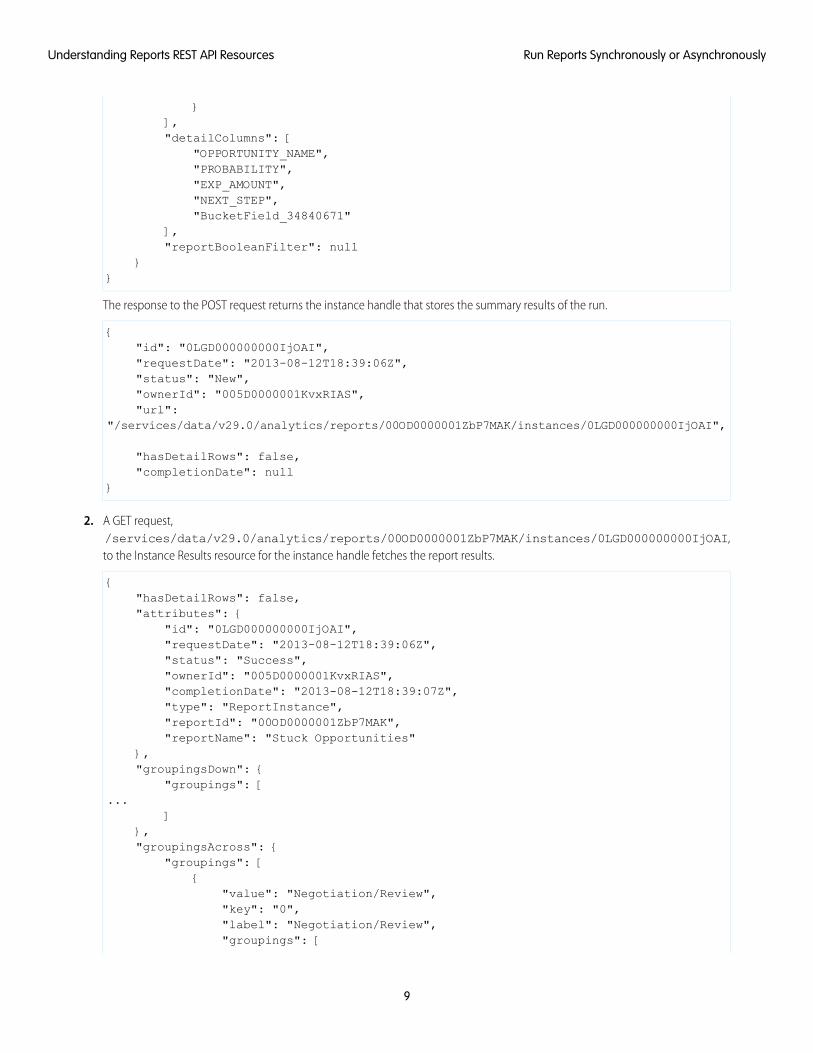
}],"detailColumns": [
"OPPORTUNITY_NAME","PROBABILITY","EXP_AMOUNT","NEXT_STEP","BucketField_34840671"
],"reportBooleanFilter": null
}}
The response to the POST request returns the instance handle that stores the summary results of the run.
{"id": "0LGD000000000IjOAI","requestDate": "2013-08-12T18:39:06Z","status": "New","ownerId": "005D0000001KvxRIAS","url":
"/services/data/v29.0/analytics/reports/00OD0000001ZbP7MAK/instances/0LGD000000000IjOAI",
"hasDetailRows": false,"completionDate": null
}
2. A GET request,/services/data/v29.0/analytics/reports/00OD0000001ZbP7MAK/instances/0LGD000000000IjOAI,to the Instance Results resource for the instance handle fetches the report results.
{"hasDetailRows": false,"attributes": {
"id": "0LGD000000000IjOAI","requestDate": "2013-08-12T18:39:06Z","status": "Success","ownerId": "005D0000001KvxRIAS","completionDate": "2013-08-12T18:39:07Z","type": "ReportInstance","reportId": "00OD0000001ZbP7MAK","reportName": "Stuck Opportunities"
},"groupingsDown": {
"groupings": [...
]},"groupingsAcross": {
"groupings": [{
"value": "Negotiation/Review","key": "0","label": "Negotiation/Review","groupings": [
9
Run Reports Synchronously or AsynchronouslyUnderstanding Reports REST API Resources
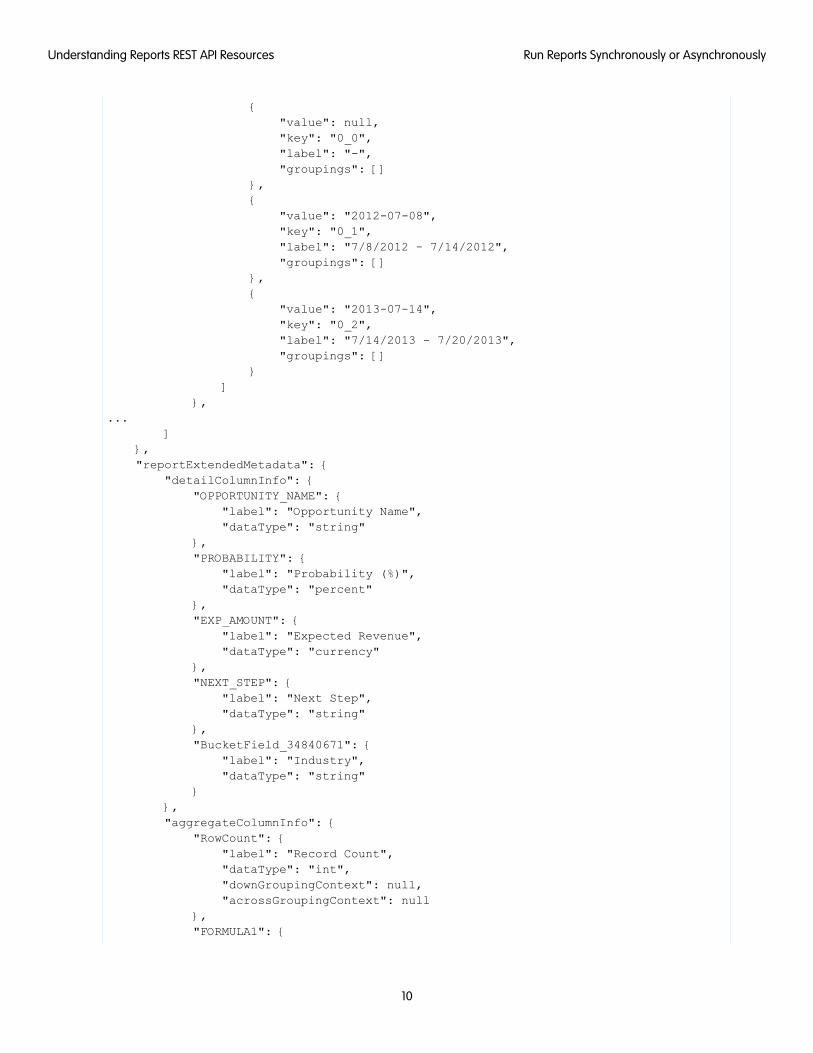
{"value": null,"key": "0_0","label": "-","groupings": []
},{
"value": "2012-07-08","key": "0_1","label": "7/8/2012 - 7/14/2012","groupings": []
},{
"value": "2013-07-14","key": "0_2","label": "7/14/2013 - 7/20/2013","groupings": []
}]
},...
]},"reportExtendedMetadata": {
"detailColumnInfo": {"OPPORTUNITY_NAME": {
"label": "Opportunity Name","dataType": "string"
},"PROBABILITY": {
"label": "Probability (%)","dataType": "percent"
},"EXP_AMOUNT": {
"label": "Expected Revenue","dataType": "currency"
},"NEXT_STEP": {
"label": "Next Step","dataType": "string"
},"BucketField_34840671": {
"label": "Industry","dataType": "string"
}},"aggregateColumnInfo": {
"RowCount": {"label": "Record Count","dataType": "int","downGroupingContext": null,"acrossGroupingContext": null
},"FORMULA1": {
10
Run Reports Synchronously or AsynchronouslyUnderstanding Reports REST API Resources
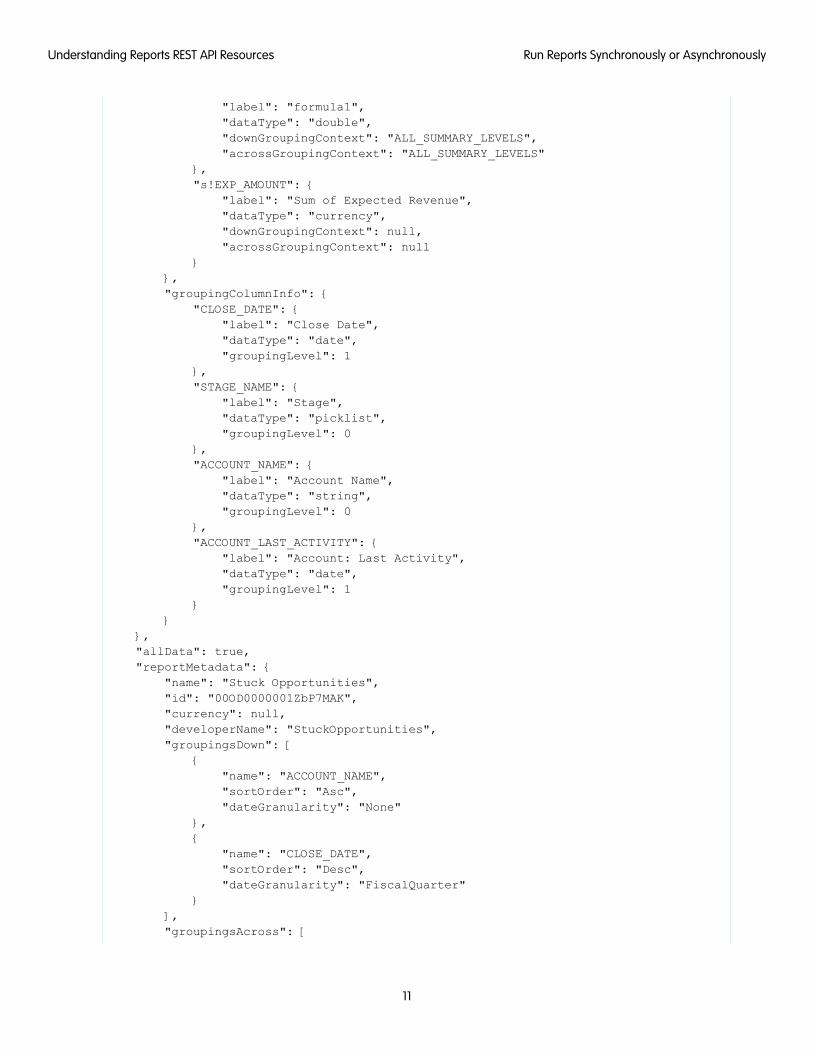
"label": "formula1","dataType": "double","downGroupingContext": "ALL_SUMMARY_LEVELS","acrossGroupingContext": "ALL_SUMMARY_LEVELS"
},"s!EXP_AMOUNT": {
"label": "Sum of Expected Revenue","dataType": "currency","downGroupingContext": null,"acrossGroupingContext": null
}},"groupingColumnInfo": {
"CLOSE_DATE": {"label": "Close Date","dataType": "date","groupingLevel": 1
},"STAGE_NAME": {
"label": "Stage","dataType": "picklist","groupingLevel": 0
},"ACCOUNT_NAME": {
"label": "Account Name","dataType": "string","groupingLevel": 0
},"ACCOUNT_LAST_ACTIVITY": {
"label": "Account: Last Activity","dataType": "date","groupingLevel": 1
}}
},"allData": true,"reportMetadata": {
"name": "Stuck Opportunities","id": "00OD0000001ZbP7MAK","currency": null,"developerName": "StuckOpportunities","groupingsDown": [
{"name": "ACCOUNT_NAME","sortOrder": "Asc","dateGranularity": "None"
},{
"name": "CLOSE_DATE","sortOrder": "Desc","dateGranularity": "FiscalQuarter"
}],"groupingsAcross": [
11
Run Reports Synchronously or AsynchronouslyUnderstanding Reports REST API Resources
{"name": "STAGE_NAME","sortOrder": "Desc","dateGranularity": "None"
},{
"name": "ACCOUNT_LAST_ACTIVITY","sortOrder": "Asc","dateGranularity": "Week"
}],"reportType": {
"type": "Opportunity","label": "Opportunities"
},"aggregates": [
"s!EXP_AMOUNT","FORMULA1","RowCount"
],"reportFormat": "MATRIX","reportBooleanFilter": null,"reportFilters": [
{"value": "Closed Won,Closed Lost","column": "STAGE_NAME","operator": "notEqual"
},{
"value": "50","column": "PROBABILITY","operator": "greaterThan"
}],"detailColumns": [
"OPPORTUNITY_NAME","PROBABILITY","EXP_AMOUNT","NEXT_STEP","BucketField_34840671"
]},"factMap": {
"4_0!2_0": {"aggregates": [
{"value": 0,"label": "$0.00"
},{
"value": null,"label": "-"
},{
12
Run Reports Synchronously or AsynchronouslyUnderstanding Reports REST API Resources
"value": 0,"label": "0"
}]
},"12_0!4": {
"aggregates": [{
"value": 0,"label": "$0.00"
},{
"value": null,"label": "-"
},{
"value": 0,"label": "0"
}]
},...
}}
SEE ALSO:
Execute Sync
Instances List
Instance Results
Get Report Metadata
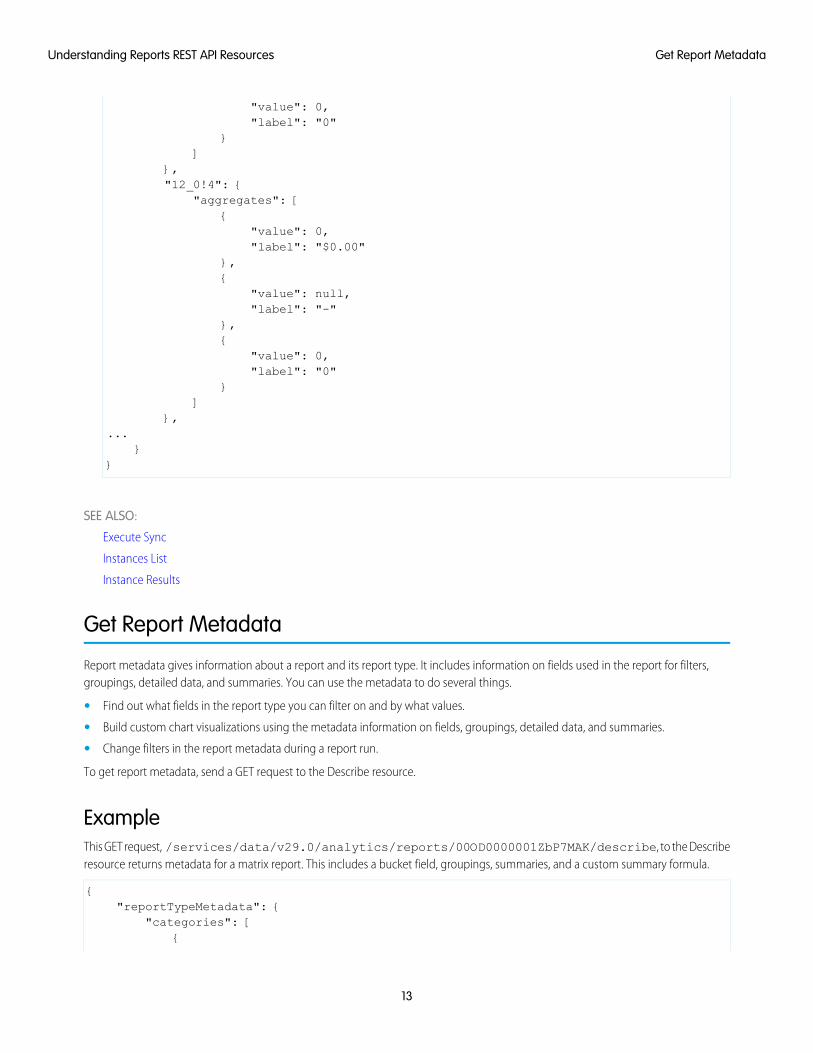
Report metadata gives information about a report and its report type. It includes information on fields used in the report for filters,groupings, detailed data, and summaries. You can use the metadata to do several things.
• Find out what fields in the report type you can filter on and by what values.
• Build custom chart visualizations using the metadata information on fields, groupings, detailed data, and summaries.
• Change filters in the report metadata during a report run.
To get report metadata, send a GET request to the Describe resource.
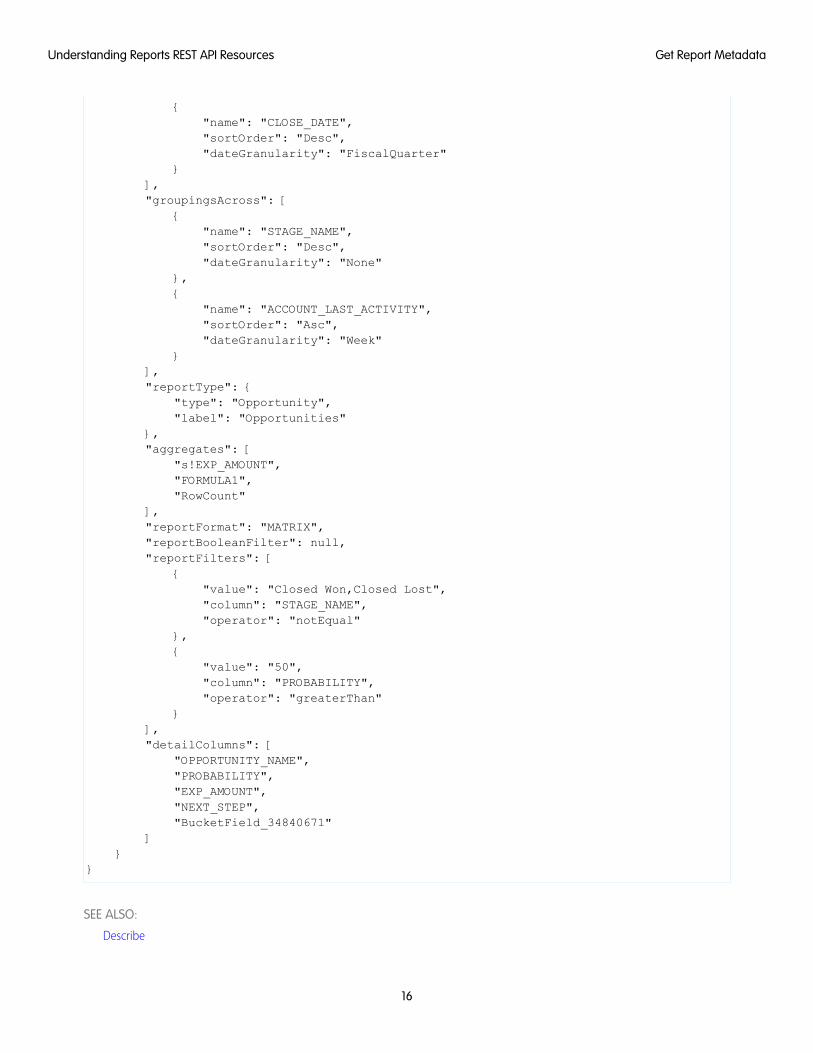
ExampleThis GET request, /services/data/v29.0/analytics/reports/00OD0000001ZbP7MAK/describe, to the Describeresource returns metadata for a matrix report. This includes a bucket field, groupings, summaries, and a custom summary formula.
{"reportTypeMetadata": {
"categories": [{
13
Get Report MetadataUnderstanding Reports REST API Resources
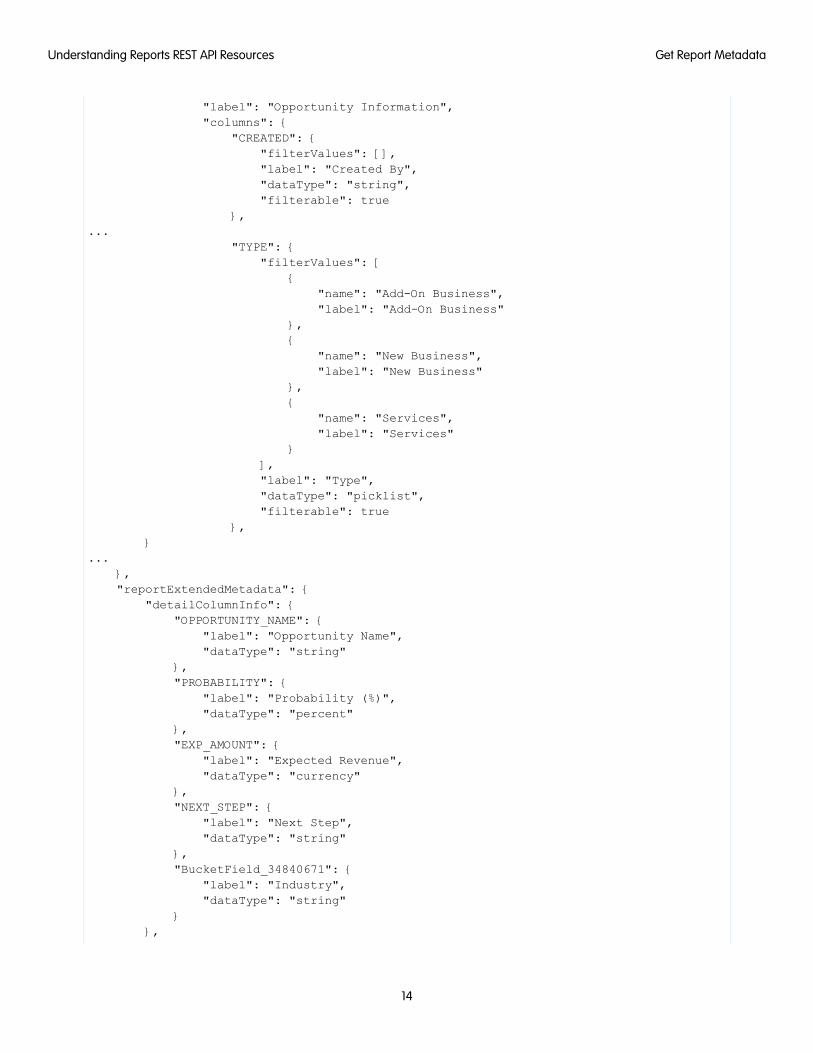
"label": "Opportunity Information","columns": {
"CREATED": {"filterValues": [],"label": "Created By","dataType": "string","filterable": true
},...
"TYPE": {"filterValues": [
{"name": "Add-On Business","label": "Add-On Business"
},{
"name": "New Business","label": "New Business"
},{
"name": "Services","label": "Services"
}],"label": "Type","dataType": "picklist","filterable": true
},}
...},"reportExtendedMetadata": {
"detailColumnInfo": {"OPPORTUNITY_NAME": {
"label": "Opportunity Name","dataType": "string"
},"PROBABILITY": {
"label": "Probability (%)","dataType": "percent"
},"EXP_AMOUNT": {
"label": "Expected Revenue","dataType": "currency"
},"NEXT_STEP": {
"label": "Next Step","dataType": "string"
},"BucketField_34840671": {
"label": "Industry","dataType": "string"
}},
14
Get Report MetadataUnderstanding Reports REST API Resources
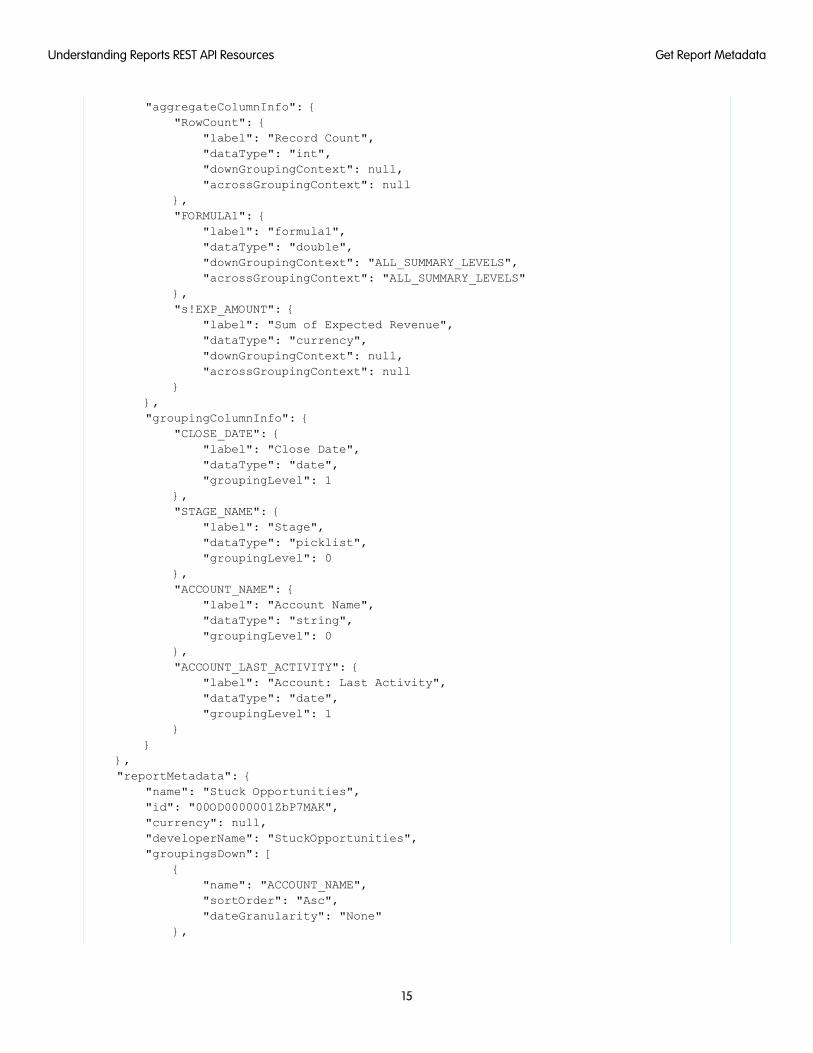
"aggregateColumnInfo": {"RowCount": {
"label": "Record Count","dataType": "int","downGroupingContext": null,"acrossGroupingContext": null
},"FORMULA1": {
"label": "formula1","dataType": "double","downGroupingContext": "ALL_SUMMARY_LEVELS","acrossGroupingContext": "ALL_SUMMARY_LEVELS"
},"s!EXP_AMOUNT": {
"label": "Sum of Expected Revenue","dataType": "currency","downGroupingContext": null,"acrossGroupingContext": null
}},"groupingColumnInfo": {
"CLOSE_DATE": {"label": "Close Date","dataType": "date","groupingLevel": 1
},"STAGE_NAME": {
"label": "Stage","dataType": "picklist","groupingLevel": 0
},"ACCOUNT_NAME": {
"label": "Account Name","dataType": "string","groupingLevel": 0
},"ACCOUNT_LAST_ACTIVITY": {
"label": "Account: Last Activity","dataType": "date","groupingLevel": 1
}}
},"reportMetadata": {
"name": "Stuck Opportunities","id": "00OD0000001ZbP7MAK","currency": null,"developerName": "StuckOpportunities","groupingsDown": [
{"name": "ACCOUNT_NAME","sortOrder": "Asc","dateGranularity": "None"
},
15
Get Report MetadataUnderstanding Reports REST API Resources
{"name": "CLOSE_DATE","sortOrder": "Desc","dateGranularity": "FiscalQuarter"
}],"groupingsAcross": [
{"name": "STAGE_NAME","sortOrder": "Desc","dateGranularity": "None"
},{
"name": "ACCOUNT_LAST_ACTIVITY","sortOrder": "Asc","dateGranularity": "Week"
}],"reportType": {
"type": "Opportunity","label": "Opportunities"
},"aggregates": [
"s!EXP_AMOUNT","FORMULA1","RowCount"
],"reportFormat": "MATRIX","reportBooleanFilter": null,"reportFilters": [
{"value": "Closed Won,Closed Lost","column": "STAGE_NAME","operator": "notEqual"
},{
"value": "50","column": "PROBABILITY","operator": "greaterThan"
}],"detailColumns": [
"OPPORTUNITY_NAME","PROBABILITY","EXP_AMOUNT","NEXT_STEP","BucketField_34840671"
]}
}
SEE ALSO:
Describe
16
Get Report MetadataUnderstanding Reports REST API Resources
List Asynchronous Runs of a Report
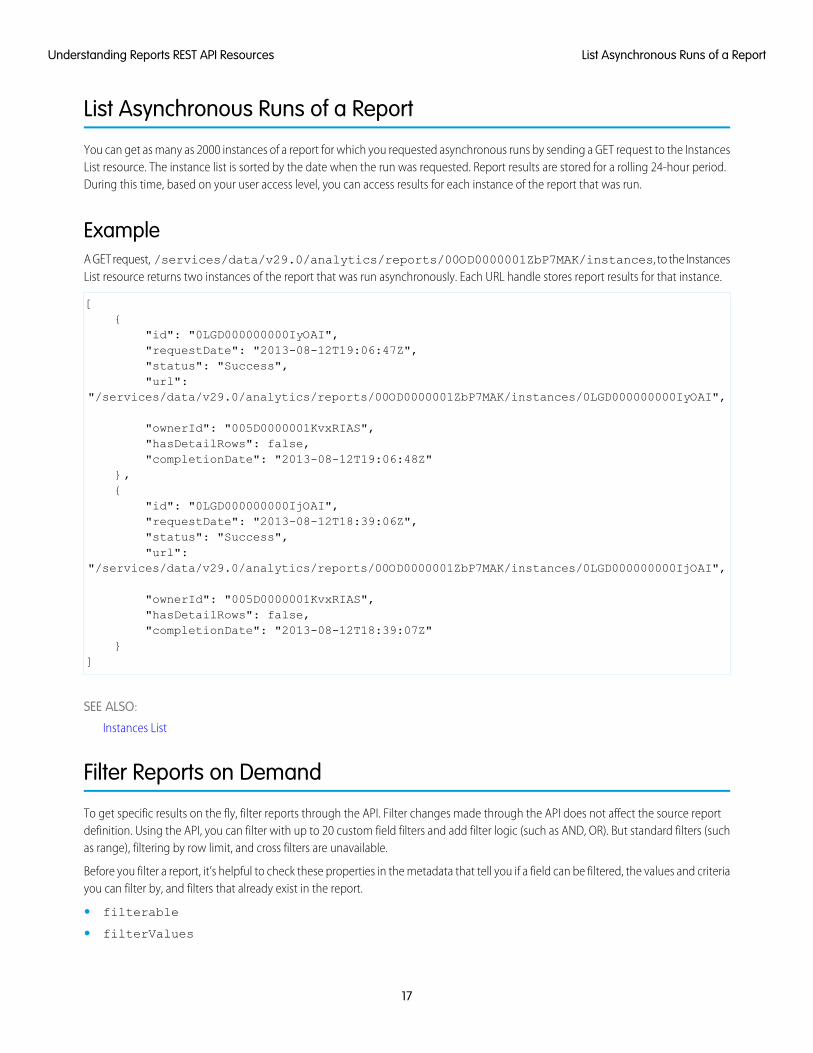
You can get as many as 2000 instances of a report for which you requested asynchronous runs by sending a GET request to the InstancesList resource. The instance list is sorted by the date when the run was requested. Report results are stored for a rolling 24-hour period.During this time, based on your user access level, you can access results for each instance of the report that was run.
ExampleA GET request, /services/data/v29.0/analytics/reports/00OD0000001ZbP7MAK/instances, to the InstancesList resource returns two instances of the report that was run asynchronously. Each URL handle stores report results for that instance.
[{
"id": "0LGD000000000IyOAI","requestDate": "2013-08-12T19:06:47Z","status": "Success","url":
"/services/data/v29.0/analytics/reports/00OD0000001ZbP7MAK/instances/0LGD000000000IyOAI",
"ownerId": "005D0000001KvxRIAS","hasDetailRows": false,"completionDate": "2013-08-12T19:06:48Z"
},{
"id": "0LGD000000000IjOAI","requestDate": "2013-08-12T18:39:06Z","status": "Success","url":
"/services/data/v29.0/analytics/reports/00OD0000001ZbP7MAK/instances/0LGD000000000IjOAI",
"ownerId": "005D0000001KvxRIAS","hasDetailRows": false,"completionDate": "2013-08-12T18:39:07Z"
}]
SEE ALSO:
Instances List
Filter Reports on Demand
To get specific results on the fly, filter reports through the API. Filter changes made through the API does not affect the source reportdefinition. Using the API, you can filter with up to 20 custom field filters and add filter logic (such as AND, OR). But standard filters (suchas range), filtering by row limit, and cross filters are unavailable.
Before you filter a report, it’s helpful to check these properties in the metadata that tell you if a field can be filtered, the values and criteriayou can filter by, and filters that already exist in the report.
• filterable
• filterValues
17
List Asynchronous Runs of a ReportUnderstanding Reports REST API Resources
• dataTypeFilterOperatorMap
• reportFilters
You can filter reports during synchronous or asynchronous report runs by making a POST request to the Execute Sync or Execute Asyncresource.
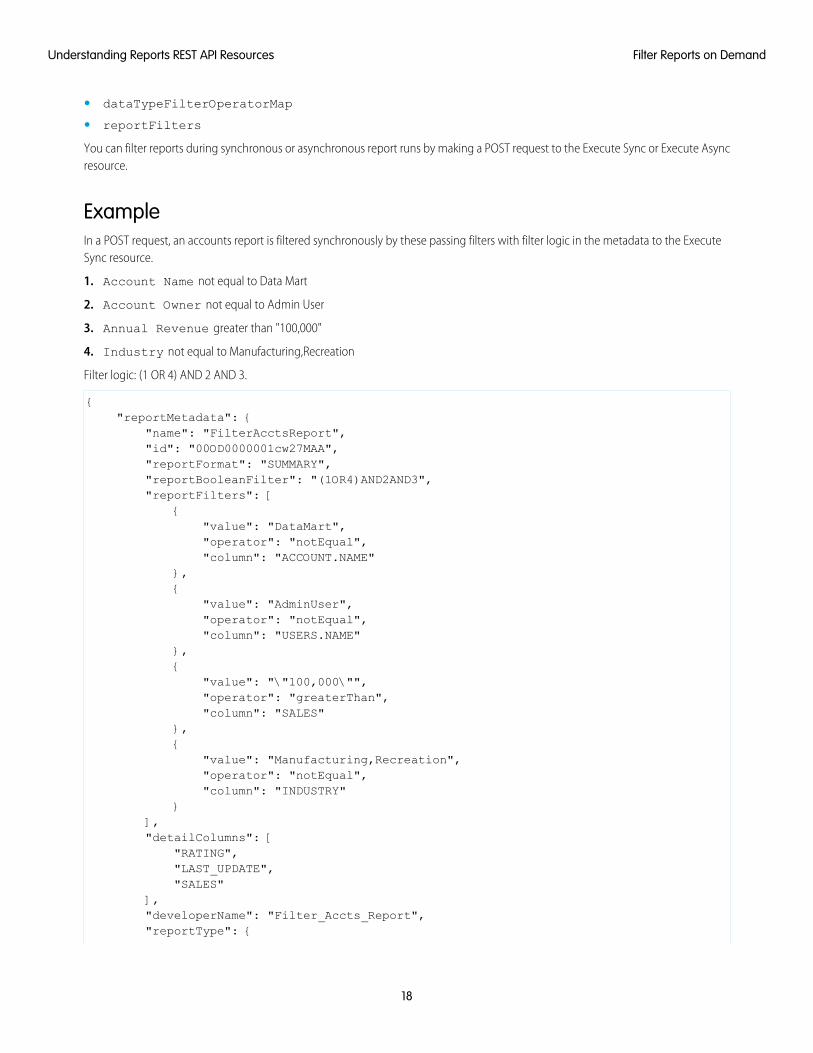
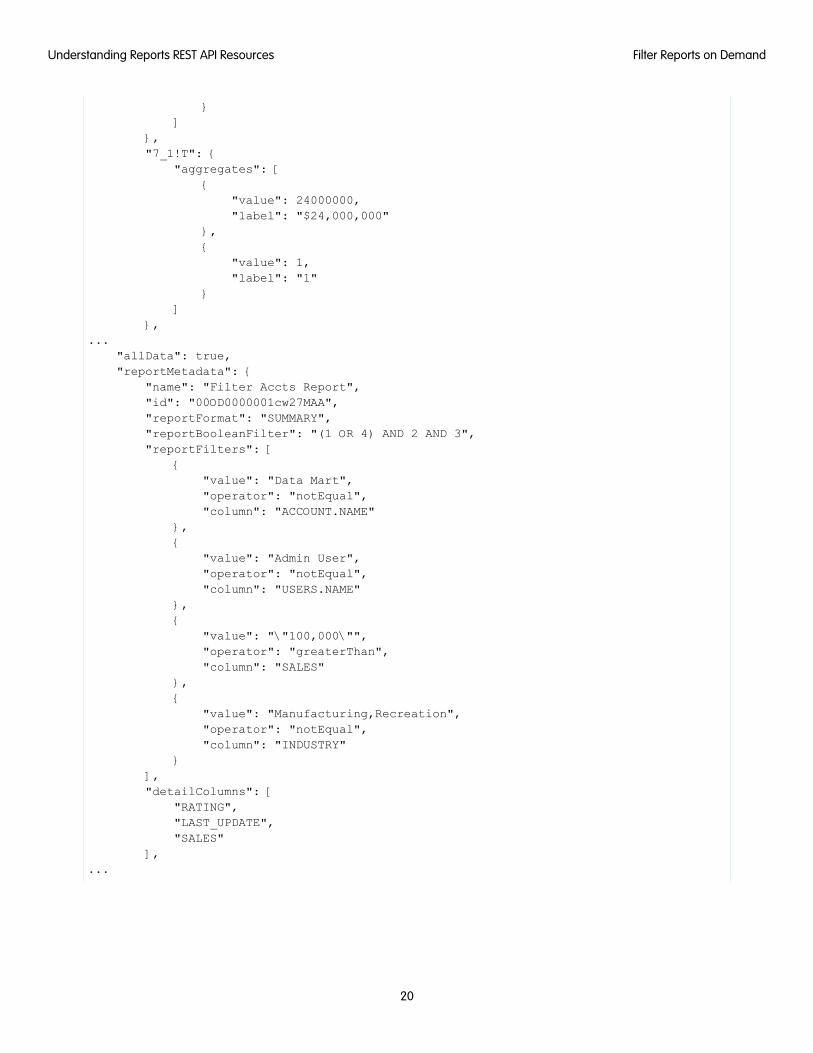
ExampleIn a POST request, an accounts report is filtered synchronously by these passing filters with filter logic in the metadata to the ExecuteSync resource.
1. Account Name not equal to Data Mart
2. Account Owner not equal to Admin User
3. Annual Revenue greater than "100,000"
4. Industry not equal to Manufacturing,Recreation
Filter logic: (1 OR 4) AND 2 AND 3.
{"reportMetadata": {
"name": "FilterAcctsReport","id": "00OD0000001cw27MAA","reportFormat": "SUMMARY","reportBooleanFilter": "(1OR4)AND2AND3","reportFilters": [
{"value": "DataMart","operator": "notEqual","column": "ACCOUNT.NAME"
},{
"value": "AdminUser","operator": "notEqual","column": "USERS.NAME"
},{
"value": "\"100,000\"","operator": "greaterThan","column": "SALES"
},{
"value": "Manufacturing,Recreation","operator": "notEqual","column": "INDUSTRY"
}],"detailColumns": [
"RATING","LAST_UPDATE","SALES"
],"developerName": "Filter_Accts_Report","reportType": {
18
Filter Reports on DemandUnderstanding Reports REST API Resources
"type": "AccountList","label": "Accounts"
},"currency": null,"aggregates": [
"s!SALES","RowCount"
],"groupingsDown": [
{"name": "USERS.NAME","sortAggregate": "s!SALES","sortOrder": "Desc","dateGranularity": "None"
},{
"name": "ACCOUNT.NAME","sortAggregate": null,"sortOrder": "Asc","dateGranularity": "None"
},{
"name": "DUE_DATE","sortAggregate": null,"sortOrder": "Asc","dateGranularity": "Month"
}],"groupingsAcross": []
}}
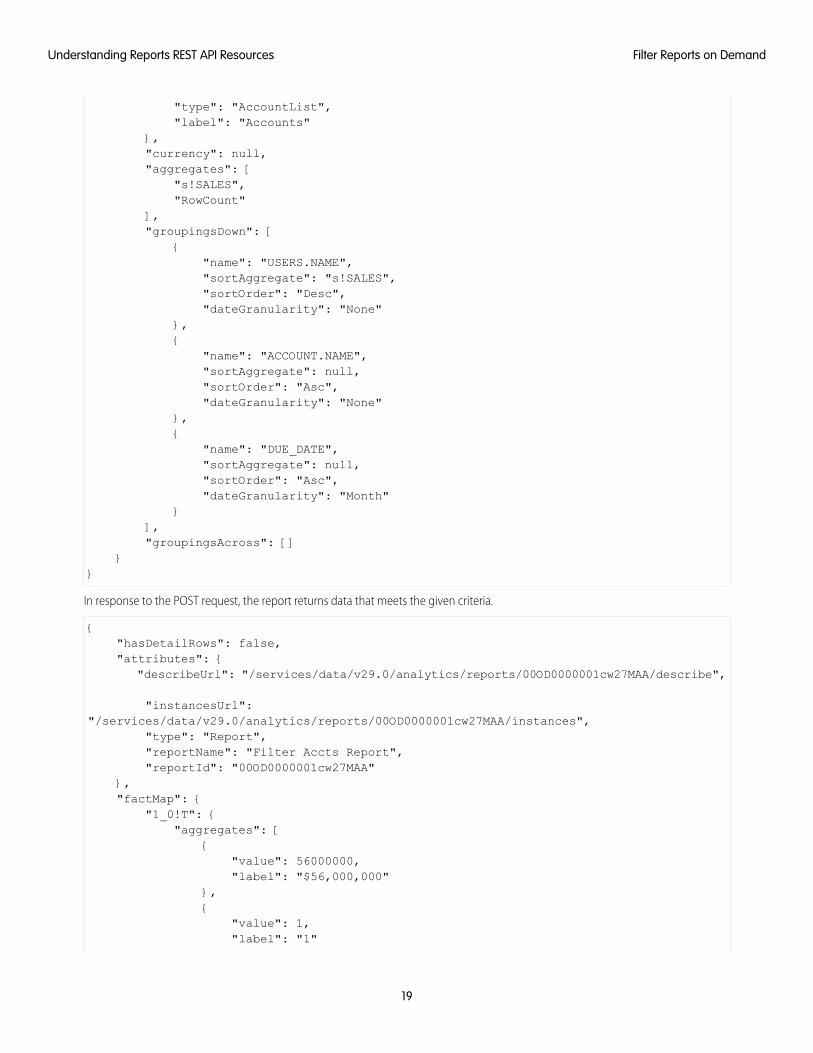
In response to the POST request, the report returns data that meets the given criteria.
{"hasDetailRows": false,"attributes": {
"describeUrl": "/services/data/v29.0/analytics/reports/00OD0000001cw27MAA/describe",
"instancesUrl":"/services/data/v29.0/analytics/reports/00OD0000001cw27MAA/instances",
"type": "Report","reportName": "Filter Accts Report","reportId": "00OD0000001cw27MAA"
},"factMap": {
"1_0!T": {"aggregates": [
{"value": 56000000,"label": "$56,000,000"
},{
"value": 1,"label": "1"
19
Filter Reports on DemandUnderstanding Reports REST API Resources
}]
},"7_1!T": {
"aggregates": [{
"value": 24000000,"label": "$24,000,000"
},{
"value": 1,"label": "1"
}]
},...
"allData": true,"reportMetadata": {
"name": "Filter Accts Report","id": "00OD0000001cw27MAA","reportFormat": "SUMMARY","reportBooleanFilter": "(1 OR 4) AND 2 AND 3","reportFilters": [
{"value": "Data Mart","operator": "notEqual","column": "ACCOUNT.NAME"
},{
"value": "Admin User","operator": "notEqual","column": "USERS.NAME"
},{
"value": "\"100,000\"","operator": "greaterThan","column": "SALES"
},{
"value": "Manufacturing,Recreation","operator": "notEqual","column": "INDUSTRY"
}],"detailColumns": [
"RATING","LAST_UPDATE","SALES"
],...
20
Filter Reports on DemandUnderstanding Reports REST API Resources
}}
SEE ALSO:
Execute Sync
List Recently Viewed Reports
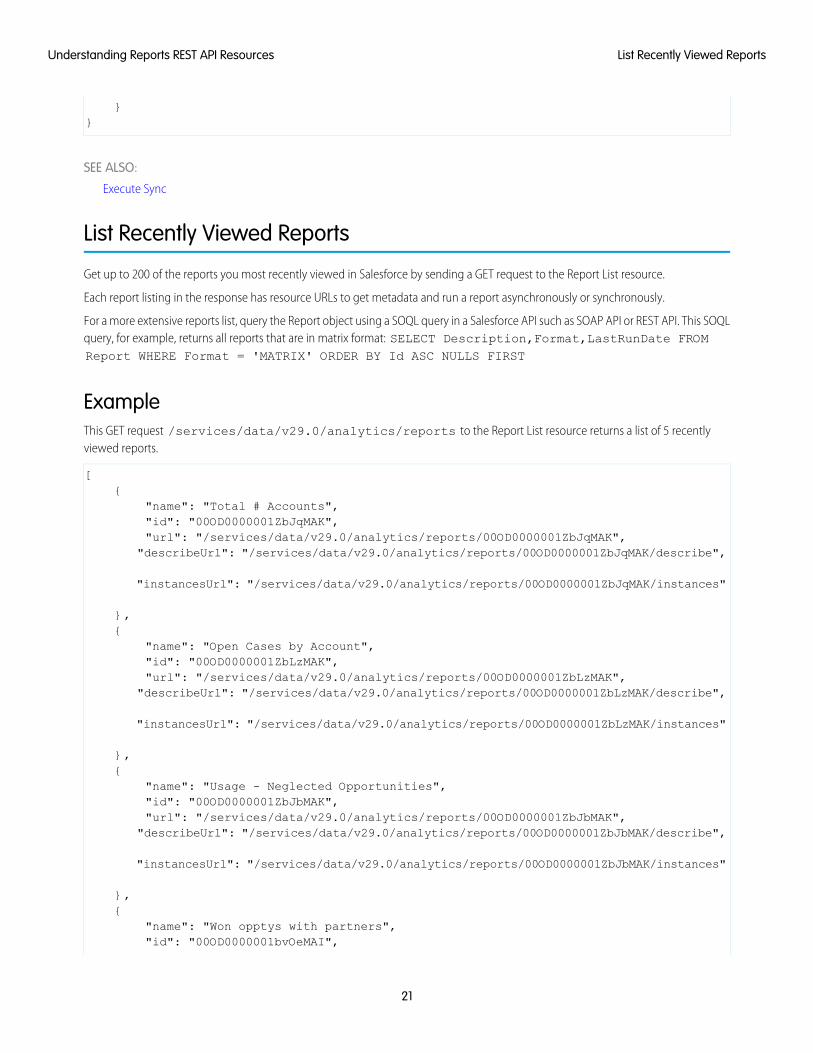
Get up to 200 of the reports you most recently viewed in Salesforce by sending a GET request to the Report List resource.
Each report listing in the response has resource URLs to get metadata and run a report asynchronously or synchronously.
For a more extensive reports list, query the Report object using a SOQL query in a Salesforce API such as SOAP API or REST API. This SOQLquery, for example, returns all reports that are in matrix format: SELECT Description,Format,LastRunDate FROMReport WHERE Format = 'MATRIX' ORDER BY Id ASC NULLS FIRST
ExampleThis GET request /services/data/v29.0/analytics/reports to the Report List resource returns a list of 5 recentlyviewed reports.
[{
"name": "Total # Accounts","id": "00OD0000001ZbJqMAK","url": "/services/data/v29.0/analytics/reports/00OD0000001ZbJqMAK",
"describeUrl": "/services/data/v29.0/analytics/reports/00OD0000001ZbJqMAK/describe",
"instancesUrl": "/services/data/v29.0/analytics/reports/00OD0000001ZbJqMAK/instances"
},{
"name": "Open Cases by Account","id": "00OD0000001ZbLzMAK","url": "/services/data/v29.0/analytics/reports/00OD0000001ZbLzMAK",
"describeUrl": "/services/data/v29.0/analytics/reports/00OD0000001ZbLzMAK/describe",
"instancesUrl": "/services/data/v29.0/analytics/reports/00OD0000001ZbLzMAK/instances"
},{
"name": "Usage - Neglected Opportunities","id": "00OD0000001ZbJbMAK","url": "/services/data/v29.0/analytics/reports/00OD0000001ZbJbMAK",
"describeUrl": "/services/data/v29.0/analytics/reports/00OD0000001ZbJbMAK/describe",
"instancesUrl": "/services/data/v29.0/analytics/reports/00OD0000001ZbJbMAK/instances"
},{
"name": "Won opptys with partners","id": "00OD0000001bvOeMAI",
21
List Recently Viewed ReportsUnderstanding Reports REST API Resources
"url": "/services/data/v29.0/analytics/reports/00OD0000001bvOeMAI","describeUrl": "/services/data/v29.0/analytics/reports/00OD0000001bvOeMAI/describe",
"instancesUrl": "/services/data/v29.0/analytics/reports/00OD0000001bvOeMAI/instances"
},{
"name": "Usage - Accounts Last Modified","id": "00OD0000001ZbJdMAK","url": "/services/data/v29.0/analytics/reports/00OD0000001ZbJdMAK",
"describeUrl": "/services/data/v29.0/analytics/reports/00OD0000001ZbJdMAK/describe",
"instancesUrl": "/services/data/v29.0/analytics/reports/00OD0000001ZbJdMAK/instances"
},]
SEE ALSO:
Report List
Decode the Fact Map
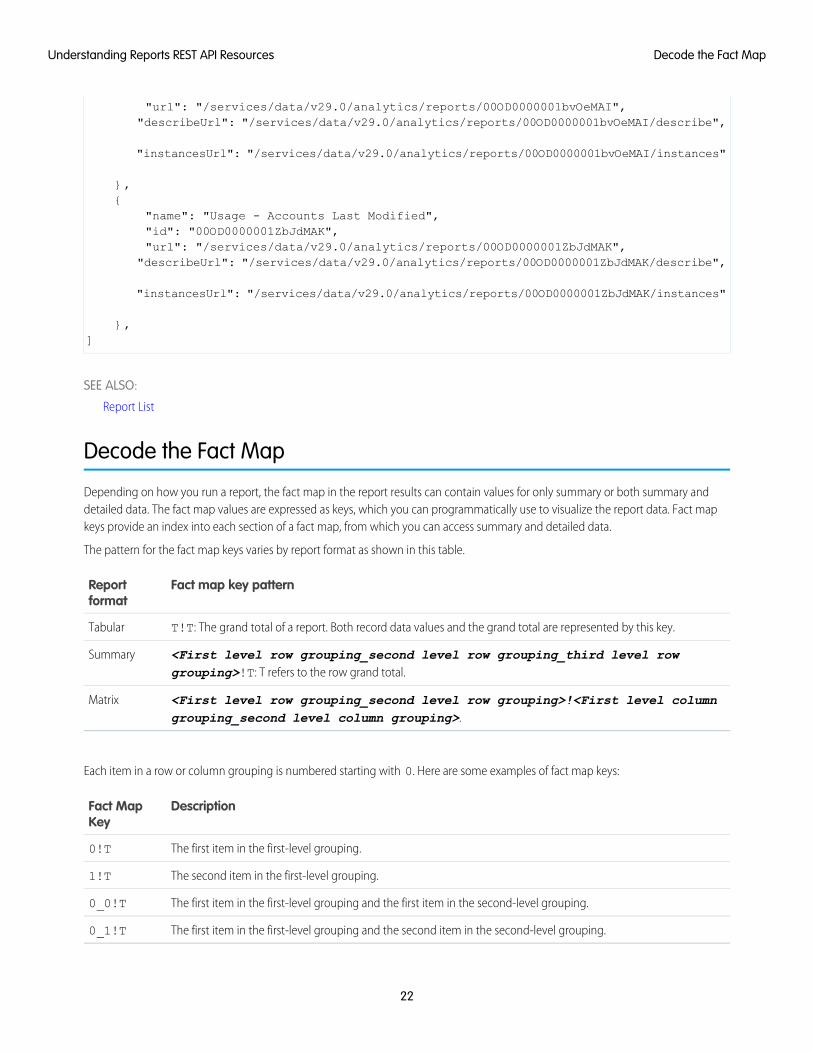
Depending on how you run a report, the fact map in the report results can contain values for only summary or both summary anddetailed data. The fact map values are expressed as keys, which you can programmatically use to visualize the report data. Fact mapkeys provide an index into each section of a fact map, from which you can access summary and detailed data.
The pattern for the fact map keys varies by report format as shown in this table.
Fact map key patternReportformat
T!T: The grand total of a report. Both record data values and the grand total are represented by this key.Tabular
<First level row grouping_second level row grouping_third level rowgrouping>!T: T refers to the row grand total.
Summary
<First level row grouping_second level row grouping>!<First level columngrouping_second level column grouping>.
Matrix
Each item in a row or column grouping is numbered starting with 0. Here are some examples of fact map keys:
DescriptionFact MapKey
The first item in the first-level grouping.0!T
The second item in the first-level grouping.1!T
The first item in the first-level grouping and the first item in the second-level grouping.0_0!T
The first item in the first-level grouping and the second item in the second-level grouping.0_1!T
22
Decode the Fact MapUnderstanding Reports REST API Resources
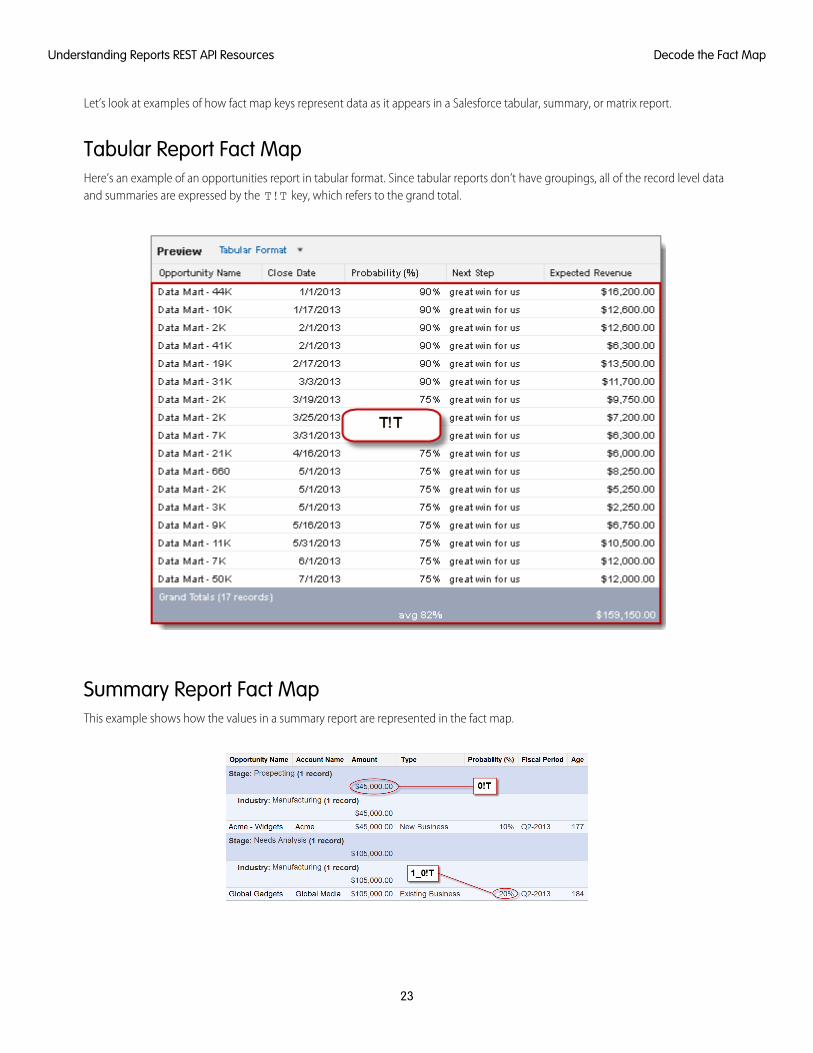
Let’s look at examples of how fact map keys represent data as it appears in a Salesforce tabular, summary, or matrix report.
Tabular Report Fact MapHere’s an example of an opportunities report in tabular format. Since tabular reports don’t have groupings, all of the record level dataand summaries are expressed by the T!T key, which refers to the grand total.
Summary Report Fact MapThis example shows how the values in a summary report are represented in the fact map.
23
Decode the Fact MapUnderstanding Reports REST API Resources
DescriptionFact Map Key
Summary for the value of opportunities in the Prospecting stage.0!T
Summary of the probabilities for the Manufacturing opportunities in the Needs Analysis stage.1_0!T
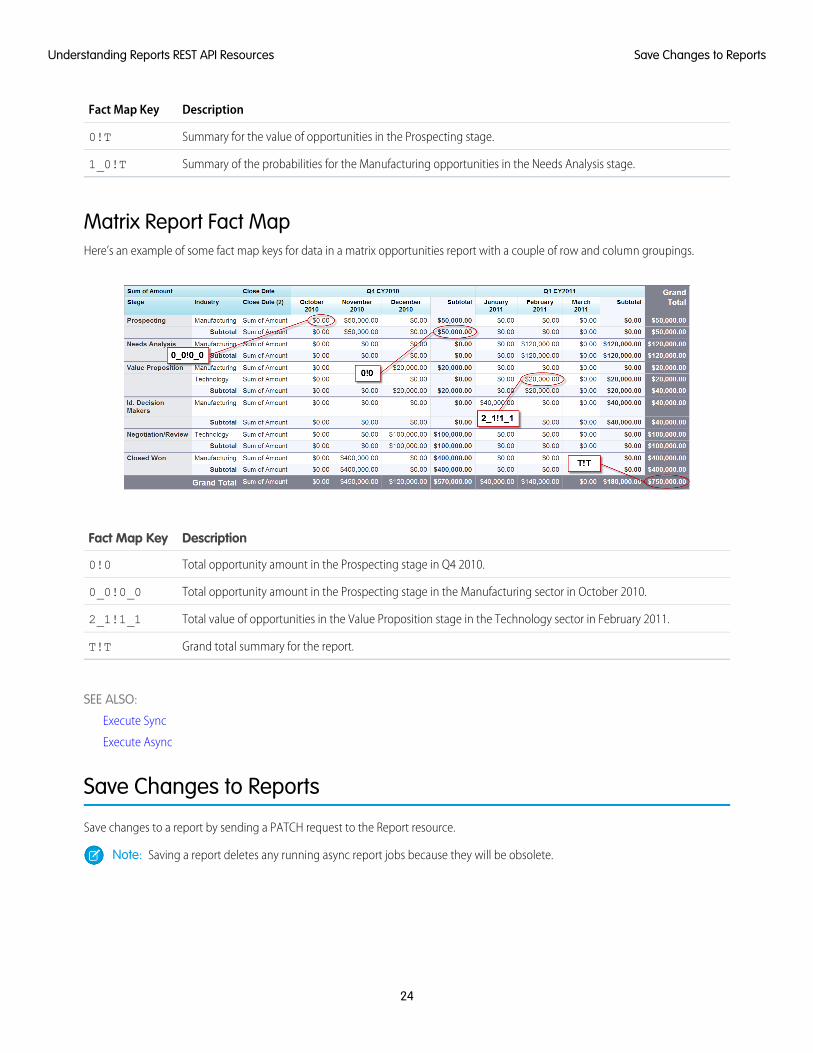
Matrix Report Fact MapHere’s an example of some fact map keys for data in a matrix opportunities report with a couple of row and column groupings.
DescriptionFact Map Key
Total opportunity amount in the Prospecting stage in Q4 2010.0!0
Total opportunity amount in the Prospecting stage in the Manufacturing sector in October 2010.0_0!0_0
Total value of opportunities in the Value Proposition stage in the Technology sector in February 2011.2_1!1_1
Grand total summary for the report.T!T
SEE ALSO:
Execute Sync
Execute Async
Save Changes to Reports
Save changes to a report by sending a PATCH request to the Report resource.
Note: Saving a report deletes any running async report jobs because they will be obsolete.
24
Save Changes to ReportsUnderstanding Reports REST API Resources
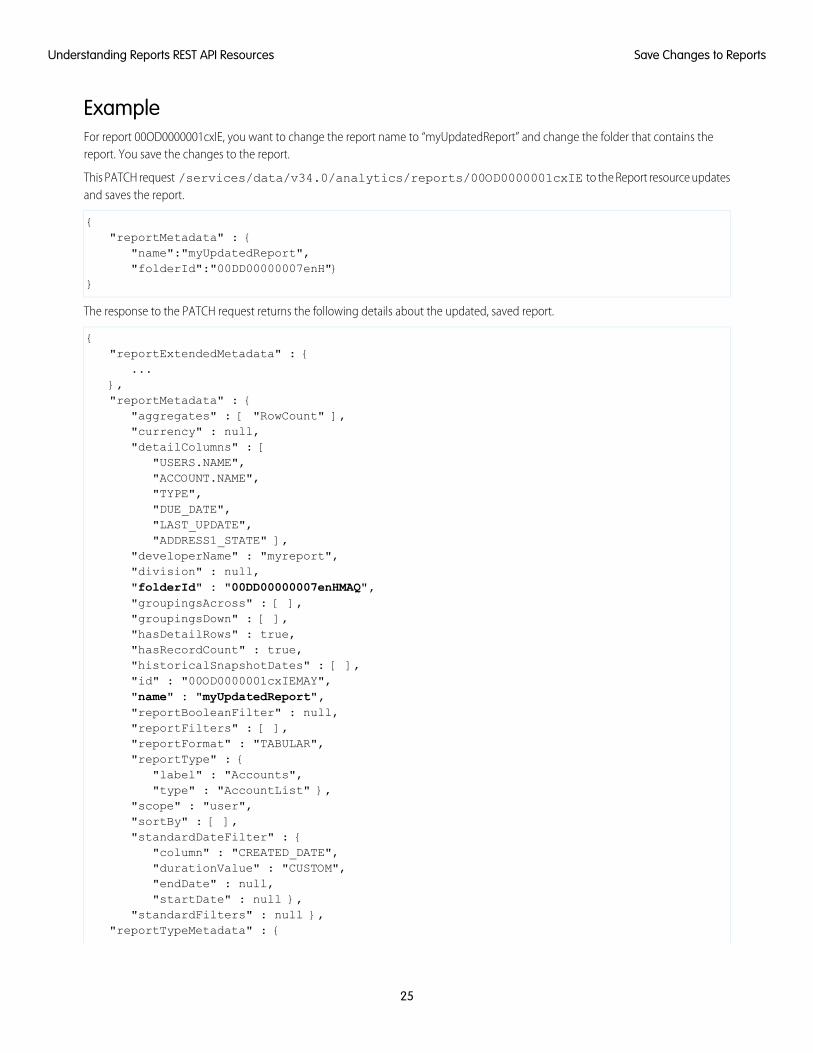
ExampleFor report 00OD0000001cxIE, you want to change the report name to “myUpdatedReport” and change the folder that contains thereport. You save the changes to the report.
This PATCH request /services/data/v34.0/analytics/reports/00OD0000001cxIE to the Report resource updatesand saves the report.
{"reportMetadata" : {
"name":"myUpdatedReport","folderId":"00DD00000007enH"}
}
The response to the PATCH request returns the following details about the updated, saved report.
{"reportExtendedMetadata" : {
...},"reportMetadata" : {
"aggregates" : [ "RowCount" ],"currency" : null,"detailColumns" : [
"USERS.NAME","ACCOUNT.NAME","TYPE","DUE_DATE","LAST_UPDATE","ADDRESS1_STATE" ],
"developerName" : "myreport","division" : null,"folderId" : "00DD00000007enHMAQ","groupingsAcross" : [ ],"groupingsDown" : [ ],"hasDetailRows" : true,"hasRecordCount" : true,"historicalSnapshotDates" : [ ],"id" : "00OD0000001cxIEMAY","name" : "myUpdatedReport","reportBooleanFilter" : null,"reportFilters" : [ ],"reportFormat" : "TABULAR","reportType" : {
"label" : "Accounts","type" : "AccountList" },
"scope" : "user","sortBy" : [ ],"standardDateFilter" : {
"column" : "CREATED_DATE","durationValue" : "CUSTOM","endDate" : null,"startDate" : null },
"standardFilters" : null },"reportTypeMetadata" : {
25
Save Changes to ReportsUnderstanding Reports REST API Resources
...}
}
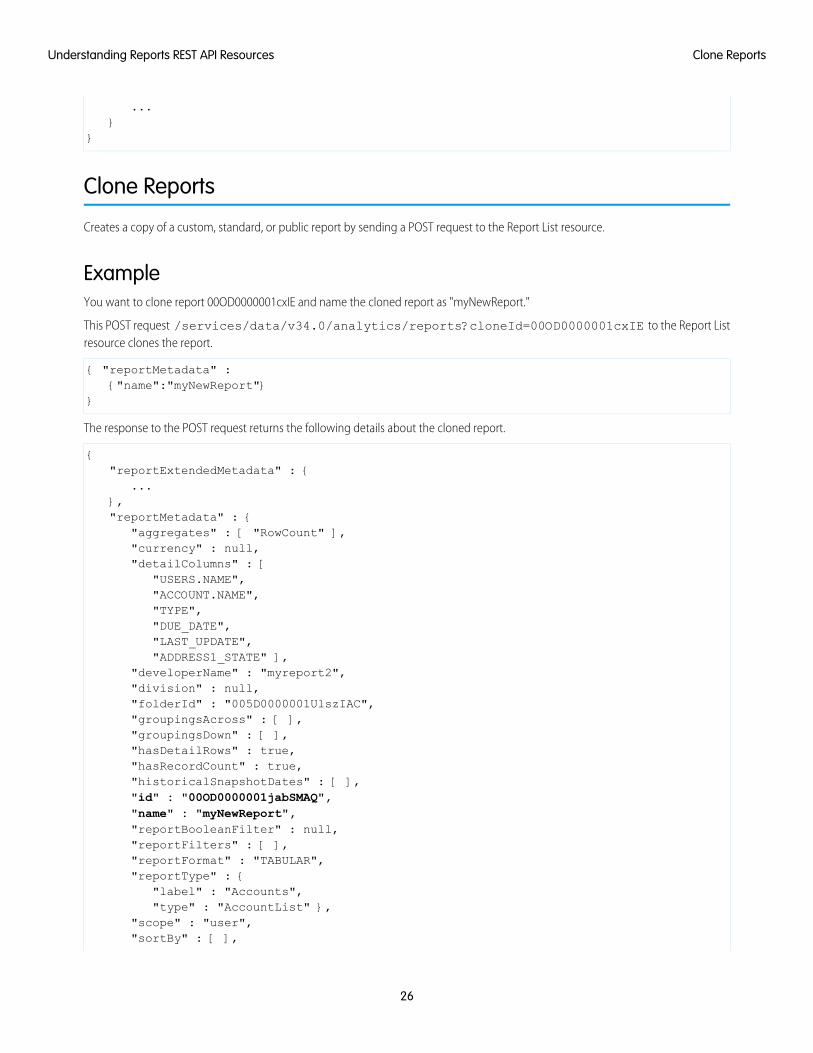
Clone Reports
Creates a copy of a custom, standard, or public report by sending a POST request to the Report List resource.
ExampleYou want to clone report 00OD0000001cxIE and name the cloned report as "myNewReport."
This POST request /services/data/v34.0/analytics/reports?cloneId=00OD0000001cxIE to the Report Listresource clones the report.
{ "reportMetadata" :{"name":"myNewReport"}
}
The response to the POST request returns the following details about the cloned report.
{"reportExtendedMetadata" : {
...},"reportMetadata" : {
"aggregates" : [ "RowCount" ],"currency" : null,"detailColumns" : [
"USERS.NAME","ACCOUNT.NAME","TYPE","DUE_DATE","LAST_UPDATE","ADDRESS1_STATE" ],
"developerName" : "myreport2","division" : null,"folderId" : "005D0000001UlszIAC","groupingsAcross" : [ ],"groupingsDown" : [ ],"hasDetailRows" : true,"hasRecordCount" : true,"historicalSnapshotDates" : [ ],"id" : "00OD0000001jabSMAQ","name" : "myNewReport","reportBooleanFilter" : null,"reportFilters" : [ ],"reportFormat" : "TABULAR","reportType" : {
"label" : "Accounts","type" : "AccountList" },
"scope" : "user","sortBy" : [ ],
26
Clone ReportsUnderstanding Reports REST API Resources
"standardDateFilter" : {"column" : "CREATED_DATE","durationValue" : "CUSTOM","endDate" : null,"startDate" : null },
"standardFilters" : null },"reportTypeMetadata" : {
...}
}
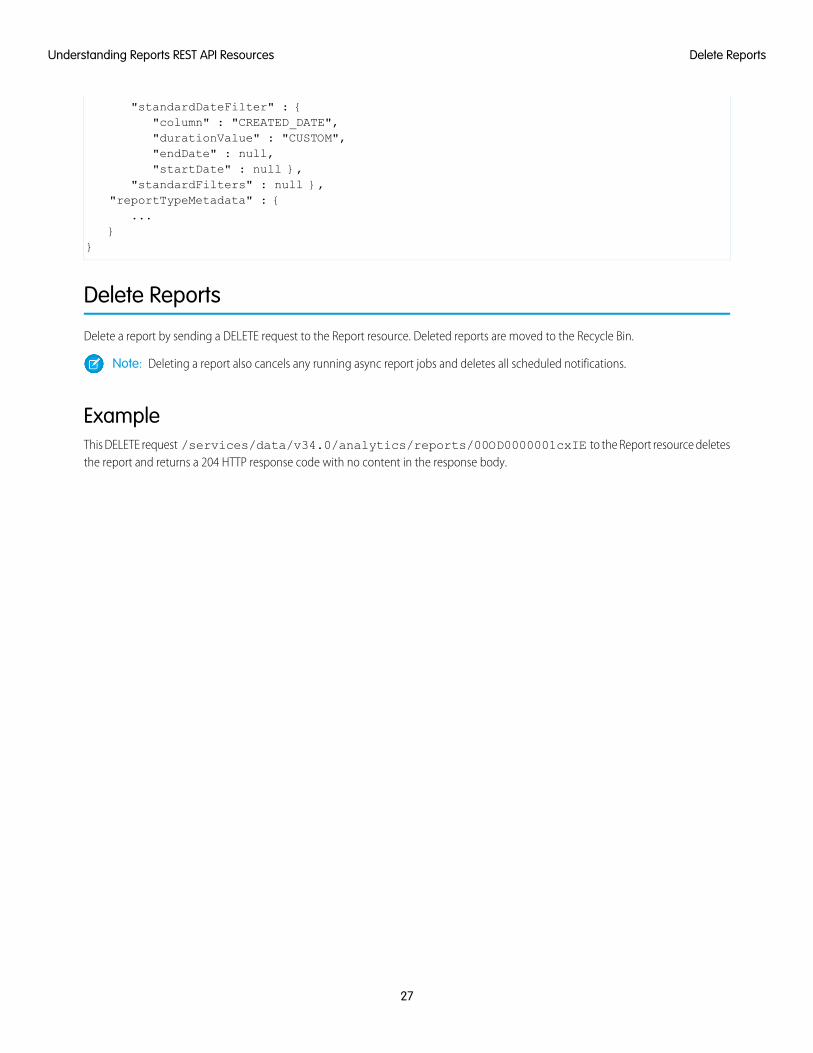
Delete Reports
Delete a report by sending a DELETE request to the Report resource. Deleted reports are moved to the Recycle Bin.
Note: Deleting a report also cancels any running async report jobs and deletes all scheduled notifications.
ExampleThis DELETE request /services/data/v34.0/analytics/reports/00OD0000001cxIE to the Report resource deletesthe report and returns a 204 HTTP response code with no content in the response body.
27
Delete ReportsUnderstanding Reports REST API Resources
CHAPTER 3 Understanding Dashboards REST APIResources
The Dashboards API is designed to let you access and refresh dashboards easily. Use the API to:In this chapter ...• Get List of Recently Used Dashboards
Get a list of dashboards with URLs to access status and results.• Get List of Recently
Used Dashboards
• Get DashboardResults
• Get Dashboard Results
Get dashboard metadata, data, and status.• Filter DashboardResults • Filter Dashboard Results
Filter dashboard results, status, or refresh requests.• Get DashboardStatus
• Get Dashboard Status
Get dashboard refresh status.
• Refresh a Dashboard
• Delete a Dashboard
• Refresh a Dashboard
Trigger a dashboard refresh.
• Delete a Dashboard
Clean up unused and obsolete dashboards.
28
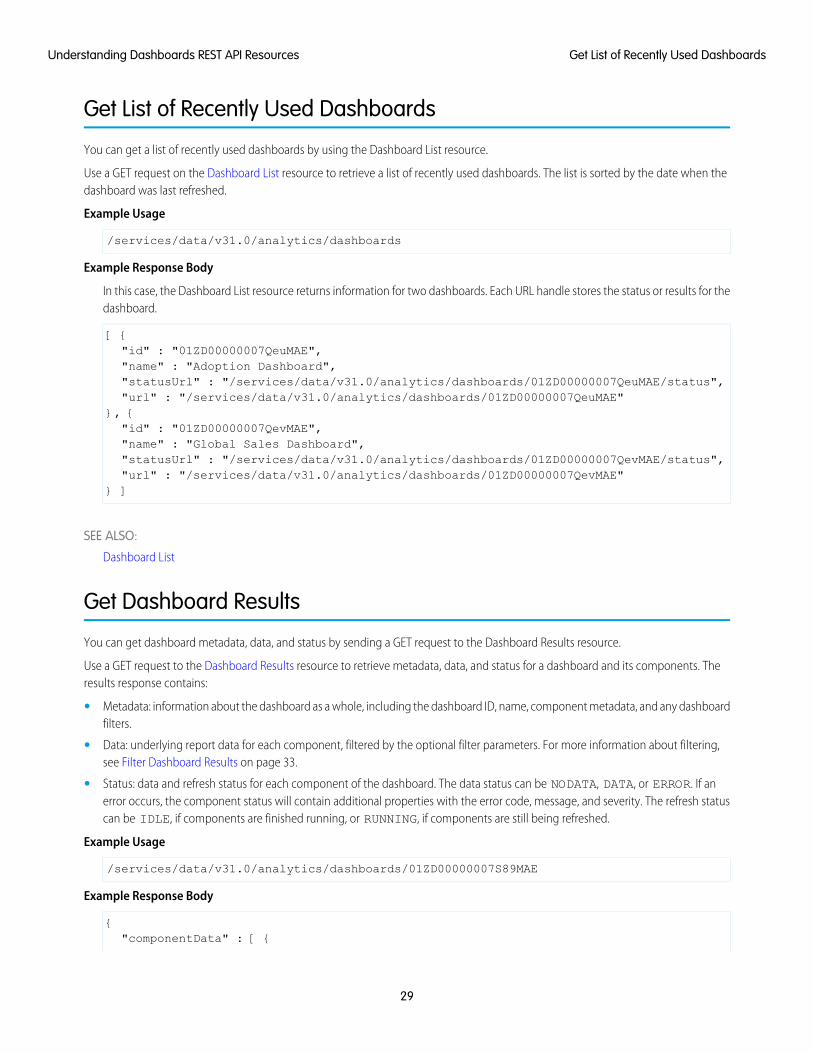
Get List of Recently Used Dashboards
You can get a list of recently used dashboards by using the Dashboard List resource.
Use a GET request on the Dashboard List resource to retrieve a list of recently used dashboards. The list is sorted by the date when thedashboard was last refreshed.
Example Usage
/services/data/v31.0/analytics/dashboards
Example Response Body
In this case, the Dashboard List resource returns information for two dashboards. Each URL handle stores the status or results for thedashboard.
[ {"id" : "01ZD00000007QeuMAE","name" : "Adoption Dashboard","statusUrl" : "/services/data/v31.0/analytics/dashboards/01ZD00000007QeuMAE/status","url" : "/services/data/v31.0/analytics/dashboards/01ZD00000007QeuMAE"
}, {"id" : "01ZD00000007QevMAE","name" : "Global Sales Dashboard","statusUrl" : "/services/data/v31.0/analytics/dashboards/01ZD00000007QevMAE/status","url" : "/services/data/v31.0/analytics/dashboards/01ZD00000007QevMAE"
} ]
SEE ALSO:
Dashboard List
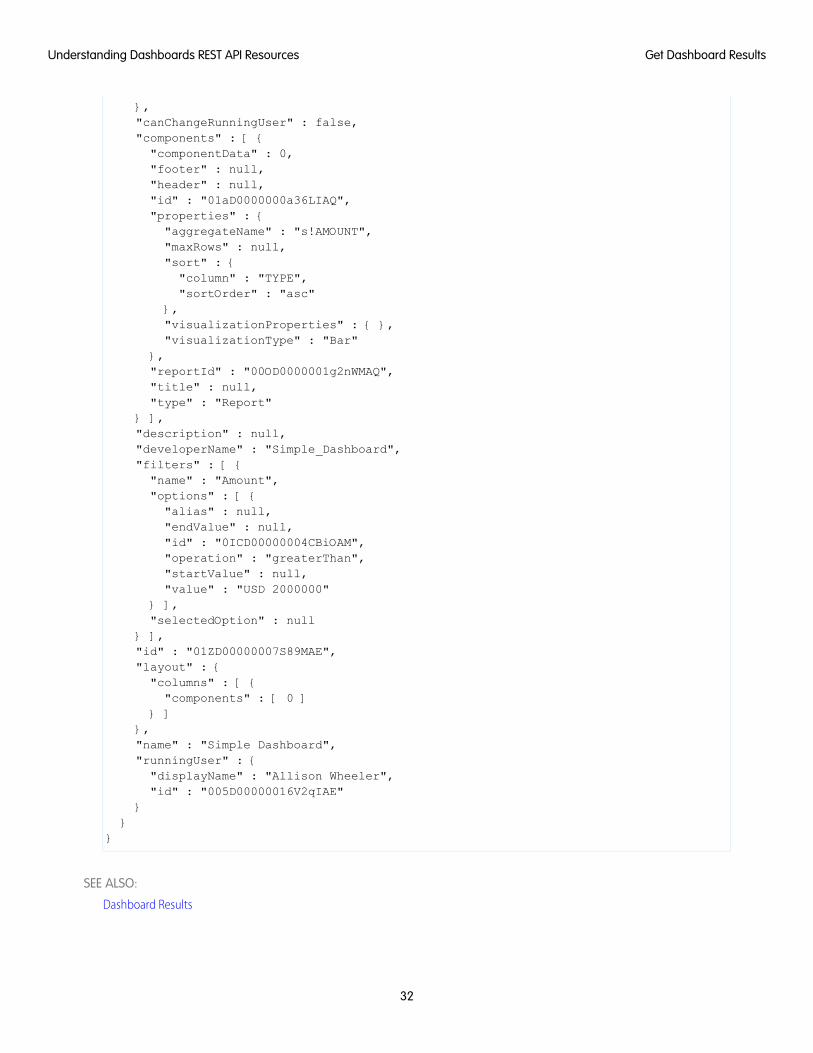
Get Dashboard Results
You can get dashboard metadata, data, and status by sending a GET request to the Dashboard Results resource.
Use a GET request to the Dashboard Results resource to retrieve metadata, data, and status for a dashboard and its components. Theresults response contains:
• Metadata: information about the dashboard as a whole, including the dashboard ID, name, component metadata, and any dashboardfilters.
• Data: underlying report data for each component, filtered by the optional filter parameters. For more information about filtering,see Filter Dashboard Results on page 33.
• Status: data and refresh status for each component of the dashboard. The data status can be NODATA, DATA, or ERROR. If anerror occurs, the component status will contain additional properties with the error code, message, and severity. The refresh statuscan be IDLE, if components are finished running, or RUNNING, if components are still being refreshed.
Example Usage
/services/data/v31.0/analytics/dashboards/01ZD00000007S89MAE
Example Response Body
{"componentData" : [ {
29
Get List of Recently Used DashboardsUnderstanding Dashboards REST API Resources
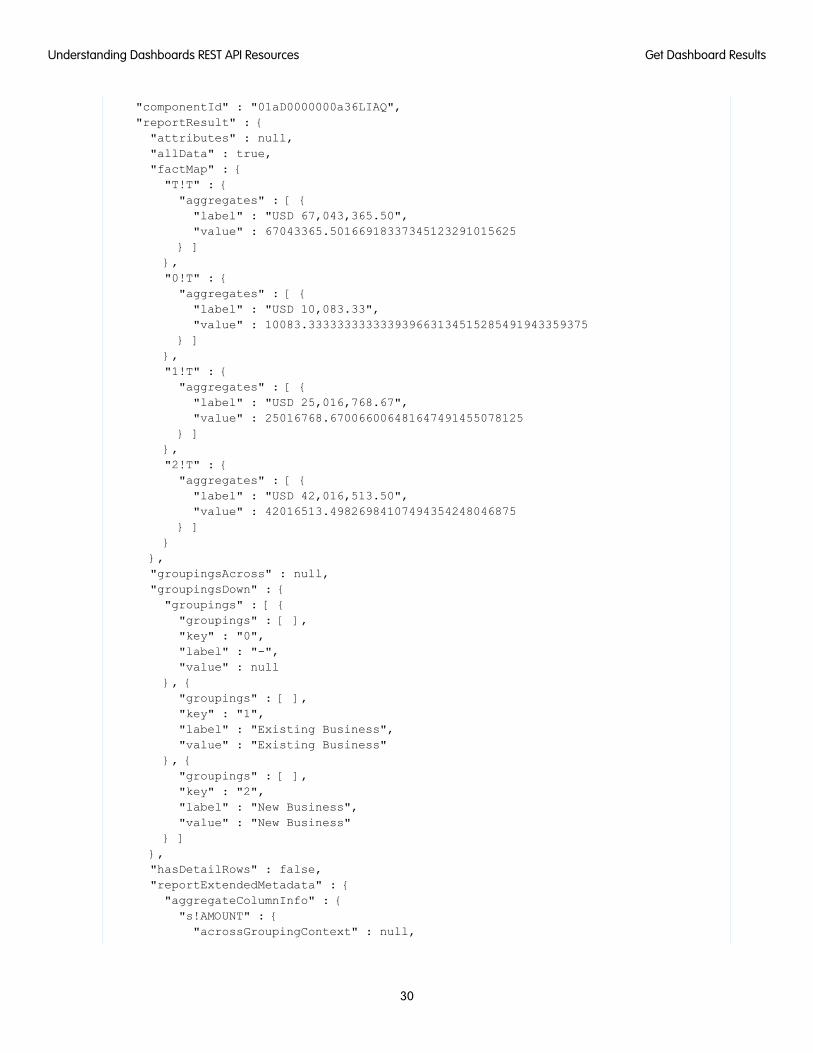
"componentId" : "01aD0000000a36LIAQ","reportResult" : {"attributes" : null,"allData" : true,"factMap" : {"T!T" : {"aggregates" : [ {"label" : "USD 67,043,365.50","value" : 67043365.50166918337345123291015625
} ]},"0!T" : {"aggregates" : [ {"label" : "USD 10,083.33","value" : 10083.333333333333939663134515285491943359375
} ]},"1!T" : {"aggregates" : [ {"label" : "USD 25,016,768.67","value" : 25016768.670066006481647491455078125
} ]},"2!T" : {"aggregates" : [ {"label" : "USD 42,016,513.50","value" : 42016513.49826984107494354248046875
} ]}
},"groupingsAcross" : null,"groupingsDown" : {"groupings" : [ {"groupings" : [ ],"key" : "0","label" : "-","value" : null
}, {"groupings" : [ ],"key" : "1","label" : "Existing Business","value" : "Existing Business"
}, {"groupings" : [ ],"key" : "2","label" : "New Business","value" : "New Business"
} ]},"hasDetailRows" : false,"reportExtendedMetadata" : {"aggregateColumnInfo" : {"s!AMOUNT" : {"acrossGroupingContext" : null,
30
Get Dashboard ResultsUnderstanding Dashboards REST API Resources
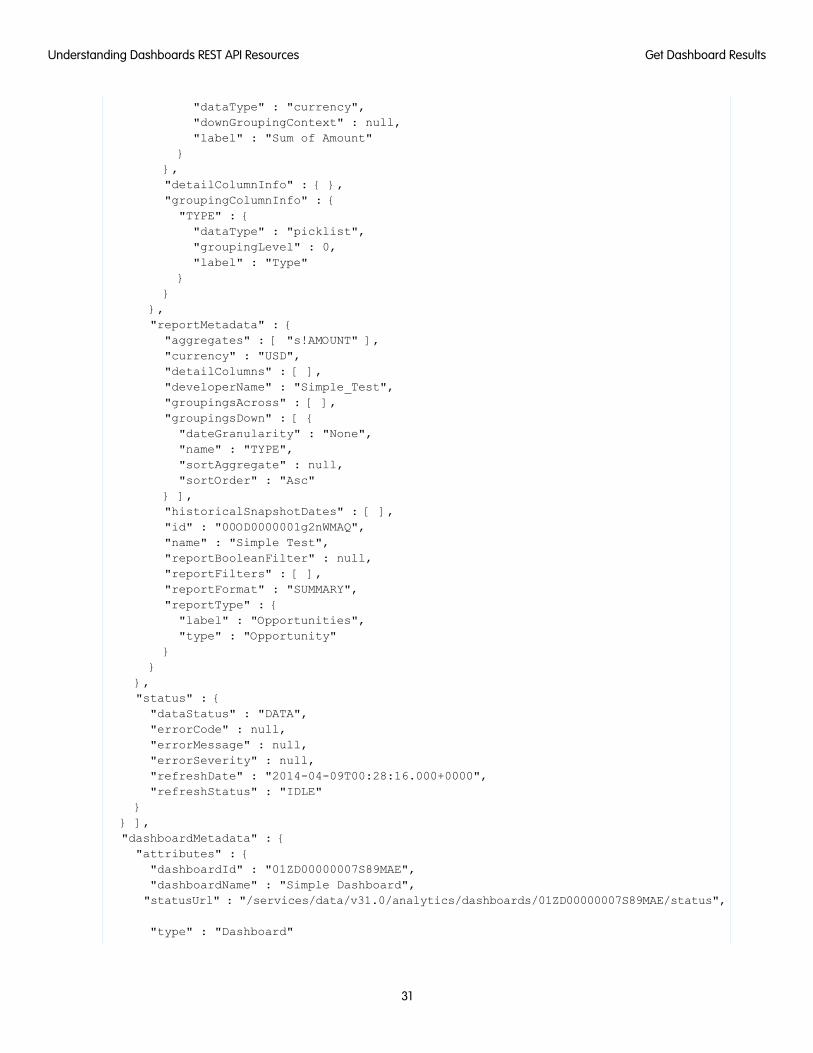
"dataType" : "currency","downGroupingContext" : null,"label" : "Sum of Amount"
}},"detailColumnInfo" : { },"groupingColumnInfo" : {"TYPE" : {"dataType" : "picklist","groupingLevel" : 0,"label" : "Type"
}}
},"reportMetadata" : {"aggregates" : [ "s!AMOUNT" ],"currency" : "USD","detailColumns" : [ ],"developerName" : "Simple_Test","groupingsAcross" : [ ],"groupingsDown" : [ {"dateGranularity" : "None","name" : "TYPE","sortAggregate" : null,"sortOrder" : "Asc"
} ],"historicalSnapshotDates" : [ ],"id" : "00OD0000001g2nWMAQ","name" : "Simple Test","reportBooleanFilter" : null,"reportFilters" : [ ],"reportFormat" : "SUMMARY","reportType" : {"label" : "Opportunities","type" : "Opportunity"
}}
},"status" : {"dataStatus" : "DATA","errorCode" : null,"errorMessage" : null,"errorSeverity" : null,"refreshDate" : "2014-04-09T00:28:16.000+0000","refreshStatus" : "IDLE"
}} ],"dashboardMetadata" : {"attributes" : {"dashboardId" : "01ZD00000007S89MAE","dashboardName" : "Simple Dashboard","statusUrl" : "/services/data/v31.0/analytics/dashboards/01ZD00000007S89MAE/status",
"type" : "Dashboard"
31
Get Dashboard ResultsUnderstanding Dashboards REST API Resources
},"canChangeRunningUser" : false,"components" : [ {"componentData" : 0,"footer" : null,"header" : null,"id" : "01aD0000000a36LIAQ","properties" : {"aggregateName" : "s!AMOUNT","maxRows" : null,"sort" : {"column" : "TYPE","sortOrder" : "asc"
},"visualizationProperties" : { },"visualizationType" : "Bar"
},"reportId" : "00OD0000001g2nWMAQ","title" : null,"type" : "Report"
} ],"description" : null,"developerName" : "Simple_Dashboard","filters" : [ {"name" : "Amount","options" : [ {"alias" : null,"endValue" : null,"id" : "0ICD00000004CBiOAM","operation" : "greaterThan","startValue" : null,"value" : "USD 2000000"
} ],"selectedOption" : null
} ],"id" : "01ZD00000007S89MAE","layout" : {"columns" : [ {"components" : [ 0 ]
} ]},"name" : "Simple Dashboard","runningUser" : {"displayName" : "Allison Wheeler","id" : "005D00000016V2qIAE"
}}
}
SEE ALSO:
Dashboard Results
32
Get Dashboard ResultsUnderstanding Dashboards REST API Resources
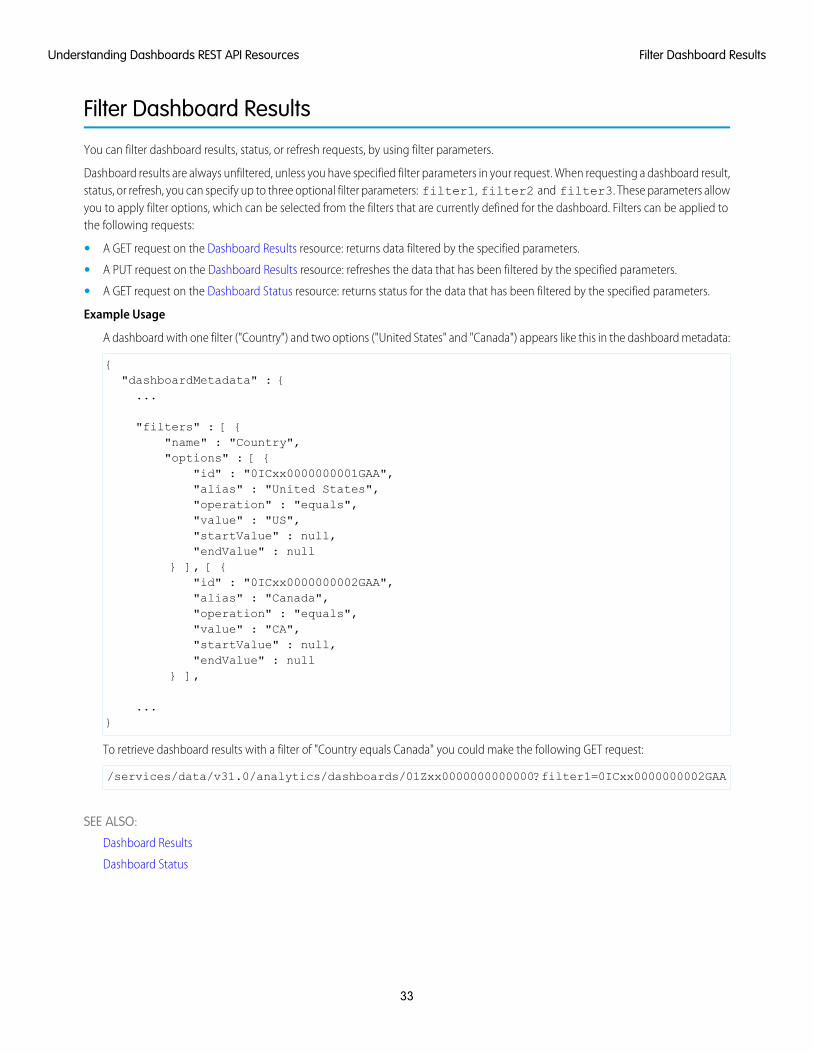
Filter Dashboard Results
You can filter dashboard results, status, or refresh requests, by using filter parameters.
Dashboard results are always unfiltered, unless you have specified filter parameters in your request. When requesting a dashboard result,status, or refresh, you can specify up to three optional filter parameters: filter1, filter2 and filter3. These parameters allowyou to apply filter options, which can be selected from the filters that are currently defined for the dashboard. Filters can be applied tothe following requests:
• A GET request on the Dashboard Results resource: returns data filtered by the specified parameters.
• A PUT request on the Dashboard Results resource: refreshes the data that has been filtered by the specified parameters.
• A GET request on the Dashboard Status resource: returns status for the data that has been filtered by the specified parameters.
Example Usage
A dashboard with one filter ("Country") and two options ("United States" and "Canada") appears like this in the dashboard metadata:
{"dashboardMetadata" : {...
"filters" : [ {"name" : "Country","options" : [ {
"id" : "0ICxx0000000001GAA","alias" : "United States","operation" : "equals","value" : "US","startValue" : null,"endValue" : null
} ], [ {"id" : "0ICxx0000000002GAA","alias" : "Canada","operation" : "equals","value" : "CA","startValue" : null,"endValue" : null
} ],
...}
To retrieve dashboard results with a filter of "Country equals Canada" you could make the following GET request:
/services/data/v31.0/analytics/dashboards/01Zxx0000000000000?filter1=0ICxx0000000002GAA
SEE ALSO:
Dashboard Results
Dashboard Status
33
Filter Dashboard ResultsUnderstanding Dashboards REST API Resources
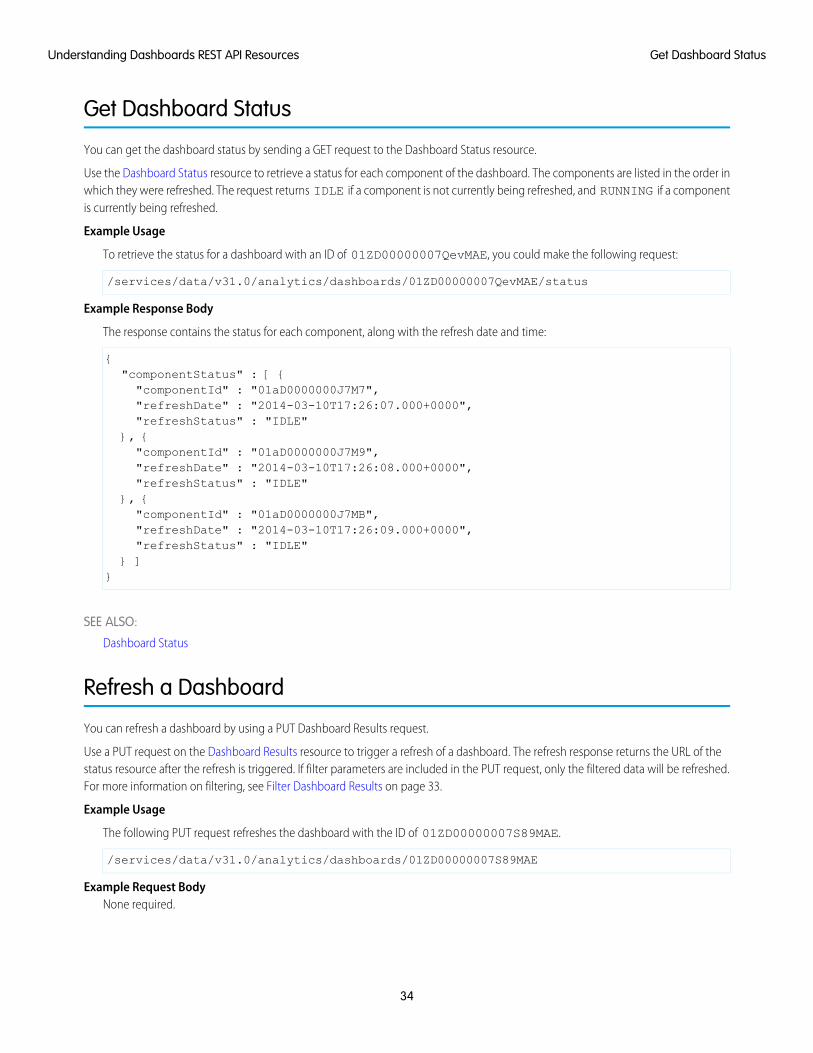
Get Dashboard Status
You can get the dashboard status by sending a GET request to the Dashboard Status resource.
Use the Dashboard Status resource to retrieve a status for each component of the dashboard. The components are listed in the order inwhich they were refreshed. The request returns IDLE if a component is not currently being refreshed, and RUNNING if a componentis currently being refreshed.
Example Usage
To retrieve the status for a dashboard with an ID of 01ZD00000007QevMAE, you could make the following request:
/services/data/v31.0/analytics/dashboards/01ZD00000007QevMAE/status
Example Response Body
The response contains the status for each component, along with the refresh date and time:
{"componentStatus" : [ {"componentId" : "01aD0000000J7M7","refreshDate" : "2014-03-10T17:26:07.000+0000","refreshStatus" : "IDLE"
}, {"componentId" : "01aD0000000J7M9","refreshDate" : "2014-03-10T17:26:08.000+0000","refreshStatus" : "IDLE"
}, {"componentId" : "01aD0000000J7MB","refreshDate" : "2014-03-10T17:26:09.000+0000","refreshStatus" : "IDLE"
} ]}
SEE ALSO:
Dashboard Status
Refresh a Dashboard
You can refresh a dashboard by using a PUT Dashboard Results request.
Use a PUT request on the Dashboard Results resource to trigger a refresh of a dashboard. The refresh response returns the URL of thestatus resource after the refresh is triggered. If filter parameters are included in the PUT request, only the filtered data will be refreshed.For more information on filtering, see Filter Dashboard Results on page 33.
Example Usage
The following PUT request refreshes the dashboard with the ID of 01ZD00000007S89MAE.
/services/data/v31.0/analytics/dashboards/01ZD00000007S89MAE
Example Request BodyNone required.
34
Get Dashboard StatusUnderstanding Dashboards REST API Resources
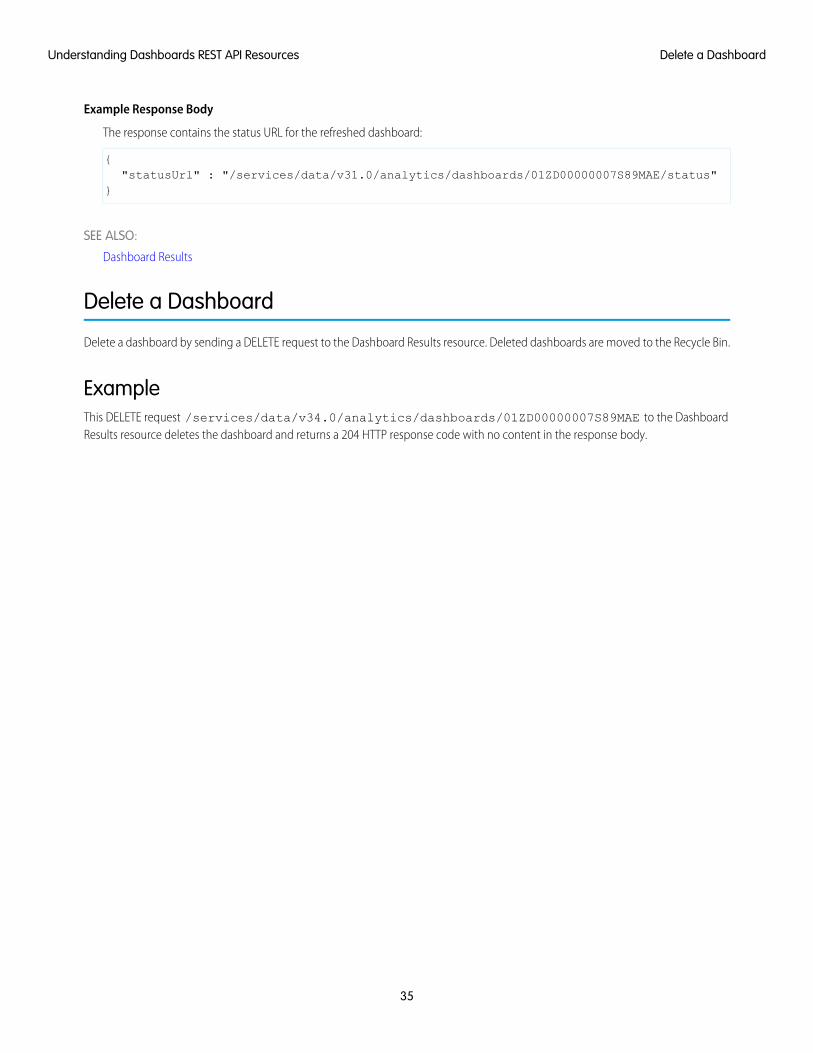
Example Response Body
The response contains the status URL for the refreshed dashboard:
{"statusUrl" : "/services/data/v31.0/analytics/dashboards/01ZD00000007S89MAE/status"
}
SEE ALSO:
Dashboard Results
Delete a Dashboard
Delete a dashboard by sending a DELETE request to the Dashboard Results resource. Deleted dashboards are moved to the Recycle Bin.
ExampleThis DELETE request /services/data/v34.0/analytics/dashboards/01ZD00000007S89MAE to the DashboardResults resource deletes the dashboard and returns a 204 HTTP response code with no content in the response body.
35
Delete a DashboardUnderstanding Dashboards REST API Resources
CHAPTER 4 Reports API Resource Reference
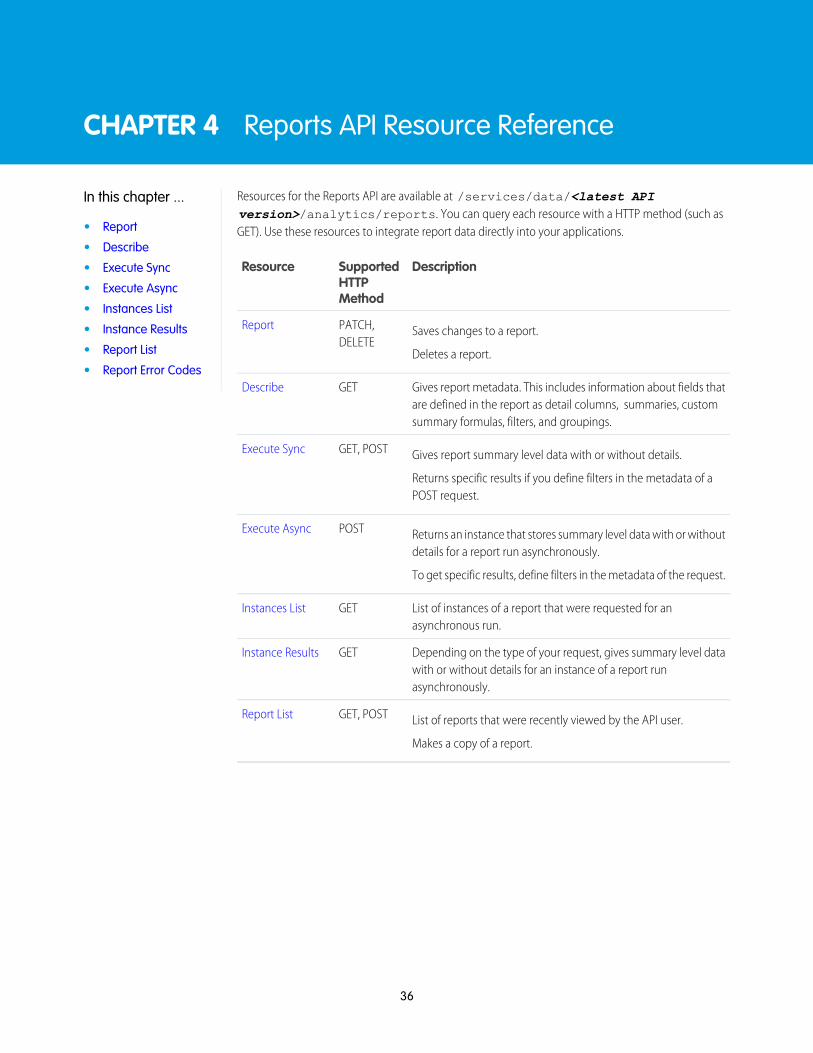
Resources for the Reports API are available at /services/data/<latest APIversion>/analytics/reports. You can query each resource with a HTTP method (such asGET). Use these resources to integrate report data directly into your applications.
In this chapter ...
• Report
• Describe
DescriptionSupportedHTTPMethod
Resource• Execute Sync
• Execute Async
• Instances List
Saves changes to a report.PATCH,DELETE
Report• Instance Results
Deletes a report.• Report List
• Report Error CodesGives report metadata. This includes information about fields thatare defined in the report as detail columns, summaries, customsummary formulas, filters, and groupings.
GETDescribe
Gives report summary level data with or without details.GET, POSTExecute Sync
Returns specific results if you define filters in the metadata of aPOST request.
Returns an instance that stores summary level data with or withoutdetails for a report run asynchronously.
POSTExecute Async
To get specific results, define filters in the metadata of the request.
List of instances of a report that were requested for anasynchronous run.
GETInstances List
Depending on the type of your request, gives summary level datawith or without details for an instance of a report runasynchronously.
GETInstance Results
List of reports that were recently viewed by the API user.GET, POSTReport List
Makes a copy of a report.
36
Report
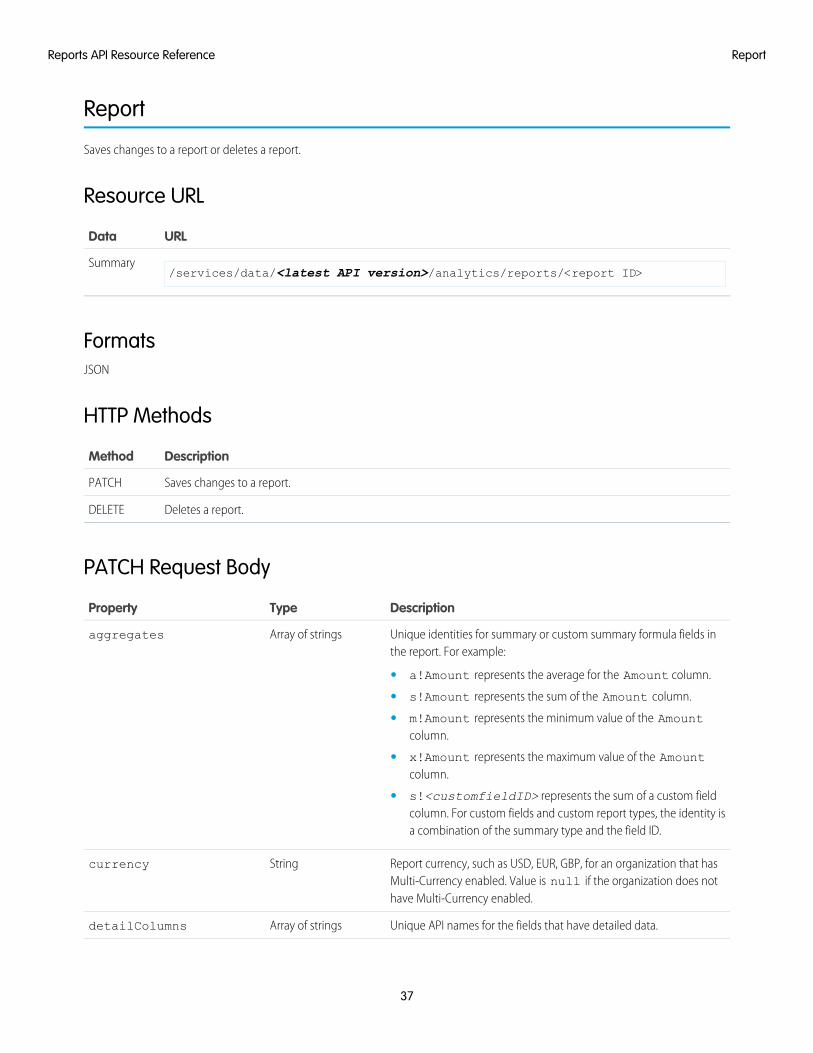
Saves changes to a report or deletes a report.
Resource URL
URLData
/services/data/<latest API version>/analytics/reports/<report ID>Summary
FormatsJSON
HTTP Methods
DescriptionMethod
Saves changes to a report.PATCH
Deletes a report.DELETE
PATCH Request Body
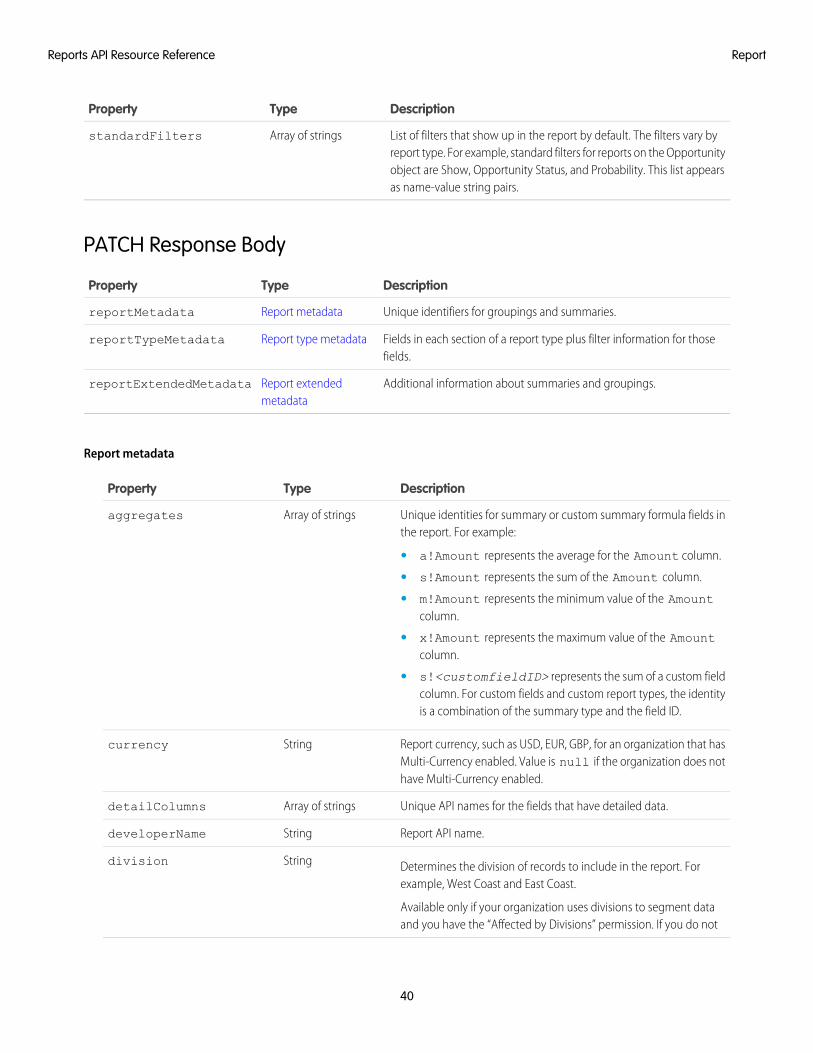
DescriptionTypeProperty
Unique identities for summary or custom summary formula fields inthe report. For example:
Array of stringsaggregates
• a!Amount represents the average for the Amount column.
• s!Amount represents the sum of the Amount column.
• m!Amount represents the minimum value of the Amountcolumn.
• x!Amount represents the maximum value of the Amountcolumn.
• s!<customfieldID> represents the sum of a custom fieldcolumn. For custom fields and custom report types, the identity isa combination of the summary type and the field ID.
Report currency, such as USD, EUR, GBP, for an organization that hasMulti-Currency enabled. Value is null if the organization does nothave Multi-Currency enabled.
Stringcurrency
Unique API names for the fields that have detailed data.Array of stringsdetailColumns
37
ReportReports API Resource Reference
DescriptionTypeProperty
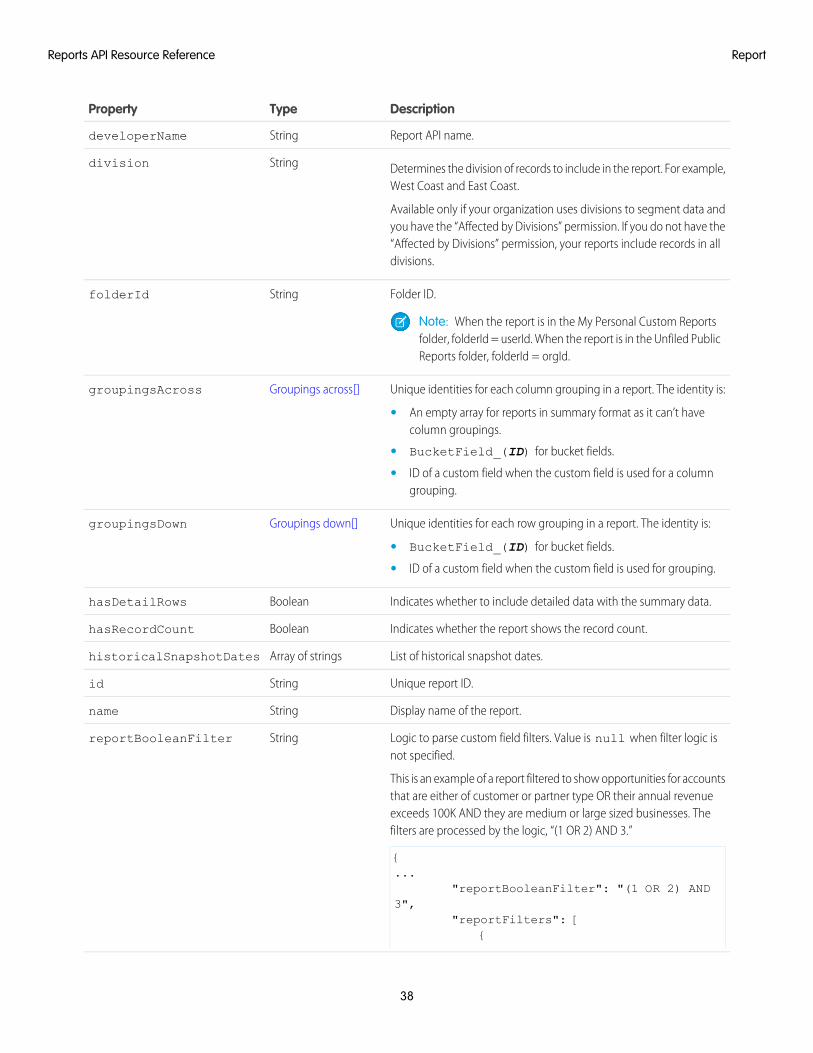
Report API name.StringdeveloperName
Determines the division of records to include in the report. For example,West Coast and East Coast.
Stringdivision
Available only if your organization uses divisions to segment data andyou have the “Affected by Divisions” permission. If you do not have the“Affected by Divisions” permission, your reports include records in alldivisions.
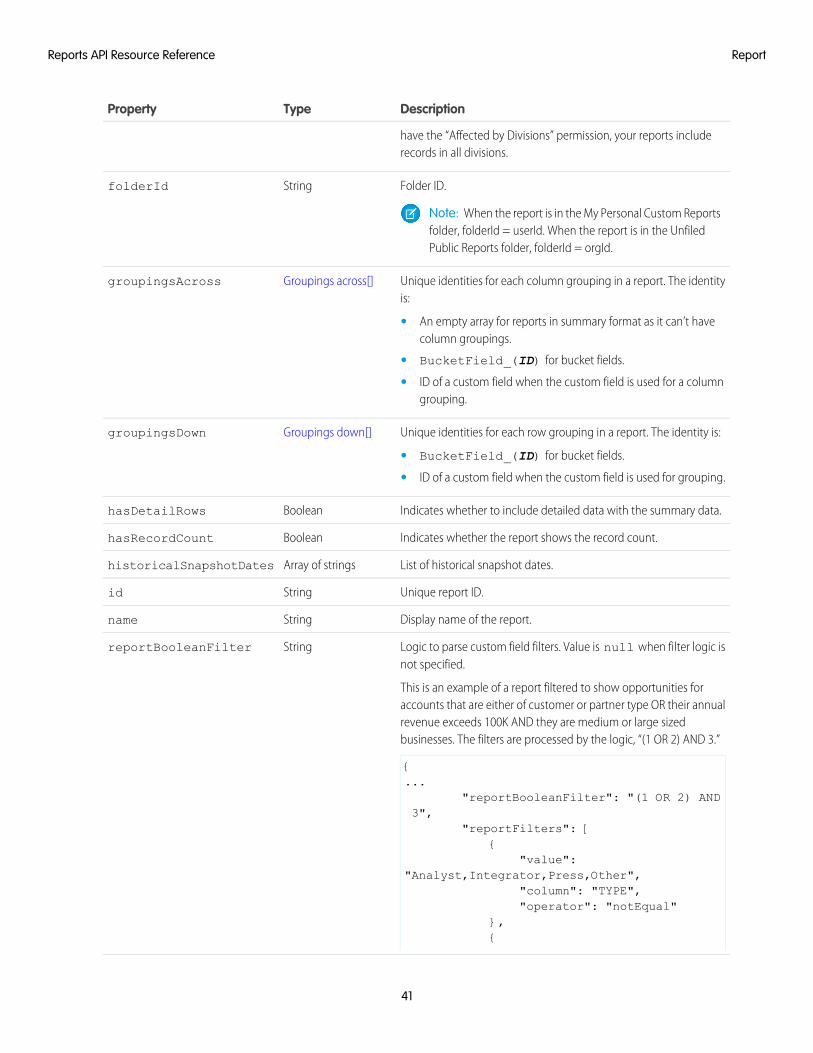
Folder ID.StringfolderId
Note: When the report is in the My Personal Custom Reportsfolder, folderId = userId. When the report is in the Unfiled PublicReports folder, folderId = orgId.
Unique identities for each column grouping in a report. The identity is:Groupings across[]groupingsAcross
• An empty array for reports in summary format as it can’t havecolumn groupings.
• BucketField_(ID) for bucket fields.
• ID of a custom field when the custom field is used for a columngrouping.
Unique identities for each row grouping in a report. The identity is:Groupings down[]groupingsDown
• BucketField_(ID) for bucket fields.
• ID of a custom field when the custom field is used for grouping.
Indicates whether to include detailed data with the summary data.BooleanhasDetailRows
Indicates whether the report shows the record count.BooleanhasRecordCount
List of historical snapshot dates.Array of stringshistoricalSnapshotDates
Unique report ID.Stringid
Display name of the report.Stringname
Logic to parse custom field filters. Value is null when filter logic isnot specified.
This is an example of a report filtered to show opportunities for accountsthat are either of customer or partner type OR their annual revenue
StringreportBooleanFilter
exceeds 100K AND they are medium or large sized businesses. Thefilters are processed by the logic, “(1 OR 2) AND 3.”
{...
"reportBooleanFilter": "(1 OR 2) AND3",
"reportFilters": [{
38
ReportReports API Resource Reference
DescriptionTypeProperty
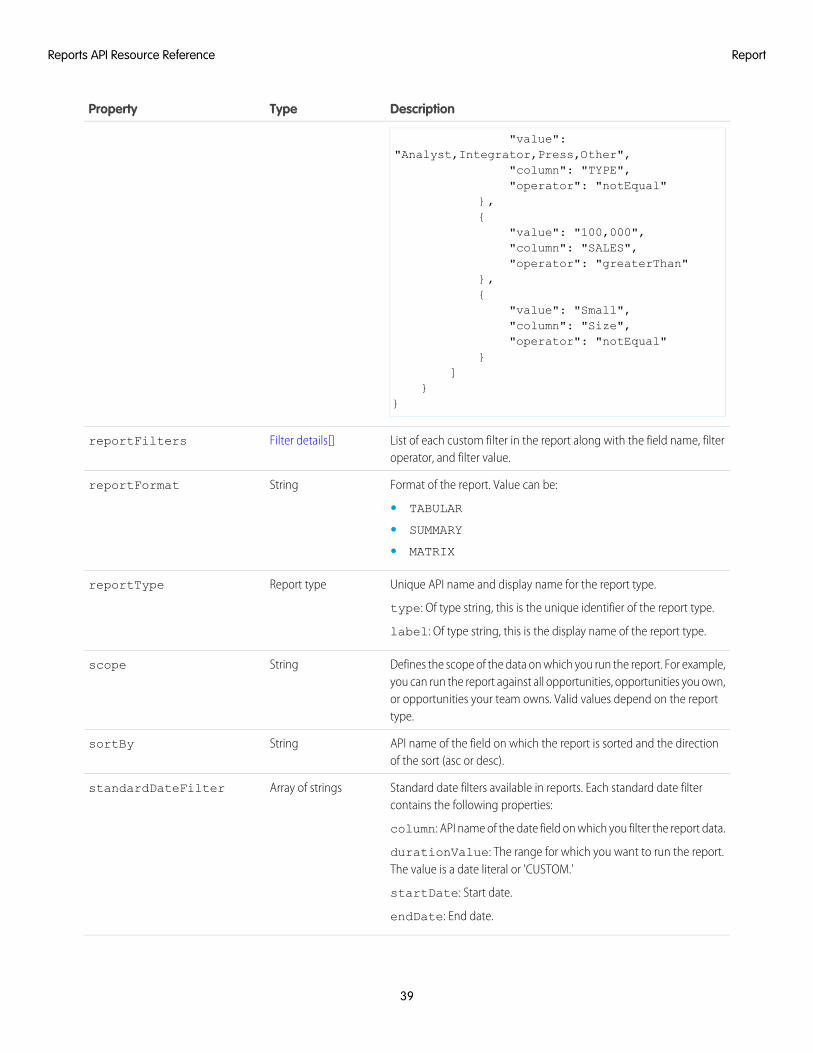
"value":"Analyst,Integrator,Press,Other",
"column": "TYPE","operator": "notEqual"
},{
"value": "100,000","column": "SALES","operator": "greaterThan"
},{
"value": "Small","column": "Size","operator": "notEqual"
}]
}}
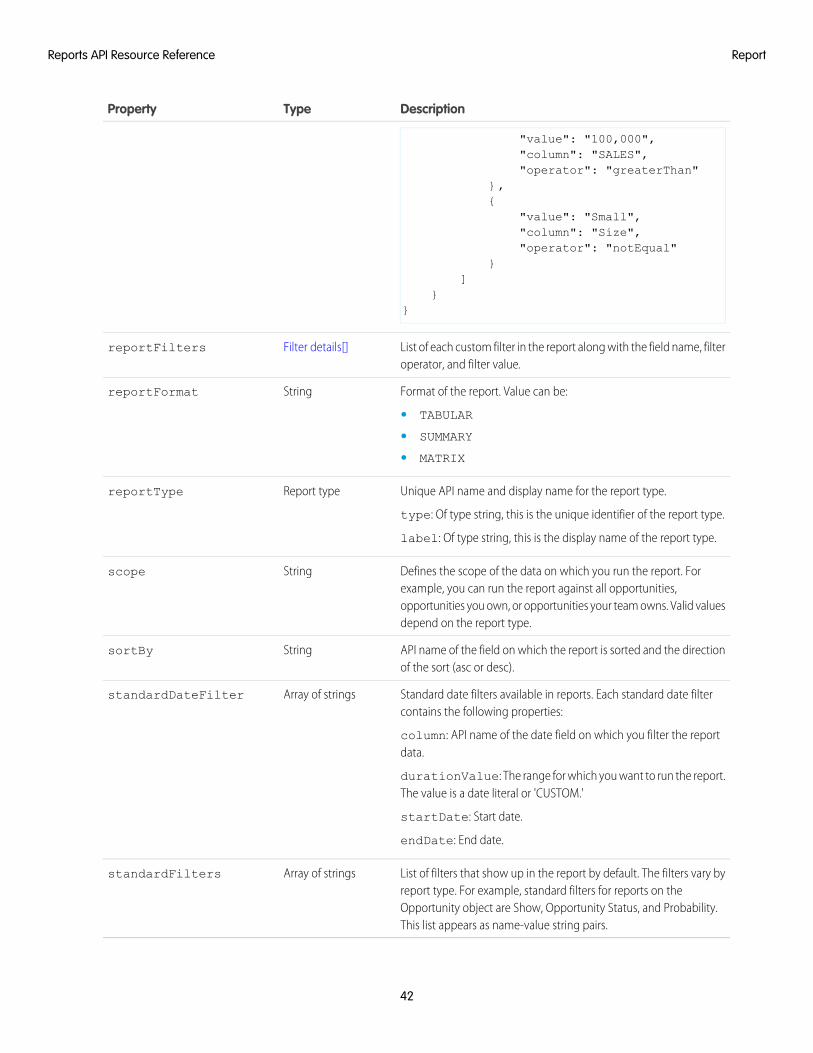
List of each custom filter in the report along with the field name, filteroperator, and filter value.
Filter details[]reportFilters
Format of the report. Value can be:StringreportFormat
• TABULAR
• SUMMARY
• MATRIX
Unique API name and display name for the report type.
type: Of type string, this is the unique identifier of the report type.
Report typereportType
label: Of type string, this is the display name of the report type.
Defines the scope of the data on which you run the report. For example,you can run the report against all opportunities, opportunities you own,
Stringscope
or opportunities your team owns. Valid values depend on the reporttype.
API name of the field on which the report is sorted and the directionof the sort (asc or desc).
StringsortBy
Standard date filters available in reports. Each standard date filtercontains the following properties:
column: API name of the date field on which you filter the report data.
Array of stringsstandardDateFilter
durationValue: The range for which you want to run the report.The value is a date literal or 'CUSTOM.'
startDate: Start date.
endDate: End date.
39
ReportReports API Resource Reference
DescriptionTypeProperty
List of filters that show up in the report by default. The filters vary byreport type. For example, standard filters for reports on the Opportunity
Array of stringsstandardFilters
object are Show, Opportunity Status, and Probability. This list appearsas name-value string pairs.
PATCH Response Body
DescriptionTypeProperty
Unique identifiers for groupings and summaries.Report metadatareportMetadata
Fields in each section of a report type plus filter information for thosefields.
Report type metadatareportTypeMetadata
Additional information about summaries and groupings.Report extendedmetadata
reportExtendedMetadata
Report metadata
DescriptionTypeProperty
Unique identities for summary or custom summary formula fields inthe report. For example:
Array of stringsaggregates
• a!Amount represents the average for the Amount column.
• s!Amount represents the sum of the Amount column.
• m!Amount represents the minimum value of the Amountcolumn.
• x!Amount represents the maximum value of the Amountcolumn.
• s!<customfieldID> represents the sum of a custom fieldcolumn. For custom fields and custom report types, the identityis a combination of the summary type and the field ID.
Report currency, such as USD, EUR, GBP, for an organization that hasMulti-Currency enabled. Value is null if the organization does nothave Multi-Currency enabled.
Stringcurrency
Unique API names for the fields that have detailed data.Array of stringsdetailColumns
Report API name.StringdeveloperName
Determines the division of records to include in the report. Forexample, West Coast and East Coast.
Stringdivision
Available only if your organization uses divisions to segment dataand you have the “Affected by Divisions” permission. If you do not
40
ReportReports API Resource Reference
DescriptionTypeProperty
have the “Affected by Divisions” permission, your reports includerecords in all divisions.
Folder ID.StringfolderId
Note: When the report is in the My Personal Custom Reportsfolder, folderId = userId. When the report is in the UnfiledPublic Reports folder, folderId = orgId.
Unique identities for each column grouping in a report. The identityis:
Groupings across[]groupingsAcross
• An empty array for reports in summary format as it can’t havecolumn groupings.
• BucketField_(ID) for bucket fields.
• ID of a custom field when the custom field is used for a columngrouping.
Unique identities for each row grouping in a report. The identity is:Groupings down[]groupingsDown
• BucketField_(ID) for bucket fields.
• ID of a custom field when the custom field is used for grouping.
Indicates whether to include detailed data with the summary data.BooleanhasDetailRows
Indicates whether the report shows the record count.BooleanhasRecordCount
List of historical snapshot dates.Array of stringshistoricalSnapshotDates
Unique report ID.Stringid
Display name of the report.Stringname
Logic to parse custom field filters. Value is null when filter logic isnot specified.
This is an example of a report filtered to show opportunities foraccounts that are either of customer or partner type OR their annual
StringreportBooleanFilter
revenue exceeds 100K AND they are medium or large sizedbusinesses. The filters are processed by the logic, “(1 OR 2) AND 3.”
{...
"reportBooleanFilter": "(1 OR 2) AND3",
"reportFilters": [{
"value":"Analyst,Integrator,Press,Other",
"column": "TYPE","operator": "notEqual"
},{
41
ReportReports API Resource Reference
DescriptionTypeProperty
"value": "100,000","column": "SALES","operator": "greaterThan"
},{
"value": "Small","column": "Size","operator": "notEqual"
}]
}}
List of each custom filter in the report along with the field name, filteroperator, and filter value.
Filter details[]reportFilters
Format of the report. Value can be:StringreportFormat
• TABULAR
• SUMMARY
• MATRIX
Unique API name and display name for the report type.
type: Of type string, this is the unique identifier of the report type.
Report typereportType
label: Of type string, this is the display name of the report type.
Defines the scope of the data on which you run the report. Forexample, you can run the report against all opportunities,
Stringscope
opportunities you own, or opportunities your team owns. Valid valuesdepend on the report type.
API name of the field on which the report is sorted and the directionof the sort (asc or desc).
StringsortBy
Standard date filters available in reports. Each standard date filtercontains the following properties:
column: API name of the date field on which you filter the reportdata.
Array of stringsstandardDateFilter
durationValue: The range for which you want to run the report.The value is a date literal or 'CUSTOM.'
startDate: Start date.
endDate: End date.
List of filters that show up in the report by default. The filters vary byreport type. For example, standard filters for reports on the
Array of stringsstandardFilters
Opportunity object are Show, Opportunity Status, and Probability.This list appears as name-value string pairs.
42
ReportReports API Resource Reference
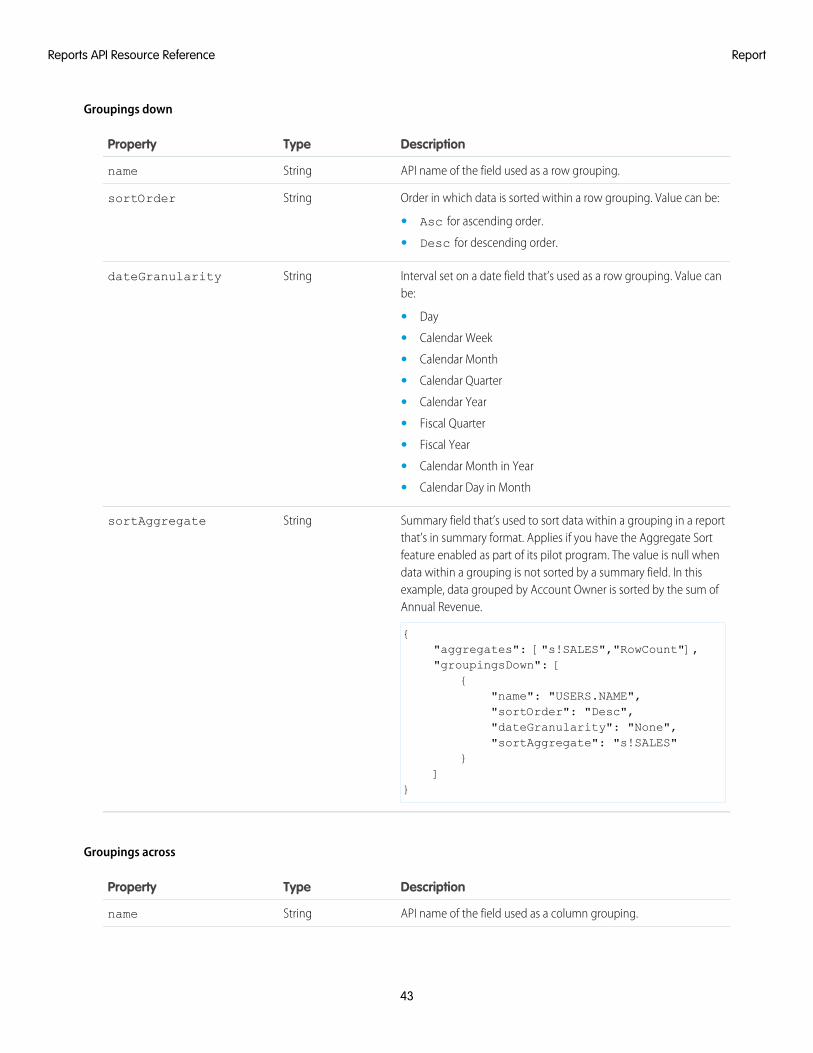
Groupings down
DescriptionTypeProperty
API name of the field used as a row grouping.Stringname
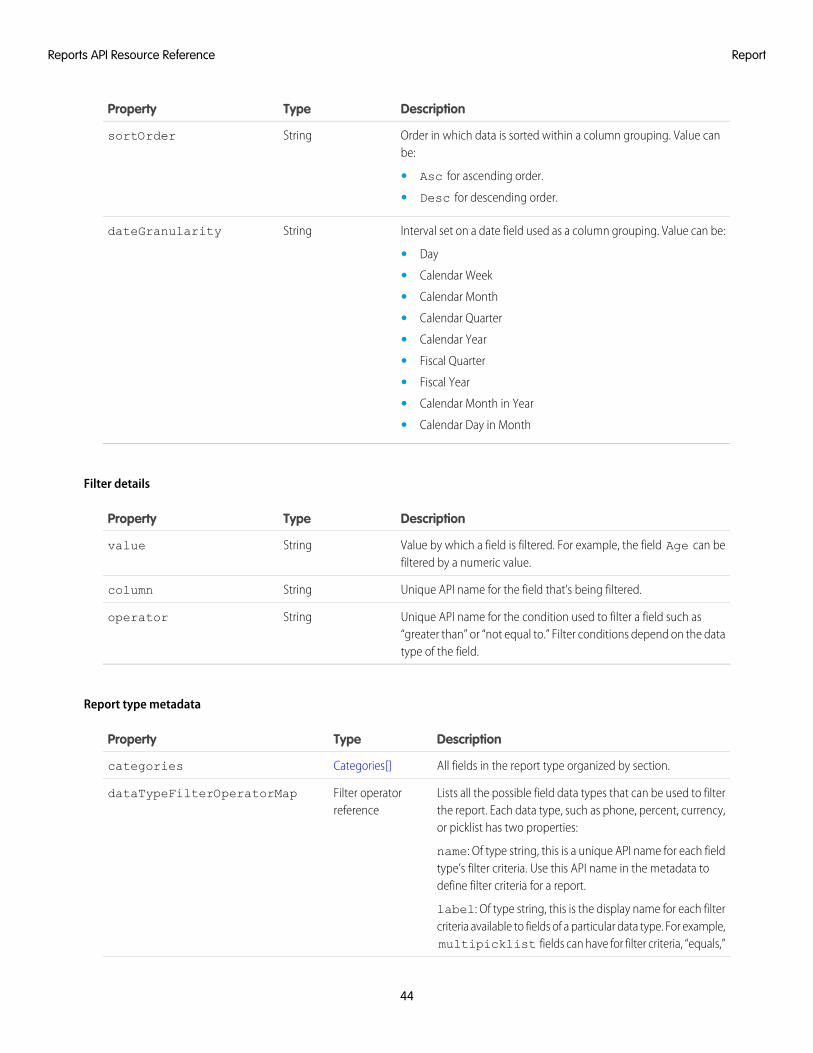
Order in which data is sorted within a row grouping. Value can be:StringsortOrder
• Asc for ascending order.
• Desc for descending order.
Interval set on a date field that’s used as a row grouping. Value canbe:
StringdateGranularity
• Day
• Calendar Week
• Calendar Month
• Calendar Quarter
• Calendar Year
• Fiscal Quarter
• Fiscal Year
• Calendar Month in Year
• Calendar Day in Month
Summary field that’s used to sort data within a grouping in a reportthat’s in summary format. Applies if you have the Aggregate Sort
StringsortAggregate
feature enabled as part of its pilot program. The value is null whendata within a grouping is not sorted by a summary field. In thisexample, data grouped by Account Owner is sorted by the sum ofAnnual Revenue.
{"aggregates": ["s!SALES","RowCount"],"groupingsDown": [
{"name": "USERS.NAME","sortOrder": "Desc","dateGranularity": "None","sortAggregate": "s!SALES"
}]
}
Groupings across
DescriptionTypeProperty
API name of the field used as a column grouping.Stringname
43
ReportReports API Resource Reference
DescriptionTypeProperty
Order in which data is sorted within a column grouping. Value canbe:
StringsortOrder
• Asc for ascending order.
• Desc for descending order.
Interval set on a date field used as a column grouping. Value can be:StringdateGranularity
• Day
• Calendar Week
• Calendar Month
• Calendar Quarter
• Calendar Year
• Fiscal Quarter
• Fiscal Year
• Calendar Month in Year
• Calendar Day in Month
Filter details
DescriptionTypeProperty
Value by which a field is filtered. For example, the field Age can befiltered by a numeric value.
Stringvalue
Unique API name for the field that’s being filtered.Stringcolumn
Unique API name for the condition used to filter a field such as“greater than” or “not equal to.” Filter conditions depend on the datatype of the field.
Stringoperator
Report type metadata
DescriptionTypeProperty
All fields in the report type organized by section.Categories[]categories
Lists all the possible field data types that can be used to filterthe report. Each data type, such as phone, percent, currency,or picklist has two properties:
name: Of type string, this is a unique API name for each fieldtype’s filter criteria. Use this API name in the metadata todefine filter criteria for a report.
Filter operatorreference
dataTypeFilterOperatorMap
label: Of type string, this is the display name for each filtercriteria available to fields of a particular data type. For example,multipicklist fields can have for filter criteria, “equals,”
44
ReportReports API Resource Reference
DescriptionTypeProperty
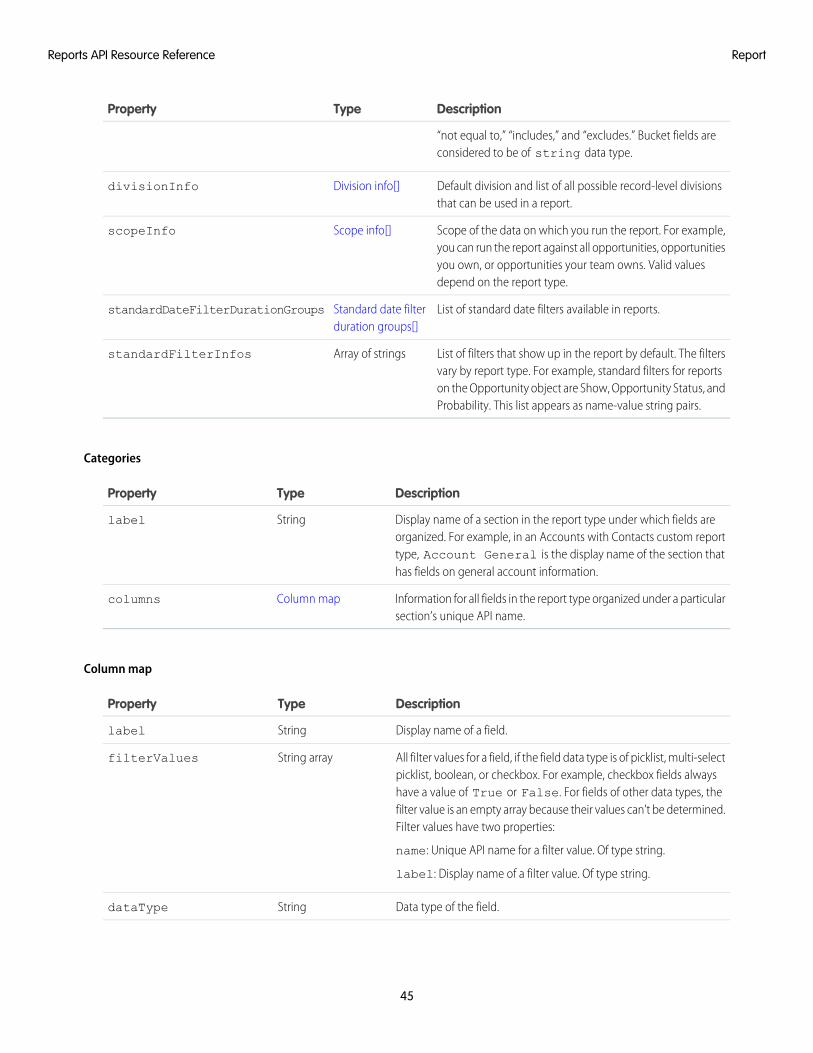
“not equal to,” “includes,” and “excludes.” Bucket fields areconsidered to be of string data type.
Default division and list of all possible record-level divisionsthat can be used in a report.
Division info[]divisionInfo
Scope of the data on which you run the report. For example,you can run the report against all opportunities, opportunities
Scope info[]scopeInfo
you own, or opportunities your team owns. Valid valuesdepend on the report type.
List of standard date filters available in reports.Standard date filterduration groups[]
standardDateFilterDurationGroups
List of filters that show up in the report by default. The filtersvary by report type. For example, standard filters for reports
Array of stringsstandardFilterInfos
on the Opportunity object are Show, Opportunity Status, andProbability. This list appears as name-value string pairs.
Categories
DescriptionTypeProperty
Display name of a section in the report type under which fields areorganized. For example, in an Accounts with Contacts custom report
Stringlabel
type, Account General is the display name of the section thathas fields on general account information.
Information for all fields in the report type organized under a particularsection’s unique API name.
Column mapcolumns
Column map
DescriptionTypeProperty
Display name of a field.Stringlabel
All filter values for a field, if the field data type is of picklist, multi-selectpicklist, boolean, or checkbox. For example, checkbox fields always
String arrayfilterValues
have a value of True or False. For fields of other data types, thefilter value is an empty array because their values can’t be determined.Filter values have two properties:
name: Unique API name for a filter value. Of type string.
label: Display name of a filter value. Of type string.
Data type of the field.StringdataType
45
ReportReports API Resource Reference
DescriptionTypeProperty
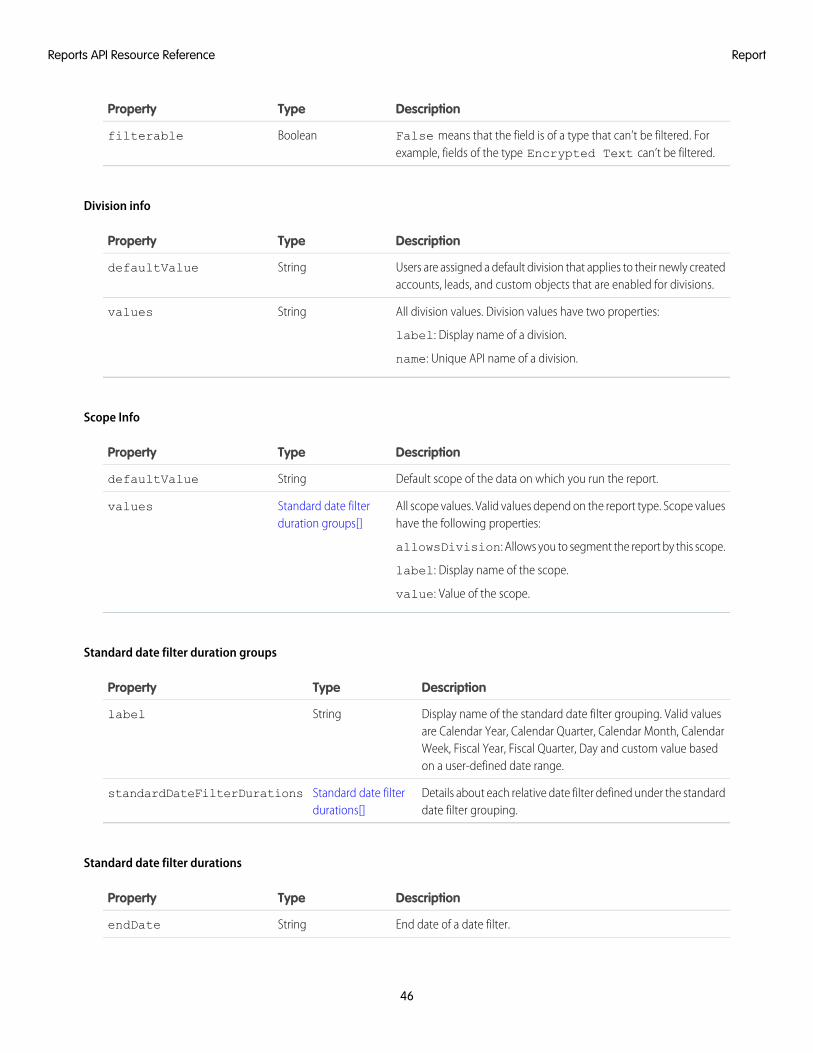
False means that the field is of a type that can’t be filtered. Forexample, fields of the type Encrypted Text can’t be filtered.
Booleanfilterable
Division info
DescriptionTypeProperty
Users are assigned a default division that applies to their newly createdaccounts, leads, and custom objects that are enabled for divisions.
StringdefaultValue
All division values. Division values have two properties:
label: Display name of a division.
Stringvalues
name: Unique API name of a division.
Scope Info
DescriptionTypeProperty
Default scope of the data on which you run the report.StringdefaultValue
All scope values. Valid values depend on the report type. Scope valueshave the following properties:
allowsDivision: Allows you to segment the report by this scope.
Standard date filterduration groups[]
values
label: Display name of the scope.
value: Value of the scope.
Standard date filter duration groups
DescriptionTypeProperty
Display name of the standard date filter grouping. Valid valuesare Calendar Year, Calendar Quarter, Calendar Month, Calendar
Stringlabel
Week, Fiscal Year, Fiscal Quarter, Day and custom value basedon a user-defined date range.
Details about each relative date filter defined under the standarddate filter grouping.
Standard date filterdurations[]
standardDateFilterDurations
Standard date filter durations
DescriptionTypeProperty
End date of a date filter.StringendDate
46
ReportReports API Resource Reference
DescriptionTypeProperty
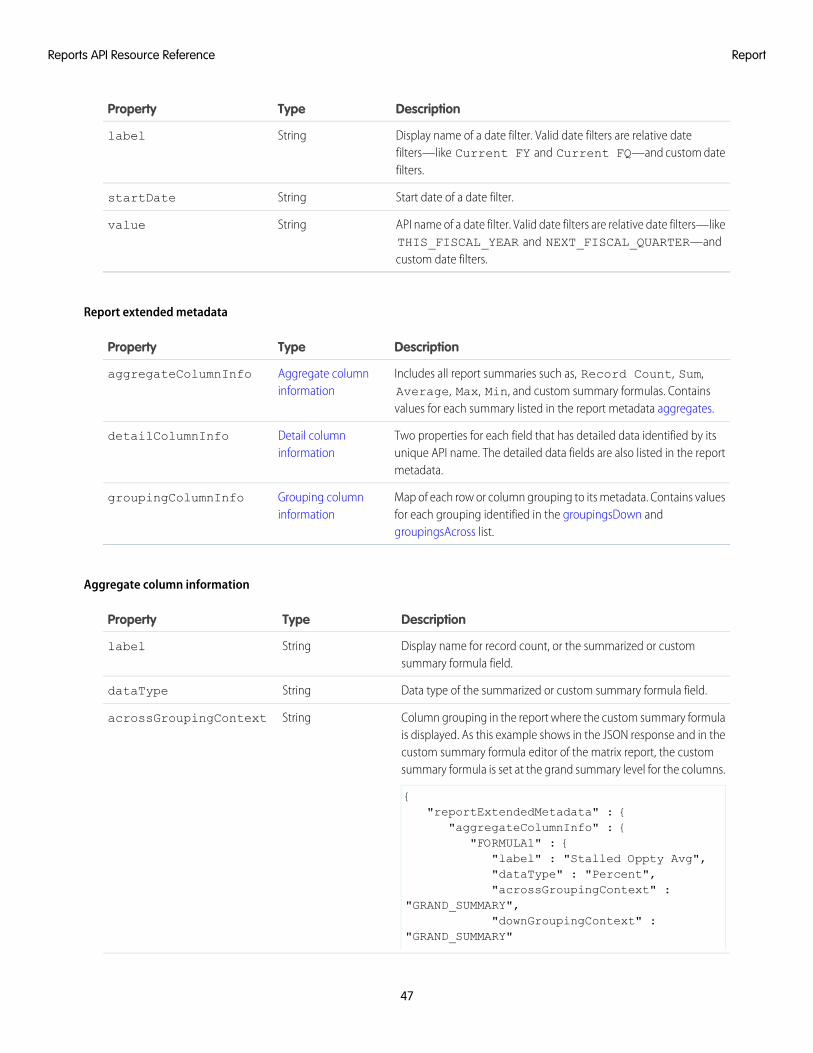
Display name of a date filter. Valid date filters are relative datefilters—like Current FY and Current FQ—and custom datefilters.
Stringlabel
Start date of a date filter.StringstartDate
API name of a date filter. Valid date filters are relative date filters—likeTHIS_FISCAL_YEAR and NEXT_FISCAL_QUARTER—andcustom date filters.
Stringvalue
Report extended metadata
DescriptionTypeProperty
Includes all report summaries such as, Record Count, Sum,Average, Max, Min, and custom summary formulas. Containsvalues for each summary listed in the report metadata aggregates.
Aggregate columninformation
aggregateColumnInfo
Two properties for each field that has detailed data identified by itsunique API name. The detailed data fields are also listed in the reportmetadata.
Detail columninformation
detailColumnInfo
Map of each row or column grouping to its metadata. Contains valuesfor each grouping identified in the groupingsDown andgroupingsAcross list.
Grouping columninformation
groupingColumnInfo
Aggregate column information
DescriptionTypeProperty
Display name for record count, or the summarized or customsummary formula field.
Stringlabel
Data type of the summarized or custom summary formula field.StringdataType
Column grouping in the report where the custom summary formulais displayed. As this example shows in the JSON response and in the
StringacrossGroupingContext
custom summary formula editor of the matrix report, the customsummary formula is set at the grand summary level for the columns.
{"reportExtendedMetadata" : {
"aggregateColumnInfo" : {"FORMULA1" : {
"label" : "Stalled Oppty Avg","dataType" : "Percent","acrossGroupingContext" :
"GRAND_SUMMARY","downGroupingContext" :
"GRAND_SUMMARY"
47
ReportReports API Resource Reference

DescriptionTypeProperty
},}
}}
Row grouping in the report where the custom summary formula isdisplayed. In this example, the custom summary formula for a
StringdownGroupingContext
summary report is displayed at the first grouping level This exampleis shown in both the JSON response and in the custom summaryformula editor of the summary report.
{"reportExtendedMetadata" : {
"aggregateColumnInfo" : {...},
"FORMULA1" : {"label" : "Average Won","dataType" : "Number","acrossGroupingContext" : null,"downGroupingContext" : "TYPE"
},}
}}
Detail column information
DescriptionTypeProperty
The localized display name of a standard field, the ID of a customfield, or the API name of a bucket field that has detailed data.
Stringlabel
The data type of the field that has detailed data.StringdataType
48
ReportReports API Resource Reference
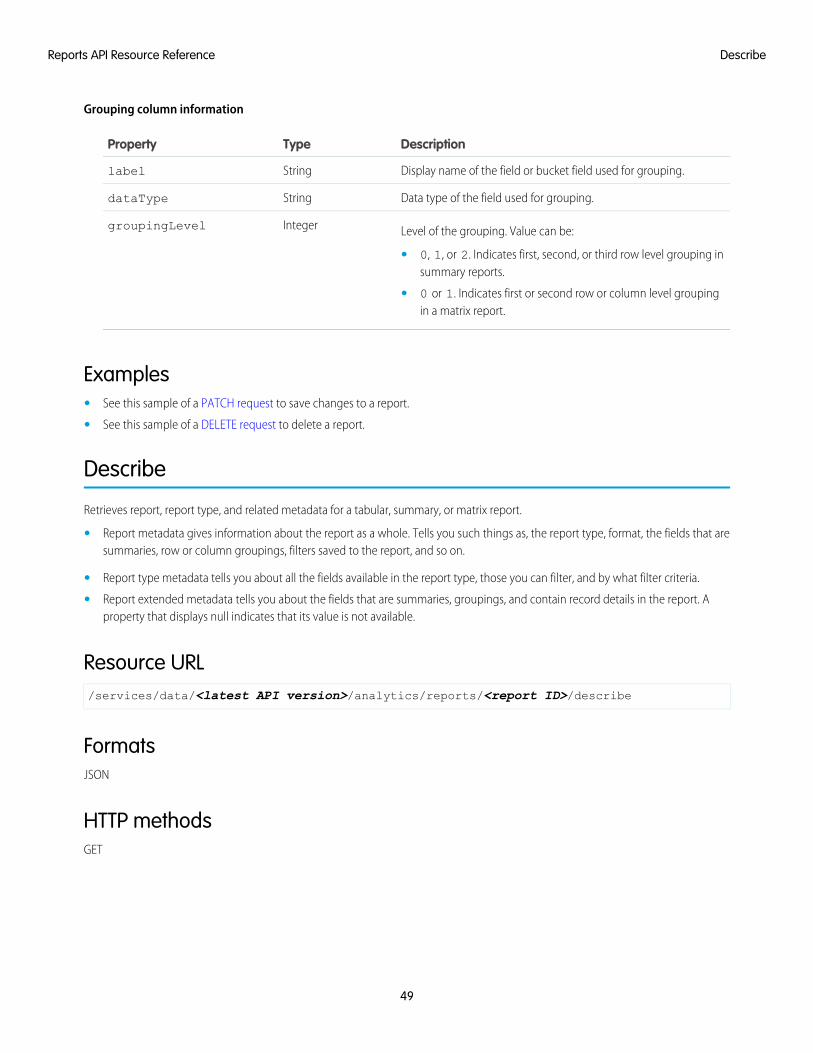
Grouping column information
DescriptionTypeProperty
Display name of the field or bucket field used for grouping.Stringlabel
Data type of the field used for grouping.StringdataType
Level of the grouping. Value can be:IntegergroupingLevel
• 0, 1, or 2. Indicates first, second, or third row level grouping insummary reports.
• 0 or 1. Indicates first or second row or column level groupingin a matrix report.
Examples• See this sample of a PATCH request to save changes to a report.
• See this sample of a DELETE request to delete a report.
Describe
Retrieves report, report type, and related metadata for a tabular, summary, or matrix report.
• Report metadata gives information about the report as a whole. Tells you such things as, the report type, format, the fields that aresummaries, row or column groupings, filters saved to the report, and so on.
• Report type metadata tells you about all the fields available in the report type, those you can filter, and by what filter criteria.
• Report extended metadata tells you about the fields that are summaries, groupings, and contain record details in the report. Aproperty that displays null indicates that its value is not available.
Resource URL/services/data/<latest API version>/analytics/reports/<report ID>/describe
FormatsJSON
HTTP methodsGET
49
DescribeReports API Resource Reference
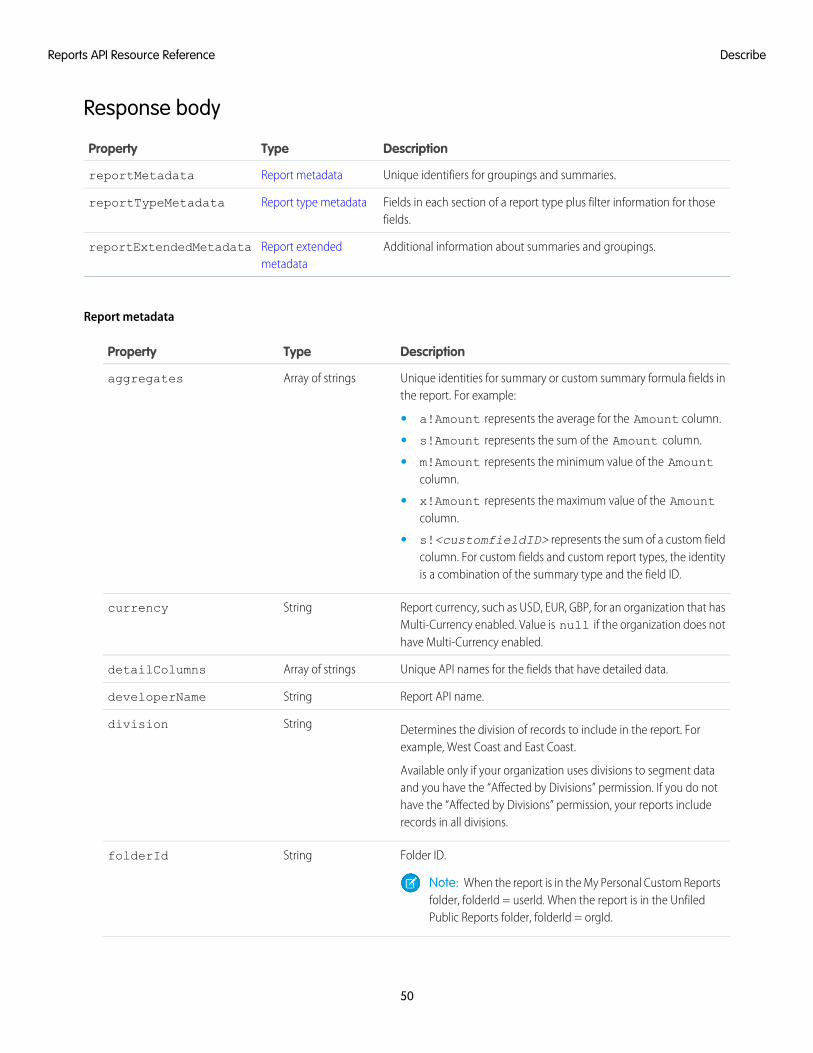
Response body
DescriptionTypeProperty
Unique identifiers for groupings and summaries.Report metadatareportMetadata
Fields in each section of a report type plus filter information for thosefields.
Report type metadatareportTypeMetadata
Additional information about summaries and groupings.Report extendedmetadata
reportExtendedMetadata
Report metadata
DescriptionTypeProperty
Unique identities for summary or custom summary formula fields inthe report. For example:
Array of stringsaggregates
• a!Amount represents the average for the Amount column.
• s!Amount represents the sum of the Amount column.
• m!Amount represents the minimum value of the Amountcolumn.
• x!Amount represents the maximum value of the Amountcolumn.
• s!<customfieldID> represents the sum of a custom fieldcolumn. For custom fields and custom report types, the identityis a combination of the summary type and the field ID.
Report currency, such as USD, EUR, GBP, for an organization that hasMulti-Currency enabled. Value is null if the organization does nothave Multi-Currency enabled.
Stringcurrency
Unique API names for the fields that have detailed data.Array of stringsdetailColumns
Report API name.StringdeveloperName
Determines the division of records to include in the report. Forexample, West Coast and East Coast.
Stringdivision
Available only if your organization uses divisions to segment dataand you have the “Affected by Divisions” permission. If you do nothave the “Affected by Divisions” permission, your reports includerecords in all divisions.
Folder ID.StringfolderId
Note: When the report is in the My Personal Custom Reportsfolder, folderId = userId. When the report is in the UnfiledPublic Reports folder, folderId = orgId.
50
DescribeReports API Resource Reference
DescriptionTypeProperty
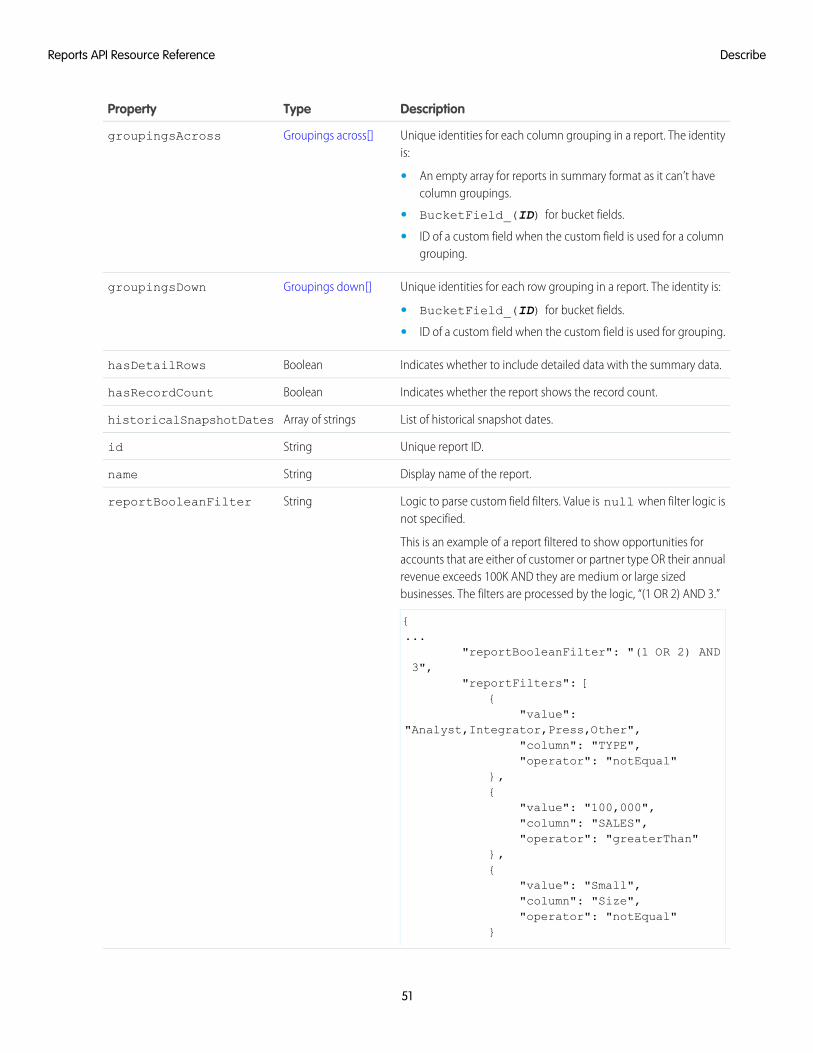
Unique identities for each column grouping in a report. The identityis:
Groupings across[]groupingsAcross
• An empty array for reports in summary format as it can’t havecolumn groupings.
• BucketField_(ID) for bucket fields.
• ID of a custom field when the custom field is used for a columngrouping.
Unique identities for each row grouping in a report. The identity is:Groupings down[]groupingsDown
• BucketField_(ID) for bucket fields.
• ID of a custom field when the custom field is used for grouping.
Indicates whether to include detailed data with the summary data.BooleanhasDetailRows
Indicates whether the report shows the record count.BooleanhasRecordCount
List of historical snapshot dates.Array of stringshistoricalSnapshotDates
Unique report ID.Stringid
Display name of the report.Stringname
Logic to parse custom field filters. Value is null when filter logic isnot specified.
This is an example of a report filtered to show opportunities foraccounts that are either of customer or partner type OR their annual
StringreportBooleanFilter
revenue exceeds 100K AND they are medium or large sizedbusinesses. The filters are processed by the logic, “(1 OR 2) AND 3.”
{...
"reportBooleanFilter": "(1 OR 2) AND3",
"reportFilters": [{
"value":"Analyst,Integrator,Press,Other",
"column": "TYPE","operator": "notEqual"
},{
"value": "100,000","column": "SALES","operator": "greaterThan"
},{
"value": "Small","column": "Size","operator": "notEqual"
}
51
DescribeReports API Resource Reference
DescriptionTypeProperty
]}
}
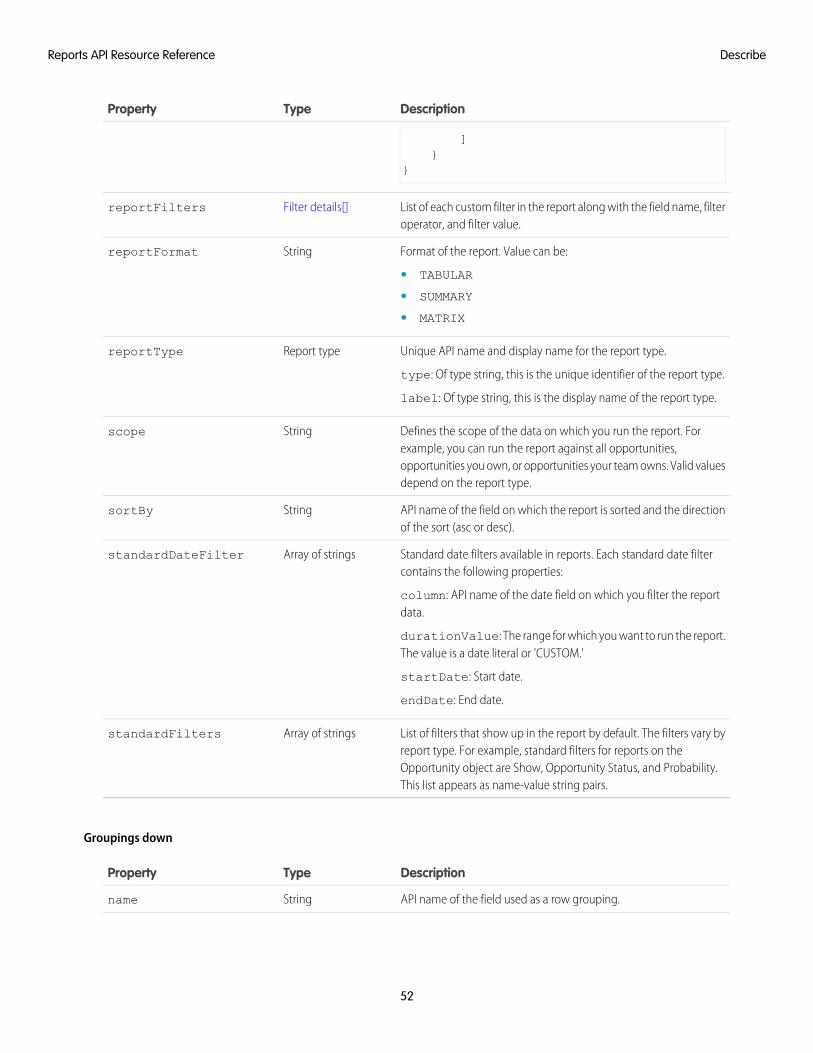
List of each custom filter in the report along with the field name, filteroperator, and filter value.
Filter details[]reportFilters
Format of the report. Value can be:StringreportFormat
• TABULAR
• SUMMARY
• MATRIX
Unique API name and display name for the report type.
type: Of type string, this is the unique identifier of the report type.
Report typereportType
label: Of type string, this is the display name of the report type.
Defines the scope of the data on which you run the report. Forexample, you can run the report against all opportunities,
Stringscope
opportunities you own, or opportunities your team owns. Valid valuesdepend on the report type.
API name of the field on which the report is sorted and the directionof the sort (asc or desc).
StringsortBy
Standard date filters available in reports. Each standard date filtercontains the following properties:
column: API name of the date field on which you filter the reportdata.
Array of stringsstandardDateFilter
durationValue: The range for which you want to run the report.The value is a date literal or 'CUSTOM.'
startDate: Start date.
endDate: End date.
List of filters that show up in the report by default. The filters vary byreport type. For example, standard filters for reports on the
Array of stringsstandardFilters
Opportunity object are Show, Opportunity Status, and Probability.This list appears as name-value string pairs.
Groupings down
DescriptionTypeProperty
API name of the field used as a row grouping.Stringname
52
DescribeReports API Resource Reference
DescriptionTypeProperty
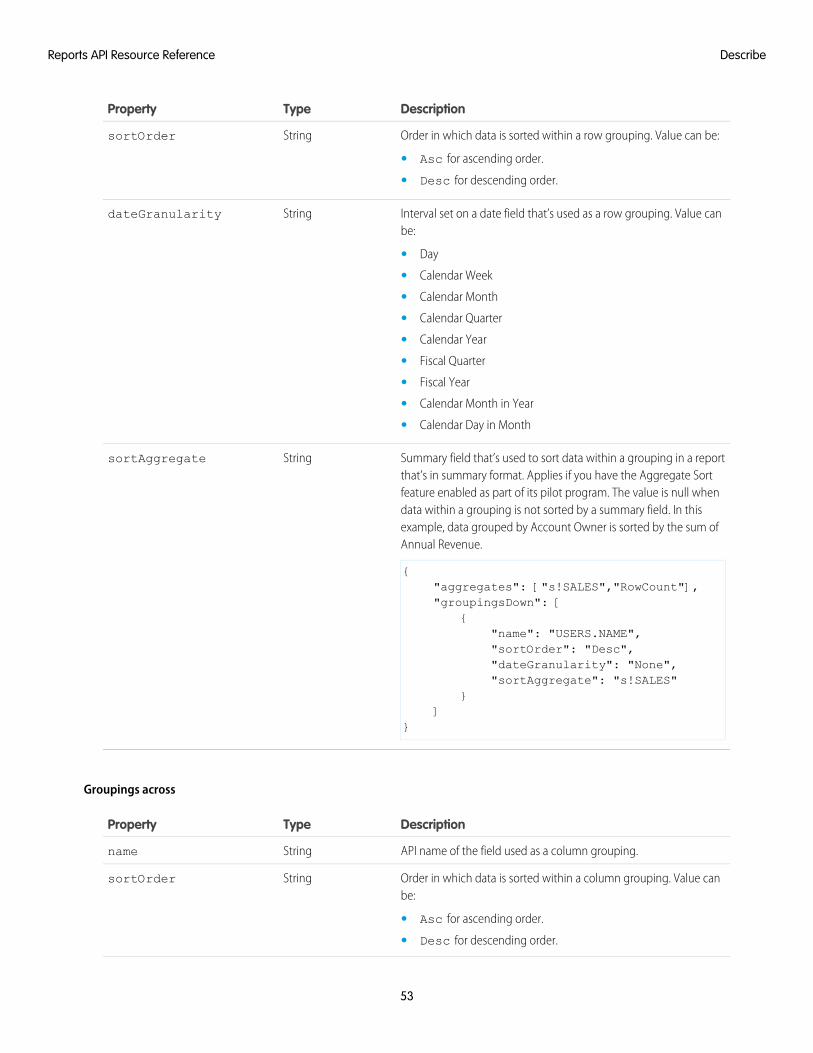
Order in which data is sorted within a row grouping. Value can be:StringsortOrder
• Asc for ascending order.
• Desc for descending order.
Interval set on a date field that’s used as a row grouping. Value canbe:
StringdateGranularity
• Day
• Calendar Week
• Calendar Month
• Calendar Quarter
• Calendar Year
• Fiscal Quarter
• Fiscal Year
• Calendar Month in Year
• Calendar Day in Month
Summary field that’s used to sort data within a grouping in a reportthat’s in summary format. Applies if you have the Aggregate Sort
StringsortAggregate
feature enabled as part of its pilot program. The value is null whendata within a grouping is not sorted by a summary field. In thisexample, data grouped by Account Owner is sorted by the sum ofAnnual Revenue.
{"aggregates": ["s!SALES","RowCount"],"groupingsDown": [
{"name": "USERS.NAME","sortOrder": "Desc","dateGranularity": "None","sortAggregate": "s!SALES"
}]
}
Groupings across
DescriptionTypeProperty
API name of the field used as a column grouping.Stringname
Order in which data is sorted within a column grouping. Value canbe:
StringsortOrder
• Asc for ascending order.
• Desc for descending order.
53
DescribeReports API Resource Reference
DescriptionTypeProperty
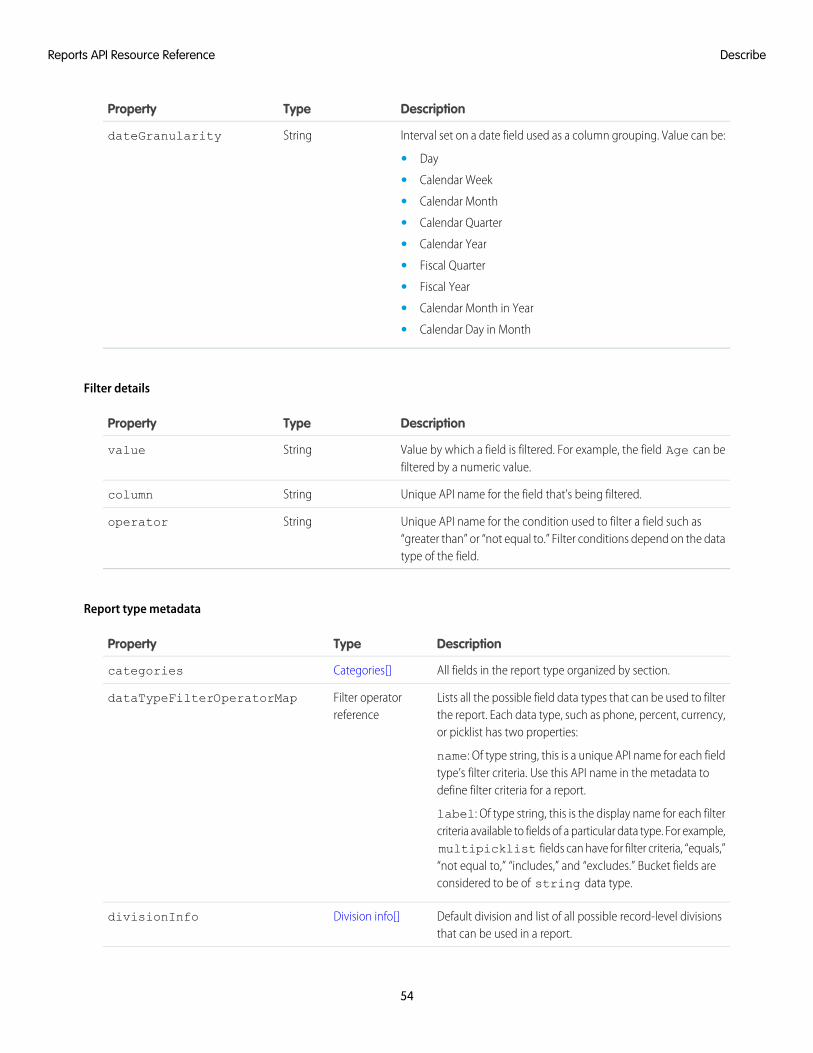
Interval set on a date field used as a column grouping. Value can be:StringdateGranularity
• Day
• Calendar Week
• Calendar Month
• Calendar Quarter
• Calendar Year
• Fiscal Quarter
• Fiscal Year
• Calendar Month in Year
• Calendar Day in Month
Filter details
DescriptionTypeProperty
Value by which a field is filtered. For example, the field Age can befiltered by a numeric value.
Stringvalue
Unique API name for the field that’s being filtered.Stringcolumn
Unique API name for the condition used to filter a field such as“greater than” or “not equal to.” Filter conditions depend on the datatype of the field.
Stringoperator
Report type metadata
DescriptionTypeProperty
All fields in the report type organized by section.Categories[]categories
Lists all the possible field data types that can be used to filterthe report. Each data type, such as phone, percent, currency,or picklist has two properties:
name: Of type string, this is a unique API name for each fieldtype’s filter criteria. Use this API name in the metadata todefine filter criteria for a report.
Filter operatorreference
dataTypeFilterOperatorMap
label: Of type string, this is the display name for each filtercriteria available to fields of a particular data type. For example,multipicklist fields can have for filter criteria, “equals,”“not equal to,” “includes,” and “excludes.” Bucket fields areconsidered to be of string data type.
Default division and list of all possible record-level divisionsthat can be used in a report.
Division info[]divisionInfo
54
DescribeReports API Resource Reference
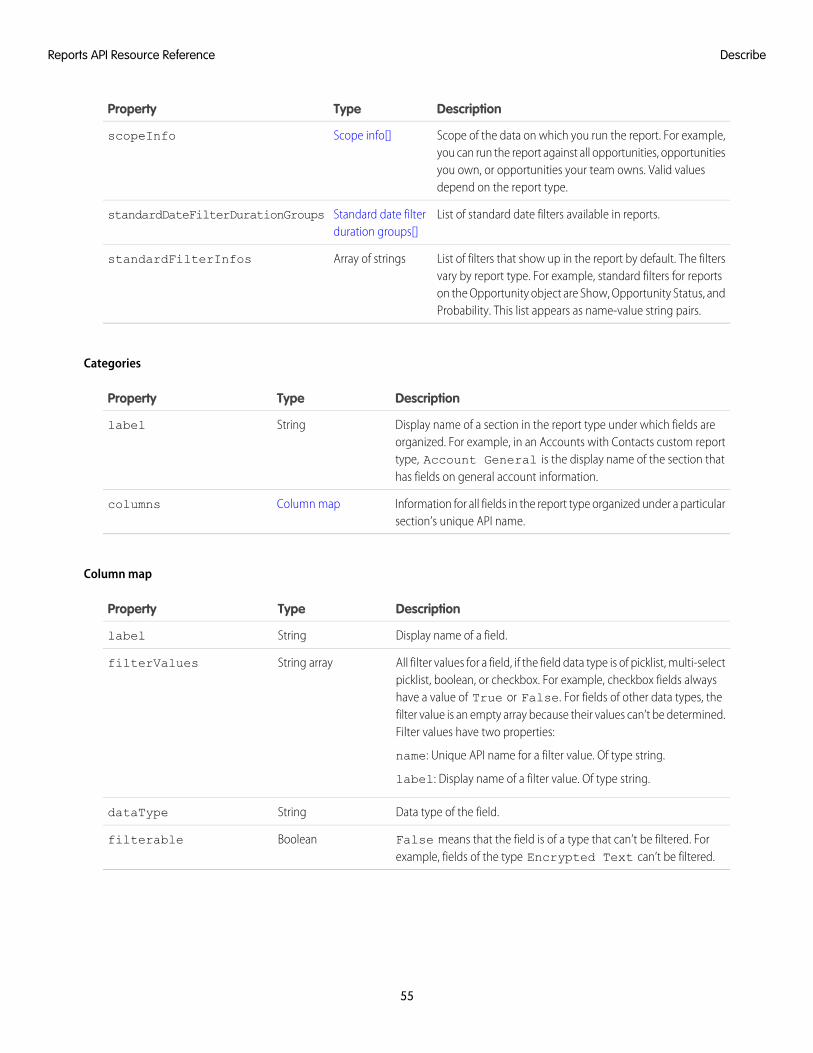
DescriptionTypeProperty
Scope of the data on which you run the report. For example,you can run the report against all opportunities, opportunities
Scope info[]scopeInfo
you own, or opportunities your team owns. Valid valuesdepend on the report type.
List of standard date filters available in reports.Standard date filterduration groups[]
standardDateFilterDurationGroups
List of filters that show up in the report by default. The filtersvary by report type. For example, standard filters for reports
Array of stringsstandardFilterInfos
on the Opportunity object are Show, Opportunity Status, andProbability. This list appears as name-value string pairs.
Categories
DescriptionTypeProperty
Display name of a section in the report type under which fields areorganized. For example, in an Accounts with Contacts custom report
Stringlabel
type, Account General is the display name of the section thathas fields on general account information.
Information for all fields in the report type organized under a particularsection’s unique API name.
Column mapcolumns
Column map
DescriptionTypeProperty
Display name of a field.Stringlabel
All filter values for a field, if the field data type is of picklist, multi-selectpicklist, boolean, or checkbox. For example, checkbox fields always
String arrayfilterValues
have a value of True or False. For fields of other data types, thefilter value is an empty array because their values can’t be determined.Filter values have two properties:
name: Unique API name for a filter value. Of type string.
label: Display name of a filter value. Of type string.
Data type of the field.StringdataType
False means that the field is of a type that can’t be filtered. Forexample, fields of the type Encrypted Text can’t be filtered.
Booleanfilterable
55
DescribeReports API Resource Reference
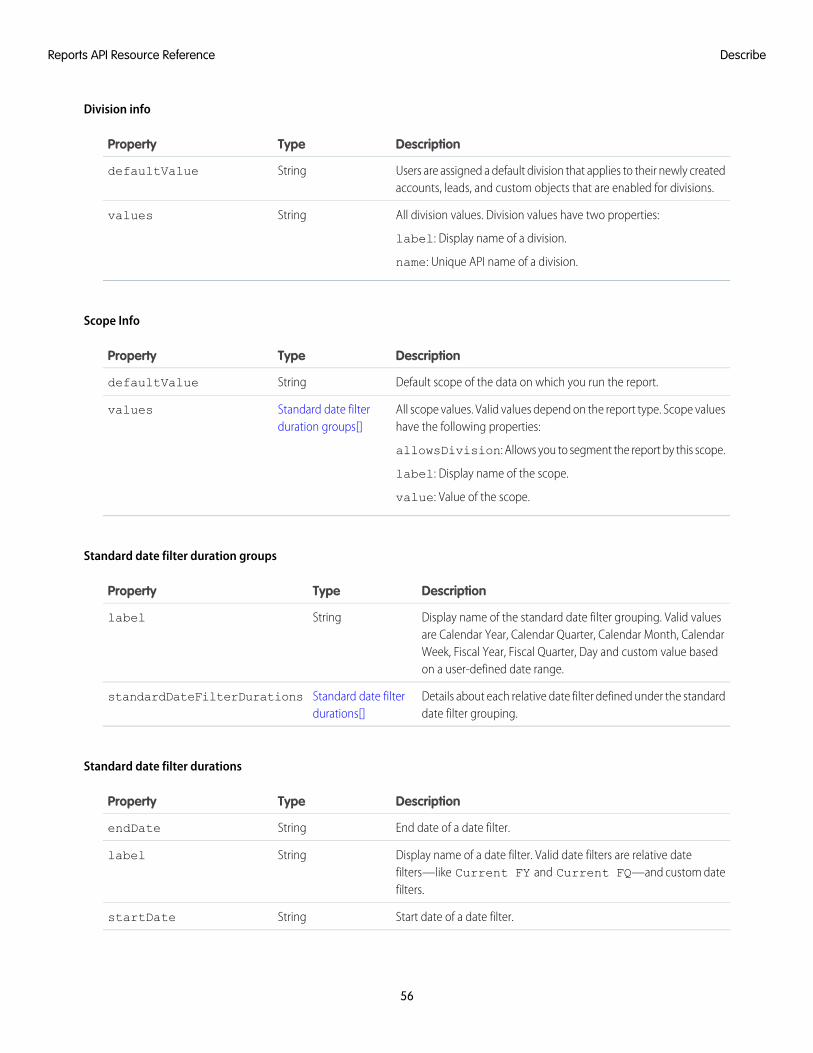
Division info
DescriptionTypeProperty
Users are assigned a default division that applies to their newly createdaccounts, leads, and custom objects that are enabled for divisions.
StringdefaultValue
All division values. Division values have two properties:
label: Display name of a division.
Stringvalues
name: Unique API name of a division.
Scope Info
DescriptionTypeProperty
Default scope of the data on which you run the report.StringdefaultValue
All scope values. Valid values depend on the report type. Scope valueshave the following properties:
allowsDivision: Allows you to segment the report by this scope.
Standard date filterduration groups[]
values
label: Display name of the scope.
value: Value of the scope.
Standard date filter duration groups
DescriptionTypeProperty
Display name of the standard date filter grouping. Valid valuesare Calendar Year, Calendar Quarter, Calendar Month, Calendar
Stringlabel
Week, Fiscal Year, Fiscal Quarter, Day and custom value basedon a user-defined date range.
Details about each relative date filter defined under the standarddate filter grouping.
Standard date filterdurations[]
standardDateFilterDurations
Standard date filter durations
DescriptionTypeProperty
End date of a date filter.StringendDate
Display name of a date filter. Valid date filters are relative datefilters—like Current FY and Current FQ—and custom datefilters.
Stringlabel
Start date of a date filter.StringstartDate
56
DescribeReports API Resource Reference
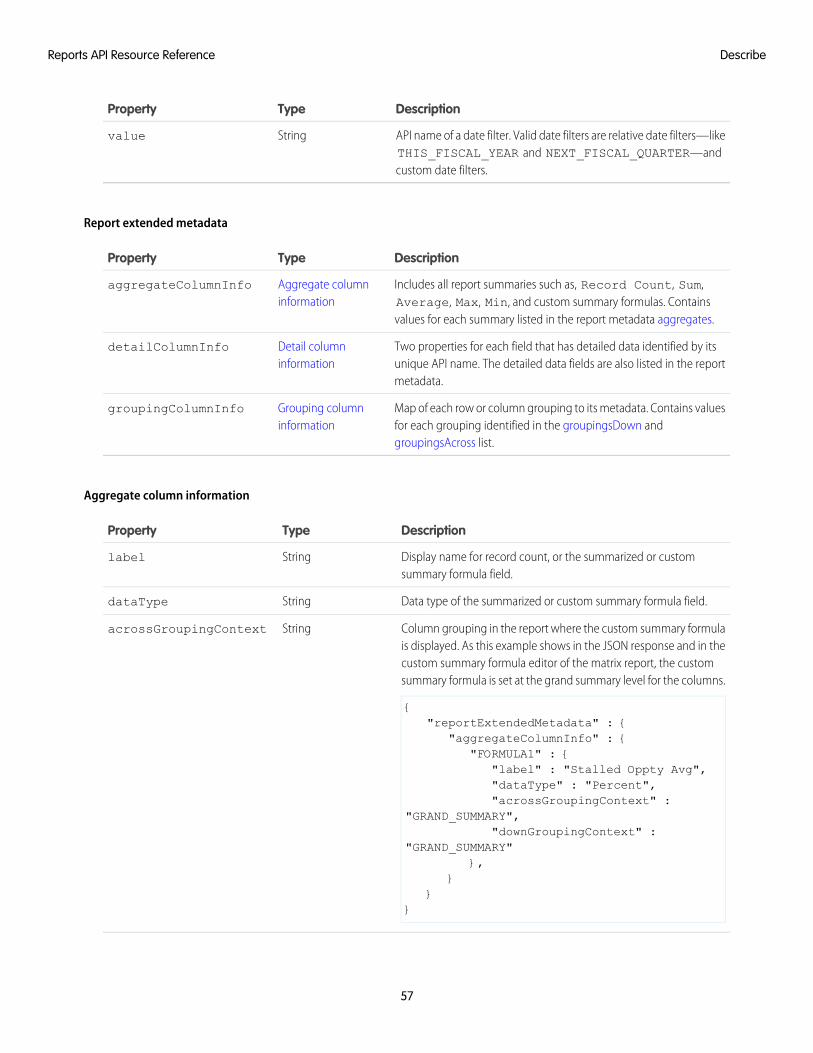
DescriptionTypeProperty
API name of a date filter. Valid date filters are relative date filters—likeTHIS_FISCAL_YEAR and NEXT_FISCAL_QUARTER—andcustom date filters.
Stringvalue
Report extended metadata
DescriptionTypeProperty
Includes all report summaries such as, Record Count, Sum,Average, Max, Min, and custom summary formulas. Containsvalues for each summary listed in the report metadata aggregates.
Aggregate columninformation
aggregateColumnInfo
Two properties for each field that has detailed data identified by itsunique API name. The detailed data fields are also listed in the reportmetadata.
Detail columninformation
detailColumnInfo
Map of each row or column grouping to its metadata. Contains valuesfor each grouping identified in the groupingsDown andgroupingsAcross list.
Grouping columninformation
groupingColumnInfo
Aggregate column information
DescriptionTypeProperty
Display name for record count, or the summarized or customsummary formula field.
Stringlabel
Data type of the summarized or custom summary formula field.StringdataType
Column grouping in the report where the custom summary formulais displayed. As this example shows in the JSON response and in the
StringacrossGroupingContext
custom summary formula editor of the matrix report, the customsummary formula is set at the grand summary level for the columns.
{"reportExtendedMetadata" : {
"aggregateColumnInfo" : {"FORMULA1" : {
"label" : "Stalled Oppty Avg","dataType" : "Percent","acrossGroupingContext" :
"GRAND_SUMMARY","downGroupingContext" :
"GRAND_SUMMARY"},
}}
}
57
DescribeReports API Resource Reference
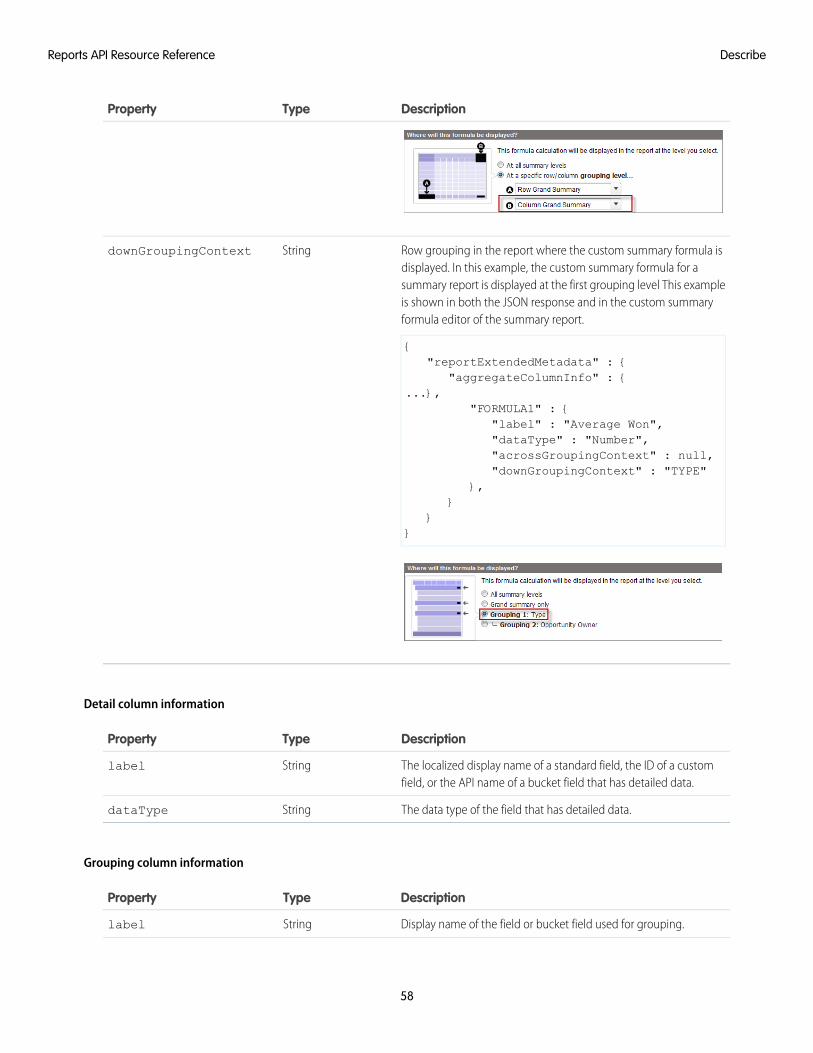
DescriptionTypeProperty
Row grouping in the report where the custom summary formula isdisplayed. In this example, the custom summary formula for a
StringdownGroupingContext
summary report is displayed at the first grouping level This exampleis shown in both the JSON response and in the custom summaryformula editor of the summary report.
{"reportExtendedMetadata" : {
"aggregateColumnInfo" : {...},
"FORMULA1" : {"label" : "Average Won","dataType" : "Number","acrossGroupingContext" : null,"downGroupingContext" : "TYPE"
},}
}}
Detail column information
DescriptionTypeProperty
The localized display name of a standard field, the ID of a customfield, or the API name of a bucket field that has detailed data.
Stringlabel
The data type of the field that has detailed data.StringdataType
Grouping column information
DescriptionTypeProperty
Display name of the field or bucket field used for grouping.Stringlabel
58
DescribeReports API Resource Reference
DescriptionTypeProperty
Data type of the field used for grouping.StringdataType
Level of the grouping. Value can be:IntegergroupingLevel
• 0, 1, or 2. Indicates first, second, or third row level grouping insummary reports.
• 0 or 1. Indicates first or second row or column level groupingin a matrix report.
ExampleSee this sample of a GET request for report metadata.
SEE ALSO:
Execute Sync
Execute Async
Execute Sync
Runs a report immediately with or without changing filters and returns the latest summary data with or without details for your level ofaccess.
Resource URL/services/data/<latest API version>/analytics/reports/<report ID>
FormatsJSON
HTTP Methods
DescriptionMethod
Get report results.GET
Get specific results by passing filters in the report metadata.POST
59
Execute SyncReports API Resource Reference
POST Request Body
DescriptionTypeProperty
Unique identities for summary or custom summary formula fields inthe report. For example:
Array of stringsaggregates
• a!Amount represents the average for the Amount column.
• s!Amount represents the sum of the Amount column.
• m!Amount represents the minimum value of the Amountcolumn.
• x!Amount represents the maximum value of the Amountcolumn.
• s!<customfieldID> represents the sum of a custom fieldcolumn. For custom fields and custom report types, the identity isa combination of the summary type and the field ID.
Report currency, such as USD, EUR, GBP, for an organization that hasMulti-Currency enabled. Value is null if the organization does nothave Multi-Currency enabled.
Stringcurrency
Unique API names for the fields that have detailed data.Array of stringsdetailColumns
Report API name.StringdeveloperName
Determines the division of records to include in the report. For example,West Coast and East Coast.
Stringdivision
Available only if your organization uses divisions to segment data andyou have the “Affected by Divisions” permission. If you do not have the“Affected by Divisions” permission, your reports include records in alldivisions.
Folder ID.StringfolderId
Note: When the report is in the My Personal Custom Reportsfolder, folderId = userId. When the report is in the Unfiled PublicReports folder, folderId = orgId.
Unique identities for each column grouping in a report. The identity is:Groupings across[]groupingsAcross
• An empty array for reports in summary format as it can’t havecolumn groupings.
• BucketField_(ID) for bucket fields.
• ID of a custom field when the custom field is used for a columngrouping.
Unique identities for each row grouping in a report. The identity is:Groupings down[]groupingsDown
• BucketField_(ID) for bucket fields.
• ID of a custom field when the custom field is used for grouping.
60
Execute SyncReports API Resource Reference
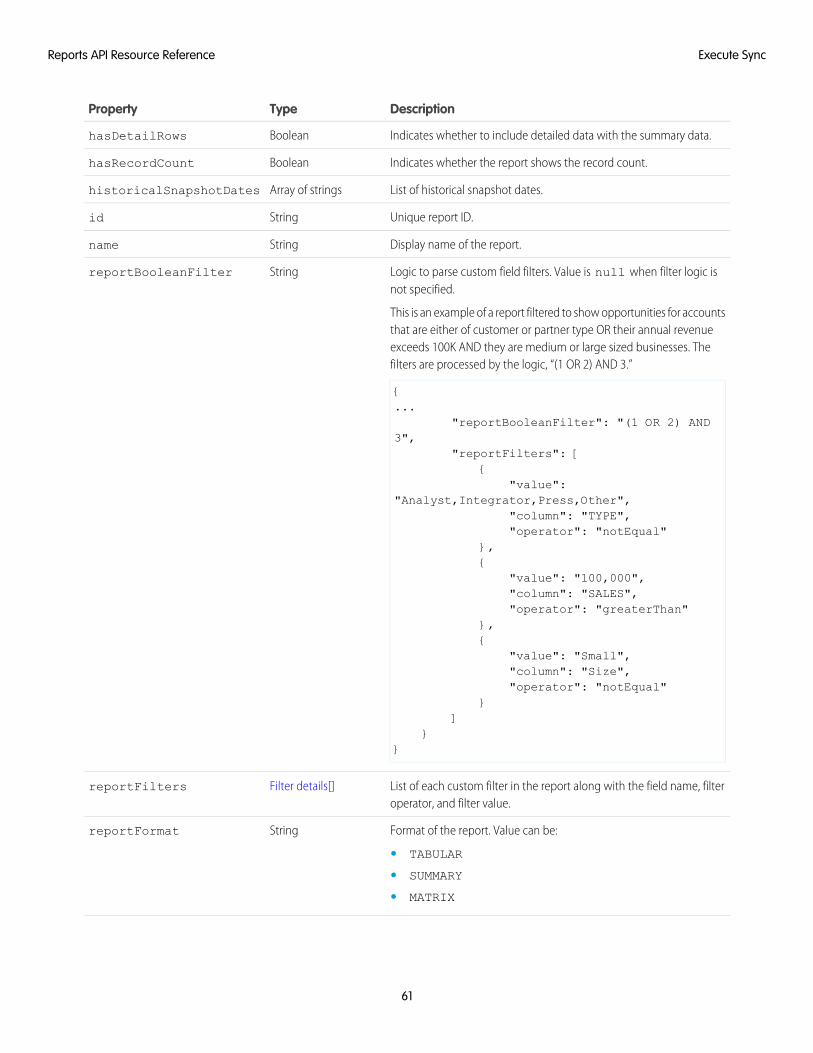
DescriptionTypeProperty
Indicates whether to include detailed data with the summary data.BooleanhasDetailRows
Indicates whether the report shows the record count.BooleanhasRecordCount
List of historical snapshot dates.Array of stringshistoricalSnapshotDates
Unique report ID.Stringid
Display name of the report.Stringname
Logic to parse custom field filters. Value is null when filter logic isnot specified.
This is an example of a report filtered to show opportunities for accountsthat are either of customer or partner type OR their annual revenue
StringreportBooleanFilter
exceeds 100K AND they are medium or large sized businesses. Thefilters are processed by the logic, “(1 OR 2) AND 3.”
{...
"reportBooleanFilter": "(1 OR 2) AND3",
"reportFilters": [{
"value":"Analyst,Integrator,Press,Other",
"column": "TYPE","operator": "notEqual"
},{
"value": "100,000","column": "SALES","operator": "greaterThan"
},{
"value": "Small","column": "Size","operator": "notEqual"
}]
}}
List of each custom filter in the report along with the field name, filteroperator, and filter value.
Filter details[]reportFilters
Format of the report. Value can be:StringreportFormat
• TABULAR
• SUMMARY
• MATRIX
61
Execute SyncReports API Resource Reference
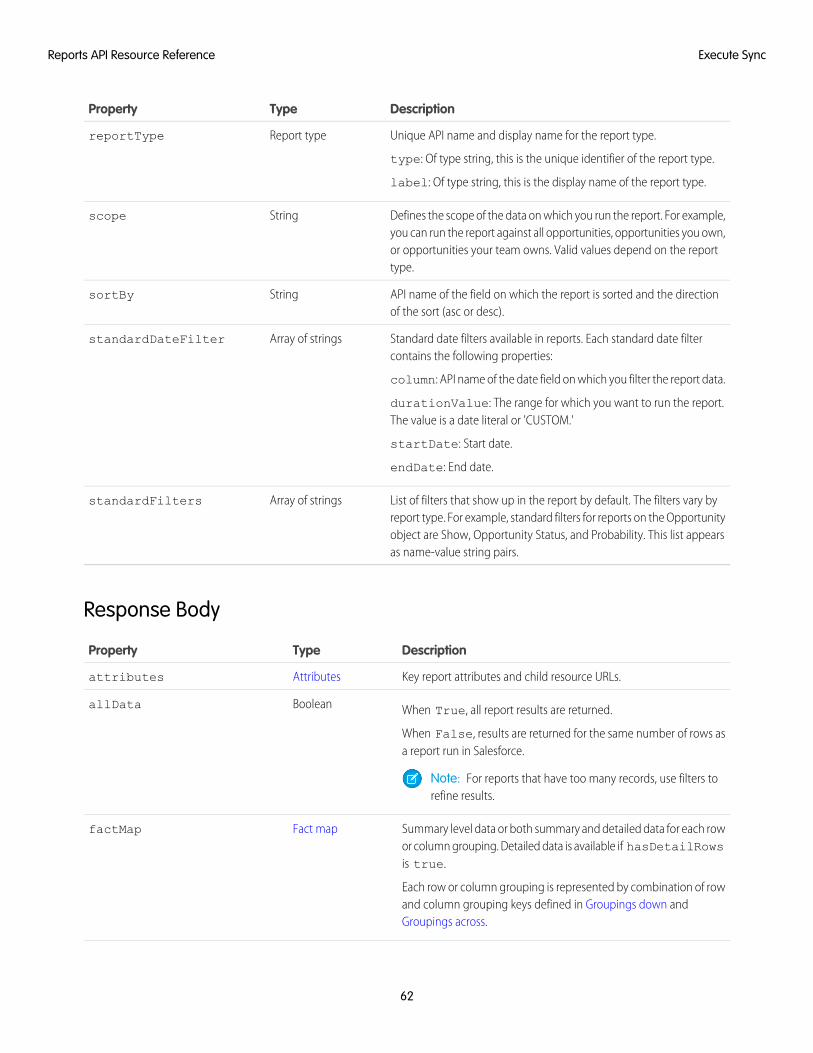
DescriptionTypeProperty
Unique API name and display name for the report type.
type: Of type string, this is the unique identifier of the report type.
Report typereportType
label: Of type string, this is the display name of the report type.
Defines the scope of the data on which you run the report. For example,you can run the report against all opportunities, opportunities you own,
Stringscope
or opportunities your team owns. Valid values depend on the reporttype.
API name of the field on which the report is sorted and the directionof the sort (asc or desc).
StringsortBy
Standard date filters available in reports. Each standard date filtercontains the following properties:
column: API name of the date field on which you filter the report data.
Array of stringsstandardDateFilter
durationValue: The range for which you want to run the report.The value is a date literal or 'CUSTOM.'
startDate: Start date.
endDate: End date.
List of filters that show up in the report by default. The filters vary byreport type. For example, standard filters for reports on the Opportunity
Array of stringsstandardFilters
object are Show, Opportunity Status, and Probability. This list appearsas name-value string pairs.
Response Body
DescriptionTypeProperty
Key report attributes and child resource URLs.Attributesattributes
When True, all report results are returned.BooleanallData
When False, results are returned for the same number of rows asa report run in Salesforce.
Note: For reports that have too many records, use filters torefine results.
Summary level data or both summary and detailed data for each rowor column grouping. Detailed data is available if hasDetailRowsis true.
Each row or column grouping is represented by combination of rowand column grouping keys defined in Groupings down andGroupings across.
Fact mapfactMap
62
Execute SyncReports API Resource Reference
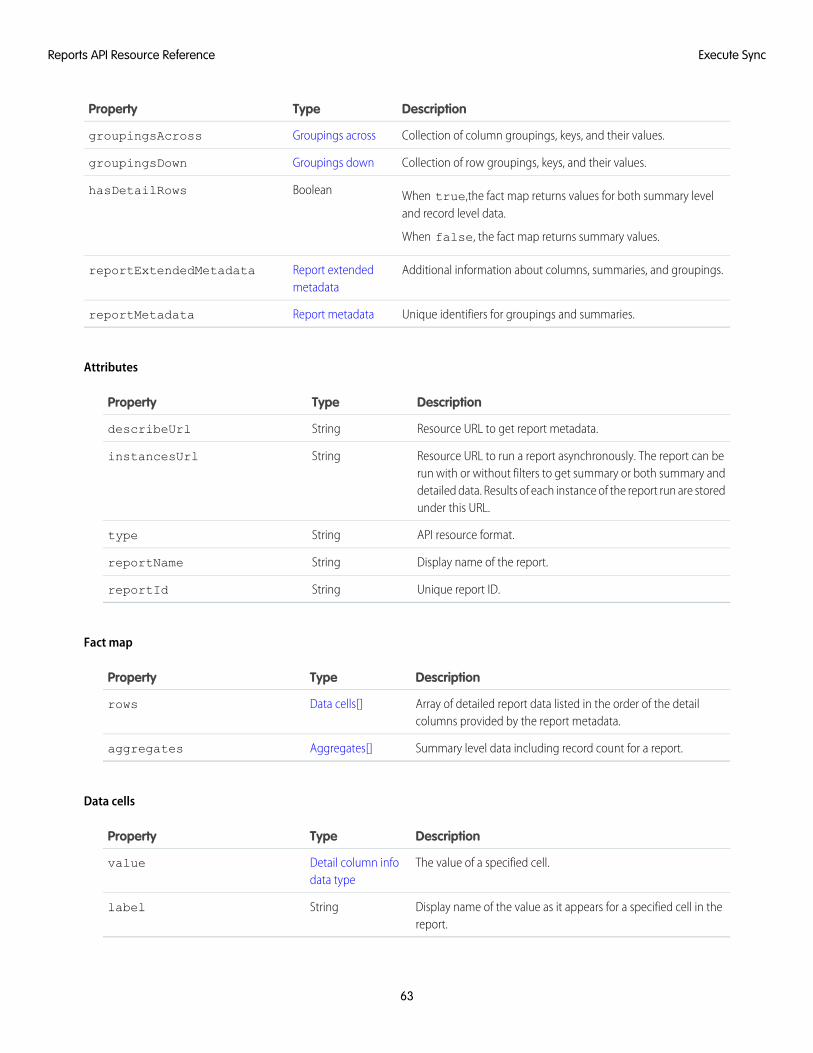
DescriptionTypeProperty
Collection of column groupings, keys, and their values.Groupings acrossgroupingsAcross
Collection of row groupings, keys, and their values.Groupings downgroupingsDown
When true,the fact map returns values for both summary leveland record level data.
BooleanhasDetailRows
When false, the fact map returns summary values.
Additional information about columns, summaries, and groupings.Report extendedmetadata
reportExtendedMetadata
Unique identifiers for groupings and summaries.Report metadatareportMetadata
Attributes
DescriptionTypeProperty
Resource URL to get report metadata.StringdescribeUrl
Resource URL to run a report asynchronously. The report can berun with or without filters to get summary or both summary and
StringinstancesUrl
detailed data. Results of each instance of the report run are storedunder this URL.
API resource format.Stringtype
Display name of the report.StringreportName
Unique report ID.StringreportId
Fact map
DescriptionTypeProperty
Array of detailed report data listed in the order of the detailcolumns provided by the report metadata.
Data cells[]rows
Summary level data including record count for a report.Aggregates[]aggregates
Data cells
DescriptionTypeProperty
The value of a specified cell.Detail column infodata type
value
Display name of the value as it appears for a specified cell in thereport.
Stringlabel
63
Execute SyncReports API Resource Reference
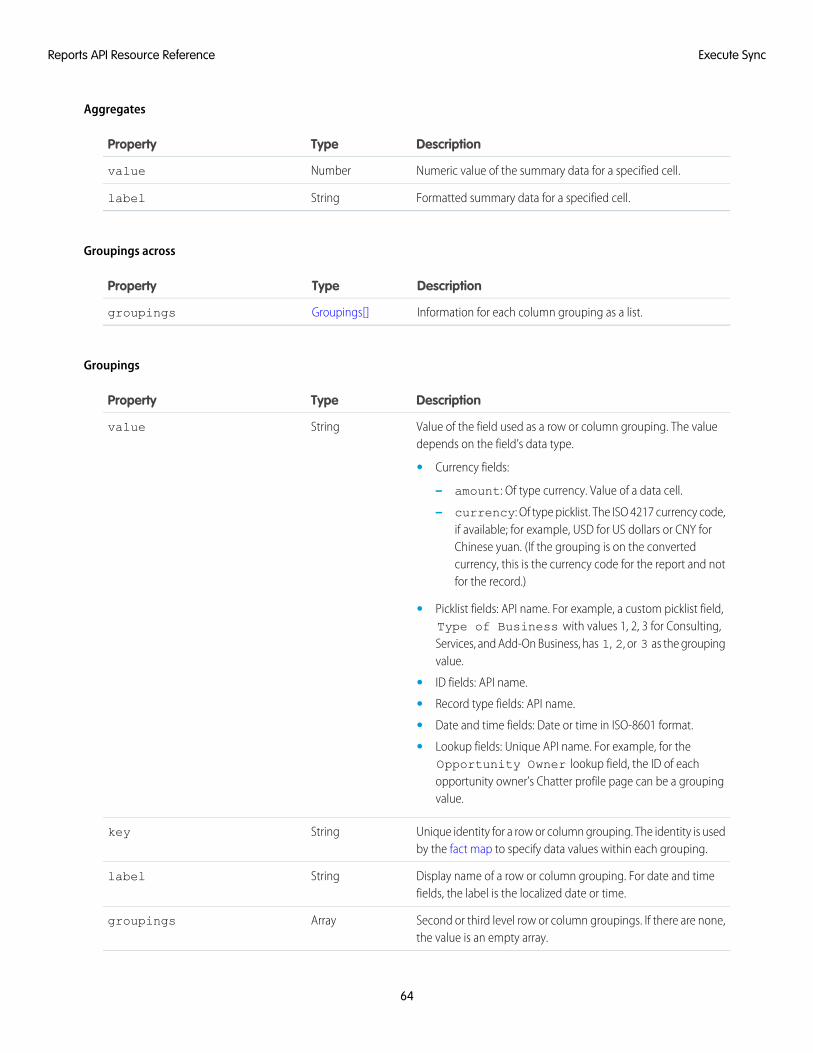
Aggregates
DescriptionTypeProperty
Numeric value of the summary data for a specified cell.Numbervalue
Formatted summary data for a specified cell.Stringlabel
Groupings across
DescriptionTypeProperty
Information for each column grouping as a list.Groupings[]groupings
Groupings
DescriptionTypeProperty
Value of the field used as a row or column grouping. The valuedepends on the field’s data type.
Stringvalue
• Currency fields:
– amount: Of type currency. Value of a data cell.
– currency: Of type picklist. The ISO 4217 currency code,if available; for example, USD for US dollars or CNY forChinese yuan. (If the grouping is on the convertedcurrency, this is the currency code for the report and notfor the record.)
• Picklist fields: API name. For example, a custom picklist field,Type of Business with values 1, 2, 3 for Consulting,Services, and Add-On Business, has 1, 2, or 3 as the groupingvalue.
• ID fields: API name.
• Record type fields: API name.
• Date and time fields: Date or time in ISO-8601 format.
• Lookup fields: Unique API name. For example, for theOpportunity Owner lookup field, the ID of eachopportunity owner’s Chatter profile page can be a groupingvalue.
Unique identity for a row or column grouping. The identity is usedby the fact map to specify data values within each grouping.
Stringkey
Display name of a row or column grouping. For date and timefields, the label is the localized date or time.
Stringlabel
Second or third level row or column groupings. If there are none,the value is an empty array.
Arraygroupings
64
Execute SyncReports API Resource Reference
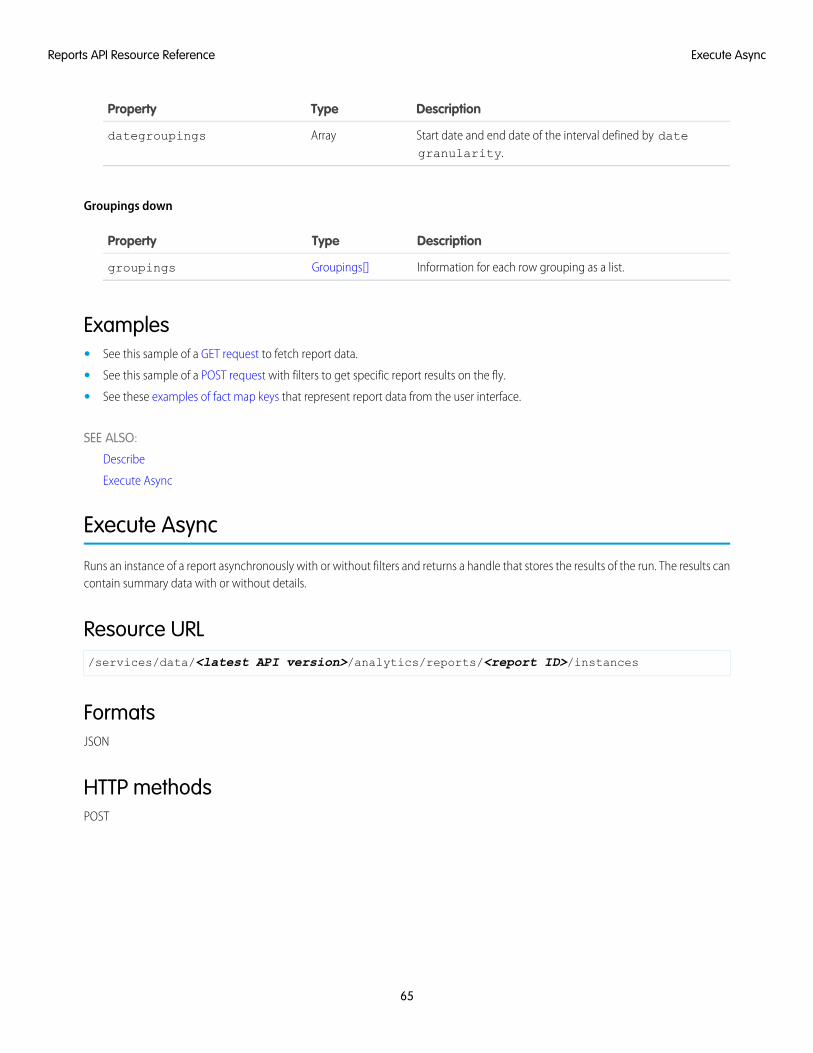
DescriptionTypeProperty
Start date and end date of the interval defined by dategranularity.
Arraydategroupings
Groupings down
DescriptionTypeProperty
Information for each row grouping as a list.Groupings[]groupings
Examples• See this sample of a GET request to fetch report data.
• See this sample of a POST request with filters to get specific report results on the fly.
• See these examples of fact map keys that represent report data from the user interface.
SEE ALSO:
Describe
Execute Async
Execute Async
Runs an instance of a report asynchronously with or without filters and returns a handle that stores the results of the run. The results cancontain summary data with or without details.
Resource URL/services/data/<latest API version>/analytics/reports/<report ID>/instances
FormatsJSON
HTTP methodsPOST
65
Execute AsyncReports API Resource Reference
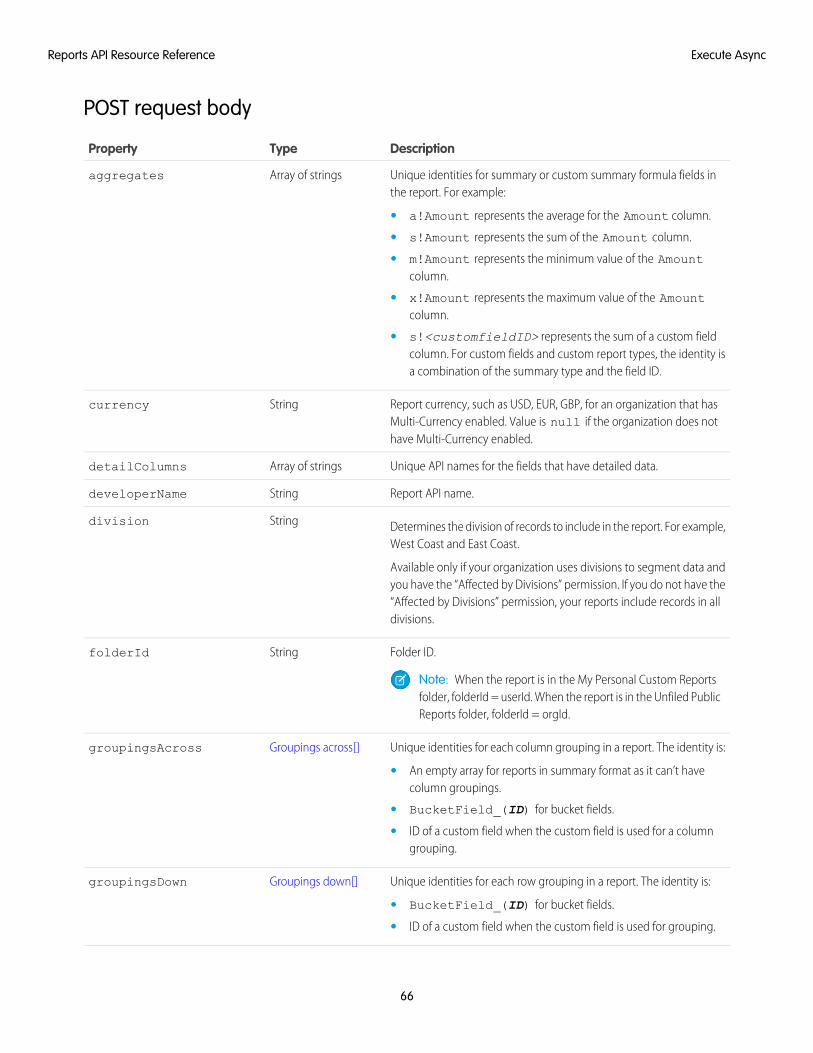
POST request body
DescriptionTypeProperty
Unique identities for summary or custom summary formula fields inthe report. For example:
Array of stringsaggregates
• a!Amount represents the average for the Amount column.
• s!Amount represents the sum of the Amount column.
• m!Amount represents the minimum value of the Amountcolumn.
• x!Amount represents the maximum value of the Amountcolumn.
• s!<customfieldID> represents the sum of a custom fieldcolumn. For custom fields and custom report types, the identity isa combination of the summary type and the field ID.
Report currency, such as USD, EUR, GBP, for an organization that hasMulti-Currency enabled. Value is null if the organization does nothave Multi-Currency enabled.
Stringcurrency
Unique API names for the fields that have detailed data.Array of stringsdetailColumns
Report API name.StringdeveloperName
Determines the division of records to include in the report. For example,West Coast and East Coast.
Stringdivision
Available only if your organization uses divisions to segment data andyou have the “Affected by Divisions” permission. If you do not have the“Affected by Divisions” permission, your reports include records in alldivisions.
Folder ID.StringfolderId
Note: When the report is in the My Personal Custom Reportsfolder, folderId = userId. When the report is in the Unfiled PublicReports folder, folderId = orgId.
Unique identities for each column grouping in a report. The identity is:Groupings across[]groupingsAcross
• An empty array for reports in summary format as it can’t havecolumn groupings.
• BucketField_(ID) for bucket fields.
• ID of a custom field when the custom field is used for a columngrouping.
Unique identities for each row grouping in a report. The identity is:Groupings down[]groupingsDown
• BucketField_(ID) for bucket fields.
• ID of a custom field when the custom field is used for grouping.
66
Execute AsyncReports API Resource Reference

DescriptionTypeProperty
Indicates whether to include detailed data with the summary data.BooleanhasDetailRows
Indicates whether the report shows the record count.BooleanhasRecordCount
List of historical snapshot dates.Array of stringshistoricalSnapshotDates
Unique report ID.Stringid
Display name of the report.Stringname
Logic to parse custom field filters. Value is null when filter logic isnot specified.
This is an example of a report filtered to show opportunities for accountsthat are either of customer or partner type OR their annual revenue
StringreportBooleanFilter
exceeds 100K AND they are medium or large sized businesses. Thefilters are processed by the logic, “(1 OR 2) AND 3.”
{...
"reportBooleanFilter": "(1 OR 2) AND3",
"reportFilters": [{
"value":"Analyst,Integrator,Press,Other",
"column": "TYPE","operator": "notEqual"
},{
"value": "100,000","column": "SALES","operator": "greaterThan"
},{
"value": "Small","column": "Size","operator": "notEqual"
}]
}}
List of each custom filter in the report along with the field name, filteroperator, and filter value.
Filter details[]reportFilters
Format of the report. Value can be:StringreportFormat
• TABULAR
• SUMMARY
• MATRIX
67
Execute AsyncReports API Resource Reference
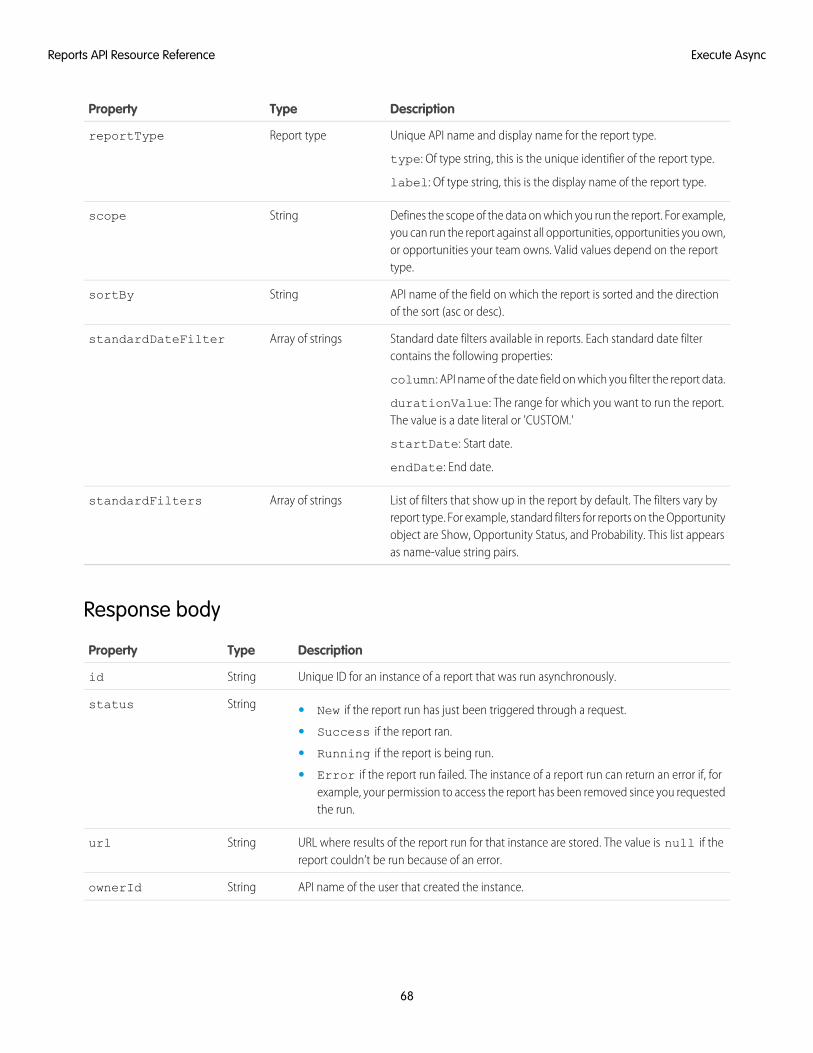
DescriptionTypeProperty
Unique API name and display name for the report type.
type: Of type string, this is the unique identifier of the report type.
Report typereportType
label: Of type string, this is the display name of the report type.
Defines the scope of the data on which you run the report. For example,you can run the report against all opportunities, opportunities you own,
Stringscope
or opportunities your team owns. Valid values depend on the reporttype.
API name of the field on which the report is sorted and the directionof the sort (asc or desc).
StringsortBy
Standard date filters available in reports. Each standard date filtercontains the following properties:
column: API name of the date field on which you filter the report data.
Array of stringsstandardDateFilter
durationValue: The range for which you want to run the report.The value is a date literal or 'CUSTOM.'
startDate: Start date.
endDate: End date.
List of filters that show up in the report by default. The filters vary byreport type. For example, standard filters for reports on the Opportunity
Array of stringsstandardFilters
object are Show, Opportunity Status, and Probability. This list appearsas name-value string pairs.
Response body
DescriptionTypeProperty
Unique ID for an instance of a report that was run asynchronously.Stringid
Stringstatus • New if the report run has just been triggered through a request.
• Success if the report ran.
• Running if the report is being run.
• Error if the report run failed. The instance of a report run can return an error if, forexample, your permission to access the report has been removed since you requestedthe run.
URL where results of the report run for that instance are stored. The value is null if thereport couldn’t be run because of an error.
Stringurl
API name of the user that created the instance.StringownerId
68
Execute AsyncReports API Resource Reference
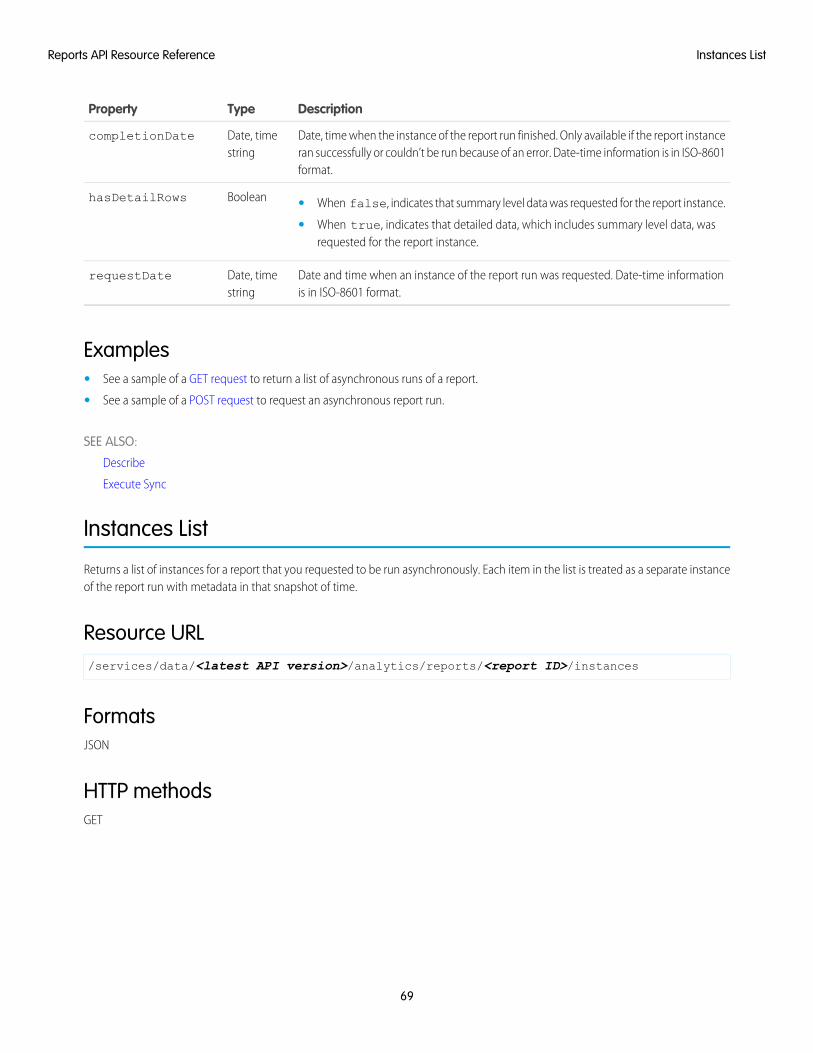
DescriptionTypeProperty
Date, time when the instance of the report run finished. Only available if the report instanceran successfully or couldn’t be run because of an error. Date-time information is in ISO-8601format.
Date, timestring
completionDate
BooleanhasDetailRows • When false, indicates that summary level data was requested for the report instance.
• When true, indicates that detailed data, which includes summary level data, wasrequested for the report instance.
Date and time when an instance of the report run was requested. Date-time informationis in ISO-8601 format.
Date, timestring
requestDate
Examples• See a sample of a GET request to return a list of asynchronous runs of a report.
• See a sample of a POST request to request an asynchronous report run.
SEE ALSO:
Describe
Execute Sync
Instances List
Returns a list of instances for a report that you requested to be run asynchronously. Each item in the list is treated as a separate instanceof the report run with metadata in that snapshot of time.
Resource URL/services/data/<latest API version>/analytics/reports/<report ID>/instances
FormatsJSON
HTTP methodsGET
69
Instances ListReports API Resource Reference
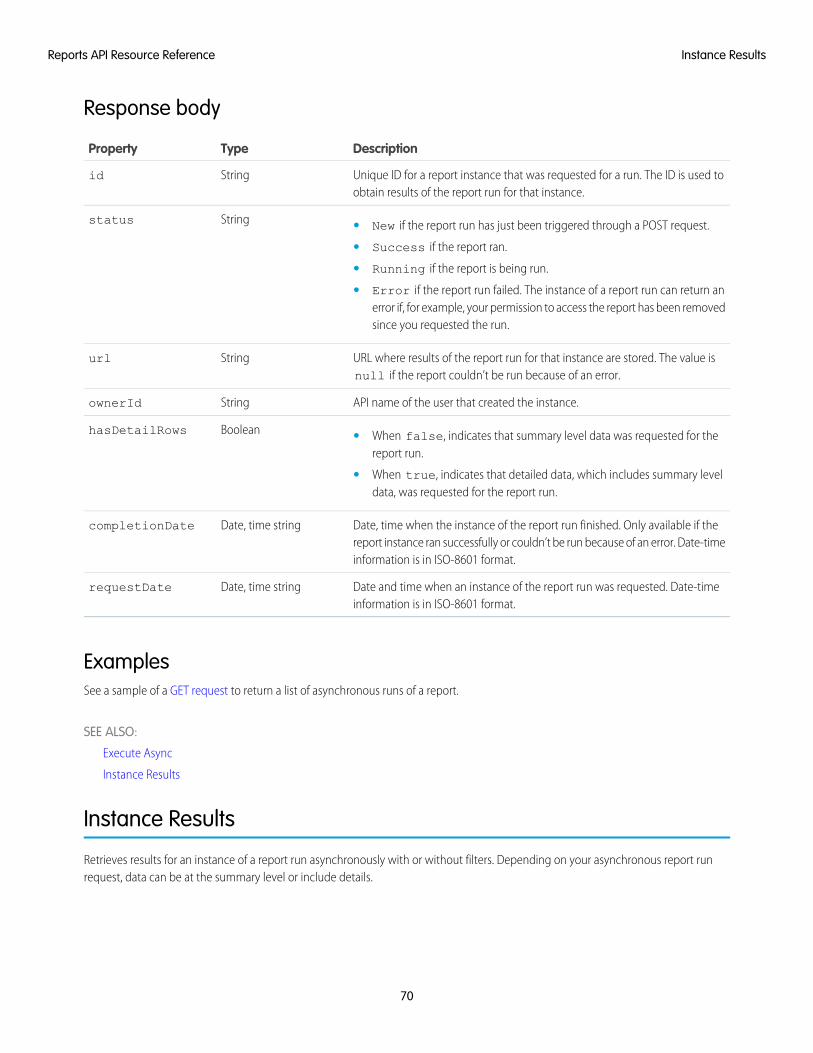
Response body
DescriptionTypeProperty
Unique ID for a report instance that was requested for a run. The ID is used toobtain results of the report run for that instance.
Stringid
Stringstatus • New if the report run has just been triggered through a POST request.
• Success if the report ran.
• Running if the report is being run.
• Error if the report run failed. The instance of a report run can return anerror if, for example, your permission to access the report has been removedsince you requested the run.
URL where results of the report run for that instance are stored. The value isnull if the report couldn’t be run because of an error.
Stringurl
API name of the user that created the instance.StringownerId
BooleanhasDetailRows • When false, indicates that summary level data was requested for thereport run.
• When true, indicates that detailed data, which includes summary leveldata, was requested for the report run.
Date, time when the instance of the report run finished. Only available if thereport instance ran successfully or couldn’t be run because of an error. Date-timeinformation is in ISO-8601 format.
Date, time stringcompletionDate
Date and time when an instance of the report run was requested. Date-timeinformation is in ISO-8601 format.
Date, time stringrequestDate
ExamplesSee a sample of a GET request to return a list of asynchronous runs of a report.
SEE ALSO:
Execute Async
Instance Results
Instance Results
Retrieves results for an instance of a report run asynchronously with or without filters. Depending on your asynchronous report runrequest, data can be at the summary level or include details.
70
Instance ResultsReports API Resource Reference
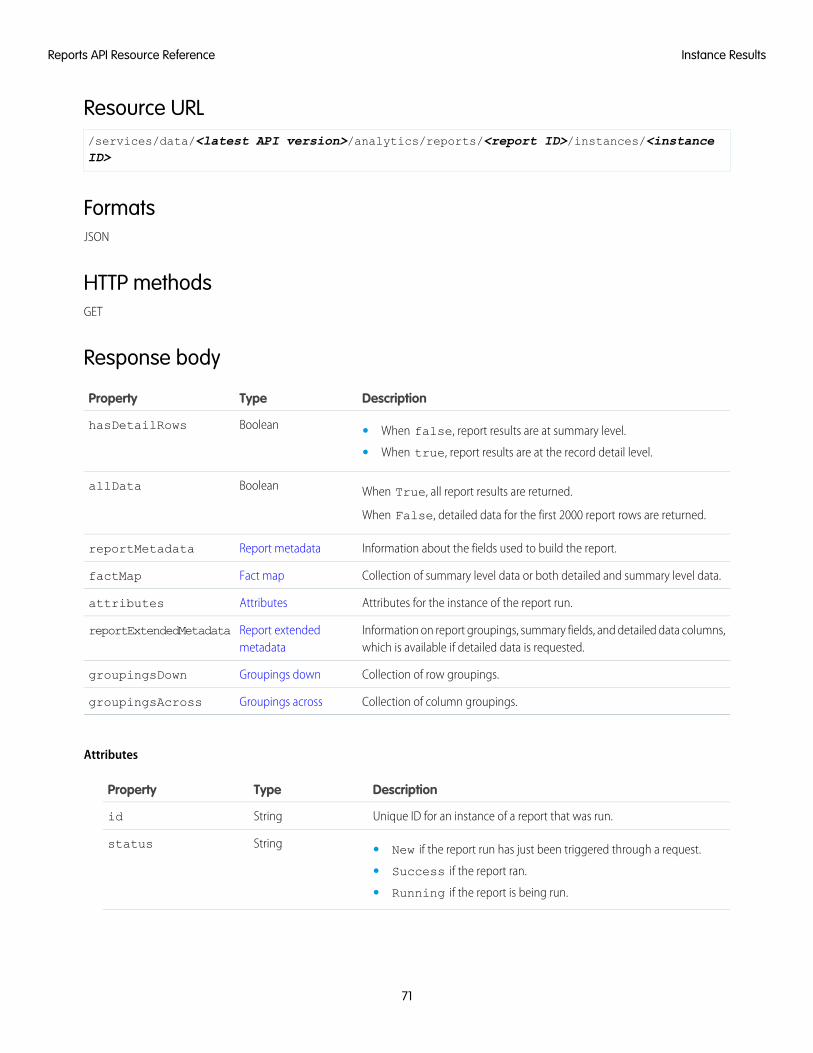
Resource URL/services/data/<latest API version>/analytics/reports/<report ID>/instances/<instanceID>
FormatsJSON
HTTP methodsGET
Response body
DescriptionTypeProperty
BooleanhasDetailRows • When false, report results are at summary level.
• When true, report results are at the record detail level.
When True, all report results are returned.BooleanallData
When False, detailed data for the first 2000 report rows are returned.
Information about the fields used to build the report.Report metadatareportMetadata
Collection of summary level data or both detailed and summary level data.Fact mapfactMap
Attributes for the instance of the report run.Attributesattributes
Information on report groupings, summary fields, and detailed data columns,which is available if detailed data is requested.
Report extendedmetadata
reportExtendedMetadata
Collection of row groupings.Groupings downgroupingsDown
Collection of column groupings.Groupings acrossgroupingsAcross
Attributes
DescriptionTypeProperty
Unique ID for an instance of a report that was run.Stringid
Stringstatus • New if the report run has just been triggered through a request.
• Success if the report ran.
• Running if the report is being run.
71
Instance ResultsReports API Resource Reference
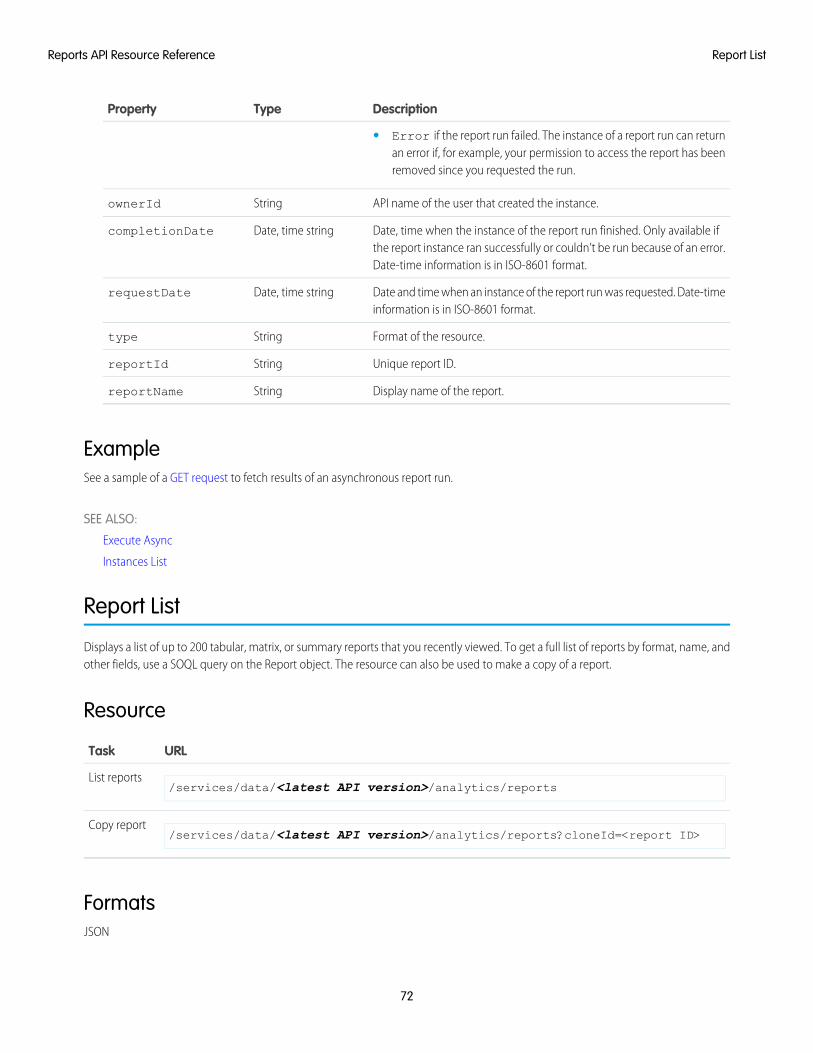
DescriptionTypeProperty
• Error if the report run failed. The instance of a report run can returnan error if, for example, your permission to access the report has beenremoved since you requested the run.
API name of the user that created the instance.StringownerId
Date, time when the instance of the report run finished. Only available ifthe report instance ran successfully or couldn’t be run because of an error.Date-time information is in ISO-8601 format.
Date, time stringcompletionDate
Date and time when an instance of the report run was requested. Date-timeinformation is in ISO-8601 format.
Date, time stringrequestDate
Format of the resource.Stringtype
Unique report ID.StringreportId
Display name of the report.StringreportName
ExampleSee a sample of a GET request to fetch results of an asynchronous report run.
SEE ALSO:
Execute Async
Instances List
Report List
Displays a list of up to 200 tabular, matrix, or summary reports that you recently viewed. To get a full list of reports by format, name, andother fields, use a SOQL query on the Report object. The resource can also be used to make a copy of a report.
Resource
URLTask
/services/data/<latest API version>/analytics/reportsList reports
/services/data/<latest API version>/analytics/reports?cloneId=<report ID>Copy report
FormatsJSON
72
Report ListReports API Resource Reference
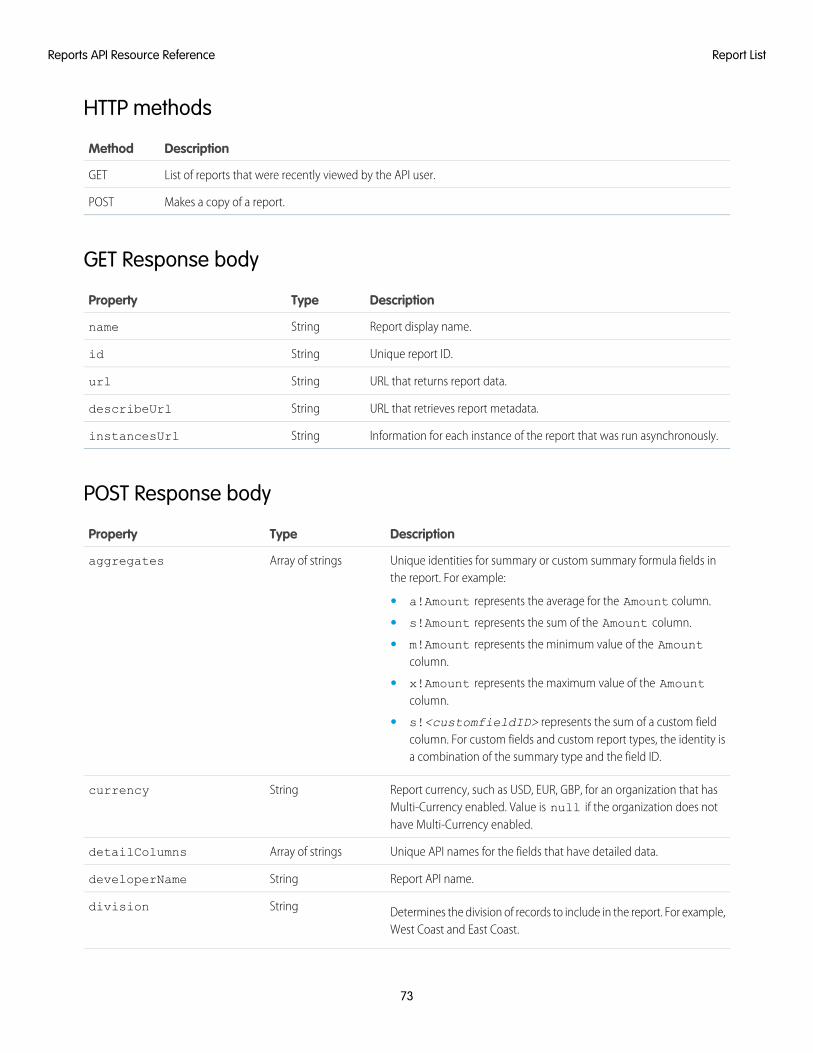
HTTP methods
DescriptionMethod
List of reports that were recently viewed by the API user.GET
Makes a copy of a report.POST
GET Response body
DescriptionTypeProperty
Report display name.Stringname
Unique report ID.Stringid
URL that returns report data.Stringurl
URL that retrieves report metadata.StringdescribeUrl
Information for each instance of the report that was run asynchronously.StringinstancesUrl
POST Response body
DescriptionTypeProperty
Unique identities for summary or custom summary formula fields inthe report. For example:
Array of stringsaggregates
• a!Amount represents the average for the Amount column.
• s!Amount represents the sum of the Amount column.
• m!Amount represents the minimum value of the Amountcolumn.
• x!Amount represents the maximum value of the Amountcolumn.
• s!<customfieldID> represents the sum of a custom fieldcolumn. For custom fields and custom report types, the identity isa combination of the summary type and the field ID.
Report currency, such as USD, EUR, GBP, for an organization that hasMulti-Currency enabled. Value is null if the organization does nothave Multi-Currency enabled.
Stringcurrency
Unique API names for the fields that have detailed data.Array of stringsdetailColumns
Report API name.StringdeveloperName
Determines the division of records to include in the report. For example,West Coast and East Coast.
Stringdivision
73
Report ListReports API Resource Reference
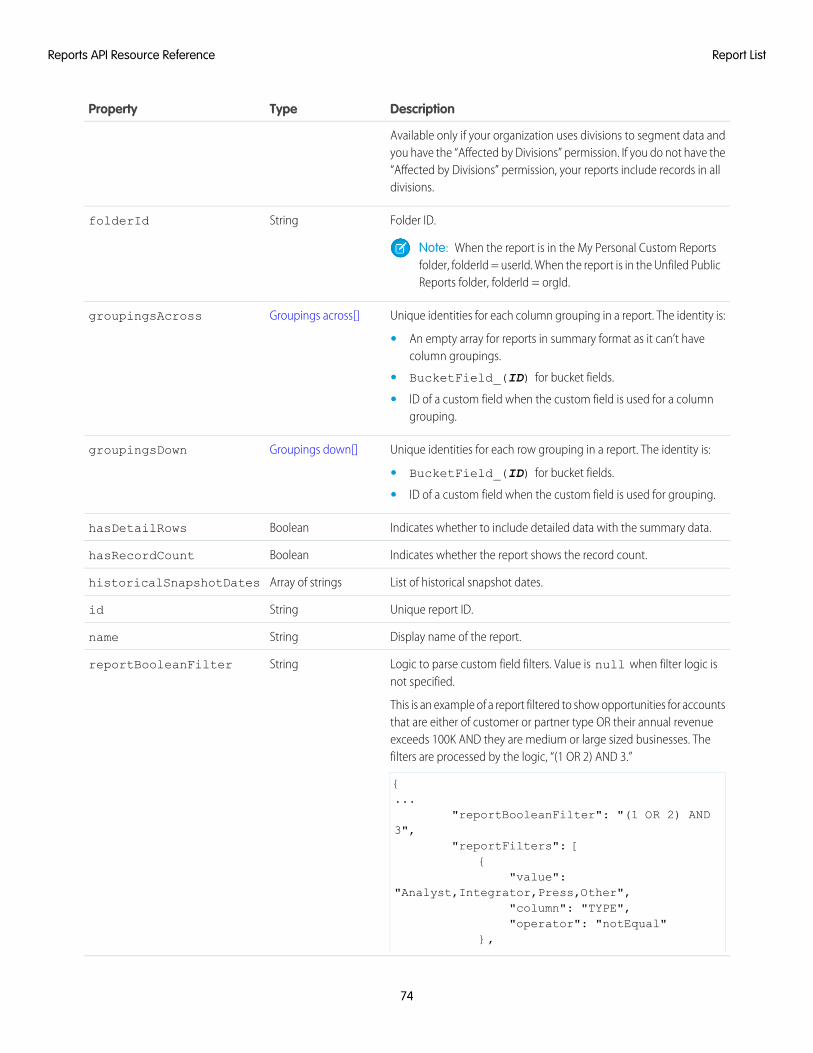
DescriptionTypeProperty
Available only if your organization uses divisions to segment data andyou have the “Affected by Divisions” permission. If you do not have the“Affected by Divisions” permission, your reports include records in alldivisions.
Folder ID.StringfolderId
Note: When the report is in the My Personal Custom Reportsfolder, folderId = userId. When the report is in the Unfiled PublicReports folder, folderId = orgId.
Unique identities for each column grouping in a report. The identity is:Groupings across[]groupingsAcross
• An empty array for reports in summary format as it can’t havecolumn groupings.
• BucketField_(ID) for bucket fields.
• ID of a custom field when the custom field is used for a columngrouping.
Unique identities for each row grouping in a report. The identity is:Groupings down[]groupingsDown
• BucketField_(ID) for bucket fields.
• ID of a custom field when the custom field is used for grouping.
Indicates whether to include detailed data with the summary data.BooleanhasDetailRows
Indicates whether the report shows the record count.BooleanhasRecordCount
List of historical snapshot dates.Array of stringshistoricalSnapshotDates
Unique report ID.Stringid
Display name of the report.Stringname
Logic to parse custom field filters. Value is null when filter logic isnot specified.
This is an example of a report filtered to show opportunities for accountsthat are either of customer or partner type OR their annual revenue
StringreportBooleanFilter
exceeds 100K AND they are medium or large sized businesses. Thefilters are processed by the logic, “(1 OR 2) AND 3.”
{...
"reportBooleanFilter": "(1 OR 2) AND3",
"reportFilters": [{
"value":"Analyst,Integrator,Press,Other",
"column": "TYPE","operator": "notEqual"
},
74
Report ListReports API Resource Reference
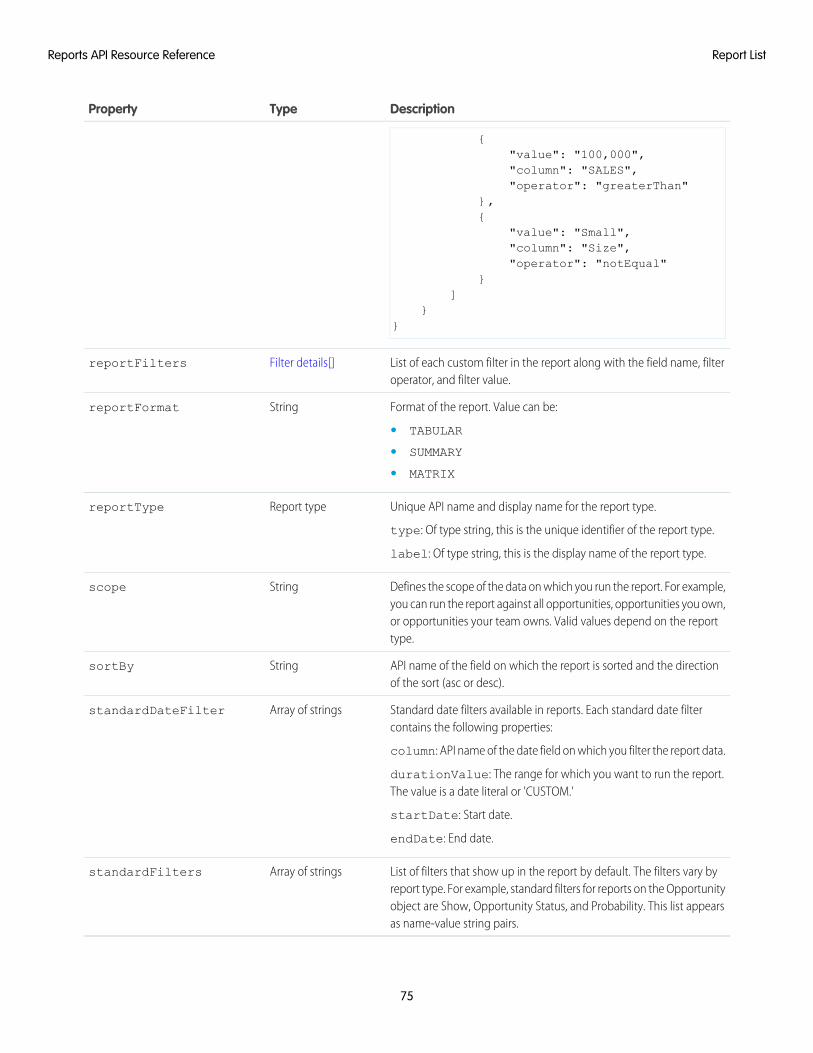
DescriptionTypeProperty
{"value": "100,000","column": "SALES","operator": "greaterThan"
},{
"value": "Small","column": "Size","operator": "notEqual"
}]
}}
List of each custom filter in the report along with the field name, filteroperator, and filter value.
Filter details[]reportFilters
Format of the report. Value can be:StringreportFormat
• TABULAR
• SUMMARY
• MATRIX
Unique API name and display name for the report type.
type: Of type string, this is the unique identifier of the report type.
Report typereportType
label: Of type string, this is the display name of the report type.
Defines the scope of the data on which you run the report. For example,you can run the report against all opportunities, opportunities you own,
Stringscope
or opportunities your team owns. Valid values depend on the reporttype.
API name of the field on which the report is sorted and the directionof the sort (asc or desc).
StringsortBy
Standard date filters available in reports. Each standard date filtercontains the following properties:
column: API name of the date field on which you filter the report data.
Array of stringsstandardDateFilter
durationValue: The range for which you want to run the report.The value is a date literal or 'CUSTOM.'
startDate: Start date.
endDate: End date.
List of filters that show up in the report by default. The filters vary byreport type. For example, standard filters for reports on the Opportunity
Array of stringsstandardFilters
object are Show, Opportunity Status, and Probability. This list appearsas name-value string pairs.
75
Report ListReports API Resource Reference
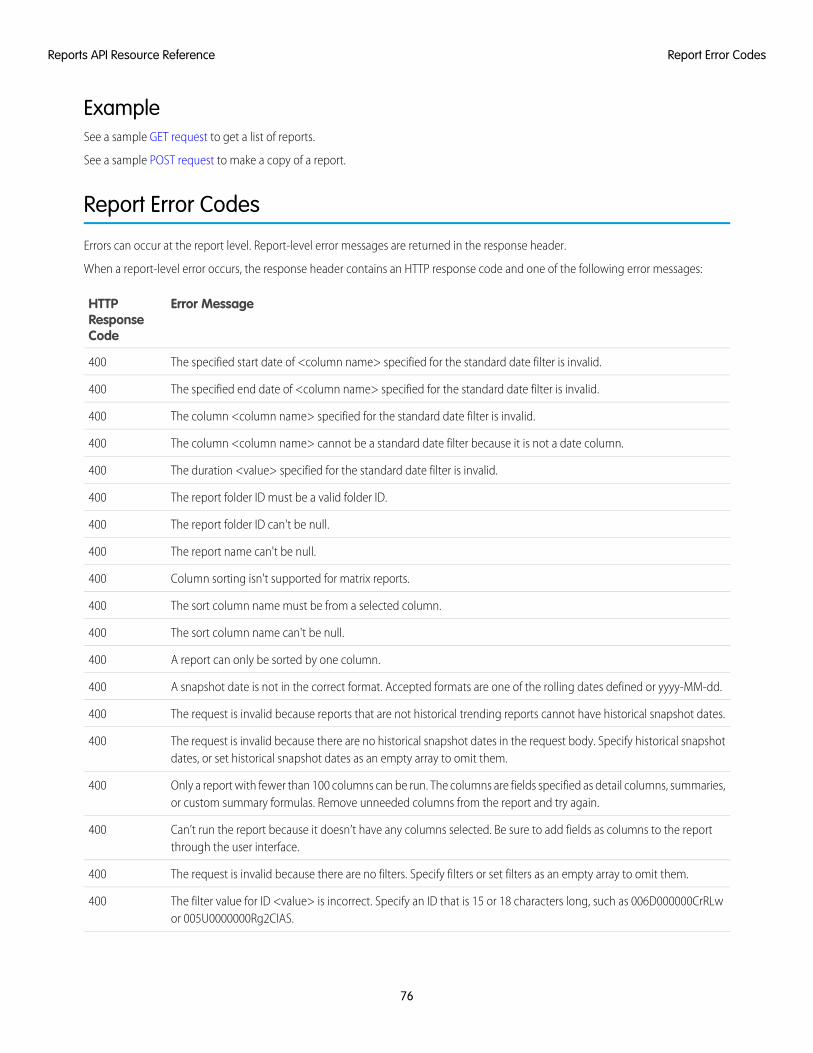
ExampleSee a sample GET request to get a list of reports.
See a sample POST request to make a copy of a report.
Report Error Codes
Errors can occur at the report level. Report-level error messages are returned in the response header.
When a report-level error occurs, the response header contains an HTTP response code and one of the following error messages:
Error MessageHTTPResponseCode
The specified start date of <column name> specified for the standard date filter is invalid.400
The specified end date of <column name> specified for the standard date filter is invalid.400
The column <column name> specified for the standard date filter is invalid.400
The column <column name> cannot be a standard date filter because it is not a date column.400
The duration <value> specified for the standard date filter is invalid.400
The report folder ID must be a valid folder ID.400
The report folder ID can't be null.400
The report name can't be null.400
Column sorting isn't supported for matrix reports.400
The sort column name must be from a selected column.400
The sort column name can't be null.400
A report can only be sorted by one column.400
A snapshot date is not in the correct format. Accepted formats are one of the rolling dates defined or yyyy-MM-dd.400
The request is invalid because reports that are not historical trending reports cannot have historical snapshot dates.400
The request is invalid because there are no historical snapshot dates in the request body. Specify historical snapshotdates, or set historical snapshot dates as an empty array to omit them.
400
Only a report with fewer than 100 columns can be run. The columns are fields specified as detail columns, summaries,or custom summary formulas. Remove unneeded columns from the report and try again.
400
Can’t run the report because it doesn’t have any columns selected. Be sure to add fields as columns to the reportthrough the user interface.
400
The request is invalid because there are no filters. Specify filters or set filters as an empty array to omit them.400
The filter value for ID <value> is incorrect. Specify an ID that is 15 or 18 characters long, such as 006D000000CrRLwor 005U0000000Rg2CIAS.
400
76
Report Error CodesReports API Resource Reference
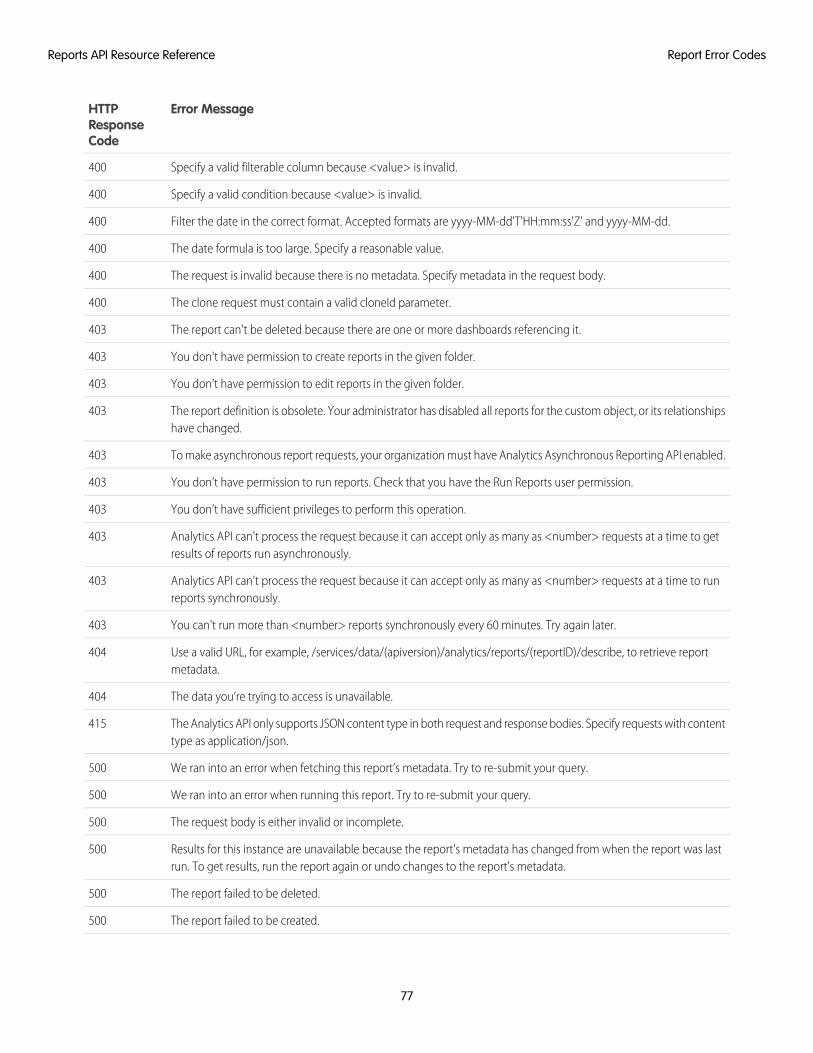
Error MessageHTTPResponseCode
Specify a valid filterable column because <value> is invalid.400
Specify a valid condition because <value> is invalid.400
Filter the date in the correct format. Accepted formats are yyyy-MM-dd'T'HH:mm:ss'Z' and yyyy-MM-dd.400
The date formula is too large. Specify a reasonable value.400
The request is invalid because there is no metadata. Specify metadata in the request body.400
The clone request must contain a valid cloneId parameter.400
The report can't be deleted because there are one or more dashboards referencing it.403
You don't have permission to create reports in the given folder.403
You don’t have permission to edit reports in the given folder.403
The report definition is obsolete. Your administrator has disabled all reports for the custom object, or its relationshipshave changed.
403
To make asynchronous report requests, your organization must have Analytics Asynchronous Reporting API enabled.403
You don’t have permission to run reports. Check that you have the Run Reports user permission.403
You don’t have sufficient privileges to perform this operation.403
Analytics API can't process the request because it can accept only as many as <number> requests at a time to getresults of reports run asynchronously.
403
Analytics API can't process the request because it can accept only as many as <number> requests at a time to runreports synchronously.
403
You can't run more than <number> reports synchronously every 60 minutes. Try again later.403
Use a valid URL, for example, /services/data/(apiversion)/analytics/reports/(reportID)/describe, to retrieve reportmetadata.
404
The data you’re trying to access is unavailable.404
The Analytics API only supports JSON content type in both request and response bodies. Specify requests with contenttype as application/json.
415
We ran into an error when fetching this report’s metadata. Try to re-submit your query.500
We ran into an error when running this report. Try to re-submit your query.500
The request body is either invalid or incomplete.500
Results for this instance are unavailable because the report's metadata has changed from when the report was lastrun. To get results, run the report again or undo changes to the report's metadata.
500
The report failed to be deleted.500
The report failed to be created.500
77
Report Error CodesReports API Resource Reference
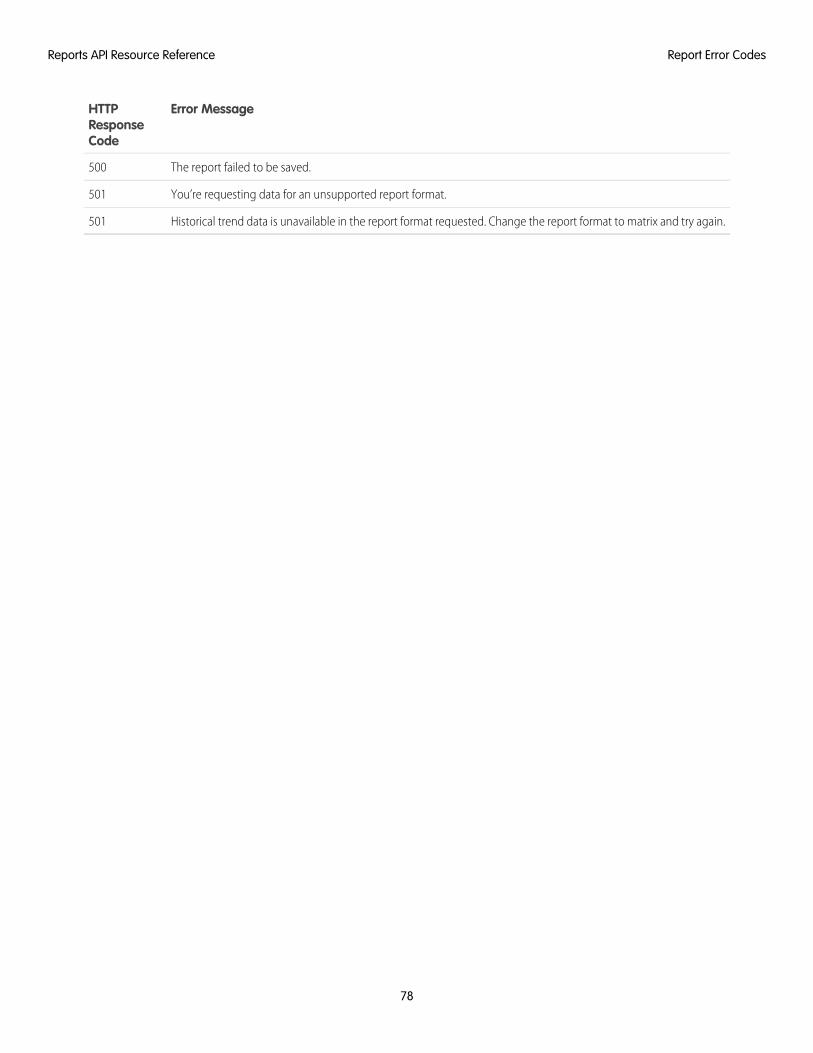
Error MessageHTTPResponseCode
The report failed to be saved.500
You’re requesting data for an unsupported report format.501
Historical trend data is unavailable in the report format requested. Change the report format to matrix and try again.501
78
Report Error CodesReports API Resource Reference
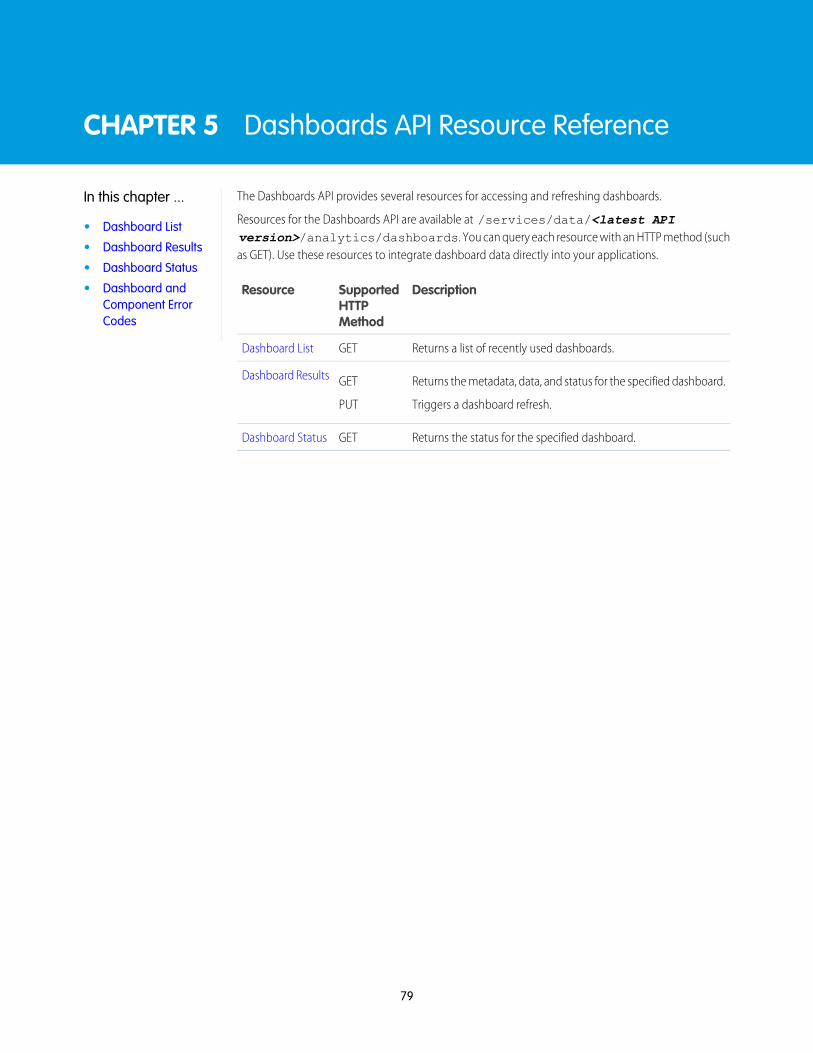
CHAPTER 5 Dashboards API Resource Reference
The Dashboards API provides several resources for accessing and refreshing dashboards.In this chapter ...Resources for the Dashboards API are available at /services/data/<latest APIversion>/analytics/dashboards. You can query each resource with an HTTP method (suchas GET). Use these resources to integrate dashboard data directly into your applications.
• Dashboard List
• Dashboard Results
• Dashboard Status
DescriptionSupportedHTTPMethod
Resource• Dashboard andComponent ErrorCodes
Returns a list of recently used dashboards.GETDashboard List
Returns the metadata, data, and status for the specified dashboard.GETDashboard Results
Triggers a dashboard refresh.PUT
Returns the status for the specified dashboard.GETDashboard Status
79
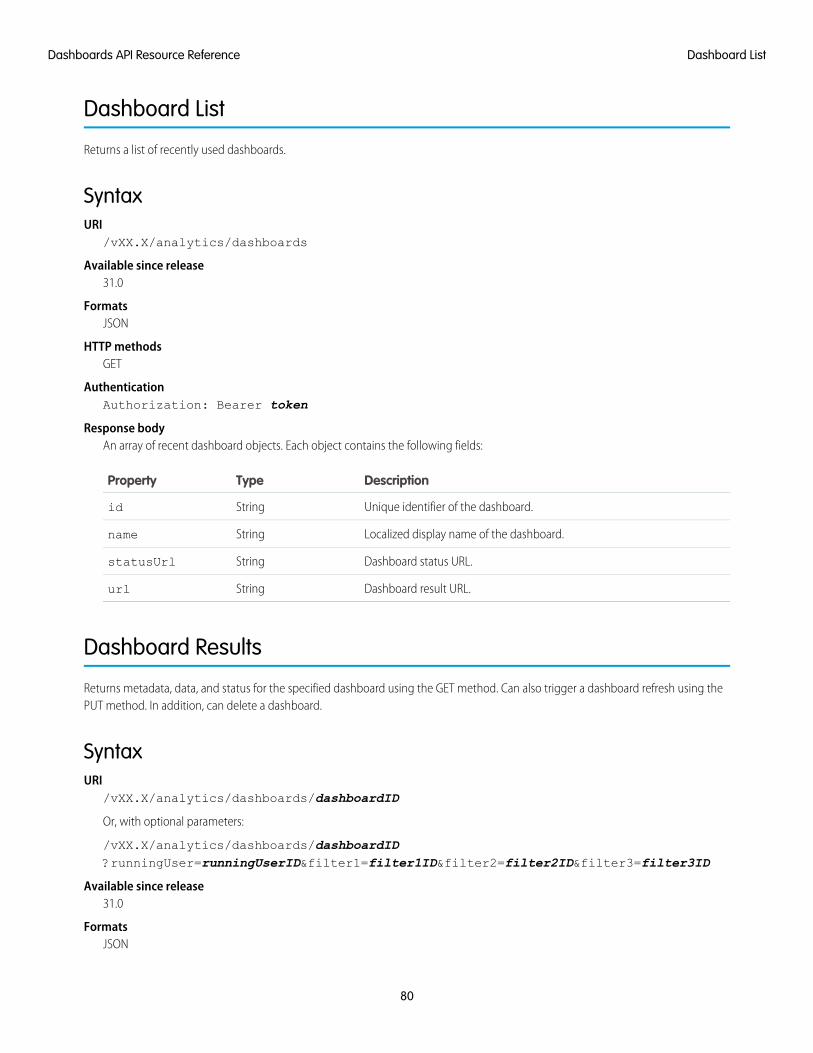
Dashboard List
Returns a list of recently used dashboards.
SyntaxURI
/vXX.X/analytics/dashboards
Available since release31.0
FormatsJSON
HTTP methodsGET
AuthenticationAuthorization: Bearer token
Response bodyAn array of recent dashboard objects. Each object contains the following fields:
DescriptionTypeProperty
Unique identifier of the dashboard.Stringid
Localized display name of the dashboard.Stringname
Dashboard status URL.StringstatusUrl
Dashboard result URL.Stringurl
Dashboard Results
Returns metadata, data, and status for the specified dashboard using the GET method. Can also trigger a dashboard refresh using thePUT method. In addition, can delete a dashboard.
SyntaxURI
/vXX.X/analytics/dashboards/dashboardID
Or, with optional parameters:
/vXX.X/analytics/dashboards/dashboardID?runningUser=runningUserID&filter1=filter1ID&filter2=filter2ID&filter3=filter3ID
Available since release31.0
FormatsJSON
80
Dashboard ListDashboards API Resource Reference
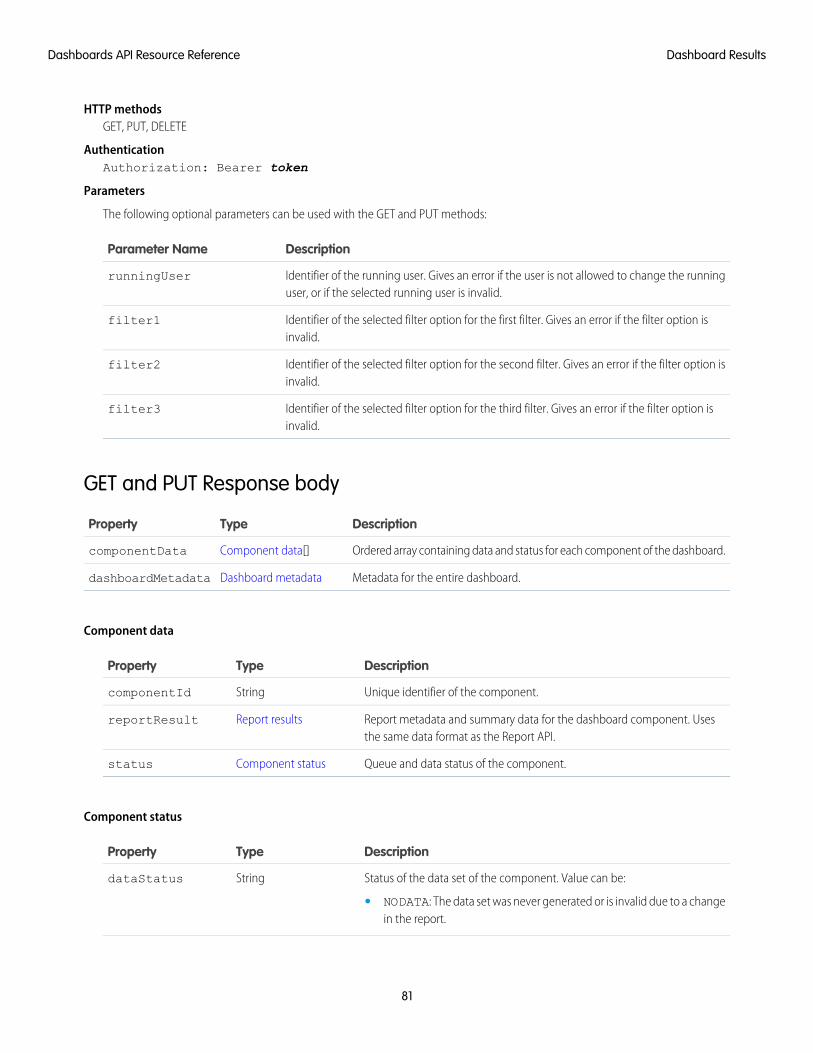
HTTP methodsGET, PUT, DELETE
AuthenticationAuthorization: Bearer token
Parameters
The following optional parameters can be used with the GET and PUT methods:
DescriptionParameter Name
Identifier of the running user. Gives an error if the user is not allowed to change the runninguser, or if the selected running user is invalid.
runningUser
Identifier of the selected filter option for the first filter. Gives an error if the filter option isinvalid.
filter1
Identifier of the selected filter option for the second filter. Gives an error if the filter option isinvalid.
filter2
Identifier of the selected filter option for the third filter. Gives an error if the filter option isinvalid.
filter3
GET and PUT Response body
DescriptionTypeProperty
Ordered array containing data and status for each component of the dashboard.Component data[]componentData
Metadata for the entire dashboard.Dashboard metadatadashboardMetadata
Component data
DescriptionTypeProperty
Unique identifier of the component.StringcomponentId
Report metadata and summary data for the dashboard component. Usesthe same data format as the Report API.
Report resultsreportResult
Queue and data status of the component.Component statusstatus
Component status
DescriptionTypeProperty
Status of the data set of the component. Value can be:StringdataStatus
• NODATA: The data set was never generated or is invalid due to a changein the report.
81
Dashboard ResultsDashboards API Resource Reference
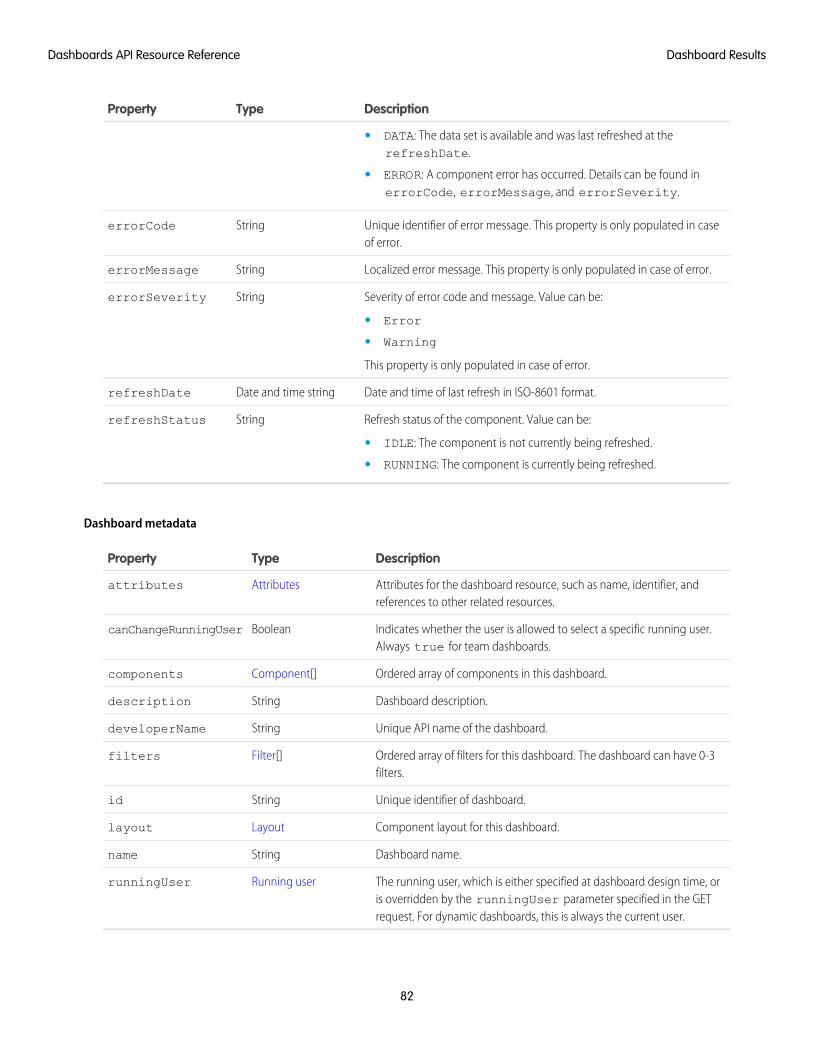
DescriptionTypeProperty
• DATA: The data set is available and was last refreshed at therefreshDate.
• ERROR: A component error has occurred. Details can be found inerrorCode, errorMessage, and errorSeverity.
Unique identifier of error message. This property is only populated in caseof error.
StringerrorCode
Localized error message. This property is only populated in case of error.StringerrorMessage
Severity of error code and message. Value can be:StringerrorSeverity
• Error
• Warning
This property is only populated in case of error.
Date and time of last refresh in ISO-8601 format.Date and time stringrefreshDate
Refresh status of the component. Value can be:StringrefreshStatus
• IDLE: The component is not currently being refreshed.
• RUNNING: The component is currently being refreshed.
Dashboard metadata
DescriptionTypeProperty
Attributes for the dashboard resource, such as name, identifier, andreferences to other related resources.
Attributesattributes
Indicates whether the user is allowed to select a specific running user.Always true for team dashboards.
BooleancanChangeRunningUser
Ordered array of components in this dashboard.Component[]components
Dashboard description.Stringdescription
Unique API name of the dashboard.StringdeveloperName
Ordered array of filters for this dashboard. The dashboard can have 0-3filters.
Filter[]filters
Unique identifier of dashboard.Stringid
Component layout for this dashboard.Layoutlayout
Dashboard name.Stringname
The running user, which is either specified at dashboard design time, oris overridden by the runningUser parameter specified in the GETrequest. For dynamic dashboards, this is always the current user.
Running userrunningUser
82
Dashboard ResultsDashboards API Resource Reference
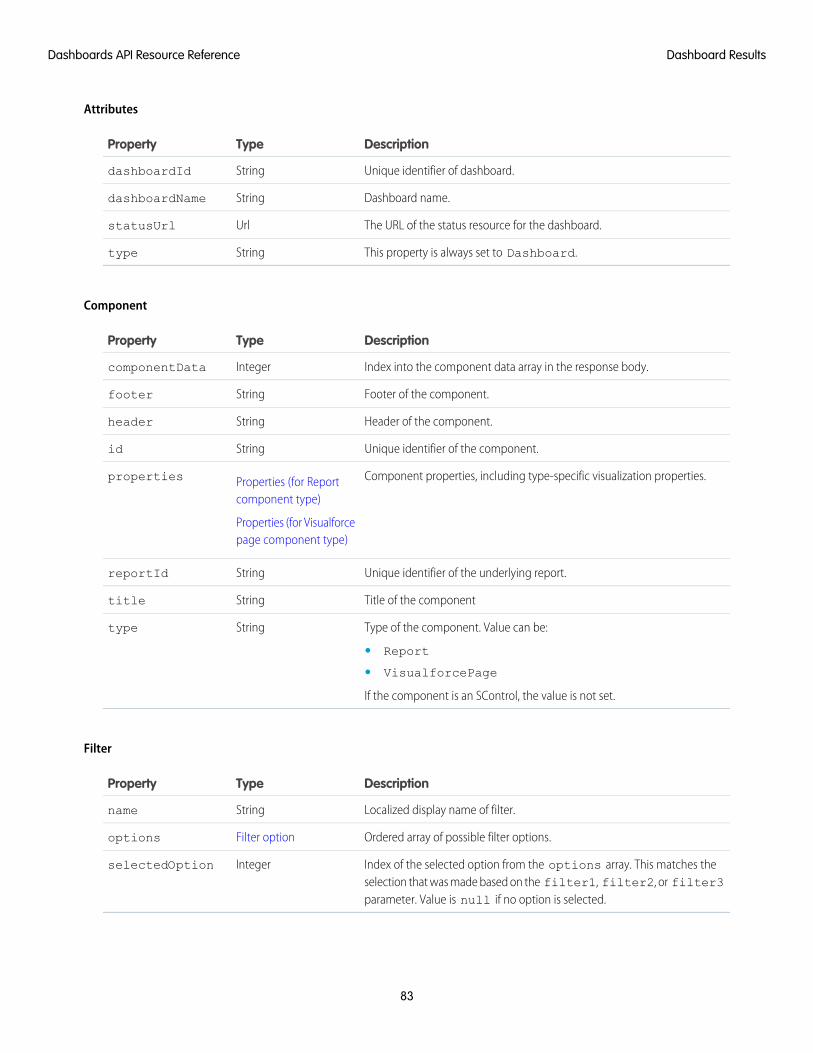
Attributes
DescriptionTypeProperty
Unique identifier of dashboard.StringdashboardId
Dashboard name.StringdashboardName
The URL of the status resource for the dashboard.UrlstatusUrl
This property is always set to Dashboard.Stringtype
Component
DescriptionTypeProperty
Index into the component data array in the response body.IntegercomponentData
Footer of the component.Stringfooter
Header of the component.Stringheader
Unique identifier of the component.Stringid
Component properties, including type-specific visualization properties.Properties (for Reportcomponent type)
properties
Properties (for Visualforcepage component type)
Unique identifier of the underlying report.StringreportId
Title of the componentStringtitle
Type of the component. Value can be:Stringtype
• Report
• VisualforcePage
If the component is an SControl, the value is not set.
Filter
DescriptionTypeProperty
Localized display name of filter.Stringname
Ordered array of possible filter options.Filter optionoptions
Index of the selected option from the options array. This matches theselection that was made based on the filter1, filter2, or filter3parameter. Value is null if no option is selected.
IntegerselectedOption
83
Dashboard ResultsDashboards API Resource Reference
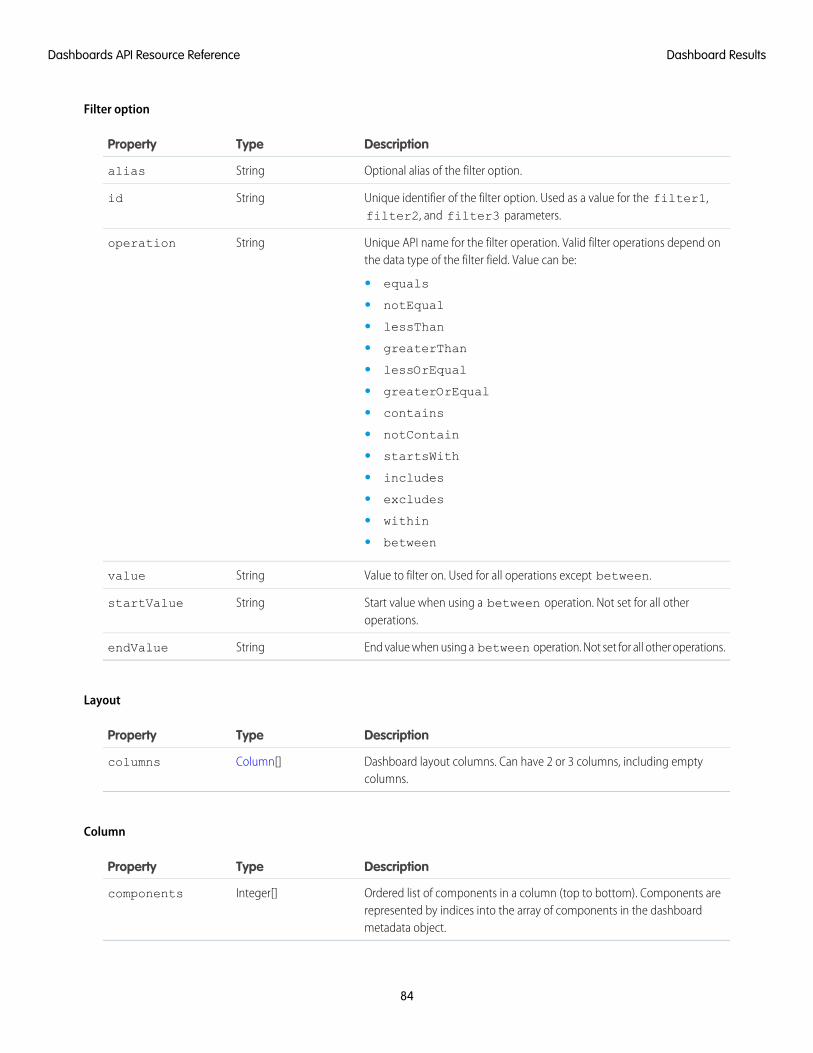
Filter option
DescriptionTypeProperty
Optional alias of the filter option.Stringalias
Unique identifier of the filter option. Used as a value for the filter1,filter2, and filter3 parameters.
Stringid
Unique API name for the filter operation. Valid filter operations depend onthe data type of the filter field. Value can be:
Stringoperation
• equals
• notEqual
• lessThan
• greaterThan
• lessOrEqual
• greaterOrEqual
• contains
• notContain
• startsWith
• includes
• excludes
• within
• between
Value to filter on. Used for all operations except between.Stringvalue
Start value when using a between operation. Not set for all otheroperations.
StringstartValue
End value when using a between operation. Not set for all other operations.StringendValue
Layout
DescriptionTypeProperty
Dashboard layout columns. Can have 2 or 3 columns, including emptycolumns.
Column[]columns
Column
DescriptionTypeProperty
Ordered list of components in a column (top to bottom). Components arerepresented by indices into the array of components in the dashboardmetadata object.
Integer[]components
84
Dashboard ResultsDashboards API Resource Reference
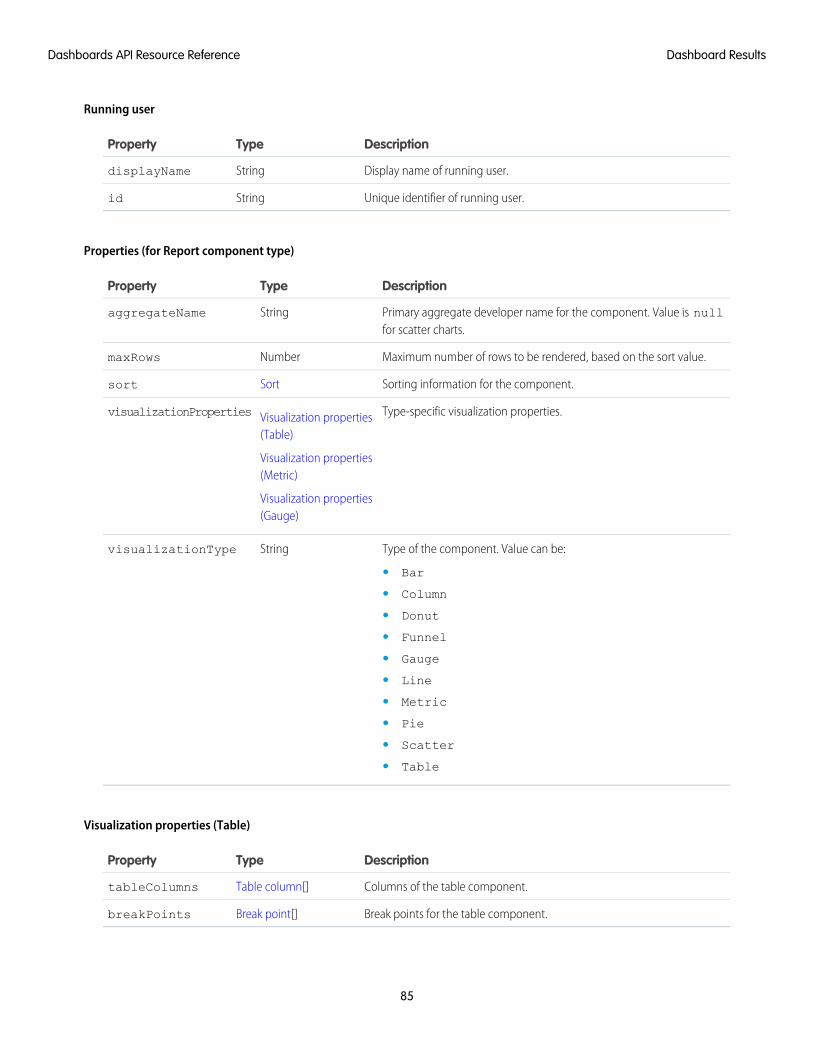
Running user
DescriptionTypeProperty
Display name of running user.StringdisplayName
Unique identifier of running user.Stringid
Properties (for Report component type)
DescriptionTypeProperty
Primary aggregate developer name for the component. Value is nullfor scatter charts.
StringaggregateName
Maximum number of rows to be rendered, based on the sort value.NumbermaxRows
Sorting information for the component.Sortsort
Type-specific visualization properties.Visualization properties(Table)
visualizationProperties
Visualization properties(Metric)
Visualization properties(Gauge)
Type of the component. Value can be:StringvisualizationType
• Bar
• Column
• Donut
• Funnel
• Gauge
• Line
• Metric
• Pie
• Scatter
• Table
Visualization properties (Table)
DescriptionTypeProperty
Columns of the table component.Table column[]tableColumns
Break points for the table component.Break point[]breakPoints
85
Dashboard ResultsDashboards API Resource Reference
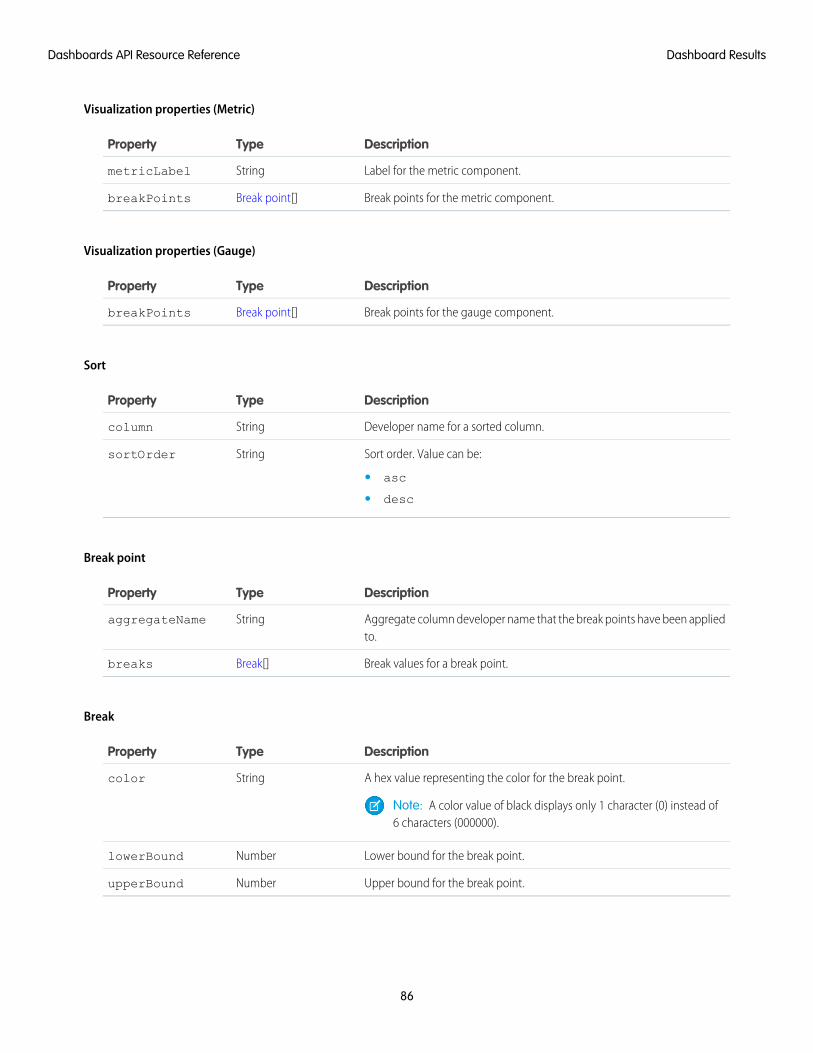
Visualization properties (Metric)
DescriptionTypeProperty
Label for the metric component.StringmetricLabel
Break points for the metric component.Break point[]breakPoints
Visualization properties (Gauge)
DescriptionTypeProperty
Break points for the gauge component.Break point[]breakPoints
Sort
DescriptionTypeProperty
Developer name for a sorted column.Stringcolumn
Sort order. Value can be:StringsortOrder
• asc
• desc
Break point
DescriptionTypeProperty
Aggregate column developer name that the break points have been appliedto.
StringaggregateName
Break values for a break point.Break[]breaks
Break
DescriptionTypeProperty
A hex value representing the color for the break point.Stringcolor
Note: A color value of black displays only 1 character (0) instead of6 characters (000000).
Lower bound for the break point.NumberlowerBound
Upper bound for the break point.NumberupperBound
86
Dashboard ResultsDashboards API Resource Reference
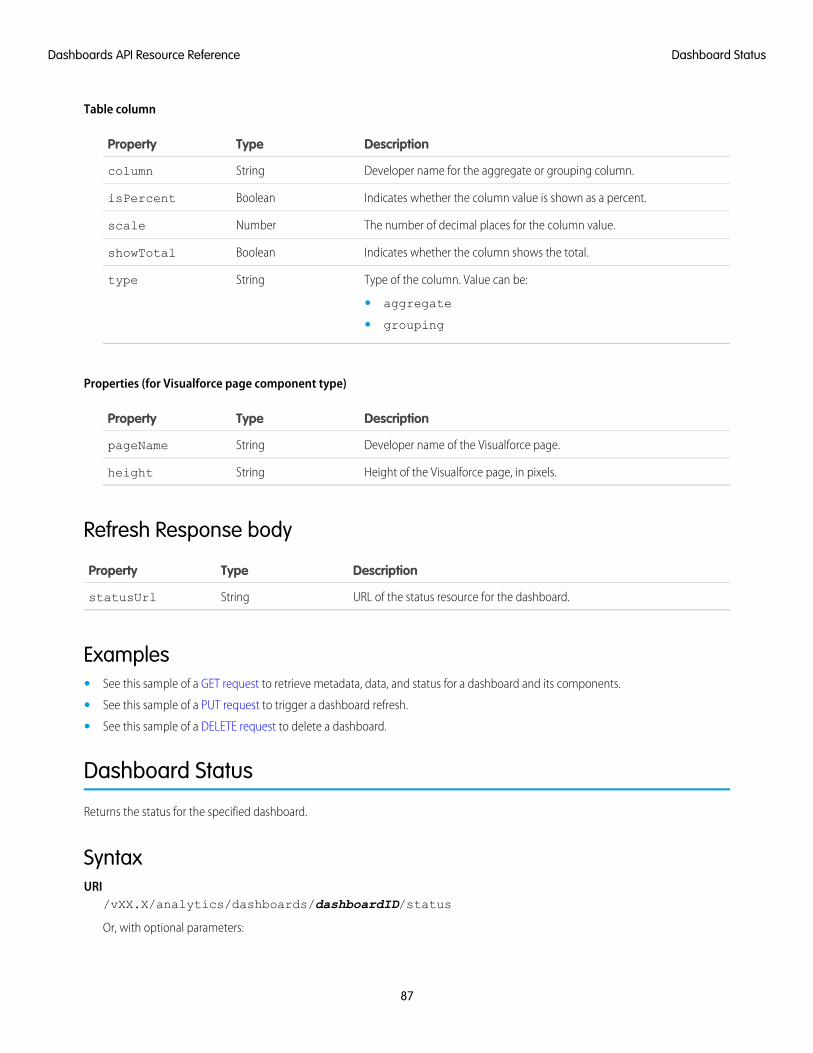
Table column
DescriptionTypeProperty
Developer name for the aggregate or grouping column.Stringcolumn
Indicates whether the column value is shown as a percent.BooleanisPercent
The number of decimal places for the column value.Numberscale
Indicates whether the column shows the total.BooleanshowTotal
Type of the column. Value can be:Stringtype
• aggregate
• grouping
Properties (for Visualforce page component type)
DescriptionTypeProperty
Developer name of the Visualforce page.StringpageName
Height of the Visualforce page, in pixels.Stringheight
Refresh Response body
DescriptionTypeProperty
URL of the status resource for the dashboard.StringstatusUrl
Examples• See this sample of a GET request to retrieve metadata, data, and status for a dashboard and its components.
• See this sample of a PUT request to trigger a dashboard refresh.
• See this sample of a DELETE request to delete a dashboard.
Dashboard Status
Returns the status for the specified dashboard.
SyntaxURI
/vXX.X/analytics/dashboards/dashboardID/status
Or, with optional parameters:
87
Dashboard StatusDashboards API Resource Reference
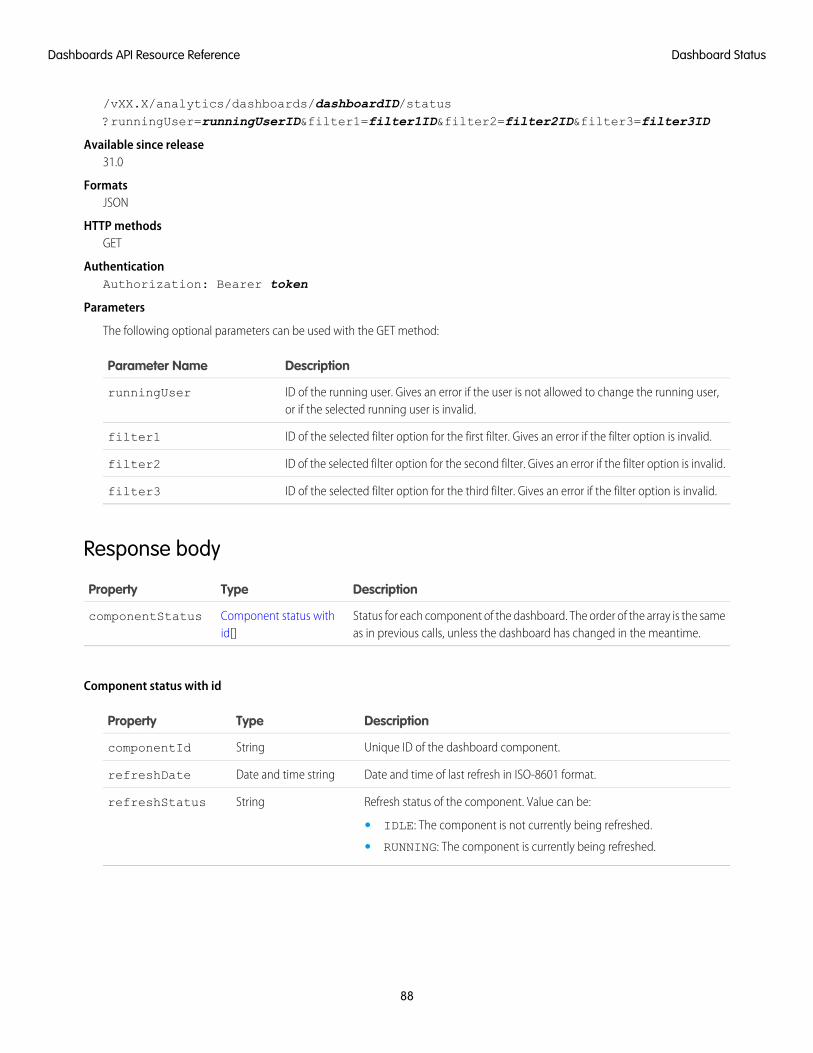
/vXX.X/analytics/dashboards/dashboardID/status?runningUser=runningUserID&filter1=filter1ID&filter2=filter2ID&filter3=filter3ID
Available since release31.0
FormatsJSON
HTTP methodsGET
AuthenticationAuthorization: Bearer token
Parameters
The following optional parameters can be used with the GET method:
DescriptionParameter Name
ID of the running user. Gives an error if the user is not allowed to change the running user,or if the selected running user is invalid.
runningUser
ID of the selected filter option for the first filter. Gives an error if the filter option is invalid.filter1
ID of the selected filter option for the second filter. Gives an error if the filter option is invalid.filter2
ID of the selected filter option for the third filter. Gives an error if the filter option is invalid.filter3
Response body
DescriptionTypeProperty
Status for each component of the dashboard. The order of the array is the sameas in previous calls, unless the dashboard has changed in the meantime.
Component status withid[]
componentStatus
Component status with id
DescriptionTypeProperty
Unique ID of the dashboard component.StringcomponentId
Date and time of last refresh in ISO-8601 format.Date and time stringrefreshDate
Refresh status of the component. Value can be:StringrefreshStatus
• IDLE: The component is not currently being refreshed.
• RUNNING: The component is currently being refreshed.
88
Dashboard StatusDashboards API Resource Reference
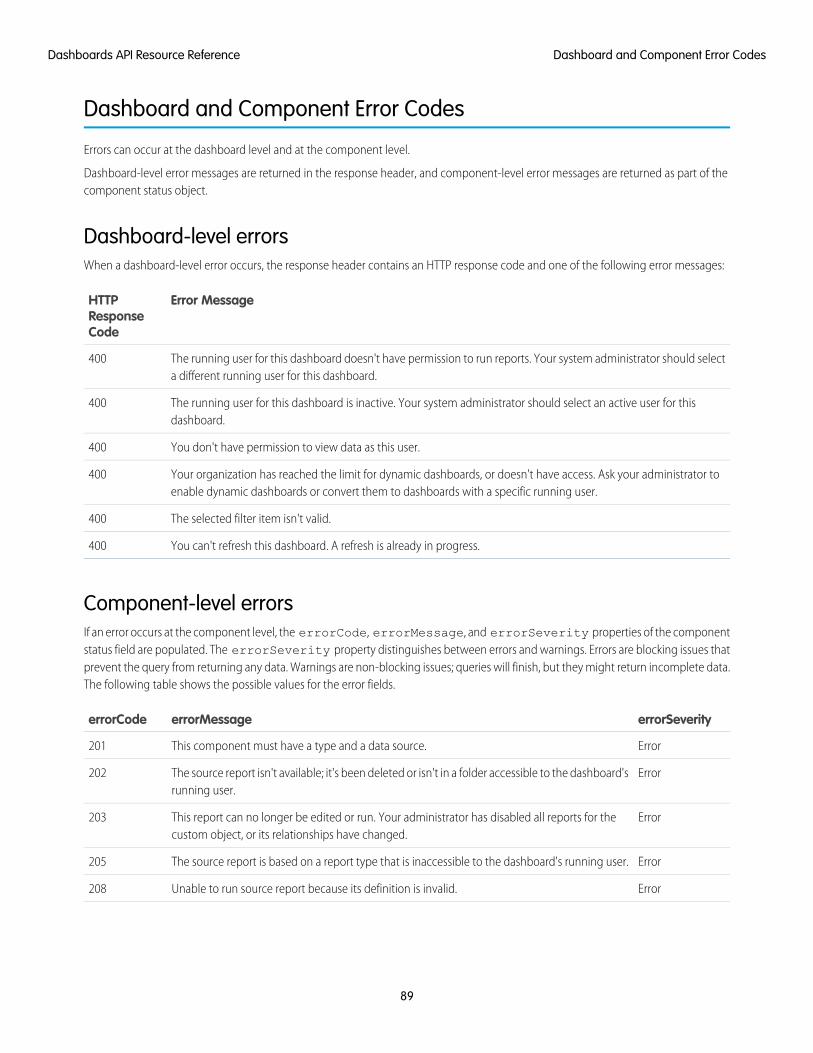
Dashboard and Component Error Codes
Errors can occur at the dashboard level and at the component level.
Dashboard-level error messages are returned in the response header, and component-level error messages are returned as part of thecomponent status object.
Dashboard-level errorsWhen a dashboard-level error occurs, the response header contains an HTTP response code and one of the following error messages:
Error MessageHTTPResponseCode
The running user for this dashboard doesn't have permission to run reports. Your system administrator should selecta different running user for this dashboard.
400
The running user for this dashboard is inactive. Your system administrator should select an active user for thisdashboard.
400
You don't have permission to view data as this user.400
Your organization has reached the limit for dynamic dashboards, or doesn't have access. Ask your administrator toenable dynamic dashboards or convert them to dashboards with a specific running user.
400
The selected filter item isn't valid.400
You can't refresh this dashboard. A refresh is already in progress.400
Component-level errorsIf an error occurs at the component level, the errorCode, errorMessage, and errorSeverity properties of the componentstatus field are populated. The errorSeverity property distinguishes between errors and warnings. Errors are blocking issues thatprevent the query from returning any data. Warnings are non-blocking issues; queries will finish, but they might return incomplete data.The following table shows the possible values for the error fields.
errorSeverityerrorMessageerrorCode
ErrorThis component must have a type and a data source.201
ErrorThe source report isn't available; it's been deleted or isn't in a folder accessible to the dashboard'srunning user.
202
ErrorThis report can no longer be edited or run. Your administrator has disabled all reports for thecustom object, or its relationships have changed.
203
ErrorThe source report is based on a report type that is inaccessible to the dashboard's running user.205
ErrorUnable to run source report because its definition is invalid.208
89
Dashboard and Component Error CodesDashboards API Resource Reference
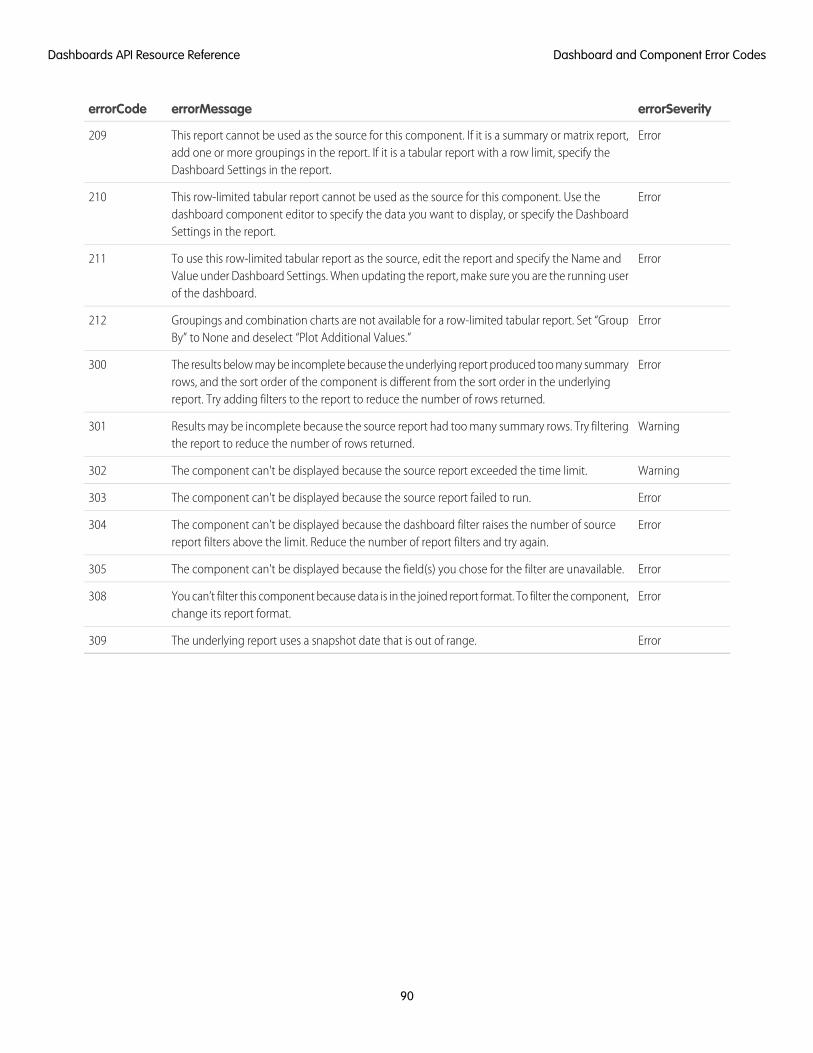
errorSeverityerrorMessageerrorCode
ErrorThis report cannot be used as the source for this component. If it is a summary or matrix report,add one or more groupings in the report. If it is a tabular report with a row limit, specify theDashboard Settings in the report.
209
ErrorThis row-limited tabular report cannot be used as the source for this component. Use thedashboard component editor to specify the data you want to display, or specify the DashboardSettings in the report.
210
ErrorTo use this row-limited tabular report as the source, edit the report and specify the Name andValue under Dashboard Settings. When updating the report, make sure you are the running userof the dashboard.
211
ErrorGroupings and combination charts are not available for a row-limited tabular report. Set “GroupBy” to None and deselect “Plot Additional Values.”
212
ErrorThe results below may be incomplete because the underlying report produced too many summaryrows, and the sort order of the component is different from the sort order in the underlyingreport. Try adding filters to the report to reduce the number of rows returned.
300
WarningResults may be incomplete because the source report had too many summary rows. Try filteringthe report to reduce the number of rows returned.
301
WarningThe component can't be displayed because the source report exceeded the time limit.302
ErrorThe component can't be displayed because the source report failed to run.303
ErrorThe component can't be displayed because the dashboard filter raises the number of sourcereport filters above the limit. Reduce the number of report filters and try again.
304
ErrorThe component can't be displayed because the field(s) you chose for the filter are unavailable.305
ErrorYou can’t filter this component because data is in the joined report format. To filter the component,change its report format.
308
ErrorThe underlying report uses a snapshot date that is out of range.309
90
Dashboard and Component Error CodesDashboards API Resource Reference
INDEX
DDashboards API
filtering results 33getting list of dashboards 29getting results 29getting status 34refreshing 34
IIntroduction 1
RReference
Dashboard error codes 89Dashboard List 79Dashboard Results 79Dashboard Status 79Report Describe 36Report Execute 36Report Instances 36Report List 36
Requirements and limitations 2Resources
DELETE report 37Detailed results 22, 59Fact map 22Filter report results 22, 59Get basic report metadata 49GET dashboard list 80GET dashboard results 80GET dashboard status 87Get extended report metadata 49
Resources (continued)Get recent reports list 72GET report data 22, 59GET report instance results 70GET report instances 69PATCH report 37POST report data 22, 59POST report instance 65, 69run report asynchronously 65Summary level results 22, 59
SSalesforce1 Reporting REST API
asynchronous 17dashboard, delete 35filter reports 17GET request 4, 13, 17list report runs 17POST request 17recently viewed 21report data 4report list 21report metadata 13report-level errors 76report, clone 26report, delete 27report, save 24synchronous 17
WWhen to use Reports API 3When to use the Dashboards API 28
91