Embed Size (px)
Citation preview
1
Sales force deployment and territory partitioning with multiple objectives
Elias Olivares-Benítez ([email protected]) UPAEP University, Puebla, Puebla, Mexico
Sonia Garcia-Bañuelos
UPAEP University, Puebla, Puebla, Mexico
María Beatriz Bernabe Loranca BUAP, Puebla, Puebla, Mexico
Jose Humberto Ablanedo Rosas
The University of Texas at El Paso, El Paso, Texas, USA
José Luis Martínez Flores UPAEP University, Puebla, Puebla, Mexico
Abstract This research arises from a project for a Mexican company with near 3800 customers grouped in zones and assigned to salesmen. A new partitioning is required in each zone affecting the sales force deployment. The problem is addressed as an optimization problem with geographic, workload, and sales turnover objectives. Keywords: Sales force deployment, Territory partitioning, Multiobjective Optimization Introduction The experience and models described in this work correspond to the development of a research project aimed to solve a consultancy for a Mexican company which manufactures and trades hand tools. This company has around 3800 customers along Mexico grouped in 9 regions for sales and distribution, and assigned to 40 salespeople. At this first step, the study was focused in the sales force deployment but a second future step considers the extension to product distribution. Although the territories and assignments already exist, a new partitioning was required in each region. The goal was to find the optimal assignment of each customer to each salesperson. The problem was addressed as a tri-objective optimization problem. The first objective considers the geographical balance of the territories. The second objective looks for the balance of the workload. The third objective aims to meet a pre-designed heterogeneity of the sales turnover for each salesperson. Mixed-integer programming models were developed for each objective and integrated later to solve the instances with the epsilon-constraint method. The
2
sets of efficient solutions were obtained for several regions using commercial optimization software. Some of these solutions are displayed in maps to compare other criteria for final selection such as compactness and contiguity. In the next section, a brief literature review is presented to highlight the contribution of this research. The problem description and the mathematical model are presented in the third section. The fourth section presents some details about the instances and the computational optimization of the models. The last section presents the conclusions and future work. Literature review The analysis and improvement of the sales force performance using quantitative methods is reviewed by Mantrala et al. (2010). They highlight the importance of the sales force in the total sales of a company, and at the same time they demonstrate the lack of research in the field. Examples of important recent applications of quantitative methods for decision making in sales force planning are presented by Golalikhani and Karwan (2012) and Lawrence et al. (2010). Mantrala et al. (2010) identified territory alignment, and its relation with the compensation plan structure, locational aspects and the work balance, as one of the research opportunities in sales force planning. Territory alignment can be identified with other terms such as territory design, territory partitioning, or territory districting, which have been applied in other fields including politics, schools, public services, and logistics (Kalcsics et al. 2005). The first territory alignment studies for sales force planning were presented by Lodish (1971), and Zoltners and Sinha (1983). More recent research articles considering a commercial approach, but more focused in product distribution activities were developed by Gonzalez-Ramirez et al. (2011), Rios-Mercado and Lopez-Perez (2013), and Salazar-Aguilar et al. (2011). In terms of multiobjective territory design, the studies by Gonzalez-Ramirez et al. (2011), Ricca (2004), and Tavares-Pereira et al. (2007) are the few considering multiple criteria optimization. Traditional approaches in territory design for sales force planning (Drexl and Haase 1999, Golalikhani and Karwan 2012, Kalcsics et al. 2005, Zoltners and Sinha 2005) create the districts and assignments. The approach presented in this paper differs with previous research; it is based on the territory re-design maintaining certain features close to the initial condition. Only the approach by Rios-Mercado and Lopez-Perez (2013) determines the re-alignment trying to preserve a similarity with the existing plan for the assignment of a subset of customers. However the way to preserve the existing plan is different. Rios-Mercado and Lopez-Perez (2013) use a penalty function for avoiding new assignments, different to the existing plan; and we use an objective function which minimizes the difference between the new and the current assignment plan. In this way, this work contributes with a novel model for sales force planning. Furthermore, this approach has proved to be efficient for territory re-designing while maintaining certain similarity with the initial condition. Also, this study expands the use of multiobjective optimization for sales force planning and territory partitioning. In a previous work by (Correa Medina et al. 2011) this problem was treated with a bi-objective approach, and here we are extending that work adding a third objective into the optimization. Description of the problem and mathematical model As described above, there are a number of customers in the country. These customers are grouped in Sales Coverage Units (SCU’s), usually towns, cities, or sections of a city. The salespeople are assigned to regions because of administrative reasons. Each region has a number
3
of SCU’s to serve by the salespeople. The SCU’s served by a salesperson are named “territory”. Each salesperson has a base in a city or town into the region and maybe different to the base of another salesperson into the same sales region. The problem consists of deciding the assignment of each SCU to each salesperson into a given region, and to define the territory of each salesperson. Although there is already a territory partitioning, the changes in the market required a re-design of the territories to improve sales force performance. These changes include new customers, some customers closing their business, customers who stop buying, and mainly the overlapping of the geography of the territories. The effect of these changes was a poor customer service because of unbalanced workload and long travel distances. Therefore, the first objectives were to balance the travel distance and the workload for the salespeople. However, a change in the assignment could bring a different sales turnover for each salesperson, affecting the compensation plan structure, creating discontent among the salespeople and reluctance to the new proposal. Hence a third objective was considered to minimize the changes in the sales turnover. The optimization model for a territory re-design should consider the balance of workload, the balance of travel distances, and preserving certain economic heterogeneity of the sales turnover according to the current plan. Mathematical model Sets: C: Sales Coverage Units (SCU’s) to be assigned. V: Salespeople. Indexes: i = 1, …, |V| j = 1, …, |C| Variables: xij ∈ {0,1}: a binary variable equal to 1 if salesperson i is assigned to SCU j, and equal to 0 otherwise. Tni ∈ R+: new sales turnover for salesperson i. Wni ∈ R+: new workload for salesperson i. D ∈ R+: longest travel distance for any salesperson. Parameters: dij ∈ R+ : shortest distance between salesperson i and SCU j. Tci ∈ R+: current sales turnover for salesperson i. sj ∈ R+: sales for SCU j. w j ∈ R+: workload in hours required to serve SCU j. µ ∈ R+: workload average by salesperson according to equation (4). MODEL:
∑∈
⎟⎟⎠
⎞⎜⎜⎝
⎛−
Vi i
i
TcTn
1min (1)
Dmin (2)
∑∈
⎟⎟⎠
⎞⎜⎜⎝
⎛−
Vi
iWnµ
1min (3)
4
Subject to:
V
wCj
j∑∈=µ (4)
Dxd ijij ≤ CjVi ∈∈∀ , (5)
iCj
ijj Tnxs =∑∈
Vi∈∀ (6)
iCj
ijj Wnxw =∑∈
Vi∈∀ (7)
1=∑∈Vi
ijx Cj∈∀ (8)
The objective function in equation (1) minimizes the difference in the sales turnover of the new assignments with respect to the current assignments, to preserve the economic heterogeneity. In equation (2), the objective function minimizes the longest travel distance for any salesperson, to induce the geographic homogeneity of the territories. The objective function in equation (3) minimizes the difference of the workload of the new assignments with respect to the workload average by salesperson, to achieve the workload homogeneity. The workload average is calculated in equation (4). The longest travel distance for every salesperson is calculated in equation (5). In equations (6) and (7), the new sales turnover and workload are calculated for each salesperson. Finally, the constraints in equation (8) assure each SCU is assigned to just one salesperson. Given the multiobjective approach for this mixed-integer program, the epsilon-constraint method was applied (Ehrgott 2005). In this way, the objective functions in equations (2) and (3) were transformed to equations (9) and (10) respectively, and added as constraints to the model.
1ε≤D (9)
21 εµ
≤⎟⎟⎠
⎞⎜⎜⎝
⎛−∑
∈Vi
iWn (10)
Finally, given the non-linear nature of equations (1) and (10) because of the absolute functions, a linearization process was done using positive and negative auxiliary variables (Kallrath, 2004) to take advantage of LP/MIP solvers. Computational optimization As mentioned above, the company had near 3800 customers along Mexico grouped in 621 SCU’s, in 9 regions for sales and distribution, and assigned to 40 salespeople. Each region of this setting was considered an instance to be solved. At this point, this research presents the results of five of those regions named Sonora-Sinaloa, Yucatan peninsula, Laguna-Durango, Chihuahua, and Bajio. The epsilon-constraint method requires solving the mixed-integer programming (MIP) model changing the values of ε1 and ε2 iteratively. To define the ranges for these values, the model is solved for each objective function separately, and the values of the other objective functions are evaluated from the solution obtained. The gap between one value and the next for a given epsilon was determined to obtain a large number of solutions. The epsilon-constraint
5
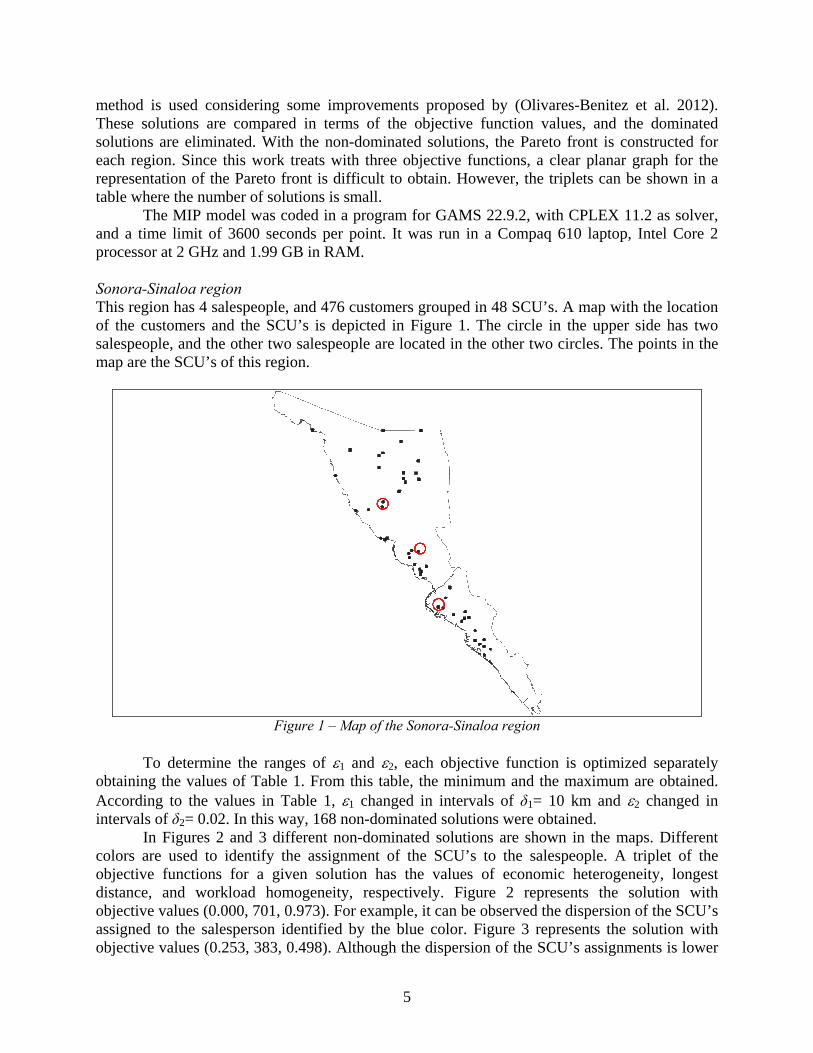
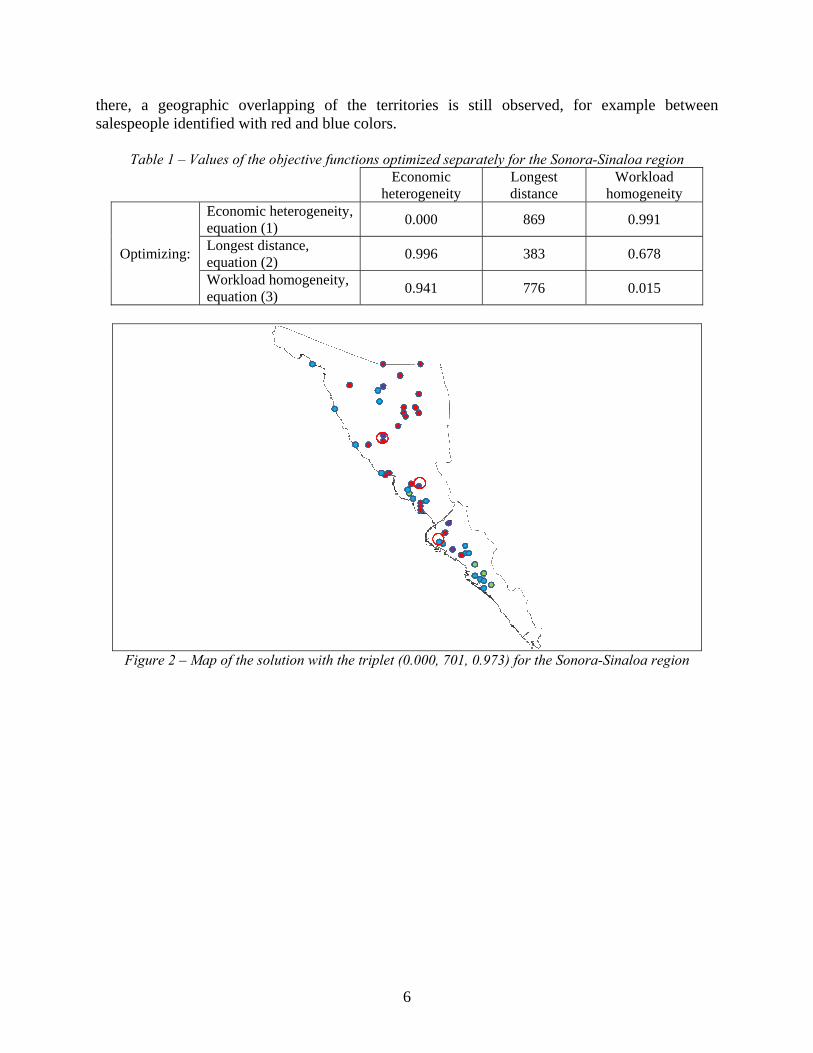
method is used considering some improvements proposed by (Olivares-Benitez et al. 2012). These solutions are compared in terms of the objective function values, and the dominated solutions are eliminated. With the non-dominated solutions, the Pareto front is constructed for each region. Since this work treats with three objective functions, a clear planar graph for the representation of the Pareto front is difficult to obtain. However, the triplets can be shown in a table where the number of solutions is small. The MIP model was coded in a program for GAMS 22.9.2, with CPLEX 11.2 as solver, and a time limit of 3600 seconds per point. It was run in a Compaq 610 laptop, Intel Core 2 processor at 2 GHz and 1.99 GB in RAM. Sonora-Sinaloa region This region has 4 salespeople, and 476 customers grouped in 48 SCU’s. A map with the location of the customers and the SCU’s is depicted in Figure 1. The circle in the upper side has two salespeople, and the other two salespeople are located in the other two circles. The points in the map are the SCU’s of this region.
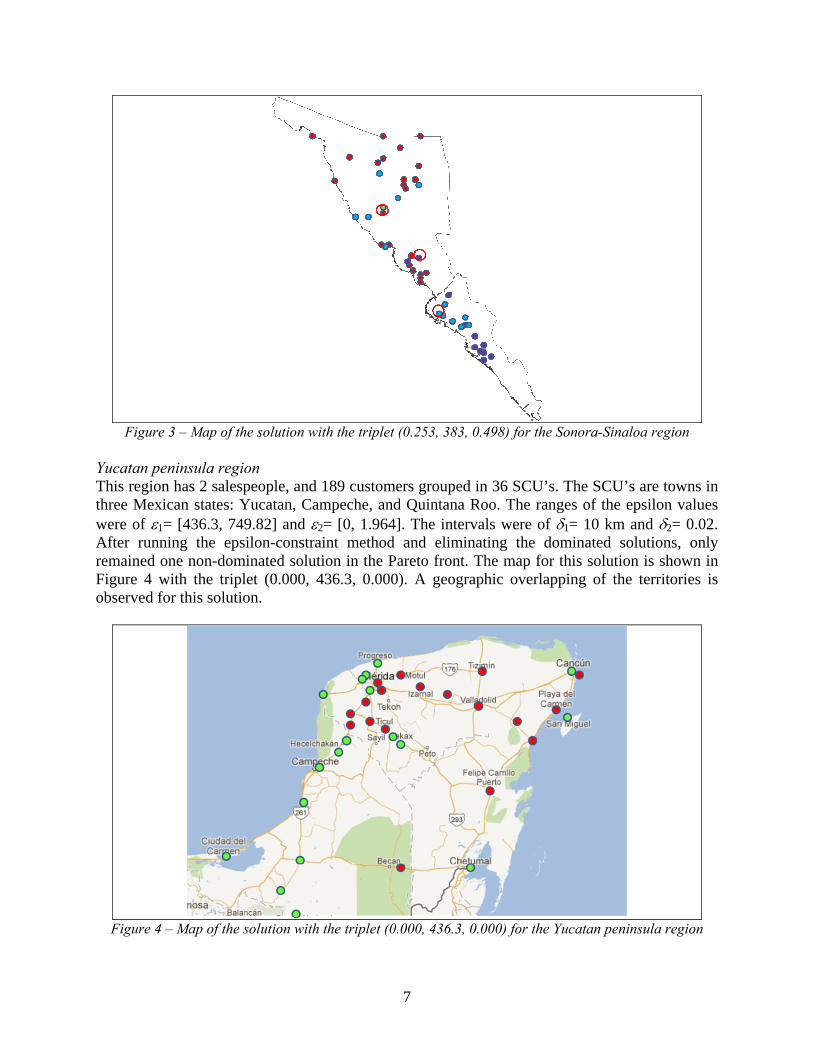
Figure 1 – Map of the Sonora-Sinaloa region To determine the ranges of ε1 and ε2, each objective function is optimized separately obtaining the values of Table 1. From this table, the minimum and the maximum are obtained. According to the values in Table 1, ε1 changed in intervals of δ1= 10 km and ε2 changed in intervals of δ2= 0.02. In this way, 168 non-dominated solutions were obtained. In Figures 2 and 3 different non-dominated solutions are shown in the maps. Different colors are used to identify the assignment of the SCU’s to the salespeople. A triplet of the objective functions for a given solution has the values of economic heterogeneity, longest distance, and workload homogeneity, respectively. Figure 2 represents the solution with objective values (0.000, 701, 0.973). For example, it can be observed the dispersion of the SCU’s assigned to the salesperson identified by the blue color. Figure 3 represents the solution with objective values (0.253, 383, 0.498). Although the dispersion of the SCU’s assignments is lower
6
there, a geographic overlapping of the territories is still observed, for example between salespeople identified with red and blue colors.
Table 1 – Values of the objective functions optimized separately for the Sonora-Sinaloa region Economic
heterogeneity Longest distance
Workload homogeneity
Optimizing:
Economic heterogeneity, equation (1) 0.000 869 0.991
Longest distance, equation (2) 0.996 383 0.678
Workload homogeneity, equation (3) 0.941 776 0.015
Figure 2 – Map of the solution with the triplet (0.000, 701, 0.973) for the Sonora-Sinaloa region
7
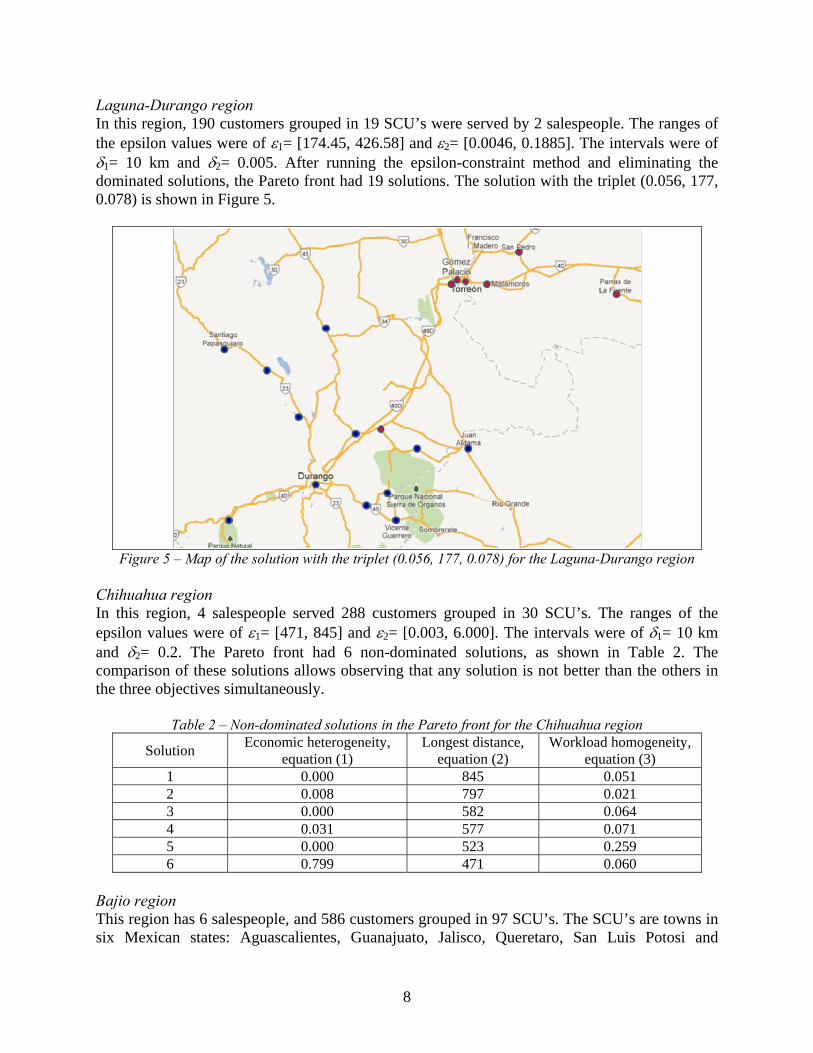
Figure 3 – Map of the solution with the triplet (0.253, 383, 0.498) for the Sonora-Sinaloa region Yucatan peninsula region This region has 2 salespeople, and 189 customers grouped in 36 SCU’s. The SCU’s are towns in three Mexican states: Yucatan, Campeche, and Quintana Roo. The ranges of the epsilon values were of ε1= [436.3, 749.82] and ε2= [0, 1.964]. The intervals were of δ1= 10 km and δ2= 0.02. After running the epsilon-constraint method and eliminating the dominated solutions, only remained one non-dominated solution in the Pareto front. The map for this solution is shown in Figure 4 with the triplet (0.000, 436.3, 0.000). A geographic overlapping of the territories is observed for this solution.
Figure 4 – Map of the solution with the triplet (0.000, 436.3, 0.000) for the Yucatan peninsula region
8
Laguna-Durango region In this region, 190 customers grouped in 19 SCU’s were served by 2 salespeople. The ranges of the epsilon values were of ε1= [174.45, 426.58] and ε2= [0.0046, 0.1885]. The intervals were of δ1= 10 km and δ2= 0.005. After running the epsilon-constraint method and eliminating the dominated solutions, the Pareto front had 19 solutions. The solution with the triplet (0.056, 177, 0.078) is shown in Figure 5.
Figure 5 – Map of the solution with the triplet (0.056, 177, 0.078) for the Laguna-Durango region
Chihuahua region In this region, 4 salespeople served 288 customers grouped in 30 SCU’s. The ranges of the epsilon values were of ε1= [471, 845] and ε2= [0.003, 6.000]. The intervals were of δ1= 10 km and δ2= 0.2. The Pareto front had 6 non-dominated solutions, as shown in Table 2. The comparison of these solutions allows observing that any solution is not better than the others in the three objectives simultaneously.
Table 2 – Non-dominated solutions in the Pareto front for the Chihuahua region
Solution Economic heterogeneity, equation (1)
Longest distance, equation (2)
Workload homogeneity, equation (3)
1 0.000 845 0.051 2 0.008 797 0.021 3 0.000 582 0.064 4 0.031 577 0.071 5 0.000 523 0.259 6 0.799 471 0.060
Bajio region This region has 6 salespeople, and 586 customers grouped in 97 SCU’s. The SCU’s are towns in six Mexican states: Aguascalientes, Guanajuato, Jalisco, Queretaro, San Luis Potosi and
9
Zacatecas. The ranges of the epsilon values were of ε1= [430.89, 612.58] and ε2= [0.0084, 3.0126]. The intervals were of δ1= 10.5 km and δ2= 0.17. The Pareto front had 13 non-dominated solutions. Conclusions A mathematical programming model with three objective functions is proposed for sales force deployment and its territory partitioning. This model incorporates the re-design approach taking into account the previous state of the system. The objectives are the geographical balance of the territories, the balance of the workload, and meeting a pre-designed heterogeneity of the sales turnover for each salesperson. The results for five instances, corresponding to sales regions, are presented. The computational effort was reasonable for each of the first 4 regions with optimization times below 4 hrs. The solution of the Bajio region required 46 hrs of computation. Obtaining the Pareto front with non-dominated solutions provides options for the decision maker to select an appropriate solution considering external criteria not included into the model. For example, a geographic analysis of the assignment allows identifying the overlapping of the territories. This overlapping is especially undesirable when it implies that one salesperson cross the road used by other salesperson into its own covering territory. The use of the same road segment by two salespeople affects the travel costs and the time spent in travelling, reducing the available time for service or prospecting new customers. Two aspects that may be improved in the model are considering an adjacency matrix to avoid the overlapping of the territories, and allowing the relocation of the salespeople into a region to improve the efficiency of the travels. In terms of the solution method, some improvements to the epsilon-constraint method have been proposed recently in the literature, and may be applied to our model. Also, the computational effort may be optimized using metaheuristics or evolutionary algorithms. Finally, the problem presented here is a sub-problem of a larger problem. The territory re-design has still to be integrated to a routing problem to determine the optimal sales routes for each salesperson according to a visits plan for each customer. This other sub-problem is related to the Periodic Vehicle Routing Problem, and should be integrated with the model presented here to optimize at the same time the territory design and the sales routes for salespeople. References Correa Medina, J. G., M. L. G. Ruvalcaba Sanchez, E. Olivares-Benitez, V. Zanella Palacios. 2011. Heurística bi-
objetivo de dos etapas para rediseño de territorios de venta. Econoquantum 8(2): 143–161. Drexl, A., K. Haase. 1999. Fast Approximation Methods for Sales Force Deployment. Management Science 45(10):
1307–1323. Ehrgott, M. 2005. Multicriteria Optimization. Springer, Heidelberg. Golalikhani, M., M. H. Karwan. 2012. A hierarchical procedure for multi-skilled sales force spatial planning.
Computers & Operations Research (In press): 14 pages. Gonzalez-Ramirez, R. G., N. R. Smith, R. G. Askin, P. A. Miranda, J. M. Sanchez. 2011. A Hybrid Metaheuristic
Approach to Optimize the Districting Design of a Parcel Company. Journal of Applied Research and Technology 9(1): 19–35.
Kallrath, J. 2004. Modeling languages in mathematical optimization. Kluwer Academic Publishers, New York. Kalcsics, J., S. Nickel, M., Schroder. 2005. Towards a Unified Territory Design Approach - Applications,
Algorithms and GIS Integration. TOP 13(1): 1–56. Lawrence, R., C. Perlich, S. Rosset, I. Khabibrakhmanov, S. Mahatma, S. Weiss. 2010. Operations Research
Improves Sales Force Productivity at IBM. Interfaces 40(1): 33–46. Lodish, L. M. 1971. CALLPLAN: An interactive salesman’s call planning system. Management Science 18(4-Part-
II): 25–40.
10
Mantrala, M. K., S. Albers, F. Caldieraro, O. Jensen, K. Joseph, M. Krafft, C. Narasimhan, S. Gopalakrishna, A. Zoltners, R. Lal, L. Lodish. 2010. Sales force modeling: State of the field and research agenda. Marketing Letters 21(3): 255–272.
Olivares-Benitez, E., J. L. Gonzalez-Velarde, R. Z. Rios-Mercado. 2012. A supply chain design problem with facility location and bi-objective transportation choices. TOP 20(3): 729–753.
Ricca, F. 2004. A multicriteria districting heuristic for the aggregation of zones and its use in computing origin-destination matrices. INFOR-Information Systems and Operational Research 42(1): 61–78.
Rios-Mercado, R. Z., J. F. Lopez-Perez. 2013. Commercial territory design planning with realignment and disjoint assignment requirements. Omega 41(3): 525–535.
Salazar-Aguilar, M. A., R. Z. Rios-Mercado, M. Cabrera-Rios. 2011. New Models for Commercial Territory Design. Networks and Spatial Economics 11(3): 487–507.
Tavares-Pereira, F., J. Figueira, V. Mousseau, B. Roy. 2007. Multiple criteria districting problems. Annals of Operations Research 154(1): 69–92.
Zoltners, A. A., P. Sinha. 1983. Sales territory alignment: A review and model. Management Science 29(11): 1237–1256.
Zoltners, A. A., P. Sinha. 2005. Sales territory design: Thirty years of modeling and implementation. Marketing Science 24(3): 313–331.