Embed Size (px)
Citation preview
CDP Climate Change 2017 Information Request
Ryder System, Inc.
Module: Introduction
Page: Introduction
CC0.1
Introduction
Please give a general description and introduction to your organization. Ryder System, Inc. (Ryder), a Florida corporation founded in 1933, is a global leader in commercial fleet management and supply chain solutions. We operate primarily in three business segments: Fleet Management Solutions (FMS), Dedicated Transportation Services (DTS) and Supply Chain Solutions (SCS). Ryder has received significant awards and recognition from customers, leading transportation and logistics industry associations, business and regulatory communities. Recent examples include: Forbes: America’s Best Employers in Transportation and Logistics industry category (2016); FORTUNE: World’s Most Admired Companies Award in Trucking Industry (2016); Texas Oil & Gas Award (2016) for environmental stewardship, corporate social responsibility, and excellence in health & safety; SupplyChainBrain - 100 Great Supply Chain Partners award; Trucking HR Canada – Award for top trucking companies in Canada; Carbon Disclosure Project Carbon Disclosure Leadership Index (2012, 2015); Food Logistics: Top Green Providers award for green transportation and logistics solutions (2012 – 2016); Inbound Logistics - top 75 Green Supply Chain Partners by Inbound Logistics (2009– 2016); Supply & Demand Chain Executive: Green Supply Chain Award for meeting green or sustainable supply chain goals (2016); 2020 Women on Boards W Company – Ryder was named a “W” company for having a board with more than 20 percent women (2013, 2017); CivilianJobs.com’s Most Valuable Employers (MVE) for Military (2013 - 2016); Florida Diversity Council: Most Powerful and Influential Woman Award (2017); 2016 Partnership Award Bacardi: Through its US EPA SmartWay partnership with Ryder, Inc., beginning in 2008, Bacardi USA has vastly improved transportation efficiencies and reduced carbon emissions by more than 20%. The FMS business provides full service leasing (long-term), commercial rental (short-term), as well as contract maintenance of trucks, tractors and trailers to customers principally in the U.S., Canada and the U.K. The standard leasing business model offers customers different vehicle options (such as fuel-efficient or natural gas powered vehicle packages) with attractive financing mechanisms. Because of increased demand for vehicle efficiency and reliability, companies that own and manage their own fleet of vehicles have put greater emphasis on the quality of preventative maintenance for their vehicles. Finally, the tightened credit market has limited some businesses’ access to capital at a time when commercial vehicle costs have increased due to new technologies and more expensive emission controls needed for EPA-compliant engines. Under the FMS Full Service Lease option, Ryder offers vehicle maintenance services, supplies and related equipment necessary for operating and maintaining lease vehicles. This applies to customers who want to manage their own freight, but are interested in outsourcing or upgrading their fleet management needs without having to invest their own capital. Under the FMS Commercial Rental option, customers who need to supplement their fleet on a short-term basis are able to rent vehicles for a day, a week, a month, or on a multi-year rental contract. The Dedicated Transportation Service (DTS) option provides vehicles and drivers as part of a dedicate transportation solution in the US. Customers directly manage their overall freight movement but Ryder provides the equipment, maintenance, and administrative services (including driver hiring, training, routing and scheduling,
and fleet sizing) associated with maintaining the customer’s private fleet. This combination of services allow us to provide high service levels and the most efficient routing to lower fuel costs due to less idle time and fewer empty miles. A key difference between Dedicated Transportation Services and Full Service Lease is Ryder provides the drivers for Dedicated. The SCS supply chain solution provides Distribution and Transportation Management services in North America and Asia. SCS customers are looking for a total integrated solution that includes managing outsourced vehicles, drivers, freight routing, IT integration, warehouse and distribution management, as well as other logistics engineering services. SCS provides a wide range of services relating to a customer’s distribution operations, from designing the distribution network to managing distribution facilities. Customers can more precisely align inbound and outbound shipments, synchronize returns with optimized fleet use and arrange backhauls to offset transportation costs and minimize empty miles that will directly help lowering GHG emissions. The SCS Transportation Management business offers services relating to all aspects of a customer’s transportation network. Ryder’s transportation specialists provide shipment planning and execution, through a series of technological and web-based solutions.
CC0.2
Reporting Year
Please state the start and end date of the year for which you are reporting data. The current reporting year is the latest/most recent 12-month period for which data is reported. Enter the dates of this year first. We request data for more than one reporting period for some emission accounting questions. Please provide data for the three years prior to the current reporting year if you have not provided this information before, or if this is the first time you have answered a CDP information request. (This does not apply if you have been offered and selected the option of answering the shorter questionnaire). If you are going to provide additional years of data, please give the dates of those reporting periods here. Work backwards from the most recent reporting year. Please enter dates in following format: day(DD)/month(MM)/year(YYYY) (i.e. 31/01/2001).
Enter Periods that will be disclosed
Fri 01 Jan 2016 - Sat 31 Dec 2016
CC0.3
Country list configuration
Please select the countries for which you will be supplying data. If you are responding to the Electric Utilities module, this selection will be carried forward to assist you in completing your response.
Select country
CC0.4
Currency selection
Please select the currency in which you would like to submit your response. All financial information contained in the response should be in this currency. USD($)
CC0.6
Modules
As part of the request for information on behalf of investors, companies in the electric utility sector, companies in the automobile and auto component manufacturing sector, companies in the oil and gas sector, companies in the information and communications technology sector (ICT) and companies in the food, beverage and tobacco sector (FBT) should complete supplementary questions in addition to the core questionnaire. If you are in these sector groupings, the corresponding sector modules will not appear among the options of question CC0.6 but will automatically appear in the ORS navigation bar when you save this page. If you want to query your classification, please email [email protected]. If you have not been presented with a sector module that you consider would be appropriate for your company to answer, please select the module below in CC0.6.
Further Information
Module: Management
Page: CC1. Governance
CC1.1
Where is the highest level of direct responsibility for climate change within your organization?
Board or individual/sub-set of the Board or other committee appointed by the Board
CC1.1a
Please identify the position of the individual or name of the committee with this responsibility
i) The Board of Directors’ Corporate Governance Committee, a subcommittee of the full Board of Directors, is responsible for overseeing public policy, public affairs and corporate responsibility including responsibility for Ryder’s environmental programs, which address regulatory and business issues related to climate change impacts and strategy. ii) The Vice President of Environmental, Real Estate, and Fuel Services maintains day-to-day operational responsibility for Environmental Programs including climate change strategy and reports to the Executive Vice President, Chief Legal Officer and Corporate Secretary. An Environmental Report is provided annually to the Corporate Governance Committee.
CC1.2
Do you provide incentives for the management of climate change issues, including the attainment of targets?
Yes
CC1.2a
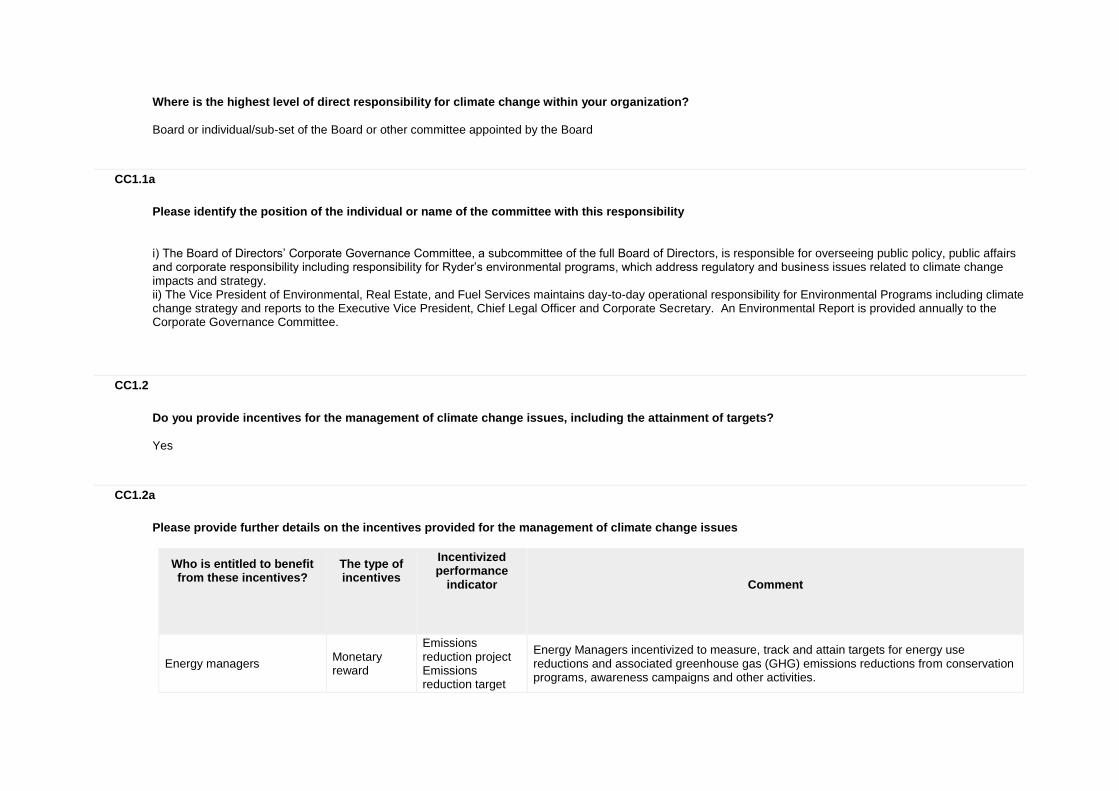
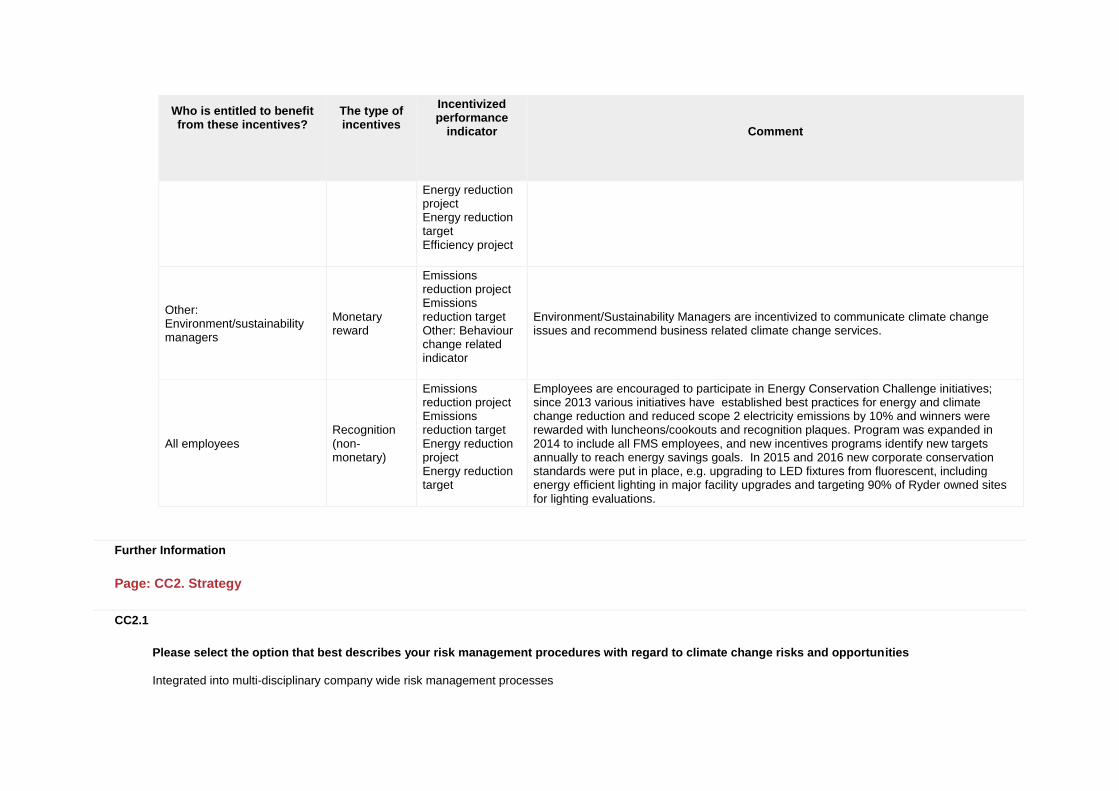
Please provide further details on the incentives provided for the management of climate change issues
Who is entitled to benefit from these incentives?
The type of incentives
Incentivized performance
indicator
Comment
Energy managers Monetary reward
Emissions reduction project Emissions reduction target
Energy Managers incentivized to measure, track and attain targets for energy use reductions and associated greenhouse gas (GHG) emissions reductions from conservation programs, awareness campaigns and other activities.
Who is entitled to benefit from these incentives?
The type of incentives
Incentivized performance
indicator
Comment
Energy reduction project Energy reduction target Efficiency project
Other: Environment/sustainability managers
Monetary reward
Emissions reduction project Emissions reduction target Other: Behaviour change related indicator
Environment/Sustainability Managers are incentivized to communicate climate change issues and recommend business related climate change services.
All employees Recognition (non-monetary)
Emissions reduction project Emissions reduction target Energy reduction project Energy reduction target
Employees are encouraged to participate in Energy Conservation Challenge initiatives; since 2013 various initiatives have established best practices for energy and climate change reduction and reduced scope 2 electricity emissions by 10% and winners were rewarded with luncheons/cookouts and recognition plaques. Program was expanded in 2014 to include all FMS employees, and new incentives programs identify new targets annually to reach energy savings goals. In 2015 and 2016 new corporate conservation standards were put in place, e.g. upgrading to LED fixtures from fluorescent, including energy efficient lighting in major facility upgrades and targeting 90% of Ryder owned sites for lighting evaluations.
Further Information
Page: CC2. Strategy
CC2.1
Please select the option that best describes your risk management procedures with regard to climate change risks and opportunities
Integrated into multi-disciplinary company wide risk management processes
CC2.1a
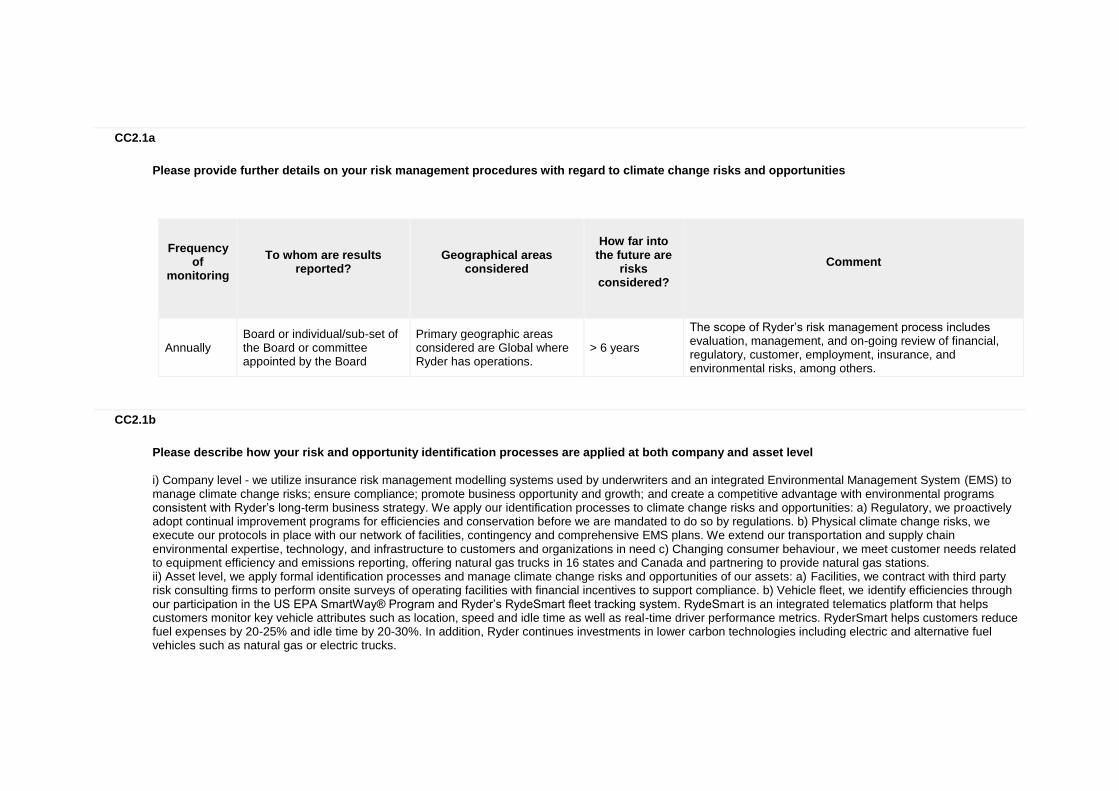
Please provide further details on your risk management procedures with regard to climate change risks and opportunities
Frequency
of monitoring
To whom are results
reported?
Geographical areas
considered
How far into
the future are risks
considered?
Comment
Annually Board or individual/sub-set of the Board or committee appointed by the Board
Primary geographic areas considered are Global where Ryder has operations.
> 6 years
The scope of Ryder’s risk management process includes evaluation, management, and on-going review of financial, regulatory, customer, employment, insurance, and environmental risks, among others.
CC2.1b
Please describe how your risk and opportunity identification processes are applied at both company and asset level
i) Company level - we utilize insurance risk management modelling systems used by underwriters and an integrated Environmental Management System (EMS) to manage climate change risks; ensure compliance; promote business opportunity and growth; and create a competitive advantage with environmental programs consistent with Ryder’s long-term business strategy. We apply our identification processes to climate change risks and opportunities: a) Regulatory, we proactively adopt continual improvement programs for efficiencies and conservation before we are mandated to do so by regulations. b) Physical climate change risks, we execute our protocols in place with our network of facilities, contingency and comprehensive EMS plans. We extend our transportation and supply chain environmental expertise, technology, and infrastructure to customers and organizations in need c) Changing consumer behaviour, we meet customer needs related to equipment efficiency and emissions reporting, offering natural gas trucks in 16 states and Canada and partnering to provide natural gas stations. ii) Asset level, we apply formal identification processes and manage climate change risks and opportunities of our assets: a) Facilities, we contract with third party risk consulting firms to perform onsite surveys of operating facilities with financial incentives to support compliance. b) Vehicle fleet, we identify efficiencies through our participation in the US EPA SmartWay® Program and Ryder’s RydeSmart fleet tracking system. RydeSmart is an integrated telematics platform that helps customers monitor key vehicle attributes such as location, speed and idle time as well as real-time driver performance metrics. RyderSmart helps customers reduce fuel expenses by 20-25% and idle time by 20-30%. In addition, Ryder continues investments in lower carbon technologies including electric and alternative fuel vehicles such as natural gas or electric trucks.
CC2.1c
How do you prioritize the risks and opportunities identified?
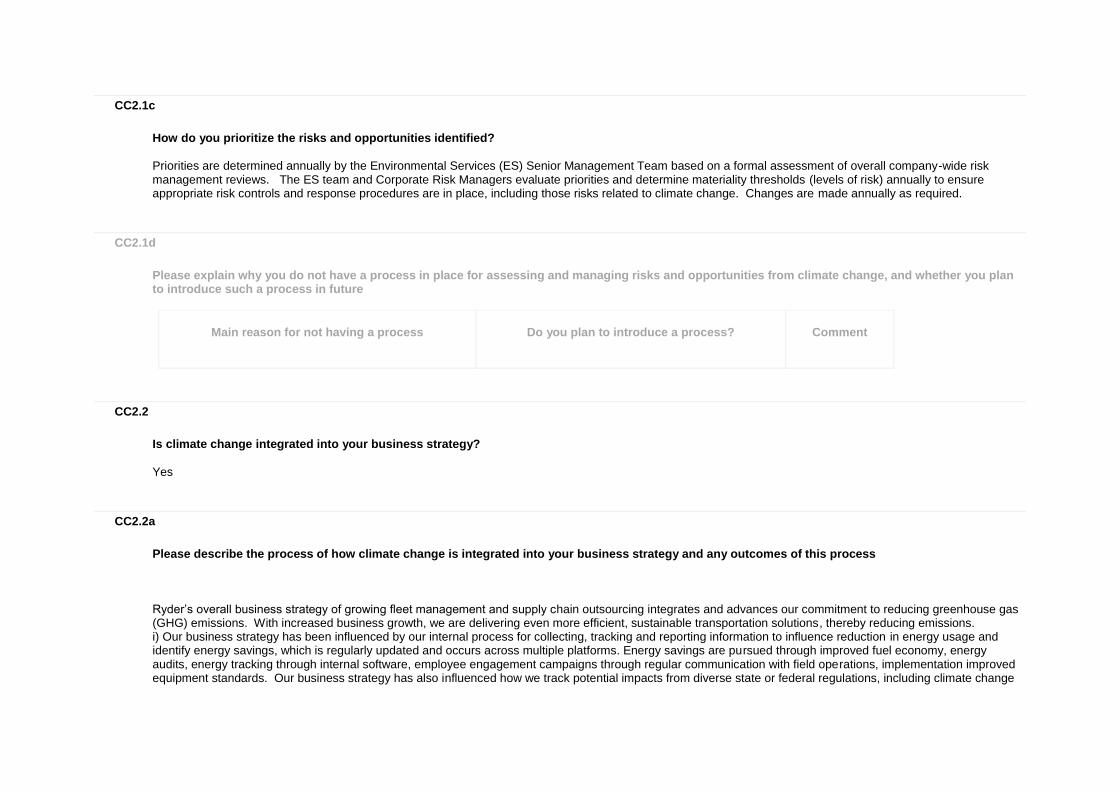
Priorities are determined annually by the Environmental Services (ES) Senior Management Team based on a formal assessment of overall company-wide risk management reviews. The ES team and Corporate Risk Managers evaluate priorities and determine materiality thresholds (levels of risk) annually to ensure appropriate risk controls and response procedures are in place, including those risks related to climate change. Changes are made annually as required.
CC2.1d
Please explain why you do not have a process in place for assessing and managing risks and opportunities from climate change, and whether you plan to introduce such a process in future
Main reason for not having a process
Do you plan to introduce a process?
Comment
CC2.2
Is climate change integrated into your business strategy?
Yes
CC2.2a
Please describe the process of how climate change is integrated into your business strategy and any outcomes of this process
Ryder’s overall business strategy of growing fleet management and supply chain outsourcing integrates and advances our commitment to reducing greenhouse gas (GHG) emissions. With increased business growth, we are delivering even more efficient, sustainable transportation solutions, thereby reducing emissions. i) Our business strategy has been influenced by our internal process for collecting, tracking and reporting information to influence reduction in energy usage and identify energy savings, which is regularly updated and occurs across multiple platforms. Energy savings are pursued through improved fuel economy, energy audits, energy tracking through internal software, employee engagement campaigns through regular communication with field operations, implementation improved equipment standards. Our business strategy has also influenced how we track potential impacts from diverse state or federal regulations, including climate change
related regulations. ii) Reducing fuel use is central to our business model and customer services - because fuel is important to all our customers and is a fluctuating fleet expense, Ryder services continually identifies new ways to reduce fuel costs for our customers. Ryder is working closely with manufacturers to incorporate fuel efficiencies into trucks such as aerodynamic features or researching and implementing low carbon technologies including alternative fuel trucks such as electric or natural gas vehicles. Our most substantial climate-related business decisions are reflected in vehicle investments, which are driven by the need for adaptation in using fuel-efficient vehicles plus an opportunity to develop green business as a differentiator versus competitors. iii) Primary climate change aspects influencing our business strategy: a) Mitigating risks: reduce the potential financial impact from state or federal regulations, including climate change b) Customer compliance: support regulatory issues for our customers. iv) The most important component of our short-term strategy influenced by climate change is in response to market demands for cost-effective, environmentally friendly alternative fuel solutions. Our short-term strategy is to develop fuel-efficient and low carbon offerings for our customers and help them track their GHG performance while tracking and improving our own performance: a) Investing in fuel efficient vehicles: Our fleet provides new engine technologies and vehicles engineered for optimum fuel efficiency. We follow guidelines provided by the Environmental Protection Agency (EPA)’s SmartWay® Transport program. b) Optimizing fleet performance: Ryder is improving fuel-efficient vehicle offerings such as the newly redesigned fuel efficient MetroVan that reports 25 miles per gallon. In addition, Ryder’s fleet program implements preventive maintenance schedules for even the most routine care, including checking tire conditions and inflation rates when vehicles stop to refuel to ensure optimum performance. c) Reducing Idling time: Through Ryder's FleetCare and RydeSmart, fleet owners can optimize routes and monitor idle times, all which mitigate rising fuel costs. d) Investing in new products and technologies: Ryder is the first national maintenance service provider to convert its entire bulk oil program to low viscosity, high efficiency 10W-30 grade engine oil. Using the more efficient oil, enables customers to achieve up to a 1.5 percent improvement in fuel economy translating into a collective reduction of over 125,000 metric tonnes (MT) CO2e annually. e) Recycling shop waste: We upgrade our facilities and implement new conservation programs to reduce environmental impacts from automotive waste streams. In 2016, we recycled 2.4 million gallons (gal) of used oil, over 820,000 gal of oily water, 10,000 drums of used oil filters, 43,000 gal of solvent and 115,000 automotive batteries, which collectively reduced nearly 20,000 MT CO2e. f) Tracking GHG and energy: 1) Vehicle GHG performance: With the help of SmartWay Verified Technologies, we offer our customers industry-leading vehicle performance, optimized fuel efficiency and reduced carbon emissions. Our EPA SmartWay® Partnership is one of our key sustainability initiatives used to promote energy efficiency and reduce GHG emissions for our Customers and Ryder. 2) Facility energy use: our strategy is to monitor, track and reduce electricity use. Our Resource Conservation Program targets energy and water reduction at all Ryder facilities. Locations have committed to saving energy with energy efficient shop improvements. Each shop adopts a Statement of Commitment outlining their goals including conserve energy resources, incorporate energy efficiency into daily operations, invest in energy efficiency equipment and upgrades, and engage all employees to save energy. v) The most important components of our long-term strategy influenced by climate change are business strategies to ensure disaster preparedness, our capital investment to support and expand alternative fuel vehicles and infrastructure to service our natural gas fleet. a) Our disaster preparedness strategies include third party onsite risk audits of operating facilities. Controls mitigate risks that could lead to loss of property due to fire, windstorm, flood and other physical perils. Compliance is monitored for facility financial incentives. Our Asset Protection Manual provides guidance to maintain optimum, safe working conditions year round and prepare facilities for annual Engineering Surveys. b) Investments in low carbon technologies include offering alternative fuel and advanced technology vehicles to our customers fleet as part of a strategic process ahead of regulatory drivers. Ryder’s market leadership in operating advanced vehicle technologies in commercial truck applications also includes Ryder’s natural gas vehicle and maintenance solutions offering. Ryder has made significant investments to offer alternative fuel vehicles. Natural gas vehicles reduce fuel costs and well-to-wheel CO2 emissions by 25%. In addition, Ryder will roll out electric pickup trucks to their customers in a new partnership with electric truck manufacturer Workhorse. The trucks will have an estimated 75 mpg fuel efficiency rating in all electric operation. vi) Improved fuel efficiency is a key strategic advantage for our business and provides us with both a short-term and long-term strategic advantage. By offering fuel-efficient vehicles and preventive maintenance services to our customers, we develop long-standing relationships that drive future revenue and business growth. This
aspect of our service offering strengthens our customer relations and business retention.
CC2.2b
Please explain why climate change is not integrated into your business strategy
CC2.2c
Does your company use an internal price on carbon?
No, and we currently don't anticipate doing so in the next 2 years
CC2.2d
Please provide details and examples of how your company uses an internal price on carbon
CC2.3
Do you engage in activities that could either directly or indirectly influence public policy on climate change through any of the following? (tick all that apply)
Direct engagement with policy makers
CC2.3a
On what issues have you been engaging directly with policy makers?
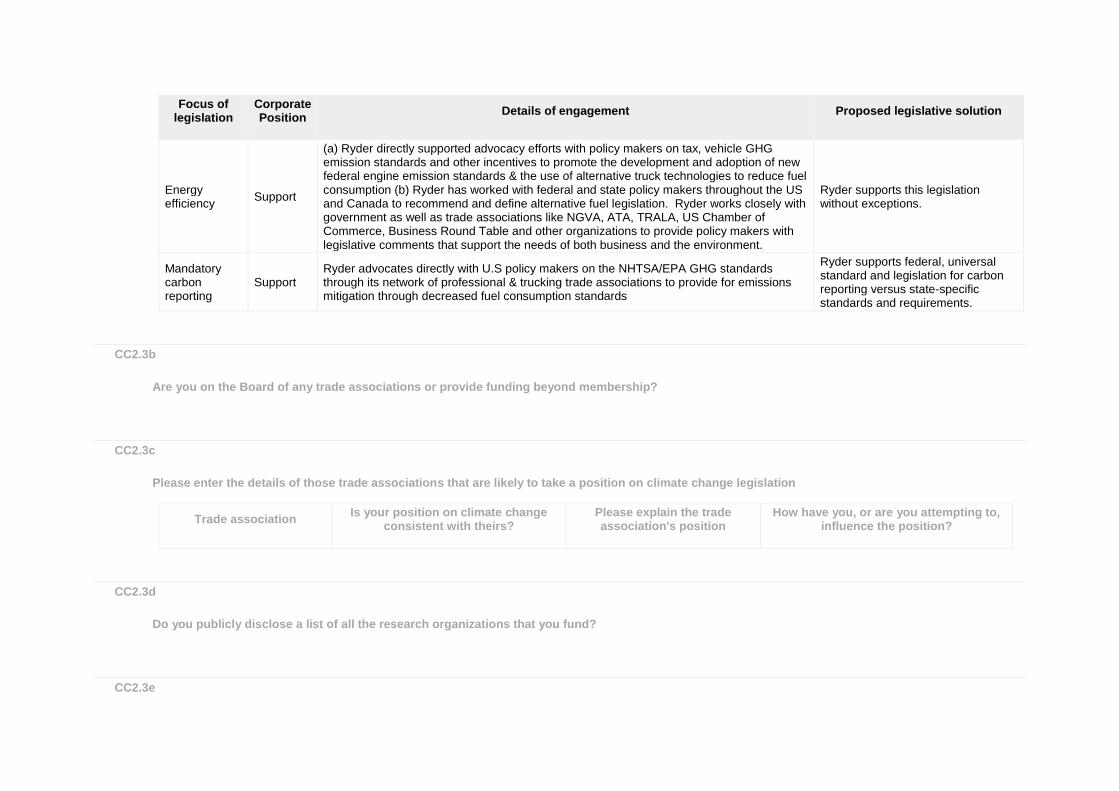
Focus of legislation
Corporate Position
Details of engagement
Proposed legislative solution
Energy efficiency
Support
(a) Ryder directly supported advocacy efforts with policy makers on tax, vehicle GHG emission standards and other incentives to promote the development and adoption of new federal engine emission standards & the use of alternative truck technologies to reduce fuel consumption (b) Ryder has worked with federal and state policy makers throughout the US and Canada to recommend and define alternative fuel legislation. Ryder works closely with government as well as trade associations like NGVA, ATA, TRALA, US Chamber of Commerce, Business Round Table and other organizations to provide policy makers with legislative comments that support the needs of both business and the environment.
Ryder supports this legislation without exceptions.
Mandatory carbon reporting
Support Ryder advocates directly with U.S policy makers on the NHTSA/EPA GHG standards through its network of professional & trucking trade associations to provide for emissions mitigation through decreased fuel consumption standards
Ryder supports federal, universal standard and legislation for carbon reporting versus state-specific standards and requirements.
CC2.3b
Are you on the Board of any trade associations or provide funding beyond membership?
CC2.3c
Please enter the details of those trade associations that are likely to take a position on climate change legislation
Trade association
Is your position on climate change consistent with theirs?
Please explain the trade association's position
How have you, or are you attempting to, influence the position?
CC2.3d
Do you publicly disclose a list of all the research organizations that you fund?
CC2.3e
Please provide details of the other engagement activities that you undertake
CC2.3f
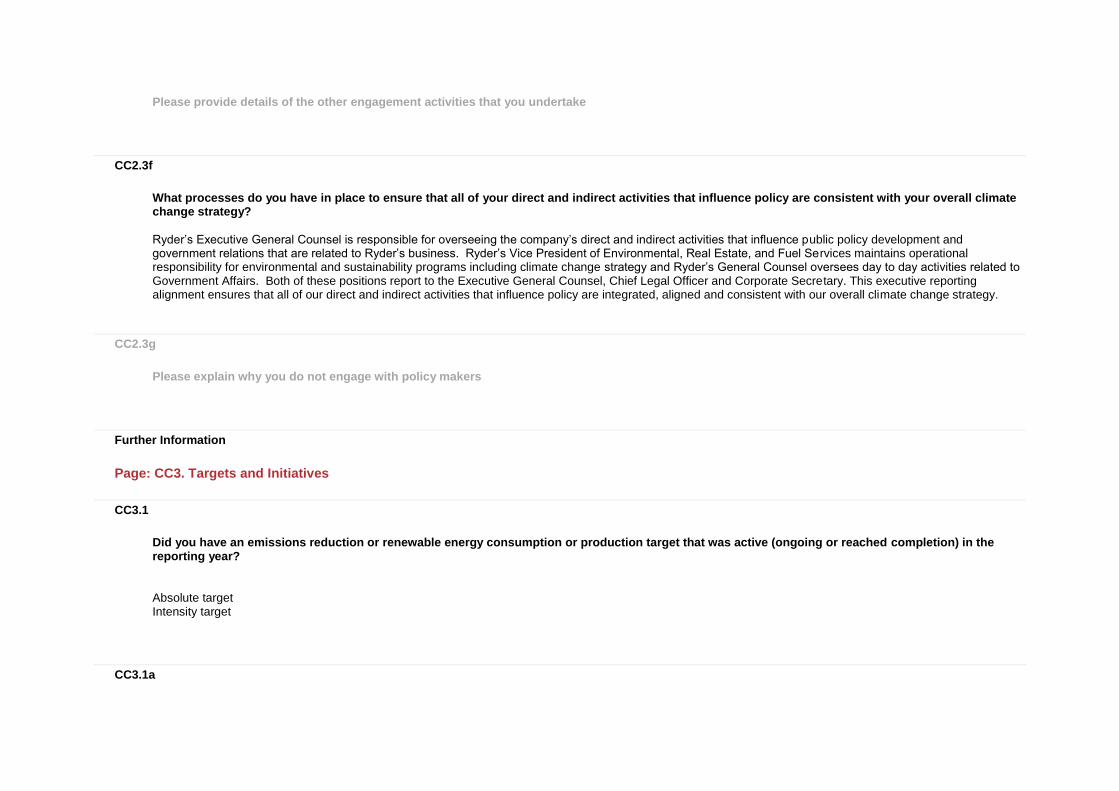
What processes do you have in place to ensure that all of your direct and indirect activities that influence policy are consistent with your overall climate change strategy?
Ryder’s Executive General Counsel is responsible for overseeing the company’s direct and indirect activities that influence public policy development and government relations that are related to Ryder’s business. Ryder’s Vice President of Environmental, Real Estate, and Fuel Services maintains operational responsibility for environmental and sustainability programs including climate change strategy and Ryder’s General Counsel oversees day to day activities related to Government Affairs. Both of these positions report to the Executive General Counsel, Chief Legal Officer and Corporate Secretary. This executive reporting alignment ensures that all of our direct and indirect activities that influence policy are integrated, aligned and consistent with our overall climate change strategy.
CC2.3g
Please explain why you do not engage with policy makers
Further Information
Page: CC3. Targets and Initiatives
CC3.1
Did you have an emissions reduction or renewable energy consumption or production target that was active (ongoing or reached completion) in the reporting year?
Absolute target Intensity target
CC3.1a
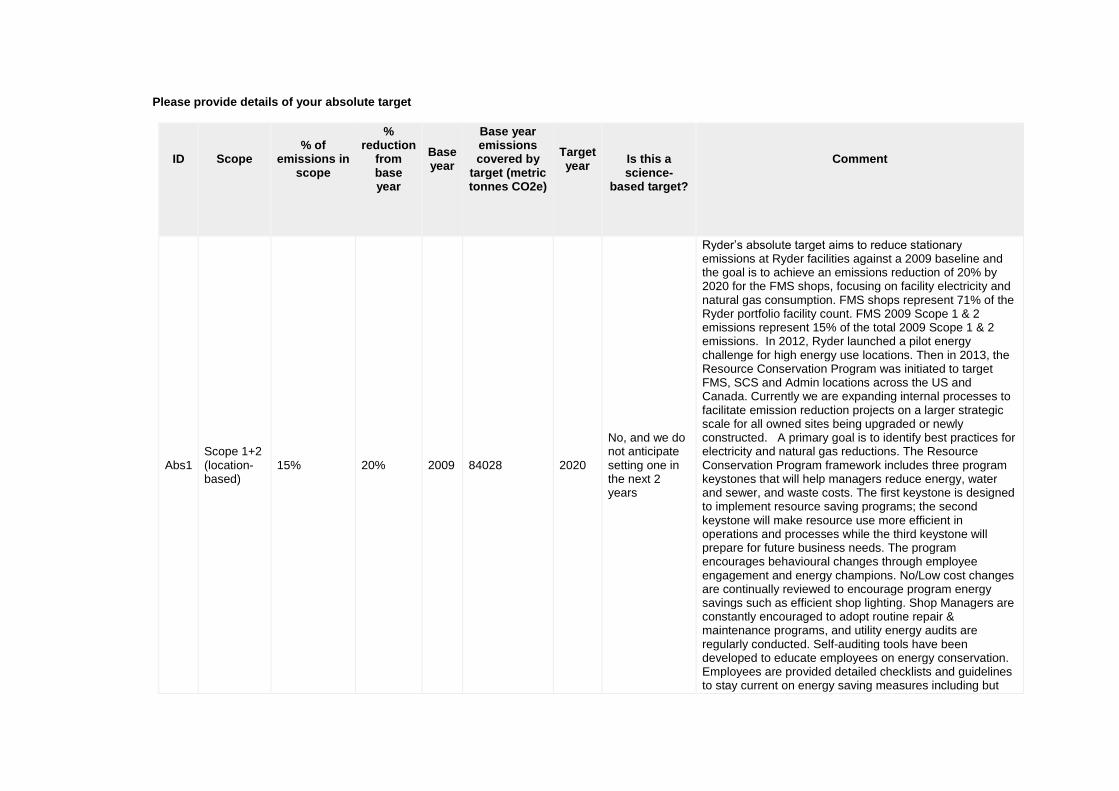
Please provide details of your absolute target
ID
Scope
% of emissions in
scope
% reduction
from base year
Base year
Base year emissions covered by
target (metric tonnes CO2e)
Target year
Is this a science-
based target?
Comment
Abs1 Scope 1+2 (location-based)
15% 20% 2009 84028 2020
No, and we do not anticipate setting one in the next 2 years
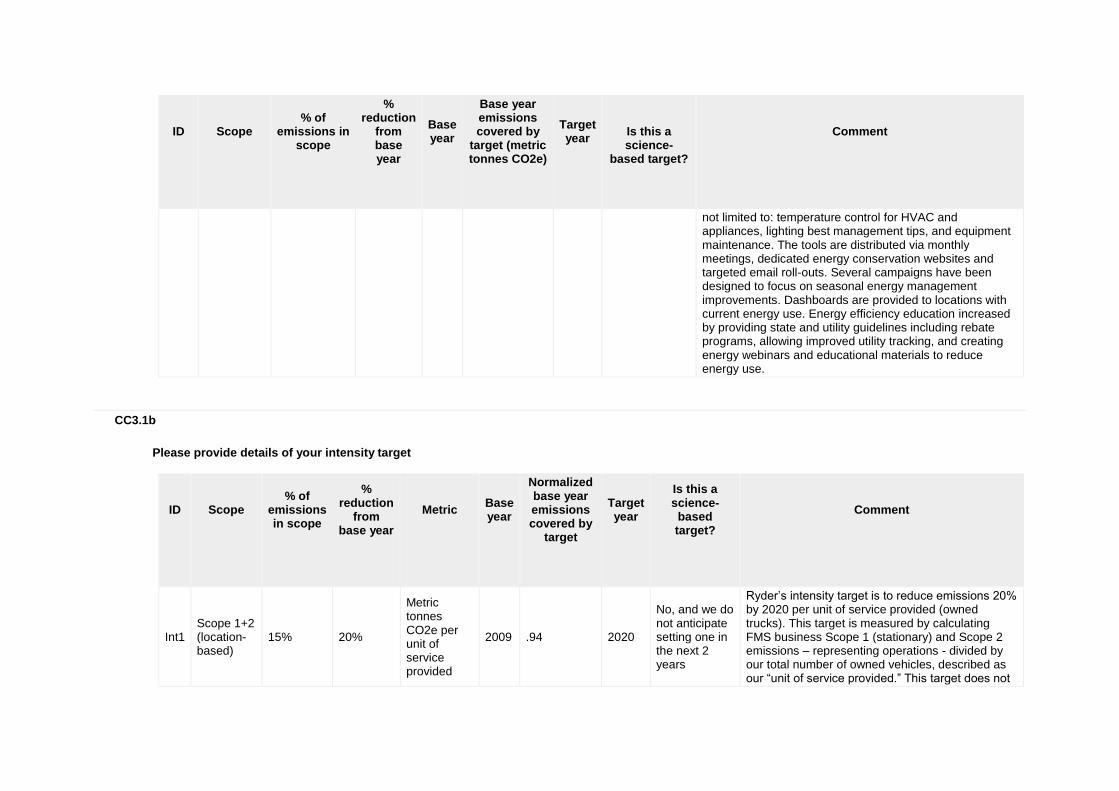
Ryder’s absolute target aims to reduce stationary emissions at Ryder facilities against a 2009 baseline and the goal is to achieve an emissions reduction of 20% by 2020 for the FMS shops, focusing on facility electricity and natural gas consumption. FMS shops represent 71% of the Ryder portfolio facility count. FMS 2009 Scope 1 & 2 emissions represent 15% of the total 2009 Scope 1 & 2 emissions. In 2012, Ryder launched a pilot energy challenge for high energy use locations. Then in 2013, the Resource Conservation Program was initiated to target FMS, SCS and Admin locations across the US and Canada. Currently we are expanding internal processes to facilitate emission reduction projects on a larger strategic scale for all owned sites being upgraded or newly constructed. A primary goal is to identify best practices for electricity and natural gas reductions. The Resource Conservation Program framework includes three program keystones that will help managers reduce energy, water and sewer, and waste costs. The first keystone is designed to implement resource saving programs; the second keystone will make resource use more efficient in operations and processes while the third keystone will prepare for future business needs. The program encourages behavioural changes through employee engagement and energy champions. No/Low cost changes are continually reviewed to encourage program energy savings such as efficient shop lighting. Shop Managers are constantly encouraged to adopt routine repair & maintenance programs, and utility energy audits are regularly conducted. Self-auditing tools have been developed to educate employees on energy conservation. Employees are provided detailed checklists and guidelines to stay current on energy saving measures including but
ID
Scope
% of emissions in
scope
% reduction
from base year
Base year
Base year emissions covered by
target (metric tonnes CO2e)
Target year
Is this a science-
based target?
Comment
not limited to: temperature control for HVAC and appliances, lighting best management tips, and equipment maintenance. The tools are distributed via monthly meetings, dedicated energy conservation websites and targeted email roll-outs. Several campaigns have been designed to focus on seasonal energy management improvements. Dashboards are provided to locations with current energy use. Energy efficiency education increased by providing state and utility guidelines including rebate programs, allowing improved utility tracking, and creating energy webinars and educational materials to reduce energy use.
CC3.1b
Please provide details of your intensity target
ID
Scope
% of emissions in scope
% reduction
from base year
Metric
Base year
Normalized base year emissions covered by
target
Target year
Is this a science-based target?
Comment
Int1 Scope 1+2 (location-based)
15% 20%
Metric tonnes CO2e per unit of service provided
2009 .94 2020
No, and we do not anticipate setting one in the next 2 years
Ryder’s intensity target is to reduce emissions 20% by 2020 per unit of service provided (owned trucks). This target is measured by calculating FMS business Scope 1 (stationary) and Scope 2 emissions – representing operations - divided by our total number of owned vehicles, described as our “unit of service provided.” This target does not
ID
Scope
% of emissions in scope
% reduction
from base year
Metric
Base year
Normalized base year emissions covered by
target
Target year
Is this a science-based target?
Comment
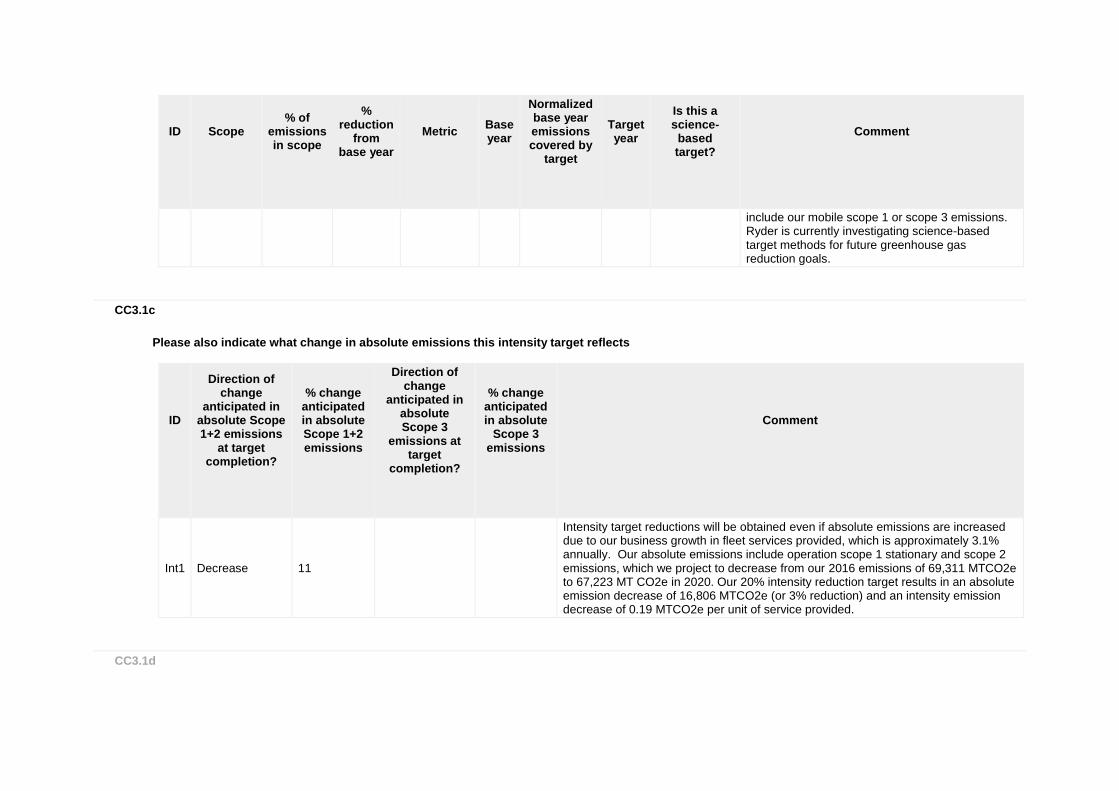
include our mobile scope 1 or scope 3 emissions. Ryder is currently investigating science-based target methods for future greenhouse gas reduction goals.
CC3.1c
Please also indicate what change in absolute emissions this intensity target reflects
ID
Direction of change
anticipated in absolute Scope 1+2 emissions
at target completion?
% change anticipated in absolute Scope 1+2 emissions
Direction of change
anticipated in absolute Scope 3
emissions at target
completion?
% change anticipated in absolute
Scope 3 emissions
Comment
Int1 Decrease 11
Intensity target reductions will be obtained even if absolute emissions are increased due to our business growth in fleet services provided, which is approximately 3.1% annually. Our absolute emissions include operation scope 1 stationary and scope 2 emissions, which we project to decrease from our 2016 emissions of 69,311 MTCO2e to 67,223 MT CO2e in 2020. Our 20% intensity reduction target results in an absolute emission decrease of 16,806 MTCO2e (or 3% reduction) and an intensity emission decrease of 0.19 MTCO2e per unit of service provided.
CC3.1d
Please provide details of your renewable energy consumption and/or production target
ID
Energy types
covered by target
Base year
Base year energy for energy type covered
(MWh)
% renewable
energy in base year
Target year
% renewable
energy in target year
Comment
CC3.1e
For all of your targets, please provide details on the progress made in the reporting year
ID
% complete (time)
% complete (emissions or renewable energy)
Comment
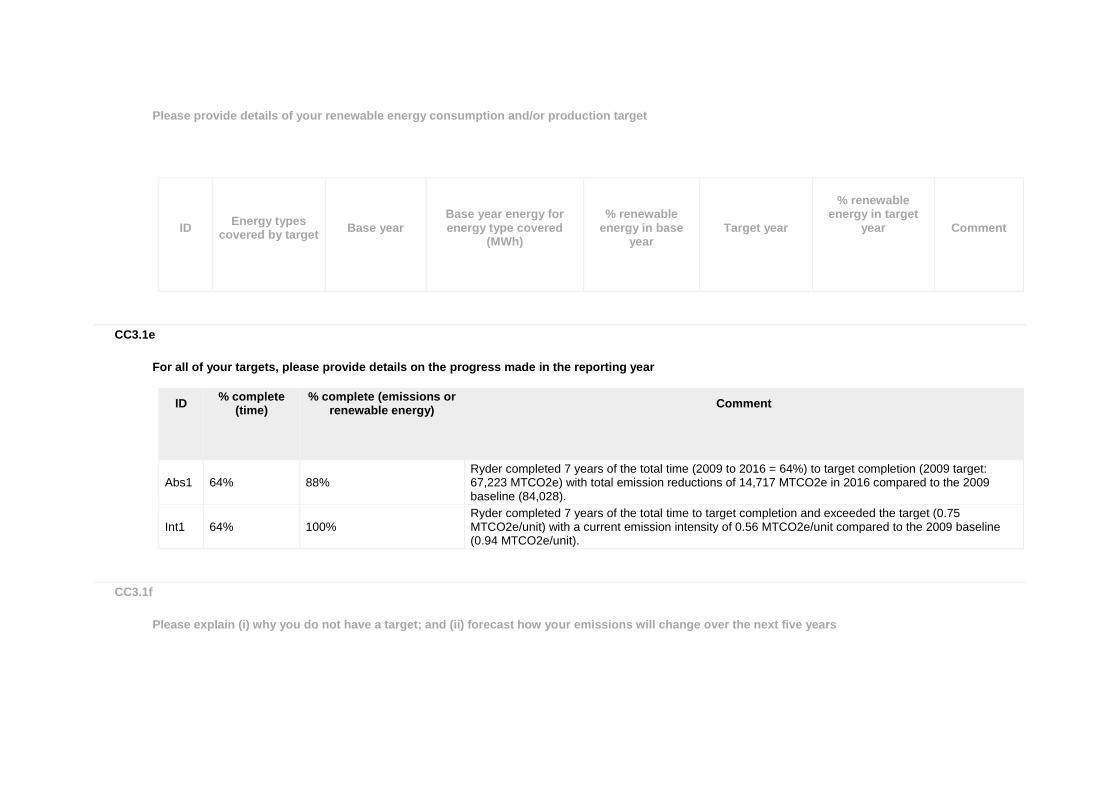
Abs1 64% 88% Ryder completed 7 years of the total time (2009 to 2016 = 64%) to target completion (2009 target: 67,223 MTCO2e) with total emission reductions of 14,717 MTCO2e in 2016 compared to the 2009 baseline (84,028).
Int1 64% 100% Ryder completed 7 years of the total time to target completion and exceeded the target (0.75 MTCO2e/unit) with a current emission intensity of 0.56 MTCO2e/unit compared to the 2009 baseline (0.94 MTCO2e/unit).
CC3.1f
Please explain (i) why you do not have a target; and (ii) forecast how your emissions will change over the next five years
CC3.2
Do you classify any of your existing goods and/or services as low carbon products or do they enable a third party to avoid GHG emissions?
Yes
CC3.2a
Please provide details of your products and/or services that you classify as low carbon products or that enable a third party to avoid GHG emissions
Level of
aggregation
Description of product/Group of
products
Are you
reporting low carbon product/s or avoided emissions?
Taxonomy, project or
methodology used to classify
product/s as low carbon
or to calculate avoided
emissions
%
revenue from low carbon
product/s in the
reporting year
% R&D in
low carbon
product/s in the
reporting year
Comment
Company-wide
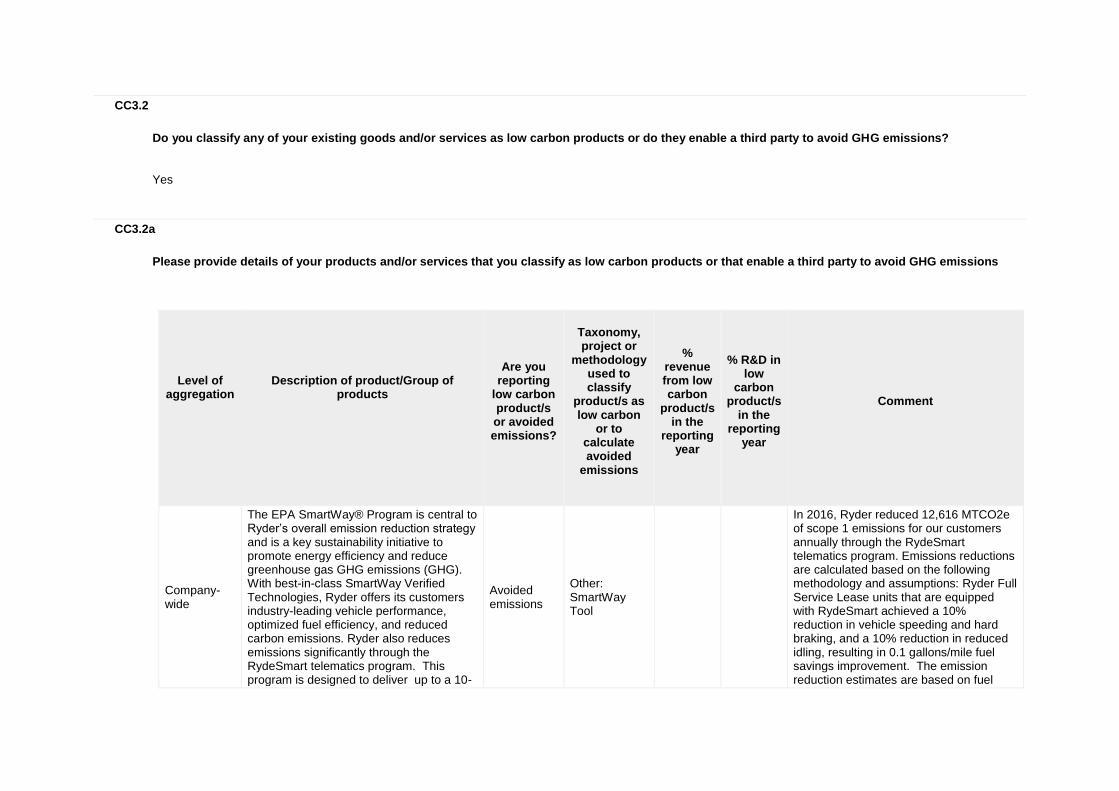
The EPA SmartWay® Program is central to Ryder’s overall emission reduction strategy and is a key sustainability initiative to promote energy efficiency and reduce greenhouse gas GHG emissions (GHG). With best-in-class SmartWay Verified Technologies, Ryder offers its customers industry-leading vehicle performance, optimized fuel efficiency, and reduced carbon emissions. Ryder also reduces emissions significantly through the RydeSmart telematics program. This program is designed to deliver up to a 10-
Avoided emissions
Other: SmartWay Tool
In 2016, Ryder reduced 12,616 MTCO2e of scope 1 emissions for our customers annually through the RydeSmart telematics program. Emissions reductions are calculated based on the following methodology and assumptions: Ryder Full Service Lease units that are equipped with RydeSmart achieved a 10% reduction in vehicle speeding and hard braking, and a 10% reduction in reduced idling, resulting in 0.1 gallons/mile fuel savings improvement. The emission reduction estimates are based on fuel
Level of
aggregation
Description of product/Group of
products
Are you
reporting low carbon product/s or avoided emissions?
Taxonomy, project or
methodology used to classify
product/s as low carbon
or to calculate avoided
emissions
%
revenue from low carbon
product/s in the
reporting year
% R&D in
low carbon
product/s in the
reporting year
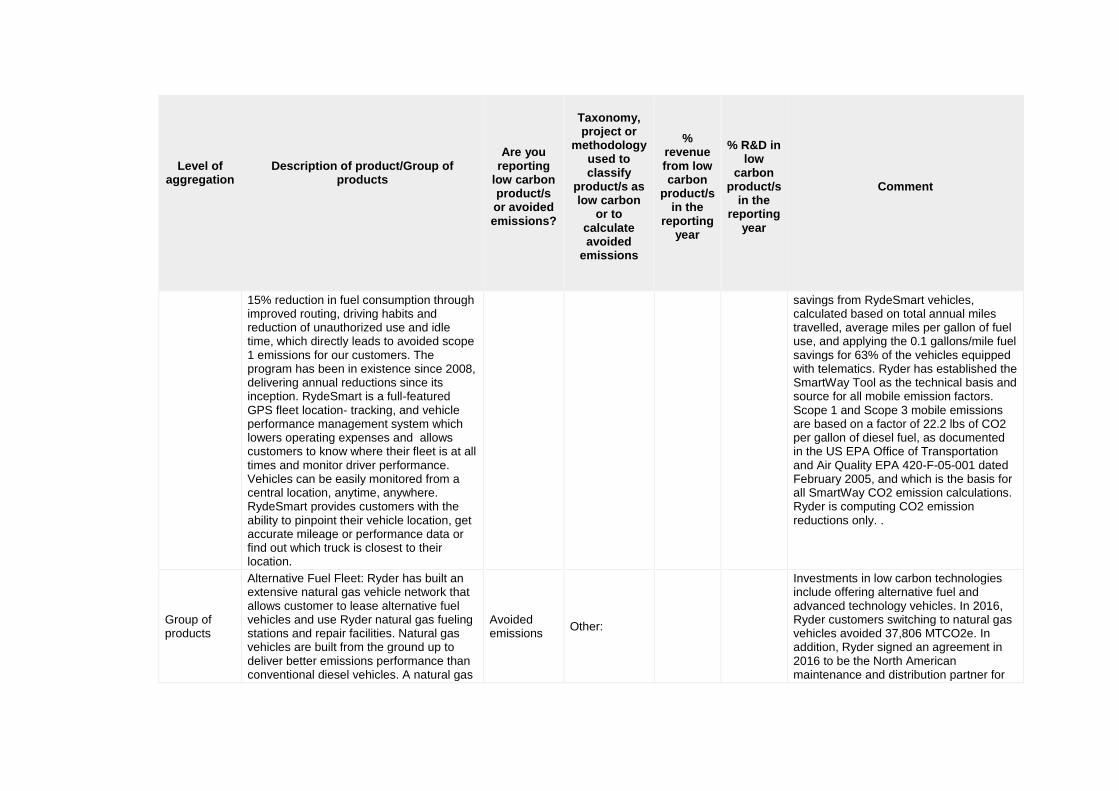
Comment
15% reduction in fuel consumption through improved routing, driving habits and reduction of unauthorized use and idle time, which directly leads to avoided scope 1 emissions for our customers. The program has been in existence since 2008, delivering annual reductions since its inception. RydeSmart is a full-featured GPS fleet location- tracking, and vehicle performance management system which lowers operating expenses and allows customers to know where their fleet is at all times and monitor driver performance. Vehicles can be easily monitored from a central location, anytime, anywhere. RydeSmart provides customers with the ability to pinpoint their vehicle location, get accurate mileage or performance data or find out which truck is closest to their location.
savings from RydeSmart vehicles, calculated based on total annual miles travelled, average miles per gallon of fuel use, and applying the 0.1 gallons/mile fuel savings for 63% of the vehicles equipped with telematics. Ryder has established the SmartWay Tool as the technical basis and source for all mobile emission factors. Scope 1 and Scope 3 mobile emissions are based on a factor of 22.2 lbs of CO2 per gallon of diesel fuel, as documented in the US EPA Office of Transportation and Air Quality EPA 420-F-05-001 dated February 2005, and which is the basis for all SmartWay CO2 emission calculations. Ryder is computing CO2 emission reductions only. .
Group of products
Alternative Fuel Fleet: Ryder has built an extensive natural gas vehicle network that allows customer to lease alternative fuel vehicles and use Ryder natural gas fueling stations and repair facilities. Natural gas vehicles are built from the ground up to deliver better emissions performance than conventional diesel vehicles. A natural gas
Avoided emissions
Other:
Investments in low carbon technologies include offering alternative fuel and advanced technology vehicles. In 2016, Ryder customers switching to natural gas vehicles avoided 37,806 MTCO2e. In addition, Ryder signed an agreement in 2016 to be the North American maintenance and distribution partner for
Level of
aggregation
Description of product/Group of
products
Are you
reporting low carbon product/s or avoided emissions?
Taxonomy, project or
methodology used to classify
product/s as low carbon
or to calculate avoided
emissions
%
revenue from low carbon
product/s in the
reporting year
% R&D in
low carbon
product/s in the
reporting year
Comment
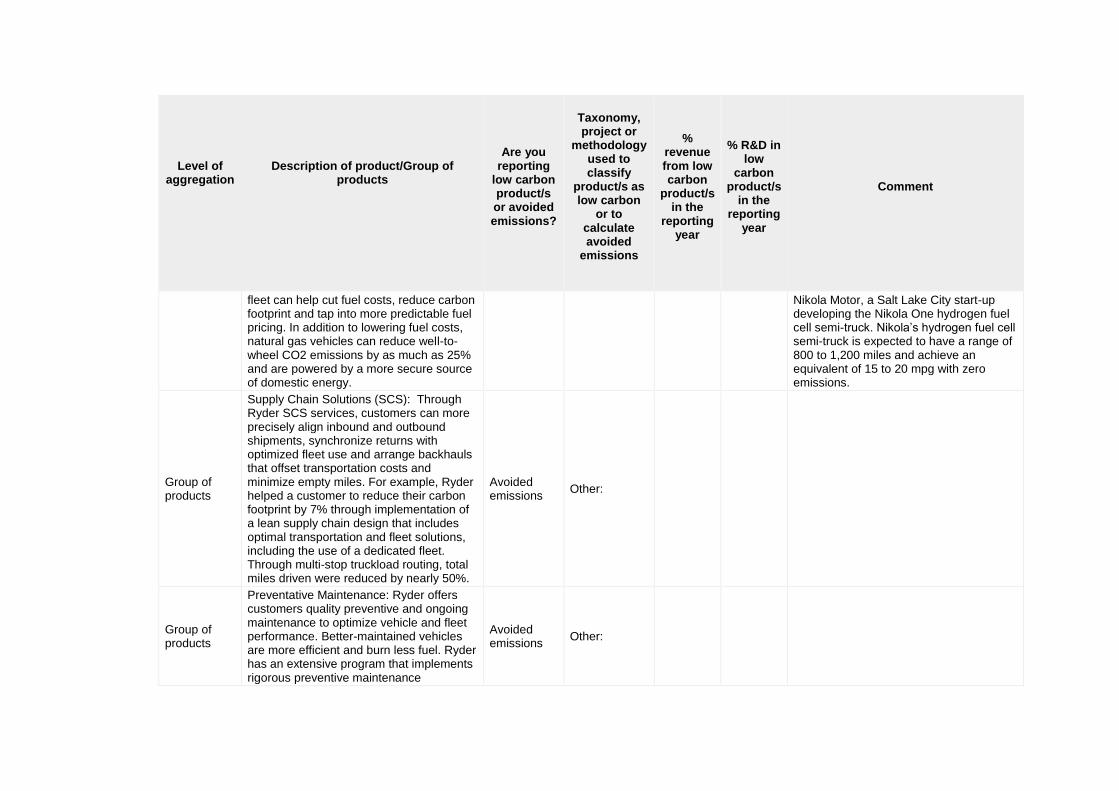
fleet can help cut fuel costs, reduce carbon footprint and tap into more predictable fuel pricing. In addition to lowering fuel costs, natural gas vehicles can reduce well-to-wheel CO2 emissions by as much as 25% and are powered by a more secure source of domestic energy.
Nikola Motor, a Salt Lake City start-up developing the Nikola One hydrogen fuel cell semi-truck. Nikola’s hydrogen fuel cell semi-truck is expected to have a range of 800 to 1,200 miles and achieve an equivalent of 15 to 20 mpg with zero emissions.
Group of products
Supply Chain Solutions (SCS): Through Ryder SCS services, customers can more precisely align inbound and outbound shipments, synchronize returns with optimized fleet use and arrange backhauls that offset transportation costs and minimize empty miles. For example, Ryder helped a customer to reduce their carbon footprint by 7% through implementation of a lean supply chain design that includes optimal transportation and fleet solutions, including the use of a dedicated fleet. Through multi-stop truckload routing, total miles driven were reduced by nearly 50%.
Avoided emissions
Other:
Group of products
Preventative Maintenance: Ryder offers customers quality preventive and ongoing maintenance to optimize vehicle and fleet performance. Better-maintained vehicles are more efficient and burn less fuel. Ryder has an extensive program that implements rigorous preventive maintenance
Avoided emissions
Other:
Level of
aggregation
Description of product/Group of
products
Are you
reporting low carbon product/s or avoided emissions?
Taxonomy, project or
methodology used to classify
product/s as low carbon
or to calculate avoided
emissions
%
revenue from low carbon
product/s in the
reporting year
% R&D in
low carbon
product/s in the
reporting year
Comment
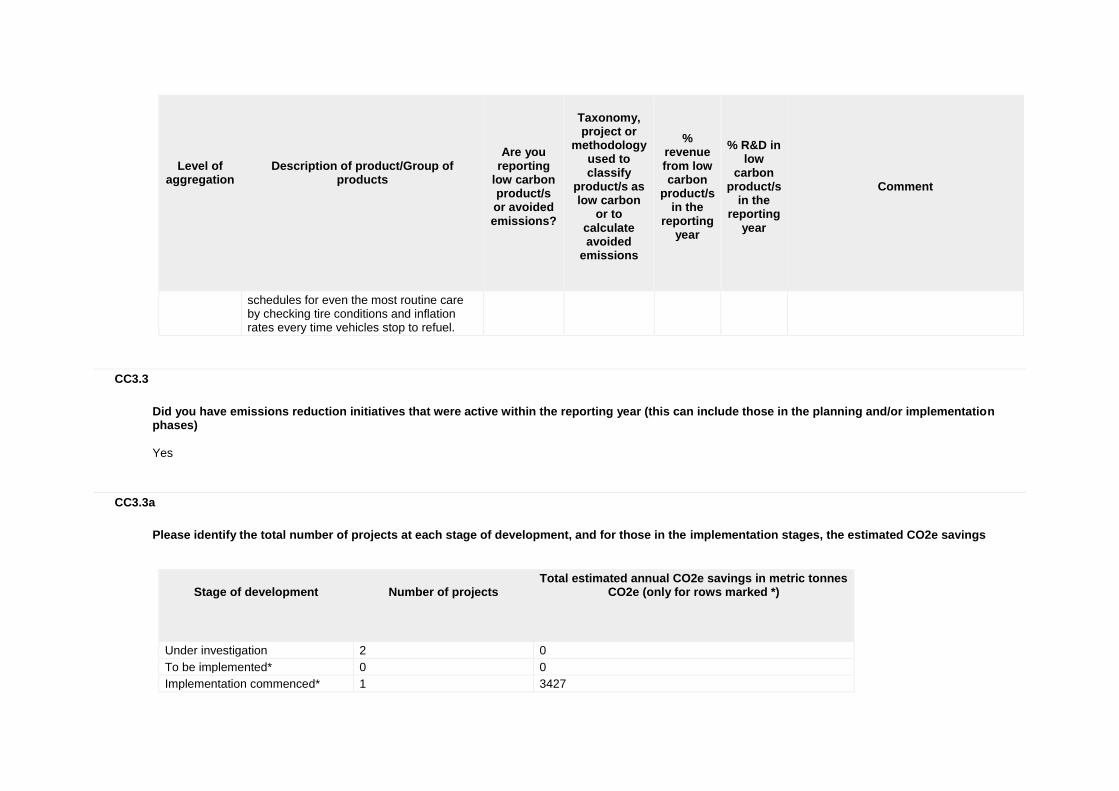
schedules for even the most routine care by checking tire conditions and inflation rates every time vehicles stop to refuel.
CC3.3
Did you have emissions reduction initiatives that were active within the reporting year (this can include those in the planning and/or implementation phases)
Yes
CC3.3a
Please identify the total number of projects at each stage of development, and for those in the implementation stages, the estimated CO2e savings
Stage of development
Number of projects
Total estimated annual CO2e savings in metric tonnes CO2e (only for rows marked *)
Under investigation 2 0
To be implemented* 0 0
Implementation commenced* 1 3427
Stage of development
Number of projects
Total estimated annual CO2e savings in metric tonnes CO2e (only for rows marked *)
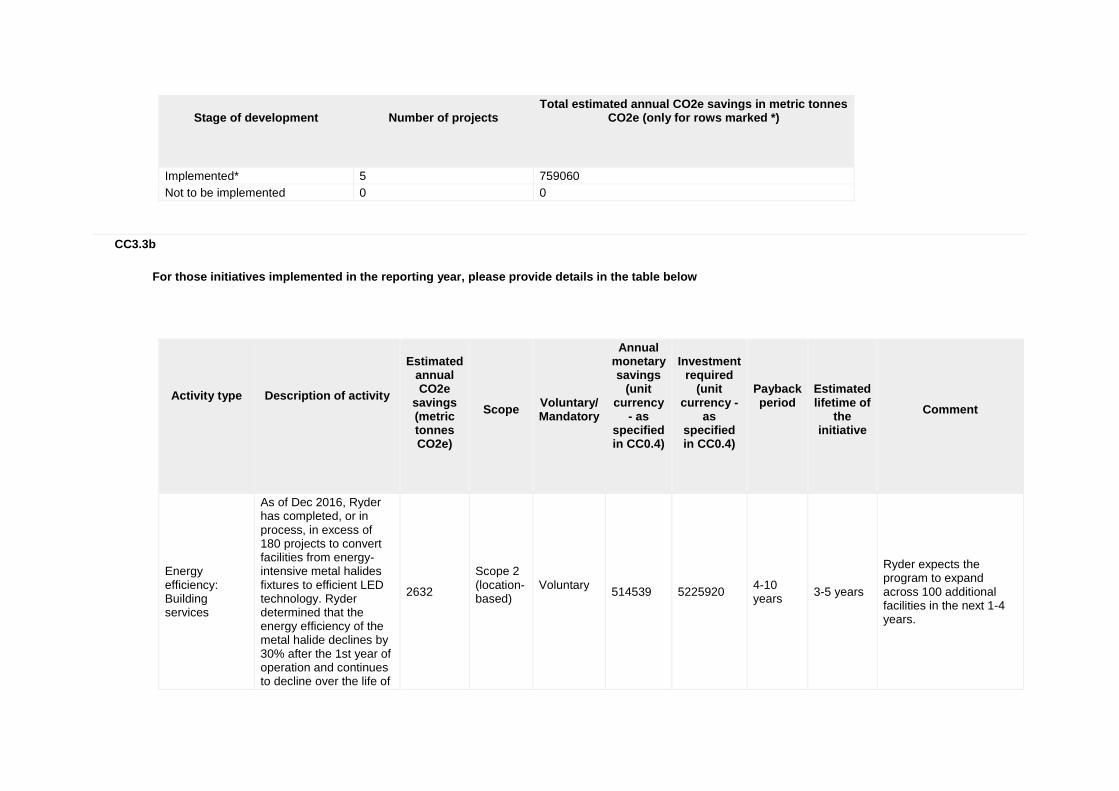
Implemented* 5 759060
Not to be implemented 0 0
CC3.3b
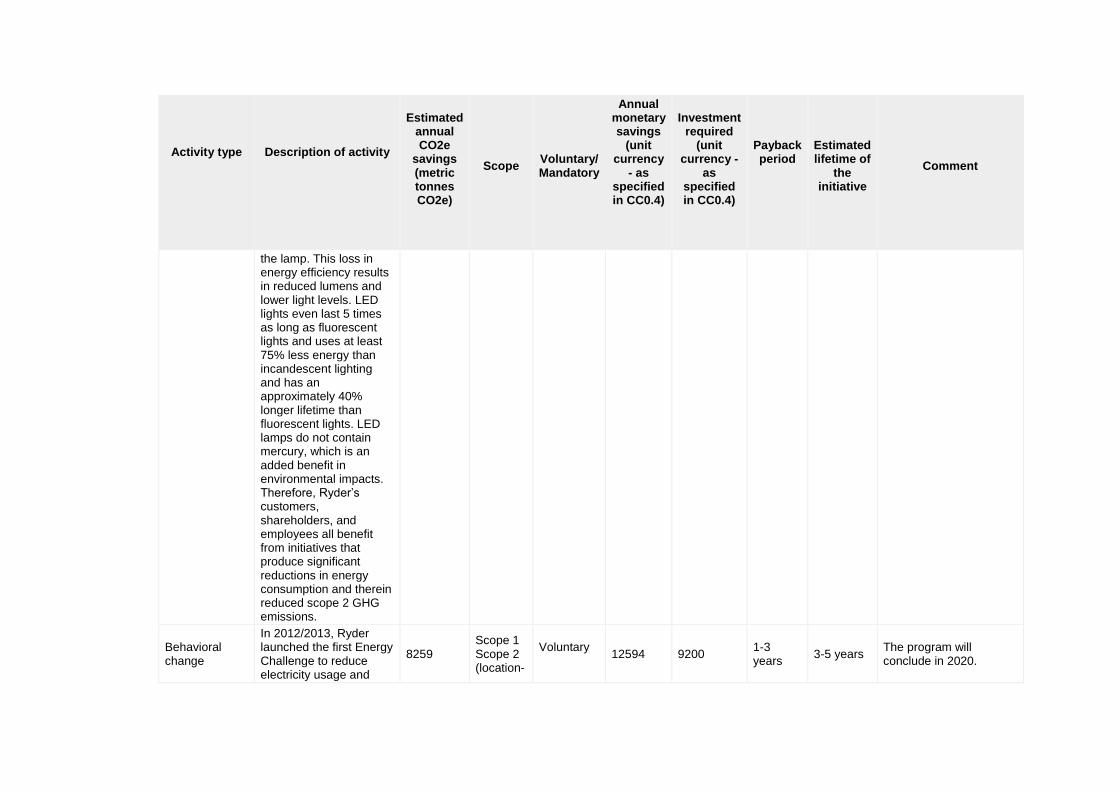
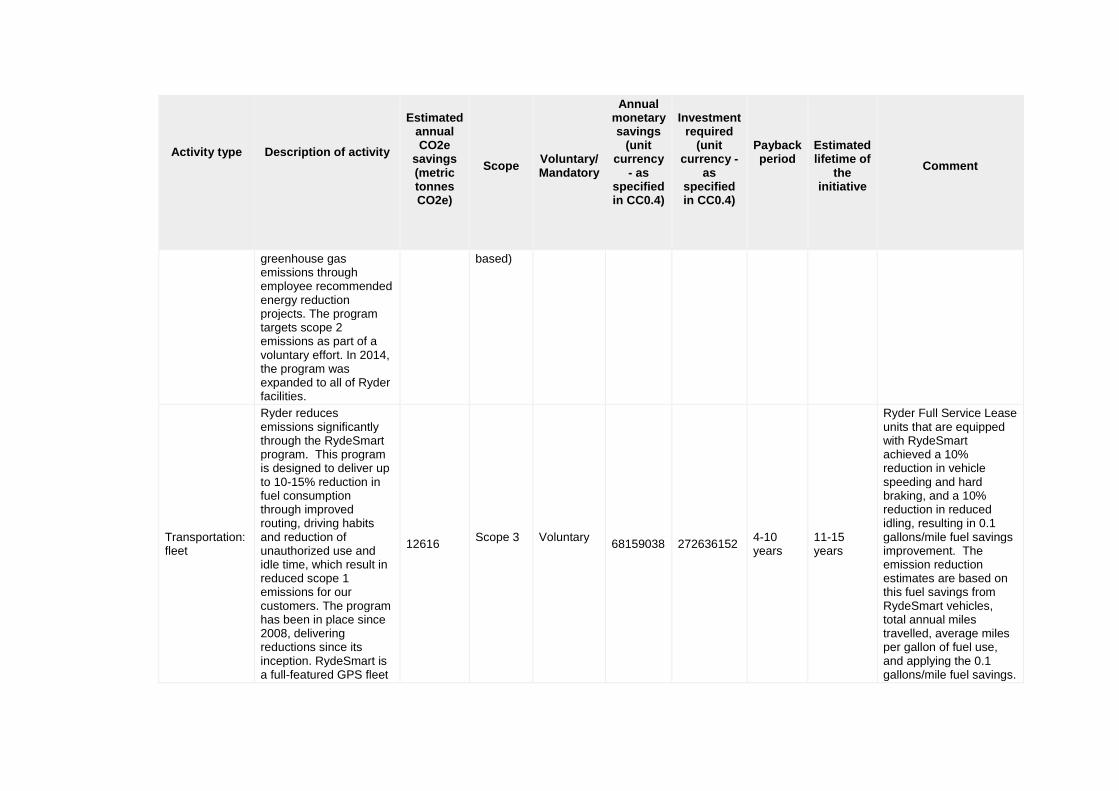
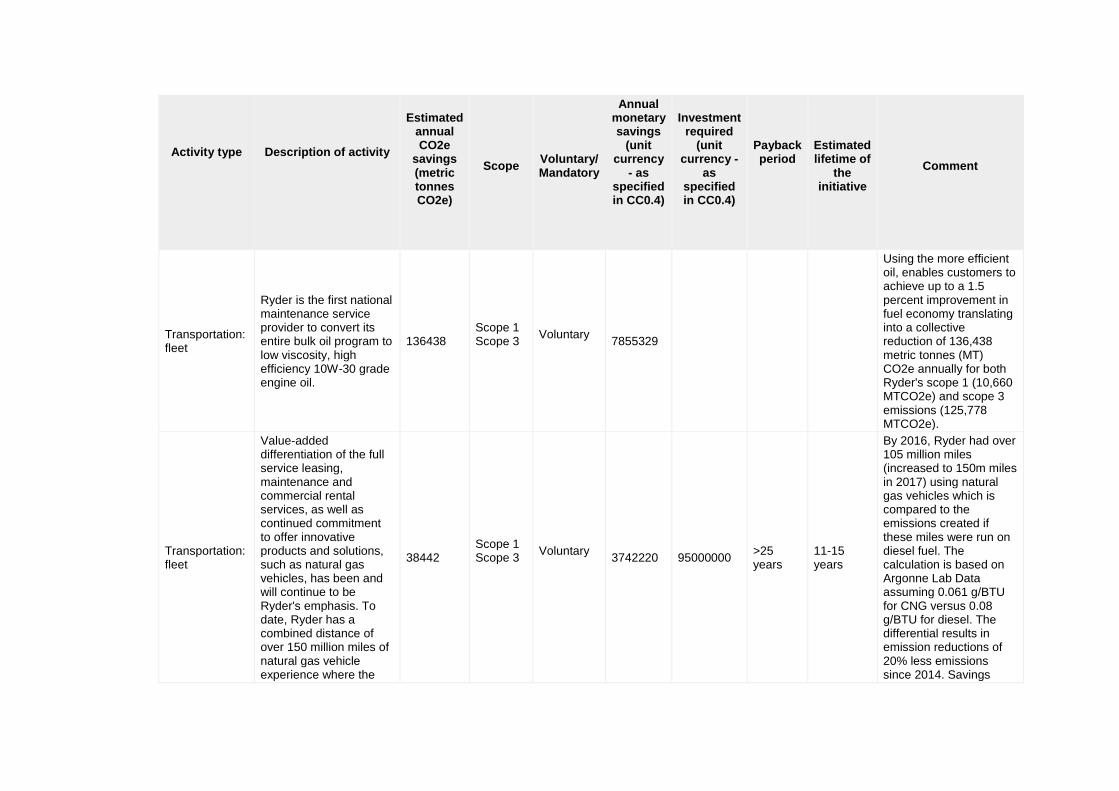
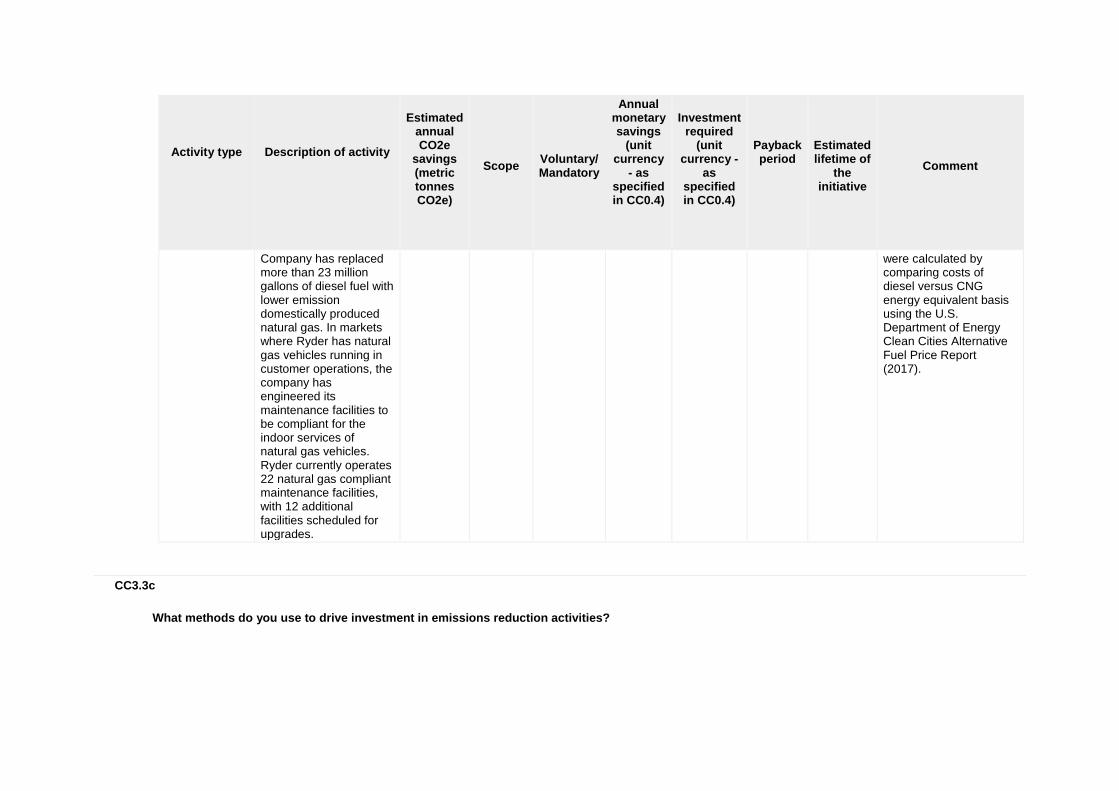
For those initiatives implemented in the reporting year, please provide details in the table below
Activity type
Description of activity
Estimated annual CO2e
savings (metric tonnes CO2e)
Scope
Voluntary/ Mandatory
Annual monetary savings
(unit currency
- as specified in CC0.4)
Investment required
(unit currency -
as specified in CC0.4)
Payback period
Estimated lifetime of
the initiative
Comment
Energy efficiency: Building services
As of Dec 2016, Ryder has completed, or in process, in excess of 180 projects to convert facilities from energy-intensive metal halides fixtures to efficient LED technology. Ryder determined that the energy efficiency of the metal halide declines by 30% after the 1st year of operation and continues to decline over the life of
2632
Scope 2 (location-based)
Voluntary
514539 5225920 4-10 years
3-5 years
Ryder expects the program to expand across 100 additional facilities in the next 1-4 years.
Activity type
Description of activity
Estimated annual CO2e
savings (metric tonnes CO2e)
Scope
Voluntary/ Mandatory
Annual monetary savings
(unit currency
- as specified in CC0.4)
Investment required
(unit currency -
as specified in CC0.4)
Payback period
Estimated lifetime of
the initiative
Comment
the lamp. This loss in energy efficiency results in reduced lumens and lower light levels. LED lights even last 5 times as long as fluorescent lights and uses at least 75% less energy than incandescent lighting and has an approximately 40% longer lifetime than fluorescent lights. LED lamps do not contain mercury, which is an added benefit in environmental impacts. Therefore, Ryder’s customers, shareholders, and employees all benefit from initiatives that produce significant reductions in energy consumption and therein reduced scope 2 GHG emissions.
Behavioral change
In 2012/2013, Ryder launched the first Energy Challenge to reduce electricity usage and
8259 Scope 1 Scope 2 (location-
Voluntary
12594 9200 1-3 years
3-5 years The program will conclude in 2020.
Activity type
Description of activity
Estimated annual CO2e
savings (metric tonnes CO2e)
Scope
Voluntary/ Mandatory
Annual monetary savings
(unit currency
- as specified in CC0.4)
Investment required
(unit currency -
as specified in CC0.4)
Payback period
Estimated lifetime of
the initiative
Comment
greenhouse gas emissions through employee recommended energy reduction projects. The program targets scope 2 emissions as part of a voluntary effort. In 2014, the program was expanded to all of Ryder facilities.
based)
Transportation: fleet
Ryder reduces emissions significantly through the RydeSmart program. This program is designed to deliver up to 10-15% reduction in fuel consumption through improved routing, driving habits and reduction of unauthorized use and idle time, which result in reduced scope 1 emissions for our customers. The program has been in place since 2008, delivering reductions since its inception. RydeSmart is a full-featured GPS fleet
12616 Scope 3
Voluntary
68159038 272636152 4-10 years
11-15 years
Ryder Full Service Lease units that are equipped with RydeSmart achieved a 10% reduction in vehicle speeding and hard braking, and a 10% reduction in reduced idling, resulting in 0.1 gallons/mile fuel savings improvement. The emission reduction estimates are based on this fuel savings from RydeSmart vehicles, total annual miles travelled, average miles per gallon of fuel use, and applying the 0.1 gallons/mile fuel savings.
Activity type
Description of activity
Estimated annual CO2e
savings (metric tonnes CO2e)
Scope
Voluntary/ Mandatory
Annual monetary savings
(unit currency
- as specified in CC0.4)
Investment required
(unit currency -
as specified in CC0.4)
Payback period
Estimated lifetime of
the initiative
Comment
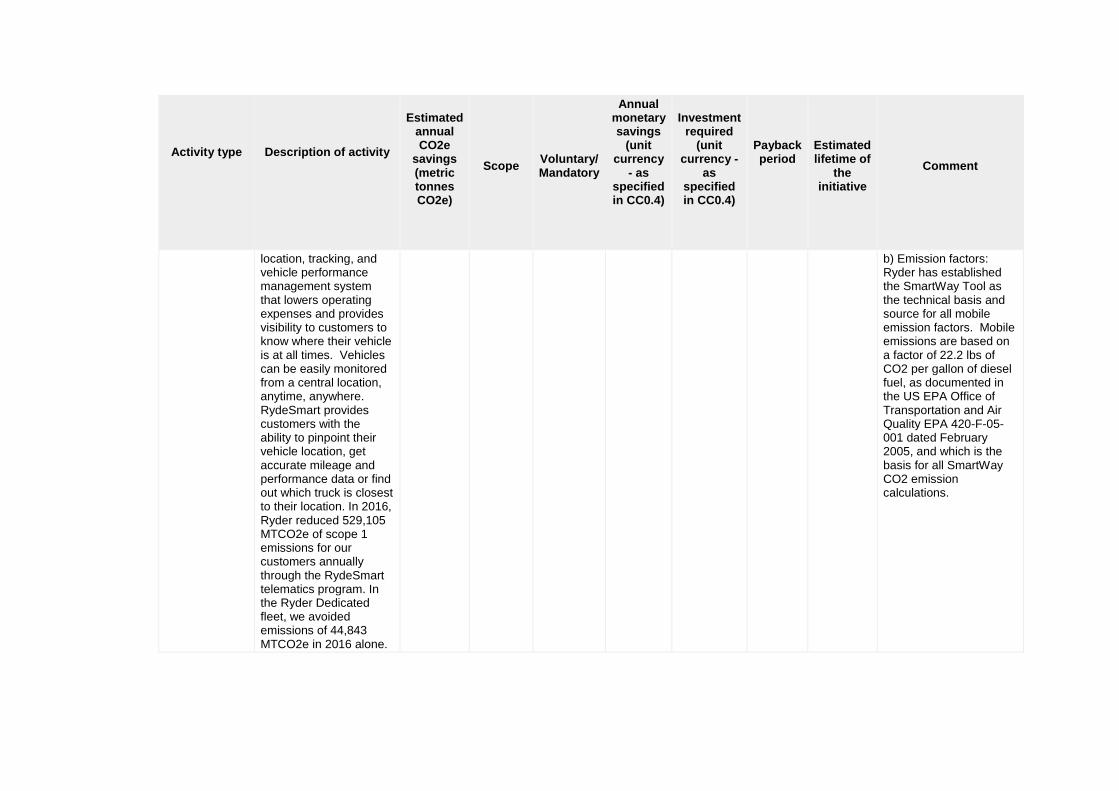
location, tracking, and vehicle performance management system that lowers operating expenses and provides visibility to customers to know where their vehicle is at all times. Vehicles can be easily monitored from a central location, anytime, anywhere. RydeSmart provides customers with the ability to pinpoint their vehicle location, get accurate mileage and performance data or find out which truck is closest to their location. In 2016, Ryder reduced 529,105 MTCO2e of scope 1 emissions for our customers annually through the RydeSmart telematics program. In the Ryder Dedicated fleet, we avoided emissions of 44,843 MTCO2e in 2016 alone.
b) Emission factors: Ryder has established the SmartWay Tool as the technical basis and source for all mobile emission factors. Mobile emissions are based on a factor of 22.2 lbs of CO2 per gallon of diesel fuel, as documented in the US EPA Office of Transportation and Air Quality EPA 420-F-05-001 dated February 2005, and which is the basis for all SmartWay CO2 emission calculations.
Activity type
Description of activity
Estimated annual CO2e
savings (metric tonnes CO2e)
Scope
Voluntary/ Mandatory
Annual monetary savings
(unit currency
- as specified in CC0.4)
Investment required
(unit currency -
as specified in CC0.4)
Payback period
Estimated lifetime of
the initiative
Comment
Transportation: fleet
Ryder is the first national maintenance service provider to convert its entire bulk oil program to low viscosity, high efficiency 10W-30 grade engine oil.
136438 Scope 1 Scope 3
Voluntary
7855329
Using the more efficient oil, enables customers to achieve up to a 1.5 percent improvement in fuel economy translating into a collective reduction of 136,438 metric tonnes (MT) CO2e annually for both Ryder's scope 1 (10,660 MTCO2e) and scope 3 emissions (125,778 MTCO2e).
Transportation: fleet
Value-added differentiation of the full service leasing, maintenance and commercial rental services, as well as continued commitment to offer innovative products and solutions, such as natural gas vehicles, has been and will continue to be Ryder's emphasis. To date, Ryder has a combined distance of over 150 million miles of natural gas vehicle experience where the
38442 Scope 1 Scope 3
Voluntary
3742220 95000000 >25 years
11-15 years
By 2016, Ryder had over 105 million miles (increased to 150m miles in 2017) using natural gas vehicles which is compared to the emissions created if these miles were run on diesel fuel. The calculation is based on Argonne Lab Data assuming 0.061 g/BTU for CNG versus 0.08 g/BTU for diesel. The differential results in emission reductions of 20% less emissions since 2014. Savings
Activity type
Description of activity
Estimated annual CO2e
savings (metric tonnes CO2e)
Scope
Voluntary/ Mandatory
Annual monetary savings
(unit currency
- as specified in CC0.4)
Investment required
(unit currency -
as specified in CC0.4)
Payback period
Estimated lifetime of
the initiative
Comment
Company has replaced more than 23 million gallons of diesel fuel with lower emission domestically produced natural gas. In markets where Ryder has natural gas vehicles running in customer operations, the company has engineered its maintenance facilities to be compliant for the indoor services of natural gas vehicles. Ryder currently operates 22 natural gas compliant maintenance facilities, with 12 additional facilities scheduled for upgrades.
were calculated by comparing costs of diesel versus CNG energy equivalent basis using the U.S. Department of Energy Clean Cities Alternative Fuel Price Report (2017).
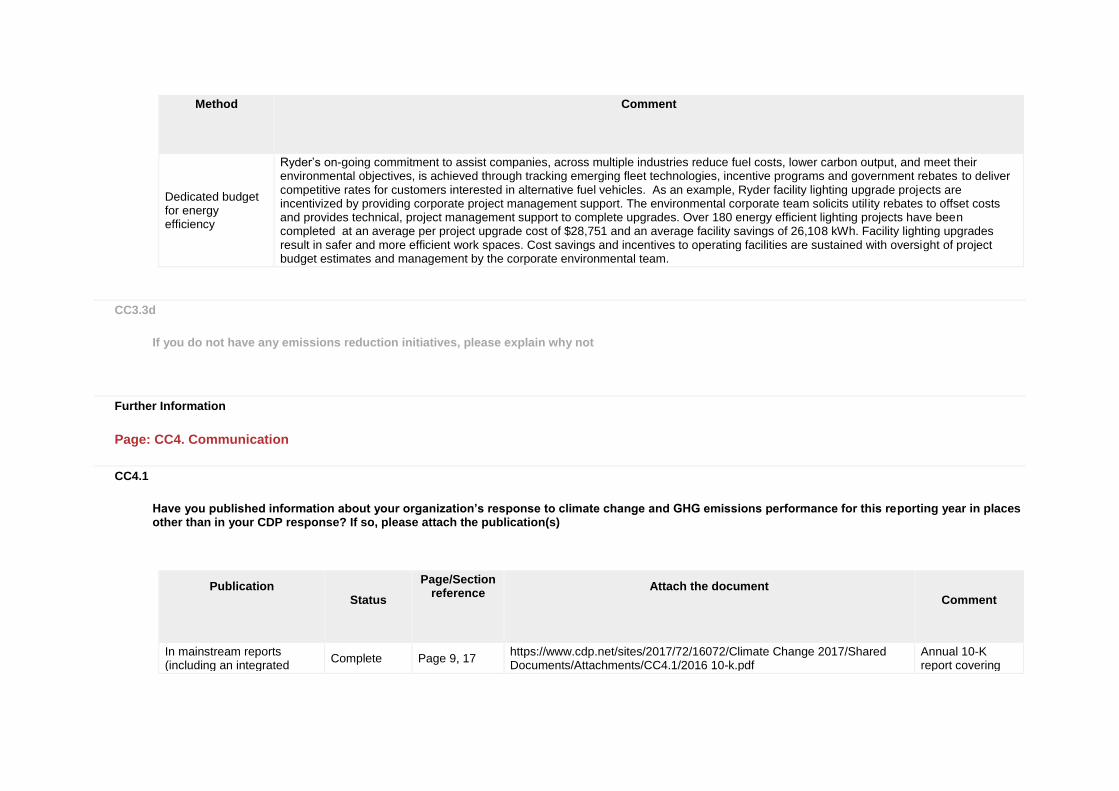
CC3.3c
What methods do you use to drive investment in emissions reduction activities?
Method
Comment
Dedicated budget for energy efficiency
Ryder’s on-going commitment to assist companies, across multiple industries reduce fuel costs, lower carbon output, and meet their environmental objectives, is achieved through tracking emerging fleet technologies, incentive programs and government rebates to deliver competitive rates for customers interested in alternative fuel vehicles. As an example, Ryder facility lighting upgrade projects are incentivized by providing corporate project management support. The environmental corporate team solicits utility rebates to offset costs and provides technical, project management support to complete upgrades. Over 180 energy efficient lighting projects have been completed at an average per project upgrade cost of $28,751 and an average facility savings of 26,108 kWh. Facility lighting upgrades result in safer and more efficient work spaces. Cost savings and incentives to operating facilities are sustained with oversight of project budget estimates and management by the corporate environmental team.
CC3.3d
If you do not have any emissions reduction initiatives, please explain why not
Further Information
Page: CC4. Communication
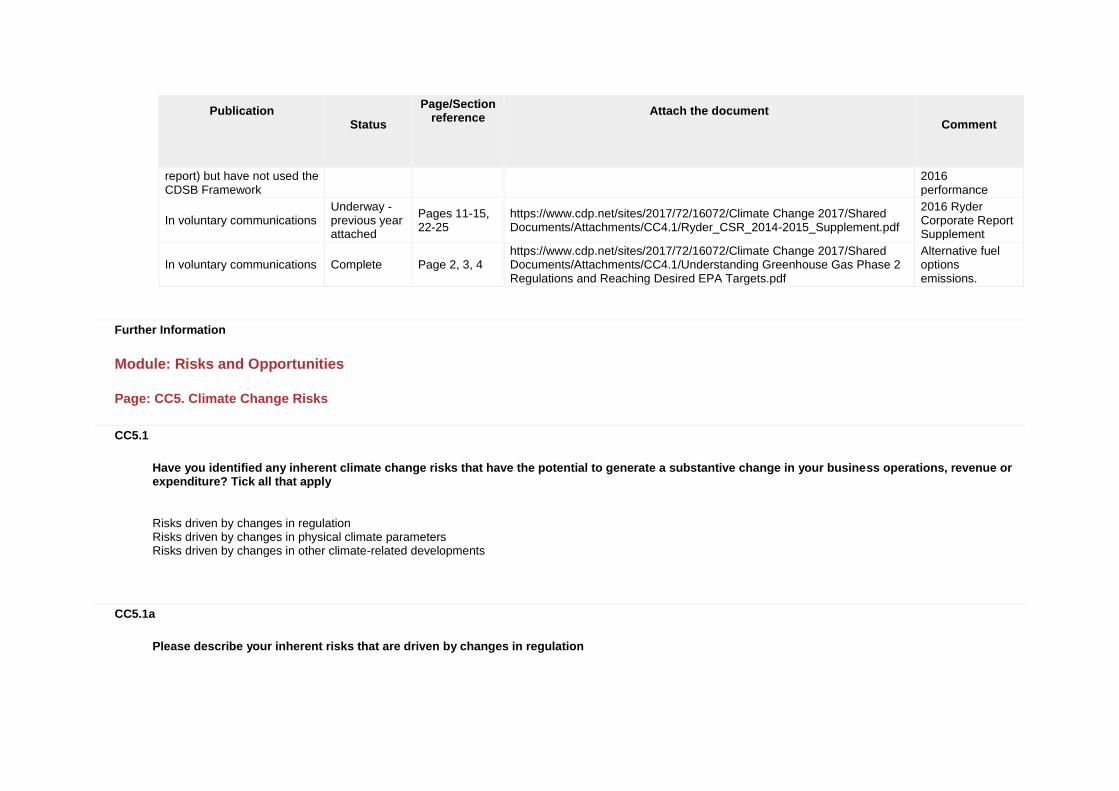
CC4.1
Have you published information about your organization’s response to climate change and GHG emissions performance for this reporting year in places other than in your CDP response? If so, please attach the publication(s)
Publication
Status
Page/Section reference
Attach the document
Comment
In mainstream reports (including an integrated
Complete Page 9, 17 https://www.cdp.net/sites/2017/72/16072/Climate Change 2017/Shared Documents/Attachments/CC4.1/2016 10-k.pdf
Annual 10-K report covering
Publication
Status
Page/Section reference
Attach the document
Comment
report) but have not used the CDSB Framework
2016 performance
In voluntary communications Underway - previous year attached
Pages 11-15, 22-25
https://www.cdp.net/sites/2017/72/16072/Climate Change 2017/Shared Documents/Attachments/CC4.1/Ryder_CSR_2014-2015_Supplement.pdf
2016 Ryder Corporate Report Supplement
In voluntary communications Complete Page 2, 3, 4 https://www.cdp.net/sites/2017/72/16072/Climate Change 2017/Shared Documents/Attachments/CC4.1/Understanding Greenhouse Gas Phase 2 Regulations and Reaching Desired EPA Targets.pdf
Alternative fuel options emissions.
Further Information
Module: Risks and Opportunities
Page: CC5. Climate Change Risks
CC5.1
Have you identified any inherent climate change risks that have the potential to generate a substantive change in your business operations, revenue or expenditure? Tick all that apply
Risks driven by changes in regulation Risks driven by changes in physical climate parameters Risks driven by changes in other climate-related developments
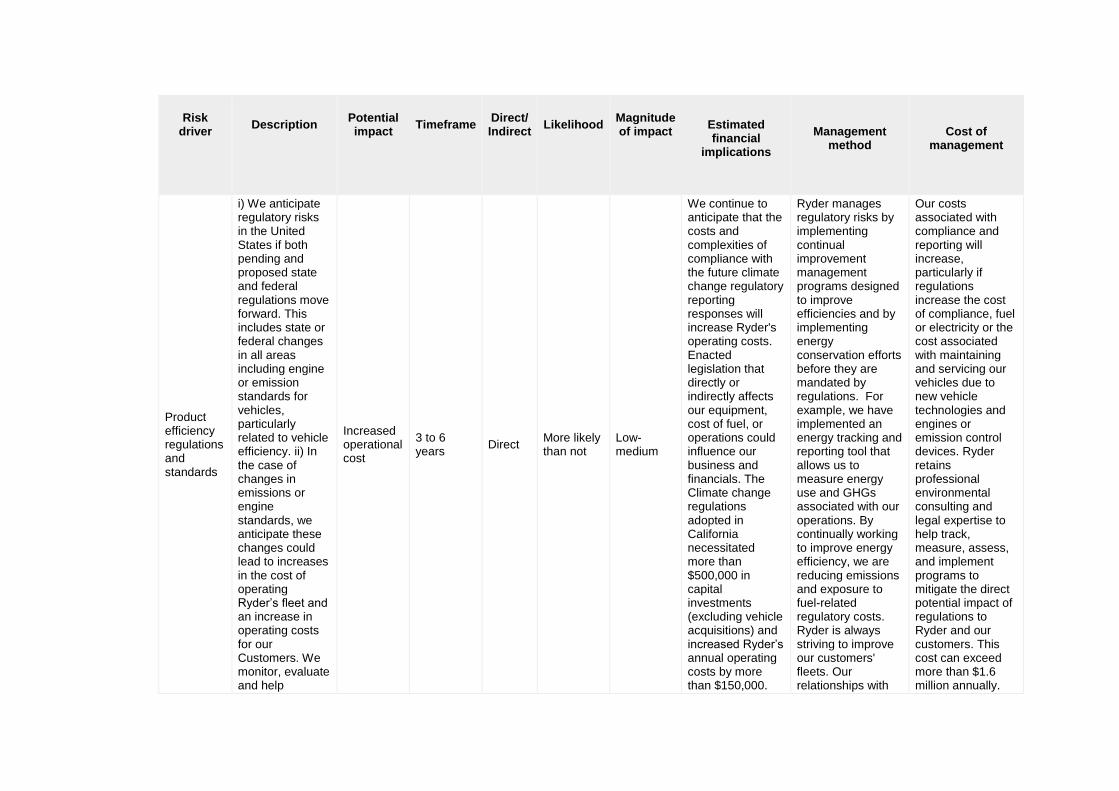
CC5.1a
Please describe your inherent risks that are driven by changes in regulation
Risk driver
Description
Potential impact
Timeframe
Direct/ Indirect
Likelihood
Magnitude of impact
Estimated financial
implications
Management
method
Cost of
management
Product efficiency regulations and standards
i) We anticipate regulatory risks in the United States if both pending and proposed state and federal regulations move forward. This includes state or federal changes in all areas including engine or emission standards for vehicles, particularly related to vehicle efficiency. ii) In the case of changes in emissions or engine standards, we anticipate these changes could lead to increases in the cost of operating Ryder’s fleet and an increase in operating costs for our Customers. We monitor, evaluate and help
Increased operational cost
3 to 6 years
Direct More likely than not
Low-medium
We continue to anticipate that the costs and complexities of compliance with the future climate change regulatory reporting responses will increase Ryder's operating costs. Enacted legislation that directly or indirectly affects our equipment, cost of fuel, or operations could influence our business and financials. The Climate change regulations adopted in California necessitated more than $500,000 in capital investments (excluding vehicle acquisitions) and increased Ryder’s annual operating costs by more than $150,000.
Ryder manages regulatory risks by implementing continual improvement management programs designed to improve efficiencies and by implementing energy conservation efforts before they are mandated by regulations. For example, we have implemented an energy tracking and reporting tool that allows us to measure energy use and GHGs associated with our operations. By continually working to improve energy efficiency, we are reducing emissions and exposure to fuel-related regulatory costs. Ryder is always striving to improve our customers' fleets. Our relationships with
Our costs associated with compliance and reporting will increase, particularly if regulations increase the cost of compliance, fuel or electricity or the cost associated with maintaining and servicing our vehicles due to new vehicle technologies and engines or emission control devices. Ryder retains professional environmental consulting and legal expertise to help track, measure, assess, and implement programs to mitigate the direct potential impact of regulations to Ryder and our customers. This cost can exceed more than $1.6 million annually.
Risk driver
Description
Potential impact
Timeframe
Direct/ Indirect
Likelihood
Magnitude of impact
Estimated financial
implications
Management
method
Cost of
management
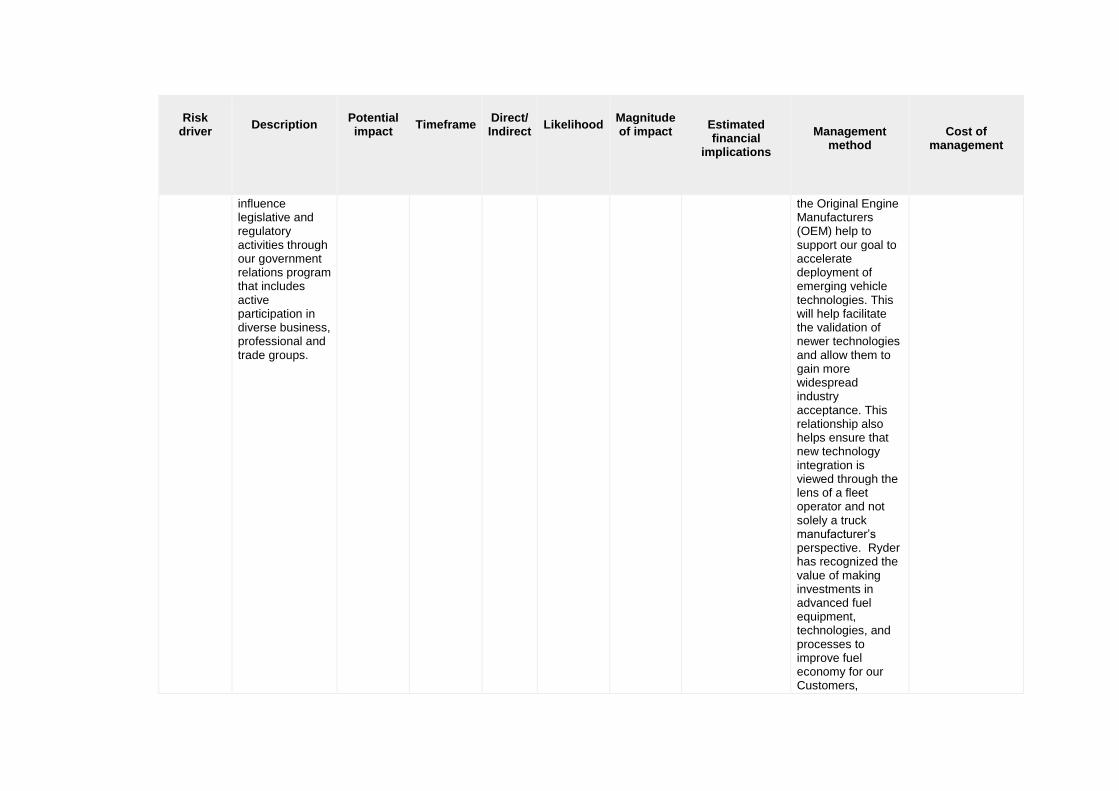
influence legislative and regulatory activities through our government relations program that includes active participation in diverse business, professional and trade groups.
the Original Engine Manufacturers (OEM) help to support our goal to accelerate deployment of emerging vehicle technologies. This will help facilitate the validation of newer technologies and allow them to gain more widespread industry acceptance. This relationship also helps ensure that new technology integration is viewed through the lens of a fleet operator and not solely a truck manufacturer’s perspective. Ryder has recognized the value of making investments in advanced fuel equipment, technologies, and processes to improve fuel economy for our Customers,
Risk driver
Description
Potential impact
Timeframe
Direct/ Indirect
Likelihood
Magnitude of impact
Estimated financial
implications
Management
method
Cost of
management
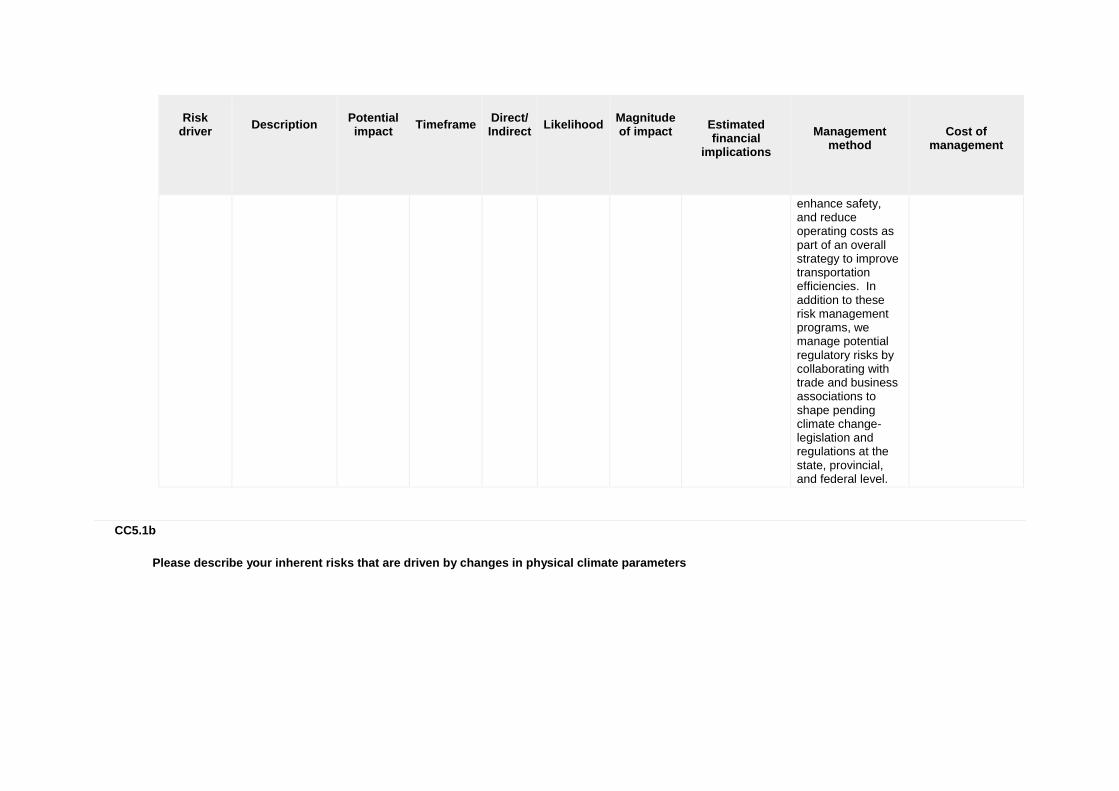
enhance safety, and reduce operating costs as part of an overall strategy to improve transportation efficiencies. In addition to these risk management programs, we manage potential regulatory risks by collaborating with trade and business associations to shape pending climate change- legislation and regulations at the state, provincial, and federal level.
CC5.1b
Please describe your inherent risks that are driven by changes in physical climate parameters
Risk driver
Description
Potential impact
Timeframe
Direct/ Indirect
Likelihood
Magnitude of impact
Estimated financial
implications
Management method
Cost of
management
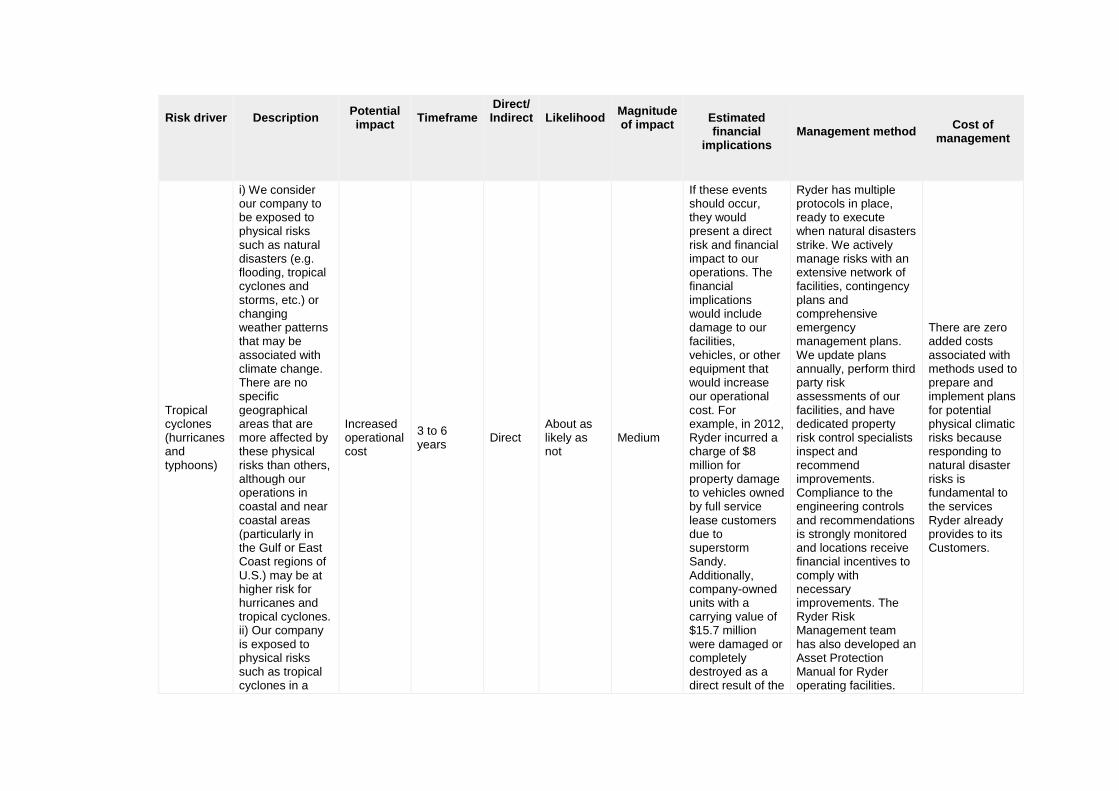
Tropical cyclones (hurricanes and typhoons)
i) We consider our company to be exposed to physical risks such as natural disasters (e.g. flooding, tropical cyclones and storms, etc.) or changing weather patterns that may be associated with climate change. There are no specific geographical areas that are more affected by these physical risks than others, although our operations in coastal and near coastal areas (particularly in the Gulf or East Coast regions of U.S.) may be at higher risk for hurricanes and tropical cyclones. ii) Our company is exposed to physical risks such as tropical cyclones in a
Increased operational cost
3 to 6 years
Direct About as likely as not
Medium
If these events should occur, they would present a direct risk and financial impact to our operations. The financial implications would include damage to our facilities, vehicles, or other equipment that would increase our operational cost. For example, in 2012, Ryder incurred a charge of $8 million for property damage to vehicles owned by full service lease customers due to superstorm Sandy. Additionally, company-owned units with a carrying value of $15.7 million were damaged or completely destroyed as a direct result of the
Ryder has multiple protocols in place, ready to execute when natural disasters strike. We actively manage risks with an extensive network of facilities, contingency plans and comprehensive emergency management plans. We update plans annually, perform third party risk assessments of our facilities, and have dedicated property risk control specialists inspect and recommend improvements. Compliance to the engineering controls and recommendations is strongly monitored and locations receive financial incentives to comply with necessary improvements. The Ryder Risk Management team has also developed an Asset Protection Manual for Ryder operating facilities.
There are zero added costs associated with methods used to prepare and implement plans for potential physical climatic risks because responding to natural disaster risks is fundamental to the services Ryder already provides to its Customers.
Risk driver
Description
Potential impact
Timeframe
Direct/ Indirect
Likelihood
Magnitude of impact
Estimated financial
implications
Management method
Cost of
management
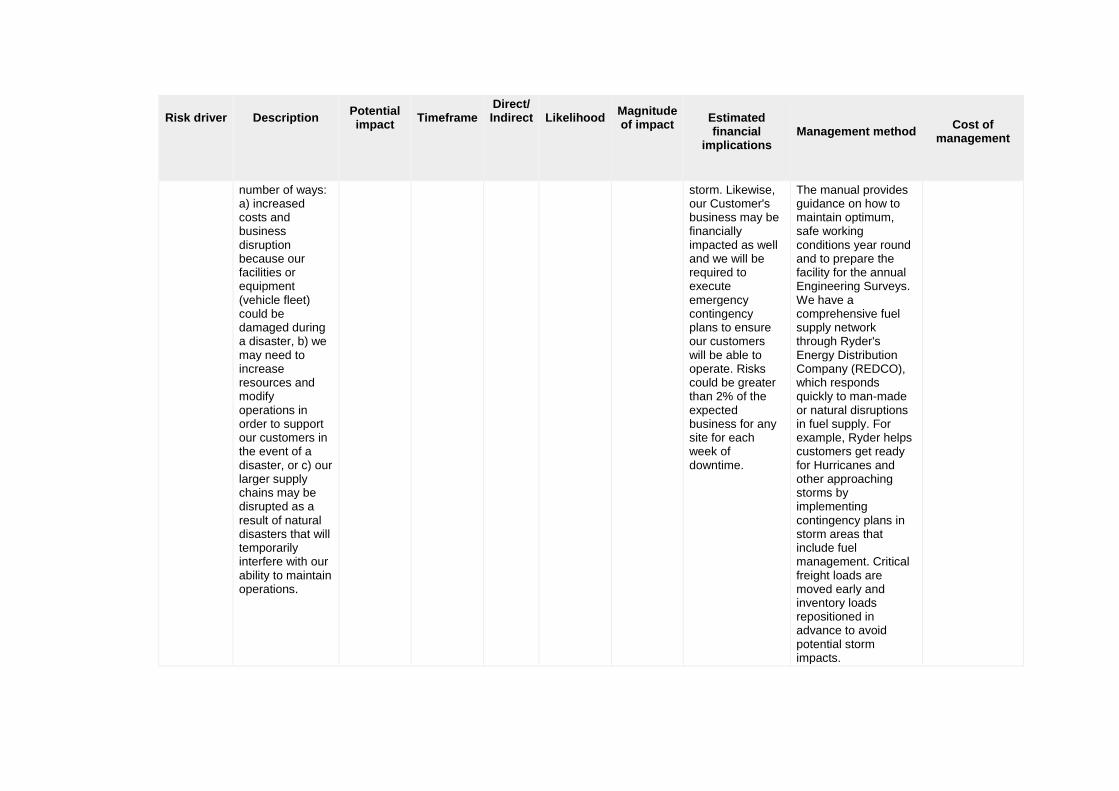
number of ways: a) increased costs and business disruption because our facilities or equipment (vehicle fleet) could be damaged during a disaster, b) we may need to increase resources and modify operations in order to support our customers in the event of a disaster, or c) our larger supply chains may be disrupted as a result of natural disasters that will temporarily interfere with our ability to maintain operations.
storm. Likewise, our Customer's business may be financially impacted as well and we will be required to execute emergency contingency plans to ensure our customers will be able to operate. Risks could be greater than 2% of the expected business for any site for each week of downtime.
The manual provides guidance on how to maintain optimum, safe working conditions year round and to prepare the facility for the annual Engineering Surveys. We have a comprehensive fuel supply network through Ryder's Energy Distribution Company (REDCO), which responds quickly to man-made or natural disruptions in fuel supply. For example, Ryder helps customers get ready for Hurricanes and other approaching storms by implementing contingency plans in storm areas that include fuel management. Critical freight loads are moved early and inventory loads repositioned in advance to avoid potential storm impacts.
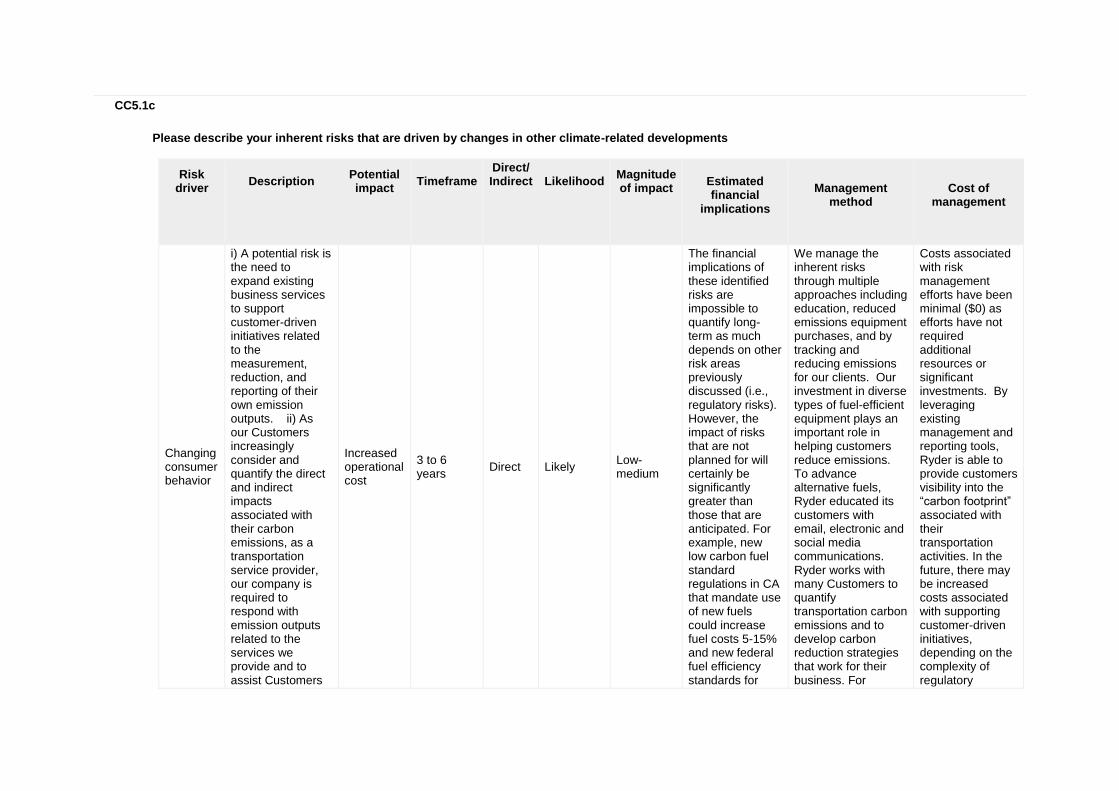
CC5.1c
Please describe your inherent risks that are driven by changes in other climate-related developments
Risk driver
Description
Potential impact
Timeframe
Direct/ Indirect
Likelihood
Magnitude of impact
Estimated financial
implications
Management
method
Cost of
management
Changing consumer behavior
i) A potential risk is the need to expand existing business services to support customer-driven initiatives related to the measurement, reduction, and reporting of their own emission outputs. ii) As our Customers increasingly consider and quantify the direct and indirect impacts associated with their carbon emissions, as a transportation service provider, our company is required to respond with emission outputs related to the services we provide and to assist Customers
Increased operational cost
3 to 6 years
Direct Likely Low-medium
The financial implications of these identified risks are impossible to quantify long-term as much depends on other risk areas previously discussed (i.e., regulatory risks). However, the impact of risks that are not planned for will certainly be significantly greater than those that are anticipated. For example, new low carbon fuel standard regulations in CA that mandate use of new fuels could increase fuel costs 5-15% and new federal fuel efficiency standards for
We manage the inherent risks through multiple approaches including education, reduced emissions equipment purchases, and by tracking and reducing emissions for our clients. Our investment in diverse types of fuel-efficient equipment plays an important role in helping customers reduce emissions. To advance alternative fuels, Ryder educated its customers with email, electronic and social media communications. Ryder works with many Customers to quantify transportation carbon emissions and to develop carbon reduction strategies that work for their business. For
Costs associated with risk management efforts have been minimal ($0) as efforts have not required additional resources or significant investments. By leveraging existing management and reporting tools, Ryder is able to provide customers visibility into the “carbon footprint” associated with their transportation activities. In the future, there may be increased costs associated with supporting customer-driven initiatives, depending on the complexity of regulatory
Risk driver
Description
Potential impact
Timeframe
Direct/ Indirect
Likelihood
Magnitude of impact
Estimated financial
implications
Management
method
Cost of
management
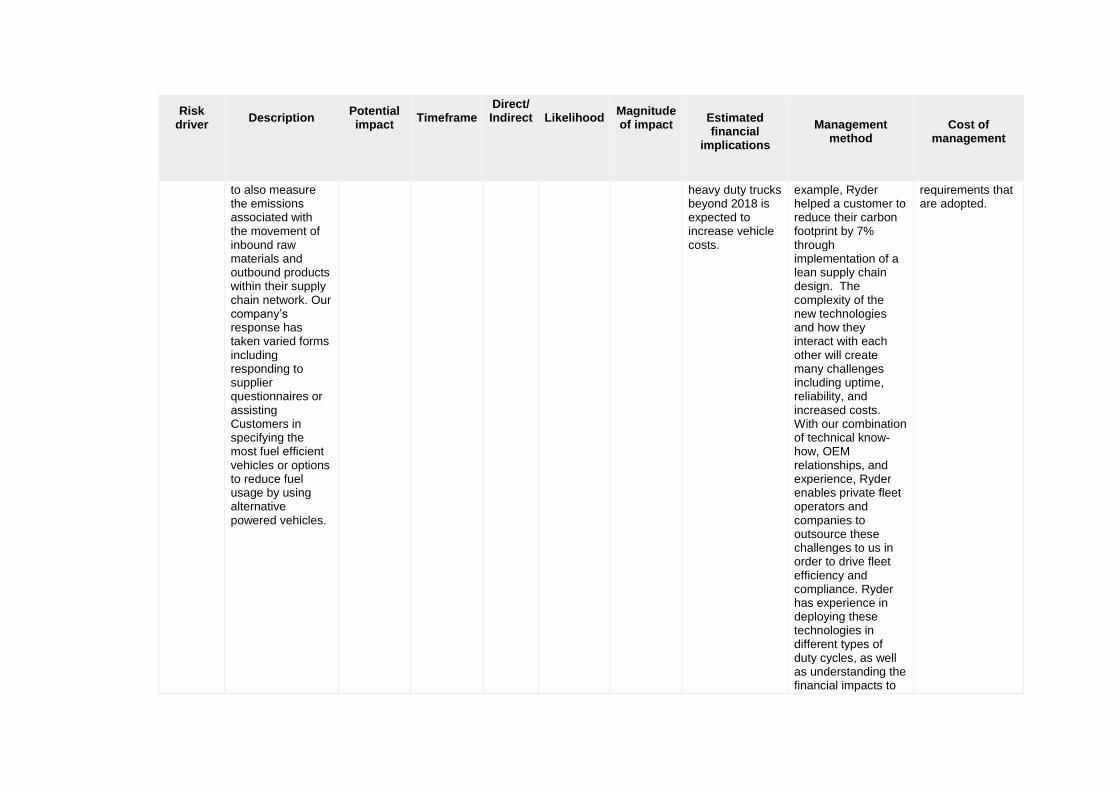
to also measure the emissions associated with the movement of inbound raw materials and outbound products within their supply chain network. Our company’s response has taken varied forms including responding to supplier questionnaires or assisting Customers in specifying the most fuel efficient vehicles or options to reduce fuel usage by using alternative powered vehicles.
heavy duty trucks beyond 2018 is expected to increase vehicle costs.
example, Ryder helped a customer to reduce their carbon footprint by 7% through implementation of a lean supply chain design. The complexity of the new technologies and how they interact with each other will create many challenges including uptime, reliability, and increased costs. With our combination of technical know-how, OEM relationships, and experience, Ryder enables private fleet operators and companies to outsource these challenges to us in order to drive fleet efficiency and compliance. Ryder has experience in deploying these technologies in different types of duty cycles, as well as understanding the financial impacts to
requirements that are adopted.
Risk driver
Description
Potential impact
Timeframe
Direct/ Indirect
Likelihood
Magnitude of impact
Estimated financial
implications
Management
method
Cost of
management
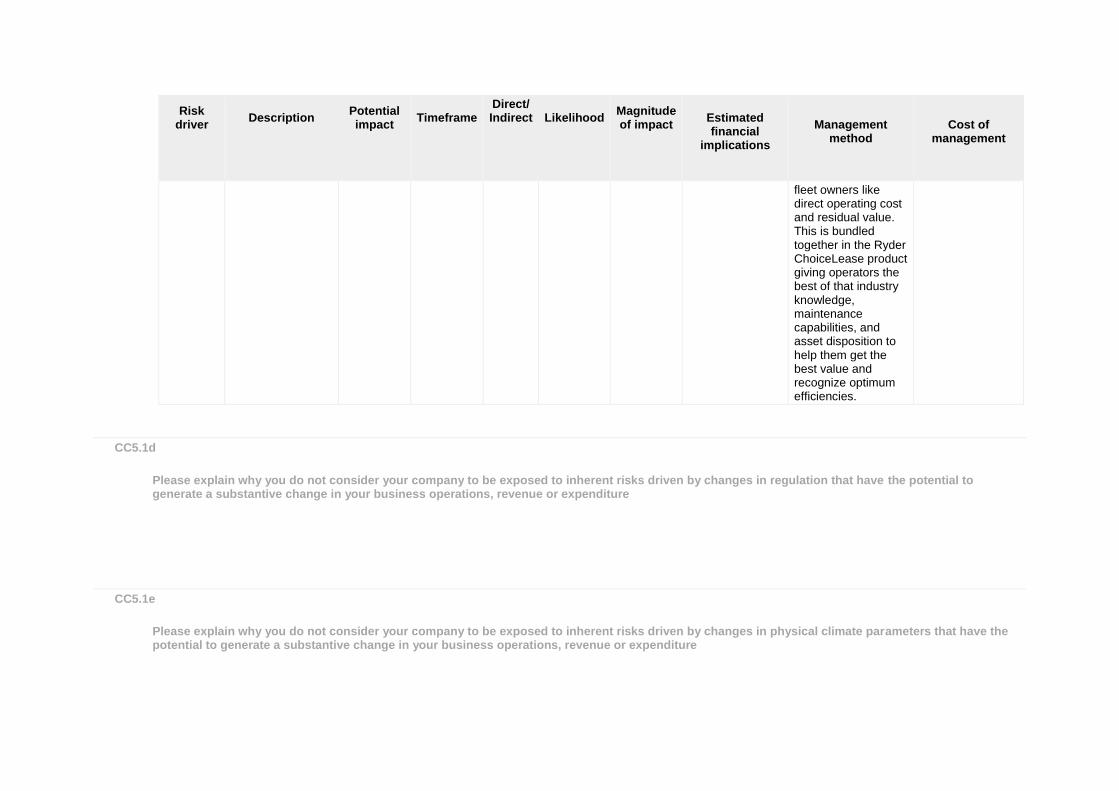
fleet owners like direct operating cost and residual value. This is bundled together in the Ryder ChoiceLease product giving operators the best of that industry knowledge, maintenance capabilities, and asset disposition to help them get the best value and recognize optimum efficiencies.
CC5.1d
Please explain why you do not consider your company to be exposed to inherent risks driven by changes in regulation that have the potential to generate a substantive change in your business operations, revenue or expenditure
CC5.1e
Please explain why you do not consider your company to be exposed to inherent risks driven by changes in physical climate parameters that have the potential to generate a substantive change in your business operations, revenue or expenditure
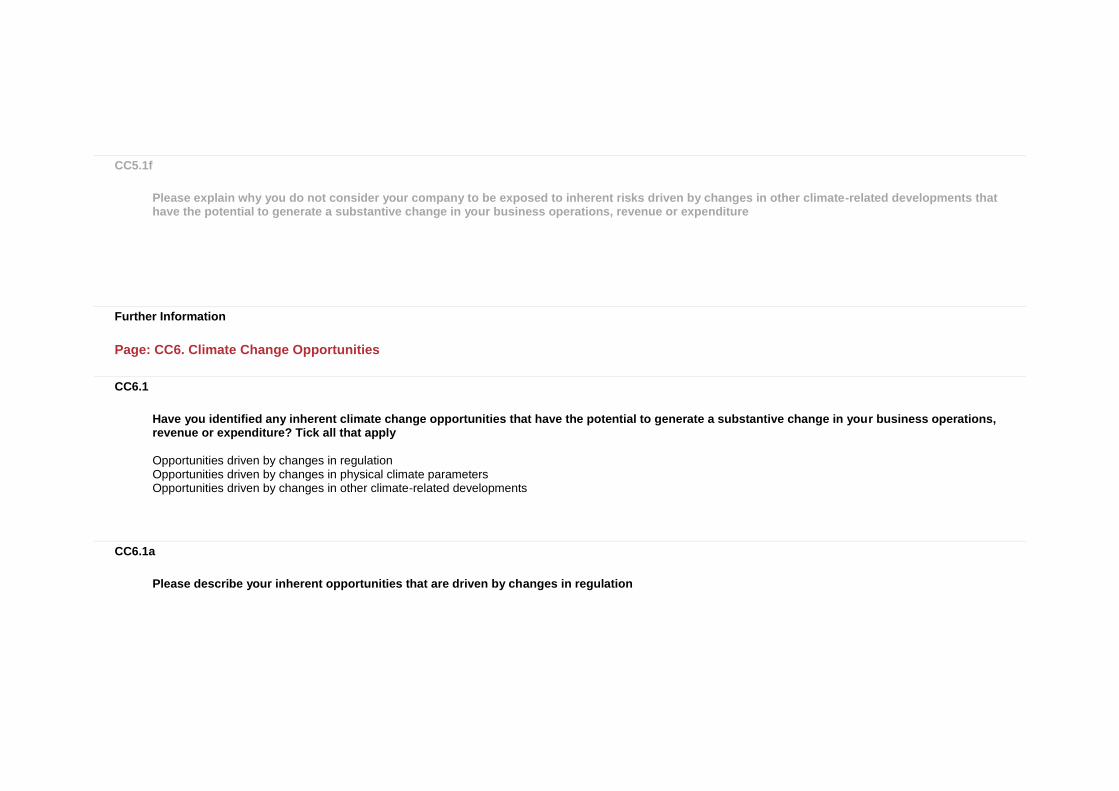
CC5.1f
Please explain why you do not consider your company to be exposed to inherent risks driven by changes in other climate-related developments that have the potential to generate a substantive change in your business operations, revenue or expenditure
Further Information
Page: CC6. Climate Change Opportunities
CC6.1
Have you identified any inherent climate change opportunities that have the potential to generate a substantive change in your business operations, revenue or expenditure? Tick all that apply
Opportunities driven by changes in regulation Opportunities driven by changes in physical climate parameters Opportunities driven by changes in other climate-related developments
CC6.1a
Please describe your inherent opportunities that are driven by changes in regulation
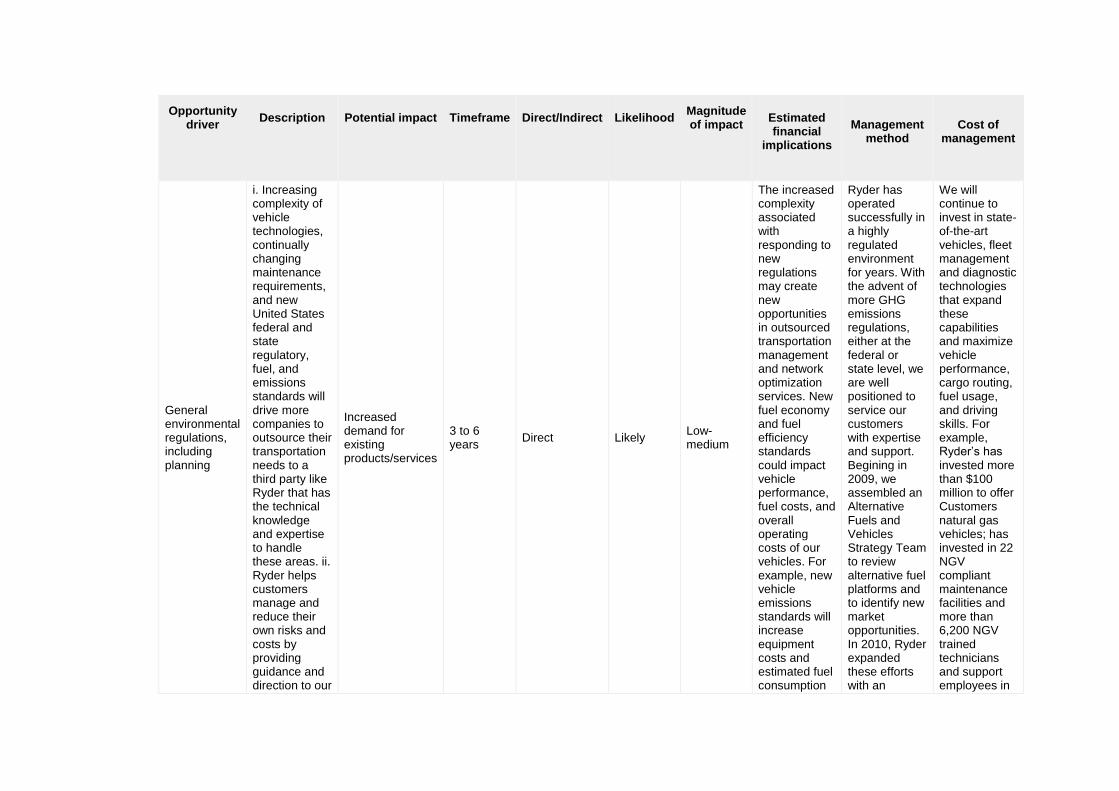
Opportunity driver
Description
Potential impact
Timeframe
Direct/Indirect
Likelihood
Magnitude of impact
Estimated financial
implications
Management
method
Cost of
management
General environmental regulations, including planning
i. Increasing complexity of vehicle technologies, continually changing maintenance requirements, and new United States federal and state regulatory, fuel, and emissions standards will drive more companies to outsource their transportation needs to a third party like Ryder that has the technical knowledge and expertise to handle these areas. ii. Ryder helps customers manage and reduce their own risks and costs by providing guidance and direction to our
Increased demand for existing products/services
3 to 6 years
Direct Likely Low-medium
The increased complexity associated with responding to new regulations may create new opportunities in outsourced transportation management and network optimization services. New fuel economy and fuel efficiency standards could impact vehicle performance, fuel costs, and overall operating costs of our vehicles. For example, new vehicle emissions standards will increase equipment costs and estimated fuel consumption
Ryder has operated successfully in a highly regulated environment for years. With the advent of more GHG emissions regulations, either at the federal or state level, we are well positioned to service our customers with expertise and support. Begining in 2009, we assembled an Alternative Fuels and Vehicles Strategy Team to review alternative fuel platforms and to identify new market opportunities. In 2010, Ryder expanded these efforts with an
We will continue to invest in state-of-the-art vehicles, fleet management and diagnostic technologies that expand these capabilities and maximize vehicle performance, cargo routing, fuel usage, and driving skills. For example, Ryder’s has invested more than $100 million to offer Customers natural gas vehicles; has invested in 22 NGV compliant maintenance facilities and more than 6,200 NGV trained technicians and support employees in
Opportunity driver
Description
Potential impact
Timeframe
Direct/Indirect
Likelihood
Magnitude of impact
Estimated financial
implications
Management
method
Cost of
management
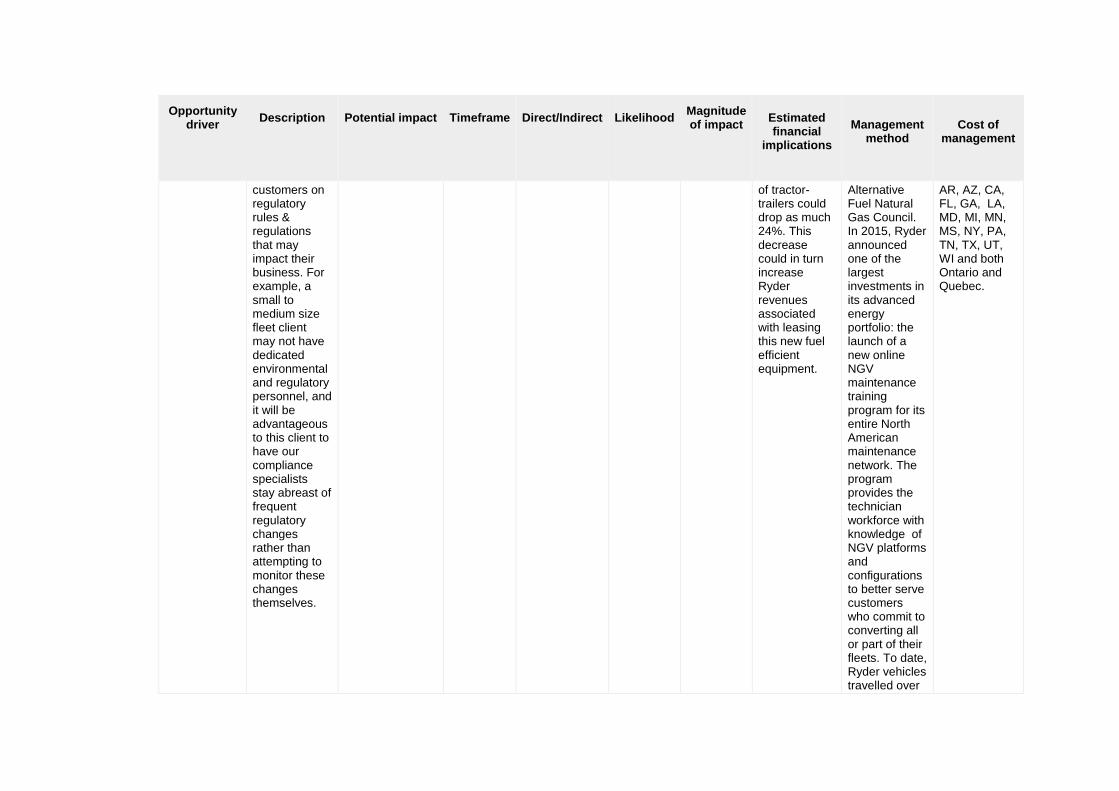
customers on regulatory rules & regulations that may impact their business. For example, a small to medium size fleet client may not have dedicated environmental and regulatory personnel, and it will be advantageous to this client to have our compliance specialists stay abreast of frequent regulatory changes rather than attempting to monitor these changes themselves.
of tractor-trailers could drop as much 24%. This decrease could in turn increase Ryder revenues associated with leasing this new fuel efficient equipment.
Alternative Fuel Natural Gas Council. In 2015, Ryder announced one of the largest investments in its advanced energy portfolio: the launch of a new online NGV maintenance training program for its entire North American maintenance network. The program provides the technician workforce with knowledge of NGV platforms and configurations to better serve customers who commit to converting all or part of their fleets. To date, Ryder vehicles travelled over
AR, AZ, CA, FL, GA, LA, MD, MI, MN, MS, NY, PA, TN, TX, UT, WI and both Ontario and Quebec.
Opportunity driver
Description
Potential impact
Timeframe
Direct/Indirect
Likelihood
Magnitude of impact
Estimated financial
implications
Management
method
Cost of
management
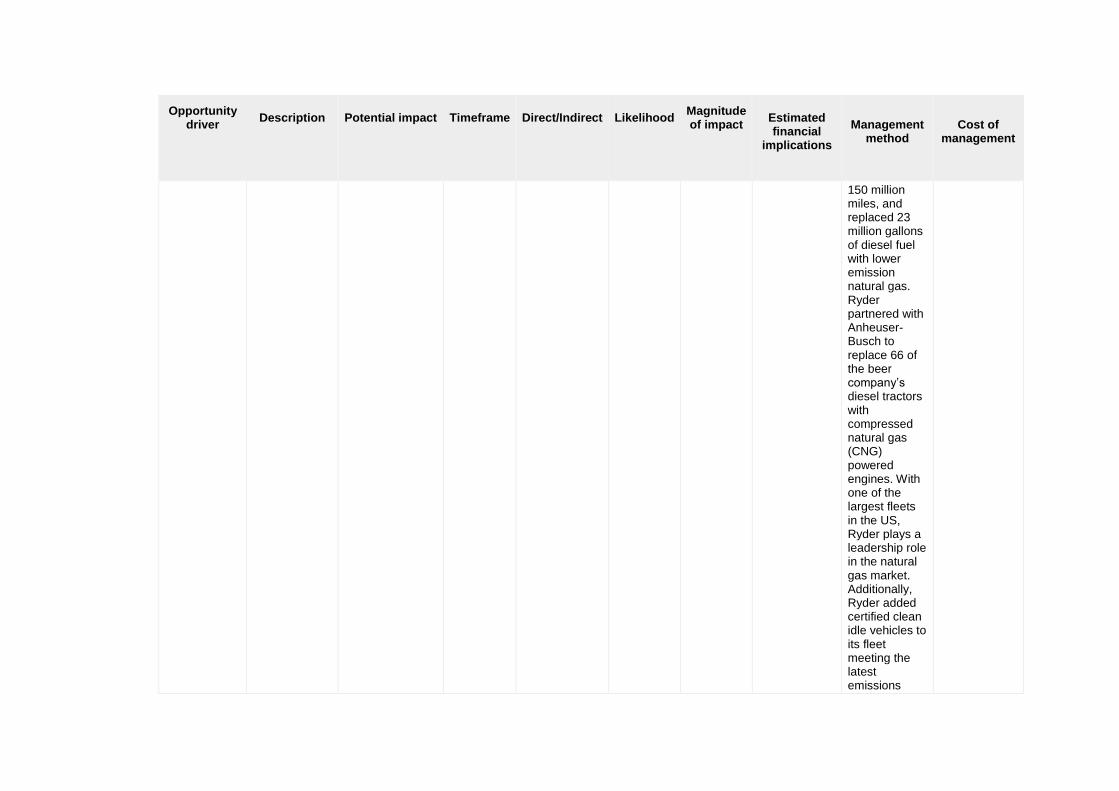
150 million miles, and replaced 23 million gallons of diesel fuel with lower emission natural gas. Ryder partnered with Anheuser-Busch to replace 66 of the beer company’s diesel tractors with compressed natural gas (CNG) powered engines. With one of the largest fleets in the US, Ryder plays a leadership role in the natural gas market. Additionally, Ryder added certified clean idle vehicles to its fleet meeting the latest emissions
Opportunity driver
Description
Potential impact
Timeframe
Direct/Indirect
Likelihood
Magnitude of impact
Estimated financial
implications
Management
method
Cost of
management
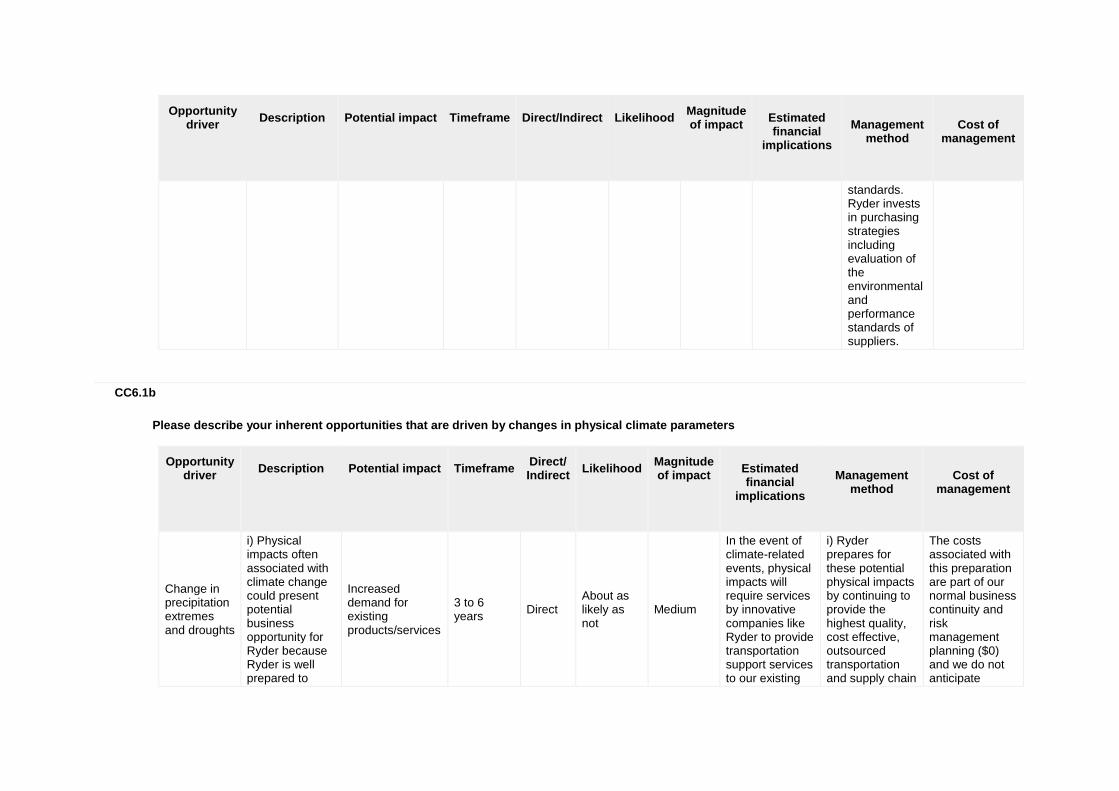
standards. Ryder invests in purchasing strategies including evaluation of the environmental and performance standards of suppliers.
CC6.1b
Please describe your inherent opportunities that are driven by changes in physical climate parameters
Opportunity driver
Description
Potential impact
Timeframe
Direct/ Indirect
Likelihood
Magnitude of impact
Estimated financial
implications
Management
method
Cost of
management
Change in precipitation extremes and droughts
i) Physical impacts often associated with climate change could present potential business opportunity for Ryder because Ryder is well prepared to
Increased demand for existing products/services
3 to 6 years
Direct About as likely as not
Medium
In the event of climate-related events, physical impacts will require services by innovative companies like Ryder to provide transportation support services to our existing
i) Ryder prepares for these potential physical impacts by continuing to provide the highest quality, cost effective, outsourced transportation and supply chain
The costs associated with this preparation are part of our normal business continuity and risk management planning ($0) and we do not anticipate
Opportunity driver
Description
Potential impact
Timeframe
Direct/ Indirect
Likelihood
Magnitude of impact
Estimated financial
implications
Management
method
Cost of
management
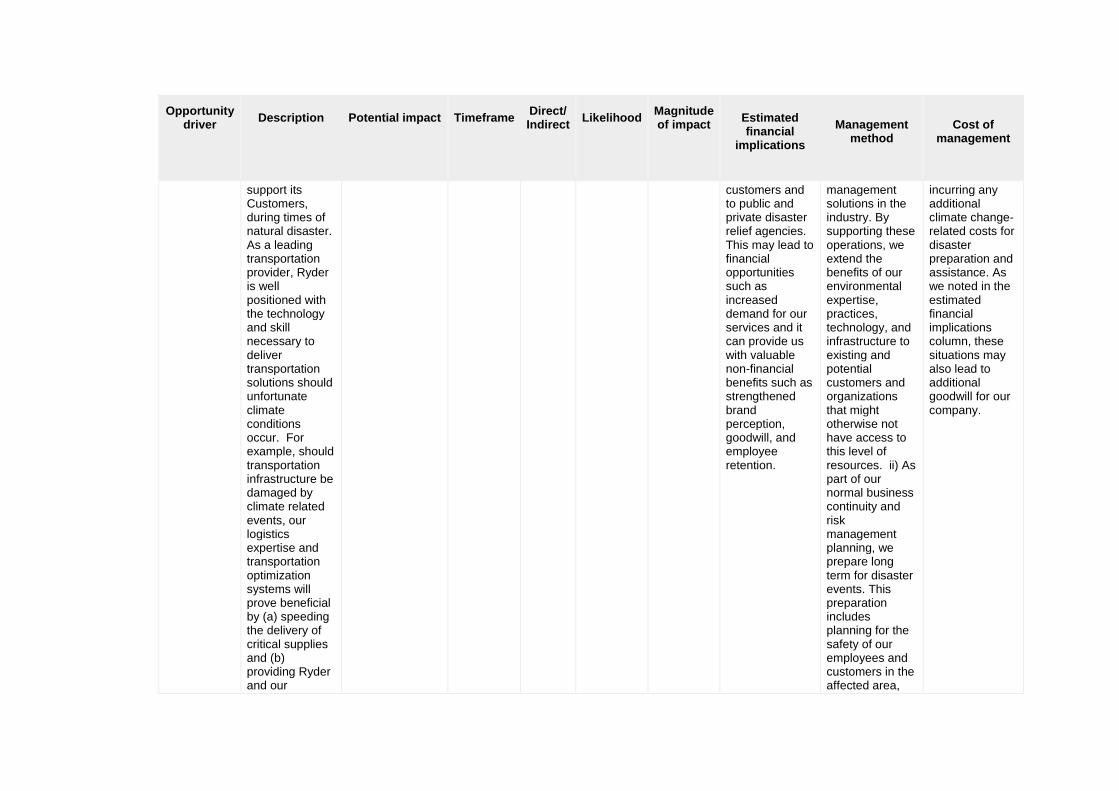
support its Customers, during times of natural disaster. As a leading transportation provider, Ryder is well positioned with the technology and skill necessary to deliver transportation solutions should unfortunate climate conditions occur. For example, should transportation infrastructure be damaged by climate related events, our logistics expertise and transportation optimization systems will prove beneficial by (a) speeding the delivery of critical supplies and (b) providing Ryder and our
customers and to public and private disaster relief agencies. This may lead to financial opportunities such as increased demand for our services and it can provide us with valuable non-financial benefits such as strengthened brand perception, goodwill, and employee retention.
management solutions in the industry. By supporting these operations, we extend the benefits of our environmental expertise, practices, technology, and infrastructure to existing and potential customers and organizations that might otherwise not have access to this level of resources. ii) As part of our normal business continuity and risk management planning, we prepare long term for disaster events. This preparation includes planning for the safety of our employees and customers in the affected area,
incurring any additional climate change-related costs for disaster preparation and assistance. As we noted in the estimated financial implications column, these situations may also lead to additional goodwill for our company.
Opportunity driver
Description
Potential impact
Timeframe
Direct/ Indirect
Likelihood
Magnitude of impact
Estimated financial
implications
Management
method
Cost of
management
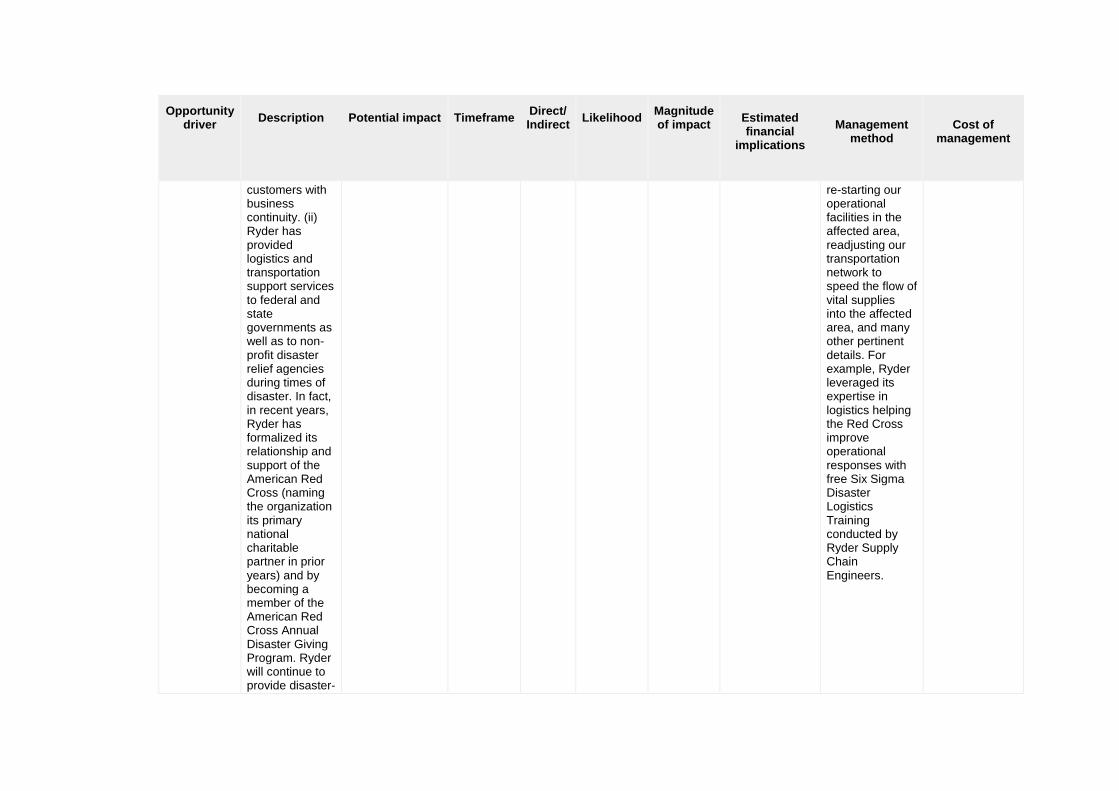
customers with business continuity. (ii) Ryder has provided logistics and transportation support services to federal and state governments as well as to non-profit disaster relief agencies during times of disaster. In fact, in recent years, Ryder has formalized its relationship and support of the American Red Cross (naming the organization its primary national charitable partner in prior years) and by becoming a member of the American Red Cross Annual Disaster Giving Program. Ryder will continue to provide disaster-
re-starting our operational facilities in the affected area, readjusting our transportation network to speed the flow of vital supplies into the affected area, and many other pertinent details. For example, Ryder leveraged its expertise in logistics helping the Red Cross improve operational responses with free Six Sigma Disaster Logistics Training conducted by Ryder Supply Chain Engineers.
Opportunity driver
Description
Potential impact
Timeframe
Direct/ Indirect
Likelihood
Magnitude of impact
Estimated financial
implications
Management
method
Cost of
management
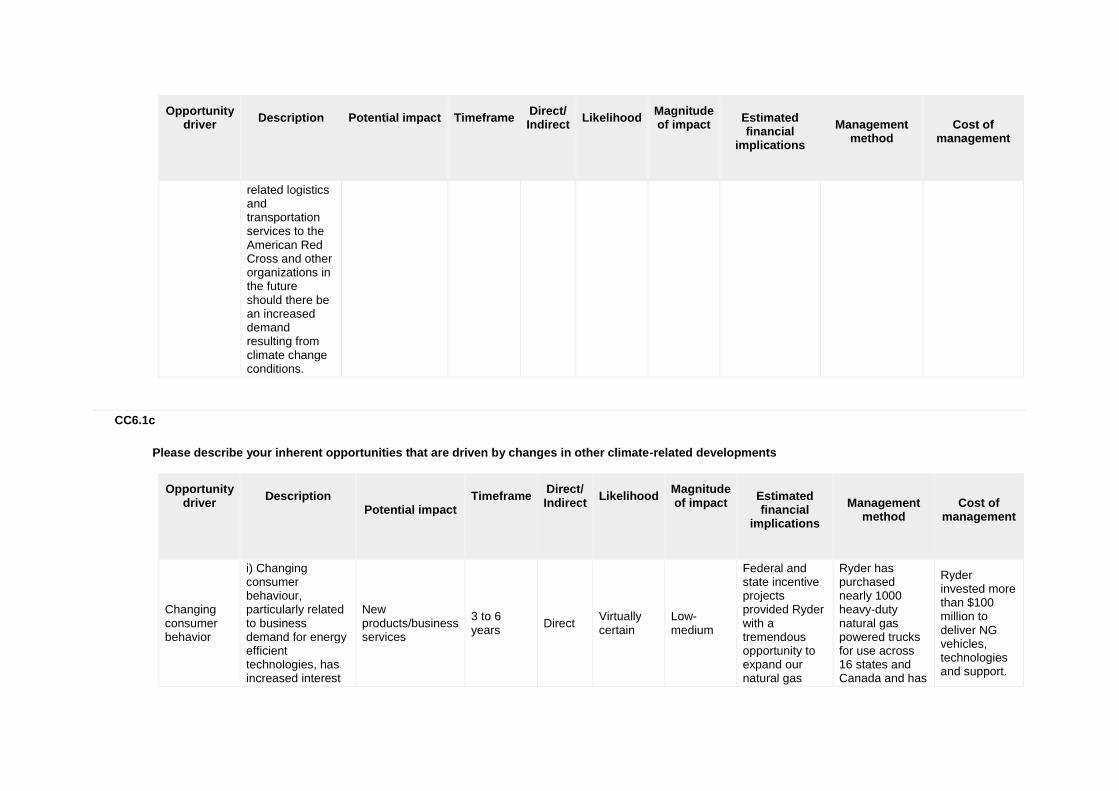
related logistics and transportation services to the American Red Cross and other organizations in the future should there be an increased demand resulting from climate change conditions.
CC6.1c
Please describe your inherent opportunities that are driven by changes in other climate-related developments
Opportunity driver
Description
Potential impact
Timeframe
Direct/ Indirect
Likelihood
Magnitude of impact
Estimated financial
implications
Management
method
Cost of
management
Changing consumer behavior
i) Changing consumer behaviour, particularly related to business demand for energy efficient technologies, has increased interest
New products/business services
3 to 6 years
Direct Virtually certain
Low-medium
Federal and state incentive projects provided Ryder with a tremendous opportunity to expand our natural gas
Ryder has purchased nearly 1000 heavy-duty natural gas powered trucks for use across 16 states and Canada and has
Ryder invested more than $100 million to deliver NG vehicles, technologies and support.
Opportunity driver
Description
Potential impact
Timeframe
Direct/ Indirect
Likelihood
Magnitude of impact
Estimated financial
implications
Management
method
Cost of
management
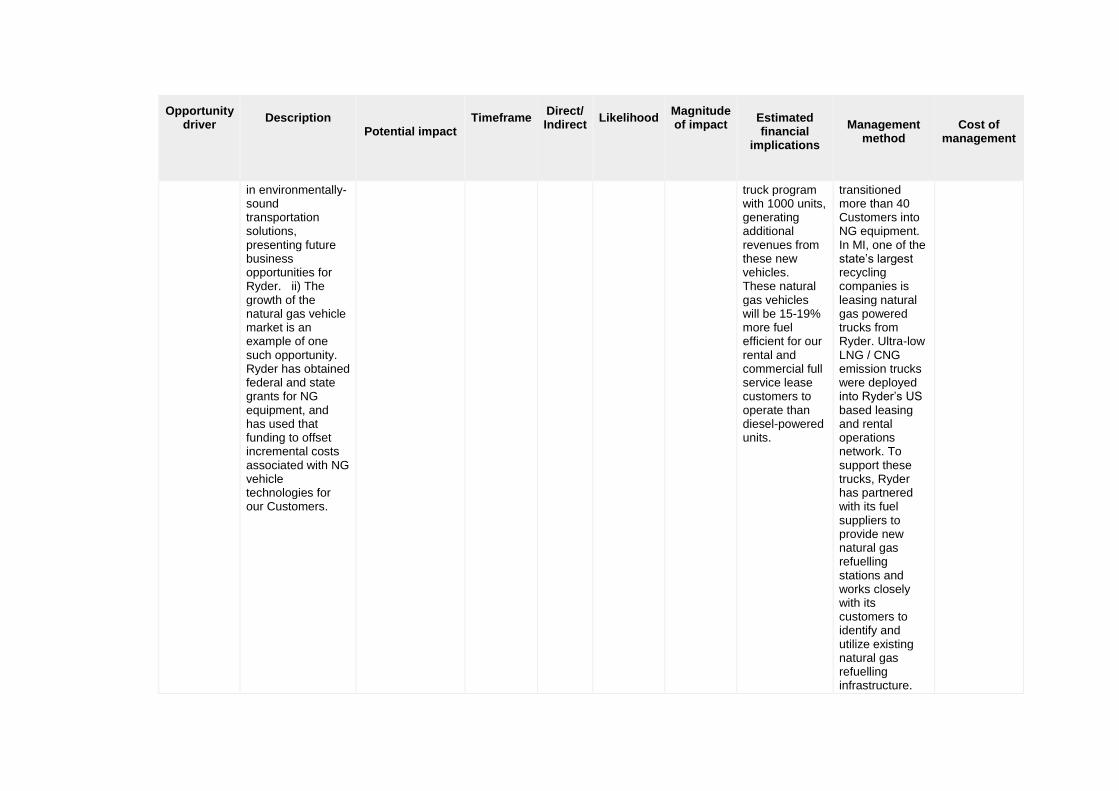
in environmentally-sound transportation solutions, presenting future business opportunities for Ryder. ii) The growth of the natural gas vehicle market is an example of one such opportunity. Ryder has obtained federal and state grants for NG equipment, and has used that funding to offset incremental costs associated with NG vehicle technologies for our Customers.
truck program with 1000 units, generating additional revenues from these new vehicles. These natural gas vehicles will be 15-19% more fuel efficient for our rental and commercial full service lease customers to operate than diesel-powered units.
transitioned more than 40 Customers into NG equipment. In MI, one of the state’s largest recycling companies is leasing natural gas powered trucks from Ryder. Ultra-low LNG / CNG emission trucks were deployed into Ryder’s US based leasing and rental operations network. To support these trucks, Ryder has partnered with its fuel suppliers to provide new natural gas refuelling stations and works closely with its customers to identify and utilize existing natural gas refuelling infrastructure.
Opportunity driver
Description
Potential impact
Timeframe
Direct/ Indirect
Likelihood
Magnitude of impact
Estimated financial
implications
Management
method
Cost of
management
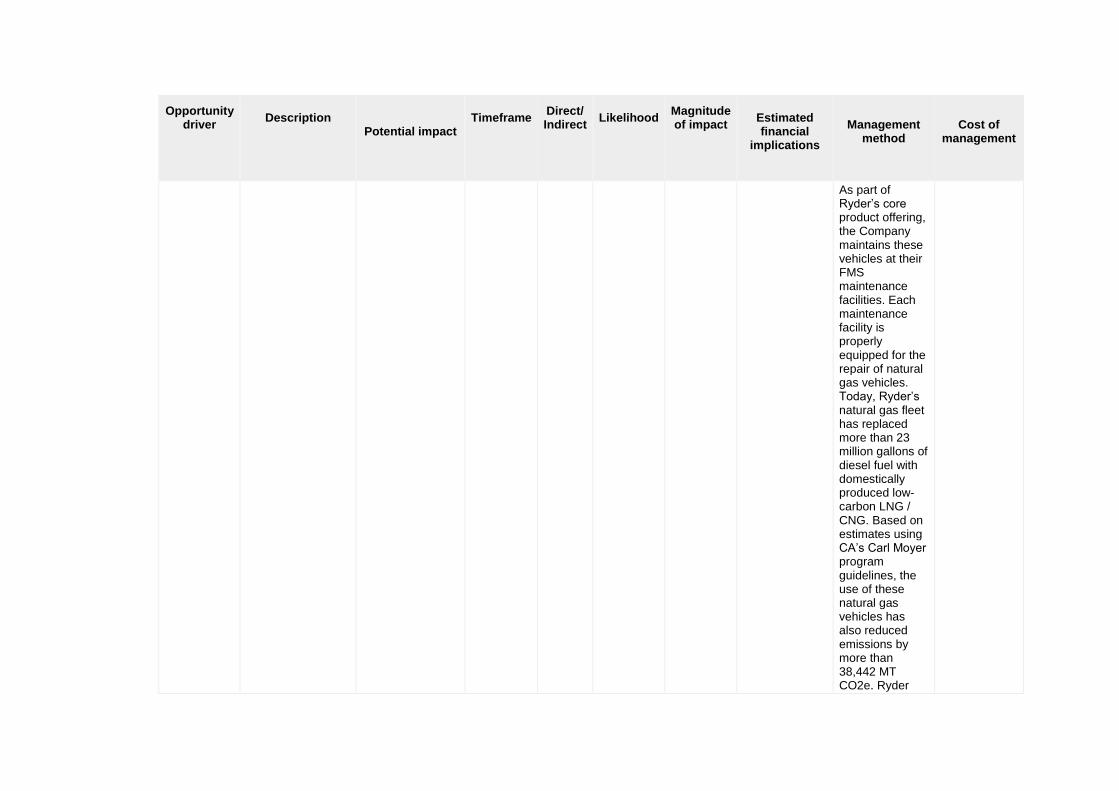
As part of Ryder’s core product offering, the Company maintains these vehicles at their FMS maintenance facilities. Each maintenance facility is properly equipped for the repair of natural gas vehicles. Today, Ryder’s natural gas fleet has replaced more than 23 million gallons of diesel fuel with domestically produced low-carbon LNG / CNG. Based on estimates using CA’s Carl Moyer program guidelines, the use of these natural gas vehicles has also reduced emissions by more than 38,442 MT CO2e. Ryder
Opportunity driver
Description
Potential impact
Timeframe
Direct/ Indirect
Likelihood
Magnitude of impact
Estimated financial
implications
Management
method
Cost of
management
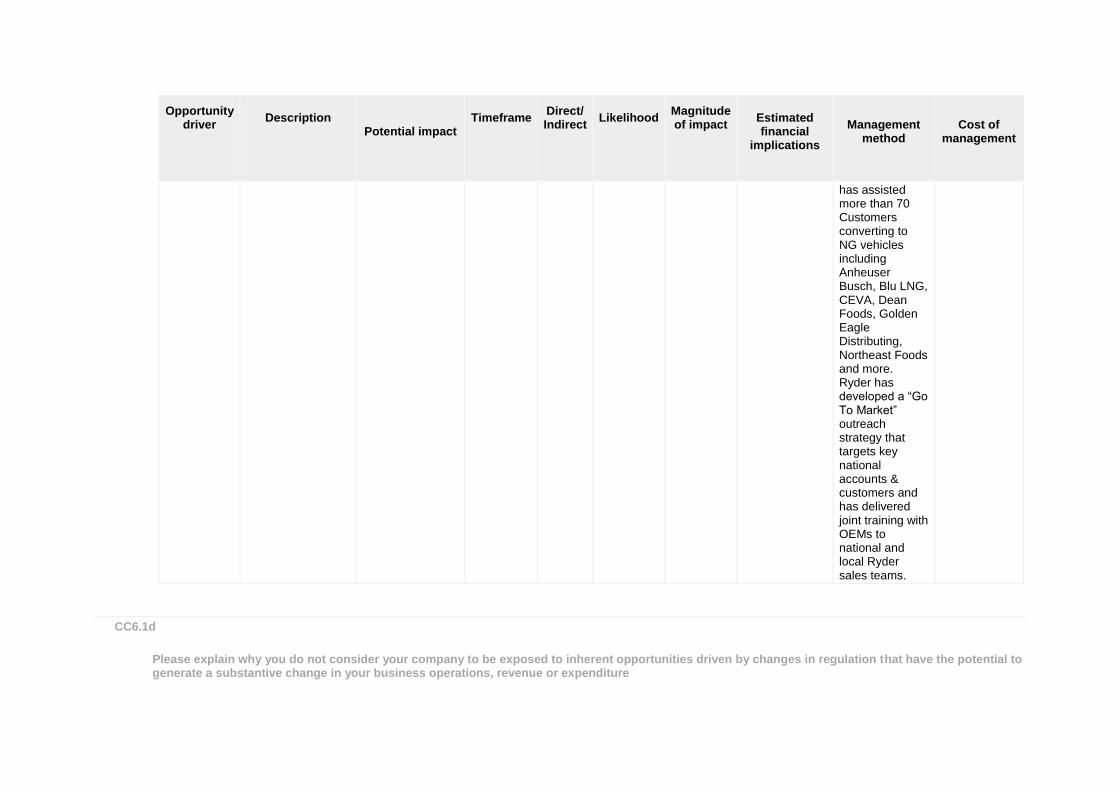
has assisted more than 70 Customers converting to NG vehicles including Anheuser Busch, Blu LNG, CEVA, Dean Foods, Golden Eagle Distributing, Northeast Foods and more. Ryder has developed a “Go To Market” outreach strategy that targets key national accounts & customers and has delivered joint training with OEMs to national and local Ryder sales teams.
CC6.1d
Please explain why you do not consider your company to be exposed to inherent opportunities driven by changes in regulation that have the potential to generate a substantive change in your business operations, revenue or expenditure
CC6.1e
Please explain why you do not consider your company to be exposed to inherent opportunities driven by changes in physical climate parameters that have the potential to generate a substantive change in your business operations, revenue or expenditure
CC6.1f
Please explain why you do not consider your company to be exposed to inherent opportunities driven by changes in other climate-related developments that have the potential to generate a substantive change in your business operations, revenue or expenditure
Further Information
Module: GHG Emissions Accounting, Energy and Fuel Use, and Trading
Page: CC7. Emissions Methodology
CC7.1
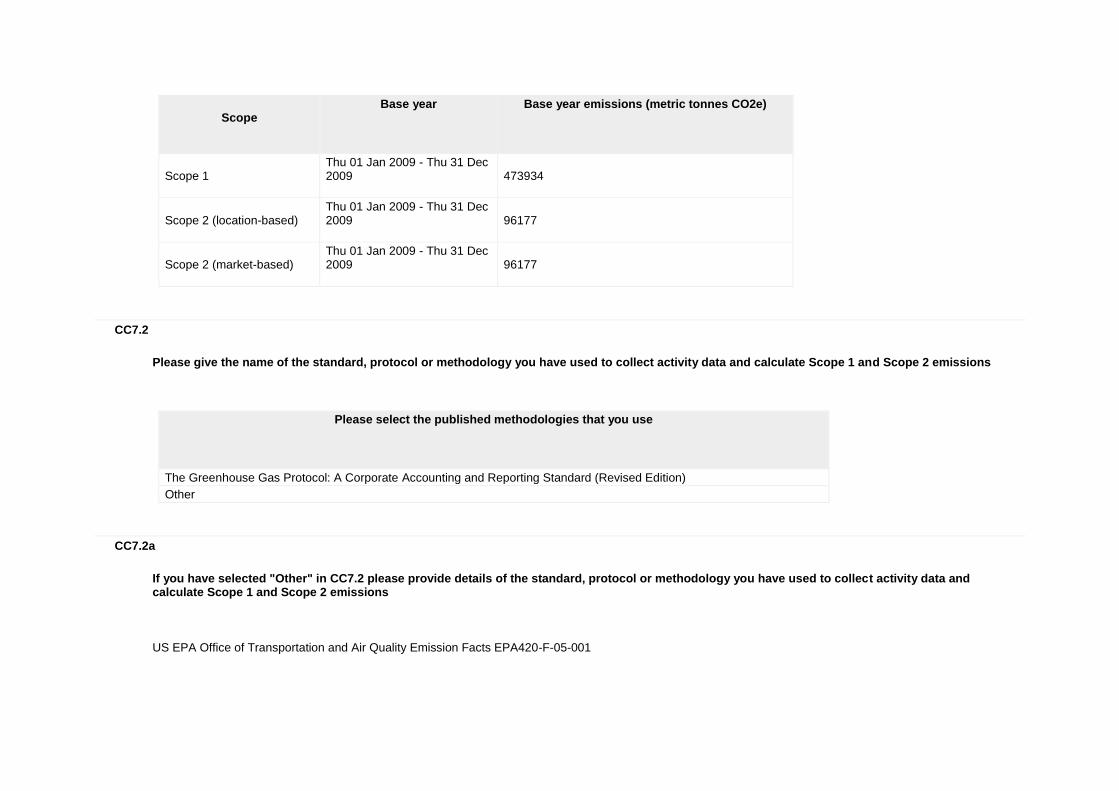
Please provide your base year and base year emissions (Scopes 1 and 2)
Scope
Base year
Base year emissions (metric tonnes CO2e)
Scope 1 Thu 01 Jan 2009 - Thu 31 Dec 2009
473934
Scope 2 (location-based) Thu 01 Jan 2009 - Thu 31 Dec 2009
96177
Scope 2 (market-based) Thu 01 Jan 2009 - Thu 31 Dec 2009
96177
CC7.2
Please give the name of the standard, protocol or methodology you have used to collect activity data and calculate Scope 1 and Scope 2 emissions
Please select the published methodologies that you use
The Greenhouse Gas Protocol: A Corporate Accounting and Reporting Standard (Revised Edition)
Other
CC7.2a
If you have selected "Other" in CC7.2 please provide details of the standard, protocol or methodology you have used to collect activity data and calculate Scope 1 and Scope 2 emissions
US EPA Office of Transportation and Air Quality Emission Facts EPA420-F-05-001
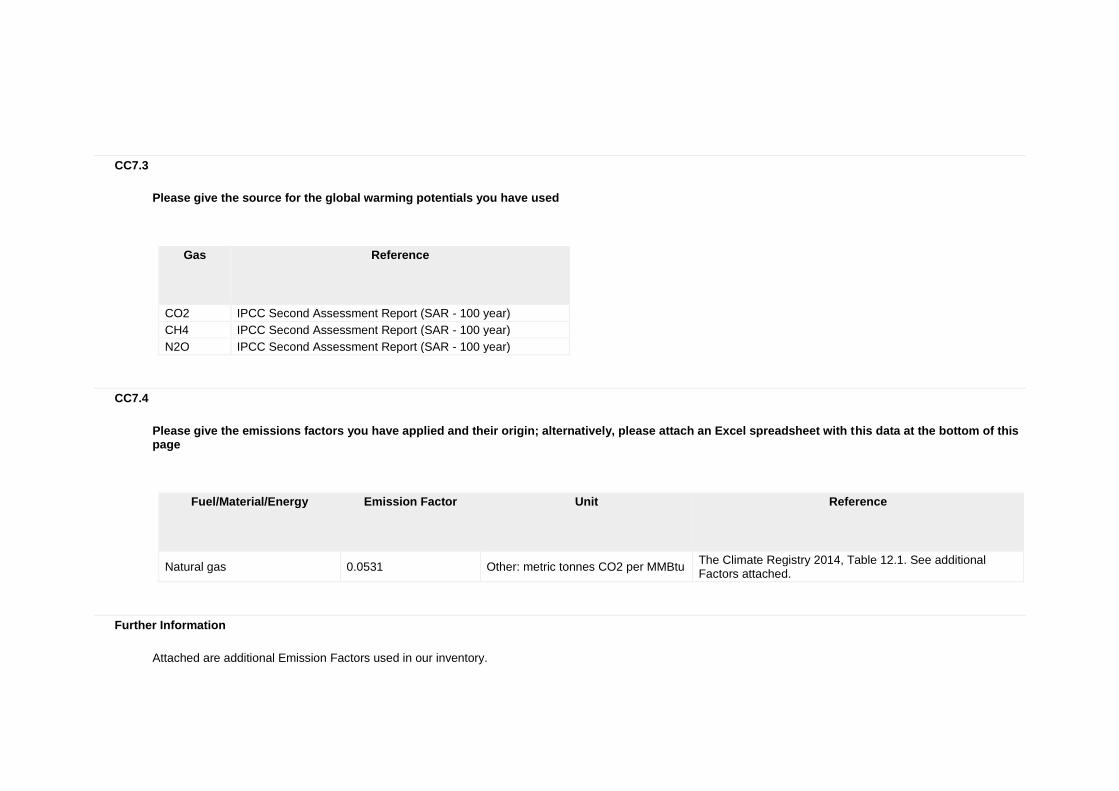
CC7.3
Please give the source for the global warming potentials you have used
Gas
Reference
CO2 IPCC Second Assessment Report (SAR - 100 year)
CH4 IPCC Second Assessment Report (SAR - 100 year)
N2O IPCC Second Assessment Report (SAR - 100 year)
CC7.4
Please give the emissions factors you have applied and their origin; alternatively, please attach an Excel spreadsheet with this data at the bottom of this page
Fuel/Material/Energy
Emission Factor
Unit
Reference
Natural gas 0.0531 Other: metric tonnes CO2 per MMBtu The Climate Registry 2014, Table 12.1. See additional Factors attached.
Further Information
Attached are additional Emission Factors used in our inventory.
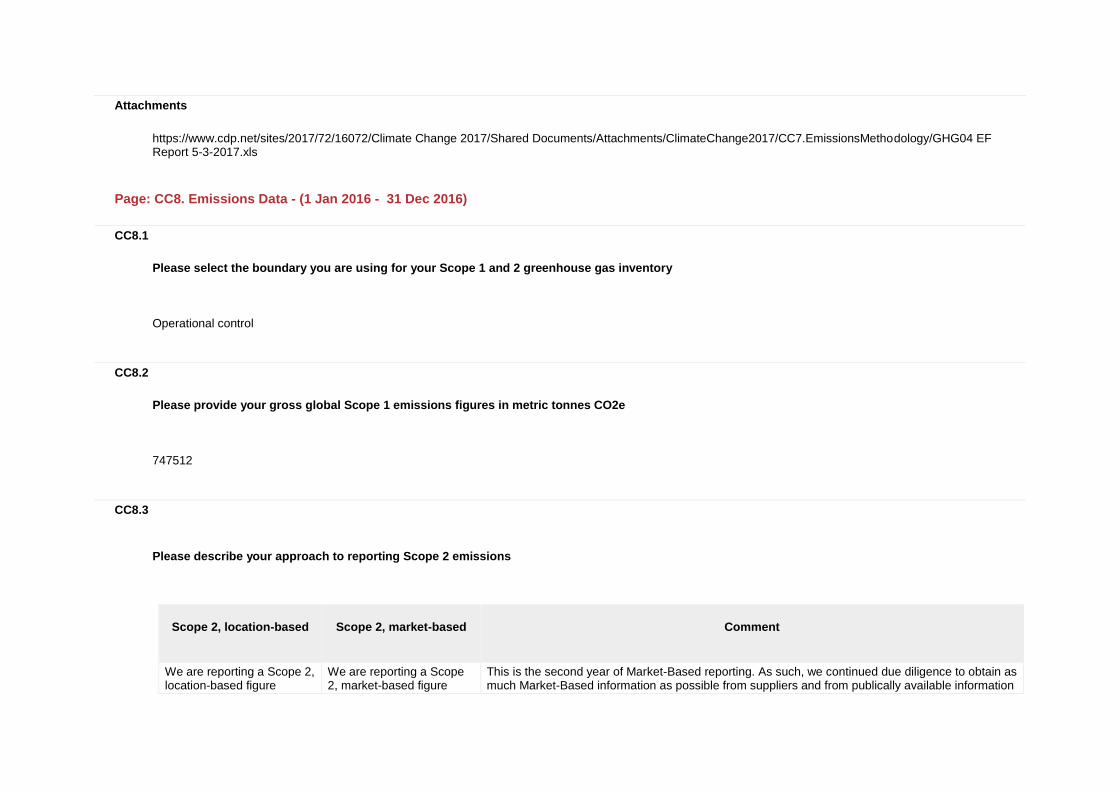
Attachments
https://www.cdp.net/sites/2017/72/16072/Climate Change 2017/Shared Documents/Attachments/ClimateChange2017/CC7.EmissionsMethodology/GHG04 EF Report 5-3-2017.xls
Page: CC8. Emissions Data - (1 Jan 2016 - 31 Dec 2016)
CC8.1
Please select the boundary you are using for your Scope 1 and 2 greenhouse gas inventory
Operational control
CC8.2
Please provide your gross global Scope 1 emissions figures in metric tonnes CO2e
747512
CC8.3
Please describe your approach to reporting Scope 2 emissions
Scope 2, location-based
Scope 2, market-based
Comment
We are reporting a Scope 2, location-based figure
We are reporting a Scope 2, market-based figure
This is the second year of Market-Based reporting. As such, we continued due diligence to obtain as much Market-Based information as possible from suppliers and from publically available information
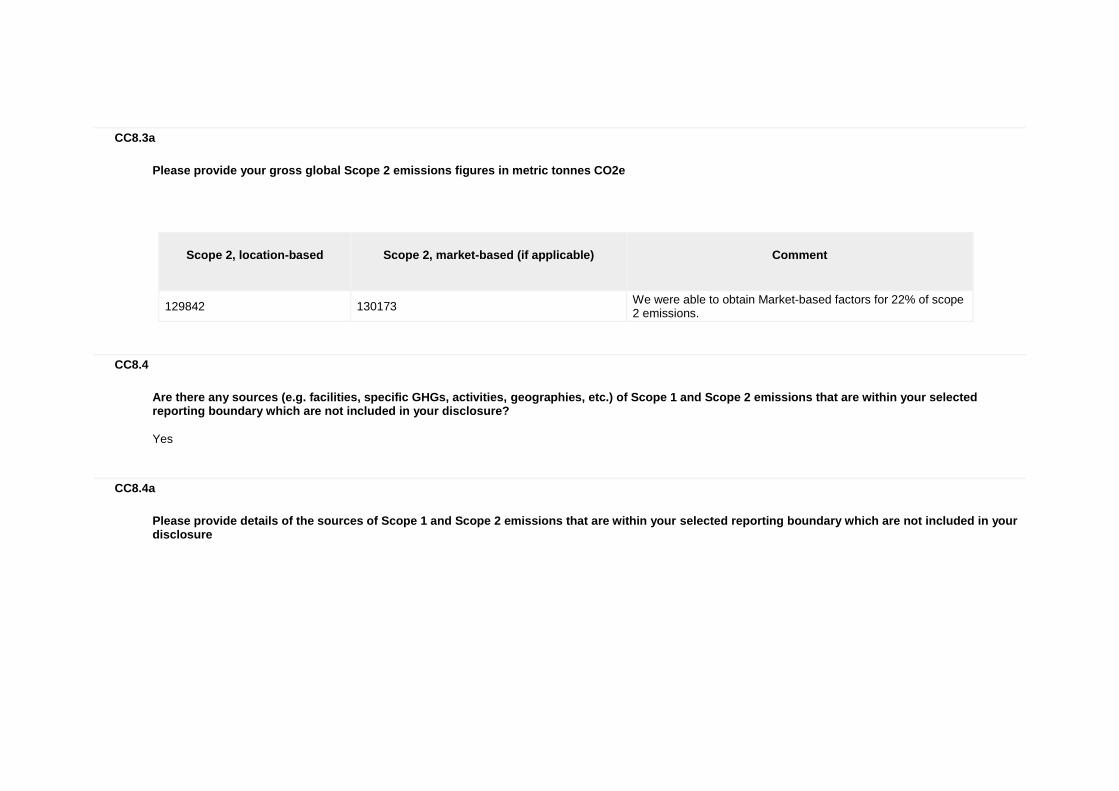
CC8.3a
Please provide your gross global Scope 2 emissions figures in metric tonnes CO2e
Scope 2, location-based
Scope 2, market-based (if applicable)
Comment
129842 130173 We were able to obtain Market-based factors for 22% of scope 2 emissions.
CC8.4
Are there any sources (e.g. facilities, specific GHGs, activities, geographies, etc.) of Scope 1 and Scope 2 emissions that are within your selected reporting boundary which are not included in your disclosure?
Yes
CC8.4a
Please provide details of the sources of Scope 1 and Scope 2 emissions that are within your selected reporting boundary which are not included in your disclosure
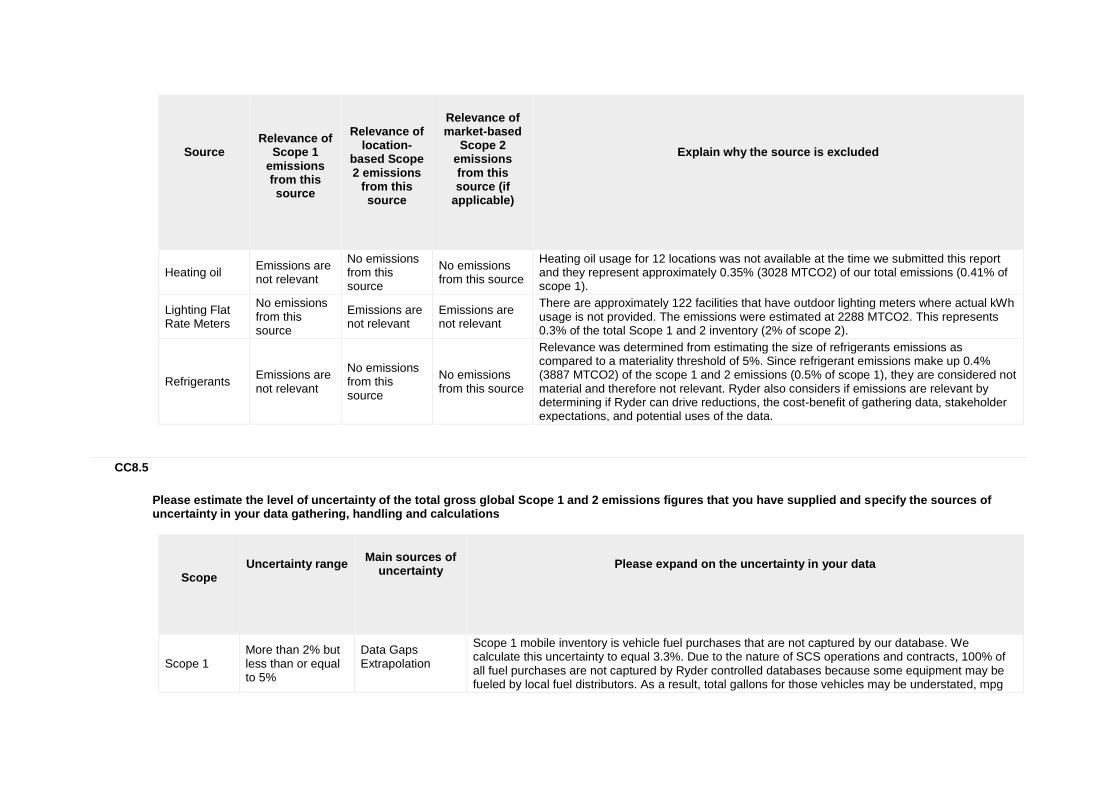
Source
Relevance of
Scope 1 emissions from this source
Relevance of
location-based Scope 2 emissions
from this source
Relevance of market-based
Scope 2 emissions from this source (if
applicable)
Explain why the source is excluded
Heating oil Emissions are not relevant
No emissions from this source
No emissions from this source
Heating oil usage for 12 locations was not available at the time we submitted this report and they represent approximately 0.35% (3028 MTCO2) of our total emissions (0.41% of scope 1).
Lighting Flat Rate Meters
No emissions from this source
Emissions are not relevant
Emissions are not relevant
There are approximately 122 facilities that have outdoor lighting meters where actual kWh usage is not provided. The emissions were estimated at 2288 MTCO2. This represents 0.3% of the total Scope 1 and 2 inventory (2% of scope 2).
Refrigerants Emissions are not relevant
No emissions from this source
No emissions from this source
Relevance was determined from estimating the size of refrigerants emissions as compared to a materiality threshold of 5%. Since refrigerant emissions make up 0.4% (3887 MTCO2) of the scope 1 and 2 emissions (0.5% of scope 1), they are considered not material and therefore not relevant. Ryder also considers if emissions are relevant by determining if Ryder can drive reductions, the cost-benefit of gathering data, stakeholder expectations, and potential uses of the data.
CC8.5
Please estimate the level of uncertainty of the total gross global Scope 1 and 2 emissions figures that you have supplied and specify the sources of uncertainty in your data gathering, handling and calculations
Scope
Uncertainty range
Main sources of
uncertainty
Please expand on the uncertainty in your data
Scope 1 More than 2% but less than or equal to 5%
Data Gaps Extrapolation
Scope 1 mobile inventory is vehicle fuel purchases that are not captured by our database. We calculate this uncertainty to equal 3.3%. Due to the nature of SCS operations and contracts, 100% of all fuel purchases are not captured by Ryder controlled databases because some equipment may be fueled by local fuel distributors. As a result, total gallons for those vehicles may be understated, mpg
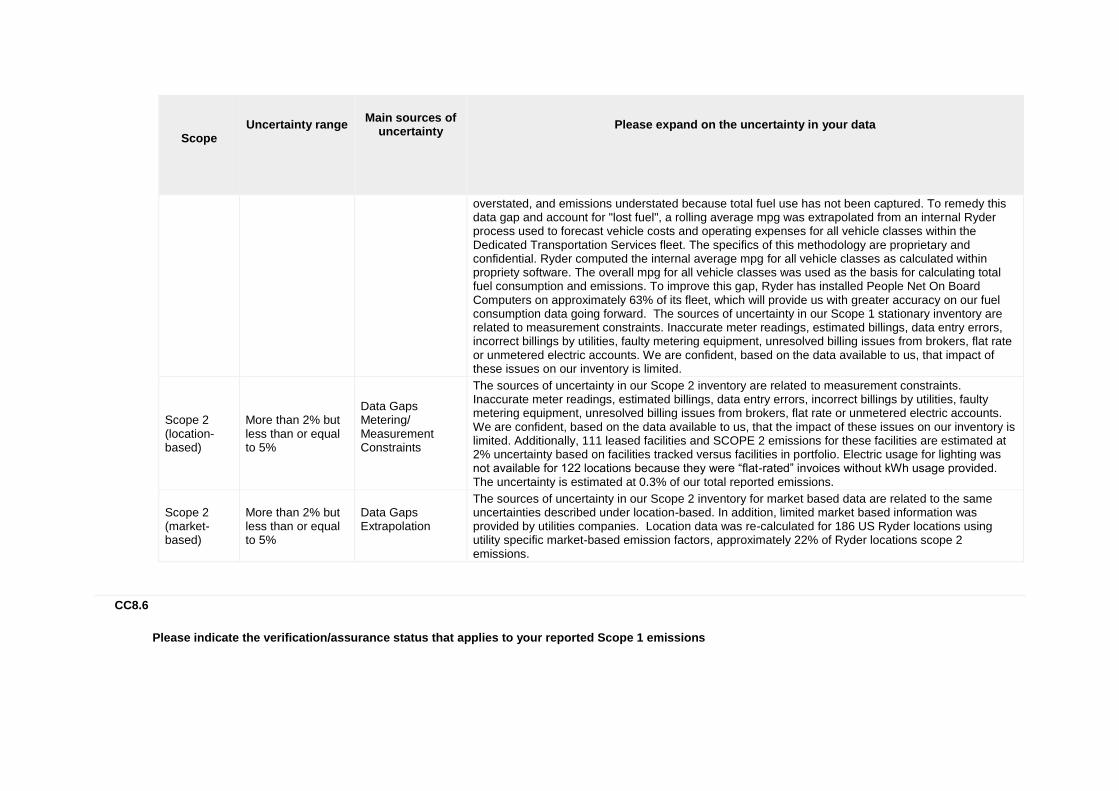
Scope
Uncertainty range
Main sources of
uncertainty
Please expand on the uncertainty in your data
overstated, and emissions understated because total fuel use has not been captured. To remedy this data gap and account for "lost fuel", a rolling average mpg was extrapolated from an internal Ryder process used to forecast vehicle costs and operating expenses for all vehicle classes within the Dedicated Transportation Services fleet. The specifics of this methodology are proprietary and confidential. Ryder computed the internal average mpg for all vehicle classes as calculated within propriety software. The overall mpg for all vehicle classes was used as the basis for calculating total fuel consumption and emissions. To improve this gap, Ryder has installed People Net On Board Computers on approximately 63% of its fleet, which will provide us with greater accuracy on our fuel consumption data going forward. The sources of uncertainty in our Scope 1 stationary inventory are related to measurement constraints. Inaccurate meter readings, estimated billings, data entry errors, incorrect billings by utilities, faulty metering equipment, unresolved billing issues from brokers, flat rate or unmetered electric accounts. We are confident, based on the data available to us, that impact of these issues on our inventory is limited.
Scope 2 (location-based)
More than 2% but less than or equal to 5%
Data Gaps Metering/ Measurement Constraints
The sources of uncertainty in our Scope 2 inventory are related to measurement constraints. Inaccurate meter readings, estimated billings, data entry errors, incorrect billings by utilities, faulty metering equipment, unresolved billing issues from brokers, flat rate or unmetered electric accounts. We are confident, based on the data available to us, that the impact of these issues on our inventory is limited. Additionally, 111 leased facilities and SCOPE 2 emissions for these facilities are estimated at 2% uncertainty based on facilities tracked versus facilities in portfolio. Electric usage for lighting was not available for 122 locations because they were “flat-rated” invoices without kWh usage provided. The uncertainty is estimated at 0.3% of our total reported emissions.
Scope 2 (market-based)
More than 2% but less than or equal to 5%
Data Gaps Extrapolation
The sources of uncertainty in our Scope 2 inventory for market based data are related to the same uncertainties described under location-based. In addition, limited market based information was provided by utilities companies. Location data was re-calculated for 186 US Ryder locations using utility specific market-based emission factors, approximately 22% of Ryder locations scope 2 emissions.
CC8.6
Please indicate the verification/assurance status that applies to your reported Scope 1 emissions
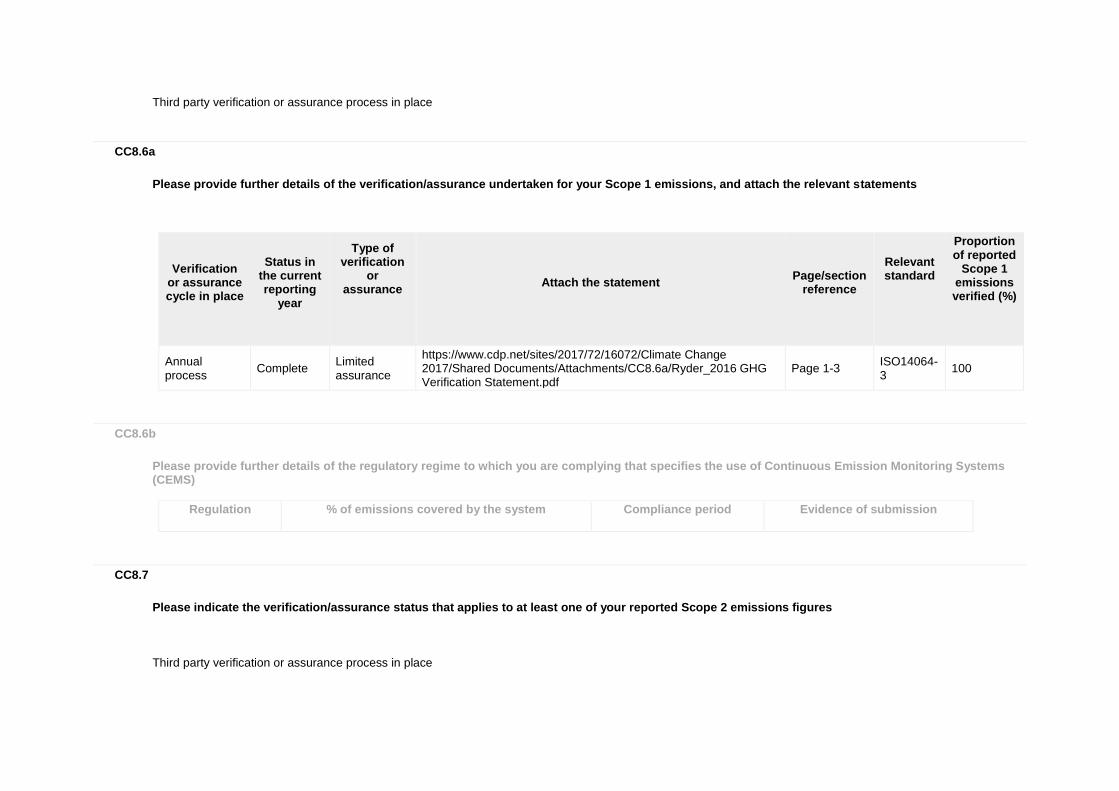
Third party verification or assurance process in place
CC8.6a
Please provide further details of the verification/assurance undertaken for your Scope 1 emissions, and attach the relevant statements
Verification
or assurance cycle in place
Status in
the current reporting
year
Type of verification
or assurance
Attach the statement
Page/section
reference
Relevant standard
Proportion of reported
Scope 1 emissions verified (%)
Annual process
Complete Limited assurance
https://www.cdp.net/sites/2017/72/16072/Climate Change 2017/Shared Documents/Attachments/CC8.6a/Ryder_2016 GHG Verification Statement.pdf
Page 1-3 ISO14064-3
100
CC8.6b
Please provide further details of the regulatory regime to which you are complying that specifies the use of Continuous Emission Monitoring Systems (CEMS)
Regulation
% of emissions covered by the system
Compliance period
Evidence of submission
CC8.7
Please indicate the verification/assurance status that applies to at least one of your reported Scope 2 emissions figures
Third party verification or assurance process in place
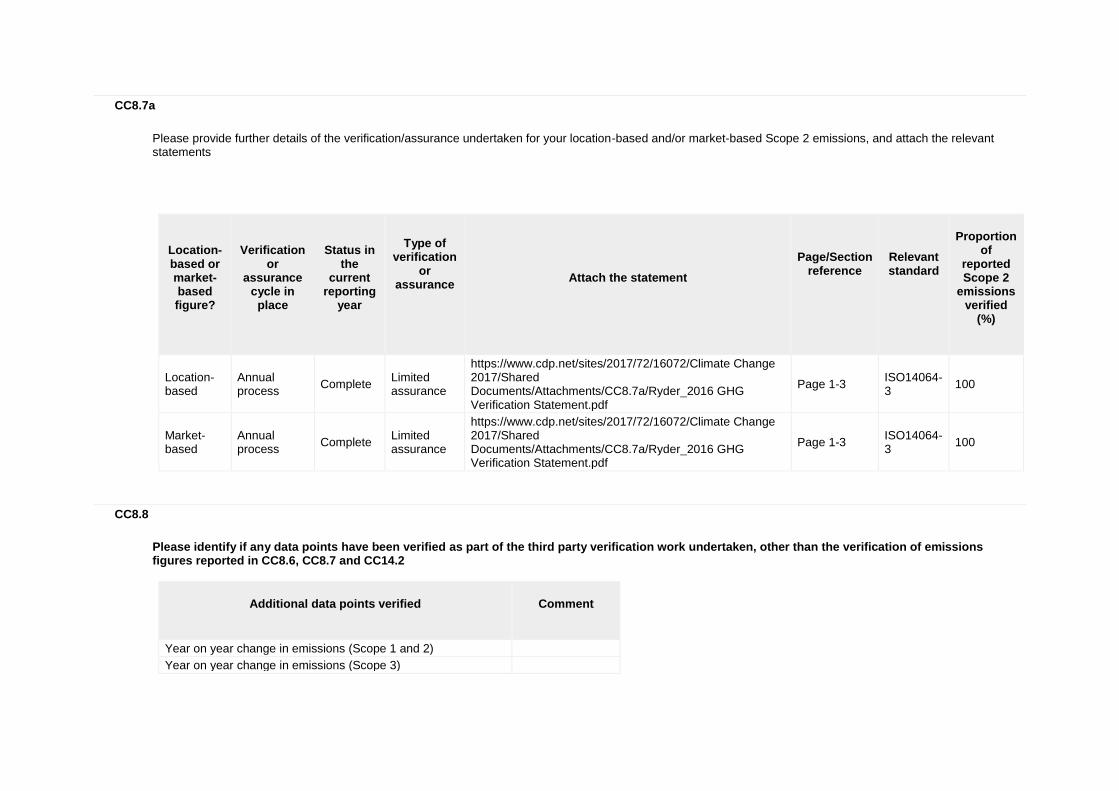
CC8.7a
Please provide further details of the verification/assurance undertaken for your location-based and/or market-based Scope 2 emissions, and attach the relevant statements
Location-based or market-based figure?
Verification
or assurance
cycle in place
Status in
the current
reporting year
Type of verification
or assurance
Attach the statement
Page/Section reference
Relevant standard
Proportion
of reported Scope 2
emissions verified
(%)
Location-based
Annual process
Complete Limited assurance
https://www.cdp.net/sites/2017/72/16072/Climate Change 2017/Shared Documents/Attachments/CC8.7a/Ryder_2016 GHG Verification Statement.pdf
Page 1-3 ISO14064-3
100
Market-based
Annual process
Complete Limited assurance
https://www.cdp.net/sites/2017/72/16072/Climate Change 2017/Shared Documents/Attachments/CC8.7a/Ryder_2016 GHG Verification Statement.pdf
Page 1-3 ISO14064-3
100
CC8.8
Please identify if any data points have been verified as part of the third party verification work undertaken, other than the verification of emissions figures reported in CC8.6, CC8.7 and CC14.2
Additional data points verified
Comment
Year on year change in emissions (Scope 1 and 2)
Year on year change in emissions (Scope 3)
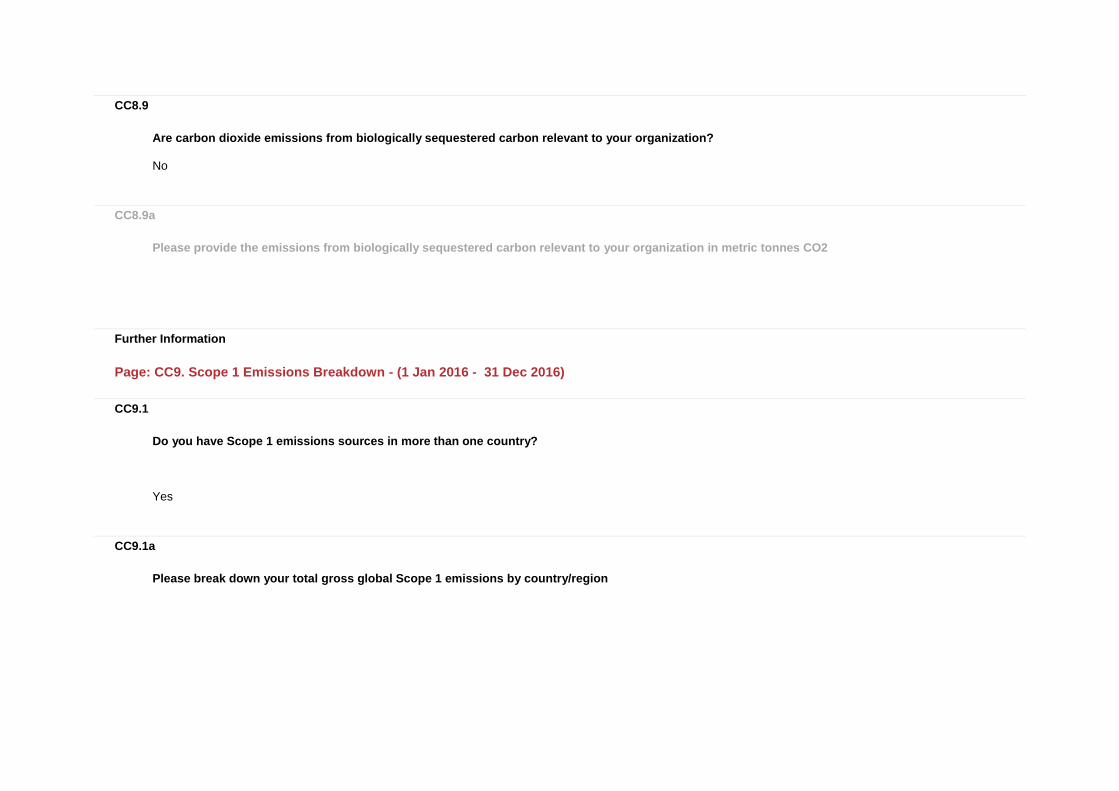
CC8.9
Are carbon dioxide emissions from biologically sequestered carbon relevant to your organization?
No
CC8.9a
Please provide the emissions from biologically sequestered carbon relevant to your organization in metric tonnes CO2
Further Information
Page: CC9. Scope 1 Emissions Breakdown - (1 Jan 2016 - 31 Dec 2016)
CC9.1
Do you have Scope 1 emissions sources in more than one country?
Yes
CC9.1a
Please break down your total gross global Scope 1 emissions by country/region
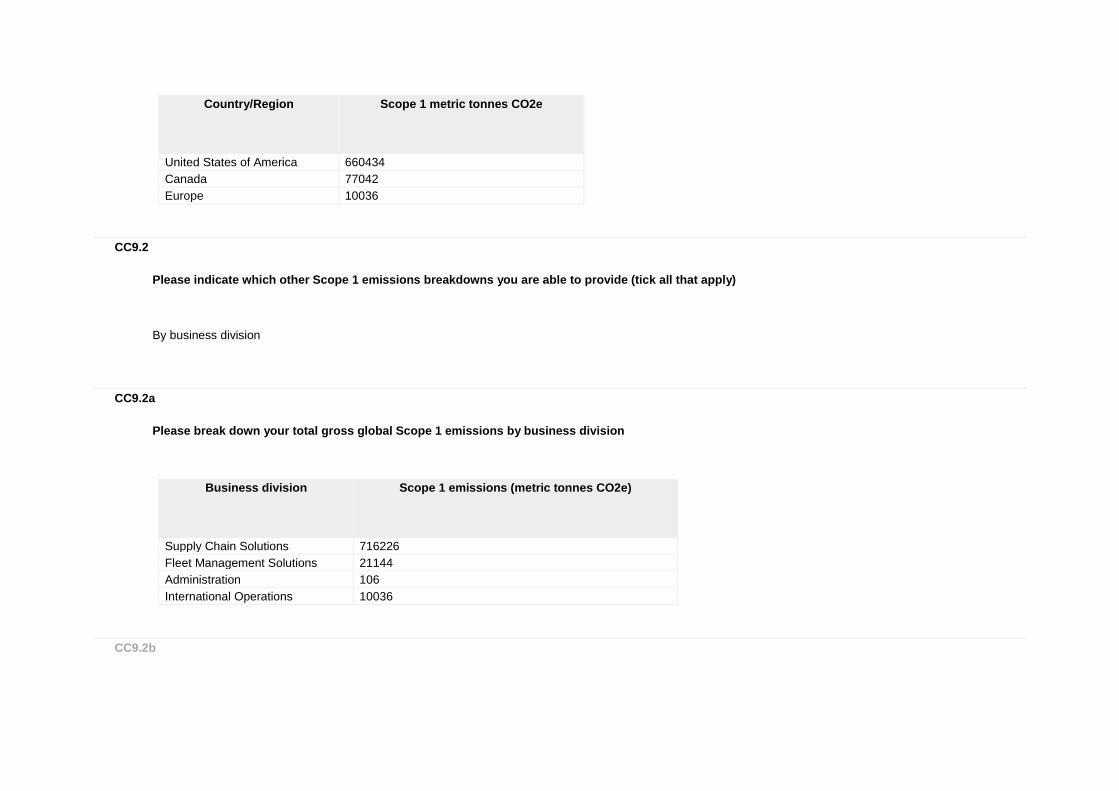
Country/Region
Scope 1 metric tonnes CO2e
United States of America 660434
Canada 77042
Europe 10036
CC9.2
Please indicate which other Scope 1 emissions breakdowns you are able to provide (tick all that apply)
By business division
CC9.2a
Please break down your total gross global Scope 1 emissions by business division
Business division
Scope 1 emissions (metric tonnes CO2e)
Supply Chain Solutions 716226
Fleet Management Solutions 21144
Administration 106
International Operations 10036
CC9.2b
Please break down your total gross global Scope 1 emissions by facility
Facility
Scope 1 emissions (metric tonnes CO2e)
Latitude
Longitude
CC9.2c
Please break down your total gross global Scope 1 emissions by GHG type
GHG type
Scope 1 emissions (metric tonnes CO2e)
CC9.2d
Please break down your total gross global Scope 1 emissions by activity
Activity
Scope 1 emissions (metric tonnes CO2e)
Further Information
Page: CC10. Scope 2 Emissions Breakdown - (1 Jan 2016 - 31 Dec 2016)
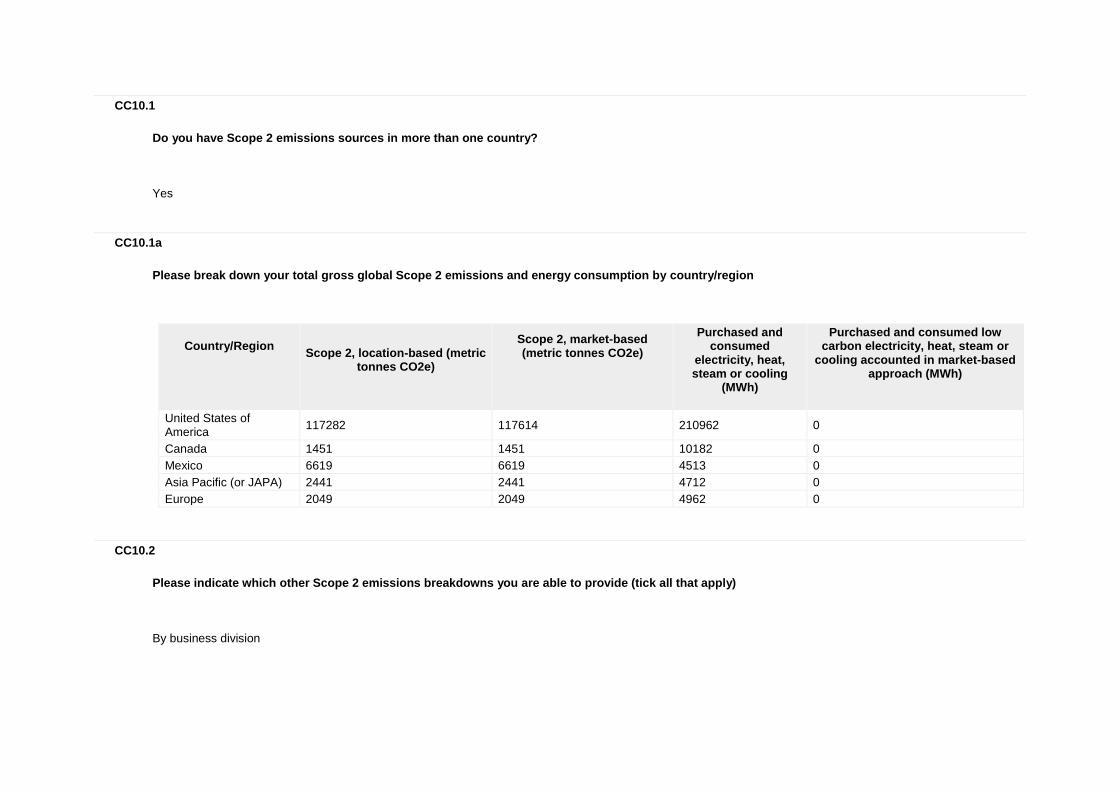
CC10.1
Do you have Scope 2 emissions sources in more than one country?
Yes
CC10.1a
Please break down your total gross global Scope 2 emissions and energy consumption by country/region
Country/Region
Scope 2, location-based (metric
tonnes CO2e)
Scope 2, market-based (metric tonnes CO2e)
Purchased and consumed
electricity, heat, steam or cooling
(MWh)
Purchased and consumed low carbon electricity, heat, steam or
cooling accounted in market-based approach (MWh)
United States of America
117282 117614 210962 0
Canada 1451 1451 10182 0
Mexico 6619 6619 4513 0
Asia Pacific (or JAPA) 2441 2441 4712 0
Europe 2049 2049 4962 0
CC10.2
Please indicate which other Scope 2 emissions breakdowns you are able to provide (tick all that apply)
By business division
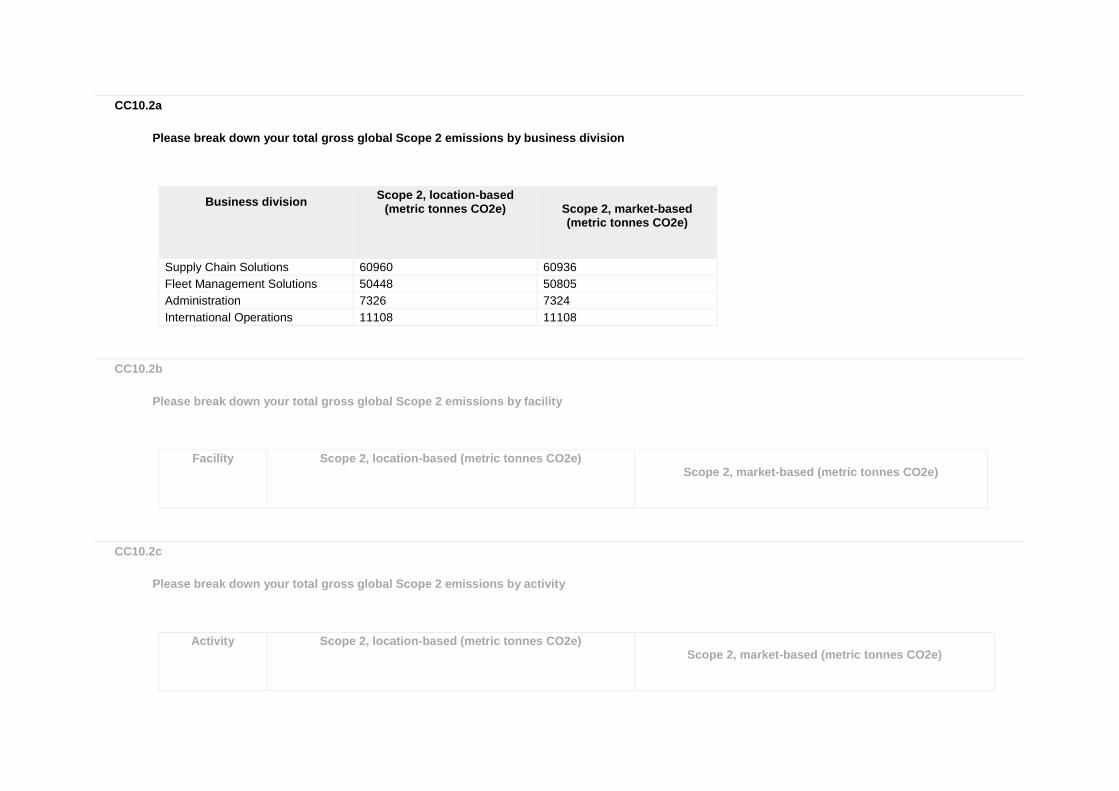
CC10.2a
Please break down your total gross global Scope 2 emissions by business division
Business division
Scope 2, location-based (metric tonnes CO2e)
Scope 2, market-based (metric tonnes CO2e)
Supply Chain Solutions 60960 60936
Fleet Management Solutions 50448 50805
Administration 7326 7324
International Operations 11108 11108
CC10.2b
Please break down your total gross global Scope 2 emissions by facility
Facility
Scope 2, location-based (metric tonnes CO2e)
Scope 2, market-based (metric tonnes CO2e)
CC10.2c
Please break down your total gross global Scope 2 emissions by activity
Activity
Scope 2, location-based (metric tonnes CO2e)
Scope 2, market-based (metric tonnes CO2e)
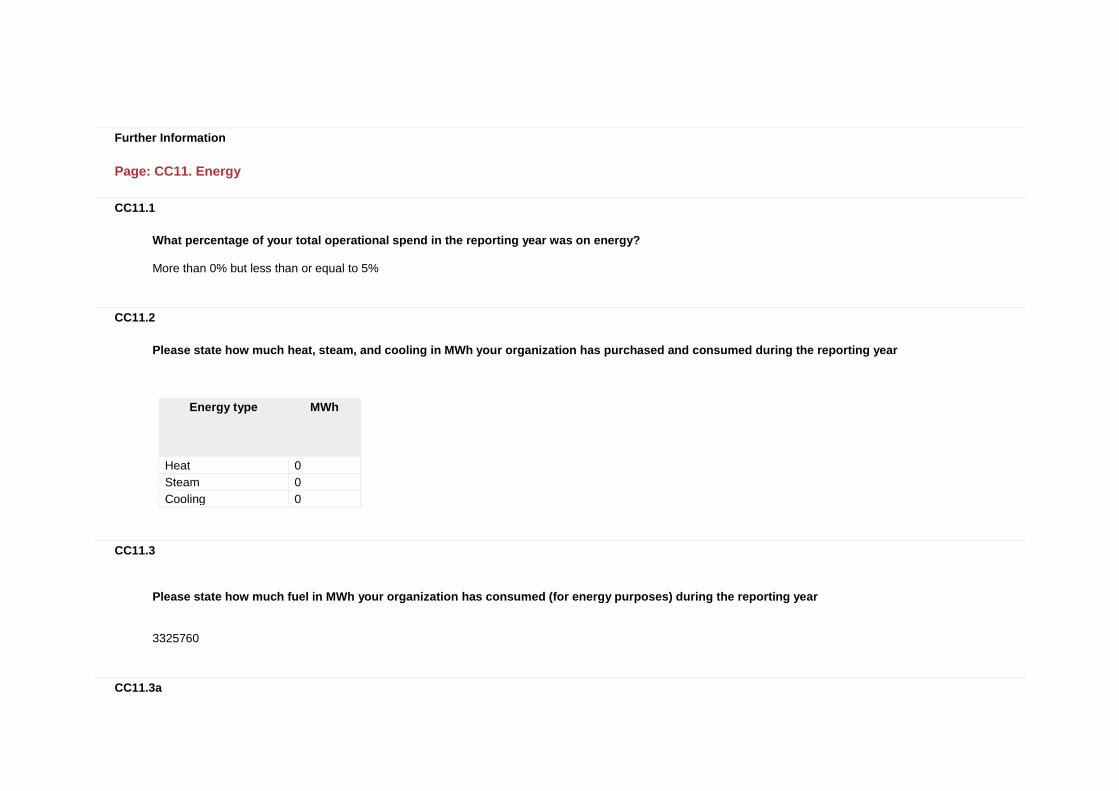
Further Information
Page: CC11. Energy
CC11.1
What percentage of your total operational spend in the reporting year was on energy?
More than 0% but less than or equal to 5%
CC11.2
Please state how much heat, steam, and cooling in MWh your organization has purchased and consumed during the reporting year
Energy type
MWh
Heat 0
Steam 0
Cooling 0
CC11.3
Please state how much fuel in MWh your organization has consumed (for energy purposes) during the reporting year
3325760
CC11.3a
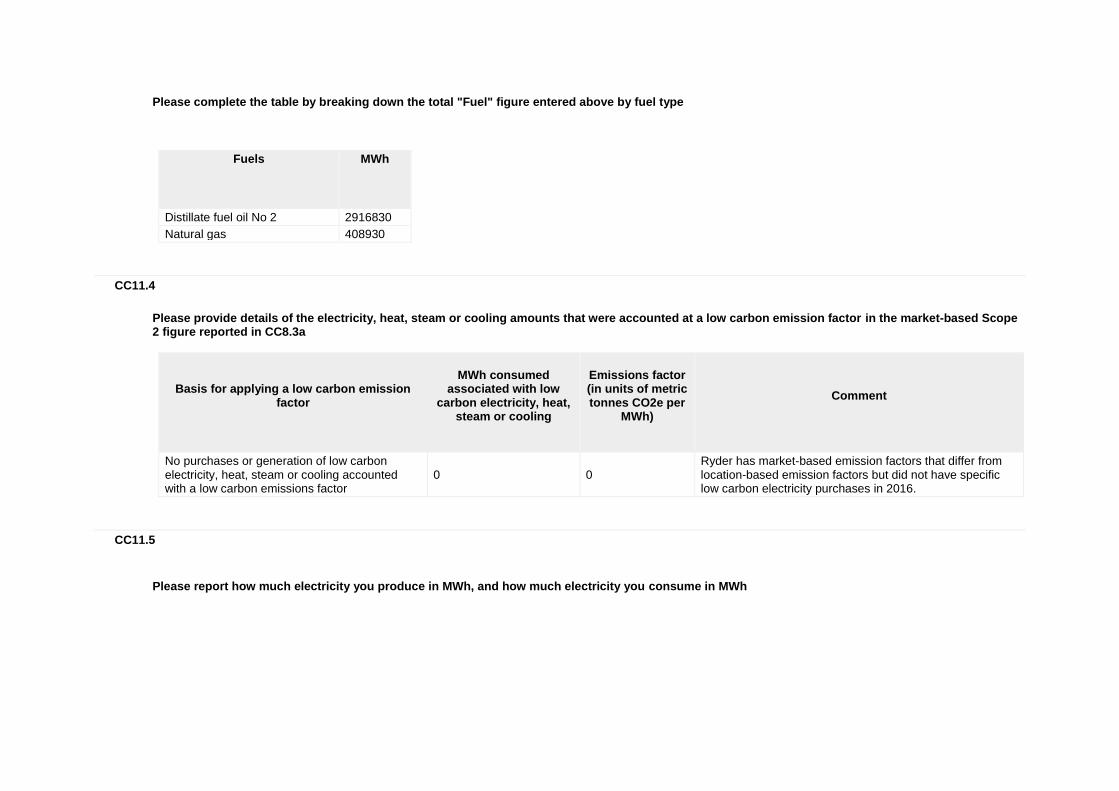
Please complete the table by breaking down the total "Fuel" figure entered above by fuel type
Fuels
MWh
Distillate fuel oil No 2 2916830
Natural gas 408930
CC11.4
Please provide details of the electricity, heat, steam or cooling amounts that were accounted at a low carbon emission factor in the market-based Scope 2 figure reported in CC8.3a
Basis for applying a low carbon emission factor
MWh consumed associated with low
carbon electricity, heat, steam or cooling
Emissions factor (in units of metric tonnes CO2e per
MWh)
Comment
No purchases or generation of low carbon electricity, heat, steam or cooling accounted with a low carbon emissions factor
0 0 Ryder has market-based emission factors that differ from location-based emission factors but did not have specific low carbon electricity purchases in 2016.
CC11.5
Please report how much electricity you produce in MWh, and how much electricity you consume in MWh
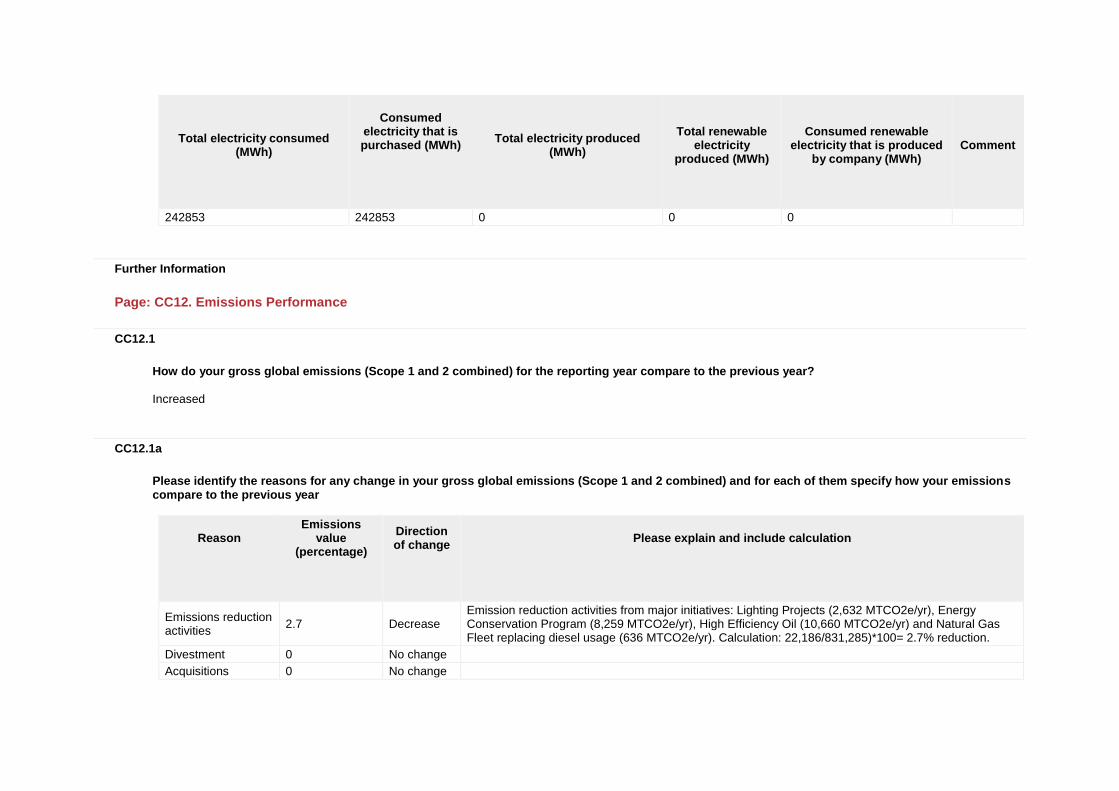
Total electricity consumed
(MWh)
Consumed
electricity that is purchased (MWh)
Total electricity produced
(MWh)
Total renewable
electricity produced (MWh)
Consumed renewable
electricity that is produced by company (MWh)
Comment
242853 242853 0 0 0
Further Information
Page: CC12. Emissions Performance
CC12.1
How do your gross global emissions (Scope 1 and 2 combined) for the reporting year compare to the previous year?
Increased
CC12.1a
Please identify the reasons for any change in your gross global emissions (Scope 1 and 2 combined) and for each of them specify how your emissions compare to the previous year
Reason
Emissions value
(percentage)
Direction of change
Please explain and include calculation
Emissions reduction activities
2.7 Decrease Emission reduction activities from major initiatives: Lighting Projects (2,632 MTCO2e/yr), Energy Conservation Program (8,259 MTCO2e/yr), High Efficiency Oil (10,660 MTCO2e/yr) and Natural Gas Fleet replacing diesel usage (636 MTCO2e/yr). Calculation: 22,186/831,285)*100= 2.7% reduction.
Divestment 0 No change
Acquisitions 0 No change
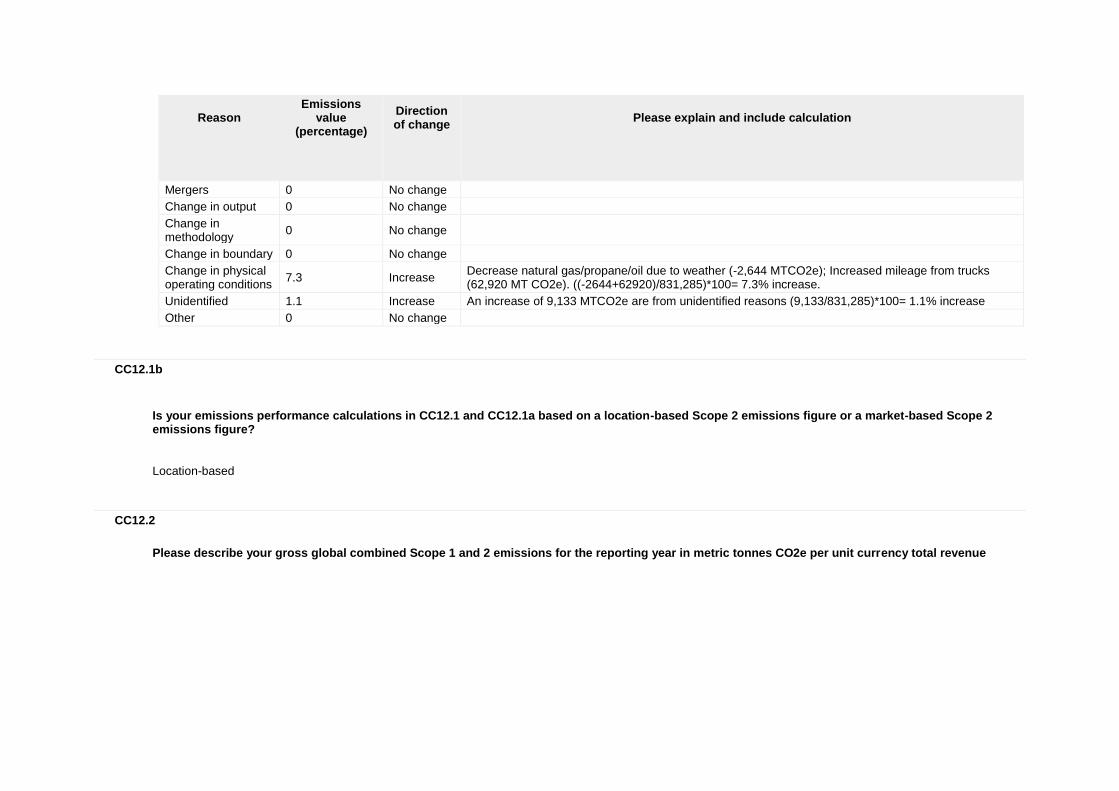
Reason
Emissions value
(percentage)
Direction of change
Please explain and include calculation
Mergers 0 No change
Change in output 0 No change
Change in methodology
0 No change
Change in boundary 0 No change
Change in physical operating conditions
7.3 Increase Decrease natural gas/propane/oil due to weather (-2,644 MTCO2e); Increased mileage from trucks (62,920 MT CO2e). ((-2644+62920)/831,285)*100= 7.3% increase.
Unidentified 1.1 Increase An increase of 9,133 MTCO2e are from unidentified reasons (9,133/831,285)*100= 1.1% increase
Other 0 No change
CC12.1b
Is your emissions performance calculations in CC12.1 and CC12.1a based on a location-based Scope 2 emissions figure or a market-based Scope 2 emissions figure?
Location-based
CC12.2
Please describe your gross global combined Scope 1 and 2 emissions for the reporting year in metric tonnes CO2e per unit currency total revenue
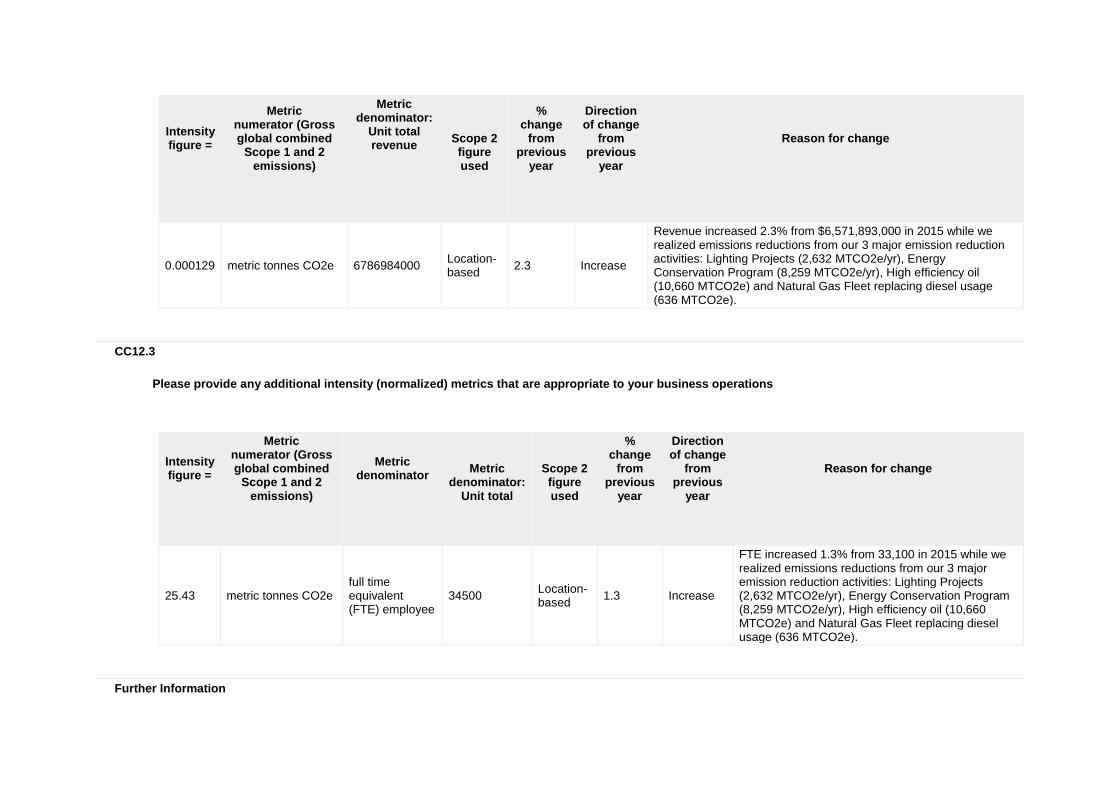
Intensity figure =
Metric numerator (Gross global combined
Scope 1 and 2 emissions)
Metric denominator:
Unit total revenue
Scope 2 figure used
% change
from previous
year
Direction of change
from previous
year
Reason for change
0.000129 metric tonnes CO2e 6786984000 Location-based
2.3 Increase
Revenue increased 2.3% from $6,571,893,000 in 2015 while we realized emissions reductions from our 3 major emission reduction activities: Lighting Projects (2,632 MTCO2e/yr), Energy Conservation Program (8,259 MTCO2e/yr), High efficiency oil (10,660 MTCO2e) and Natural Gas Fleet replacing diesel usage (636 MTCO2e).
CC12.3
Please provide any additional intensity (normalized) metrics that are appropriate to your business operations
Intensity figure =
Metric numerator (Gross global combined
Scope 1 and 2 emissions)
Metric denominator
Metric
denominator: Unit total
Scope 2 figure used
% change
from previous
year
Direction of change
from previous
year
Reason for change
25.43 metric tonnes CO2e full time equivalent (FTE) employee
34500 Location-based
1.3 Increase
FTE increased 1.3% from 33,100 in 2015 while we realized emissions reductions from our 3 major emission reduction activities: Lighting Projects (2,632 MTCO2e/yr), Energy Conservation Program (8,259 MTCO2e/yr), High efficiency oil (10,660 MTCO2e) and Natural Gas Fleet replacing diesel usage (636 MTCO2e).
Further Information
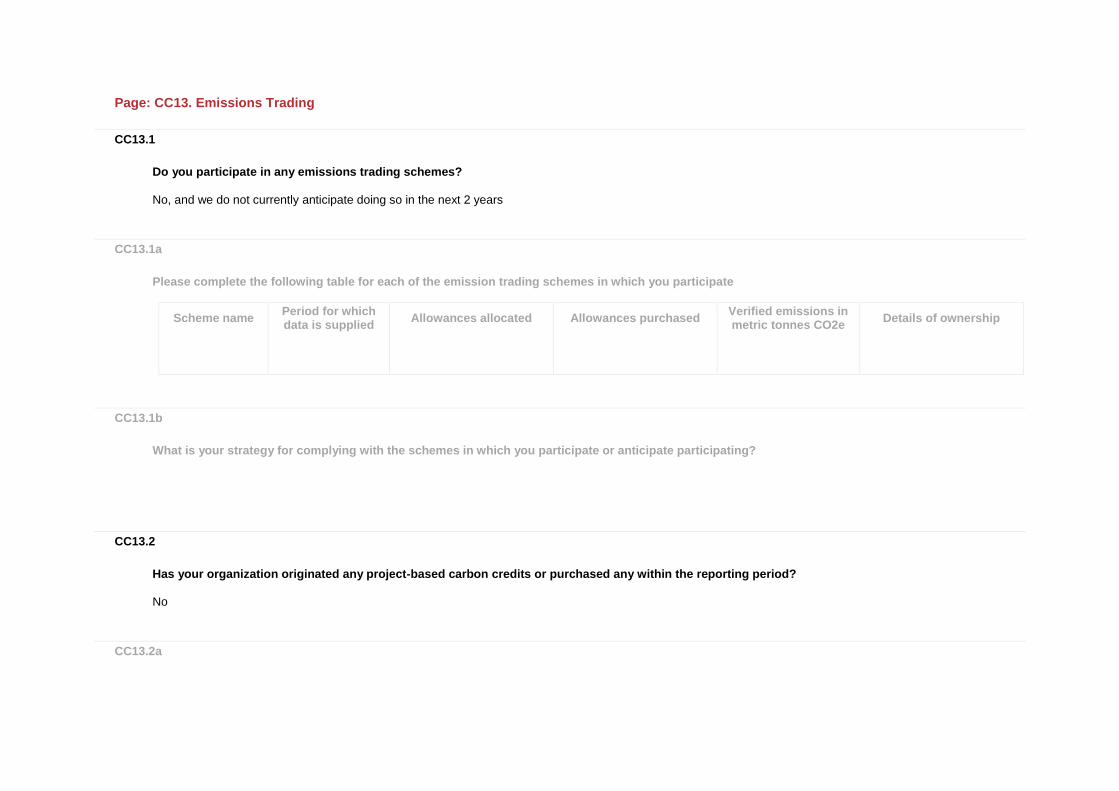
Page: CC13. Emissions Trading
CC13.1
Do you participate in any emissions trading schemes?
No, and we do not currently anticipate doing so in the next 2 years
CC13.1a
Please complete the following table for each of the emission trading schemes in which you participate
Scheme name
Period for which data is supplied
Allowances allocated
Allowances purchased
Verified emissions in metric tonnes CO2e
Details of ownership
CC13.1b
What is your strategy for complying with the schemes in which you participate or anticipate participating?
CC13.2
Has your organization originated any project-based carbon credits or purchased any within the reporting period?
No
CC13.2a
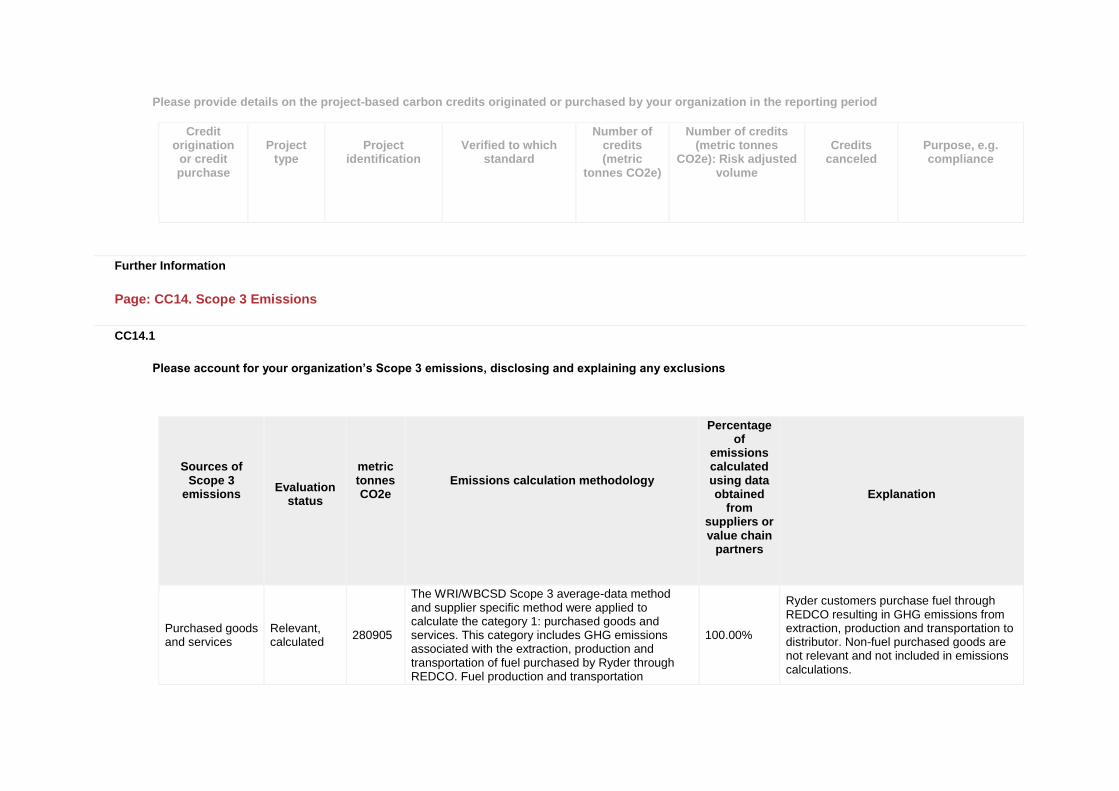
Please provide details on the project-based carbon credits originated or purchased by your organization in the reporting period
Credit origination
or credit purchase
Project type
Project identification
Verified to which standard
Number of credits (metric
tonnes CO2e)
Number of credits (metric tonnes
CO2e): Risk adjusted volume
Credits canceled
Purpose, e.g. compliance
Further Information
Page: CC14. Scope 3 Emissions
CC14.1
Please account for your organization’s Scope 3 emissions, disclosing and explaining any exclusions
Sources of Scope 3
emissions
Evaluation status
metric tonnes CO2e
Emissions calculation methodology
Percentage of
emissions calculated using data obtained
from suppliers or value chain
partners
Explanation
Purchased goods and services
Relevant, calculated
280905
The WRI/WBCSD Scope 3 average-data method and supplier specific method were applied to calculate the category 1: purchased goods and services. This category includes GHG emissions associated with the extraction, production and transportation of fuel purchased by Ryder through REDCO. Fuel production and transportation
100.00%
Ryder customers purchase fuel through REDCO resulting in GHG emissions from extraction, production and transportation to distributor. Non-fuel purchased goods are not relevant and not included in emissions calculations.
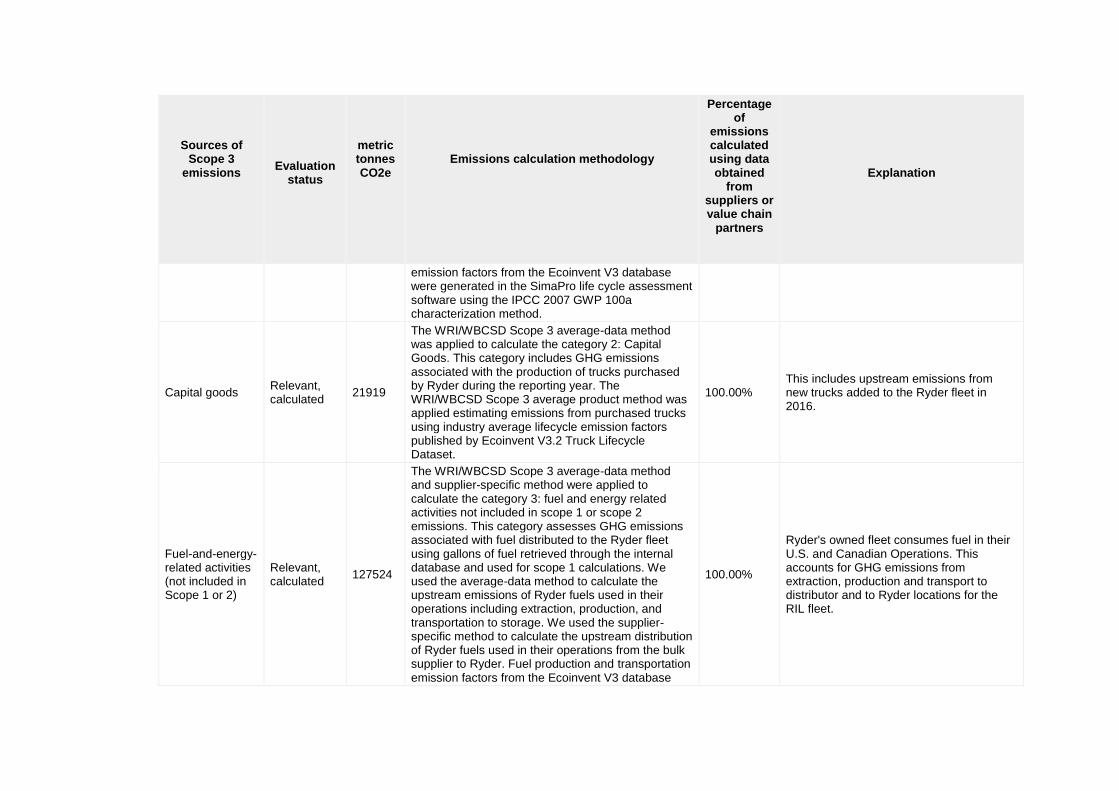
Sources of Scope 3
emissions
Evaluation status
metric tonnes CO2e
Emissions calculation methodology
Percentage of
emissions calculated using data obtained
from suppliers or value chain
partners
Explanation
emission factors from the Ecoinvent V3 database were generated in the SimaPro life cycle assessment software using the IPCC 2007 GWP 100a characterization method.
Capital goods Relevant, calculated
21919
The WRI/WBCSD Scope 3 average-data method was applied to calculate the category 2: Capital Goods. This category includes GHG emissions associated with the production of trucks purchased by Ryder during the reporting year. The WRI/WBCSD Scope 3 average product method was applied estimating emissions from purchased trucks using industry average lifecycle emission factors published by Ecoinvent V3.2 Truck Lifecycle Dataset.
100.00% This includes upstream emissions from new trucks added to the Ryder fleet in 2016.
Fuel-and-energy-related activities (not included in Scope 1 or 2)
Relevant, calculated
127524
The WRI/WBCSD Scope 3 average-data method and supplier-specific method were applied to calculate the category 3: fuel and energy related activities not included in scope 1 or scope 2 emissions. This category assesses GHG emissions associated with fuel distributed to the Ryder fleet using gallons of fuel retrieved through the internal database and used for scope 1 calculations. We used the average-data method to calculate the upstream emissions of Ryder fuels used in their operations including extraction, production, and transportation to storage. We used the supplier-specific method to calculate the upstream distribution of Ryder fuels used in their operations from the bulk supplier to Ryder. Fuel production and transportation emission factors from the Ecoinvent V3 database
100.00%
Ryder's owned fleet consumes fuel in their U.S. and Canadian Operations. This accounts for GHG emissions from extraction, production and transport to distributor and to Ryder locations for the RIL fleet.
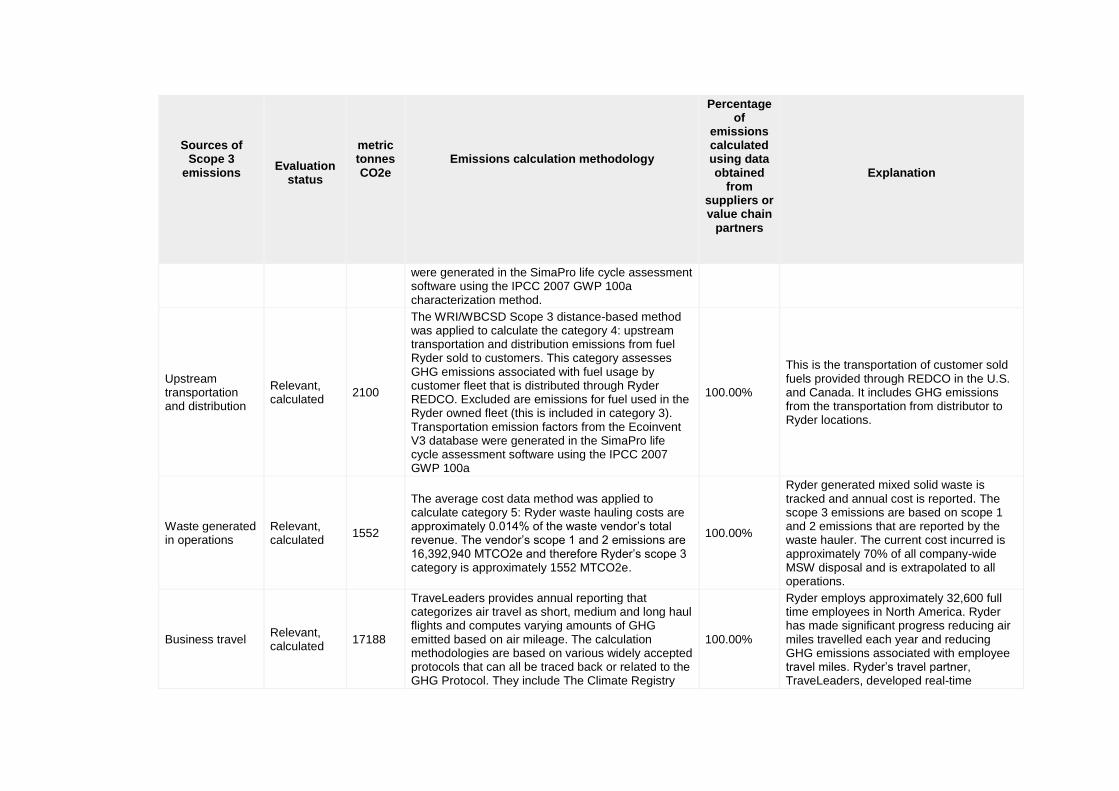
Sources of Scope 3
emissions
Evaluation status
metric tonnes CO2e
Emissions calculation methodology
Percentage of
emissions calculated using data obtained
from suppliers or value chain
partners
Explanation
were generated in the SimaPro life cycle assessment software using the IPCC 2007 GWP 100a characterization method.
Upstream transportation and distribution
Relevant, calculated
2100
The WRI/WBCSD Scope 3 distance-based method was applied to calculate the category 4: upstream transportation and distribution emissions from fuel Ryder sold to customers. This category assesses GHG emissions associated with fuel usage by customer fleet that is distributed through Ryder REDCO. Excluded are emissions for fuel used in the Ryder owned fleet (this is included in category 3). Transportation emission factors from the Ecoinvent V3 database were generated in the SimaPro life cycle assessment software using the IPCC 2007 GWP 100a
100.00%
This is the transportation of customer sold fuels provided through REDCO in the U.S. and Canada. It includes GHG emissions from the transportation from distributor to Ryder locations.
Waste generated in operations
Relevant, calculated
1552
The average cost data method was applied to calculate category 5: Ryder waste hauling costs are approximately 0.014% of the waste vendor’s total revenue. The vendor’s scope 1 and 2 emissions are 16,392,940 MTCO2e and therefore Ryder’s scope 3 category is approximately 1552 MTCO2e.
100.00%
Ryder generated mixed solid waste is tracked and annual cost is reported. The scope 3 emissions are based on scope 1 and 2 emissions that are reported by the waste hauler. The current cost incurred is approximately 70% of all company-wide MSW disposal and is extrapolated to all operations.
Business travel Relevant, calculated
17188
TraveLeaders provides annual reporting that categorizes air travel as short, medium and long haul flights and computes varying amounts of GHG emitted based on air mileage. The calculation methodologies are based on various widely accepted protocols that can all be traced back or related to the GHG Protocol. They include The Climate Registry
100.00%
Ryder employs approximately 32,600 full time employees in North America. Ryder has made significant progress reducing air miles travelled each year and reducing GHG emissions associated with employee travel miles. Ryder’s travel partner, TraveLeaders, developed real-time
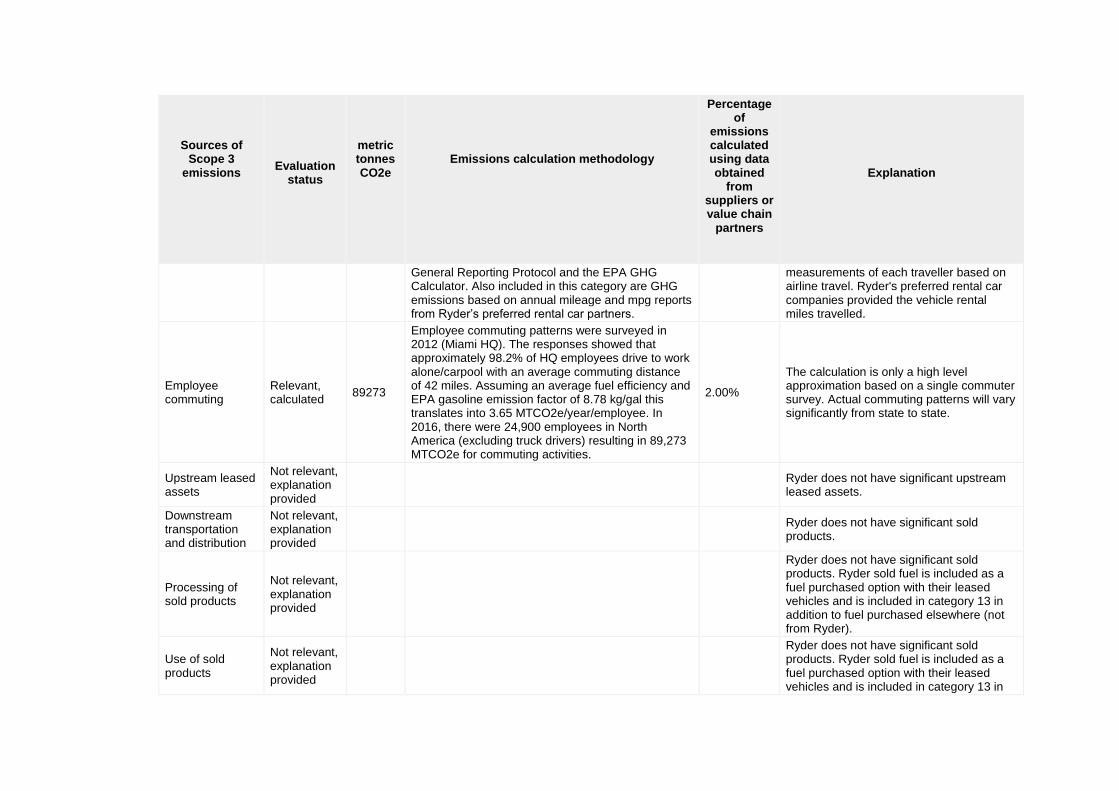
Sources of Scope 3
emissions
Evaluation status
metric tonnes CO2e
Emissions calculation methodology
Percentage of
emissions calculated using data obtained
from suppliers or value chain
partners
Explanation
General Reporting Protocol and the EPA GHG Calculator. Also included in this category are GHG emissions based on annual mileage and mpg reports from Ryder’s preferred rental car partners.
measurements of each traveller based on airline travel. Ryder's preferred rental car companies provided the vehicle rental miles travelled.
Employee commuting
Relevant, calculated
89273
Employee commuting patterns were surveyed in 2012 (Miami HQ). The responses showed that approximately 98.2% of HQ employees drive to work alone/carpool with an average commuting distance of 42 miles. Assuming an average fuel efficiency and EPA gasoline emission factor of 8.78 kg/gal this translates into 3.65 MTCO2e/year/employee. In 2016, there were 24,900 employees in North America (excluding truck drivers) resulting in 89,273 MTCO2e for commuting activities.
2.00%
The calculation is only a high level approximation based on a single commuter survey. Actual commuting patterns will vary significantly from state to state.
Upstream leased assets
Not relevant, explanation provided
Ryder does not have significant upstream leased assets.
Downstream transportation and distribution
Not relevant, explanation provided
Ryder does not have significant sold products.
Processing of sold products
Not relevant, explanation provided
Ryder does not have significant sold products. Ryder sold fuel is included as a fuel purchased option with their leased vehicles and is included in category 13 in addition to fuel purchased elsewhere (not from Ryder).
Use of sold products
Not relevant, explanation provided
Ryder does not have significant sold products. Ryder sold fuel is included as a fuel purchased option with their leased vehicles and is included in category 13 in
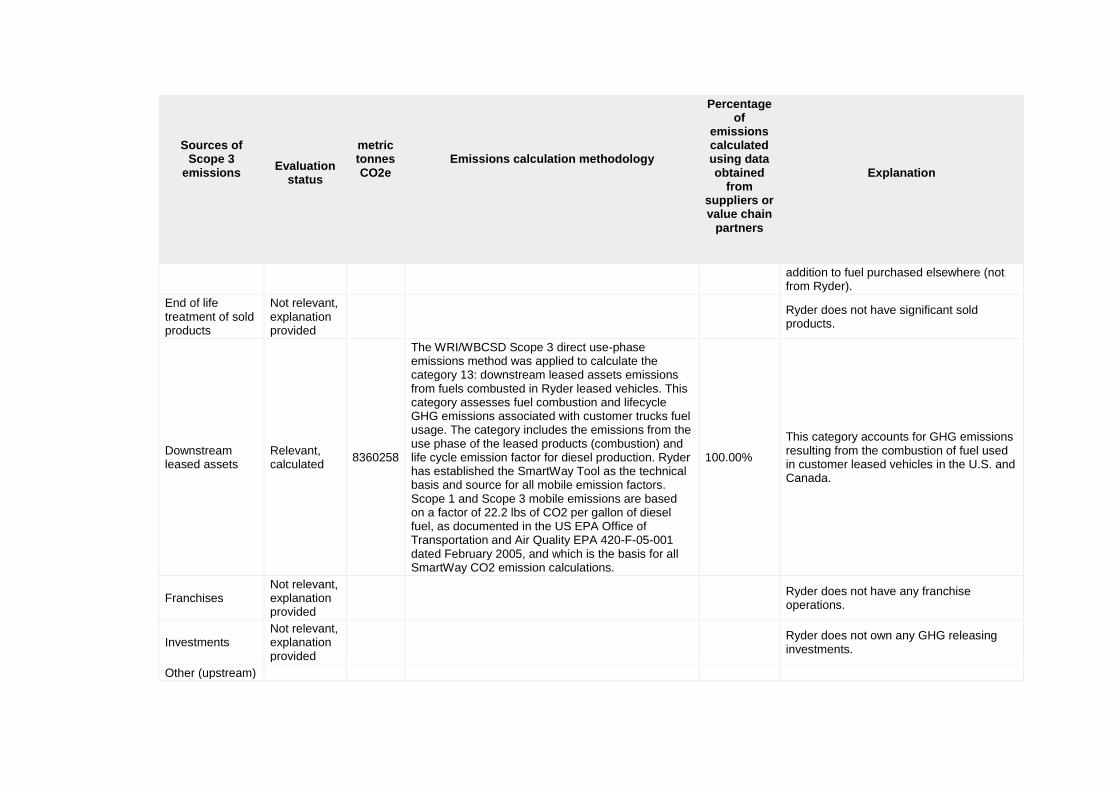
Sources of Scope 3
emissions
Evaluation status
metric tonnes CO2e
Emissions calculation methodology
Percentage of
emissions calculated using data obtained
from suppliers or value chain
partners
Explanation
addition to fuel purchased elsewhere (not from Ryder).
End of life treatment of sold products
Not relevant, explanation provided
Ryder does not have significant sold products.
Downstream leased assets
Relevant, calculated
8360258
The WRI/WBCSD Scope 3 direct use-phase emissions method was applied to calculate the category 13: downstream leased assets emissions from fuels combusted in Ryder leased vehicles. This category assesses fuel combustion and lifecycle GHG emissions associated with customer trucks fuel usage. The category includes the emissions from the use phase of the leased products (combustion) and life cycle emission factor for diesel production. Ryder has established the SmartWay Tool as the technical basis and source for all mobile emission factors. Scope 1 and Scope 3 mobile emissions are based on a factor of 22.2 lbs of CO2 per gallon of diesel fuel, as documented in the US EPA Office of Transportation and Air Quality EPA 420-F-05-001 dated February 2005, and which is the basis for all SmartWay CO2 emission calculations.
100.00%
This category accounts for GHG emissions resulting from the combustion of fuel used in customer leased vehicles in the U.S. and Canada.
Franchises Not relevant, explanation provided
Ryder does not have any franchise operations.
Investments Not relevant, explanation provided
Ryder does not own any GHG releasing investments.
Other (upstream)
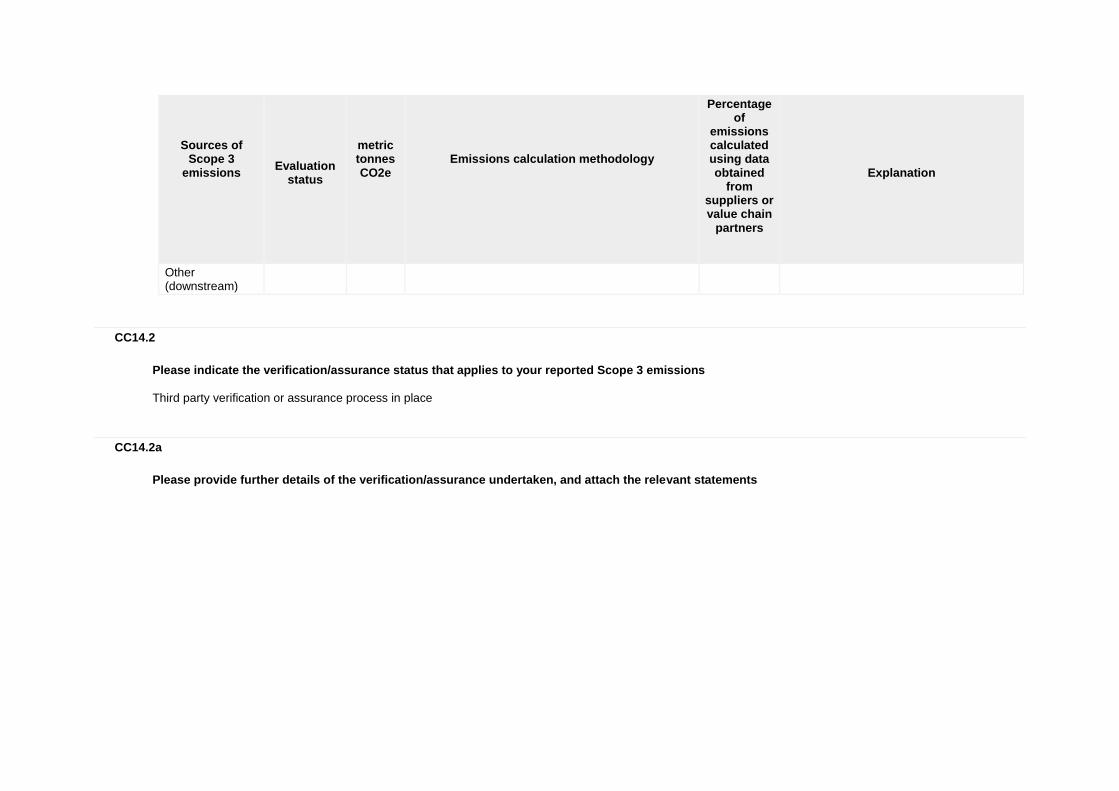
Sources of Scope 3
emissions
Evaluation status
metric tonnes CO2e
Emissions calculation methodology
Percentage of
emissions calculated using data obtained
from suppliers or value chain
partners
Explanation
Other (downstream)
CC14.2
Please indicate the verification/assurance status that applies to your reported Scope 3 emissions
Third party verification or assurance process in place
CC14.2a
Please provide further details of the verification/assurance undertaken, and attach the relevant statements
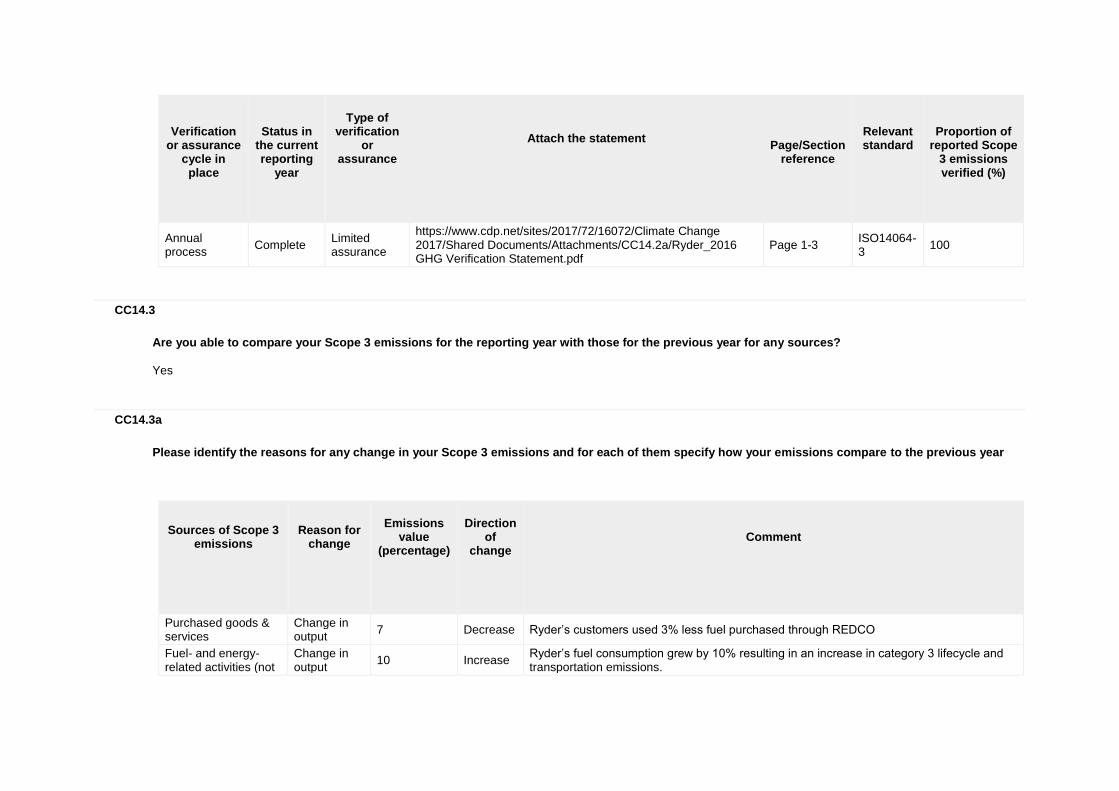
Verification
or assurance cycle in
place
Status in
the current reporting
year
Type of
verification or
assurance
Attach the statement
Page/Section
reference
Relevant standard
Proportion of
reported Scope 3 emissions verified (%)
Annual process
Complete Limited assurance
https://www.cdp.net/sites/2017/72/16072/Climate Change 2017/Shared Documents/Attachments/CC14.2a/Ryder_2016 GHG Verification Statement.pdf
Page 1-3 ISO14064-3
100
CC14.3
Are you able to compare your Scope 3 emissions for the reporting year with those for the previous year for any sources?
Yes
CC14.3a
Please identify the reasons for any change in your Scope 3 emissions and for each of them specify how your emissions compare to the previous year
Sources of Scope 3
emissions
Reason for
change
Emissions
value (percentage)
Direction
of change
Comment
Purchased goods & services
Change in output
7 Decrease Ryder’s customers used 3% less fuel purchased through REDCO
Fuel- and energy-related activities (not
Change in output
10 Increase Ryder’s fuel consumption grew by 10% resulting in an increase in category 3 lifecycle and transportation emissions.
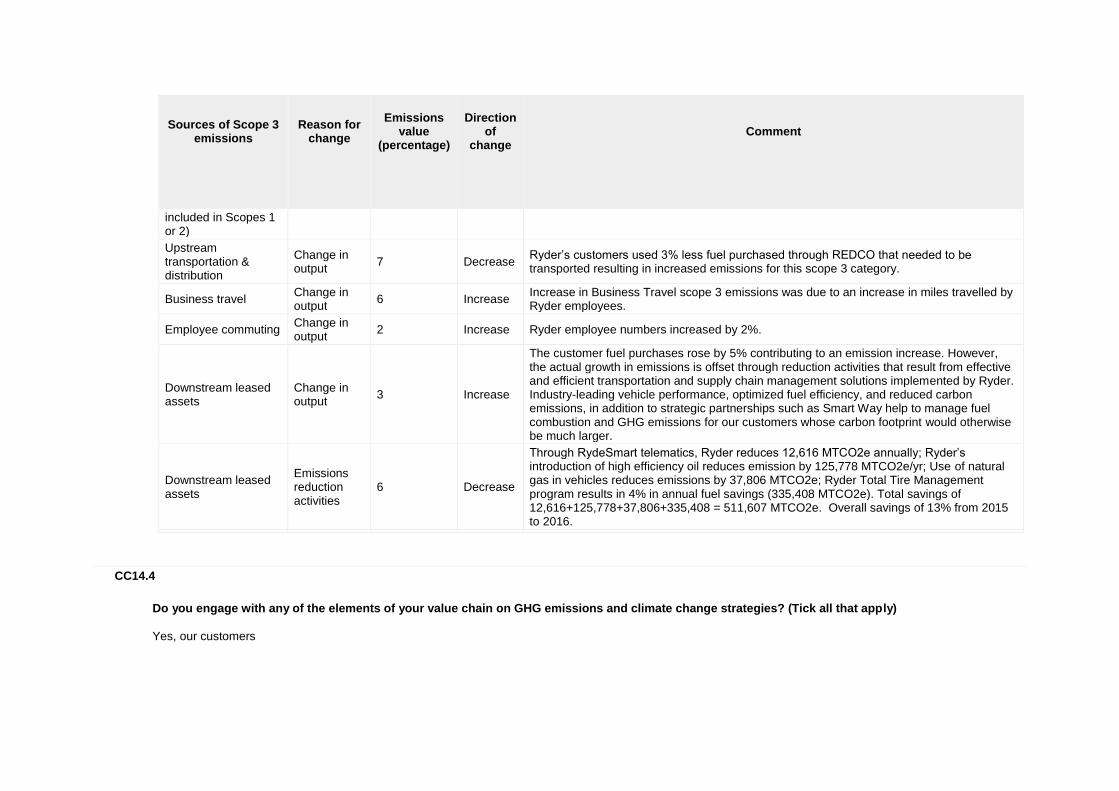
Sources of Scope 3
emissions
Reason for
change
Emissions
value (percentage)
Direction
of change
Comment
included in Scopes 1 or 2)
Upstream transportation & distribution
Change in output
7 Decrease Ryder’s customers used 3% less fuel purchased through REDCO that needed to be transported resulting in increased emissions for this scope 3 category.
Business travel Change in output
6 Increase Increase in Business Travel scope 3 emissions was due to an increase in miles travelled by Ryder employees.
Employee commuting Change in output
2 Increase Ryder employee numbers increased by 2%.
Downstream leased assets
Change in output
3 Increase
The customer fuel purchases rose by 5% contributing to an emission increase. However, the actual growth in emissions is offset through reduction activities that result from effective and efficient transportation and supply chain management solutions implemented by Ryder. Industry-leading vehicle performance, optimized fuel efficiency, and reduced carbon emissions, in addition to strategic partnerships such as Smart Way help to manage fuel combustion and GHG emissions for our customers whose carbon footprint would otherwise be much larger.
Downstream leased assets
Emissions reduction activities
6 Decrease
Through RydeSmart telematics, Ryder reduces 12,616 MTCO2e annually; Ryder’s introduction of high efficiency oil reduces emission by 125,778 MTCO2e/yr; Use of natural gas in vehicles reduces emissions by 37,806 MTCO2e; Ryder Total Tire Management program results in 4% in annual fuel savings (335,408 MTCO2e). Total savings of 12,616+125,778+37,806+335,408 = 511,607 MTCO2e. Overall savings of 13% from 2015 to 2016.
CC14.4
Do you engage with any of the elements of your value chain on GHG emissions and climate change strategies? (Tick all that apply)
Yes, our customers
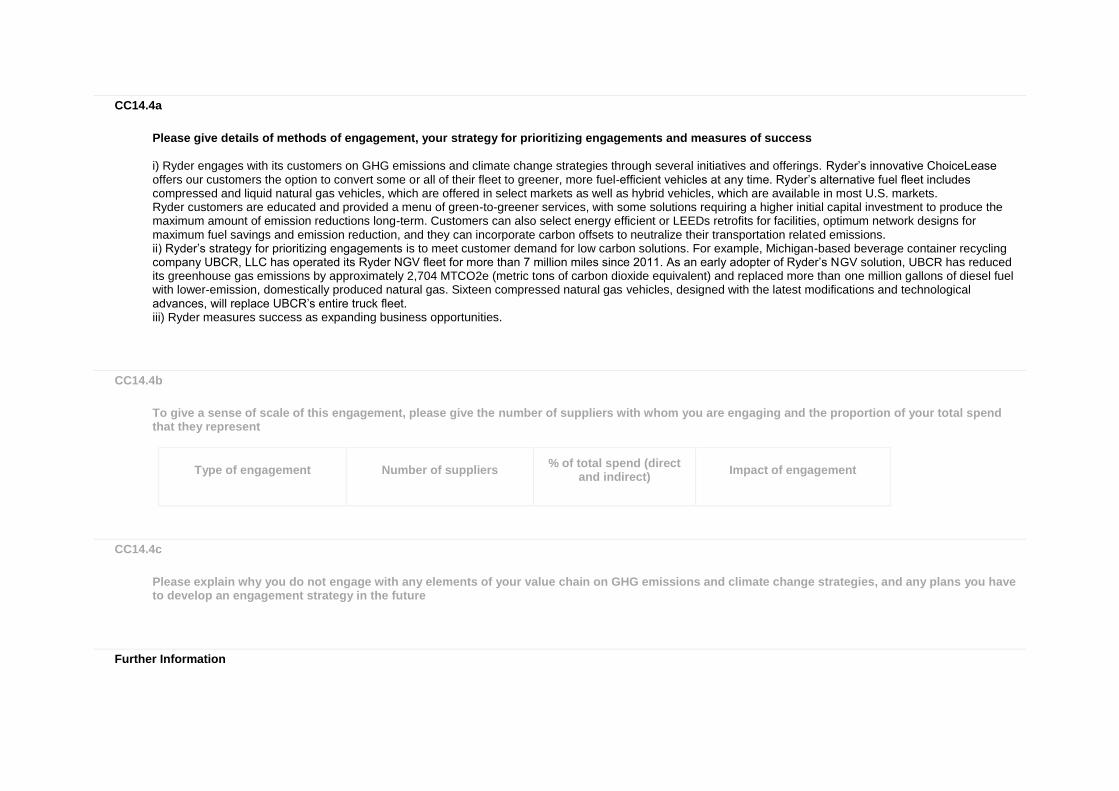
CC14.4a
Please give details of methods of engagement, your strategy for prioritizing engagements and measures of success
i) Ryder engages with its customers on GHG emissions and climate change strategies through several initiatives and offerings. Ryder’s innovative ChoiceLease offers our customers the option to convert some or all of their fleet to greener, more fuel-efficient vehicles at any time. Ryder’s alternative fuel fleet includes compressed and liquid natural gas vehicles, which are offered in select markets as well as hybrid vehicles, which are available in most U.S. markets. Ryder customers are educated and provided a menu of green-to-greener services, with some solutions requiring a higher initial capital investment to produce the maximum amount of emission reductions long-term. Customers can also select energy efficient or LEEDs retrofits for facilities, optimum network designs for maximum fuel savings and emission reduction, and they can incorporate carbon offsets to neutralize their transportation related emissions. ii) Ryder’s strategy for prioritizing engagements is to meet customer demand for low carbon solutions. For example, Michigan-based beverage container recycling company UBCR, LLC has operated its Ryder NGV fleet for more than 7 million miles since 2011. As an early adopter of Ryder’s NGV solution, UBCR has reduced its greenhouse gas emissions by approximately 2,704 MTCO2e (metric tons of carbon dioxide equivalent) and replaced more than one million gallons of diesel fuel with lower-emission, domestically produced natural gas. Sixteen compressed natural gas vehicles, designed with the latest modifications and technological advances, will replace UBCR’s entire truck fleet. iii) Ryder measures success as expanding business opportunities.
CC14.4b
To give a sense of scale of this engagement, please give the number of suppliers with whom you are engaging and the proportion of your total spend that they represent
Type of engagement
Number of suppliers
% of total spend (direct and indirect)
Impact of engagement
CC14.4c
Please explain why you do not engage with any elements of your value chain on GHG emissions and climate change strategies, and any plans you have to develop an engagement strategy in the future
Further Information
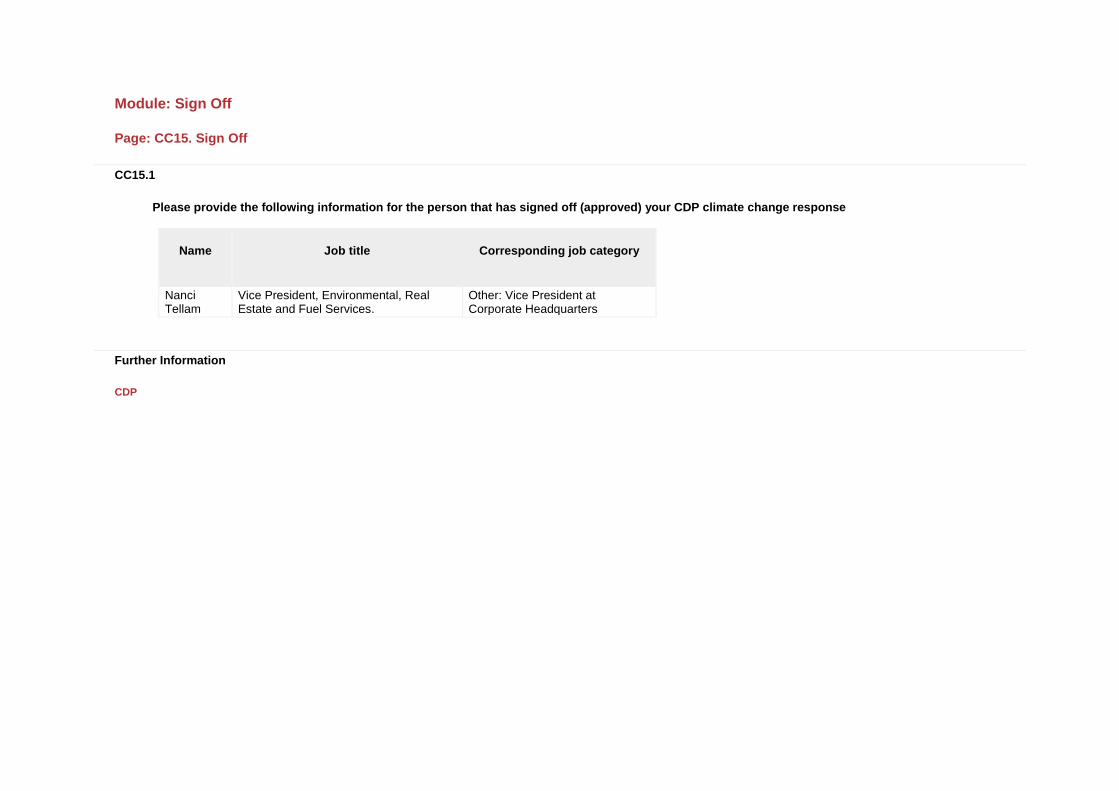
Module: Sign Off
Page: CC15. Sign Off
CC15.1
Please provide the following information for the person that has signed off (approved) your CDP climate change response
Name
Job title
Corresponding job category
Nanci Tellam
Vice President, Environmental, Real Estate and Fuel Services.
Other: Vice President at Corporate Headquarters
Further Information
CDP