Embed Size (px)
Citation preview
This article was downloaded by: [University of York]On: 26 August 2013, At: 09:40Publisher: Taylor & FrancisInforma Ltd Registered in England and Wales Registered Number: 1072954 Registeredoffice: Mortimer House, 37-41 Mortimer Street, London W1T 3JH, UK
Road Materials and Pavement DesignPublication details, including instructions for authors andsubscription information:http://www.tandfonline.com/loi/trmp20
Rutting characterization of warm mixasphalt and high RAP mixturesAdriana Vargas-Nordcbeck a & David H. Timm aa 238 Harbert Engineering Center, Auburn University, Auburn, AL,36849, USAPublished online: 13 Apr 2012.
To cite this article: Adriana Vargas-Nordcbeck & David H. Timm (2012) Rutting characterization ofwarm mix asphalt and high RAP mixtures, Road Materials and Pavement Design, 13:sup1, 1-20, DOI:10.1080/14680629.2012.657042
To link to this article: http://dx.doi.org/10.1080/14680629.2012.657042
PLEASE SCROLL DOWN FOR ARTICLE
Taylor & Francis makes every effort to ensure the accuracy of all the information (the“Content”) contained in the publications on our platform. However, Taylor & Francis,our agents, and our licensors make no representations or warranties whatsoever as tothe accuracy, completeness, or suitability for any purpose of the Content. Any opinionsand views expressed in this publication are the opinions and views of the authors,and are not the views of or endorsed by Taylor & Francis. The accuracy of the Contentshould not be relied upon and should be independently verified with primary sourcesof information. Taylor and Francis shall not be liable for any losses, actions, claims,proceedings, demands, costs, expenses, damages, and other liabilities whatsoever orhowsoever caused arising directly or indirectly in connection with, in relation to or arisingout of the use of the Content.
This article may be used for research, teaching, and private study purposes. Anysubstantial or systematic reproduction, redistribution, reselling, loan, sub-licensing,systematic supply, or distribution in any form to anyone is expressly forbidden. Terms &Conditions of access and use can be found at http://www.tandfonline.com/page/terms-and-conditions

Road Materials and Pavement DesignVol. 13, No. S1, June 2012, 1–20
Rutting characterization of warm mix asphalt and high RAP mixtures
Adriana Vargas-Nordcbeck* and David H. Timm
238 Harbert Engineering Center, Auburn University, Auburn, AL 36849, USA
The objectives of this study were to perform a rutting characterization of warm mix asphalt(WMA) mixtures and mixtures containing high reclaimed asphalt pavement (RAP) and todetermine the effects of production temperature and material type on permanent deformation.This study was based on data from the National Center for Asphalt Technology (NCAT)Test Track Phase IV research cycle and included a control section, two WMA sections and twosections with 50% RAP. Field measurements indicated that high RAP mixes had higher moduliand experienced lower vertical pressures than virgin mixes. The use of WMA technologiestended to increase permanent deformation while the addition of high RAP contents resultedin less rutting. Laboratory tests on recovered binders showed increased binder stiffness forhigh RAP mixes and no significant effect for virgin WMA mixes. Mixture tests of laboratorycompacted samples did not reflect the observed field performance accurately.
Keywords: rutting; warm mix asphalt; reclaimed asphalt pavement; pavement responses
1. IntroductionRutting, or permanent deformation, is one of the main distresses that affects pavement perfor-mance. It is defined as the accumulation of small amounts of unrecoverable strain resulting fromapplied loads to the pavement (Kandhal & Cooley, 2003). This can be caused either by consolida-tion or plastic flow. In recent years, the nation’s highways have experienced an increase in ruttingsusceptibility due to higher traffic volumes, axle loads and truck tire pressures (Brown & Cross,1992).
The use of warm mix asphalt (WMA) and half-warm mix asphalt (HWMA) has also raisedconcerns of rutting potential. WMA describes a group of technologies that allow a reduction in thetemperatures at which asphalt mixes are produced and placed. These technologies originated inEurope with the German Bitumen Forum in 1997, in response to the requirements for greenhousegas reduction that were being adopted by the European Union countries as part of the Kyototreaty on climate change. While hot-mix asphalt (HMA) is typically produced in the temperaturerange of 140◦ to 170◦C (280◦ to 335◦F), WMA mixes can be produced in the range of 105◦ to135◦C (220◦ to 275◦F) from technologies that reduce mixture viscosity and improve workability.Mixtures are considered half-warm when the resulting temperature of the mix at the plant is lessthan 100◦C (212◦F). This decrease in production temperature results in environmental benefitssuch as reduced emissions and energy consumption, but it also affects binder aging directly. Ifthe temperature is reduced, the oxidative hardening of the binder will also be reduced, whichmay contribute to loss of stability in hot weather and lead to increased rutting (Newcomb, 2007).Despite this concern, previous laboratory studies and field observations indicate that WMA mixes
*Corresponding author. Email: [email protected]
ISSN 1468-0629 print/ISSN 2164-7402 online© 2012 Taylor & Francishttp://dx.doi.org/10.1080/14680629.2012.657042http://www.tandfonline.com
Dow
nloa
ded
by [
Uni
vers
ity o
f Y
ork]
at 0
9:40
26
Aug
ust 2
013
2 A. Vargas-Nordcbeck and D.H. Timm
exhibit rutting performance similar to HMA mixes (Hurley & Prowell, 2005a; Prowell, Hurley, &Crews, 1998; Larsen, Moen, Robertus, & Koenders, 2004; Xiao, Amirkhanian, & Putman, 2010).
Prowell et al. (1998) evaluated the rutting potential of WMA mixes under accelerated loading.Laboratory and field tests were conducted on WMA mixes placed as surface courses on rehabil-itated sections at the NCAT Test Track. The results indicated that the rutting potential of WMAand HMA mixes as measured by the Asphalt Pavement Analyzer (APA) compared well. Althoughthe reduced aging of the binder in the WMA sections might tend to increase rutting potential,the improved density of the samples may tend to negate this to some extent. Field measured rutdepths also indicated similar performance for WMA and HMA sections.
Hurley and Prowell (2005a, 2005b) evaluated the applicability of different processes for use inWMA mixes, including a zeolite and a synthetic wax. APA test results showed that the additionof these products did not increase the rutting potential of the asphalt mixes. Xiao et al. (2010)conducted a laboratory investigation of rutting resistance in WMA mixtures containing moistaggregates. The experimental design included two aggregate moisture contents, two lime contents,three WMA additives, and three aggregate sources. Results from the APA test indicated thatmixtures containing WMA additives had lower or similar rut depths than the control. Ruttingresistance was primarily affected by aggregate source regardless of WMA additive, lime contentand moisture content.
In Norway, field trials were conducted on two roadway sections (RV 120 and FV 82) using acontrol mixture and a mixture produced using the WAM Foam process in each of them. Mixeswere placed in 2000 and rut depths were monitored over the next three years. It was found that therutting behavior of the WMA mixes was similar to that of the control mixes (Larsen et al., 2004).
The reduced aging effect obtained with WMA can be beneficial when using high percentages ofreclaimed asphalt pavement (RAP). High RAP is defined as using 25% or more RAP in an asphaltmixture by weight of the total mix (Copeland, 2011). The maximum amount of RAP allowed inHMA varies for each state and is generally under 30% for surface courses and may increase forbinder and base courses (FHWA, 2008). The reason for many state transportation departments tolimit the maximum amount of RAP allowed in asphalt mixes has been mainly the lack of guidanceon RAP use for special mixes and documented information about long-term performance of highRAP mixes. However, as asphalt binder costs continue to increase and more emphasis is given tosustainable technologies, the highway community is reassessing the use of higher percentages ofRAP.
Design and construction of mixtures with a high RAP content can be challenging due to thepresence of aged binder that can cause problems with workability and compactability. WMAtechnologies may be beneficial with mixes containing high proportions of RAP in two ways: (1)the viscosity reduction will aid in compaction, and (2) the decreased aging of the binder as a resultof the lower production temperatures may help compensate for the aged RAP binder, similar tousing a softer binder grade (D’Angelo et al., 2007). Previous studies have shown that inclusionof WMA additives has allowed the production of workable mixtures containing 50 to 100% RAP(D’Angelo et al., 2007; Mallick, Kandhal, & Bradbury, 2008; Tao & Mallick, 2009).
D’Angelo et al. (2007) conducted a scan study where a team of US materials experts visitedfour European countries to assess and evaluate various WMA and HWMA technologies. The teamwas presented with several cases where high RAP contents had been successfully incorporatedin asphalt mixes with the aid of WMA technologies. In Germany, a case study was presentedin which 45% RAP was used in the base course. In the Netherlands, both low-energy asphaltconcrete (LEAB) and HMA are routinely produced with 50% unfractionated RAP. Trials havebeen conducted in Germany with 90 to 100% RAP using WMA additives.
Mallick et al. (2008) used a WMA additive to evaluate the feasibility of producing an asphaltmixture incorporating 75% RAP. Two HMA mixes and two WMA mixes were produced using
Dow
nloa
ded
by [
Uni
vers
ity o
f Y
ork]
at 0
9:40
26
Aug
ust 2
013
Road Materials and Pavement Design 3
varying PG grades. The results showed that it was possible to produce mixes with high RAP withsimilar air voids as virgin mixes at lower than conventional temperatures using WMA technology.Rut depths obtained from the APA test indicated that samples containing WMA additive and softbinder grades were more susceptible to permanent deformation, but all mixtures showed goodperformance with less than 4 mm of rutting.
Tao and Mallick (2009) investigated the feasibility of using 100% RAP HMA as the base coursewith the aid of WMA additives. Workability of the mixes was evaluated with a torque tester thatmeasured the torque needed to move a paddle through a mix inside a bucket at different times aftermixing (higher torque indicates lower workability of the mix and vice versa). The results showedthat workability of the 100% RAP HMA was improved with the addition of WMA additives attemperatures as low as 110◦C.
The use of WMA technology and high RAP contents results in various economic and environ-mental benefits such as lower costs, reduced waste, reduced emissions and fuel consumptionand conservation of natural resources. As state agencies become more aware of these sus-tainable technologies and begin to transition from an empirical pavement design method to amechanistic-empirical (M-E) approach, it has become necessary to further evaluate their struc-tural characteristics. This information is important for accurate performance prediction and designof efficient pavement structures because the M-E design method relies on mechanistic modelsthat calculate structural responses (stresses, strains and deflections) based on material properties,environmental conditions and loading characteristics, as well as on empirical models that predictpavement performance from the calculated responses and material properties. However, currentmodels were developed based on ‘conventional’ materials that did not include WMA and highRAP mixtures and caution must be taken when using these technologies in an M-E design method.
2. Objective and scope of workCharacterizing the fatigue and rutting behavior of asphalt concrete mixtures is a key part of theM-E design procedure. A full-scale fatigue characterization of WMA and high RAP sectionshas been performed in a previous research (Timm, Willis, & Kvasnak, 2011). An evaluation ofpavement responses for these sections based on partial datasets has also been performed in aprevious study (Vargas-Nordcbeck & Timm, 2011). The objectives of this study were to performa rutting characterization of WMA and high RAP mixes and to determine the effects of productiontemperature and material type on permanent deformation. This was accomplished by measuring rutdepths and pavement responses of five test sections placed at the NCAT Test Track. Additionally,plant-produced mixture samples were collected during construction for laboratory testing.
3. Facility and test sectionsThis study was based on data from the NCAT Test Track Phase IV research cycle. The NCAT TestTrack is a full-scale accelerated testing facility located in Opelika, Alabama, where a total of 10million equivalent single axle loads (ESALs) are applied over a two-year period. Reconstructionfor this research cycle was carried out during the summer of 2009, with paving operations per-formed from July 3 to August 11. Traffic operations started on August 28, 2009 and are currentlyongoing.
As part of the fourth research cycle, the Group Experiment (GE) was created to include structuralsections built using several sustainable technologies. A total of three WMA sections were placedincluding a foam-based section, an additive-based section and a foamed-based section containing50% RAP, respectively. Additionally, a control HMA section and a control HMA section with
Dow
nloa
ded
by [
Uni
vers
ity o
f Y
ork]
at 0
9:40
26
Aug
ust 2
013

4 A. Vargas-Nordcbeck and D.H. Timm
50% RAP were also placed. All GE sections had a design asphalt thickness of seven inches oversix inches of aggregate base and a stiff subgrade underneath. This is a notable divergence fromprevious studies of WMA rutting investigations at the Test Track where WMA mixtures wereplaced on much thicker HMA foundations (approximately 15 inches of HMA).
Table 1 shows a description of each section. All sections were paved in three lifts; all base andintermediate lifts had a nominal maximum aggregate size (NMAS) of 19 mm, while the surfacelifts had a NMAS of 9.5 mm. Paving was performed by the same contractor using the same crewin all sections. All mixtures were produced at the same plant.
Table 1. Section description
Section Number Description Abbreviation
S9 Control ControlS10 Foam-based WMA WMA-FS11 Additive-based WMA WMA-AN10 50% RAP HMA HMA-RAPN11 50% RAP WMA (foam-based) WMA-RAP
3.1. Mix designsAll mixes were designed using the Superpave method at 80 gyrations with the same virgin aggre-gates. The mixtures were designed so that all sections would have similar volumetric properties.For each lift, all virgin blend sections (control, WMA-F and WMA-A) were paved on the sameday in a continuous process, keeping the plant settings constant while varying the productiontemperature. Similarly, both high RAP sections (HMA-RAP and WMA-RAP) were placed in thesame manner. Tables 2 through 4 show the as-built aggregate gradations and Tables 5 through 7show the as-built volumetric properties (binder content (Pb), effective binder (Pbe), dust propor-tion (DP), voids in the mineral aggregate (VMA) and voids filled with asphalt (VFA)) as well asthe average measured mat density expressed as a percentage of the maximum theoretical density.All mixes were within the acceptance criteria set by the researchers and section sponsors.
Table 2. Aggregate gradation – surface lift.
Sieve Size Control WMA-F WMA-A HMA-RAP WMA-RAP
1” 100 100 100 100 1003/4” 100 100 100 100 1001/2” 100 100 100 100 993/8” 100 100 100 95 95#4 81 81 83 67 69#8 59 60 61 48 51#16 46 47 47 39 41#30 31 32 31 27 27#50 16 17 16 12 12#100 9 10 9 7 7#200 6.0 6.7 6.1 4.7 4.8
The production temperatures are presented in Table 8. The use of WMA technologies allowedfor temperature reductions of 60 to 85◦F. Greater temperature reductions were obtained fromadditive-based WMA, which is typical.
Dow
nloa
ded
by [
Uni
vers
ity o
f Y
ork]
at 0
9:40
26
Aug
ust 2
013

Road Materials and Pavement Design 5
Table 3. Aggregate gradation – intermediate lift.
Sieve Size Control WMA-F WMA-A HMA-RAP WMA-RAP
1” 99 99 98 98 993/4” 92 96 94 93 931/2” 84 89 87 86 863/8” 76 80 80 79 79#4 57 60 60 56 58#8 47 48 48 46 47#16 38 39 38 37 39#30 26 27 25 26 27#50 15 14 13 13 14#100 9 9 8 8 8#200 5.3 5.3 4.9 5.6 5.7
Table 4. Aggregate gradation – base lift.
Sieve Size Control WMA-F WMA-A HMA-RAP WMA-RAP
1” 99 99 99 99 973/4” 95 94 95 95 891/2” 87 85 87 89 833/8” 77 76 80 82 75#4 56 57 61 58 54#8 46 47 50 47 44#16 37 38 40 39 37#30 26 21 28 27 25#50 15 12 16 14 13#100 9 7 9 9 8#200 5.1 5.1 5.3 5.8 5.3
Table 5. Volumetric properties – surface lift.
Property Control WMA-F WMA-A HMA-RAP WMA-RAP
Pb, % 6.1 6.1 6.4 6.0 6.1Pbe, % 5.4 5.5 5.7 5.2 5.3DP 1.1 1.2 1.1 0.9 0.9VMA 16.5 16.0 16.7 15.8 15.5VFA 76 80 80 76 79Density, % 93.1 92.5 93.6 92.6 92.0
Table 6. Volumetric properties – intermediate lift.
Property Control WMA-F WMA-A HMA-RAP WMA-RAP
Pb, % 4.4 4.7 4.6 4.4 4.7Pbe, % 3.9 4.1 4.0 3.8 4.1DP 1.4 1.3 1.2 1.5 1.4VMA 13.5 14.3 14.5 13.6 13.6VFA 68 68 66 67 72Density, % 92.7 93.0 92.8 92.9 93.2
Dow
nloa
ded
by [
Uni
vers
ity o
f Y
ork]
at 0
9:40
26
Aug
ust 2
013

6 A. Vargas-Nordcbeck and D.H. Timm
Table 7. Volumetric properties – base lift.
Property Control WMA-F WMA-A HMA-RAP WMA-RAP
Pb, % 4.7 4.7 5.0 4.7 4.6Pbe, % 4.2 4.2 4.5 4.1 4.0DP 1.2 1.2 1.2 1.4 1.3VMA 13.9 14.0 13.7 13.8 13.7VFA 71 71 78 70 70Density, % 92.6 92.1 93.8 95.0 94.2
Table 8. Production temperatures.
Production Temperature, ◦F
Lift Control WMA-F WMA-A HMA-RAP WMA-RAP
Surface 335Intermediate 275 250 325 275Base 325
3.2. Pavement cross sectionsAs mentioned earlier, all sections had a design asphalt thickness of 7 inches placed in three liftsover six inches of aggregate base. The as-built layer thicknesses from surveyed depths duringconstruction are shown in Table 9. These thicknesses were used to adjust the measured verticalpressures to the design cross-section to account for differences due to construction variability.
Table 9. As-built pavement thicknesses.
Section Asphalt Concrete, in. Aggregate Base, in.
Control 6.8 6.2WMA-F 6.8 7.0WMA-A 6.9 6.3HMA-RAP 7.5 3.4WMA-RAP 7.1 4.6
3.3. Pavement instrumentationDuring construction, all pavement sections included in this study were embedded with a gaugearray that featured two earth pressure cells to measure vertical pressure in the center of the outsidewheelpath at the top of the granular base and at the top of the subgrade. Additionally, in eachsection, four temperature probes were bundled together and installed in the pavement to measuretemperature at the top, middle and bottom of the AC and three inches into the underlying aggregatebase layer. A detailed report on the instrumentation plan is documented elsewhere (Timm, 2009).
4. Field measurementsThis study included data collected from August 2009 to April 2011. During trafficking operations,measurements were taken approximately once a week under live traffic loads and under differentenvironmental conditions. A fleet of five triple-trailer vehicles operated 16 hours per day, five
Dow
nloa
ded
by [
Uni
vers
ity o
f Y
ork]
at 0
9:40
26
Aug
ust 2
013
Road Materials and Pavement Design 7
days a week. On each date of data collection, three passes of each truck traveling approximately45 mph were obtained along with pavement temperatures.
Additionally, falling weight deflectometer (FWD) testing was performed three times per monthto quantify the seasonal behavior of the pavement layer moduli. FWD testing was conducted atthree predetermined random locations per test section. At each random location, testing wasperformed in the inside, outside and between the wheelpaths. The pavement layer moduli wereback-calculated from deflection data using EVERCALC 5.0.
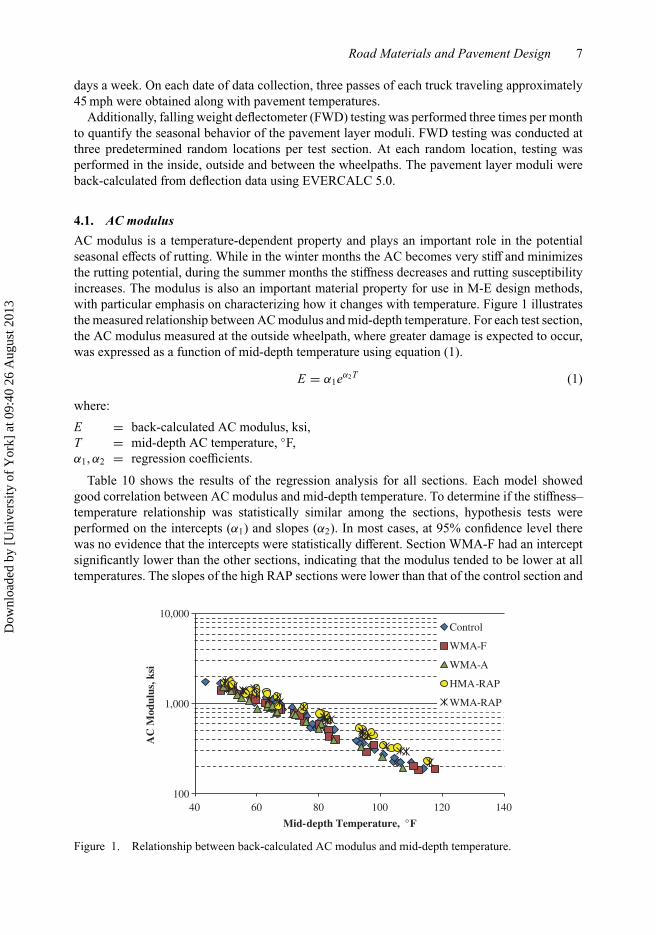
4.1. AC modulusAC modulus is a temperature-dependent property and plays an important role in the potentialseasonal effects of rutting. While in the winter months the AC becomes very stiff and minimizesthe rutting potential, during the summer months the stiffness decreases and rutting susceptibilityincreases. The modulus is also an important material property for use in M-E design methods,with particular emphasis on characterizing how it changes with temperature. Figure 1 illustratesthe measured relationship between AC modulus and mid-depth temperature. For each test section,the AC modulus measured at the outside wheelpath, where greater damage is expected to occur,was expressed as a function of mid-depth temperature using equation (1).
E = α1eα2T (1)
where:
E = back-calculated AC modulus, ksi,T = mid-depth AC temperature, ◦F,α1, α2 = regression coefficients.
Table 10 shows the results of the regression analysis for all sections. Each model showedgood correlation between AC modulus and mid-depth temperature. To determine if the stiffness–temperature relationship was statistically similar among the sections, hypothesis tests wereperformed on the intercepts (α1) and slopes (α2). In most cases, at 95% confidence level therewas no evidence that the intercepts were statistically different. Section WMA-F had an interceptsignificantly lower than the other sections, indicating that the modulus tended to be lower at alltemperatures. The slopes of the high RAP sections were lower than that of the control section and
100
1,000
10,000
40 60 80 100 120 140
AC
Mod
ulus
, ksi
Mid-depth Temperature, °F
Control
WMA-F
WMA-A
HMA-RAP
WMA-RAP
Figure 1. Relationship between back-calculated AC modulus and mid-depth temperature.
Dow
nloa
ded
by [
Uni
vers
ity o
f Y
ork]
at 0
9:40
26
Aug
ust 2
013
8 A. Vargas-Nordcbeck and D.H. Timm
Table 10. Regression analysis for AC modulus asa function of mid-depth temperature.
Section α1 α2 R2
Control 8832.3 −0.034 0.97WMA-F 7762.8 −0.033 0.97WMA-A 7970.7 −0.034 0.96HMA-RAP 8506.7 −0.030 0.97WMA-RAP 8354.6 −0.031 0.98
virgin WMA sections, which means they were less influenced by temperature presumably due tothe presence of a binder with more aging.
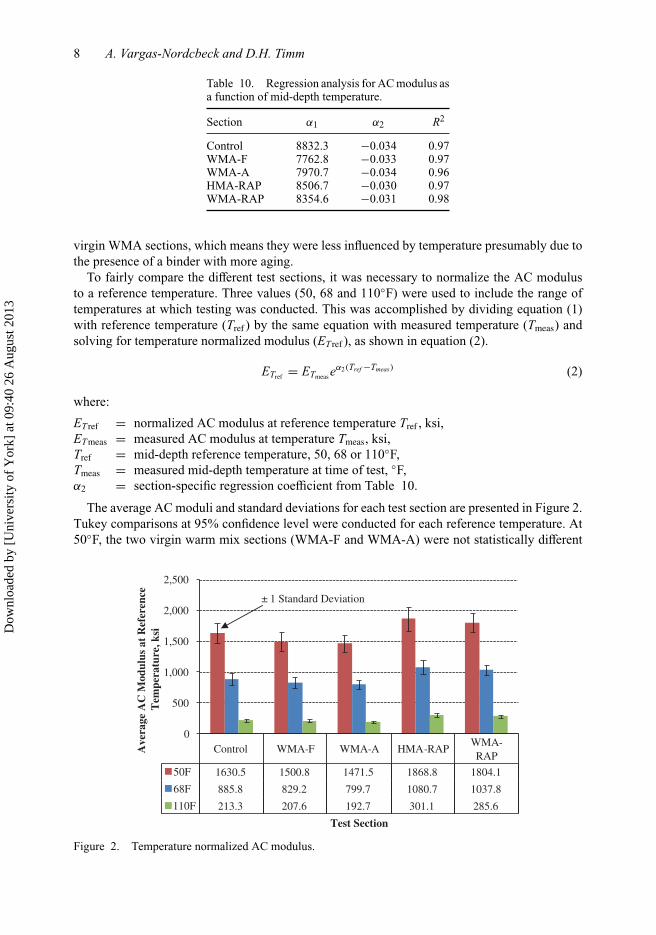
To fairly compare the different test sections, it was necessary to normalize the AC modulusto a reference temperature. Three values (50, 68 and 110◦F) were used to include the range oftemperatures at which testing was conducted. This was accomplished by dividing equation (1)with reference temperature (Tref ) by the same equation with measured temperature (Tmeas) andsolving for temperature normalized modulus (ET ref ), as shown in equation (2).
ETref = ETmeas eα2(Tref −Tmeas) (2)
where:
ET ref = normalized AC modulus at reference temperature Tref , ksi,ET meas = measured AC modulus at temperature Tmeas, ksi,Tref = mid-depth reference temperature, 50, 68 or 110◦F,Tmeas = measured mid-depth temperature at time of test, ◦F,α2 = section-specific regression coefficient from Table 10.
The average AC moduli and standard deviations for each test section are presented in Figure 2.Tukey comparisons at 95% confidence level were conducted for each reference temperature. At50◦F, the two virgin warm mix sections (WMA-F and WMA-A) were not statistically different
Control WMA-F WMA-A HMA-RAPWMA-RAP
50F 1630.5 1500.8 1471.5 1868.8 1804.1
68F 885.8 829.2 799.7 1080.7 1037.8
110F 213.3 207.6 192.7 301.1 285.6
0
500
1,000
1,500
2,000
2,500
Ave
rage
AC
Mod
ulus
at
Ref
eren
ce
Tem
pera
ture
, ksi
Test Section
± 1 Standard Deviation
Figure 2. Temperature normalized AC modulus.
Dow
nloa
ded
by [
Uni
vers
ity o
f Y
ork]
at 0
9:40
26
Aug
ust 2
013

Road Materials and Pavement Design 9
from each other, but all other sections were different among themselves. At 68 and 110◦F, thedifferences among all sections were statistically significant; however, it should be noted that themagnitudes of the differences among virgin sections were not large, especially at high tempera-tures. The statistical significance can be attributed to the low coefficients of variation observedin the sections (under 11%) that caused relatively small differences in the data to be consideredmeaningful. From a practical perspective, the moduli of the control and virgin WMA sectionsmay be considered similar at intermediate and high pavement temperatures. The same assumptioncan be made when comparing the two high RAP sections.
4.2. Vertical pressuresPermanent deformation can be related to the vertical pavement responses generated under movingwheel loads. Although traditional M-E transfer functions use vertical strain (Applied ResearchAssociates, 2004), this response was not directly measured. Instead, vertical pressure measuringdevices were used because of their robust nature and proven performance at the Test Track (Timm,2009; Willis et al., 2009). Pressures were measured at the top of the granular base and at the top ofthe subgrade for all sections and data were subdivided by axle type (i.e., steer, single and tandem).Only the single axle data are presented in this study because they represent the majority of axlepasses on each section. Additionally, the values shown correspond to the ‘best hit’ on each sectionfor each test date, which was defined as the 95th percentile of the readings obtained on a giventest date.
As with AC modulus, vertical pressures are dependent on mid-depth pavement temperature, asshown in Figures 3 and 4. The relationship between the variables was modeled by:
σ = k1ek2T (3)
where:σ = vertical base or subgrade pressure, psi,T = Mid-depth AC temperature, ◦F,k1, k2 = Section-specific regression coefficients.
0
5
10
15
20
25
30
35
20 40 60 80 100 120 140
Ver
tica
l Bas
e P
ress
ure,
psi
Temperature, °F
Control
WMA-F
WMA-A
HMA-RAP
WMA-RAP
Figure 3. Relationship between base pressure and temperature.
Dow
nloa
ded
by [
Uni
vers
ity o
f Y
ork]
at 0
9:40
26
Aug
ust 2
013

10 A. Vargas-Nordcbeck and D.H. Timm
0
5
10
15
20
25
20 40 60 80 100 120 140
Ver
tica
l Sub
grad
ePre
ssur
e, p
si
Mid-Depth Temperature, °F
Control
WMA-F
WMA-A
HMA-RAP
WMA-RAP
Figure 4. Relationship between subgrade pressure and temperature.
The results from the regression analysis are shown in Table 11. Most sections exhibited verygood correlation, with R2 values exceeding 0.90. The HMA-RAP section had a relatively lowerR2 value, due to higher variability in the data.
Table 11. Regression analysis for base and subgrade pressure as afunction of mid-depth temperature.
Base Subgrade
Section k1 k2 R2 k1 k2 R2
Control 1.565 0.025 0.96 1.922 0.020 0.96WMA-F 0.701 0.029 0.97 1.814 0.020 0.98WMA-A 1.433 0.026 0.96 1.716 0.020 0.97HMA-RAP 1.186 0.022 0.76 1.802 0.015 0.74WMA-RAP 1.524 0.022 0.96 1.903 0.019 0.93
Hypothesis tests were performed on the intercepts (k1) and slopes (k2) to identify differences inthe stress–temperature relationship of the mixes. For base pressures, all sections except WMA-Fhad intercepts and slopes statistically similar to the control at 95% confidence level (α = 0.05).Section WMA-F had statistically lower intercept and higher slope than the control, meaning thatits vertical base pressures were lower at all temperatures. For subgrade pressures, all sections hadstatistically similar intercepts and only the HMA-RAP section had a lower slope than the control,making it less susceptible to temperature changes, which was expected because the same trendwas observed in the AC moduli results.
The vertical pressures were normalized to three reference temperatures following the sameprocedure used for AC modulus normalization. Additionally, because pressures are also dependenton the thickness of the pavement layers, it was necessary to apply a correction to account for slightdifferences in as-built pavement thickness.
The correction factors were obtained based on theoretical relationships between layer thicknessand vertical pressure from layer elastic analysis. Each section was modeled using the softwareWESLEA; the layer moduli were estimated from FWD testing and the thicknesses were variedin half-inch increments from 5.5 to 8 inches for the AC layer and from 3 to 7.5 inches for theaggregate base layer. The vertical pressures were plotted against AC and aggregate base thickness
Dow
nloa
ded
by [
Uni
vers
ity o
f Y
ork]
at 0
9:40
26
Aug
ust 2
013

Road Materials and Pavement Design 11
and the data series were fitted using a power function as shown in equation (4).
σ = aH b (4)
where:
σ = vertical base or subgrade pressure, psi,H = AC or aggregate base thickness, in,a, b = regression coefficients.
The correction factor was found by dividing the right-hand side of equation (4) with referencethickness (Href ) by the same term with measured thickness (Hmeas).
CF = H bref
H bmeas
(5)
where:
Href = reference thickness (7 in for AC, 6 in for aggregate base),Hmeas = as-built thickness measured at the center of the gauge array, in,b = section-specific regression coefficient.
Although differences during construction were subtle, this correction allowed for a morefair comparison of the test sections. Figures 5 and 6 illustrate the temperature-normalized andthickness-corrected pressures on top of the aggregate base and subgrade, respectively. The resultsfrom the statistical comparisons indicated that, in general, the differences among sections weresignificant. For base pressure, the control section and WMA-A were similar at intermediate andhigh temperatures. It was observed that the base pressures for section WMA-F were very lowand even were below the subgrade pressures for that section. Normally, pressures at the asphaltconcrete/aggregate base interface exceed those at the aggregate base/subgrade interface. Thissuggests that there may have been a problem with the instrumentation in that particular sectionand its base pressures was disregarded for the remainder of the analysis.
The subgrade pressures were also statistically different for most sections. However, at low andintermediate temperatures the control section and WMA-F were similar. Sections WMA-A andWMA-RAP were also similar. This suggests that using WMA may not have a significant effecton virgin mixes but can increase the subgrade pressures of high RAP mixes to a level similar
0
5
10
15
20
25
30
Control WMA-F WMA-A HMA-RAP WMA-RAP
Ave
rage
Ver
tica
l Bas
e P
ress
ure,
psi
Test Section
50F 68F 110F± 1 Standard Deviation
Figure 5. Vertical base pressures.
Dow
nloa
ded
by [
Uni
vers
ity o
f Y
ork]
at 0
9:40
26
Aug
ust 2
013

12 A. Vargas-Nordcbeck and D.H. Timm
0
5
10
15
20
25
30
Control WMA-F WMA-A HMA-RAP WMA-RAP
Ave
rage
Ver
tica
l Sub
grad
e P
ress
ure,
ps
i
Test Section
50F 68F 110F
± 1 Standard Deviation
Figure 6. Vertical subgrade pressures.
to a virgin mix. As expected, the HMA high RAP section, which had the highest AC modulus,consistently exhibited the lower pressures.
4.3. Field measured rut depthsField rut depths were measured approximately once a month on each of the sections using theAlabama Department of Transportation (ALDOT) method. This method uses a 4-ft long levelwith a dial gauge. Readings were taken in each wheel path along three predetermined randomlocations within each section and the averages were computed.
Sections were also manually inspected for cracking on a weekly basis. Cracking reduces thestiffness of the AC surface, and water can infiltrate and lower the strengths of the unbound granularlayers and subgrade, leading to accelerated rutting (Haddock, Hand, & Fang, 2002). None of thesections exhibited any cracking during the period studied.
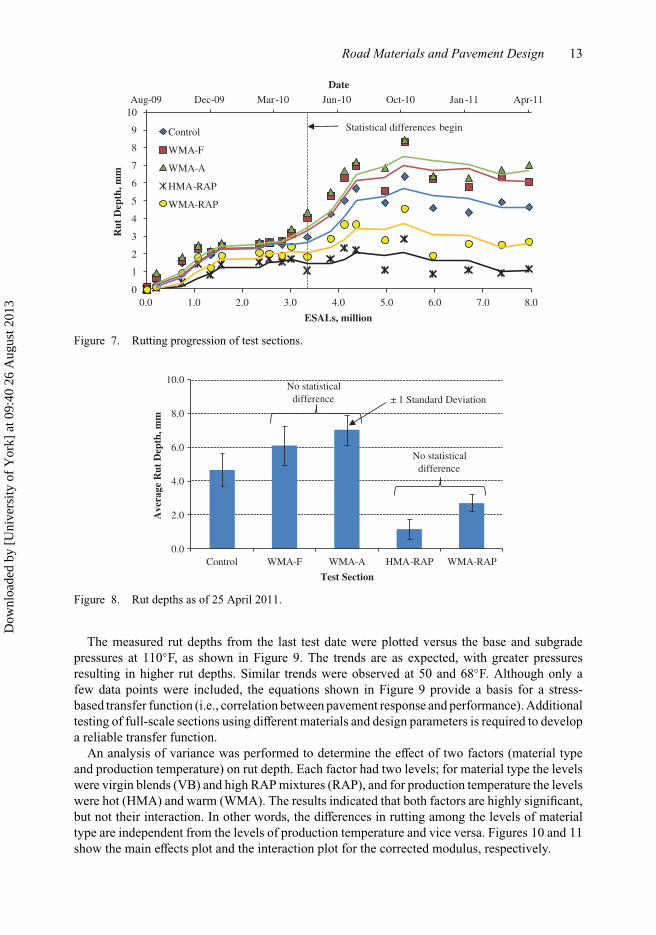
Average rutting measurements taken from August 2009 to April 2011 are shown in Figure 7.The smooth lines represent 3-date moving averages. It can be observed that early rutting accu-mulated rapidly and was similar for all sections. As more ESALs were applied, the differencesin performance become more accentuated. A Tukey’s post-ANOVA test was conducted for eachtest date to determine if there were statistical differences among the sections. It was found thatthe differences among sections did not become significant until approximately 3.3 million ESALshad been applied, in May 2010. Rut depths kept increasing during the summer, when pavementtemperatures were high and became nearly constant after August 2010.
The measurements corresponding to the last test date in Figure 7 are represented in Figure 8.Tukey comparisons at 95% confidence level indicated that there was no statistical differencebetween the virgin WMA sections (WMA-F and WMA-A) and that these sections had higher rutdepths than the control. Conversely, the two high RAP sections (HMA-RAP and WMA-RAP) didnot exhibit significant differences and had the least rutting. Overall, the results were as expectedbecause the WMA-F section exhibited higher pressures than the control while the high RAPmixes had lower pressures. Although section WMA-A had lower pressures than the control, ithad relatively higher permanent deformation. This could be due to accumulated damage in theAC layer that has not yet manifested as cracking. Further monitoring and forensic analysis will berequired to determine the cause. However, it is important to note that all sections have performedvery well, with rut depths under 10 mm.
Dow
nloa
ded
by [
Uni
vers
ity o
f Y
ork]
at 0
9:40
26
Aug
ust 2
013
Road Materials and Pavement Design 13
Aug-09 Dec-09 Mar-10 Jun-10 Oct-10 Jan -11 Apr-11
0
1
2
3
4
5
6
7
8
9
10
0.0 1.0 2.0 3.0 4.0 5.0 6.0 7.0 8.0
Date
Rut
Dep
th, m
m
ESALs, million
Control
WMA-F
WMA-A
HMA-RAP
WMA-RAP
Statistical differences begin
Figure 7. Rutting progression of test sections.
0.0
2.0
4.0
6.0
8.0
10.0
Control WMA-F WMA-A HMA-RAP WMA-RAP
Ave
rage
Rut
Dep
th, m
m
Test Section
No statistical difference
± 1 Standard DeviationNo statistical
difference
Figure 8. Rut depths as of 25 April 2011.
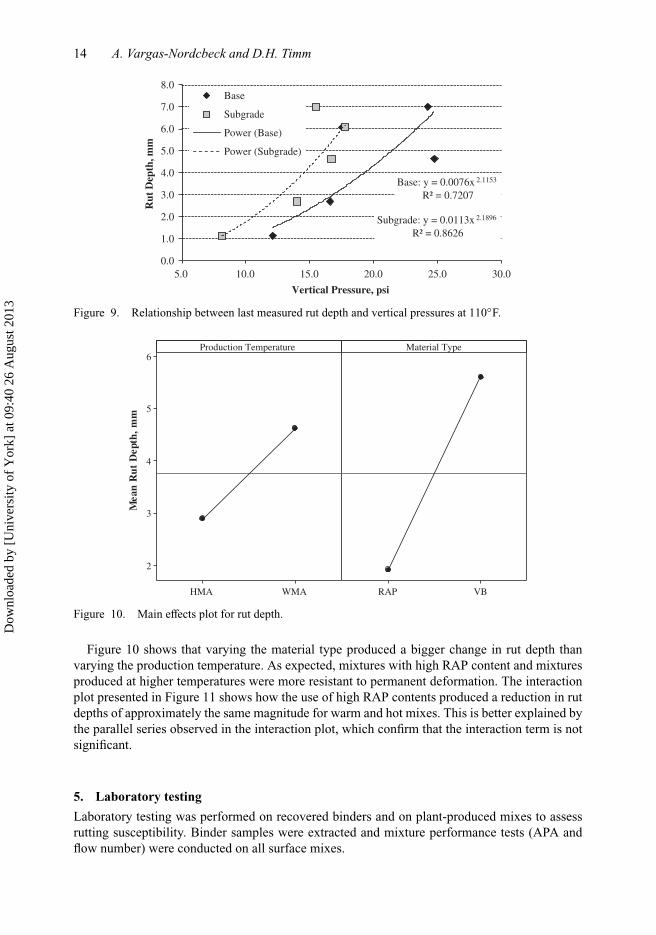
The measured rut depths from the last test date were plotted versus the base and subgradepressures at 110◦F, as shown in Figure 9. The trends are as expected, with greater pressuresresulting in higher rut depths. Similar trends were observed at 50 and 68◦F. Although only afew data points were included, the equations shown in Figure 9 provide a basis for a stress-based transfer function (i.e., correlation between pavement response and performance). Additionaltesting of full-scale sections using different materials and design parameters is required to developa reliable transfer function.
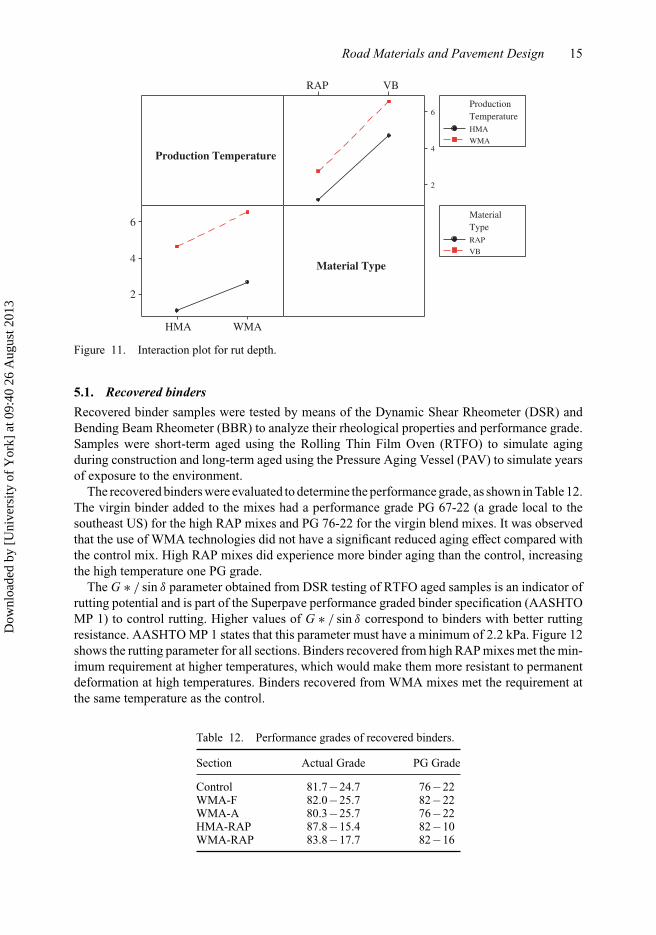
An analysis of variance was performed to determine the effect of two factors (material typeand production temperature) on rut depth. Each factor had two levels; for material type the levelswere virgin blends (VB) and high RAP mixtures (RAP), and for production temperature the levelswere hot (HMA) and warm (WMA). The results indicated that both factors are highly significant,but not their interaction. In other words, the differences in rutting among the levels of materialtype are independent from the levels of production temperature and vice versa. Figures 10 and 11show the main effects plot and the interaction plot for the corrected modulus, respectively.
Dow
nloa
ded
by [
Uni
vers
ity o
f Y
ork]
at 0
9:40
26
Aug
ust 2
013
14 A. Vargas-Nordcbeck and D.H. Timm
Base: y = 0.0076x 2.1153
R² = 0.7207
Subgrade: y = 0.0113x 2.1896
R² = 0.8626
0.0
1.0
2.0
3.0
4.0
5.0
6.0
7.0
8.0
5.0 10.0 15.0 20.0 25.0 30.0
Rut
Dep
th, m
m
Vertical Pressure, psi
Base
Subgrade
Power (Base)
Power (Subgrade)
Figure 9. Relationship between last measured rut depth and vertical pressures at 110◦F.
WMAHMA
6
5
4
3
2
VBRAP
Production Temperature
Mea
nR
utD
epth
,mm
Material Type
Figure 10. Main effects plot for rut depth.
Figure 10 shows that varying the material type produced a bigger change in rut depth thanvarying the production temperature. As expected, mixtures with high RAP content and mixturesproduced at higher temperatures were more resistant to permanent deformation. The interactionplot presented in Figure 11 shows how the use of high RAP contents produced a reduction in rutdepths of approximately the same magnitude for warm and hot mixes. This is better explained bythe parallel series observed in the interaction plot, which confirm that the interaction term is notsignificant.
5. Laboratory testingLaboratory testing was performed on recovered binders and on plant-produced mixes to assessrutting susceptibility. Binder samples were extracted and mixture performance tests (APA andflow number) were conducted on all surface mixes.
Dow
nloa
ded
by [
Uni
vers
ity o
f Y
ork]
at 0
9:40
26
Aug
ust 2
013
Road Materials and Pavement Design 15
VBRAP
6
4
2
WMAHMA
6
4
2
Production Temperature
Material Type
HMA
WMA
TemperatureProduction
RAP
VB
TypeMaterial
Figure 11. Interaction plot for rut depth.
5.1. Recovered bindersRecovered binder samples were tested by means of the Dynamic Shear Rheometer (DSR) andBending Beam Rheometer (BBR) to analyze their rheological properties and performance grade.Samples were short-term aged using the Rolling Thin Film Oven (RTFO) to simulate agingduring construction and long-term aged using the Pressure Aging Vessel (PAV) to simulate yearsof exposure to the environment.
The recovered binders were evaluated to determine the performance grade, as shown in Table 12.The virgin binder added to the mixes had a performance grade PG 67-22 (a grade local to thesoutheast US) for the high RAP mixes and PG 76-22 for the virgin blend mixes. It was observedthat the use of WMA technologies did not have a significant reduced aging effect compared withthe control mix. High RAP mixes did experience more binder aging than the control, increasingthe high temperature one PG grade.
The G ∗ / sin δ parameter obtained from DSR testing of RTFO aged samples is an indicator ofrutting potential and is part of the Superpave performance graded binder specification (AASHTOMP 1) to control rutting. Higher values of G ∗ / sin δ correspond to binders with better ruttingresistance. AASHTO MP 1 states that this parameter must have a minimum of 2.2 kPa. Figure 12shows the rutting parameter for all sections. Binders recovered from high RAP mixes met the min-imum requirement at higher temperatures, which would make them more resistant to permanentdeformation at high temperatures. Binders recovered from WMA mixes met the requirement atthe same temperature as the control.
Table 12. Performance grades of recovered binders.
Section Actual Grade PG Grade
Control 81.7 – 24.7 76 – 22WMA-F 82.0 – 25.7 82 – 22WMA-A 80.3 – 25.7 76 – 22HMA-RAP 87.8 – 15.4 82 – 10WMA-RAP 83.8 – 17.7 82 – 16
Dow
nloa
ded
by [
Uni
vers
ity o
f Y
ork]
at 0
9:40
26
Aug
ust 2
013

16 A. Vargas-Nordcbeck and D.H. Timm
Min. Required
0.0
1.0
2.0
3.0
4.0
5.0
70 76 82 88 94
G*/
sinδ
, kP
a
Temperature, °C
Control WMA-F WMA-A HMA-RAP WMA-RAP
Figure 12. Rutting parameter of recovered binders.
Figure 13 plots the rutting parameter (G ∗ / sin δ) at 82◦C versus the field measured rut depthson the last date of testing. It was observed that, as expected, binder stiffness was highly correlatedto rutting potential. These results confirm the expected trend of mixes with stiffer binders havingbetter rutting resistance.
HMA-RAP
WMA-RAP
Control
WMA-F
WMA-A
y = 28.528x -2.228
R² = 0.9665
0.0
1.0
2.0
3.0
4.0
5.0
6.0
7.0
8.0
0.0 1.0 2.0 3.0 4.0 5.0
Rut
Dep
th, m
m
G*/ sinδ , kPa
Figure 13. Effect of binder stiffness on rutting potential.
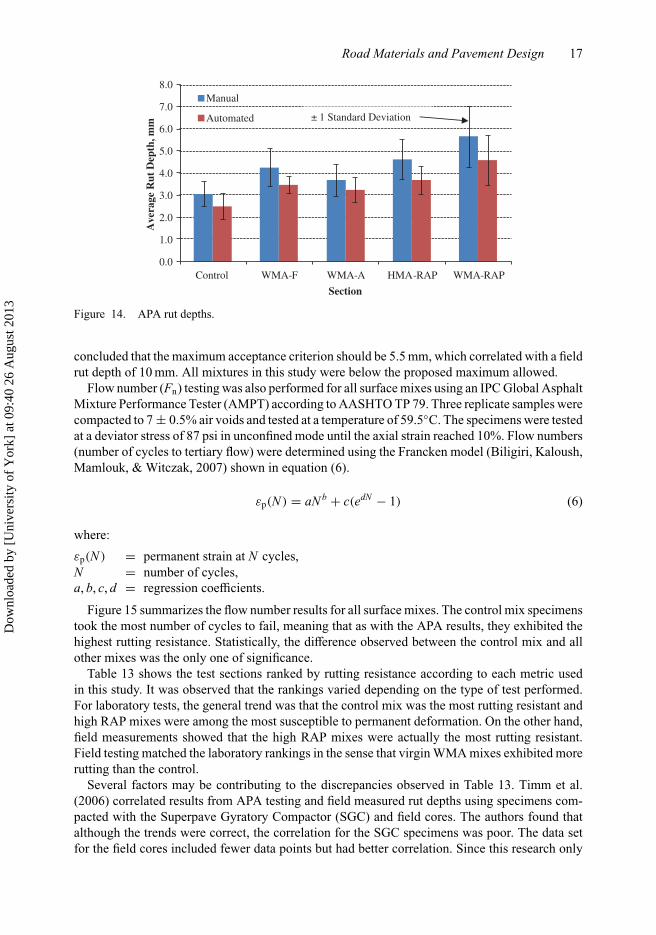
5.2. Asphalt mixturesMixes were tested according to AASHTO TP 63 using the Asphalt Pavement Analyzer (APA).Six replicates were tested for each surface mix. Specimens were compacted to 7 ± 0.5% air voidsand tested at a temperature of 64◦C using a vertical load of 100 lb and hose pressure of 100 psi for8,000 cycles. Figure 14 shows the averages for manually and automatically measured rut depthsfor all surface mixes. The only statistical differences observed were between the WMA-RAPmix and the control and WMA-A mixes. Willis et al. (2009) evaluated correlations between theAPA test and field rutting performance for mixes placed at the NCAT Test Track. The authors
Dow
nloa
ded
by [
Uni
vers
ity o
f Y
ork]
at 0
9:40
26
Aug
ust 2
013
Road Materials and Pavement Design 17
0.0
1.0
2.0
3.0
4.0
5.0
6.0
7.0
8.0
Control WMA-F WMA-A HMA-RAP WMA-RAP
Ave
rage
Rut
Dep
th, m
m
Section
Manual
Automated ± 1 Standard Deviation
Figure 14. APA rut depths.
concluded that the maximum acceptance criterion should be 5.5 mm, which correlated with a fieldrut depth of 10 mm. All mixtures in this study were below the proposed maximum allowed.
Flow number (Fn) testing was also performed for all surface mixes using an IPC Global AsphaltMixture Performance Tester (AMPT) according to AASHTO TP 79. Three replicate samples werecompacted to 7 ± 0.5% air voids and tested at a temperature of 59.5◦C. The specimens were testedat a deviator stress of 87 psi in unconfined mode until the axial strain reached 10%. Flow numbers(number of cycles to tertiary flow) were determined using the Francken model (Biligiri, Kaloush,Mamlouk, & Witczak, 2007) shown in equation (6).
εp(N ) = aN b + c(edN − 1) (6)
where:
εp(N ) = permanent strain at N cycles,N = number of cycles,a, b, c, d = regression coefficients.
Figure 15 summarizes the flow number results for all surface mixes. The control mix specimenstook the most number of cycles to fail, meaning that as with the APA results, they exhibited thehighest rutting resistance. Statistically, the difference observed between the control mix and allother mixes was the only one of significance.
Table 13 shows the test sections ranked by rutting resistance according to each metric usedin this study. It was observed that the rankings varied depending on the type of test performed.For laboratory tests, the general trend was that the control mix was the most rutting resistant andhigh RAP mixes were among the most susceptible to permanent deformation. On the other hand,field measurements showed that the high RAP mixes were actually the most rutting resistant.Field testing matched the laboratory rankings in the sense that virgin WMA mixes exhibited morerutting than the control.
Several factors may be contributing to the discrepancies observed in Table 13. Timm et al.(2006) correlated results from APA testing and field measured rut depths using specimens com-pacted with the Superpave Gyratory Compactor (SGC) and field cores. The authors found thatalthough the trends were correct, the correlation for the SGC specimens was poor. The data setfor the field cores included fewer data points but had better correlation. Since this research only
Dow
nloa
ded
by [
Uni
vers
ity o
f Y
ork]
at 0
9:40
26
Aug
ust 2
013

18 A. Vargas-Nordcbeck and D.H. Timm
0
20
40
60
80
100
120
140
160
180
200
Control WMA-F WMA-A HMA-RAP WMA-RAP
Ave
rage
Flo
w N
umbe
r, c
ycel
s
Test Section
± 1 Standard Deviation
Figure 15. Flow number results.
Table 13. Rutting resistance ranked by test method.
Rank
Section APA Fn Field
Control 1 1 3WMA-F 3 3 4WMA-A 2 5 5HMA-RAP 4 2 1WMA-RAP 5 4 2
contains data from five sections, it is expected that the effect of SGC samples would produceinconsistencies.
One reason for the higher rut depths exhibited by high RAP mixes in laboratory tests comparedto virgin mixes may be the effect of RAP on the percentage of binder absorbed (Pbe). If thePbe decreases, the mixture has less binder available for binding aggregates together, resulting inhigher rutting susceptibility (Apeagyei, Diefenderfer, & Diefenderfer, 2011, Daniel & Lachance,2005). Although the tests in this study were performed on the same plant-produced mixes placedin the test sections, they were only conducted on surface mixes, which had the lowest Pbe amongsections.
The combination of these factors could be affecting the relationship between laboratory andfield performance tests. Further testing on mixes from all AC layers and field cores may helpimprove the correlation between the two. However, these results indicate that lab results shouldbe viewed with caution as they may not always be a good indicator of field performance.
6. Summary of key findingsThis study provided an analysis of the load responses and physical properties of warm and highRAP mixes and their impact on rutting performance. The following key findings were obtained.
• The AC modulus-temperature relationship was not affected by the use of WMA technologiesin virgin mixes. The modulus of high RAP mixes was less sensitive to changes in pavementtemperature.
Dow
nloa
ded
by [
Uni
vers
ity o
f Y
ork]
at 0
9:40
26
Aug
ust 2
013

Road Materials and Pavement Design 19
• Virgin WMA sections had lower AC moduli than the control and high RAP mixes exhibitedthe highest AC moduli overall.
• The changes in vertical pressure with temperature were smaller for high RAP mixes. VirginWMA sections were comparable to the control.
• Sections with higher vertical pressures (virgin WMA mixes) had higher field measured rutdepths. However, all sections performed very well after nearly 8 million ESALs with rutdepths under 10 mm.
• Factors such as production temperature and material type significantly affected ruttingsusceptibility in the field. The use of WMA technologies tended to increase permanentdeformation while the addition of high RAP contents resulted in less rutting. The effectobtained was more significant for variation of material type than for production temperature.
• Use of WMA technologies did not provide a reduced aging effect on mixture binders.Addition of high RAP contents did increase the binder stiffness and resulted in changes inthe high temperature grade of the asphalt binder.
• The laboratory tests conducted on asphalt mixtures did not reflect the observed field per-formance accurately. Field rutting was better correlated to the results from binder testing.However, this experiment was designed so that pavement sections would have mixtureswith similar virgin aggregates, gradations and volumetric properties. Variations in thesefactors may also affect rutting susceptibility without being identified in binder tests.
AcknowledgementsThe authors wish to thank the following state departments of transportation for their continued cooperationand support of this research: Alabama, Florida, North Carolina, Oklahoma and Tennessee. The FederalHighway Administration also deserves special recognition for their support and cooperation.
ReferencesApeagyei, A., Diefenderfer, B., & Diefenderfer, S. (2011). Rutting resistance of asphalt concrete mixtures
containing recycled asphalt pavement. Paper No. 11-1840 Presented at the 90th Transportation ResearchBoard Annual Meeting, Washington, DC.
Applied Research Associates (2004). Guide for mechanistic–empirical design of new and rehabilitatedpavement structures. NCHRP, Transportation Research Board of the National Academies, Washington,DC.
Biligiri, K.P., Kaloush, K.E., Mamlouk, M.S., & Witczak, M.W. (2007). Rational modeling of tertiary flowfor asphalt mixtures. Journal of the Transportation Research Board, No. 2001, National Academies,Washington, DC, 63–72.
Brown, E.R., & Cross, S.A. (1992). A national study of rutting in hot mix asphalt (HMA) pavements. NCATReport 92-05, National Center for Asphalt Technology, Auburn University.
Copeland, A. (2011). Reclaimed asphalt pavement in asphalt mixtures: state of the practice. Report No.FHWA-HRT-11-021, Federal Highway Administration, McLean, Virginia.
D’Angelo, J., Harm, E., Bartoszek, J., Baumgardner, G., Corrigan, M., Cowsert, J., Harman, T., Jamshidi,M., Jones, W., Newcomb, D., Prowell, B., Sines, R., & Yeaton, B. (2007). Warm-mix asphalt: Europeanpractice. International Technology Scanning Program, Federal Highway Administration, December.
Daniel, J.S., & Lachance, A. (2005). Mechanistic and volumetric properties of asphalt mixtures with recycledasphalt pavement. Journal of the Transportation Research Board, No. 1929, National Academies,Washington, DC, 28–36.
FHWA (2008). User guidelines for by-product and secondary use materials in pavement construction. FHWAPublication FHWA-RD-97-148, Federal Highway Administration, Washington DC.
Haddock, J.E, Hand, A.J., & Fang, H. (2002). Contributions of pavement structural layers to rutting of hotmix asphalt pavements. NCHRP Report 468, National Academy Press, Washington, DC.
Hurley, G.C., & Prowell, B.D. (2005a). Evaluation of Aspha-Min zeolite for use in warm mix asphalt. NCATReport 05-04, National Center for Asphalt Technology, Auburn University.
Dow
nloa
ded
by [
Uni
vers
ity o
f Y
ork]
at 0
9:40
26
Aug
ust 2
013
20 A. Vargas-Nordcbeck and D.H. Timm
Hurley, G.C., & Prowell, B.D. (2005b). Evaluation of Sasobit for use in warm mix asphalt. NCAT Report05-06, National Center for Asphalt Technology, Auburn University.
Kandhal, P.S., & Cooley, L.A. (2003). Accelerated laboratory rutting tests: Evaluation of the asphaltpavement analyzer. NCHRP Report 508, National Academy Press, Washington, DC.
Larsen, O.R., Moen, O., Robertus, C., & Koenders, B.G. (2004). WAM foam asphalt production at loweroperating temperatures as an environmental friendly alternative to HMA. Proceedings, 3rd Eurasphalt& Eurobitume Congress, Vienna, Austria.
Mallick, R.B., Kandhal, P.S., & Bradbury, R.L. (2008). Using warm-mix asphalt technology to incor-porate high percentage of reclaimed asphalt pavement material in asphalt mixtures. Journal of theTransportation Research Board, No. 2051, National Academies, Washington, DC, 71–79.
Newcomb, D. (2007). An introduction to warm mix asphalt. National Asphalt Pavement Association.Prowell, B.D., Hurley, G.C., & Crews, E. (2007). Field performance of warm-mix asphalt at National Center
for Asphalt Technology test track. Journal of the Transportation Research Board, No. 1998, NationalAcademies, Washington, DC, 96–102.
Tao, M.,& Mallick, R.B. (2009). An evaluation of the effects of warm mix asphalt additives on workability andmechanical properties of Reclaimed Asphalt Pavement (RAP) material. Paper No. 09-3503 Presentedat the 88th Transportation Research Board Annual Meeting, Washington, DC.
Timm, D.H. (2009). Design, construction and instrumentation of the 2006 test track structural study. NCATReport 09-01, National Center for Asphalt Technology, Auburn University.
Timm, D., West, R., Priest, A., Powell, B., Selvaraj, I., Zhang, J., & Brown, R. (2006). Phase II NCAT testtrack results. NCAT Report 06-05, National Center for Asphalt Technology, Auburn University.
Timm, D.H., Willis, J.R., & Kvasnak, A. (2011). Full-scale structural evaluation of fatigue characteristics inhigh reclaimed asphalt pavement and warm-mix asphalt. Journal of the Transportation Research Board,No. 2208, National Academies, Washington, DC, 56–63.
Vargas-Nordcbeck, A., & Timm, D.H. (2011). Evaluation of pavement reponses of warm mix asphalt sectionsat the NCAT test track. Proceedings, 2nd International Conference on Warm Mix Asphalt, St. Louis,Missouri.
Willis, R., Timm, D., West, R., Powell, B., Robbins, M., Taylor, A., Smit, A., Tran, N., Heitzman, M., &Bianchini, A. (2009). Phase III NCAT test track findings. NCAT Report 09-08, National Center forAsphalt Technology, Auburn University.
Xiao, F., Amirkhanian, F.S., & Putman, B.J. (2010). Evaluation of rutting resistance in warm-mix asphaltscontaining moist aggregates. Journal of the Transportation Research Board, No. 2180, NationalAcademies, Washington, DC, 75–84.
Dow
nloa
ded
by [
Uni
vers
ity o
f Y
ork]
at 0
9:40
26
Aug
ust 2
013