Embed Size (px)
Citation preview
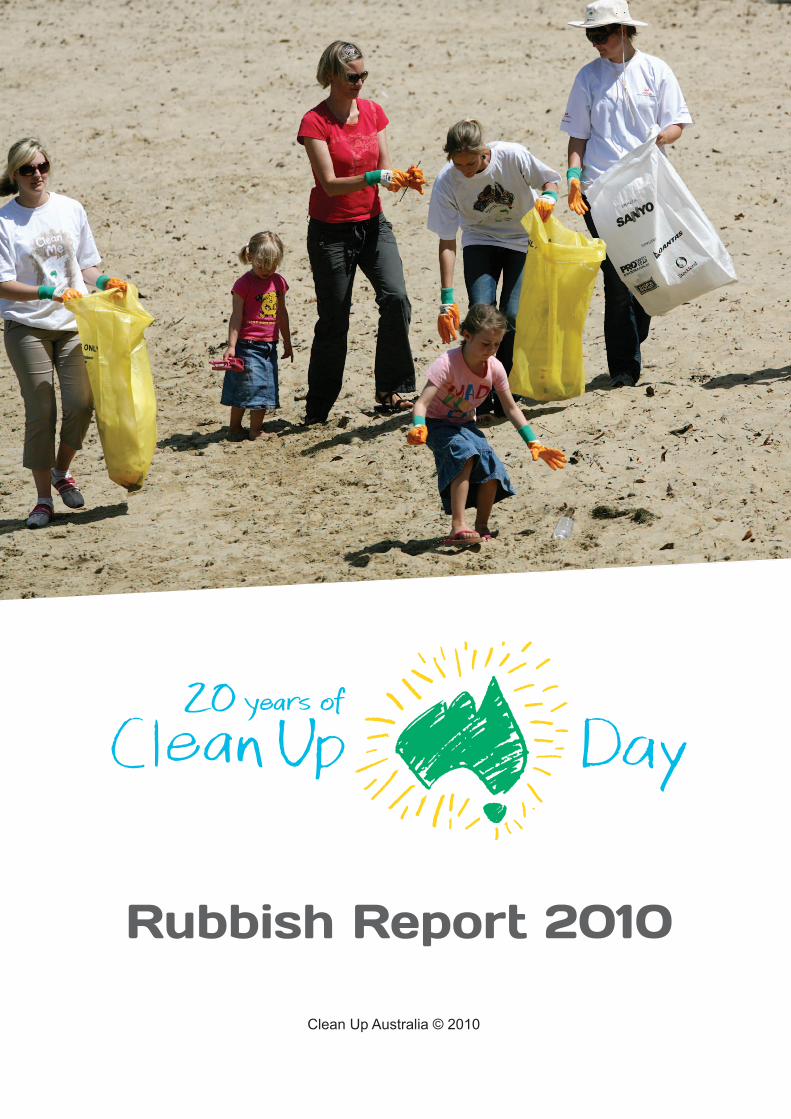
Rubbish Report 2010
Clean Up Australia © 2010
Clean Up Australia Day - Rubbish Report 2010Page
ContentsIntroduction
Executive Summary
Methodology
Returned Surveys by State
Returned Surveys by Site Type
The Top Ten Rubbish Items
Major Sources of Rubbish
Historical Comparison
Major Sources of Rubbish – Analysis of Each Category
- Plastic- Miscellaneous- Metal & Aluminium- Glass- Paper & Cardboard- Expanded Polystyrene- Wood- Rubber
Site Rubbish CompositionThe Great Northern Clean Up20 Years Of Clean Up Australia Day
With thanks to our Sponsors and Supporters:
Major Sponsors
Sponsor
Suppliers
2
3
4
6
7
7
8
8
10
1313141415151616171819
Clean Up Australia Day - Rubbish Report 2010 Page
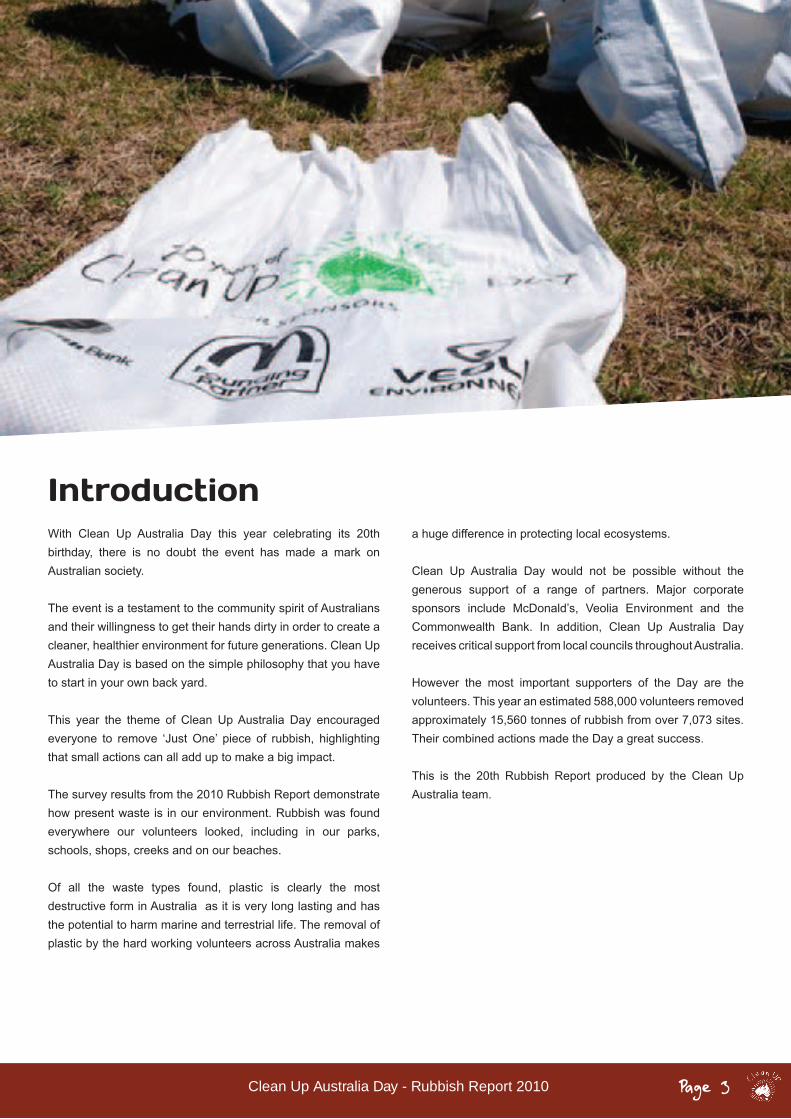
IntroductionWith Clean Up Australia Day this year celebrating its 20th birthday, there is no doubt the event has made a mark on Australian society.
The event is a testament to the community spirit of Australians and their willingness to get their hands dirty in order to create a cleaner, healthier environment for future generations. Clean Up Australia Day is based on the simple philosophy that you have to start in your own back yard.
This year the theme of Clean Up Australia Day encouraged everyone to remove ‘Just One’ piece of rubbish, highlighting that small actions can all add up to make a big impact.
The survey results from the 2010 Rubbish Report demonstrate how present waste is in our environment. Rubbish was found everywhere our volunteers looked, including in our parks, schools, shops, creeks and on our beaches.
Of all the waste types found, plastic is clearly the most destructive form in Australia as it is very long lasting and has the potential to harm marine and terrestrial life. The removal of plastic by the hard working volunteers across Australia makes
a huge difference in protecting local ecosystems.
Clean Up Australia Day would not be possible without the generous support of a range of partners. Major corporate sponsors include McDonald’s, Veolia Environment and the Commonwealth Bank. In addition, Clean Up Australia Day receives critical support from local councils throughout Australia.
However the most important supporters of the Day are the volunteers. This year an estimated 588,000 volunteers removed approximately 15,560 tonnes of rubbish from over 7,073 sites. Their combined actions made the Day a great success.
This is the 20th Rubbish Report produced by the Clean Up Australia team.
3
Clean Up Australia Day - Rubbish Report 2010Page
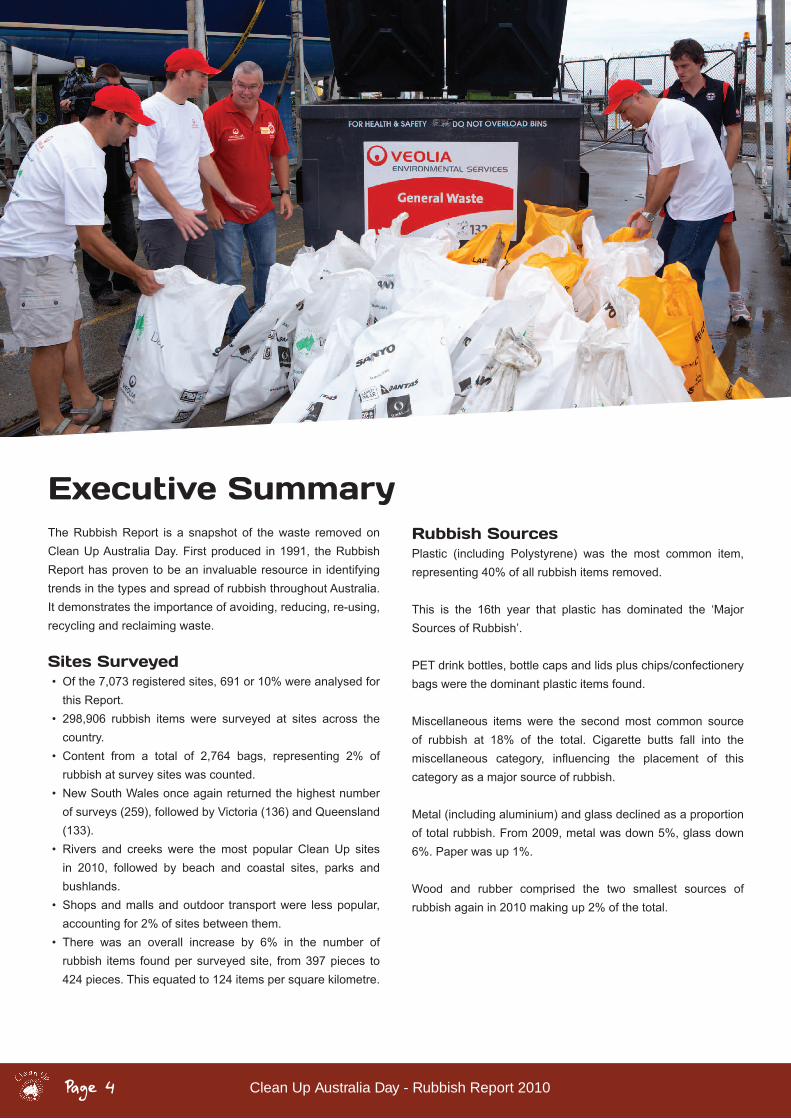
Executive SummaryThe Rubbish Report is a snapshot of the waste removed on Clean Up Australia Day. First produced in 1991, the Rubbish Report has proven to be an invaluable resource in identifying trends in the types and spread of rubbish throughout Australia. It demonstrates the importance of avoiding, reducing, re-using, recycling and reclaiming waste.
Sites Surveyed• Of the 7,073 registered sites, 691 or 10% were analysed for
this Report. • 298,906 rubbish items were surveyed at sites across the
country.• Content from a total of 2,764 bags, representing 2% of
rubbish at survey sites was counted. • New South Wales once again returned the highest number
of surveys (259), followed by Victoria (136) and Queensland (133).
• Rivers and creeks were the most popular Clean Up sites in 2010, followed by beach and coastal sites, parks and bushlands.
• Shops and malls and outdoor transport were less popular, accounting for 2% of sites between them.
• There was an overall increase by 6% in the number of rubbish items found per surveyed site, from 397 pieces to 424 pieces. This equated to 124 items per square kilometre.
Rubbish SourcesPlastic (including Polystyrene) was the most common item, representing 40% of all rubbish items removed.
This is the 16th year that plastic has dominated the ‘Major Sources of Rubbish’.
PET drink bottles, bottle caps and lids plus chips/confectionery bags were the dominant plastic items found.
Miscellaneous items were the second most common source of rubbish at 18% of the total. Cigarette butts fall into the miscellaneous category, influencing the placement of thiscategory as a major source of rubbish.
Metal (including aluminium) and glass declined as a proportion of total rubbish. From 2009, metal was down 5%, glass down 6%. Paper was up 1%.
Wood and rubber comprised the two smallest sources of rubbish again in 2010 making up 2% of the total.
4
Clean Up Australia Day - Rubbish Report 2010 Page
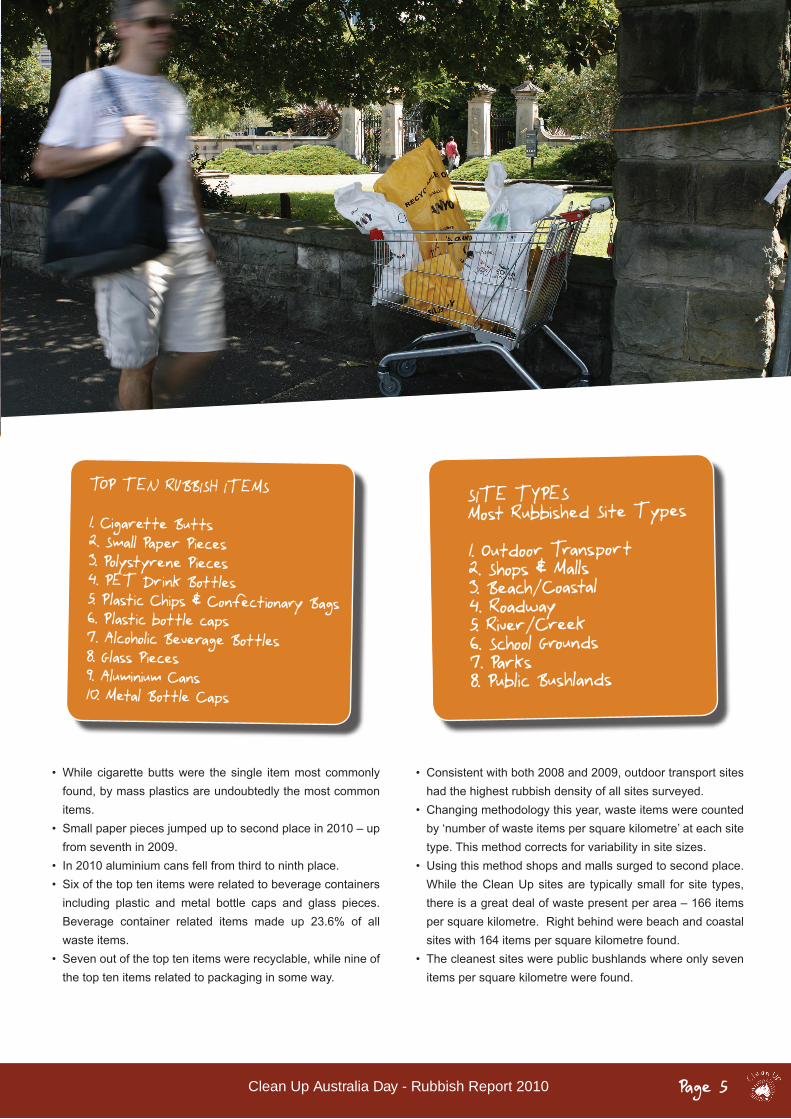
TOP TEN RUBBISH ITEMS
1. Cigarette Butts2. Small Paper Pieces3. Polystyrene Pieces4. PET Drink Bottles5. Plastic Chips & Confectionary Bags6. Plastic bottle caps7. Alcoholic Beverage Bottles8. Glass Pieces9. Aluminium Cans10. Metal Bottle Caps
• While cigarette butts were the single item most commonly found, by mass plastics are undoubtedly the most common items.
• Small paper pieces jumped up to second place in 2010 – up from seventh in 2009.
• In 2010 aluminium cans fell from third to ninth place.• Six of the top ten items were related to beverage containers
including plastic and metal bottle caps and glass pieces. Beverage container related items made up 23.6% of all waste items.
• Seven out of the top ten items were recyclable, while nine of the top ten items related to packaging in some way.
• Consistent with both 2008 and 2009, outdoor transport sites had the highest rubbish density of all sites surveyed.
• Changing methodology this year, waste items were counted by ‘number of waste items per square kilometre’ at each site type. This method corrects for variability in site sizes.
• Using this method shops and malls surged to second place. While the Clean Up sites are typically small for site types, there is a great deal of waste present per area – 166 items per square kilometre. Right behind were beach and coastal sites with 164 items per square kilometre found.
• The cleanest sites were public bushlands where only seven items per square kilometre were found.
SITE TYPESMost Rubbished Site Types
1. Outdoor Transport2. Shops & Malls3. Beach/Coastal4. Roadway5. River/Creek6. School Grounds7. Parks8. Public Bushlands
5
Clean Up Australia Day - Rubbish Report 2010Page
Methodology
Rubbish Report Survey Forms are issued in Clean Up kits to site supervisors. In the past few years, rubbish survey forms have been distributed to all site co-ordinators and included as part of the ‘End of Clean Up Report’ though still positioned as an optional exercise. This has generally increased the number of Rubbish Report surveys completed.
The survey requires those taking part to identify and count a proportion of the rubbish removed from their site.
One in five bags of rubbish removed is analysed, with amaximumof10bagssurveyedpersite.If lessthanfivebagsare collected, the contents of just one bag is counted.
In 2010, volunteers were asked to separate their rubbish into recyclable and non-recyclable items, with the provision of ‘yellow’ bags as well as the usual white ones. The intention was to encourage volunteers to recycle where possible. Site co-ordinators were asked to capture a representative sample from both types of bags – for example, if the site collected 10 rubbishbagsandfiveyellowbags, count the items from tworubbish bags and one recyclable bag.
Each site surveyed is classified by the category that bestdescribes its location. The categories are: beaches/coastal, outdoor transport areas, parks, public bushland, river/creek, roadway, school grounds, shop/mall and other. These categories have been consistent since the Rubbish Report was firstintroducedin1991.Onechangein2009wasthechangefrom parks/waterfront to just parks as the waterfront category generated some confusion as it is already captured under the river/creek and beach/coastal.
TheRubbishReportSurvey lists a total of 82 specificwasteitems grouped by type of source material, with 11 ‘other’ categories in each section for those items which do not fiteasily within the list. ‘Other’ items are carefully analysed to capture a numeric value. Source categories are: plastic (further divided into plastic bags, plastic bottles/ containers and plastic miscellaneous), polystyrene, glass, rubber, paper/cardboard, metal/aluminium (further divided into metal/aluminium cans and metal/aluminium miscellaneous), wood and miscellaneous. E-waste (mobile phones, computers etc.) was added to the miscellaneous category this year.
The Rubbish Report is intended to act as a snapshot of information to show trends over time of rubbish removed on CleanUpAustraliaDay.Itisnotintendedtobeadefinitivesurveyrepresenting all rubbish found in all Australian environments.
Thefigurespresented in theRubbishReportarebasedonasample of a small number of Clean Up Sites, where data is collected by our generous volunteers. Also incorporated is historical information that accounts for sites which include large and bulky items – such as old car bodies and construction waste. To account for these large sites, an average value of 2.2 tonnes of rubbish removed per site has been traditionally used. This value is multiplied by the number of registered sites to give an estimate of the total rubbish removed.
6
Clean Up Australia Day - Rubbish Report 2010 Page
Returned Valid Surveys by State
Returned Valid Surveys by Site Type
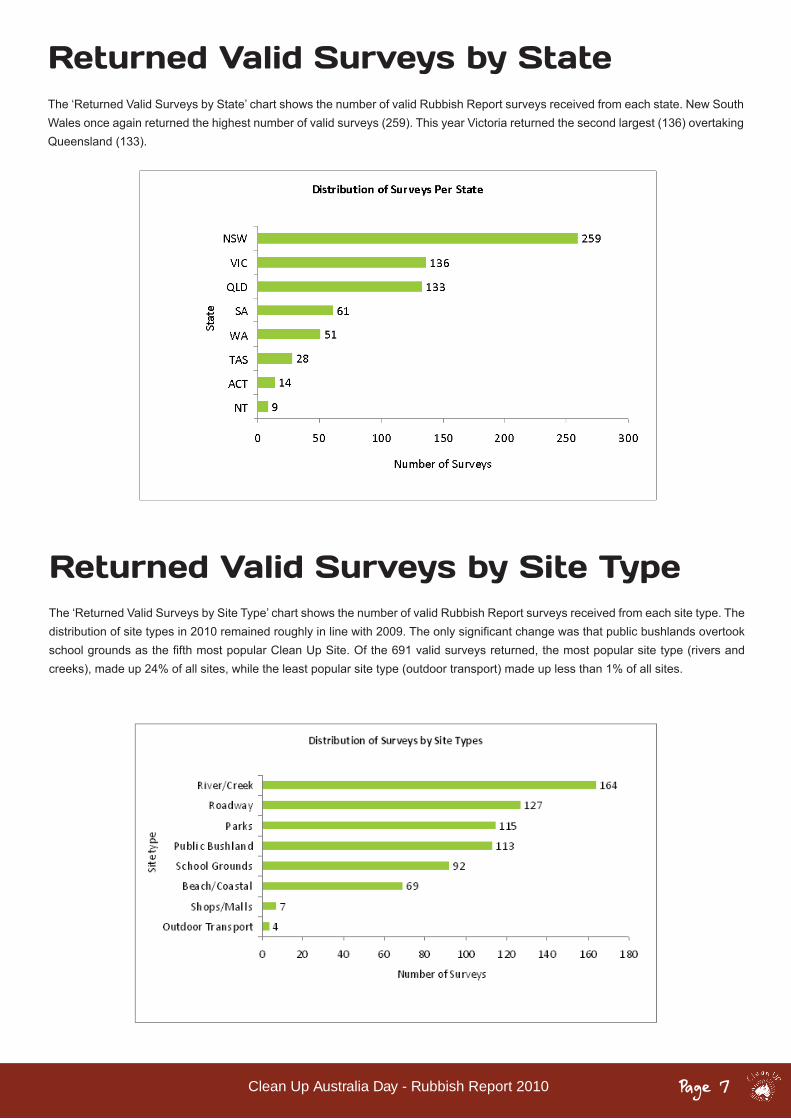
The ‘Returned Valid Surveys by State’ chart shows the number of valid Rubbish Report surveys received from each state. New South Wales once again returned the highest number of valid surveys (259). This year Victoria returned the second largest (136) overtaking Queensland (133).
The ‘Returned Valid Surveys by Site Type’ chart shows the number of valid Rubbish Report surveys received from each site type. The distributionofsitetypesin2010remainedroughlyinlinewith2009.TheonlysignificantchangewasthatpublicbushlandsovertookschoolgroundsasthefifthmostpopularCleanUpSite.Ofthe691validsurveysreturned,themostpopularsitetype(riversandcreeks), made up 24% of all sites, while the least popular site type (outdoor transport) made up less than 1% of all sites.
7
Clean Up Australia Day - Rubbish Report 2010Page
Top Ten Rubbish Items
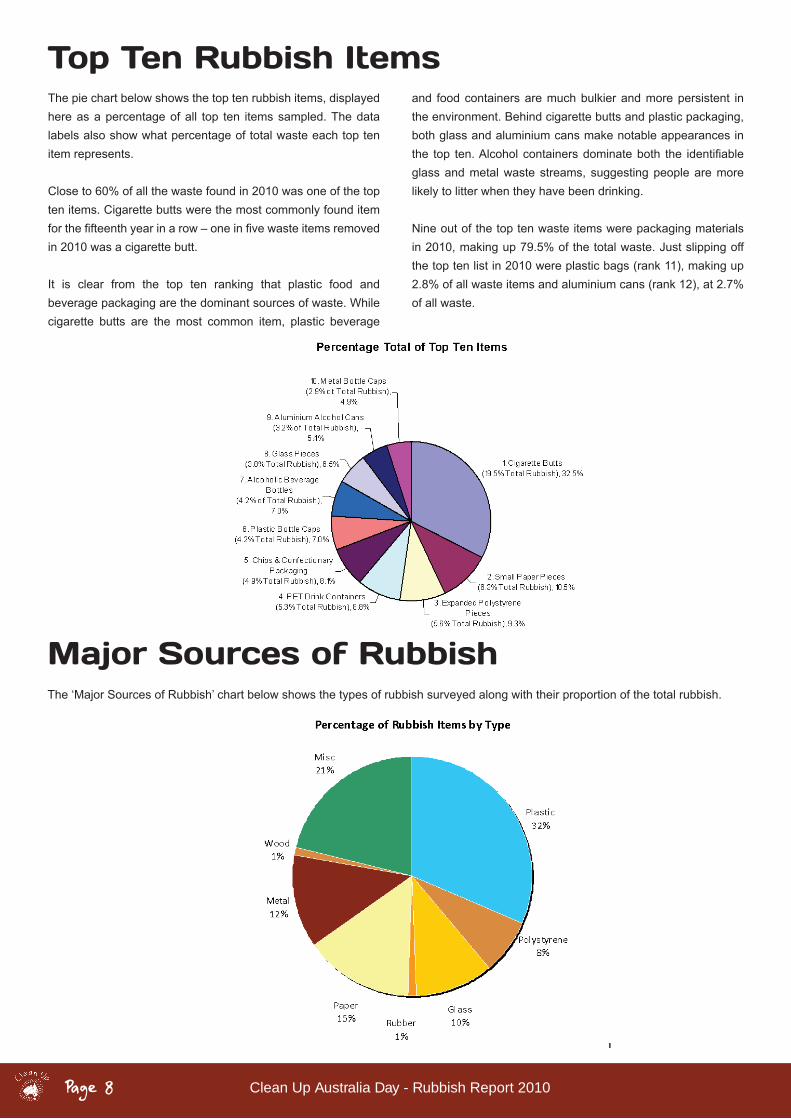
Major Sources of RubbishThe ‘Major Sources of Rubbish’ chart below shows the types of rubbish surveyed along with their proportion of the total rubbish.
The pie chart below shows the top ten rubbish items, displayed here as a percentage of all top ten items sampled. The data labels also show what percentage of total waste each top ten item represents.
Close to 60% of all the waste found in 2010 was one of the top ten items. Cigarette butts were the most commonly found item forthefifteenthyearinarow–oneinfivewasteitemsremovedin 2010 was a cigarette butt.
It is clear from the top ten ranking that plastic food and beverage packaging are the dominant sources of waste. While cigarette butts are the most common item, plastic beverage
and food containers are much bulkier and more persistent in the environment. Behind cigarette butts and plastic packaging, both glass and aluminium cans make notable appearances in the top ten.Alcohol containersdominateboth the identifiableglass and metal waste streams, suggesting people are more likely to litter when they have been drinking.
Nine out of the top ten waste items were packaging materials in 2010, making up 79.5% of the total waste. Just slipping off the top ten list in 2010 were plastic bags (rank 11), making up 2.8% of all waste items and aluminium cans (rank 12), at 2.7% of all waste.
8
Clean Up Australia Day - Rubbish Report 2010 Page
PlasticOver the entire 21 years of Clean Up Australia Day, plastics have remained the dominant waste item found. This year, plastics (including polystyrene) made up 40% of all rubbish removed. The amount of plastic removed as a total proportion of rubbish peaked in 1994, when 48% of all waste items removed were plastics. Plastics can remain in the environment for long periods, and can cause harm to both terrestrial and marine wildlife. Therefore, removal of plastics from the environment is a key achievement of Clean Up Australia Day.
MiscellanousMiscellaneous items were the second largest source of rubbish in 2010 next to plastics, consistent with 2009’s results. Cigarette butts were overwhelmingly the largest miscellaneous waste item removed, constituting 92% of all miscellaneous items removed.Othermiscellaneous items of significance includedcar parts, batteries, food scraps and clothing. In total there were 61,217 miscellaneous items removed at all sites that returned valid surveys.
Metal and AlumuniumMetals were the fourth largest category removed in 2010, losing their third place on the podium for the first time since 2007.Representing 12% of all waste items removed, metals are a high value commodity and one of the few items that can be truly recycled rather than ‘downcycled’. Their removal from the environment for recycling presents an economic net gain.
GlassGlass waste accounted for 10% of all items removed in 2010. Like metals, glass can be recycled with minimal loss of mass or quality, and is a key target for recycling. Alcohol bottles were the dominant form of glass removed, making up 40% of the total.Brokenglasswasalsosignificant,accountingfor36%ofall glass waste.
Paper and Cardboard In 2010 papermade it back on the podium for the first timein four years – representing 15% of all waste removed. This category also includes liquid paper board, a form of packaging where paper is covered with a thin layer of polyethylene. As paper is both biodegradable and non-toxic, its environmental impactislowerthanotherformsofwaste.Themostsignificantidentifiable items in thepaper categorywere foodpackaging(12% of waste items) and napkins and tissues (5% of paper found).
Expanded PolystyreneDue to the relatively high toxicity of the styrene monomer and the tendency for expanded polystyrene to shred into tiny particles, expanded polystyrene is counted separately from other plastics. Expanded polystyrene represented 20% of all plastic items removed– a sobering figure. Further, of thetotal polystyrene items removed 73% were partial polystyrene pieces.
RubberRubber items removed were at their lowest point since 1993, representing just over 1% of all waste items removed. By far the most significant rubber item removed was tyres, whichaccounted for 19% of all rubber items removed and no doubt the largest mass of rubber removed.
WoodWood was the smallest category of waste removed in 2010, making up just over 1% of all waste items removed. Wood products are often treated with paints, lacquers, resins as well as toxic preservatives such as chromated copper arsenate (CCA). Therefore, it would be imprudent to regard discarded wood products as environmentally benign. In 2010 there were 3218 wood items removed, a 58% decrease from 2009.
Summary
9
Clean Up Australia Day - Rubbish Report 2010Page
Historical Comparison
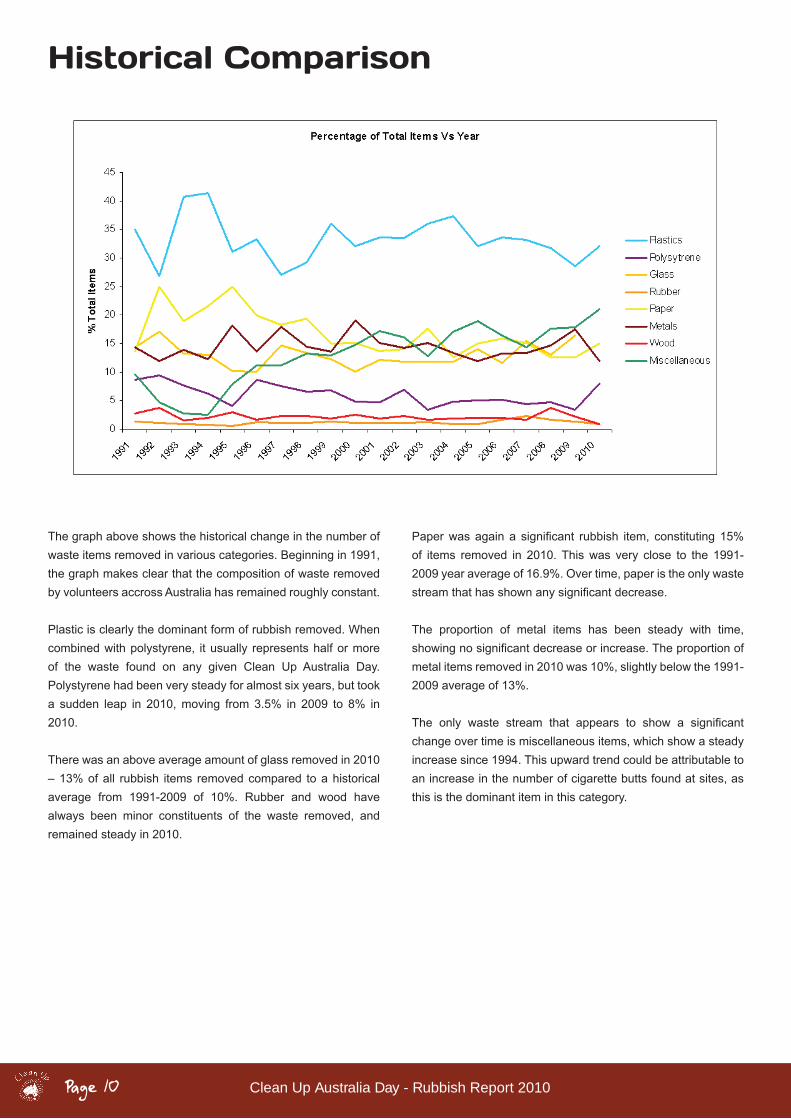
The graph above shows the historical change in the number of waste items removed in various categories. Beginning in 1991, the graph makes clear that the composition of waste removed by volunteers accross Australia has remained roughly constant.
Plastic is clearly the dominant form of rubbish removed. When combined with polystyrene, it usually represents half or more of the waste found on any given Clean Up Australia Day. Polystyrene had been very steady for almost six years, but took a sudden leap in 2010, moving from 3.5% in 2009 to 8% in 2010.
There was an above average amount of glass removed in 2010 – 13% of all rubbish items removed compared to a historical average from 1991-2009 of 10%. Rubber and wood have always been minor constituents of the waste removed, and remained steady in 2010.
Paperwasagaina significant rubbish item, constituting15%of items removed in 2010. This was very close to the 1991-2009 year average of 16.9%. Over time, paper is the only waste streamthathasshownanysignificantdecrease.
The proportion of metal items has been steady with time, showingnosignificantdecreaseorincrease.Theproportionofmetal items removed in 2010 was 10%, slightly below the 1991-2009 average of 13%.
The only waste stream that appears to show a significantchange over time is miscellaneous items, which show a steady increase since 1994. This upward trend could be attributable to an increase in the number of cigarette butts found at sites, as this is the dominant item in this category.
10
Clean Up Australia Day - Rubbish Report 2010 Page 11
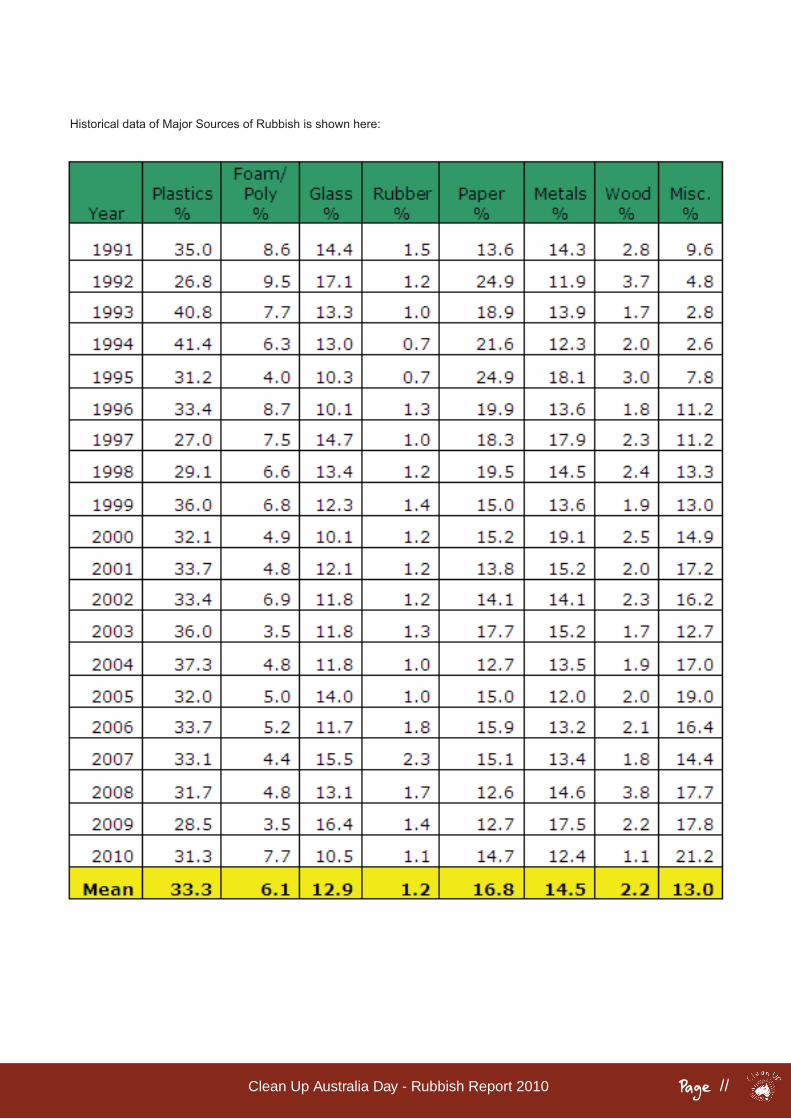
Historical data of Major Sources of Rubbish is shown here:
Clean Up Australia Day - Rubbish Report 2010Page
Most Polluted Sites
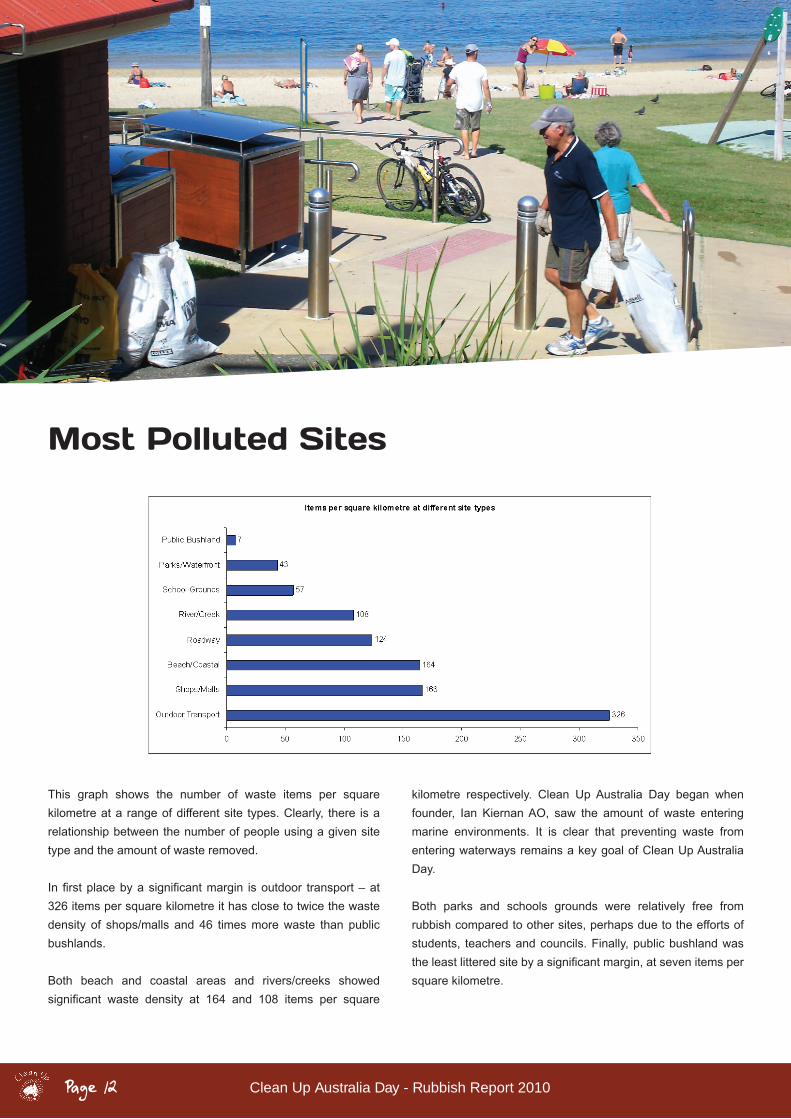
This graph shows the number of waste items per square kilometre at a range of different site types. Clearly, there is a relationship between the number of people using a given site type and the amount of waste removed.
Infirstplacebyasignificantmargin isoutdoor transport–at326 items per square kilometre it has close to twice the waste density of shops/malls and 46 times more waste than public bushlands. Both beach and coastal areas and rivers/creeks showed significant waste density at 164 and 108 items per square
kilometre respectively. Clean Up Australia Day began when founder, Ian Kiernan AO, saw the amount of waste entering marine environments. It is clear that preventing waste from entering waterways remains a key goal of Clean Up Australia Day. Both parks and schools grounds were relatively free from rubbish compared to other sites, perhaps due to the efforts of students, teachers and councils. Finally, public bushland was theleastlitteredsitebyasignificantmargin,atsevenitemspersquare kilometre.
12
Clean Up Australia Day - Rubbish Report 2010 Page
Major Sources of Rubbish - Analysis of each Category
Plastic
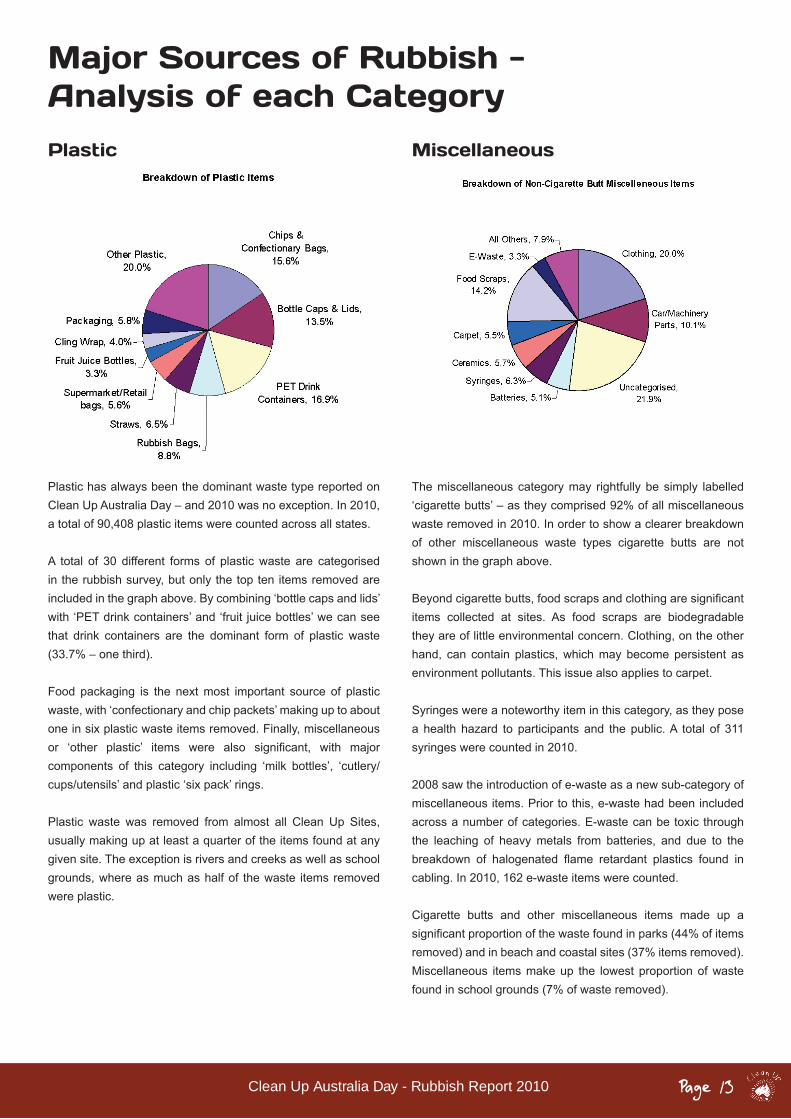
Plastic has always been the dominant waste type reported on Clean Up Australia Day – and 2010 was no exception. In 2010, a total of 90,408 plastic items were counted across all states.
A total of 30 different forms of plastic waste are categorised in the rubbish survey, but only the top ten items removed are included in the graph above. By combining ‘bottle caps and lids’ with ‘PET drink containers’ and ‘fruit juice bottles’ we can see that drink containers are the dominant form of plastic waste (33.7% – one third).
Food packaging is the next most important source of plastic waste, with ‘confectionary and chip packets’ making up to about one in six plastic waste items removed. Finally, miscellaneous or ‘other plastic’ items were also significant, with majorcomponents of this category including ‘milk bottles’, ‘cutlery/cups/utensils’ and plastic ‘six pack’ rings.
Plastic waste was removed from almost all Clean Up Sites, usually making up at least a quarter of the items found at any given site. The exception is rivers and creeks as well as school grounds, where as much as half of the waste items removed were plastic.
The miscellaneous category may rightfully be simply labelled ‘cigarette butts’ – as they comprised 92% of all miscellaneous waste removed in 2010. In order to show a clearer breakdown of other miscellaneous waste types cigarette butts are not shown in the graph above.
Beyondcigarettebutts,foodscrapsandclothingaresignificantitems collected at sites. As food scraps are biodegradable they are of little environmental concern. Clothing, on the other hand, can contain plastics, which may become persistent as environment pollutants. This issue also applies to carpet.
Syringes were a noteworthy item in this category, as they pose a health hazard to participants and the public. A total of 311 syringes were counted in 2010.
2008 saw the introduction of e-waste as a new sub-category of miscellaneous items. Prior to this, e-waste had been included across a number of categories. E-waste can be toxic through the leaching of heavy metals from batteries, and due to the breakdown of halogenated flame retardant plastics found incabling. In 2010, 162 e-waste items were counted.
Cigarette butts and other miscellaneous items made up a significantproportionofthewastefoundinparks(44%ofitemsremoved) and in beach and coastal sites (37% items removed). Miscellaneous items make up the lowest proportion of waste found in school grounds (7% of waste removed).
Miscellaneous
13
Clean Up Australia Day - Rubbish Report 2010Page
Metal & Aluminium Glass
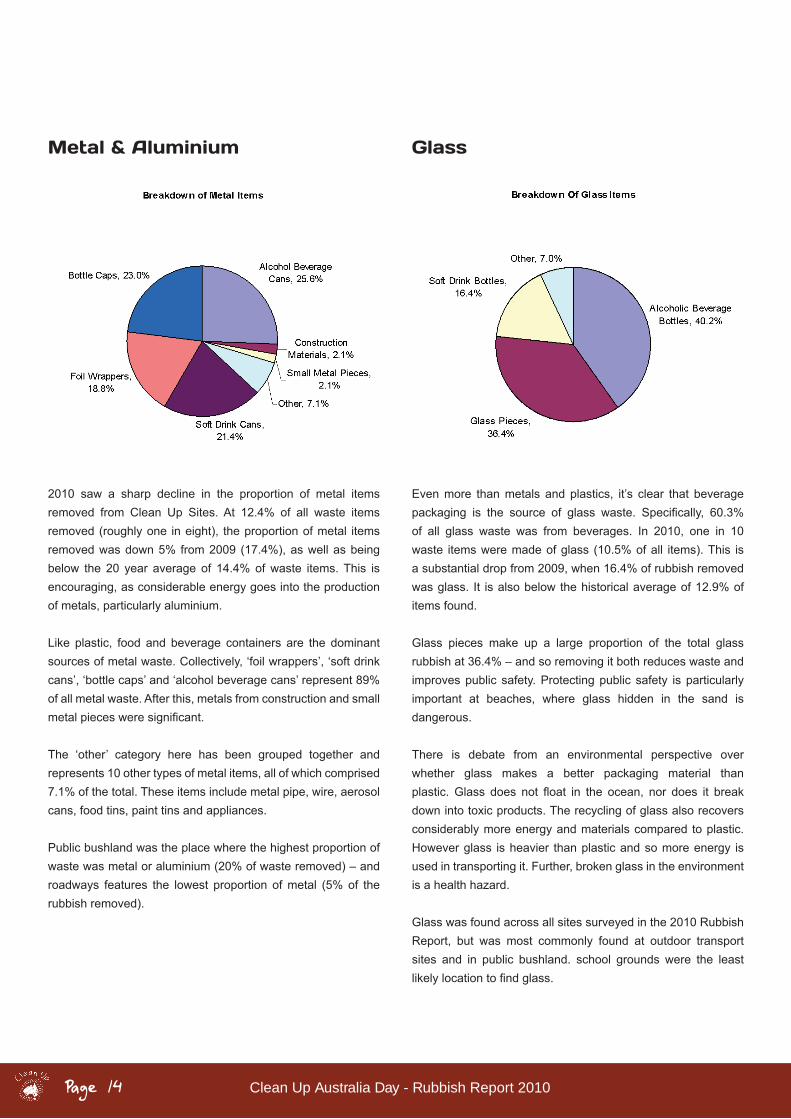
2010 saw a sharp decline in the proportion of metal items removed from Clean Up Sites. At 12.4% of all waste items removed (roughly one in eight), the proportion of metal items removed was down 5% from 2009 (17.4%), as well as being below the 20 year average of 14.4% of waste items. This is encouraging, as considerable energy goes into the production of metals, particularly aluminium.
Like plastic, food and beverage containers are the dominant sources of metal waste. Collectively, ‘foil wrappers’, ‘soft drink cans’, ‘bottle caps’ and ‘alcohol beverage cans’ represent 89% of all metal waste. After this, metals from construction and small metalpiecesweresignificant.
The ‘other’ category here has been grouped together and represents 10 other types of metal items, all of which comprised 7.1% of the total. These items include metal pipe, wire, aerosol cans, food tins, paint tins and appliances.
Public bushland was the place where the highest proportion of waste was metal or aluminium (20% of waste removed) – and roadways features the lowest proportion of metal (5% of the rubbish removed).
Even more than metals and plastics, it’s clear that beverage packaging is the source of glass waste. Specifically, 60.3%of all glass waste was from beverages. In 2010, one in 10 waste items were made of glass (10.5% of all items). This is a substantial drop from 2009, when 16.4% of rubbish removed was glass. It is also below the historical average of 12.9% of items found.
Glass pieces make up a large proportion of the total glass rubbish at 36.4% – and so removing it both reduces waste and improves public safety. Protecting public safety is particularly important at beaches, where glass hidden in the sand is dangerous.
There is debate from an environmental perspective over whether glass makes a better packaging material than plastic.Glass does not float in the ocean, nor does it breakdown into toxic products. The recycling of glass also recovers considerably more energy and materials compared to plastic. However glass is heavier than plastic and so more energy is used in transporting it. Further, broken glass in the environment is a health hazard.
Glass was found across all sites surveyed in the 2010 Rubbish Report, but was most commonly found at outdoor transport sites and in public bushland. school grounds were the least likelylocationtofindglass.
14
Clean Up Australia Day - Rubbish Report 2010 Page
Paper & Cardboard Expanded Polystyrene
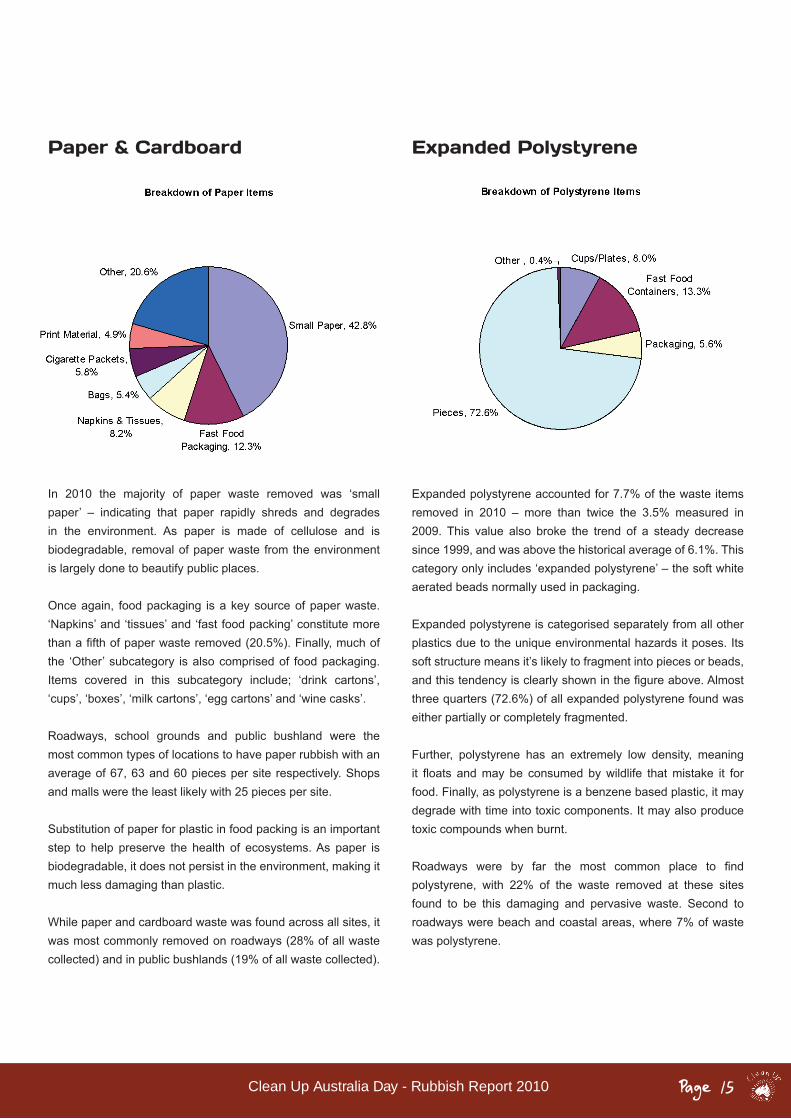
In 2010 the majority of paper waste removed was ‘small paper’ – indicating that paper rapidly shreds and degrades in the environment. As paper is made of cellulose and is biodegradable, removal of paper waste from the environment is largely done to beautify public places.
Once again, food packaging is a key source of paper waste. ‘Napkins’ and ‘tissues’ and ‘fast food packing’ constitute more thanafifthofpaperwasteremoved(20.5%).Finally,muchofthe ‘Other’ subcategory is also comprised of food packaging. Items covered in this subcategory include; ‘drink cartons’, ‘cups’, ‘boxes’, ‘milk cartons’, ‘egg cartons’ and ‘wine casks’.
Roadways, school grounds and public bushland were the most common types of locations to have paper rubbish with an average of 67, 63 and 60 pieces per site respectively. Shops and malls were the least likely with 25 pieces per site.
Substitution of paper for plastic in food packing is an important step to help preserve the health of ecosystems. As paper is biodegradable, it does not persist in the environment, making it much less damaging than plastic.
While paper and cardboard waste was found across all sites, it was most commonly removed on roadways (28% of all waste collected) and in public bushlands (19% of all waste collected).
Expanded polystyrene accounted for 7.7% of the waste items removed in 2010 – more than twice the 3.5% measured in 2009. This value also broke the trend of a steady decrease since 1999, and was above the historical average of 6.1%. This category only includes ‘expanded polystyrene’ – the soft white aerated beads normally used in packaging.
Expanded polystyrene is categorised separately from all other plastics due to the unique environmental hazards it poses. Its soft structure means it’s likely to fragment into pieces or beads, andthistendencyisclearlyshowninthefigureabove.Almostthree quarters (72.6%) of all expanded polystyrene found was either partially or completely fragmented.
Further, polystyrene has an extremely low density, meaning it floats andmay be consumed bywildlife thatmistake it forfood. Finally, as polystyrene is a benzene based plastic, it may degrade with time into toxic components. It may also produce toxic compounds when burnt.
Roadways were by far the most common place to findpolystyrene, with 22% of the waste removed at these sites found to be this damaging and pervasive waste. Second to roadways were beach and coastal areas, where 7% of waste was polystyrene.
15
Clean Up Australia Day - Rubbish Report 2010Page
Wood Rubber
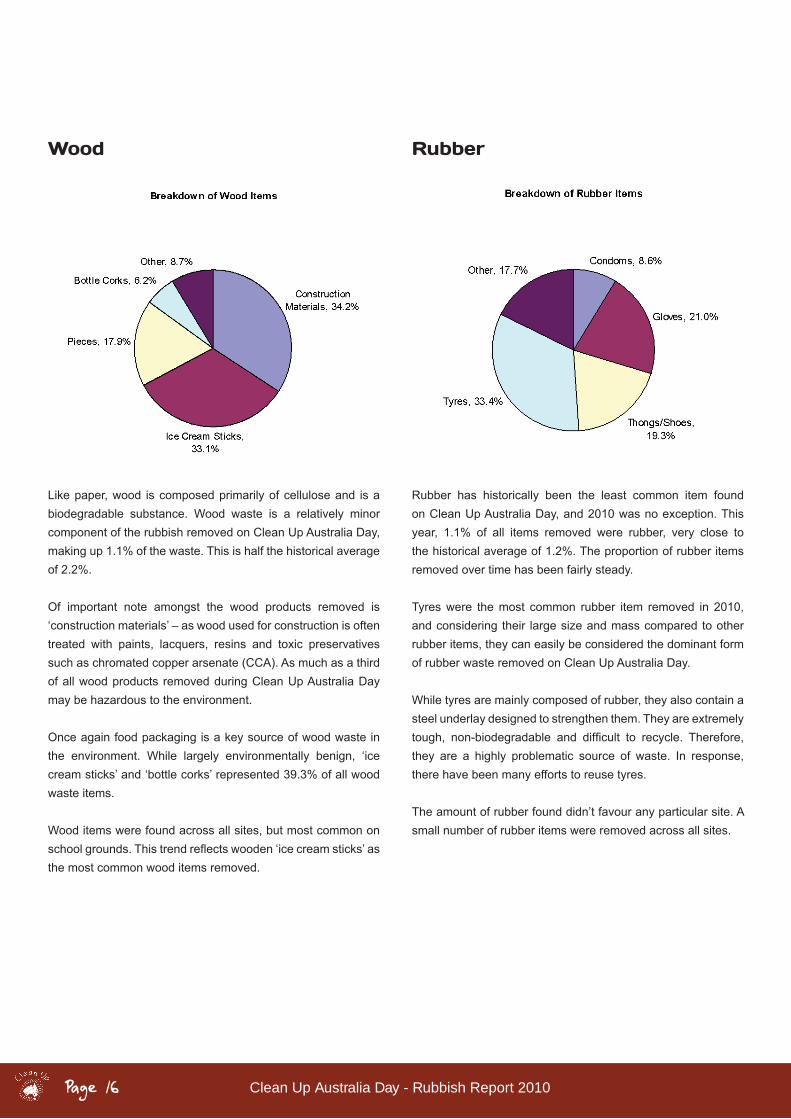
Like paper, wood is composed primarily of cellulose and is a biodegradable substance. Wood waste is a relatively minor component of the rubbish removed on Clean Up Australia Day, making up 1.1% of the waste. This is half the historical average of 2.2%.
Of important note amongst the wood products removed is ‘construction materials’ – as wood used for construction is often treated with paints, lacquers, resins and toxic preservatives such as chromated copper arsenate (CCA). As much as a third of all wood products removed during Clean Up Australia Day may be hazardous to the environment.
Once again food packaging is a key source of wood waste in the environment. While largely environmentally benign, ‘ice cream sticks’ and ‘bottle corks’ represented 39.3% of all wood waste items.
Wood items were found across all sites, but most common on schoolgrounds.Thistrendreflectswooden‘icecreamsticks’asthe most common wood items removed.
Rubber has historically been the least common item found on Clean Up Australia Day, and 2010 was no exception. This year, 1.1% of all items removed were rubber, very close to the historical average of 1.2%. The proportion of rubber items removed over time has been fairly steady.
Tyres were the most common rubber item removed in 2010, and considering their large size and mass compared to other rubber items, they can easily be considered the dominant form of rubber waste removed on Clean Up Australia Day.
While tyres are mainly composed of rubber, they also contain a steel underlay designed to strengthen them. They are extremely tough, non-biodegradable and difficult to recycle. Therefore,they are a highly problematic source of waste. In response, there have been many efforts to reuse tyres.
The amount of rubber found didn’t favour any particular site. A small number of rubber items were removed across all sites.
16
Clean Up Australia Day - Rubbish Report 2010 Page
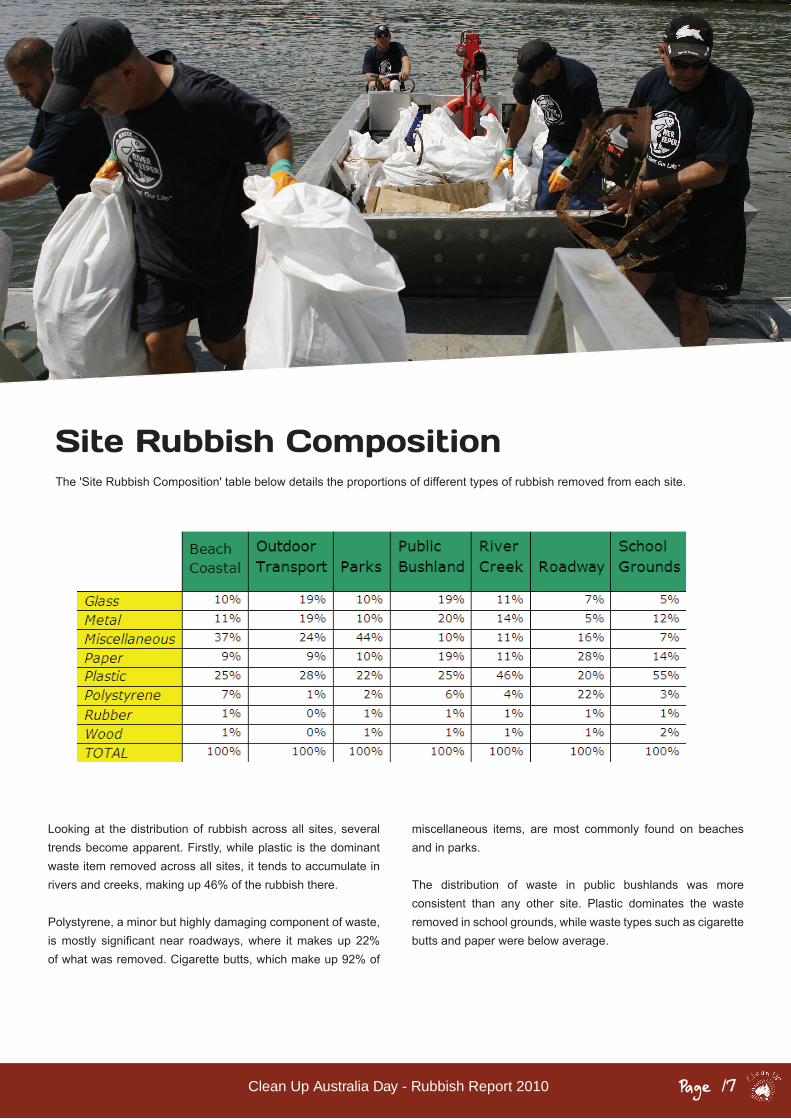
Looking at the distribution of rubbish across all sites, several trends become apparent. Firstly, while plastic is the dominant waste item removed across all sites, it tends to accumulate in rivers and creeks, making up 46% of the rubbish there.
Polystyrene, a minor but highly damaging component of waste, ismostly significant near roadways,where itmakes up 22%of what was removed. Cigarette butts, which make up 92% of
miscellaneous items, are most commonly found on beaches and in parks.
The distribution of waste in public bushlands was more consistent than any other site. Plastic dominates the waste removed in school grounds, while waste types such as cigarette butts and paper were below average.
17
Site Rubbish CompositionThe 'Site Rubbish Composition' table below details the proportions of different types of rubbish removed from each site.
Clean Up Australia Day - Rubbish Report 2010Page 18
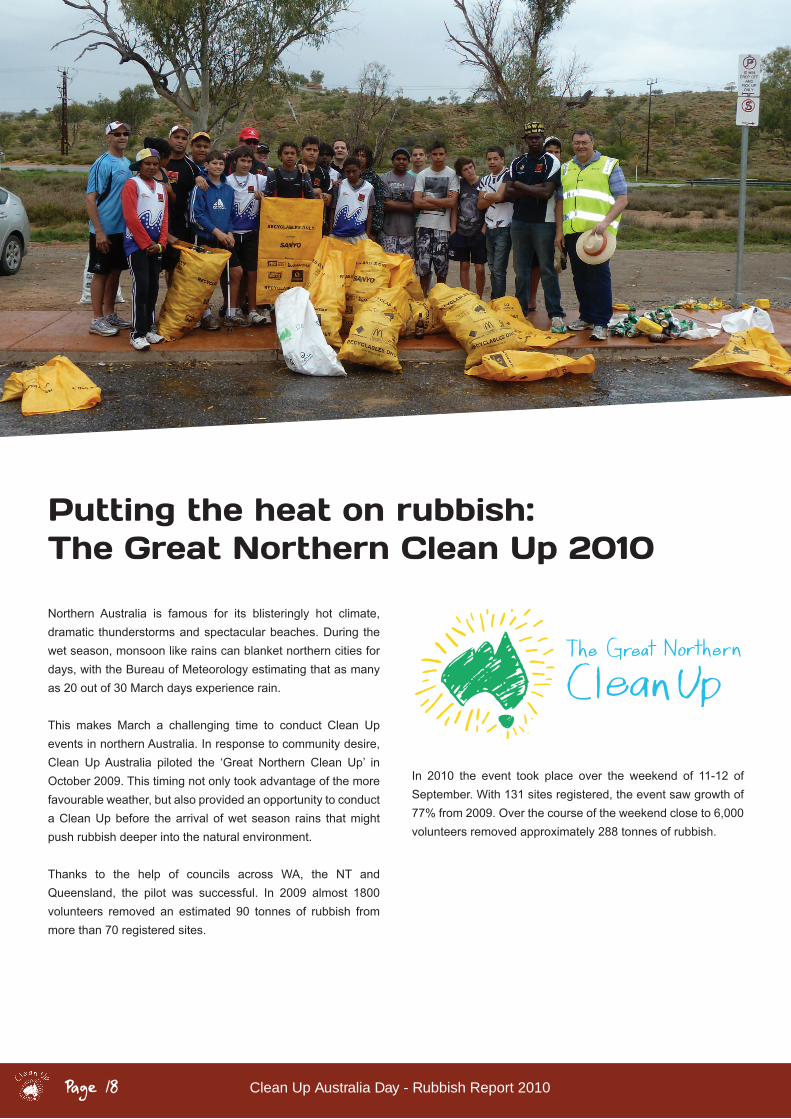
Putting the heat on rubbish:The Great Northern Clean Up 2010
Northern Australia is famous for its blisteringly hot climate, dramatic thunderstorms and spectacular beaches. During the wet season, monsoon like rains can blanket northern cities for days, with the Bureau of Meteorology estimating that as many as 20 out of 30 March days experience rain.
This makes March a challenging time to conduct Clean Up events in northern Australia. In response to community desire, Clean Up Australia piloted the ‘Great Northern Clean Up’ in October 2009. This timing not only took advantage of the more favourable weather, but also provided an opportunity to conduct a Clean Up before the arrival of wet season rains that might push rubbish deeper into the natural environment.
Thanks to the help of councils across WA, the NT and Queensland, the pilot was successful. In 2009 almost 1800 volunteers removed an estimated 90 tonnes of rubbish from more than 70 registered sites.
In 2010 the event took place over the weekend of 11-12 of September. With 131 sites registered, the event saw growth of 77% from 2009. Over the course of the weekend close to 6,000 volunteers removed approximately 288 tonnes of rubbish.
Clean Up Australia Day - Rubbish Report 2010 Page 19
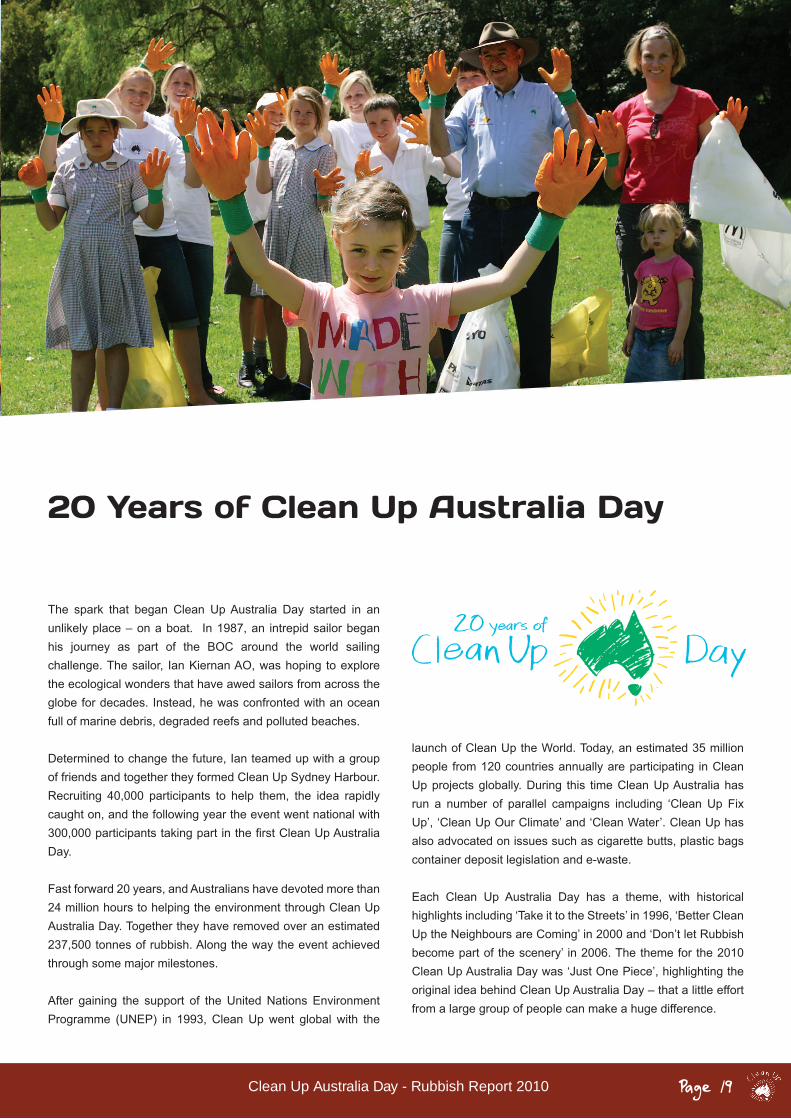
20 Years of Clean Up Australia Day
The spark that began Clean Up Australia Day started in an unlikely place – on a boat. In 1987, an intrepid sailor began his journey as part of the BOC around the world sailing challenge. The sailor, Ian Kiernan AO, was hoping to explore the ecological wonders that have awed sailors from across the globe for decades. Instead, he was confronted with an ocean full of marine debris, degraded reefs and polluted beaches.
Determined to change the future, Ian teamed up with a group of friends and together they formed Clean Up Sydney Harbour. Recruiting 40,000 participants to help them, the idea rapidly caught on, and the following year the event went national with 300,000participantstakingpartinthefirstCleanUpAustraliaDay.
Fast forward 20 years, and Australians have devoted more than 24 million hours to helping the environment through Clean Up Australia Day. Together they have removed over an estimated 237,500 tonnes of rubbish. Along the way the event achieved through some major milestones.
After gaining the support of the United Nations Environment Programme (UNEP) in 1993, Clean Up went global with the
launch of Clean Up the World. Today, an estimated 35 million people from 120 countries annually are participating in Clean Up projects globally. During this time Clean Up Australia has run a number of parallel campaigns including ‘Clean Up Fix Up’, ‘Clean Up Our Climate’ and ‘Clean Water’. Clean Up has also advocated on issues such as cigarette butts, plastic bags container deposit legislation and e-waste.
Each Clean Up Australia Day has a theme, with historical highlights including ‘Take it to the Streets’ in 1996, ‘Better Clean Up the Neighbours are Coming’ in 2000 and ‘Don’t let Rubbish become part of the scenery’ in 2006. The theme for the 2010 Clean Up Australia Day was ‘Just One Piece’, highlighting the original idea behind Clean Up Australia Day – that a little effort from a large group of people can make a huge difference.
Clean Up Australia Ltd ABN 93 003 884 991 PO Box R725, Royal Exchange NSW 1225 Australiatel: 1800 CUA DAY email: [email protected] web: www.cleanup.org.au