Embed Size (px)
Citation preview

Building Engineering
The Royal Borough of Kingston Upon Thames
July 2013
Royal Borough of Kingston upon Thames: Energy Master Plan Final Report

Prepared by: ............................................................. Emily Woodhouse Graduate Consultant And Prepared by: ............................................................. Checked by: ........................................................................ Andrew Turton Alison Crompton Associate Director Regional Director Approved by: ............................................................. Paul Woods Technical Director Royal Borough of Kingston upon Thames: Energy Master Plan
Rev No Comments Checked by Approved by
Date
1 Interim report ALC PW 27/03/2013
2 Draft final report ACT PW 25/06/2013
3 Final report ACT PW 19/07/2013
36 Storey's Way, Cambridge, CB3 0DT Telephone: 01223 351258 Website: http://www.aecom.com Job No 60287076 Reference Final report Date Created July 2013 This document has been prepared by AECOM Limited for the sole use of our client (the “Client”) and in accordance with generally accepted consultancy principles, the budget for fees and the terms of reference agreed between AECOM Limited and the Client. Any information provided by third parties and referred to herein has not been checked or verified by AECOM Limited, unless otherwise expressly stated in the document. No third party may rely upon this document without the prior and express written agreement of AECOM Limited. f:\projects\sdg - en_kingston dh\6. reports\final report\130717 kingston emp final.docx

Acronyms ........................................................................................................................................................................................ 1
Executive summary ........................................................................................................................................................................ 3
1 Introduction ....................................................................................................................................................................... 9
2 Review of existing information ...................................................................................................................................... 13
3 Scoping assessment....................................................................................................................................................... 24
4 Energy production .......................................................................................................................................................... 44
5 Energy demands ............................................................................................................................................................. 78
6 Energy distribution analysis .......................................................................................................................................... 87
7 Energy sale .................................................................................................................................................................... 107
8 Analysis of options ....................................................................................................................................................... 113
9 Risk assessment ........................................................................................................................................................... 130
10 Delivery plan and next steps ........................................................................................................................................ 136
11 Conclusions and recommendations............................................................................................................................ 146
Appendices ................................................................................................................................................................................. 150
Appendix 1: Site visits ............................................................................................................................................................... 151
Appendix 2: Energy demand analysis ...................................................................................................................................... 155
Appendix 3: Impact on new development ................................................................................................................................ 172
Table of Contents
AECOM Final Report 1
Capabilities on project:
Building Engineering
AHU Air Handling Unit
BMS Building Management System
CCGT Combined Cycle Gas Turbine
CCS Carbon Capture and Storage
CHP Combined Heat and Power
CO2 Carbon Dioxide
DE Decentralised Energy
DECC Department of Energy and Climate Change
DEPDU Decentralised Energy Programme Delivery Unit
DEN Decentralised Energy Network
DH District Heating
DHN District Heating Network
DHW Domestic Hot Water
DNO Distribution Network Operator
EfW Energy from Waste
EMP Energy Master Plan
EPC Energy Performance Certificate
ESCo Energy Services Company
FiT Feed in Tariff
GIA Gross Internal Area
GLA Greater London Authority
GSHP Ground Source Heat Pump
HIU Hydraulic Interface Unit
HVAC Heating, Ventilation and Air Conditioning
IRR Internal Rate of Return
K+20 AAP Kingston Town Centre Area Action Plan
KTC Kingston Town Centre
kW Kilowatt (unit of power)
kWe Kilowatt electricity
kWh Kilowatt hour (unit of energy)
kWth Kilowatt thermal
LDF Local Development Framework
LTHW Low temperature hot water
MW Megawatt (unit of power)
Acronyms

AECOM Final Report 2
Capabilities on project:
Building Engineering
MWe Megawatt electricity
MWh Megawatt hour (unit of energy)
MWth Megawatt thermal
NPV Net Present Value
PHE Plate Heat Exchanger
RBK Royal Borough of Kingston-upon-Thames
RHI Renewable Heat Incentive
STW Sewage Treatment Works

AECOM Final Report 3
Capabilities on project:
Building Engineering
Introduction
This report has been prepared by AECOM consulting engineers at the request of our Client, the Royal Borough of
Kingston-upon-Thames (RBK). As part of RBK’s commitment to addressing climate change, it has developed a
specific policy on decentralised energy. Accordingly the Council now requires an Energy Master Plan (EMP) to
consider the feasibility of Decentralised Energy (DE) and District Heating (DH) serving two areas: the Kingston
Town Centre and Tolworth Regeneration Area. The development of DE schemes in the Borough comprising DH
networks could provide a number of benefits:
Improved fuel security through higher efficiency heat generation and the ability to use alternative forms of
energy including “waste” heat.
A reduction in CO2 emissions and the ability to change heat supply technologies at a large scale in the
future to optimise CO2 reduction.
The ability to deliver lower cost heat. This could be used to provide commercial benefits, and help alleviate
fuel poverty in residential areas.
The provision of a low carbon heat source for new development to connect to, helping to reduce the costs of
complying with future regulations, and providing a connection-ready solution to developers.
The overall aim of this EMP is therefore to determine the extent of a DE system that has the potential to supply
market competitive, low carbon energy to new developments and existing properties.
District heating networks
Our work has built on an earlier report “Royal Borough of Kingston-Upon-Thames Heat Mapping Study”, prepared
by URS in 2010.This identified a number of opportunities for DH in the Borough, but in particular in the Town Centre
area, the main assessment area for this EMP. In addition, AECOM were requested to examine the Tolworth area
due to the presence of a large commercial building (Tolworth Tower) and a number of local re-development areas.
Our overall approach has been to consider the nature and scale of the existing and potential future energy demands
in Kingston to identify how these might be best served by a DH network in the longer term – in 40 years time, using
energy modelling. Working back from this, we have considered the energy loads at existing buildings and likely
loads for identified redevelopment sites to inform how an appropriate DH network could be developed in phases
over the next 10-15 years – the medium term, and what are likely to be the most suitable heat sources.
The scope of a District Heating network in the Tolworth area appears to be limited. The major ‘Tesco site’ which
includes residential units, and a leisure centre as well as the supermarket already includes a CHP plant sized to
serve the whole development. The other major building in the area, Tolworth Tower appears to have an uncertain
future and a standalone CHP system is likely to be more suitable for this building in any case. Other sites are either
too small or distant to justify connection.
The Kingston Town Centre offers a significant opportunity for a DH network to be established. There is a wide mix of
buildings at reasonable density including: Council offices, retail centres, university buildings and a major social
housing estate. Further away from the centre is Kingston General Hospital which has its own CHP plant at present
but could form a future heat customer. The main emphasis of this EMP is therefore on Kingston Town Centre.
There are a number of potential energy sources for a DE scheme, providing heat, and potentially electricity. Initially
it is proposed that gas-fired CHP plant is used to supply the low carbon heat for a DH network. This is a reliable and
mature technology which can deliver large CO2 reductions and efficiency improvements. Gas-fired CHP plant is also
the most economic of solutions and hence well suited to developing an early scheme which can attract investment.
In the longer term, there is the potential for the use of large-scale heat pumps. One of these could be located near to
the river using the river water as a heat source. The other could be located near to the sewage treatment works
using the waste water as a heat source. The latter may be more viable as space adjacent to the river for a major
energy centre is at a premium. However the ability to access the Renewable Heat Incentive (RHI) will be crucial for
either location based on current economic assumptions.
Executive summary

AECOM Final Report 4
Capabilities on project:
Building Engineering
This EMP assesses a number of network options. It proposes that the network is developed in 3 phases:
The first phase comprising a small group of Council owned buildings, Kingston College, the Courts and
police station and part of Kingston University
The second phase which would comprise an extension into the town centre area supplying mainly
commercial and retail property
A third phase which would extend out to serve local housing areas including the Cambridge Rd estate and
forming a ring main from which further extensions can be made and in this phase connection to a more
remote heat source at the sewage treatment works for example would become viable
For the each phase a number of combinations of heat mains routes and buildings to be connected were analysed to
find an optimal configuration and examine sensitivities.
The map in Figure i below indicates the extent of the proposed scheme and its phasing.

AECOM Final Report 5
Capabilities on project:
Building Engineering
Figure i: Map indicating proposed scheme and phasing

AECOM Final Report 6
Capabilities on project:
Building Engineering
Assessment of network options
The key economic and environmental results for Phase 1 are:
Phase 1 – Short term Units
Base Case
Variation 1
Variation 2
Variation 3
Variation 4
Variation 5
Network
Network length m 1635 1370 1635 1635 1090 2045
Total network capacity kW 16,820 16,820 16,820 8,410 10,330 21,803
Economic performance
Total Capital Cost £million 7.7 7.6 8.7 5.6 5.7 10.8
CHP capacity MWe 3.2 3.2 3.2 3.2 2.4 4.5
Energy centre boilers capacity MW 16.9 16.9 16.9 16.9 10.4 21.9
IRR (indexed) 25 years % 3.0 4.1 2.3 4.9 2.4 3.7
Environmental Performance
10 year carbon saving % 26% 26% 25% 25% 30% 28%
The results demonstrate that the baseline Phase 1 scheme with a central energy centre located in the Eden Quarter
on existing RBK land (currently surface car parking) providing all of the schemes heat could provide an IRR of 3%.
By locating the energy centre closer to the customers (and therefore reducing the DH network length), the IRR is
increased to 4.1%. The highest IRR of 4.9% is obtained when the DH network provides baseload heat only
(Variation 3) and peak and back-up heat supply is from the customer’s existing boilers.
Whilst these IRRs are not commercially attractive, they could be potentially improved through optimisation at
detailed feasibility stage to a level which can attract public sector investment, or even commercial investment. It
should be noted that the assumptions used in this EMP are purposely conservative to reflect the high level nature of
the analysis, and therefore it is possible that optimisation could be beneficial. Sensitivity analysis on the baseline
results shows that:
a 20% increase in electricity revenue price (equivalent to 1.2p / kWh extra) could increase the IRR to
around 7.5% for the baseline Phase 1 scheme. This would attract public sector investment.
A 20% reduction in capital costs (representing either a real cost reduction, or input of funding from grants of
local sources such as CIL) would result in an IRR of 6.6% for the baseline Phase 1 scheme.
A combination of the above would have greater compound benefits.
The CO2 reduction in heat supply is around 25% in all options. This is calculated based on future electricity grid
CO2 carbon intensity projections from the UK Government. It is believed these de-carbonisation projections are
reasonably optimistic and therefore in reality, the CO2 savings for the DE scheme are likely to be higher.

AECOM Final Report 7
Capabilities on project:
Building Engineering
The key economic and environmental results for Phase 2 are:
Phase 2 – Medium term Units Base Case
Variation 1
Variation 2
Variation 3
Variation 4
Variation 5
Network
Network length m 5245 5245 5250 4675 5380 5245
Total network capacity kW 42,850 42,850 45,400 39,188 42,850 42,850
Economic performance
Total Capital Cost £million 22.2 23.0 23.4 19.7 22.3 19.5
CHP capacity MWe 7.9 7.9 8.9 7.9 7.9 N/A
Energy centre boilers capacity MW 43.1 43.1 45.6 39.4 43.1 43.1
IRR (indexed) 25 years % 3.9 3.4 4.3 4.2 3.9
0 (0.45
with RHI)
Environmental Performance
10 year carbon saving % 12% 12% 12% 12% 12% 45%
The phase 2 schemes all provide IRRs of around 4% except for the river water heat pump option which drops to
0.45% even with RHI income. These IRRs include investment in the entire network (including the Phase 1
components), and so if the phase 1 component is considered to be partially paid back, then the effective IRR would
increase further. The stability of the IRRs across the variations demonstrates that the Phase 2 options are not
critical when defining phase 1 of the network.
The key economic and environmental results for Phase 3 are:
Phase 3 – Long term Units Base Case
Variation 1
Variation 2
Variation 3
Variation 4
Variation 5
Variation 5
Network
No CHP CHP
Network length m 9,700 10,600 8,500 7,285 9655 9800 9800
Total network capacity kW 94,500 97,200 50,000 93,400 94,500 94,500 94,500
Economic performance
Total Capital Cost £million 49.7 51.0 33.5 45.5 43.1 43.7 45.3
CHP capacity MWe 20.1 20.1 9.7 20.1 20.1 N/A 3.0
Energy centre boilers capacity
MW 95.5 98.3 50.9 95.5 95.5 95.5 95.5
IRR (indexed) 25 years % 4.9 4.6 0.5 6.1 6.9
0 (0 with RHI)
0 (1.2 with
RHI)
Environmental Performance
10 year carbon saving % -29% -33% -34% -33% -33% 58% 43%
The IRRs for the long term Phase 3 network improve over the initial 2 phases with up to around 6% for an optimised
network (this includes removal of a section of the ring main which is poorly utilised - variation 3). As with Phase 2,
some of the capital for Phase 2 and 1 will have been paid off and therefore the effective IRRs of this later phase will
be higher – if is assumed that only the network costs for Phase 3 need to be paid off then the IRR increases to 6.9%
(variation 5). The heat pump options are not predicted to be cost effective as a single heat source, but with
additional CHP generation included in the scheme (a relatively small contribution), an IRR of 3% is achieved with
RHI income.

AECOM Final Report 8
Capabilities on project:
Building Engineering
Energy centre locations
Finding land for an energy centre/s will be critical for the development of DE in RBK. In the short term, a phase 1
network could make use of distributed boiler plant, and a central CHP engine either at the Kingston University
Penrhyn Road campus, the Surrey County Council buildings, or if completed in time, the redeveloped Kingfisher
Leisure centre. An alternative location is on existing surface car parking in the Eden Quarter, which would allow the
development of a larger centralised energy centre, which could also be used to power a phase 2 scheme.
The main long-term option for an energy centre is in the Hogsmill Valley area, either on RBK land or on the Thames
Water STW site. This provides opportunities for using secondary heat from the STW outlet in a large heat pump for
future phases. The location of an energy centre in the Hogsmill Valley, in an area which can potentially connect to
the STW outlet, should be seen as a priority for the forthcoming Hogsmill Valley AAP.
If heat pumps are to be a long term strategy taking secondary heat from the River Thames, a location is also
required along the river bank. Therefore suitable locations, including potentially as a future addition to the power
station site, need to be identified and promoted through planning.
Conclusions
These results all demonstrate that there are potentially viable short, middle, and long term DE options in Kingston
Town Centre. Phase 3 demonstrates that the viability of the scheme improves with size, and whilst the phase 1
scheme gives lower IRRs, the assumptions used in this EMP are conservative and it is anticipated that optimisation
of the network at the detailed feasibility stage combined with improvements to the electricity revenue (though either
on-site electricity sales, or improved licence-lite rates) could increase the IRR to public sector investment levels or
better.
A phase 1 scheme is connected to primarily public sector customers which helps de-risk the initial investment and
should allow the establishment of long-term heat supply contracts. The scheme could make use of a centralised
energy centre providing all heat, potentially based on the RBK owned land in the Eden Quarter which allows for
future expansion. Alternatively it could make use of existing boilers for peak and back-up heat supply with a smaller
energy centre for the CHP and associated equipment. The latter could be a temporary solution prior to a longer
term central energy centre, and have the plant located at potentially the County Hall or Kingston University Penrhyn
Road site amongst others.
Future phases of a DE scheme have a number of options which will need further investigation following the
establishment of a phase 1 scheme. A key issue to address for future phases is the transition in heat supply
technologies from gas-fired CHP to heat pumps. Future work is required to examine in more detail the feasibility of
heat pumps taking secondary heat from the Hogsmill outlet and the river Thames, and this will also need to consider
the future changes in the electricity grid carbon intensity. Alongside the transition of heat supply technologies, future
phases of a network will also need to consider lower temperature regimes to allow the distribution of the lower
temperature heat from heat pumps, whilst meeting the customers heating demands.
Recommendations
This report identifies that a DE scheme could be viable in Kingston Town Centre providing environmental and
economic benefits. In particular, the report identifies a potentially feasible Phase 1 scheme. Therefore the
following recommendations are made:
The Council review the report’s findings and decide whether there is sufficient evidence for taking the next
steps in its development
If positive the Council should undertake more detailed feasibility studies for Phase 1 and examine the
various business structures available to them to implement the project, including the use of their own capital
resources or borrowing facilities
A full business plan should then be established for which backing can be sought from all stakeholders within
the Council and outside
A Programme Board should then be established to take the project forward.

AECOM Final Report 9
Capabilities on project:
Building Engineering
1.1 Background
The Royal Borough of Kingston upon Thames (RBK) has set a 2020 vision within the Kingston Plan that the
Borough will be sustainable, prosperous and inclusive, and safe, healthy and strong1. The first theme of a
sustainable Kingston sets a number of objectives, the first of which commits the Borough to tackling climate change.
To help deliver this objective, RBK developed an Energy Strategy in 20092. This addresses energy issues under the
Council’s varied roles; that of Community Leader; that of Local Planning Authority; and that of Service Provider and
Asset Holder. Four ways to deliver the Energy Strategy have been identified:
Reducing the unnecessary use of energy
Using energy efficiently
Using renewable and cleaner energy
Getting more from conventional supplies, e.g. Combined Heat and Power.
Following the Energy Strategy, a detailed heat mapping exercise (2010) was conducted as part of the GLA’s
Decentralised Energy Master Planning (DEMaP) programme, aiming to produce heat maps for all London boroughs,
and identifying opportunities for District Heating (DH) networks 3. The heat map study identifies a number of
potential clusters of buildings which may be suited to DH development, in particular the Kingston Town Centre Ring
(which includes the Hogsmill area and sewage works).
The importance of DH and the benefits it can provide to Kingston in terms of energy security, fuel poverty, and CO2
emissions reduction is addressed in the latest Core Strategy4. Decentralised Energy (DE) features strongly as part
of the 2027 Vision, and a number of the policies set out requirements and strategies for the identification and
development of DH schemes, including the requirement for new developments to connect where viable:
Core Strategy Policy DM2 Low Carbon Development:
Independent Renewable Energy Generation
The Council will consider all applications for independent renewable energy installations favourably, subject
to other Core Strategy policies.
The development of energy generating infrastructure will be fully encouraged by the Council providing that
any opportunities for generating heat simultaneously with power are fully exploited.
District Heating
The Council will seek to develop District Heating Networks in the following areas identified as being suitable
for the establishment of a combined heat and power network (as outlined in Figure 15):
Kingston Town Centre
The Hogsmill Valley Area
1 RBK Kingston Plan: Kingston’s Vision for 2020. 2008.
2 RBK Energy Strategy. 2009
3 Royal Borough of Kingston-Upon-Thames Heat Mapping Study. URS. 2010.
http://www.londonheatmap.org.uk/Content/uploaded/documents/Heatpmap_Report/Kingston_Heat_map_FINAL_resize.pdf 4 RBK Local Development Framework: Core Strategy. Adopted April 2012.
1 Introduction

AECOM Final Report 10
Capabilities on project:
Building Engineering
Tolworth Regeneration Area.
Where relevant, development proposals in these areas should undertake the following when a District
Heating Network is:
Not in place: major developments should undertake a detailed investigation into the feasibility of
establishing a District Heating Network with the proposed development as an anchor heat load or contribute
towards such feasibility work.
Planned: make all reasonable efforts to ensure the proposed development will be designed to connect to the
planned District Heating Network without any major changes to the development. When the network is in
place, the development should be connected, unless it can be demonstrated that there is insufficient heating
demand for an efficient connection.
Present: connect to the District Heating Network and make all reasonable attempts to connect existing
developments in the vicinity to the network, unless it can be demonstrated that connection of existing
developments will not result in CO2 savings.
The Council is now keen to progress the findings of the Heat Map to support its planning policies and energy
strategy and to influence future development proposals, working alongside the Greater London Authority’s
Decentralised Energy Programme Delivery Unit (DEPDU). To that end, this Energy Master Plan (EMP) study has
been commissioned from AECOM by the Council, to consider specifically:
Kingston Town Centre (KTC), and;
Tolworth Regeneration Area.
1.2 The benefits of Decentralised Energy
The present system of energy generation in the UK is relatively inefficient. Electricity is generated centrally,
resulting in electricity transmission losses, and large amounts of waste heat from power stations which are currently
not used. Heat is usually generated at a building scale which means that only small scale technologies can be used
(most commonly gas boilers), and limiting the other forms of heat generation technologies which can be
incorporated at a building scale. By localising electricity generation and generating and capturing heat at a larger
scale for distribution, it is possible to improve efficiencies through the capture of waste heat and reduce electricity
losses.
A key component of a Decentralised Energy (DE) scheme is a DH network. This provides opportunities for
capturing the heat and distributing to a number of customers. The generation of heat at a larger scale, and linking
many buildings, allows alternative and more efficient forms of heat generation to be used which would not be viable
at a building scale, the capture and delivery of waste heat, and the simple transition to new technologies (rather than
retrofitting to many individual buildings).
District Heating is a system of insulated pipes which distribute hot water from a centralised boiler or other heat
generation plant to a number of different buildings to provide space heating and hot water. Schemes can range in
size from simply linking two buildings together, to spanning entire cities. In some continental European countries
the use of DH is widespread – in Denmark around 60% of the country’s heat load (and 60% of homes) are
connected to heat networks, including a scheme supplies the whole of Copenhagen.
The use of DE in Kingston, comprising the DH networks and energy generation plants at a district scale offers many
potential benefits to the Borough:
CO2 savings. The combination of more efficient generation and the ability to use alternative technologies
and fuels means that DE schemes can provide large CO2 reductions to communities.

AECOM Final Report 11
Capabilities on project:
Building Engineering
CO2 cost savings. Policies such as the CRC Energy Efficiency Scheme place a value on CO2 emissions
(effectively a carbon tax) and it is expected that such policies may increase in future as the pressure to
reduce emissions increases. Therefore a reduction in CO2 will also provide economic benefits.
Reduction in energy prices. The efficiencies can allow reduced energy costs for customers. Often the price
of heat is linked to gas prices with a discount (see section 7) providing long term cost reductions. This can
provide commercial benefits to commercial customers, and fuel poverty alleviation to households.
Energy security. The higher efficiencies combined with the ability to provide alternative forms of heat
generation (for example from large heat pumps or energy from waste) means that DE improves energy
security, and reduces reliance and long term lock-in to gas.
The above benefits are at a high level, and could be broken down into sub-levels, for example economic benefits
can be realised in a range of forms, and in different ways to different customers.
Whilst a scheme can provide a range of benefits, it is important at the outset when developing a scheme to establish
the priorities. This will in turn guide the design and configuration of a scheme, and the commercial versus
environmental drivers.
1.3 The purpose of this study
The purpose of this study is to establish an EMP based on DE serving KTC and Tolworth Regeneration Area TRA.
The aim is to determine the extent of a DE system that has the potential to supply market competitive, low carbon
energy to new developments and existing properties.
As noted above, our work has built on an earlier report “Royal Borough of Kingston-Upon-Thames Heat Mapping
Study”, prepared by URS in 2010.
Our overall approach has been to consider the nature and scale of the existing and potential future energy demands
in Kingston to identify how these might be best served by a DE network in the longer term – in 40 years time, using
energy modelling. Working back from this, we have considered the energy loads at existing buildings and likely
loads for identified redevelopment sites to inform how an appropriated DE network could be developed and supplied
over the next 10-15 years – the medium term.
The project outputs are therefore:
Proposals for Phase 1 DE scheme, supported by a map showing the location of the Energy Centre and the
layout of the District Heating Network
A set of next steps for the Council, to support the project moving forward
In addition, AECOM will provide additional support to RBK though analysis of the impact of additional sites over the next year.
The supporting work is presented in Sections 2 – 11 as described below:
Review of existing information to gain an understanding of the existing sources of information in the two
target areas – Section 2
A scoping assessment of the potential customers and sales, network layout options, technology options,
potential locations for an Energy Centre/s, and phasing of networks – Section 3
A review of the available energy producing technologies – Section 4
An assessment of the potential customers for connecting to a DE scheme - Section 5
Identification of the energy loads and estimation of the current and future energy5 demand and supply
balance – Section 5
Assessment of potential energy distribution options – Section 6
5 Electricity, space heating and hot water

AECOM Final Report 12
Capabilities on project:
Building Engineering
Consideration of issues and options around the selling of heat and electricity – Section 7
Analysis of proposed schemes in terms of environmental and economic performance – Section 8
A high level risk assessment – Section 9
Indicative project plan and next steps– Section 10
Conclusions and recommendations – Section 11

AECOM Final Report 13
Capabilities on project:
Building Engineering
2.1 Introduction
This section provides an overview of relevant existing available information which will be used to inform the Energy
Master Plan study. This includes information about existing energy uses within the Borough and changes which
may affect energy demand. It also includes a review of other factors which may influence the development of a
distributed energy network within the Borough. Analysis of these sources of information is provided throughout this
report.
2.2 RBK Heat Mapping Study (2010)
A study was conducted in 2010 by URS to develop a heat map of RBK to support the London DEMap programme.
The information generated as part of this study was used to input to the London Heat Map to supplement the
London-wide mapping work conducted.
The RNK Heat Mapping study makes use of a range of data capture and analysis techniques:
Analysis of GIS datasets providing information on building location, use, and type.
Analysis of datasets providing information on energy consumption and CO2 emissions across a range of
buildings.
Conducting surveys to acquire data from specific buildings relating to energy consumption
Assessment of energy demand using benchmarks where specific data is not available.
One to one consultation with key stakeholders
As the most recent and comprehensive assessment of heat demand in RBK, AECOM have used this study as the
prime source of data. Alongside the capture and presentation of heat demand data, the study provides an analysis
of the potential for DE schemes using a cluster process. By assessing groupings of buildings, and forming these into
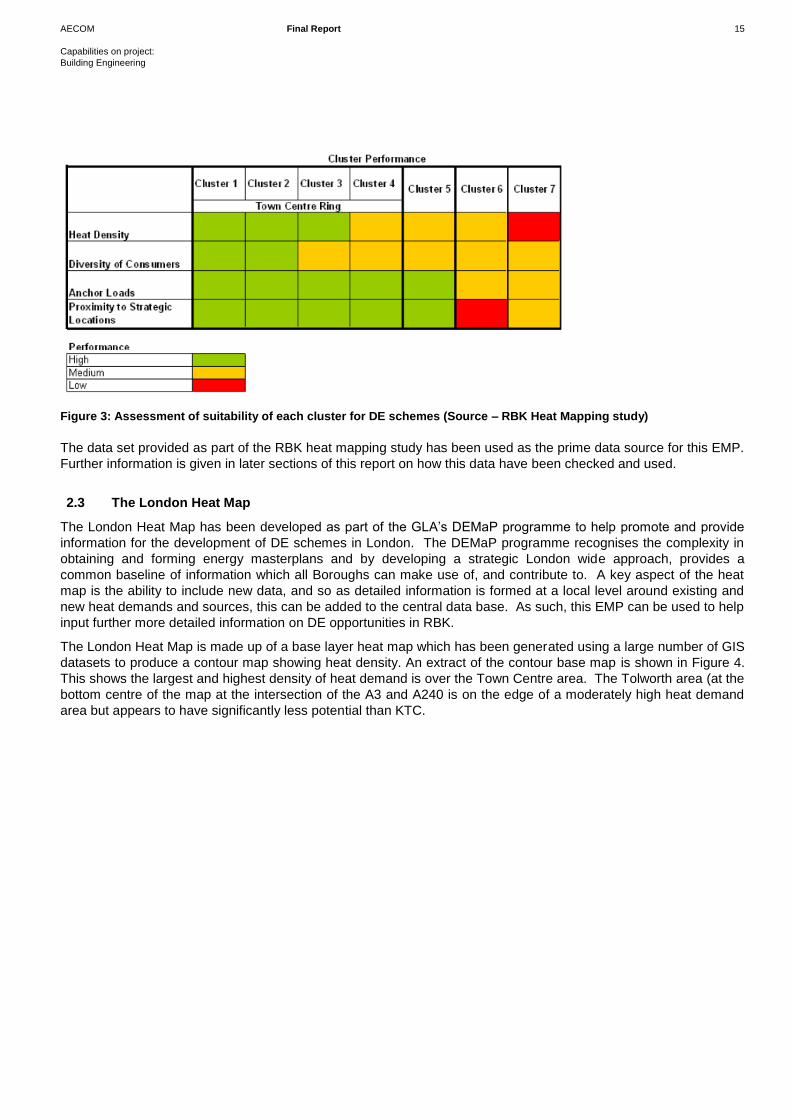
clusters, each cluster is assessed against a range of metrics to ascertain the suitability of DE in each area. Figure 2
shows a copy of the RBK Heat Mapping study cluster map, and Figure 3 the assessment of suitability of clusters for
DE.
The cluster map shows a ring of clusters in the town centre area and the simple assessment of suitability suggests
that these clusters may be suitable for a DE scheme. Importantly the cluster map does not indicate a cluster of
buildings in the Tolworth area, and only identifies one large heat demand, Tolworth Tower. The selection of
Tolworth for inclusion in this study is therefore not based on existing heat demand but future regeneration.
2 Review of existing information

AECOM Final Report 14
Capabilities on project:
Building Engineering
Figure 2: The RBK Heat Mapping study cluster map showing groupings of buildings where DE opportunities may exist.
AECOM Final Report 15
Capabilities on project:
Building Engineering
Figure 3: Assessment of suitability of each cluster for DE schemes (Source – RBK Heat Mapping study)
The data set provided as part of the RBK heat mapping study has been used as the prime data source for this EMP.
Further information is given in later sections of this report on how this data have been checked and used.
2.3 The London Heat Map
The London Heat Map has been developed as part of the GLA’s DEMaP programme to help promote and provide
information for the development of DE schemes in London. The DEMaP programme recognises the complexity in
obtaining and forming energy masterplans and by developing a strategic London wide approach, provides a
common baseline of information which all Boroughs can make use of, and contribute to. A key aspect of the heat
map is the ability to include new data, and so as detailed information is formed at a local level around existing and
new heat demands and sources, this can be added to the central data base. As such, this EMP can be used to help
input further more detailed information on DE opportunities in RBK.
The London Heat Map is made up of a base layer heat map which has been generated using a large number of GIS
datasets to produce a contour map showing heat density. An extract of the contour base map is shown in Figure 4.
This shows the largest and highest density of heat demand is over the Town Centre area. The Tolworth area (at the
bottom centre of the map at the intersection of the A3 and A240 is on the edge of a moderately high heat demand
area but appears to have significantly less potential than KTC.

AECOM Final Report 16
Capabilities on project:
Building Engineering
Figure 4: Extract of the London Heat Map showing the contour base map of heat density for the KTC area (top of image) and Tolworth area (bottom centre – green dot).
Figure 5 and Figure 6 show the heat maps with potential anchor heat loads identified – these are primarily based on
the information gathered during the RBK Heat Mapping study, and closely mirror the map shown in Figure 2. On
first inspection, the KTC area appears to have a large number of opportunities, whilst the Tolworth area appears to
be extremely limited. Most significantly, the purple areas indicate those which are deemed to have some form of
potential for DE – these are only shown on the KTC map.

AECOM Final Report 17
Capabilities on project:
Building Engineering
Figure 5: Opportunities in the KTC area. The size of the icon indicates the relative heat demand, and the shape and colour denotes the type and ownership of the building.

AECOM Final Report 18
Capabilities on project:
Building Engineering
Figure 6: Opportunities in the Tolworth area. The size of the icon indicates the relative heat demand, and the shape and colour denotes the type and ownership of the building.
2.4 Kingston Town Centre Area Action Plan
The Kingston Town Centre Area Action Plan (K+20 AAP) is part of the Local Development Framework and was
adopted in 2008, and sets out planning policy for KTC to 20206. From inspection of the K+20 AAP, it is clear that
there are ambitions for extensive re-development over the next decade, with new homes, retail, and student
accommodation, including a range of other infrastructure and landscaping modifications. These opportunities could
provide the catalyst for developing a DH scheme, by providing initial anchor loads and networks from which the
main network can extend. Redevelopment may also open up opportunities for identifying land suitable for hosting
an energy centre; something which can act as a constraint on network development. It is also possible that other
infrastructure works (such as roads) offer opportunities for combining works and minimising disruption.
6 RBK K+20 Kingston Town Centre Area Action Plan. Adopted July 2008.

AECOM Final Report 19
Capabilities on project:
Building Engineering
An important component of the K+20 AAP is the 2020 vision which identifies key development and re-development
opportunities in the town centre area (see Figure 7). This is used in this study to inform both the new development
opportunities which may connect to a DE scheme, and land for locating an energy centre. Accompanying the K+20
AAP, AECOM have been provided with a schedule of opportunity sites relating to the sites in the Vision diagram –
this provides updated information on the status of each site.
Overall the information provided in the K+20 AAP and the schedule of sites is either of relatively detailed nature (due
to either completion or planning application received or imminent), or very high level with quantum and type of
development very uncertain.

AECOM Final Report 20
Capabilities on project:
Building Engineering
Figure 7: Kingston Town Centre Area Action Plan Vision diagram.

AECOM Final Report 21
Capabilities on project:
Building Engineering
2.5 Kingston Infrastructure Delivery Plan
The Infrastructure Delivery Plan has been developed as part of the LDF to identify existing and planned
infrastructure and assess the need for further infrastructure to meet the needs of the Borough with new
development.
In relation to this study, it provides information on:
Sustainable Energy networks (although it does not make recommendations due to the need to conduct an
EMP study)
Waste Management
Water treatment
The Hogsmill Valley open areas
Healthcare
Further information on the last four items has been obtained with consultation.
2.6 Tolworth Regeneration Strategy
The Tolworth Area is dominated by Tolworth Tower which is a 1970 building 22 storeys tall and comprising
commercial and retail space. This sits at the junction between the Tolworth Broadway (A240) and the main A3 into
central London. The Tolworth Regeneration Strategy was developed to set a vision for improving and enhancing
the area, and realising social, economic, and physical regeneration.
Figure 8 provides an overview of the strategy. Many of the proposals are based around the improvement and re-
development of open and public spaces to improve biodiversity, reduce transportation impacts, and generally
increase the amenity benefits to residents. Most significant of these are the Tolworth Broadway Greenway project
which is currently under construction and is introducing new pedestrian and cycle routes along the Broadway and
across the A3 to improve the Broadway for users, reduce the impact of cars, and improve access to open land to the
South of the A3.
Of interest to this study, the strategy makes reference to the following sites:
Tolworth Tower (Site 1). Reconfiguration and additional development
Red Lion Public House (Site 2). Mixed use re-development including ground floor commercial and circa 50
flats. This is now under construction.
Tolworth Hospital (Site 4). Some redevelopment.
Former Government offices, Toby Jug PH, and Marshall House sites (Site 5). Redevelopment into mixed
use comprising Tesco supermarket, hotel, and residential.
12 Kingston Road (Site 9). A 142 bedroom hotel and conference facilities.
Jubilee Way / Kingston Road (Site 10). Indoor leisure facilities and potentially a hotel.
Apart from a planning application for the Tesco development (Site 5), and knowledge that the Red Lion PH site is
under construction / completed, no further information has been obtained on the other sites, and there is no certainty
over their delivery outside of the strategic vision.
Further discussion of these sites is provided in section 3.3.2.

AECOM Final Report 22
Capabilities on project:
Building Engineering
Figure 8: The Tolworth Strategy

AECOM Final Report 23
Capabilities on project:
Building Engineering
2.7 Summary
This section provides an overview of existing work and potential sources of information which can inform the EMP.
The most significant report and datasets are from the RBK heat mapping study which is being used as the basis for
this EMP. This identifies the key loads, and proposes areas of interest for DE scheme development, mainly the
KTC area. The datasets from the RBK study are assessed later in this study with updates and amendments where
required.
The K+20AAP outlines a number of redevelopment opportunities and proposals in the KTC area. These may
provide opportunities for connecting to a DE scheme, or opportunities for the development of an energy centre.
Land is at a premium in Kingston and so important strategic decisions will need to be made for energy centre
provision.
The Tolworth Regeneration strategy shows that whilst there are a number of opportunities in the area for
redevelopment, these are relatively small, and in some cases dispersed. These are assessed later in this report.
Further information of relevance which has been obtained for the purpose of this EMP is described later in this
report and Appendices.

AECOM Final Report 24
Capabilities on project:
Building Engineering
3.1 Introduction
This section provides an overview of the opportunities and constraints present in the Borough. Using this
information, some high level scheme concepts have been developed covering the potential for DE development
across the Borough, the extent of early phase networks, and energy supply options. This analysis is used to inform
the feasibility assessments set out later in this report.
3.2 Scoping assessment
The development of short-term, medium-term and long-term visions for DE within the Borough requires the
consideration of a number of factors which will help inform the nature of schemes proposed. It is impossible to
state, at the feasibility stage, how DE schemes will develop across the Borough over the next 40 years, or indeed
whether any schemes will develop. Nevertheless it is possible to develop high level concepts from the assessment
of a number of factors which influence the viability of schemes.
The scoping study of the opportunities and constraints, which enables the development of a framework against
which the more detailed analysis and development of the EMP can take place, needs to consider:
The size and type of potential customers including their energy demand characteristics, energy purchasing
characteristics, and location within the Borough.
Potential changes to the customers, including removal of existing customers and the creation of new
customers, through development and regeneration.
The presence of existing potential heating infrastructure, including DHNs and heat sources, and their
location.
Opportunities for routing DH pipework, with a view to identifying those routes which may be less disruptive
and have a lower cost.
The availability of land for an energy centre.
The phasing of the network taking into account the size of the scheme and the period over which it will
operate.
As outlined in the introduction, this EMP study is primarily examining opportunities for DE development in the Town
Centre and Tolworth regeneration areas. However it also makes reference to a wider vision for DE in terms of
future phasing.
3.3 Customers and sales
The size and types of customer can have a significant impact on the development of DE schemes. In general, ideal
customers have a large heat load factor and large annual demand, have an existing heating system which is
compatible for connection to a DHN, are willing to sign long-term heat supply contracts to purchase heat, and are in
a location suitable for connection in an economic and technically viable manner. The mix of customers is also
important and whilst the heat demand profile of any one building is not critical, the scheme will benefit from a
diversity of demands which when combined will result in a more continuous requirement for heat throughout the day
and throughout the year.
Private sector customers will usually require a commercial incentive for connection, based on an attractive heat
tariff. They will also be less comfortable with long-term contracts, and the potentially transient nature of commercial
organisations means that they can present a risk to the network if they move. In addition the relation between
landlord and tenants needs considering: the landlord may make decisions over heating systems and sources, whilst
the tenant pays the bills, therefore the incentive for lower cost energy does not act on the decision maker unless this
3 Scoping assessment

AECOM Final Report 25
Capabilities on project:
Building Engineering
improves the rental value of the property. Therefore the commercial sector is not ideally suited to the first phase of
DHN scheme when future certainty over revenue is important.
Public sector and quasi-public sector organisations, such as local authorities and colleges, are more suited to
connection in the early phases. They will generally take a less commercial approach, and whilst an attractive tariff
will be important, they will probably accept a lower level of benefit compared with their baseline solution as they will
also factor in the benefit of CO2 savings. They will also be more willing to enter into long-term supply contracts,
providing sufficient guarantees can be provided.
The longevity of public sector and quasi-public sector clients and their buildings also provides security for DHN
development – in general organisations such as Councils, Universities, and Colleges retain buildings and sites over
a long period of time.
3.3.1 Town Centre customers
The RBK Heat Mapping study identifies a number of clusters, with Clusters 1 – 4 and intermediate loadsmaking up
the Town Centre area in the form of a ring (see Figure 9). The clusters can be characterised as follows:
Cluster 1 covers the main retail centre. It is predominantly made up of large private retail consumers, in
particular the Eden Walk shopping centre, Bentalls (and the neighbouring Bentalls shopping centre), the
David Lloyd Gym, John Lewis, and Marks & Spencer. The study also identified some high heat demand
residential units at Regents Court to the north of the area. To the south of Cluster 1 are the RBK Guildhall
Offices (including blocks 1 and 2), and Kingston College. The cluster also includes a number of other
smaller loads, predominantly private sector owned. clusters
Cluster 2 lies south of Cluster 1, and primarily consists of County Hall, and two Kingston University sites
(Penrhyn Road and Knights Park).
Cluster 3 is to the east of Cluster 1 and contains mainly smaller loads, predominantly Bausch and Lomb
House (UK headquarters) and Tiffin School.
Cluster 4 lies to the east of the town centre ring and consists of RBK housing on the Cambridge Road
Estate which has 600 social housing units.
The Town Centre ring presents a large number of potentially significant customers from both the private and public
sector, and therefore potentially a good customer base for developing a DHN. However the majority of the large
loads in Cluster 1 are privately owned existing retail units, and unless a very attractive commercial proposition could
be provided with low cost heat, there will be significant challenges in ensuring these customers sign long-term
purchase contracts. Furthermore, the RBK Heat Mapping study does not include detailed information on the nature
of the existing heating systems, and in general, shopping centres such as Bentalls and Edenwalk have separate
(usually electric) heating systems in each retail unit, with relatively little heating demand for the shopping centre
communal areas. The retail element of Cluster 1 therefore suggests that the best potential lies in the RBK Guildhall
Offices and Kingston College to the south, and potentially the David Lloyd Gym if a suitable heating system exists.
There is a large public sector and quasi-public sector concentration of loads to the south in Cluster 2, and the RBK
housing at the Cambridge Road Estate in Cluster 4. The co-location of Cluster 2 to the Guildhall and College could
provide a strong opportunity for early DHN development in the Penrhyn Road and Kingston Hall road area. Whilst
the Cambridge Road Estate is further away, the addition of the residential heat load provided by 600 units could be
beneficial to the scheme performance, providing summer DHW and evening space heating loads.
The other smaller loads identified in all clusters and outside the clusters are likely to be too small to significantly
impact on the EMP, and therefore unlikely to influence the DHN layout. However if the existing heating system is
connectable and located in a convenient area, other buildings may be suitable for connecting in Phase 1 or future
phases.
In addition to the existing heat loads, a number of areas have been identified for future redevelopment in the town
centre. These are primarily the Gas Works site to the north of Cluster 1, and the Eden Walk site to the south east of

AECOM Final Report 26
Capabilities on project:
Building Engineering
Cluster 1. Whilst the exact nature of these two sites is uncertain, planning requirements could be used to
encourage these to connect to a network where demonstrated to be viable.
Outside of the clusters and the main town centre area, low rise residential housing is the predominant land use.
Figure 9: Map of the Borough showing the heat loads and clusters identified in the RBK Heat Mapping study. Source – RBK Heat Mapping Study

AECOM Final Report 27
Capabilities on project:
Building Engineering
3.3.2 Tolworth customers
The Tolworth area is around 4 km to the south of the town centre and is divided by the A3 and A240 main roads
(see Figure 8). Tolworth was not identified in the RBK Heat Mapping study as a cluster, neither does it appear to
have potential from the London Heat Map, and has only one large energy consumer identified, Tolworth Tower.
This is a 22-storey mixed use development comprising office space, retail, a hotel, and entertainment facilities. The
surrounding area is predominantly low rise semi-detached and terraced housing, but there is also a small NHS
hospital specialising in mental health owned by South West London and St George’s Mental Health Trust.
The Tolworth area has been identified for inclusion in this EMP due to a number of re-development opportunities in
the area and the need to invest here to attract new business. The re-development opportunities include (see section
2.6):
The Tolworth Tower complex, to provide increased residential, commercial, retail, and entertainment
facilities.
Re-development of the former Government Offices, Toby Jug Public House (PH) and Marshall House site
which sits to the south of Tolworth Tower on the other side of the A3 / A240 intersection. This will include a
new 3400m2 Tesco store, 275 flats and houses, a leisure centre, and hotel (hereafter referred to as the
‘Tesco site’).
Re-development of the no. 12 Kingston Road site with a new hotel and associated facilities.
Re-development of the Red Lion PH site with 50 flats and commercial and entertainment facilities.
Re development of Jubilee Way for indoor leisure facilities
Re-structuring of the A240 to provide a central green corridor and pedestrian and cycle links over the
existing A3 roundabout.
With respect to the existing buildings, any potential for DE centres on Tolworth Tower due to the absence of other
large heat demands at present. An extension of DE from Tolworth Tower will require DHNs to be developed in low
density areas linking relatively small sites, and predominantly low rise housing. If DE in low rise residential areas
becomes viable, this could provide a large potential for connection, but this is unlikely in the shorter term.
Nevertheless, the scale of Tolworth Tower suggests a DE scheme could be developed solely for the building,
justifying the development of a building scale CHP scheme. However this would not be a community project, but a
commercially-led scheme by the Tower owners, Stevenor Investments.
The new development sites may increase the opportunity for DE development, in particular the Tesco site and the
hotel, and leisure centre. However at present no information is available on when and if the hotel and leisure centre
will be delivered, and whilst they are adjacent to each other, they are distant from the Tower. The Tesco site
development proposals already include a site-wide DHN and gas-fired CHP system (300kW) which has been sized
for meeting the baseload heating demands7. There is therefore little benefit in linking a scheme at Tolworth Tower
to the Tesco site, and the Tesco site system will be significantly smaller than would be needed to justify a
connection to Tolworth Tower. The opportunity provided by the Tesco site is therefore perhaps a future opportunity
with a link at a later date, should a DE scheme be developed in the vicinity, potentially as part of a wider scheme
from outside of Tolworth.
The other sites identified in the Tolworth Regeneration strategy are all small in scale and too distant from the Tower
area to justify connection to a scheme, unless a scheme is developed which is viable in low density areas in the
future.
Overall the potential in the Tolworth area appears extremely limited with any scheme being based around the two
key sites of Tesco’s, and Tolworth Tower, but with seemingly little benefit to each for connecting these sites together
with a DH network. Other sites are either too small, or uncertain/unknown to be viable for connection.
7 Hook Rise, South Tolworth. Environmental Sustainability Statement: Appendix 4 Energy Statement. URS for Tesco Stores LTD.
2012.

AECOM Final Report 28
Capabilities on project:
Building Engineering
3.3.3 Identification of customers through mapping
In addition to the use of existing mapping from the RBK Heat Mapping study and the London Heat Map, AECOM
have conducted some additional mapping to inform this EMP. Using GIS datasets from national statistics, the
following attributes have been mapped across the Borough:
Dwelling density. Using national statistics dataset “Dwellings, Household Spaces and Accommodation Type
(KS401EW)”, the density of dwellings at Output Area level has been mapped. The density of dwellings can
be used as a proxy for DHN suitability, with high density areas showing where DHNs are likely to be mode
viable. (see Figure 10)
Percentage of flats. Using national statistics dataset “Dwellings, Household Spaces and Accommodation
Type (KS401EW)”, the percentage of flats within each Output Area level has been mapped. As with
dwelling density, this can be used as a proxy to identify areas where a DHN may be more viable. (see
Figure 11)
Percentage of social rented dwellings. Using national statistics dataset “Tenure (KS402EW)”, the
percentage of dwellings in each Output Area which are social rented has been mapped. This can help
identify areas where higher uptake of connections to a DHN could be achieved through a small number of
landlords. (see Figure 12).
The mapping as expected closely mirrors the London Heat Map (which will also make use of these datasets).
However it provides a clear and transparent set of metrics which can be used to help identify the potential
opportunities for developing DHNs.
In all of the maps, the Cambridge Road estate is apparent with a high density, large number of flats and high levels
of social rented tenure (all in RBKs ownership). However other areas can also be observed which may be of
interest to future phases of a network including:
Flats located to the north of the Borough on Kingston Hill, at Kingsnympton Part Estate showing high
density and moderately high levels of social rented tenure. These may be of interest if the hospital
becomes part of a wider scheme or if excess heat is available at the hospital for a smaller localised network.
Parts of Surbiton (including one area with very high social rented tenure around School Lane off Red Lion
Road).
Part of New Malden at Newhouse Close (although with low levels of social rented tenure).

AECOM Final Report 29
Capabilities on project:
Building Engineering
Figure 10: Density of dwellings

AECOM Final Report 30
Capabilities on project:
Building Engineering
Figure 11: Percentage of flats per output area

AECOM Final Report 31
Capabilities on project:
Building Engineering
Figure 12: Percentage of social rented dwellings per output area

AECOM Final Report 32
Capabilities on project:
Building Engineering
3.4 Network layout options
DHNs require suitable routes to be found to install the pipework. Installation of pipes and associated equipment is
expensive and disruptive and therefore the routing needs to be carefully considered to ensure the network is as
efficient as possible; the largest amount of heat needs to be sold over the shortest length of pipework.
Key considerations for the network routing include:
The use of existing ‘corridors’ such as roads and pathways where public ownership enables development.
The use of soft landscaped areas such as verges and parkland to reduce civil engineering works and
disruption to transport routes.
The use of existing utilities infrastructure such as service tunnels.
Making use of above-ground routing where practical. This could be achieved in more industrial areas, or
when pipes can be installed within buildings, such as within blocks of flats, basement car parks etc
Integration of DHN pipework installation with other utilities works to prevent additional digging and
associated disruption and cost.
Alongside the opportunities, some key constraints need to be considered:
Strategic transport routes and intersections where the installation of DHN pipes may cause significant
disruption.
Natural barriers such as rivers, where the network would need to make use of an existing crossing point.
Railway lines which would require the involvement of Network Rail or Transport for London (TfL), and the
associated time delays and costs of crossing or tunnelling under tracks.
Existing major utilities infrastructure which may prevent pipework being installed. In general major
infrastructure elements, such as sewers, are sufficiently deep to not be a problem.
Land ownership. When DHN pipes are routed through private land, agreements will be required with the
landowners, and easements needed for future maintenance and repairs.
At the stage of detailed design for DHNs, the location and routing of existing utilities infrastructure needs to be
considered, and this may impose some constraints on the exact routing of the network. However the mapping of
utilities within roads is of limited accuracy and completeness and their position can only be reliably ascertained
through survey work and extensive examination of available maps. In this EMP, therefore, existing utilities are not
considered as a specific constraint and would need to be considered at design stage.
3.4.1 Town centre network considerations
The town centre of Kingston is largely pedestrianised in the retail areas, with plans for further changes outlined in
the Area Action Plan - K+20 AAP. Using pedestrian routes may result in lower installation costs through a reduction
in the requirement for traffic management and extensive civil engineering works, but it may cause disruption to retail
activities and may attract cost penalties for loss of income. The routing of a DHN to large retail units will need to
consider the installed HVAC plant, which is most likely to be located adjacent to delivery access routes. Therefore
pedestrian routes are unlikely to present a significant opportunity. Parts of the town centre are due for renewal of
the surfacing with new granite setts being installed. Therefore any future network installation in these areas should
aim to minimise disruption to these new surfaces, making use of other utilities works as an opportunity, and
exploring alternative routes.

AECOM Final Report 33
Capabilities on project:
Building Engineering
Around the town centre, the A308 and A307 ring road effectively cuts off the central retail area, and therefore any
DE scheme extending into the main retail centre (including the Guildhall complex) will need to be installed in, or
across, these busy major routes.
To the south of the town centre, in cluster 2 (see Figure 9) Penrhyn Road offers the most obvious route, linking the
Guildhall complex with the College, County Hall, and Penrhyn Road University site. However, alternative minor
roads may also be used through residential areas which would limit disruption to traffic on the major routes. These
routes may even be more efficient from a network layout perspective, but may also limit the long term development
and expansion capacity of the network, as well as causing disruption to residents. Figure 13 shows these southern
town centre locations.
Sites to the north of Cluster 1 will need to consider how to cross the railway around Kingston Station. The road
crossings all pass under the railway through bridges and so crossing the railway may not be a major constraint.
However any infrastructure works close to the foundations of railway bridges require the collaboration of Network
Rail and these routes may be already congested with existing infrastructure. An alternative option could be to route
a network under or over the railway as part of future railway upgrades. The complexities of crossing the railway may
mean this is only considered as part of a strategic DHN route, not simply to connect to a small number of customers
as part of a first phase.
Opportunities for making the railway crossing in combination with other works may include:
- Re-development of the railway station area. Whilst this area is identified in the K+20AAP as an area for re-
development, no further information is available. However it is believed that any re-development options
may include for improved links across the railway and therefore provide an opportunity for network
installation.
- The section of road outside the station where Wood Street meets Clarence Street has been identified for
future re-configuration to improve cycle and walking links to the station. RBK is currently developing a
number of options for this area as part of a submission of cycle network improvements to support the
London Mayors Cycle Vision. It is understood that this may include the lowering of the existing road
carriageways such that cycle and pedestrian access remains at grade, and vehicular traffic lowered. If this
scheme comes to fruition, it will require significant infrastructure reconfiguration in the area and may provide
an opportunity for identifying DHN pipe installation corridors, and if timely, installation of the DHN pipes.
To the east of the town centre lie Clusters 3 and 4, with the latter area presenting the opportunity of connecting a
heat supply to the Cambridge Road Housing Estate. A number of possible routes exist including the main A307 and
A308, or a more minor route along Fairfield Street and Hawkes Road which includes the potential for routing of
pipes in green landscaped areas which may reduce cost..
A further opportunity for a network route is the Hogsmill River. Sections of this are densely developed leaving little
riverside space, but further away from the town centre near the Hogsmill Sewage Treatment Works (STW), the river
opens out with green space which may be suitable for routing the DHN. This could be useful if the Hogsmill STW
site is considered to host an energy centre (see below), by providing a less congested network route into the town
centre. A possible layout is shown in Figure 14 below.
The following schematics in Figure 13 and Figure 14 show indicative network routes for a first phase, and long term
scheme (further details are provided later in this report). It should be noted that for the purposes of this EMP,
indicative network routs have been selected based on the high level constraints identified, and in the case of Phase
1, site visits examining potential connection points. As an example, the network route connecting the Guildhall and
Guildhall 2 is relatively inefficient, but takes into account existing plant location, and the river Hogsmill. It is
expected that a more detailed feasibility study will optimise these connections and layouts.

AECOM Final Report 34
Capabilities on project:
Building Engineering
Figure 13: Map showing southern town centre locations.

AECOM Final Report 35
Capabilities on project:
Building Engineering
Figure 14: Map showing large scale Kingston Town Centre DHN

AECOM Final Report 36
Capabilities on project:
Building Engineering
3.4.2 Tolworth network considerations
The potential customers and sites identified in Tolworth lie along the A240 dual carriageway which crosses the A3
on a bridged roundabout. This is therefore the obvious route for a DHN, and it is the only crossing of the A3 which
would not require civil engineering works across the A3 carriageway itself (see Figure 8). .
The Tolworth Greenway, a scheme to improve public space, has recently commenced construction. This project
aims to improve walking and cycling access to Tolworth along the A240, providing new public spaces, a more
attractive retail frontage, and reducing the impact of vehicles. The works required to achieve this could have
provided an opportunity for safeguarding network routes but the timescales of the EMP and the Greenway works are
not compatible. However a legacy of the Greenway project will be improved routes across the A3 for pedestrians
and cycles and this may provide a future opportunity for routing the DHN away from the main carriageways.
However the routing of a DHN across the A3 using a bridge is likely to incur additional cost.
Outside of the immediate Tolworth Tower area, the roads are predominantly residential, serving 1930s housing. In
some areas, small strips of grass verge are present, but the majority of routes would require any DHN to be located
in the road.
Apart from the small mental health hospital, there are no other identified heating loads nearby. Connecting a
network from Tolworth to other areas would necessitate either long transmission mains to other parts of the
Borough, or expansion to supply existing residential areas and low density commercial buildings.
Overall, the potential for development of DHNs in the Tolworth area appears extremely limited due to the location
and nature of the identified heat loads, and limited scope for expansion. A greater potential may lie in the Tolworth
area becoming part of a wider network, if and when this becomes viable.

AECOM Final Report 37
Capabilities on project:
Building Engineering
3.5 Technology options and potential energy centre locations
3.5.1 Existing technology options
The RBK Heat Mapping study identifies two potential energy sources which may be used as part of a DE scheme:
1. Kingston Hospital. This lies to the north east of the town centre cluster (Cluster 1), around 2km from the
retail centre (see Figure 9). The hospital has recently upgraded its energy systems to include a new
1.4MWe gas-fired CHP system and hot water and chilled water distribution systems8. The hospital is the
largest energy user in the Borough according to the RBK Heat Mapping report, hence the report’s
suggestion that it may also be a major energy provider. However given the recent development of the CHP
and heat network on the site, it is likely that the engines are optimally sized, thus limiting or even preventing
excess heat production. The potential for connection may therefore be extremely limited unless additional
plant was located at the hospital site.
2. Hogsmill Sewage Treatment Works (STW). The STW in the Hogsmill Valley is operated by Thames Water.
It incorporates a 0.94MWe gas-fired engine CHP operating from biogas sourced from the STW. In general,
the energy (electricity and heat) produced by CHP at such a plant is used entirely on site, to power the STW
and maintain temperature in the digester units. Sometimes additional heat may also be required. Therefore
it is not considered that the STW will have a great potential for high grade heat provision. However there
may be potential for accessing secondary heat using a heat pump (see section 4.3.2) .
These potential heat supply sources are discussed in more detail in Section 4.
3.5.2 Standalone technology options – short term
Whilst the DE scheme concept from the outset should consider the long term vision, short term (typically up to 15
years) technologies will be required which can supply heat to early phases of a DE scheme. The scheme may start
as a relatively small network which can then be expanded over a period of years. An energy centre located close to
the network it serves is typically the best option, as long transmission mains for more distant energy centres have a
detrimental impact on the economics (except for very large schemes).
The supply technologies will need to meet the following requirements:
They are currently commercially available and reasonably mature to provide a low risk initial investment.
They are capable of providing CO2 savings in the current UK energy mix (typified by a relatively high grid
electricity CO2 factor)
They can operate economically when connected to the DHN such that the entire DE scheme is deemed
economically attractive for investment, allowing customer benefits.
They can operate at the scale of a DE scheme envisaged for an early phase network and meet the energy
demands posed by the scheme. Modularity may also be important in the build out of a first phase.
They can meet planning constraints imposed by a town centre location, including for example air quality,
noise, visual impact, etc.
They can be hosted on land which is available in a first phase network.
A range of systems are available which may meet these requirements, but the most mature technology, and
potentially the lowest risk and most reliable technology is natural gas-fired CHP. This is compact, flexible, available
in a range of suitable sizes, and suited to modular operation on phased networks. Other variations around gas-fired
CHP may also be suitable including bio-gas sources, gasification, and pyrolysis. However, each of these is less
mature, potentially more unreliable in terms of fuel supply and processing, and potentially less economic in the
absence of incentives.
8 http://carbonandenergyfund.net/content.php?page=kingston_hospital (downloaded 22/03/13) and consultation with the Hospital.

AECOM Final Report 38
Capabilities on project:
Building Engineering
Biomass-supplied energy sources are often viewed as a suitable technology for providing heat for DE schemes and
delivering large CO2 reductions, and potentially economic operation with the Renewable Heat Incentive (RHI).
However the availability of a reliable supply of biomass fuel at an economic price needs to be considered, alongside
the impacts on local air quality and transportation impacts.
The availability and price is of biomass somewhat determined by whether an operator can secure a long-term
supply contract. There is a risk that with future increasing demands for the fuel the fuel price will significantly
increase as total biomass resource is limited. Long-term supply contracts may be available but it is unlikely to fully
offset price risks.Furthermore air quality and transportation issues are inherent problems in an urban environment
and the issue of pollutants is recognided in the Mayor’s Air Quality Strategy9.
Technology options for the short term are examined in detail in Section 4.
3.5.3 Standalone technology options – long term
The selection of technologies for the longer term (typically 20 years or more in the future) is inherently uncertain and
will depend on a number of variables.
Firstly the evolution of the DE scheme needs to be considered, and technology options will need to be selected that
can meet the energy demands of the mature scheme. The network may increase in size, and therefore have a
higher heat demand and baseload. A future technology option could be used to replace existing modular plant, or
even a number of existing energy centres which have been constructed in line with phased extensions to the DHN.
The step change increase in energy loads provided by mature schemes or aggregation of existing plant may open
opportunities for using types of heat generation plant which are not available or viable for smaller schemes.
Alternatively the increase in size may mean that more than one energy centre and more than one technology type is
deployed to provide heat into the system. The increase in network extent may also open up new opportunities for
locating an energy centre, and could potentially justify a longer transmission mains from the energy centre to the
DHN.
Secondly, external factors need to be considered which may influence technology and fuel selection. These include
market conditions for fuel, maturity and development of technology, and the CO2 intensity of the electricity grid. This
intensity effectively determines the CO2 savings from CHP and heat pump based DE schemes. There is uncertainty
around all of these variables and projections are required which present reasonable cases, with the possibility to
examine sensitivities around these.
The CO2 intensity of the electricity grid in particular is important to consider and there are complexities in how this is
dealt with. At the simplistic level:
In the short term (mid to late 2020s) it is expected that electricity generation will continue to be heavily
dominated by fossil fuels and have a relatively high CO2 intensity. Therefore technologies which generate
electricity alongside heat (CHP) can provide large CO2 savings, even when powered by fossil fuels such as
natural gas.
In the longer term, it is expected that the grid will have decarbonised significantly with extensive uptake of
renewable technologies, nuclear power, and potentially carbon capture and storage (CCS). If the CO2
intensity is sufficiently low, then an electricity-sourced technology (such as a large heat pump) could be
most suitable.
The transition period during which the grid will decarbonise has a large number of uncertainties. In addition, an
assessment should also consider not only the average grid CO2 intensity, but the marginal CO2 intensity - this is the
9 Cleaning the Air: The Mayor’s Air Quality Strategy. 2010. It should be noted that whilst there are concerns over biomass use in
London, the Air Quality Strategy suggests measures by which this can be mitigated. The strategy also suggests that emissions from gas fired CHP systems also need to be carefully considered.

AECOM Final Report 39
Capabilities on project:
Building Engineering
intensity of electricity generation based on the marginal technology10
. The marginal plant will typically vary between
night and day, the seasons and the strength of the wind.
Current DECC projections suggest that non-CCS gas CCGT generation (combined cycle gas turbine) may remain in
operation until at least 2050 to provide peak electricity generation11
. Therefore gas-engine CHP schemes operating
at peak times are likely to be offsetting electricity with a gas CCGT emissions factor even in the long-term, and thus
reduce CO2 emissions.
Given these uncertainties, there are a number of options for future technologies:
The use of larger systems suited to aggregated heat demands. This step change may open up a range of
new technologies not suited to smaller early phases.
The use of electricity driven technologies, alongside CHP-based systems.
The use of technologies which make use of alternative feedstocks such as biomass and waste.
The use of a mix of different technology types assuming that a number of heat suppliers are connected to
the network which can operate in response to the marginal generating plant on the electricity system
The use of thermal storage to optimise the contribution from a range of heat sources
Technology options for the long term are examined in detail in Section 4.
3.5.4 Land availability for an energy centre
For the EMP, it is necessary to consider the availability of land in Kingston for an energy centre from the outset.
The area of land required will depend on the size of the scheme and the type of technology selected. The location
will be determined by land availability and the need for a site which can be economically connected to the DHN, and
it will need to be in an area deemed acceptable for the development of an energy centre.
The Borough is a heavily urbanised area, with open undeveloped space at a premium and heavily protected against
development. The borough is also relatively affluent, and there are no areas within the town centre which could be
classed as low-value or vacant and which provide an obvious site. It is therefore likely that any site suitable for an
energy centre will need to be a re-developed area and it is necessary to consider the short term and longer term
uses of available sites.
In the early phases of development, the DE schemes will be relatively small (with a total length of circa 1 – 2 km),
potentially with temporary or phased heat generating plant. The likely size of the schemes will mean that long
transmission pipe runs from an energy centre are probably uneconomic, requiring the energy centre to be located
close to, or within, the DHN. For the Kingston town centre network, this means potentially a town centre location.
The selection of land will therefore need to consider the availability of areas for development, competing uses (and
the implied cost of the land driven by these competing uses), the planning impacts of a town centre location, and the
longer term aspiration for the sites. It is possible that an interim energy centre on a town centre site with a life of say
20 years is acceptable if a longer term location is available to allow further development of the original site for other
uses.
The Hogsmill Sewage Treatment Works (STW) site and surrounding area may provide an opportunity for locating an
energy centre. This area appears to have spare land (both within the Thames Water site, and the wider RBK owned
area), and it is not suited to other forms of residential of commercial development. However the distance between
the Hogsmill STW site to the town centre needs to be considered, as it is approximately 1.2km.
In the longer term, additional energy centre locations, or a larger single location, will need to be found to allow for
expansion of the DH scheme. The timescales may mean that future opportunities arise as land becomes available
for redevelopment and policies can be put in place which allocate and prioritise land for energy centre development.
10
The short-term marginal technology is the technology which needs to be utilised to produce additional electricity at times of higher demand. The long-term marginal technologies are the ones which may or may not need to be constructed and drawn up, depending on the level of demand and the baseload, fluctuating and stored energy supplies. 11
Gas Generation Strategy. DECC. 2012.

AECOM Final Report 40
Capabilities on project:
Building Engineering
Opportunities should also be identified for other sources of heat supply, for example locating future energy-from-
waste (EfW) schemes where they can connect to an existing heat network.
3.6 Phasing of DH networks
Many aspects of the phasing of DE schemes have been discussed in the previous sections. In relation to the DHN
specifically, the following phases can be defined:
Early phases (the first 10 years). The networks will be developed at a reasonably small scale of a few
buildings representing the main or anchor energy consumers. This means that the initial customer base can
be established to get the scheme running and de-risked, potentially with a large public sector take up. For
the Kingston town centre scheme, the discussion of potential customers suggests a Phase 1 scheme may
comprise the RBK Guildhall, Kingston College, County Hall, and Kingston University sites (Penrhyn Road
and Knights Park). Other sites such as the Cambridge Road Estate and major town centre retail /
commercial loads may also connect if viable.
Expansion phases (10 – 20 years). Once the initial network has been established, and the performance and
costs firmly understood, then the scheme could expand with a combination of two methods:
i. Further expansion of the network to distant major loads. For the town centre network, this may
include commercial loads to the north and east of the town centre, including potentially the hospital.
ii. Infilling existing network locations with new customers. If new customers can be identified within
the extent of the initial network (which may have been deemed unviable or risky in the early
phases), then they could be connected and reinforce the existing demand. New customers may
also be in the form of new development or refurbishments, supported by local planning policy.
Maturity phase (20 years and beyond). As the network matures, it is possible that the extent and level of
infilling will increase until it becomes the main heat supplier in an area. A step change will occur when, and
if, the network can viably connect to small commercial premises, and individual dwellings, particularly in the
private sector. During this phase, it is possible that individual schemes may also connect, leading to
Borough-wide and even London-wide networks.
3.7 Potential for cooling networks
Cooling demand can help to diversify the heat demand profiles of an energy network, by providing a use for heat
from CHP engines in the summer period in absorption chillers. This is known as Combined Cooling, Heat, and
Power (CCHP) or Trigeneration. Cooling can be provided using two basic configurations:
Locating absorption chillers at the site of buildings with a cooling demand. The absorption chiller takes heat
from the DHN and uses this to drive the chiller. The benefit of this is that only a DHN is required and no
additional cooling network. The disadvantage is that the absorption chillers are not centralised, and smaller
chillers are generally more expensive and less efficient than larger chillers.
Using centralised chillers and a cooling network. The cooling capacity can be centralised using a large
absorption chiller located at the energy centre. Coolth in the form of cold water can then be circulated to
buildings in a separate network. Cooling networks are less expensive than DH networks due to the use of
simple plastic pipes – the low surrounding temperature of the ground means that insulation is not necessary
due to the small T between the chilled water and the ground. The advantage of this method is the use of
larger, more cost effective, and more efficient centralised chillers. The disadvantage is that a separate
network is required, which despite being relatively simple, still requires civils works and associated costs.
Assessing cooling demand at a masterplan scale is not practically possible. In general all buildings have a heating
demand, and this is most often met by gas. Whilst gas is used for other purposes (for example cooking), this is
generally negligible, and therefore gas consumption for commercial and residential buildings can be used as a proxy
for heat demand. Cooling on the other hand is not required in all buildings, and the efficient design of buildings can
help to reduce or eliminate its use. Cooling is generally provided via electric chillers, and often not sub metered.

AECOM Final Report 41
Capabilities on project:
Building Engineering
Therefore it can be impossible to determine a buildings cooling demand without in-depth analysis. .Therefore
developing robust assumptions for cooling demand is not possible at a high level.
Whilst cooling via absorption chillers can be perceived as a benefit (making use of CHP capacity in the summer
months), the benefits in practice can be minimal in terms of cost and CO2 savings. Under current grid electricity
conditions, an efficient electrically driven chiller can provide coolth with lower CO2 emissions than by using heat from
a natural gas CHP system via an absorption chiller. As the electricity grid continues to decarbonise in the future, and
if electric chillers continue to improve in efficiency, the electric chiller option will increasingly become lower carbon
than CCHP. Therefore absorption chillers may only provide a long term environmental benefit where a much lower
or zero carbon form of heat can be obtained, ideally from a waste heat source which would otherwise have no use in
the summer period. Figure 15 shows a comparison of the performance of trigeneration systems with different
electrical efficiencies compared with an electrically driven chiller. The data shows that even with highly efficiency
trigeneration systems, the chillers are expected to be lower carbon if the electricity grid emissions factor reduces to
0.4 kg CO2 / kWh or less – this is expected to be achieved within the next decade or so.
Figure 15: Comparison of tri-generation with electrically driven chillers (Note: tri-generation efficiencies refer to the CHP electrical efficiency; overall CHP efficiency is taken as 80% in all cases). Source – CIBSE AM12
12.
A situation where cooling networks and absorption chillers may provide a benefit is where there is a source of low
carbon heat which otherwise can not be used during the summer months. This is effectively waste heat, and could
be taken from industrial processes, or from geothermal systems. As neither of these have been identified in RBK,
they are not considered.
In light of the uncertainties over cooling demands, and the negligible benefit, or even adverse impact, trigeneration
can have environmentally and economically, district cooling networks are not considered further.
3.8 Assessment of the viability of a DE scheme in Tolworth
A DE scheme in the Tolworth area centres around the Tolworth Tower complex as discussed. AECOMs experience
suggests that the most suitable option for this area is a CHP scheme for the tower complex with no further network –
12
Combined Heat and Power for Buildings. CIBSE AM12. 2012.

AECOM Final Report 42
Capabilities on project:
Building Engineering
the distribution and size of loads nearby suggests that a network will not be viable. The potential for connecting to
other sites appears to be extremely limited due to the small number of site, their relatively dispersed nature, and
uncertainty over some of the re-developed areas.
The importance of Tolworth Tower meant that consultation was required with the operators to understand the Tower
in more detail, and obtain energy information so that a high level assessment could be made. Obtaining information
from the Tower proved difficult but eventually the following information was obtained:
The Tower contains a number of heating systems, with the majority of the office space in the tower itself on
a common boiler system (although two floors of tenants have their own separate systems), and the retail
tenants on ground floor having their own separate systems. It was suggested that the boiler will be replaced
in the near future.
The Tower’s owner, Stevenor Investments Limited, is in administration, and the Tower may be sold to a new
owner by the bank dealing with the administration.
The Tower may be converted or re-developed into a different use including potentially student
accommodation or residential.
No further information, including energy loads, was provided.
Given the importance of the Tower to any scheme in the Tolworth area, and the likelihood that a scheme may
involve only the Tower at least for the foreseeable future, the uncertainty over the Tower’s future and the lack of
information available means that no meaningful analysis can be conducted. It is also suggested that a scheme
revolving around a single building or site is not considered a DE scheme which requires inclusion in the EMP.
In light of this, AECOM do not believe that further analysis can be, or needs to be conducted on the Tolworth area at
the current time. However the following recommendations are made:
RBK should monitor the status of the Tower, and identify any re-development or change of use
opportunities.
RBK should engage with the new owners and encourage through planning the development of a CHP
scheme if viable.
RBK should keep a watching brief on the Tolworth area to identify any future major (re)development and
assess the potential for these to develop a DH network, and potentially link to the Tower.
Once the viability of a scheme at the Tower can be established, the wider opportunities can be investigated further.
The remaining parts of this report are therefore concerned with the Town Centre only.
3.9 Summary
This section provides an overview of the high level opportunities and constraints which need considering when
developing DE scheme options, and how they may apply with the Borough. The issues are addressed in further
detail in this EMP, and may be revised as more details are ascertained, but this initial review helps to outline the
direction of this study for both the Town Centre and Tolworth sites.
The town centre has a number of large energy users in a defined area as discussed, with a number of more remote
loads located outside this immediate area which may support the expansion phase. Outside of these loads, medium
density housing (typically terraced and semi-detached) is the predominant land use and the connection of these
dwellings may offer long term connection potential if viable. If connection to medium density housing was deemed
viable, then the expansion potential is significant and would provide a step change in connected heat load.
In the Tolworth area, the review of customers demonstrates that the potential for expansion is extremely limited
unless lower density and smaller use customers are connected. The future expansion of a scheme (which initially
may only be the Tolworth Tower complex) would therefore depend on the development of significant new loads in
the area, or a step change in economic performance allowing expansion into supplying local housing. Based on the
current analysis, Tolworth Tower is central to any scheme in the area, and is probably the most viable scheme in its

AECOM Final Report 43
Capabilities on project:
Building Engineering
own right without connecting elsewhere. Given the current status of the Tower and lack of information, it is proposed
that all further work concentrates on the Town Centre opportunities.

AECOM Final Report 44
Capabilities on project:
Building Engineering
4.1 Introduction
This section provides an assessment of potential energy supply technologies which can be used to provide heat and
electricity as part of a distributed energy scheme. The assessment is split into two parts: the first provides an
overview of a wide range of technology options which may be applied to DE schemes and identifies which are the
most suitable for use in the Borough, and the second provides a detailed assessment of the technologies deemed to
be most appropriate.
Figure 16 below summarises the potential energy sources (traditional and renewable), the energy conversion
methods, and the resulting energy supplies (power and heating/cooling).
Figure 16: Potential energy sources and conversion methods.
4.2 Existing energy supply options
The RBK Heat Mapping study identified two existing potential sources of energy in the areas of interest. These are:
Kingston Hospital – which has a Combined Heat and Power (CHP) plant
The Hogsmill STW operated by Thames Water – which creates biogas through anaerobic digestion and
uses this in an on-site CHP scheme
Our findings are presented below and summarised in Table 1.
4.2.1 Kingston Hospital
Kingston Hospital lies to the north east of the town centre and is a medium scale acute facility. A gas fired 1.4 MWe
CHP unit is used to provide heat and electricity to the hospital. This is part of an energy services contract with
Dalkia who own and operate the CHP unit, and sell heat and electricity to the hospital. This contract commenced
around 6 years ago and is due to last 15 years. At the end of the contract, the ownership of the engine will be
handed to the NHS Trust, who may then wish to continue maintaining and operating the unit, or replace.
Heat distribution on the site is via a steam main which connects to around 40% of the hospital buildings. There is no
sub metering on the network but it is estimated by the hospital that around 60% of the site’s heat load is met by the
Power Distribution
Cable
Superconductor
Switchgear
Metering and controls
Generator Connections
Insulated Pipe
Heat Exchanger
Copper pipe
Radiator
Absorption Chillers
Heat connections
Metering and controls
Heat Source
Heat Storage
Energy Conversion
Combined Heat and Power
Fuel Cell
IC Engine
Gas Turbine
Heat & Cooling
Boiler
Heat Pump
Solar Heating
Power
HeatHeat/Cooling
Distribution
System Design
Distribution
Existing Grid network
Design Tools
Energy Sources for
Traditional Conversion
Natural Gas
Biogas
Biofuels
Syn Gas
Geothermal
Renewables/Waste
Heat Energy Sources
Wind
Solar
Waste Heat
4 Energy production
AECOM Final Report 45
Capabilities on project:
Building Engineering
steam main. The remaining buildings are heated by individual gas boilers dispersed around the site. There are two
main incoming gas meters for the whole site and this is the only way of monitoring heating consumption.
The use of a steam network is common in many hospitals. The network allows for the provision of steam for
autoclaves, and reduced diameter pipe sizes for ease of installation. Steam systems were also common on hospital
sites due to the potential to access high grade heat from incinerators, although many of these have now been
removed, or replaced with boilers. The current steam network at Kingston is old, and historically poorly maintained,
and so replacement is planned for 2014 with a new main (AECOM’s understanding is that a decision has not been
taken yet on whether this is steam or hot water based) sized for additional loads.
Replacement of the network could offer a number of opportunities for the EMP:
The network could be converted to Low Temperature Hot Water (LTHW) with new pipework which opens up
flexibility for alternative heat sources and would be compatible for connecting to a wider network. With a
high temperature network, localised heat generation will be required on site to boost temperatures if the rest
of the town network is lower temperature. Discussions with Kingston Hospital have suggested a LTHW
network could be a possibility.
The scale of the network could be expanded to connect to more of the hospital buildings. This would allow
the provision of lower cost and lower CO2 heat to more of the site. The costs of connecting to all buildings
could be high and so a cost benefit analysis would need to be conducted to assess the cost of connecting
versus the heat load met. This could be part of a gradual strategy where a replacement network is
oversized, and additional buildings are connected during future refurbishment or re-development.
The design of a new network could take into account future connection opportunities. The network could be
sized with the capability of importing or exporting heat, with appropriate terminations and access provided
for connection to a wider network.
Based on the consultation with the hospital, the key opportunities appear to be:
Replacement, of the existing steam network, with a LTHW system with greater coverage of the hospital site,
and capability for connecting to a wider network. The additional cost of a connection ready network would
be minimal if designed in with appropriate connection points and the provision for controls.
Purchasing of heat from a wider network for the hospital site (heat generation plant would probably need to
be retained on the hospital site for back up and resilience).
Increase in heat generation plant through expansion of the existing boiler house, and potential increase in
CHP size, probably at the end of the energy services contract period, to allow export of heat to the wider
network.
Inclusion of a larger energy centre on re-development / modernisation of the hospital site (see also section
4.5.6).
Further information on the hospital site is provided in section 4.5.6.
4.2.2 Hogsmill Sewage Treatment Works (STW)
The Hogsmill STW is owned by Thames Water and has been identified as a potential source of heat in the RBK
Heat Mapping study, due to the presence of a biogas fuelled 0.94 MWe CHP plant. A CHP plant is typical for most
STWs as the biogas from the sewage anaerobic digestion (AD) process makes a valuable resource for energy
generation on the site.
The AD process generates biogas by digesting organic waste in an oxygen-free environment. The digestion
process requires the feedstock to be warm to catalyse and maintain digestion. The resulting biogas could be used
in a number of ways:

AECOM Final Report 46
Capabilities on project:
Building Engineering
Flared off (to no benefit)
Captured for use in a CHP unit providing heat and electricity
Captured for use in another energy application, such as storage in compressed tanks for export (although
there are at present limited applications apart from Transportation)
Compressed, upgraded, and injected into the gas network (although this is an expensive process with few
existing schemes).
In addition to the biogas output, the process results in a sludge of digestate which needs to be disposed of. This
can either be transported from the site and spread as a fertiliser, or dried and used in pyrolysis or biomass
combustion plant.
Sewage treatment plants have a high electricity process demand to power a range of systems. The electricity
generated by the CHP systems is therefore generally used entirely on the site. The AD process also requires heat.
Whilst some of this is self-generating, making use of thermal energy from the digestion process, additional heat is
also required, particularly in the cold periods. In general therefore the heat output of the CHP system is also used
entirely on the site, with additional boiler plant also often required, powered by natural gas.
The general description of energy within an STW above suggests the scope for energy export is limited.
Consultation with Graeme Walker from Thames Water found this to be true for the Hogsmill site in the short term;
there are currently no opportunities for extracting excess heat from the system. Indeed the STW imports a large
amount of natural gas for the additional process heating.
Thames Water currently export sludge from their STWs for use as a fertiliser. However this is becoming increasingly
challenging and expensive to do due to the lack of suitable locations for spreading where the existing soil conditions
allow additional nutrients. In light of this, Thames Water have trialled a sludge drying plant at their Slough STW
which involves de-watering and drying the sludge with warm air driers at 60C to produce a cake . This process is
currently inefficient and expensive, and they are about to trial a new form of sludge drying plant. If this process
becomes efficient, it may become common at a number of plants resulting in a biomass type fuel which can be
burnt, gasified, or used in pyrolysis. It is possible that a fraction of the resulting fuel will be used to power the drying
plant, and the additional fuel could be used for maintaining heat in the digesters, in place of gas boilers. It is
therefore uncertain what the net potential fuel export would be.
In the longer term, Thames Waster is keen to investigate energy generation and provision opportunities where these
may provide improved asset value and contribute towards their target for “end of waste status”.13
Therefore
opportunities such as biogas export may be of interest if sufficient heat can be generated on site (possibly from
sludge cake) and a cost effective gas export option exists. One concept could be the export of biogas from Hogsmill
STW using a dedicated biogas pipe to a local energy centre located either at the STW site or elsewhere in Kingston.
4.2.3 Other existing supplies
Other potential sources of heat have also been identified:
Kingston Crematorium. This is located to the north of the Hogsmill Valley in Kingston cemetery. The annual
gas consumption is 540 MWh per year, and therefore any heat recovery is likely to be negligible over a
large DE scheme. However, the source could be used in a local application, or as a decentralised generator
on the DE scheme. Heat capture is used at some crematoria in a minor way in the UK (for heating offices
and facilities belonging to the crematorium) but it is used more extensively in Scandinavia. Research is
being conducted into heat capture by the University of Bath but public acceptability remains divided 14
.
Low temperature waste heat sources which can be upgraded using a heat pump. See section 4.3.
13
The concept of “end of waste”, originating from scrap metal, is when the “waste material” is all re-used or recycled, and so has a further life/usefulness and so ceases to be “waste”. 14
http://www.fsj.co.uk/news?articleaction=view&articleid=482

AECOM Final Report 47
Capabilities on project:
Building Engineering
4.2.4 Summary of existing sources
Table 1 provides a summary of the existing heat sources which may be available for a DE scheme.
Table 1: Review of existing heat sources.
Source Suitability for
Kingston Comments
Kingston Hospital CHP Current source not
suitable.
Existing scheme is unlikely to have an excess heat, but
could connect in the future with new plant.
Hogsmill STW Not suitable No major source of energy identified for use in a DE
scheme.
Crematorium Suitable
Suitable for connection if a DH scheme is near the
Crematorium. However the amount of heat available is
small and this is likely to be a minor heat producer.
Low temperature heat
source Suitable
Potential to capture low temperature heat and upgrade
using heat pumps. See later in section 4.3.
4.3 Review of secondary heat sources
Several potential new energy sources are also available in the Borough. The Greater London Authority (GLA)
commissioned a study into the capacity and utilisation of secondary or low temperature heat sources in London;
secondary heat is considered to be heat arising as a by-product of industrial and commercial activities, from
infrastructure operation, and from the environment (air, ground, water)15
, This report identifies a potential resource of
447 GWh heat per year available from secondary source across the Borough, equivalent to 37% of the Borough’s
heat demand.
Table 2 provides a summary of the sources identified across London.
15
London’s Zero Carbon Energy Resource: Secondary Heat, Report Phase 1, January 2013, GLA and London’s Zero Carbon Energy Resource: Secondary Heat, Report Phase 2, April 2013

AECOM Final Report 48
Capabilities on project:
Building Engineering
Table 2: Secondary heat sources covered by the GLA’s study

AECOM Final Report 49
Capabilities on project:
Building Engineering
We have reviewed this report to identify the potential low temperature heat sources for Kingston. The main sources
identified of relevance at a strategic level are:
The River Thames
The Hogsmill Sewage Works Outlet Water.
These are discussed in further detail. The other sources identified also have relevance to Kingston, but due to their
more distributed nature, they are not discussed at the strategic level.
It is important to note (see section 4.4.6) that this secondary heat is of low temperature and is not useful unless it
can be upgraded to a higher temperature using an electrically driven heat pump. At present, the CO2 emissions
associated with operating the heat pump are likely to result in heat with a higher CO2 content than that from Gas
engine CHP systems. Therefore at present the secondary heat should not necessarily be viewed as a low carbon or
low cost form of heat.
4.3.1 The River Thames
Extraction of heat from the River Thames has been identified from the GLA secondary heat study. This will require
heat pumps to upgrade the heat to useful temperatures (see section 4.4.6). Figure 17 shows the distribution of
River Water heat extraction potential.

AECOM Final Report 50
Capabilities on project:
Building Engineering
Figure 17: Distribution of secondary heat from river water extraction. Kingston is identified as one potential location. Source – GLA secondary heat study).
The GLA report identifies around 2,000 GWh of potential delivered heat from river water extraction across the sites
identified, based on a 10% of flow extraction rate, and taking into account the varying temperature of the source
through the year, and limits on rejection temperature, Therefore whilst the amount identified is illustrated as 5001+
MWh in Figure 17, the volume of available heat at each location is likely to be significantly higher and in the order of
10s or 100s GWh (it is understood that the scales selected for the GLA mapping were to allow comparison across
all sources).
4.3.2 The Hogsmill Sewage Works Outlet Water.
It has been previously identified that there is no excess high grade waste heat from the CHP system at Hogsmill
STW. However the GLA report has identified the low grade heat at the STW outlet as a potential source suitable for
upgrading with a heat pump. The locations of these sources, including the Hogsmill STW in Kingston, are shown in
Figure 18.

AECOM Final Report 51
Capabilities on project:
Building Engineering
Figure 18: Distribution of secondary heat from STW outlet heat extraction. The Hogsmill STW in Kingston is identified as one potential location. Source – GLA secondary heat study).
The GLA report identifies around 10,000 GWh of potential heat from STW outlets across the sites identified.
Therefore as with river water heat extraction, whilst the amount identified is illustrated as 5001+ MWh in Figure 18,
the volume of available heat at each location is likely to be significantly higher and in the order of 10s or 100s GWh
(it is understood that the scales selected for the GLA mapping were to allow comparison across all sources).
4.4 Review of possible energy supply options
In this section, we have reviewed energy supply options for generating heat for DHNs, and in some cases electricity,
to identify their suitability in terms of providing a cost effective and reliable heat supply that will also deliver
environmental benefits in an urban environment. These options are:
i. Community boilers
o Gas boilers

AECOM Final Report 52
Capabilities on project:
Building Engineering
o Biomass/biogas boilers
ii. Large power station heat take-off
iii. Industrial/commercial waste heat with heat pumps if necessary
iv. Combined Heat and Power (CHP)
o Gas reciprocating engine
o Biomass CHP
o Biogas-fuelled CHP
o Fuel cell CHP
v. Energy from Waste (EfW) CHP
o Incineration
o Anaerobic digestion
vi. Large-scale heat pumps
o Air sourced
o Ground sourced
o Water sourced
We have not considered large-scale solar-thermal as the land in RBK is considered of too high a value.
4.4.1 Community boilers
The first option considered is community boiler plant acting a prime heat generator for supplying heat distributed via
a DHN.
4.4.1.1 Gas boilers
The use of gas-fired boilers supplying community heating can be ruled out almost immediately as a replacement for
existing locally sited gas boilers. The only advantages would be:
Ease of future fuel or heat source substitution
Possible diversification of loads, improving boiler efficiencies.
However, these advantages need to be weighed against:
The distribution heat losses associated with the network
The lack of clear environmental benefits as a result of the distribution heat losses and no generation
efficiency gains
The need to find a location for an energy centre
The capital and additional running costs of the district heating network and energy centre
The need to procure or set up a management company – typically an Energy Services Company (ESCo)
Therefore this option has not been considered further.

AECOM Final Report 53
Capabilities on project:
Building Engineering
4.4.1.2 Community biomass/biogas boilers
Biomass refers to the use of a wide variety of organic material such as wood, straw, dedicated energy crops (e.g.
willow coppice or specific types of grasses), sewage sludge and animal litter for the generation of heat, electricity or
motive power.
Biomass is regarded as a low carbon fuel because the CO2 released when it is converted for energy purposes by
combustion/burning or fermentation and distillation to produce liquid transport fuels is largely offset by that absorbed
by the organic material during its growth.
With the appropriate management this emitted CO2 can be recaptured provided new growth of the same amount of
biomass is achieved. However the carbon balance may not be achieved overall as a result of energy used by
harvesting vehicles or in transporting biomass to its point of use.
Biomass heating plant is available in a wide range of sizes from a few kWs to many MW of heat.. At the smaller
sizes, fuel is usually supplied as wood pellets. At the larger scale, wood chip is one of the most common fuels at
present.
The advantages and disadvantages of supplying a DHN from communal biomass boilers are identified below.
The advantages are:
Environmental benefits as a result of the low kg CO2 per kWh for biomass compared to gas
The eligibility of the technology for the Renewable Heat Incentive (RHI)
Ease of future heat source substitution.
However, any such scheme would require:
An energy centre large enough to incorporate not only the boilers but also a fuel store and a thermal store
(to avoid operating the boilers at low loads), plus gas-fired top-up/back-up boilers
Measures to ensure air quality standards are met
A suitable access route to the fuel store for delivery lorries
A management company, typically an ESCo
A secure source of biomass fuel over a significant period, say 20 – 25 years.
In general, biomass boilers are only economic compared with gas boilers when the RHI is obtained. This means that
there are no cost savings without the RHI which can be used to fund the required energy centre and distributed
network infrastructure capital and running costs. There will also be distribution heat losses associated with the
network.
Although the higher biomass fuel costs, compared to gas, could be offset by RHI payments, this option has not been
considered further due to the uncertainty over future incentives. In addition, there are concerns over fuel supply and
cost, transportation, and air quality as discussed earlier.
4.4.2 Large power station heat take-off
A significant amount of low grade heat energy is produced in the generation of electricity, which is normally rejected
to atmosphere or rivers. When a suitable heat demand is located nearby, heat can be extracted at a higher
temperature to supply a DHN. This involves a reduction in electrical output of the power station so the heat is not
‘waste heat’. There are both economic advantages to such an approach and environmental benefits, providing the
cost to install the network and connections is less than the cost of producing the heat (related to the value of the
electricity reduction), over a prescribed period.

AECOM Final Report 54
Capabilities on project:
Building Engineering
With regard to the two areas in Kingston under consideration – the Town Centre and the Tolworth Regeneration
Area – there are no large power stations nearby which could supply heat in this way and so this heat source has not
be considered any further.
4.4.3 Industrial/commercial waste heat
Another potential source of heat for a DHN is waste industrial or commercial heat. The principle is the same as that
for the power station; an organisation is generating heat, in this case as a result of a process, which is surplus to
requirements and therefore rejected to atmosphere or water.
Although the area being considered does not contain any significant industrial plants, a potential source of waste
heat within the Borough is Kingston Hospital. The potential to provide heat from the hospital has already been
considered, see Section 4.2.1.
Industrial/commercial waste heat has not been considered further other than from Kingston Hospital.
4.4.4 Combined heat and power
In general, the economics of using an energy centre and DHN to supply heat to a number of buildings are much
improved, as are the environmental benefits, when the heat is provided by a Combined Heat and Power plant (CHP)
which generates electricity as well. Typically the CHP scheme is designed to be “heat led”, so that all of the “waste
heat” produced as a bi-product of electricity generation is used and none is simply released. The electricity is either
used on site, displacing grid supplied electricity, or it is exported to the grid. Ideally all of the electricity is used on
site and none is exported to maximise the income from electricity generation. However, this requires a suitable host
site with a large electrical demand or the construction of a private wire network to sell electricity direct to customers.
In most cases these situations are not available and most of the CHP electricity generated will be sold in bulk to a
licensed supplier for onward sale to customers
Any CHP scheme should have a top-up and back-up energy supply, typically gas-fired boilers.
Figure 19: The efficiency benefits of CHP over conventional power generation and boilers (Source – CIBSE AM1216
)
In the next sections, several energy sources for a CHP engine are considered.
16
Combined Heat and Power for Buildings. CIBSE AM12. 2012.

AECOM Final Report 55
Capabilities on project:
Building Engineering
4.4.4.1 Gas-fired Combined Heat and Power (CHP) – gas reciprocating engine
This technology has been utilised widely for many years and is considered mature and economically viable. The
most noticeable advancement over the years is higher shaft efficiency and lower emissions. The normal system
configuration is that an electrical generator is connected to the engine mechanically and a heat exchanger is used to
extract the heat from the engine jacket, oil cooler and exhaust gas. Apart from natural gas (i.e. most prevalent
fuels), gas engines have been developed to run on fuels which have lower heating values and higher contents of
impurities such as anaerobic digestion gas (biomethane), landfill gas and syngas.
A CHP plant based on a gas engine can produce heat from three main sources - the engine jacket cooling system,
the oil cooler, and the exhaust gases. Typically two-thirds of the heat is available in the engine jacket/oil cooler
while the remaining one-third in the exhaust. A gas-engine CHP is normally used in low temperature hot water
applications due to the maximum temperature in the engine jacket circuit (typically 95oC).
Figure 20: Typical DH connection to a Gas reciprocating engine CHP system (Source – District Heating Manual for London
17).
Gas reciprocating engine CHP is considered a suitable energy source for DE schemes in Kingston.
4.4.4.2 Biomass -fuelled CHP
Biomass CHP can be based around gasification or combustion.
Gasification is a process to break down the biomass fuel source (which can include organic waste) into gaseous
fuels by heating but without having combustion. The process creates a chemical reaction which combines waste
with oxygen and steam under high pressure at a temperature generally in excess of 800oC. The continuous
gasification process produces a syngas which contains carbon monoxide, hydrogen and methane. The gas has a
17
District Heating Manual for London (DRAFT). GLA. 2013.

AECOM Final Report 56
Capabilities on project:
Building Engineering
net calorific value of 4-10 MJ/Nm3 and can thus be used to generate electricity. Figure 21 shows the schematic
diagram of a gasification plant.
Figure 21: Schematic diagram of a gasification plant 18
Gasification systems turn biomass material into a fuel known as synthesis gas or syngas through a high temperature
process where the fuel is reacted with oxygen and/or steam, but without combustion. This gas is then burned in a
modified gas engine to produce electricity and heat. The quality of the syngas is important and a range of cleaning
techniques are used to ensure the product is uniform and tar-free. If a suitable quality can not be achieved, the the
engine may malfunction.
The most recent gasification system appear to have made progress in ensuring the syngas is of high quality. These
units are typically fully integrated systems with the gasifier and CHP system running from the same control system
Gasification brings higher electrical efficiencies due to gas engine technology having advantages over steam based
systems.
There is limited experience of wood gasifiers at a small scale but there are now a few applications in the UK of
larger schemes of 1 to 5 MWe capacity. In Europe there are several wood gasifiers of less than 1 MW capacity that
have been running successfully for some years, and this technology is now starting to become available in the UK.
Biomass gasification has been trialled at a number of sites in the UK for smaller scale CHP (100s kW – 10s MW)
with varying degrees of success. There have been some instances of poor performance and it is considered that
this technology is pre-commercial and immature.
At a larger-scale, typically over 10MWe, biomass combustion CHP plant is well established and is usually fuelled by
straw, forest residues (e.g. wood-chips), or waste wood (which is usually classed as a waste product and therefore
required Waste Incineration Directive compliance). The system normally includes the major components as fuel
storage and feed-in system, combustion chamber, high-pressure steam boiler, steam turbine, generator and flue-
gas heat recovery boiler (hot water or steam) as indicated in Figure 22.
18
Typical gasification plant, http://www.wtert.eu/default.asp?Menue=12&ShowDok=15.

AECOM Final Report 57
Capabilities on project:
Building Engineering
Figure 22: Schematic diagram of a typical biomass CHP plant 19
Such biomass plants tend to be large in physical space terms, because it requires space for fuel handling, storage
and potentially processing, in addition to the need for relatively large boilers. Because these issues apply to any
system, this means that smaller scale plant is relatively expensive.
Due to the use of steam turbine technology, small scale biomass CHP (100s kW – 10s MW) is relatively low in
efficiency. Electrical efficiency is often 20% or less meaning that when operated in heat led mode, small scale
systems are required on smaller DE schemes due to the large heat outputs, resulting in the use of smaller, less
efficiency and more costly systems.
As smaller-scale biomass CHP remains an unproven technology and there is no suitable site for a larger-scale plant
in the Borough we have not included this technology in further analysis.
4.4.4.3 Biogas-fuelled CHP
Biomethane is produced from the decomposition of organic matter. It can be produced specifically from Anaerobic
Digestion systems designed for treating organic products (see section 4.4.5) or as a by-product from other
processes (which are also in effect a form of anaerobic digestion). As with biomass boilers, biogas-fired boilers are
unlikely to be as financially and environmentally attractive as biogas CHP, so only the latter has been considered.
The only potential local source of biogas which has been identified is from the Hogsmill STW. Further information on
this is provided in section 4.2.2, but in summary:
The STW currently captures the biogas produced for use in a CHP system which provides the onsite
requirements for electricity and heat
19
Typical biomass CHP plant, http://www.unendlich-viel-energie.de/uploads/media/Biomass_CHP.pdf.
Flue gas emission
Chimney
Flue gas
cleaningCombustion
gases
Heat
exchanger
Combustion
chamber with
grate burner
Conveyor
belt (feed-in
system)
Heat
Electricity
GeneratorCondensation
steam turbine
Biomass
storage

AECOM Final Report 58
Capabilities on project:
Building Engineering
There is considered to be no excess biogas or heat whilst the CHP system is operated.
There may be a future potential for capturing biogas or heat from the CHP system, if alternative sources of
heat are available for the STW process.
The potential use of biogas has been considered further to supply a DE scheme within the Borough in relation to
strategic decisions around energy centre locations.
4.4.4.4 Fuel cell CHP
A fuel cell is an electrochemical device that converts the chemical energy contained in fuels into electrical energy
and heat. It is typically composed of a fuel electrode (anode) and an oxidant electrode (cathode) separated by an
ion-conducting membrane. Oxygen passes over one electrode, and hydrogen over the other, generating electricity,
water and heat. Fuel cell CHP is in its infancy and this is reflected in the capital costs.
As there is no combustion, the pollutants are relatively low compared with a gas-engine or gas turbine. Fuel cells
can operate continuously as long as the necessary reactant and oxidant flows are maintained. Most fuel cells use
natural gas (or derivatives) or hydrogen as reductant, and ambient air as the oxidant
There are five main types of fuel cell classified by the electrolyte used in the cells. Three of these five types, the
Phosphoric Acid Fuel Cell PAFC (150-200oC), the Molten Carbonate Fuel Cell MCFC (600-700
oC), and the Solid
Oxide Fuel Cell SOFC (700-1000oC) are suitable for district heating application due to their operating temperature
range.
Fuel cells are commercially available, although generally considered to be an immature technology and significantly
more expensive than conventional gas engine alternatives. They offer the advantages of low emissions and high
electrical efficiencies, but this needs to be balanced against cost and reliability.
In general, the additional cost of fuel cells at present does not justify the additional costs, and gas engine CHP
systems are more viable. As the cost of fuel cells reduces (if they reduce), then they may become more viable in
the future. However due to the expected reduction in the electricity grid CO2 intensity, this maturity may not happen
in time for fuel cells to remain effective at saving CO2 if powered by natural gas.
4.4.5 Energy from Waste (EfW)
Two forms of energy from waste have been considered – incineration of municipal waste as an alternative to landfill,
and anaerobic digestion of food waste to create biogas to power an engine.
4.4.5.1 Incineration
Energy from Waste systems are typically based around the incineration of waste in boilers to generate steam for a
steam turbine. A schematic of a typical plant is shown in Figure 23.

AECOM Final Report 59
Capabilities on project:
Building Engineering
Figure 23:Schematic diagram of an energy from waste incineration plant 20
RBK is part of the South London Waste Partnership (SLWP) which covers the Boroughs of Kingston, Sutton,
Merton, and Croydon. This provides a coordinated and efficient waste service across the four boroughs. The
partnership is responsible for the collection and treatment of household waste from across the four boroughs, and
therefore the consideration of waste as part of an energy masterplan needs to consider any potential role for the
SLWP.
The SLWP has taken a strategic decision to develop an Energy Recovery Facility (ERF) based around incineration
for processing mixed waste which would otherwise be sent to landfill. The plant is to be located at Beddington Lane
in Sutton, the site of existing waste handling, processing, and land-filling. This decision was made based on
achieving a more economic solution than landfill with the associated landfill tax, and also the opportunity to provide
a source of low carbon electricity, and potentially heat.
The plant will have an annual capacity of 275,000 tonnes waste and will export up to 22MW of electricity. Planning
permission was granted for the plant in May 2013, and it will be delivered under contract by Viridor.
The location of the proposed ERF facility in Sutton is deemed to be of no benefit to heat networks in RBK, due to the
11 km distance from the Kingston Town Centre to the site at Beddington Lane, which would require an expensive
heat transmission main. There are likely to be more viable DE options closer to the ERF site with lower
transmission costs.
The development of the ERF in Sutton means that any further energy generation from waste is unlikely because:
The waste resource available locally has been allocated to the ERF, and is projected to decline over time
with increases in recycling. It is therefore considered that no further additional plant is viable.
Land is at a premium in RBK, and whilst potential options may exist in areas such as Hogsmill Valley, it is
likely that other areas in the four boroughs are more suited to an ERF facility if a future replacement plant
needs to be built at an alternative location.
20
Typical incineration plant, http://wtert.eu/default.asp?ShowDok=13.

AECOM Final Report 60
Capabilities on project:
Building Engineering
For these reasons, heat from waste incineration and future thermal waste treatment technologies are not considered
further in this study.
4.4.5.2 Anaerobic digestion
Anaerobic digestion (AD) produces biogas through the decomposition of organic waste in an oxygen-free
environment. Feedstock for AD plants can be from a range of organic sources including animal waste, food waste,
and purpose grown feedstocks (such as maize). A wet AD system typically processes feedstock using shredding
and pulping systems before digesting in an air-tight reactor (usually batch processed). The biogas produced is
taken off for energy generation (usually in a gas CHP engine, but also potentially for export), with some of the CHP
heat used within the process. The resultant digestate is removed for use as a fertiliser. An alternative dry-batch
system is also used for green waste where the feedstock is digested in air tight bunkers using a watering system to
aid the process. Figure 24 shows a schematic of a typical wet batch process system.
Figure 24: Schematic of a typical wet process AD system 21
One potential source of biogas is from the STW in Hogsmill Valley and this is discussed in Section 4.2.2. Another
potential source of organic matter is food waste. At present RBK collect segregated kitchen waste from households
and process it at an in-vessel composting plant in Mitcham, resulting in the production of compost.
Assuming each home produces around 0.29 tonnes of food waste per year, and there are circa 65,000 homes in the
Borough, the total annual food waste generation is around 19,000 tonnes per year22
23
. This is an upper limit and
assumes that food waste generation in Kingston is the same as the UK average, that all food waste is collected, and
that all food waste is suitable for AD. The actual figure is likely to be lower to account for collection uptake and
suitability. Additional sources of food waste may be available from commercial premises or food processing.
21
Typical Anaerobic Digestion plant http://www.wtert.eu/default.asp?Menue=13&ShowDok=17 22
A figure of 0.29 tonnes per year per household is based on WRAP estimates of 7.2 million tonnes of food waste per year from UK homes. There are assumed to be 25 million homes in the UK. (New estimates for household food and drink waste in the UK, WRAP, 2011). 23
The actual number of homes in 2011 was 65,198. Source – Neighbourhood Statistics Dataset Dwellings (QS418EW).

AECOM Final Report 61
Capabilities on project:
Building Engineering
A typical AD scheme operating on food waste will require around 40,000 tonnes per year of food waste feedstock for
a 1 MWe output unit – this is around the minimum size considered to be commercially viable. It can therefore be
seen that even with significant increases in food waste availability, the contribution that AD can make from RBK
resource alone is likely to be limited, and will be relatively small if it is part of a DE scheme.
Whilst other feedstocks could be imported for use in Kingston, the significant volumes of feedstock required, and the
corresponding transportation, means that AD systems are best located near to the source of feedstock, often a rural
location. In addition the significant transportation of digestate from the scheme also needs to be considered, which
also benefits from a rural location.
For this reason, AD is not considered as a key heat generation option in the Borough. However if future organic
waste treatment using AD is proposed in RBK, their location should allow for connection to a current or future DE
scheme to allow export of heat.
4.4.6 Large-scale heat pumps – air, water, ground sourced
Heat pumps take heat from the ambient surroundings (air, ground, or water) and convert deliver this heat at to a
higher temperature through a closed process; either involving a compressor (using electricity) or absorption (using
heat; e.g. steam, hot water or flue gas).
Of these heat sources, air is a diffuse source and so is less suitable for a centralised heating plant for DH. The area
required is large, particularly if noise levels are to be well-controlled.
Closed loop ground source systems are similarly limited in capacity as a large ground area is required. In general,
closed loop, borehole ground energy systems are best suited to individual building systems, rather than wide area
heat networks as the energy source is diffuse. Each borehole provides around 5-8kW of heat output (3.7-
6.4MWh/yr). A closed loop system extracts heat through the use of a secondary medium. A glycol mix is circulated
around the borehole array, and this is connected to the evaporator side of the heat pump.
In the case of open loop GSHPs, water is extracted from the ground, passed through a heat exchanger and returned
to a separate borehole. The heat extracted is available through a water to water heat exchanger. Boreholes are
typically arranged at 100m centres. Open loop ground water systems could produce water at higher temperatures
than typically used for closed loop systems. The flow rate from a single well is still limited though so a number of
such installations would be needed across the RBK area. A typical open loop borehole pairing can only provide
around 380kW of heat energy. The amount of energy available from open loop schemes is subject to regulatory
constraints imposed by the Environment Agency (EA). To avoid long term cooling of the ground, preference is given
to balanced schemes which both extract and reject heat to aquifers on an annual cycle.
The potential for deep geothermal is also known to be limited in the London area.
The proximity of RBK to the River Thames does however represent an important opportunity to develop a large-
scale heat pump technology using the river water as the heat source. The RBK area has already been identified as
having good potential for this approach in the GLA’s report in low temperature heat sources (see 4.3.1). With river
source heat pumps, heat is extracted by passing a proportion of the river flow through a plate heat exchanger
system (water to water). The water is then returned to the river, with no net abstraction and no changes in chemical
composition but at a lower temperature. Robust water intake arrangements are required, along with measures to
deal with biological fouling and to protect fish from being entrained within the intake pump suction.
The heat output is restricted to the allowable temperature difference and the minimum water return temperature,
both of which are regulated by the EA. The heat available is directly proportional to the volume of water abstracted
and to the temperature difference allowed. There is a significant degree of temperature variation, roughly
corresponding to variations in average monthly air temperature.
As a result of the above we consider the river water sourced heat pump to be the most viable type of heat pump to
be considered for RBK.

AECOM Final Report 62
Capabilities on project:
Building Engineering
The performance of heat pumps is generally represented by a Coefficient of Performance (CoP), which is the ratio
of the heat generated to the electrical input. A CoP is used, rather than an efficiency, because the CoP exceeds
100% (CoP = 1). So a CoP of 3 refers to 3 units of heat output for 1 unit of electricity input.
The CoP is highly dependent on the temperature difference between the source of the heat and the supply of heat.
We have considered heat pumps with a low temperature source of heat. A reasonable supply temperature for a DH
scheme would be 80C. It is possible to operate DH nowadays at temperatures lower than that in the past, and the
supply temperature does not need to be constant through the year. For example DH can could be run at 70˚C in
summer, 80˚C in mid season, and 90˚C only at times of peak demand. In addition, the peak heat demands can be
met by boilers or gas-fired CHP which operate in series with the heat pump to increase the flow temperature.
As noted earlier, the GLA report on low temperature heat sources identifies the River Thames and the Hogsmill
Sewage Outlet Water as the two major sources within the Borough (see section 4.3). Typical heat outputs of heat
pumps are circa 5 MW which could operated be installed on a modular basisas a modular unit. In line with the GLA
report, it is considered that up to 20 MW of large scale heat pump capacity, in 5 MW units, could be located at both
the Hogsmill STW site for heat extraction form from the STW outlet, and by the River Thames for heat extraction
from the River. A typical 5 MW heat pump will have a footprint of circa 10m by 5m totalling 50m2. Therefore a space
allowance of circa 200m2 is required for the heat pumps alone for a 20MW system with additional space for ancillary
services.
In contrast to CHP systems where it is an advantage to operate during the day period there would be advantages in
operating a heat pump system mainly at night and storing the heat for the following day. This does however require
very large thermal stores which are likely to be impractical so we have not modelled this option.
Figure 25: Schematic of a river water heat extraction heat pump (Source – GLA Secondary Heat report Phase 1).

AECOM Final Report 63
Capabilities on project:
Building Engineering
Figure 26: Schematic of an STW showing heat extraction at the water outlet for upgrading via a heat pump (Source - GLA Secondary Heat report Phase 1)
For large scale heat pumps used to supply district heating, as for all heat pumps, the CoP has a significant impact
on unit cost and carbon intensity of the heat supplied. To inform the GLA study, a review of heat pump CoPs was
carried out based on manufacturers’ data, as described in the Phase 1 report. A central case was assessed for a
500-1,000 kW unit24
and a scale factor was applied to adjust for the relationship between scale and performance.25
Figure 26 taken from the GLA Report 2, indicates the performance of this heat pump range for different source
(evaporator) temperatures for four output temperatures on the heat network (condenser) side; 40°C, 55°C, 70°C and
85°C.
The performance of a heat pump also relates to the refrigerant used as the heat transfer medium. When selecting
the refrigerant, there is a compromise between flexibility and performance – those with the highest CoP can typically
operate at a high efficiency for a limited range of input water temperatures and conditions. In relation to the graph,
two different refrigerants were assumed. The limits in refrigerants account for why it is not possible to raise water
temperatures from 30°C to 40°C or from 10°C to 85°C as these conditions are outside the standard operating
conditions of most heat pump refrigerants.
24
Heat Pump data is based on information provided J&E Hall International for high efficiency inverter drive water source heat pumps. 25
Based on heat pump performance data provided by Star Refrigeration for 3 to 10MW industrial heat pumps.

AECOM Final Report 64
Capabilities on project:
Building Engineering
Figure 27: Graph showing the variation in heat pump CoPs by evaporator (source) temperature for four different heat output (condenser) temperatures (500-1000kW scale heat output) – from GLA Report Phase 2
The dashed line associated with a CoP of 3 indicates the minimum desired performance. Below a CoP of 3, a heat
pump is typically unviable because of the electricity required to produce the heat, and the ratio of the carbon
intensity of the grid-based electricity to the carbon intensity of an alternative way of delivering the heat, although
over time as the grid is decarbonised, heat pumps with a lower CoP will save carbon.
Achieving a higher heat pump CoP needs to be balanced against the usefulness and compatibility of the resulting
lower temperature distributed hot water, especially for existing buildings with their installed building services.
Taking both factors into account, the GLA modelling assumed a 70°C district heating flow temperature for all carbon
and cost modelling of heat pumps. Reducing the return temperature of water back to the district heating network
improves the efficiency of the heat source, as well as reducing pumping costs and allowing smaller diameter
pipework to be used. This is a key requirement for low temperature heat networks.
4.4.7 Summary
The analysis of possible energy sources is summarised in below. Those in green have been examined in further
detail.

AECOM Final Report 65
Capabilities on project:
Building Engineering
Table 3: High level review of potential energy sources
Technology Suitability for DE in
RBK Comments
Community gas
boilers Not suitable
Whilst technically viable, this is not expected to lead to financial savings which can justify the costs of the distribution network, and there are unlikely to be any environmental benefits.
Community
biomass/biogas
boilers
Not suitable
Technically suitable for connection to a DH network and will result in environmental benefits.
Requires significant plant space for the biomass boilers, fuel storage, thermal store and gas-fired top-up/back-up boilers. Also requires consideration of air quality.
Not expected to lead to financial savings which can justify the costs of the distribution network.
There are high risks surrounding future availability and cost of fuel, but the costs could be partially offset by the Renewable Heat Incentive.
Large power station
heat take-off Not suitable
Currently no suitable power stations locally which could supply waste heat to a DHN in Kingston.
A new local power station is possible but unlikely.
Industrial/commercial
waste heat Not suitable
There is no source of waste heat at Kingston Hospital. No other industrial waste heat sources have been identified.
Gas-fired CHP
Suitable for
connection to a
district heating
network
Gas CHP combines a mature technology with large CO2 reductions.
Biomass-fired CHP Not suitable
Biomass CHP can deliver large CO2 reductions and air quality issues can be addressed where plants are sufficiently large.
The technology at the proposed scale is currently considered to be immature / pre-commercial.
There are significant concerns over the availability and future cost of fuel.
Biogas-fired CHP
Potentially suitable,
depending on
availability of biogas
within Kingston
A small scale scheme based around water treatment could be viable. This is likely to make only a small contribution to the wider DHN and so is considered from an energy centre location perspective only.
Fuel cell CHP Not suitable The technology is currently considered uneconomic and immature. In the future, the CO2 reduction potential may be limited.
Energy from waste -
incineration Not suitable
Whilst technically feasible, this is not considered economically feasible.
An Energy from Waste plant has been developed in Sutton, which is taking waste from the RBK area.
It would not be economic to connect a DHN to the Sutton-based EfW plant because of the distance.
It is unlikely that an EfW site will be developed in RBK in the future.
Energy from waste -
Anaerobic Digestion, Not suitable
No current schemes using food waste from the Borough exist.
Potential for a future scheme to generate biogas from food waste, but a commercially viable scheme (1 MWe) would need to collect waste from 3 – 4 times the number of households in RBK.
Heat pumps - Water
source Suitable
Heat pumps are not predicted to save much (if any) CO2 under the current grid mix.
They may be more suitable for later phases of the development with decarbonisation of the grid. Under the current RHI heat pumps can perform cost effectively although there is no certainty over the future of the RHI. .
Heat pumps - Ground
and air source Not suitable
The limitations with capturing secondary heat from the ground or air at the scale required for DHNs means these systems are not suitable.

AECOM Final Report 66
Capabilities on project:
Building Engineering
4.5 Review of Energy Centre locations – Town Centre
As outlined in the scoping section, the level of future development in and around the Town Centre is likely to be
relatively limited with sites being bought forward generally on an ad-hoc basis. However the following specific
options have been identified for the location of heating plant or an energy centre.
4.5.1 Distributed plant – phase 1
In the early phases of the scheme, and for specific buildings, it may be preferable to make use of existing boiler
plant, and have a distributed boiler system for standby and peak supply, which involves some of all of the buildings.
Advantages of this option include reduced land take for central plant, potential for sizing the DH network for
baseload heat provision, resilience for customers, and maximising the use of existing assets. Disadvantages include
the need to operate, maintain, and replace dispersed plant (with a possible loss of economy of scale), possible
complex ownership and operation structures for the boilers, and long term future proofing.
If extensive use was made of distributed boiler plant, the remaining centralised generation plant (comprising CHP
plant, thermal storage (if centralised), and pumping equipment) could be located at one of the customer’s sites if
there is sufficient space available.
For a phase 1 scheme, location options could include:
The County Hall. There may be potential to locate a temporary packaged CHP plant in or around the
County Hall, making use of existing car park areas. The most obvious location is the car park located along
the West side of the building. Consideration would need to be given to acoustic pollution and aesthetics
given the proximity to residential areas.
The Kingston University Penrhyn road campus. Plant could be located in existing car park areas, or as part
of re-development of the Townhouse at the north of the site. This location is well suited due to the large load
presented by the Penrhyn Road campus on a Phase 1 scheme. Location on the University site will need to
consider land ownership and the role the University take in the scheme. They may wish to retain the land
for greater control, or sell or lease the land to the DE scheme.
The re-developed Kingfisher Leisure centre site (see section 4.5.4).
No other large areas were identified at customer’s sites, either externally to the buildings, or within existing plant
rooms.
For a distributed plant option for phase 1, the amount of central plant, and therefore land requirements, will depend
on the configuration of the scheme. It is suggested that an indicative 500m2 land requirement is assumed for a
Phase 1 distributed option subject to more detailed feasibility work. This would allow for one or two containerised
CHP engines, thermal storage, electrical and gas sub stations and plant rooms, and associated services such as
pumping equipment, oil storage, and staff facilities. This is typical of smaller schemes such as the Bunhill Energy
Centre at Islington.
4.5.2 Distributed plant – future phases
As the scheme develops, a mix of larger centralised, and de-centralised plant may be used. This may be due to
availability of suitable distributed plant (for example recently installed large boiler plant), existing centralised heat
generation plant (such as CHP at the Hospital, or heat pumps at the Power Station site development), or
optimisation of the network (providing local peak plant to reduce the network capacity).
At all stages of network assessment in the future, the opportunity for making use of decentralised plant should be
considered alongside centralised options. In general, the benefits of a large DE scheme are that larger more
efficient centralised plant can be used, and so the benefits of incorporating decentralised options will need to be
weighed against the alternative central options.
4.5.3 South East of the town centre – Eden Quarter
This location comprises the following areas:

AECOM Final Report 67
Capabilities on project:
Building Engineering
Clarence Street South (Area P2 in Figure 28)
East of Eden Street and the Ashdown Road sites (Area P3 in Figure 28)
St James area (Area P4 in Figure 28)
RBK have a vision for the Eden Quarter to improve retail and commercial facilities, access for pedestrians from the
town centre, and improve the general appearance and amenity. Area P2 is made up of the Eden Walk shopping
centre, parts of which are 40 years old and which the owners wish to redevelop. Areas P3 and P4 are made up of a
variety of lower grade uses including surface car parking owned by RBK. The overall proposals for the area are
covered by the “Kingston Futures” project, although little information is available at the time of writing due to the
recent creation of Kingston Futures.
The potential strategic re-development of the Eden Quarter could allow for an energy centre to be developed
somewhere within the areas outlined.
The Eden Walk shopping centre is of prime commercial value. AECOM have consulted British Land, the current
owners, and learnt that whilst British Land have long term plans for re-development, there are no specific proposals
at present. However British Land would be willing to engage and consider further the following aspects:
Re-development of the shopping centre to allow connection to a future DH scheme. This may include the
use of common heating services across the centre including retail units, rather than the current conventional
fragmented services.
Re-development of the shopping centre with the potential to include some centralised heat generation plant.
This could be as part of a de-centralised scheme (with the location of CHP plant in the area), or a larger
centralised energy centre.
Due to the land ownership, and commercial nature of the shopping centre combined with the central location, it is
likely that any significant land requirements in this area will have a large cost premium. The timescales for the re-
development are also uncertain and nothing could be incorporated until re-development occurs.
Areas P3 and P4 are under a variety of ownerships, including large areas of surface car parking owned by RBK.
The proposals outlined for this area in the K+20 AAP include a mix of amenity space, improved parking, retail and
residential, although no more detailed information is available at present covering the location and quantum, as
these will be defined through the Kingston Futures programme.
The proposals for P3 and P4 combined with their current status and ownership allow for the potential development
of an energy centre. The strategic redevelopment vision allows for the inclusion of an energy centre in the schedule
of development, and the land ownership combined with current low-value use as a car park, could enable an energy
centre to be developed in the near term, prior to further development works. This would require the inclusion of an
energy centre in the area to be considered as a priority by Kingston Futures. The location of this site is also close to
the proposed Phase 1 network route, adjacent to the Phase 2 routes, and location on the southern side of the site
adjacent to the busy A307 could be preferable for both the land uses, and connection to a DE scheme.

AECOM Final Report 68
Capabilities on project:
Building Engineering
Figure 28: Kingston Town Centre AAP – Vision key diagram (Taken from K+20 AAP)

AECOM Final Report 69
Capabilities on project:
Building Engineering
4.5.4 East of the Town Centre - Eastern Approach
This location comprises the following areas:
Cattle Market car park and Fairfield bus station. (Area P5 in Figure 28)
Kingfisher Leisure Centre and Kingston Library and Museum (Area P6 in Figure 28)
Former Fairfield nursery site (Area P7 in Figure 28)
Sites P6 and P7 are both RBK owned providing leverage for future use. However the sites are relatively
constrained and the main potential for locating an energy centre or decentralised plant may be with the re-
development of the leisure centre, possibly with the inclusion of a CHP plant located within the centre.
Site P5 is owned by Transport for London (bus depot) and RBK (the car park). The K+20 AAP proposes re-
configuration of this area to improve land utilisation, and there may be the potential for incorporation of an energy
centre, in particular on the car park area due to RBK ownership. The area of the existing car parking is estimated at
0.3 Ha and so depending on the amount of land which could be used, there is sufficient space for an energy centre.
4.5.5 North of the town centre
Redevelopment sites in the north of the town centre include the Gas Holder site (P19). This currently comprises gas
holders which are partially decommissioned. On the eastern edge of the site is the Art faculty for Kingston College
for which an extension is proposed.
The Gas Holder site is identified for future development in the K+20 AAP for a number of potential uses. AECOM
have consulted the planning consultants, QUOD Planning Services Ltd, who represent owners of the site Scotia
Gas Networks. Initial discussions have commenced with RBK and it is thought the site may be developed for
residential uses (circa 200 – 300 flats potentially) or student residences (circa 600 rooms). Current proposed
timescales are for a planning application in 12 – 18 months.
There may be potential to incorporate some heating plant or an energy centre on the site, but the overall area is
limited and the commercial pressure including decontamination works from the gas holders would mean that land
will be expensive. The location is potentially on phase 2 of the network route, but not adjacent to a main
transmission pipe or the ring main. In addition, the near term development of the site means that it is unlikely that an
energy centre could be developed for export of heat to a wider network due to absence of a network in the vicinity in
the near term.
4.5.6 Kingston Hospital
(A description of the Hospital site is provided in section 4.2.1)
The hospital site is relatively dense with no large areas for potential energy centre development. Most undeveloped
areas are used for car parking which is currently stressed, and it is not envisaged that any of this land could be
allocated to a large energy centre.
However the existing boiler house has some room for expansion and could accommodate additional plant. It is not
clear whether this space would allow for additional plant for heat export, or whether simply to provide additional
centralised heat generation for the hospital site itself.
The hospital also has plans for some re-development and modernisation, subject to funding. It is not clear at the
current stage what the scope of this will be, but there may be potential during this period for incorporation of
additional plant in the proposals, and potential reconfiguration of the heat network.
4.5.7 Hogsmill Sewage Treatment works
(A description of the STW site is provided in section 4.2.2)

AECOM Final Report 70
Capabilities on project:
Building Engineering
The Hogsmill site owned by Thames Water is relatively large and its use as a STW precludes re-development for
other uses. Alongside the current operational plant, the site also consists of empty land and redundant plant.
The strategic planning and development of water treatment infrastructure is subject to 5 year asset plans which are
approved by Ofwat. These effectively limit investment by the water companies and ensure that prices are regulated
for customers. The Hogsmill site is one of a number of STW sites which may need to be expanded to cater for
increased loads, and any expansion plans will be submitted to Ofwat and the next 5 year asset period is 2015 –
2019.
AECOM have consulted with the Thames Water property team to discuss options for using the land. Until the plans
for the next asset period are confirmed, it is not possible for Thames Water to make a commitment as to land
availability at the site. However in principle, Thames Water are keen to maximise the use of the site and view an
energy centre as a potentially suitable use. Whether land is leased or sold will depend on the exact location, and the
nature of the energy centre – clearly if the energy centre is in some way connected to the STW (for example through
biogas extraction or outlet water heat extraction), then the relationship would be different to a situation where the
energy supply is independent of the STW.
It is recommended that Thames Water are consulted with on a regular basis through the development of strategic
planning proposals for the Hogsmill area (see next section).
4.5.8 Hogsmill Valley and Kingsmeadow area
The Hogsmill STW takes up a large proportion of the Hogsmill area, but there are neighbouring land uses under the
ownership of RBK. Figure 29 shows a map of the land ownership with the majority of the area to the south owned
by Thames Water, and the area to the North, and South West by RBK. The other ownerships are considered
insignificant and have existing uses.
This area (including Thames Water) has previously been covered by the Kingsmeadow AAP and is currently being
included in a revised Hogsmill Valley AAP 26
. Proposals include making use of redundant STW land, developing
areas of under-used amenity and leisure space, and improving access. Whilst large parts of the RBK owned land to
the West will remain unchanged due to use as the Kingston and Surbiton Cemeteries, opportunities to the North and
East could be provided for a large centralised energy centre, if not on the Thames Water site. This should be
considered in any future work on the Hogsmill Valley AAP.
A waste transfer station is located at the North Western corner of the Hogsmill valley area under the ownership of
RBK, and managed by Viridor as part of the SLWP contract. The site is used for the aggregation and sorting of
waste prior to transfer to other waste processing sites.
Due to its location and ownership, the site had initially been identified as a potential energy centre location.
However consultation with RBK has concluded that any relocation of the waste transfer station would need to
happen after the current 25 year SLWP contract, and also that when previously contracted to SITA, alternative
locations were examined and no suitable ones found. Therefore this site is not considered any further.
26
http://www.kingston.gov.uk/browse/environment/planning/planningpolicy/local_development_framework/hogsmill_valley_dpd.htm

AECOM Final Report 71
Capabilities on project:
Building Engineering
Figure 29: Land ownership in the Hogsmill Valley area (provided by RBK).
4.5.9 River Side locations
The use of a river water extraction heat pump will necessitate the location of an energy centre along the side of the
Thames unless water is extracted and pumped to an alternative location.
The K+AAP identifies three main sites along the Thames:
P17: The old power station site. This has been redeveloped into flats, and includes small river water
extraction heat pumps for the site’s own heating demands.
P12: Bishops Palace House. This is an “unattractive” building from the 1970s which has been identified for
re-development into a mixed use development.
P13: Northern Riverfront. This site includes some vacant land in private ownership and has been identified
for re-development with mixed uses.
The riverside is prime development land and has such will have a high value. However if heat pumps are to be
used as a source of heat by extracting water from the river, then they will ideally need to be located alongside the
river to prevent the installation of additional pipework from the river to transport the water and the associated
pumping requirements. In light of this, it is suggested that an energy centre located along the river should be sized
for the minimum amount of plant necessary, i.e. the heat pumps and associated pumping and filtering equipment
only, and not any additional back-up boiler plant.

AECOM Final Report 72
Capabilities on project:
Building Engineering
It is recommended that RBK identify any future development opportunities and land availability along the river bank
for the inclusion of a heat pump energy centre, which may be a stand-alone building, or part of a mixed use
development, even incorporated into other buildings. It is uncertain exactly where suitable opportunities may arise
along the river bank, and so identification of a site will need to consider and potentially influence the layout of the
DHN in this area to ensure a connection can be made.
The location will also need to consider access to the river to allow installation of water extraction and re-injection
equipment. An ideal location would be on the re-developed power station site, if land is available, and may be able
to make use of the redundant arrangements and location for water extraction and re-injection that was used by the
power station 27
.
4.5.10 Distributed sources of low grade heat
The GLA secondary heat report identifies a number of other smaller scale sources of heat which may be upgraded
using heat pumps. These by their very nature are distributed at the source of low grade heat, and therefore any
heat pumps will need to be located at these distributed sites.
It is recommended that during the development of any DE scheme in Kingston, potential local sources of low grade
heat are identified, such as waste heat from building cooling systems, and heat extraction heat pumps installed
where viable when making a DH connection to each site.
4.5.11 Considerations when locating an energy centre
An energy centre can be developed in a range of forms designed to suit the surrounding area and neighbouring
building uses. The building can be stand-alone, or incorporated into other buildings (including residential), and can
take a simple form (such as an industrial shed) or be architecturally more advanced. An energy centre will typically
be two storeys tall to allow for plant installation although additional height could allow the footprint to be reduced
through careful plant layout.
The actual buildings is therefore relatively flexible allowing location in a range of sites. However the following
requirements must also be considered:
Air quality. The use of fuel burning technologies such as gas CHP will need air quality to be considered,
especially when located in an air quality management area such as the Town Centre area. The mitigation
measure required will depend on the nature of the AQMA and the technology used in the DE scheme. In
general, gas CHP, sometimes with flue cleaning technologies, can be accommodated in AQMAs
successfully. Many urban AQMAs are due to low level particulate pollution arising from diesel vehicles,
whilst the flue gases from gas CHP are low in particulates and exhausted at a high level away from
receptors.
Flue heights. A flue will be required to exhaust flue gases from the CHP units and boiler plant (if present)
such that the exhaust gases do not impact on neighbouring buildings and sites. Dispersion analysis will be
required on a site-by-site basis to determine the requirements of the flue, but a typical benchmark for the
flue is that it must have a height of at least 3 m more than neighbouring buildings. Careful architectural
design and placement can ensure flues are unobtrusive and fit in with the surroundings. Where thermal
storage is incorporated, the flue could be incorporated alongside a vertical cylindrical thermal store.
Access. Sufficient road access is necessary for the delivery of plant and the replacement of plant. Due to
the size of CHP plant, boilers, and thermal stores, the access should allow the use of large articulated
vehicles. Where space in the energy centre is limited, it may be necessary for the energy centre building to
include de-mountable walls (eg cladding) to allow the servicing and replacement of equipment along the
sides of the building. Again this will need to consider access, but also the ability to use (albeit on an
infrequent basis) neighbouring areas (for example car parks) when required.
27
The energy statement submitted as part of the Kingston Heights development at the power station site suggests that the existing cooling water ducts for the power station remain, and could be re-used once the caps are removed.

AECOM Final Report 73
Capabilities on project:
Building Engineering
4.5.12 Summary of town centre site options
Table 4 provides a summary of the town centre energy centre site options including:
Suitability of site for connection to a DE scheme
Availability of site / ease of delivery
Constraints
Options for phasing
Conclusions

AECOM Final Report 74
Capabilities on project:
Building Engineering
Table 4: Summary of energy centre locations.
Site Suitability for connection Availability Constraints Phasing options Conclusions
Distributed plant phase 1 – County Hall
This is a central location on the Phase 1 network and could allow the incorporation of CHP plant and ancillary equipment
Owned by Surrey County Council and so could be acquired, potentially as part of a partnership. Current use as car parking allows early development.
Adjacent to both the County Hall and residential areas. Noise and visual impact will need to be considered.
Suitable for initial phases of the network.
Discussions should commence at the next stage of feasibility with the County Council to ascertain viability.
Distributed plant phase 1 – Kingston University Penrhyn Road
This is a central location on the Phase 1 network and could allow the incorporation of CHP plant and ancillary equipment
Land owned by Kingston University, and may require negotiations to acquire or make use of. Car park areas may be available in the short term, but the north Townhouse area would need to wait for redevelopment.
Energy centre / plant would fit in with the current research nature of the site, but consideration required of noise and visual impact.
Suitable for initial phases of the network.
RBK should open discussions with Kingston University to ascertain future plans for the campus. This may include discussions around ownership and governance of the phase 1 scheme.
Distributed plant – future phases
Depends on location. Depends on location. Depends on location, but will need to consider existing / remaining site uses.
Potentially suitable for future phases of a DE scheme if providing benefits over larger centralised generation.
To be considered during each stage of DE scheme feasibility work.
Eden Quarter – P2
Located close to phases 1 and 2 of the network facilitating ease of connection.
Privately owned land, and an energy centre could only be developed on re-development of the Edenwalk shopping centre. Potentially a high development cost, although planning policy could be used to require the construction of an energy centre.
Located in retail centre and so careful consideration will be required of a number of environmental factors.
Re-development requirement means that this is likely to be an option for future phases of the network and not phase 1.
Potential for further examination and discussion with British Land, but sites P3 and P4 are more suitable.
Eden Quarter – P3 and P4
Located on the south side of the town centre close to phase 1 and adjacent to phase 2 and the ring main.
Certain areas of land owned by RBK, and current use as surface car park could afford immediate delivery with consideration of long term vision.
Located in a future retail and commercial area, and so careful design consideration required to ensure an energy centre is compatible with future uses.
Suitable as a central energy centre location for phase 1 and future phases. Potential for re-development at a later date if other sites are used later.
This site needs to be included as a priority within the masterplanning of the area and Kingston Futures. Viability of using car parking needs to be assessed.
Eastern Approach – P5 (Bus station and car park)
Located close to the Phase 1, Phase 2, and ring main networks. Potential for delivery of a large centralised energy centre if car parking can be reduced.
Ownership of car parking uncertain but not under RBK ownership therefore the commercial value of the land will need to be considered.
This is a heavily used public and and gateway to the town centre, and so careful incorporation required to minimise effect on local environment.
Suitability will depend on timescales for re-development.
This site needs to be included as an option during further scoping studies for re-development of the area.
Eastern Approach – P6 (Kingfisher Leisure centre) and P7
Located close to the Phase 1, Phase 2, and ring main networks.
Council ownership and re-development of leisure centre could allow incorporation of decentralised CHP plant, but space is limited for a large central energy centre.
Consideration is required if a large CHP engine and associated plant is to be co-located with the leisure centre, although no specific constraints are identified.
Suitability for phased connection will be determined by the timescales for the leisure centre redevelopment.
Maintain engagement with the leisure centre development team to ensure this is retained as an option during future Phase 1 feasibility study work.
Gas Holder Site Located on a spur of the north of Owned by Scotia Gas Networks Potential contamination issues Suitable for phases 2 and Further engagement should aim

AECOM Final Report 75
Capabilities on project:
Building Engineering
Site Suitability for connection Availability Constraints Phasing options Conclusions
Phase 2 and main networks. Not suitable for connection to the current identified Phase 1 network.
who want to realise commercial value of land. Current ambition for residential development.
which will increase development costs, but could favour an energy centre over residential uses. Design needs to consider neighbouring college site.
beyond only due to remoteness from phase 1, but development of site is incompatible with network proposals.
to ensure that a heat network is developed on the site, suitable for a future connection to phase 2 of the DE scheme.
Kingston Hospital
Located in future phases of the network and so not suited to phase 1 and 2. The size of the hospital (as a consumer and potential generator) justifies a branch connection.
Owned by the NHS and so public sector leverage and policy may encourage engagement. Currently no land available on the site, but future re-development may allow incorporation of an energy centre.
Consideration is required of neighbouring hospital and residential uses, but nature of a hospital site should allow for incorporation of further plant.
Suitable for long term network connection and not Phases 1 or 2.
Further engagement with hospital to ensure that re-development of site and services improves connectivity and loads for a future network, and identifies opportunities for hosting additional heat generation plant.
Hogsmill Sewage Treatment Works
Located on the ring main and so suited for future phases. A connection for phase 1 would be expensive and unlikely to be viable. Potential synergies between STW and energy generation and use.
Owned by Thames Water. In principle, spare land may be available, and Thames Water are keen to maximise asset value. Other uses for the land are limited and so an energy centre could be a suitable option.
Few constraints considered due to existing use of the site as a STW.
Most likely suitable for future phases of the DE scheme unless viability can be justified for Phase 1 and no other more central locations are found. Phasing needs to consider the Ofwat asset periods.
Further engagement with Thames water to ascertain land availability and costs, and maintain strategic relationships in terms of energy production and sales.
Hogsmill Valley Area (RBK land) including waste transfer station.
Located on the ring main and so suited for future phases. A connection for phase 1 would be expensive and unlikely to be viable.
RBK land ownership accesses land at a low cost. Certain areas, in particular adjacent to the STW, are likely to be unattractive for alternative uses making an energy centre an attractive option. Waste transfer station in RBK ownership but required for foreseen future for waste management.
Depends on exact location, but may need to consider location adjacent to residential areas. Sensitive design may also be required if adjacent to the Cemetery areas.
Most likely suitable for future phases of the DE scheme unless viability can be justified for Phase 1 and no other more central locations are found.
Inclusion of energy centre within the Hogsmill Valley AAP development.
Thames side - for river water extraction with heat pumps.
Located close to Phase 2 of the network. May require some re-configuration of the network depending on location of the site.
Identified land in private ownership and identified for re-development. A small energy centre could be included as part of the new developments.
High value land for high value development. Any proposals will need to minimise land take.
Suitable for connections from phase 2 onwards. Likely to provide larger CO2 benefits in later phases of a DE scheme (around 2020s onwards).
RBK need to identify any parcels of land which appear along the Thames and assess potential for incorporation of a heat pump energy centre. Engagement required with the power station site to see whether additional plant can be accommodated on the development.
Distributed sources of low grade heat
Location dependent. Many of the sources from buildings are likely to be close to the network as the buildings may have a DH connection.
Depends on location. This may require heat capture heat pumps to be located at a number of sites which may or may not be in private ownership.
Site and source dependent. Suitable for all phases where viable.
Sites to be identified during detailed feasibility work.

AECOM Final Report 76
Capabilities on project:
Building Engineering
In summary, the following key conclusions are made in relation to energy centre locations:
i) The phase 1 network should investigate both a decentralised peak and standby boiler plant option and
centralised boiler plant option:
a. Decentralised with CHP plant located at either the County Hall, University Penrhyn Road site, or
Kingfisher Leisure Centre;
b. Centralised option with an energy centre on existing RBK car park areas in the Eden Quarter (P3
and P4) or potentially the bus station site (P5).
ii) Irrespective of whether a de-centralised or centralised option is selected for phase 1, early work is
needed on allocating land for an energy centre for Phase 1 and Phase 2. The most suitable locations
are P3, P4, and P5, although discussions should also commence with British Land to identify
opportunities for incorporation into a re-developed Edenwalk shopping centre (P2).
iii) Strategic long term energy centre locations need to be identified and allocated in relevant strategy
documents:
a. The Hogsmill Valley area (either Thames water land or RBK land) needs to consider the location of
an energy centre within the forthcoming Hogsmill Valley AAP.
b. Ongoing communication with Kingston Hospital is required to identify opportunities for locating plant
at the hospital site.
iv) A riverside location should be identified for a heat pump energy centre by the Thames, either on a site
identified for re-development, or an existing site.
v) A number of smaller heat pump installations could be made around the network where suitable
secondary sources of heat are identified.
In addition to the above specific opportunities, identification of land for an energy centre should remain a
consideration when identifying areas for re-development, and drawing up strategic land allocations and AAPs.
4.6 Summary
This section provides an assessment of the energy supply opportunities for DE schemes in RBK.
The RBK Heat Mapping study identified the Hospital and STW as potential sources of heat. However following
consultation, neither of these sites are deemed to have potential for exporting heat from current plant or equipment.
The hospital has a CHP and steam main system with all heat used on site. There may be opportunity for hosting
some additional plant, but the site is relatively constrained. The STW also includes a CHP system on site powered
by bio-methane, but the heat and electricity output is used on site, and there is no foreseen potential for additional
bio-methane production.
From a technical perspective, the most suitable technologies for producing heat are gas fired CHP systems and
large scale heat pumps.
Gas CHP engines are a mature and reliable technology with advantages of modularity and a large range of sizes.
Under the current grid electricity generation mix, gas fired CHP engines can provide large CO2 savings, and if the
electricity can be sold for a sufficient value, economic operation which can help fund the DH network development.
Large scale heat pumps do not currently reduce CO2 emissions due to the relatively high CO2 intensity of the
electricity grid. However as the grid decarbonises they could provide large CO2 savings in the future and act as the
long term heat supply technology. The efficiency of heat pumps is improved with low temperature outputs, and a
source temperature which is as high as possible. To potential sources of secondary heat identified are the River
Thames and the outlet from Hogsmill STW, and both of these could be used on a future DE scheme.

AECOM Final Report 77
Capabilities on project:
Building Engineering
Finding land for an energy centre/s will be critical for the development of DE in RBK. In the short term, a phase 1
network could make use of distributed boiler plant, and a central CHP engine either at the Kingston University
Penrhyn Road campus, the Surrey County Council buildings, or if completed in time, the redeveloped Kingfisher
Leisure centre. An alternative location is on existing surface car parking in the Eden Quarter, which would allow the
development of a larger centralised energy centre, which could also be used to power a phase 2 scheme.
The main long-term option for an energy centre is in the Hogsmill Valley area, either on RBK land or on the Thames
Water STW site. This provides opportunities for using secondary heat from the STW outlet in a large heat pump for
future phases. The location of an energy centre in the Hogsmill Valley, in an area which can potentially connect to
the STW outlet, should be seen as a priority for the forthcoming Hogsmill Valley AAP .
If heat pumps are to be a long term strategy taking secondary heat from the River Thames, a location is also
required along the river bank. Therefore suitable locations, including potentially as a future addition to the power
station site, need to be identified and promoted through planning.

AECOM Final Report 78
Capabilities on project:
Building Engineering
5.1 Introduction
This section describes the energy demands within the Borough to identify potential customers who could connect to
DE schemes. A more detailed discussion of the major potential customers is provided which is used to assess their
suitability for connecting to a network, and how they may influence the network design or phasing. This section also
includes a summary of site visits to some of the major consumers in a phase 1 scheme.
5.2 Data collection - existing sites
The main consumers of energy have been identified using the RBK Heat Mapping Study as the prime source of
information. For smaller loads, the RBK Heat Mapping study data is used directly to provide information on heat
demands. For larger loads, in particular in the area of the town centre phase 1 scheme, where understanding the
size and nature of the heat load is important, new data requests were sent to the relevant “Large” heat consumers
(as listed in Table 5.1 of the RBK Heat Mapping study) and some additional sites of particular importance. These
data requests were then followed up by further questions and discussion where required. A list of the large sites is
provided in Table 5.
Table 5: Sites for which individual consultation was conducted
Site name Comments
RBK Heat Mapping study “Large” Heat consumers
Kingston Hospital
This is the largest energy consumer considered for connection to the
DHN, it is further out at about 1.5km for the Town Centre, so would only
be considered for a later phase. It could be a suitable site for an Energy
Centre as discussed earlier. The site has a steam distribution system
which is about to be replaced, and is powered by a gas engine CHP.
Further information was requested to determine future plans for the site
and its heating system.
Edenwalk Shopping Centre
The location of Edenwalk shopping centre makes it well placed for
connection to a town centre DHN. At present only the central atrium
areas and office accommodation is on a central heating system. All
retail units are on independent systems, predominantly electricity based.
. Under this configuration connection to DHN would be less favourable.
There is potential for future redevelopment of this site, but there are no
further details available at present. However re-development of the
shopping centre could provide an opportunity to install a site-wide
heating scheme.
David Lloyd Gym
David Lloyd gym is part of a larger complex called The Rotunda,
containing cinema, bowling alley and restaurants. The location of the
gym would make it suitable for connection if extending a northern branch
from a town centre, as a second phase, or a later extension.
Kingston University Penrhyn Road , Knights Park
Middle Mill & Clayhill
There are a number of University sites with potential for connection to a
DHN. The most likely site for connection to the Phase 1 is the main
Penrhyn Road site, both in terms of location and heat load.
Kingston College Kingston College is well placed for inclusion in Phase 1 of and is likely to
for a key customer so further information was requested.
5 Energy demands

AECOM Final Report 79
Capabilities on project:
Building Engineering
Surrey County Council
Surrey County Council is located next to Kingston College and has been
identified as a “Large” Heat Customer, so is considered to be of
importance for Phase 1.
John Lewis Plc
John Lewis has the largest gas consumption of all of the individual retail
units identified in the RBK Heat Mapping Study. This makes the site of
potential importance for connection to DHN around the Town Centre
area.
Marks & Spencer
Similarly to John Lewis, Marks & Spencer is considered to be one of the
larger retail units in the town centre so could be an important customer
to consider for Phase 2, further information was requested.
Kingston Power Station (Kingston Heights & Kingston
Riverside)
This area was granted overall consent in 2008 for 359 apartments and a
150 room hotel. The close location to the Thames has enabled the site
to include a water-source heat pump, and could be the location for a
future DE scheme heat pump energy centre.
Additional sites of interest
Crown Court
The Crown Court was not identified in the RBK Heat Mapping study,
presumably due to not appearing on the common databases used. Its
size and location between the County Hall and College makes is a
potentially important and obvious inclusion for Phase 1. Further
information was requested.
Guildhall and Guildhall 2
These are not identified in the RBK Heat Mapping study as a Large
consumer due to being split into the 3 Guildhall buildings. Due to the
obvious ownership interest and overall size, further information was
requested for these buildings. .
Bentalls Shopping Centre and Department Store
Bentalls Shopping Centre contains the Bentalls department store as well
as a number of other smaller retail units. For any network that connects
to John Lewis or extends north to Kingston Power Station
Redevelopment, a connection to Bentalls should also be considered. As
with Edenwalk shopping centre, the nature of the load is important as
most shopping centres make use of individual heating systems for each
retail unit.
Cambridge Road Estate – RBK Housing
This site consists of 650 social homes owned by RBK. 240 homes are
located in the Brinkley, Madingley, Graveley, and Childerley 15 storey
tower blocks, with the remaining in low rise flats.
This estate has recently been retrofitted with new wet heating systems
(it used electric heating originally), and individual gas fired condensing
boilers in each unit. The opportunity has thus been missed to retrofit
with a community heating system in the near term, but this may be an
option in future phases of a DE scheme when the boilers need
replacement. The central ownership of RBK could help facilitate this,
although leasehold arrangements, if any, will need to be considered.
Further information on the data received and any follow up discussions is provided in Appendix 1: Site visits. As can
be observed, the data request process had a varying degree of success with some sites unable to provide some or
all of the data requested. This shows the importance of RBK developing a robust communication strategy as part of
their DE development programme to ensure there is buy-in from all potential customers.

AECOM Final Report 80
Capabilities on project:
Building Engineering
5.3 Assessment of RBK data
The RBK Heat Mapping study data has been used as the basis for this study, with additional information obtained
on the large loads as described above. . It is important to note that the RBK Heat Mapping dataset contains
information for a large number of buildings from a range of sources, and a comprehensive check of this data and
verification is beyond the scope of this EMP. Therefore a simple approach was taken to sense-check the
information
Where data is provided and based on data collection from the building occupiers or managers, this is
assumed to be correct. It is assumed that no further changes have been made to the buildings which affect
heat demand since the original data collection for the RBK Heat Mapping study.
Where benchmarks have been used for non-domestic buildings, a simple check has been made by dividing
the stated annual fuel consumption by the GIA where available. The expected energy consumption varies
for different building types so the buildings for connection to the DHN are categorized in terms of building
type and checked against the CIBSE Guide TM46 benchmarks.
For domestic buildings, the gas consumption per dwelling in the RBK heat mapping study ranges from
6.5MWh to 15MWh per year. The assumptions used for the new and proposed developments give a gas
consumption of approximately 4.5MWh per dwelling based on a relatively small flat size and current building
regulations. Both of these appear reasonable and in line with models of new dwellings and average
consumption from existing dwellings. Therefore the data from the RBK Heat Mapping study is assumed to
be reliable for flats.
In general, most of the information provided from the RBK Heat Mapping study showed a good match with the
benchmarks. Key inconsistencies in the RBK Heat Mapping study included:
It was assumed that the retail units in the Bentalls shopping centre, and Eden Walk shopping centre were
on a common gas fired boiler system. Consultation with the shopping centres showed that only the central
atria areas (and the Millennium House office area for Edenwalk) are on the centralised system, and all
individual retail units are on separate systems electrically powered. This makes a DH connection to all
these units unviable without major retrofit.
The RBK Heat Mapping study identified Regents Court, a large development of private flats located to the
North of the Railway station, as being heated by a common gas fired system. Research shows that these
units all have individual electric radiant panel heating systems, and are therefore not suited for connection to
a DE scheme without major retrofit.
Further information on inconsistencies are identified in Appendix 2: Energy demand analysis
5.4 Site visits
Site visits were carried out for the major consumers considered for the first phase of a DHN, with details given in
Appendix 1: Site visits. The sites were selected based on their size, the opportunity they present for connection to a
DE scheme, and on the basis that some energy users may be more complex, requiring a more in-depth
understanding.
The following sites were visited:
RBK Guildhall buildings (Guildhall, 2, and 3).
Kingston College
County Hall
Kingston University Penrhyn Road site

AECOM Final Report 81
Capabilities on project:
Building Engineering
Kingston University Knights Park site
Bentalls shopping centre
Edenwalk shopping centre
David Lloyd gym
The aim of the visits was to obtain information on:
The location of existing plant and distribution around sites
Access potential for a DHN connection including routing of pipework
The type of existing heating system to assess compatibility
No site visits were made to the Tolworth area. The only site of interest (from the scoping work) is the Tolworth
Tower complex and no suitable contacts were found at the time.
5.5 Assumptions used in developing energy load information
For the DE scheme concept design and assessment, a monthly profile is used to optimise the number and size of
CHP engines and boilers, as well as thermal storage. The peak energy demand is also used to model the network
and determine the size of the pipes required, and ensure sufficient peak heat generation capacity is provided.
For the major energy consumers this information was requested directly. Where this information could not be
provided and only annual energy demand was available, for example from the RBK heat mapping study, the
following assumptions were used to estimate the peak demand and monthly profile:
10% of the total annual demand for non-domestic buildings is for DHW. This forms a constant base load
and is evenly spread across the year. The remaining 90% of the annual demand is for space heating, which
varies according to the season, and is accounted for by 20 year average degree days28
, assuming there is
no space heating required for the months of June to August inclusive.
For dwellings, assume a baseline demand of 2,500 kWh per dwelling per year for hot water. The remaining
demand is accounted for by 20 year average degree days.
For new build dwellings, assume the hot water consumption accounts for 67% (two thirds) of the heating
demand, which forms the baseline of the annual profile. The remaining third, for heating, is accounted for by
20 year average degree days. (Note that the actual split will depend on the dwelling type, but this simple
approximation is typical of new build flats with very low space heating demands).
The peak load for each building is based on the annual heating demand with a 10% load factor where
alternative information is not available. This provides a suitable order of magnitude value, and from
AECOM’s experience on other schemes, is typical of many non-domestic buildings. This is used to size the
DHN and the heat exchangers.
Other general assumptions include:
All energy data is provided in terms of consumption, so to determine demand an efficiency of 80% is
assumed for all boilers.
Gas price = 2.6p/kWh is used where not other information is provided
28
Information on degree days is taken from www.vesma.com using a 20-year average for the Thames region.
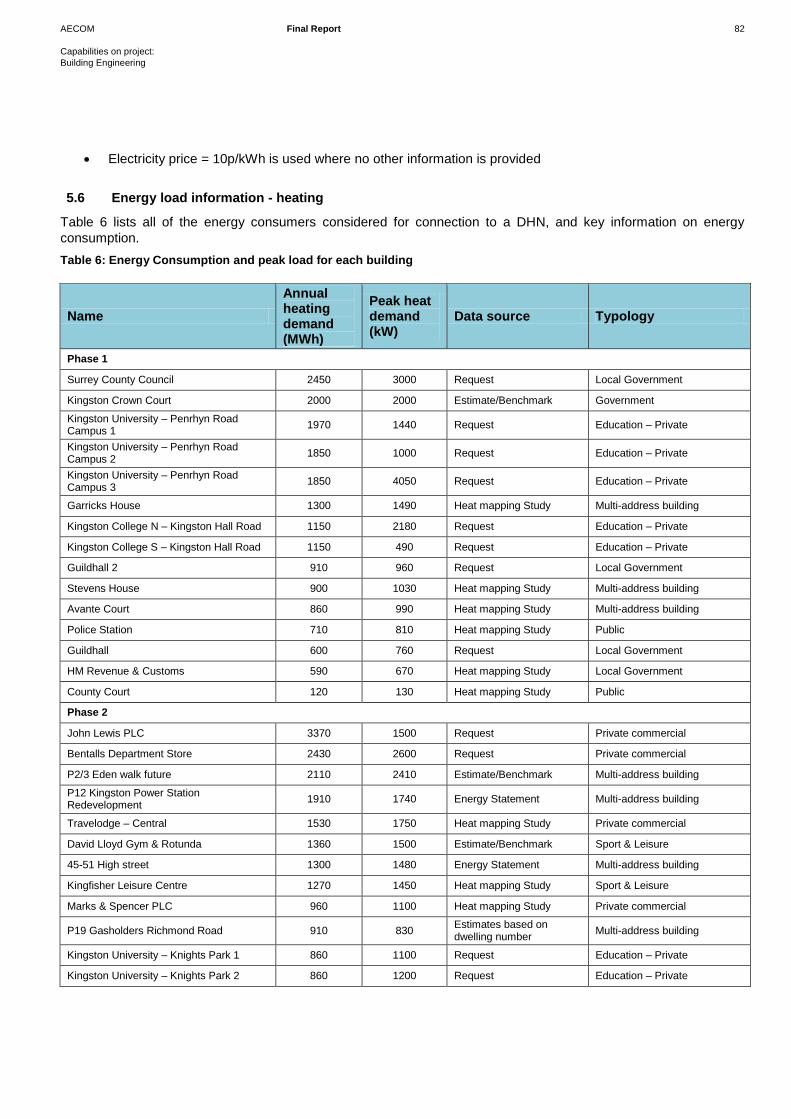
AECOM Final Report 82
Capabilities on project:
Building Engineering
Electricity price = 10p/kWh is used where no other information is provided
5.6 Energy load information - heating
Table 6 lists all of the energy consumers considered for connection to a DHN, and key information on energy
consumption.
Table 6: Energy Consumption and peak load for each building
Name
Annual heating demand (MWh)
Peak heat demand (kW)
Data source Typology
Phase 1
Surrey County Council 2450 3000 Request Local Government
Kingston Crown Court 2000 2000 Estimate/Benchmark Government
Kingston University – Penrhyn Road Campus 1
1970 1440 Request Education – Private
Kingston University – Penrhyn Road Campus 2
1850 1000 Request Education – Private
Kingston University – Penrhyn Road Campus 3
1850 4050 Request Education – Private
Garricks House 1300 1490 Heat mapping Study Multi-address building
Kingston College N – Kingston Hall Road 1150 2180 Request Education – Private
Kingston College S – Kingston Hall Road 1150 490 Request Education – Private
Guildhall 2 910 960 Request Local Government
Stevens House 900 1030 Heat mapping Study Multi-address building
Avante Court 860 990 Heat mapping Study Multi-address building
Police Station 710 810 Heat mapping Study Public
Guildhall 600 760 Request Local Government
HM Revenue & Customs 590 670 Heat mapping Study Local Government
County Court 120 130 Heat mapping Study Public
Phase 2
John Lewis PLC 3370 1500 Request Private commercial
Bentalls Department Store 2430 2600 Request Private commercial
P2/3 Eden walk future 2110 2410 Estimate/Benchmark Multi-address building
P12 Kingston Power Station Redevelopment
1910 1740 Energy Statement Multi-address building
Travelodge – Central 1530 1750 Heat mapping Study Private commercial
David Lloyd Gym & Rotunda 1360 1500 Estimate/Benchmark Sport & Leisure
45-51 High street 1300 1480 Energy Statement Multi-address building
Kingfisher Leisure Centre 1270 1450 Heat mapping Study Sport & Leisure
Marks & Spencer PLC 960 1100 Heat mapping Study Private commercial
P19 Gasholders Richmond Road 910 830 Estimates based on dwelling number
Multi-address building
Kingston University – Knights Park 1 860 1100 Request Education – Private
Kingston University – Knights Park 2 860 1200 Request Education – Private

AECOM Final Report 83
Capabilities on project:
Building Engineering
Name
Annual heating demand (MWh)
Peak heat demand (kW)
Data source Typology
Quebec House 670 770 Heat mapping Study Multi-address building
Thames Side Wharf Vicarage Road 610 560 Energy Statement Multi-address building
Kingston University – Middle Mill 590 680 Request Education – Private
P8 East of Clarence Street 510 640 Estimates based on dwelling number
Multi-address building
Museum and Heritage Service 440 510 Heat mapping Study Sport & Leisure
Curves 410 470 Heat mapping Study Sport & Leisure
P4 St James Area 360 800 Estimates based on dwelling number
Multi-address building
P19 Kingston College Richmond Road 280 320 Request Multi-address building
Bedelsford School 270 310 RBK Education – Private
Bentalls Shopping Centre 170 1000 Heat mapping Study Private commercial
Library 140 160 Heat mapping Study Local Government
P5/6 Bus Station/ Leisure Centre redevelopment
140 120 Estimates based on dwelling number
Multi-address building
Schools Library Service 40 50 Heat mapping Study Local Government
Eden Walk Shopping Centre 20 20 Request Private commercial
Phase 3
Kingston Hospital 37600 42900 Heat mapping Study Healthcare
Kingston University Clay Hill 2390 2730 Heat mapping Study Education - Private
Cambridge Road - Brinkley 1580 980 Heat mapping Study Multi-address building
Cambridge Road - Madingly 1580 980 Heat mapping Study Multi-address building
Cambridge Road - Graveley 1580 980 Heat mapping Study Multi-address building
Cambridge Road - Childerley 1580 980 Heat mapping Study Multi-address building
Tiffin School 1060 1210 RBK Education - Local Government
Wolverton House 900 1020 Heat mapping Study Multi-address building
Kingston Grammar School 670 770 Heat mapping Study Education - Private
Bausch & Lomb House 580 660 Heat mapping Study Private commercial
Buick House 490 560 Heat mapping Study Multi-address building
King Athelstan School 230 270 RBK Education - Local Government
St Johns C of E School 110 130 RBK Education - Private
Table 7 gives the total monthly profile of each of the different building typologies, shown graphically in Figure 30 .
This total includes energy consumers listed in the table above split by phase of DHN. This shows that due to the
predominantly commercial and public sector nature of the customers, the monlty profile is dominated by winter
space heating demands. It should be noted that if more accurate monthly data was obtained from individual
customers rather than the use of assumptions, then the exact nature of the profile could be established.

AECOM Final Report 84
Capabilities on project:
Building Engineering
Table 7: Monthly heating profile by Phase
Phase Monthly Heat Demand (MWh)
Jan Feb Mar Apr May Jun Jul Aug Sep Oct Nov Dec
1 2900 2700 2300 1600 1200 300 200 200 800 1000 2200 2800
2 6400 6100 5100 3700 2800 900 800 600 1700 2600 4700 6200
3 14700 13500 11700 8400 5700 1300 1200 1000 3300 6000 10700 14700
Figure 30: Graph of heat demand profile by phase
The charts in Figure 31 provide a breakdown of the annual heating demand by phase and tenure.
In phase 1, the heat loads are dominated by the Education sector, with almost half of the heat demand from the
Kingston University Penrhyn Road campus and the college. The Kingston University site is around three quarters of
this and so could be considered the anchor load for a phase 1 scheme in terms of annual heat sales. If the
Education sector was considered as a public sector customer, then over 80% of the Phase 1 heat load is with the
public sector.
In phase 2, there is a greater diversity in demand by sector, with the private commercial sector (predominantly retail)
making up almost one fifth of the annual demand. Multi-address customers with new development in the town
centre also accounts for almost one third of the annual demand.
The phase 3 network shows a large transition in customer base with the connection of Kingston Hospital. The
hospital provides a significant baseload of over 40% of the annual heat demand. This shows the importance of
working with the NHS Trust during the development of the scheme, and to identify the role the hospital may take,
either as a heat purchaser or supplier.
0
2000
4000
6000
8000
10000
12000
14000
16000
Jan Feb Mar Apr May Jun Jul Aug Sep Oct Nov Dec
Mo
nth
ly h
eat
ing
de
man
d (
MW
h)
Month
Phase 1
Phase 2
Phase 3

AECOM Final Report 85
Capabilities on project:
Building Engineering
Phase 1: Total demand 18,200 MWh / yr
Phase 2: Total demand 41,600 MWh / yr
Phase 3: Total demand 92,200 MWh/ yr
Figure 31: Pie charts of Annual heating demand by building type for each phase
Healthcare, 0, 0%
Multi-address building, 3070, 17% Sport & Leisure,
0, 0%
Education - Private, 7990, 44%
Local Government, 4550, 25%
Education - Local Government, 0, 0%
Public, 830, 4%
Government, 1800, 10%
Private commercial, 0, 0%
Healthcare, 0, 0%
Multi-address building, 11900, 29%
Sport & Leisure, 3490, 9%
Education - Private, 10600, 25%
Local Government, 4740, 11%
Education - Local Government, 0, 0%
Public, 830, 2%
Government, 1800, 4%
Private commercial, 8480, 20%
Healthcare, 37600, 41%
Multi-address building, 19600, 21%
Sport & Leisure, 3490, 4%
Education - Private, 13700, 15%
Local Government, 4740, 5%
Education - Local Government, 1300,
1%
Public, 830, 1%
Government, 1800, 2% Private commercial,
9050, 10%

AECOM Final Report 86
Capabilities on project:
Building Engineering
Further information is provided on the energy demand analysis, including detailed descriptions of individual sites, in
Appendix 2: Energy demand analysis.

AECOM Final Report 87
Capabilities on project:
Building Engineering
6.1 Introduction
This section describes the options for DHNs in the Town Centre and Tolworth areas. Based on the energy demand
analysis, network options are developed which link together the identified potential customers. Routing of the
network options is considered based on major opportunities and constraints. The network options also consider
phasing, with a more detailed analysis of the Phase 1 options.
6.2 District heating network design considerations
Before considering potential network layouts for RBK, a number of factors need to be considered which may
influence the DHN layout and design .These include:
The flow and return temperature difference.
The operating temperatures
The choice of layout type
The phasing of the network and future expansion
The location of the energy centre
Distribution of energy supply sources
These are discussed in more detail in this section, and help inform the analysis of network options for RBK.
6.2.1 Flow and return temperature difference
The capacity of the network to transmit thermal energy is determined by the difference in flow and return
temperatures. Modern networks designed for LTHW distribution typically operate with a flow of around 90C and a
return temperature of around 50C – 60C giving a temperature difference T of circa 30C - 40C. The T
determines the amount of thermal energy which can be extracted, with a larger T allowing more thermal energy to
be extracted for the same volume of water.
DHN pipes are sized to carry the required thermal load. The combination of T and the desired flow rate results in a
pipe diameter. The optimisation of diameter also needs to consider pumping energy requirements such that pipes
are sized to be economic and with low heat losses (suggesting a small diameter), but with acceptably low pressure
losses and pumping requirements (which requires a larger diameter). For this study, it is assumed that optimal pipe
diameters will be given if a maximum flow velocity of 2.5 m/s and maximum pressure drop of 250 Pa/m are
assumed.
For the purpose of this study, a T of 30C is assumed to inform the sizing of the network. This is conservative and
allows for some future increase in load carrying capacity if a larger T can be achieved. It also allows for a low
temperature operating regime (see below).
6.2.2 Operating temperatures
Whilst the temperature difference on a network determines the load carrying capacity, the actual operating
temperatures impact on the building heating systems and the energy supply technologies.
The typical flow and return regime of 90/60C is potentially suited for connection to existing buildings which have
heating systems design to operate at circa 80/70C if the return temperature of the heating system can be reduced.
If the operating temperatures are too low, then the average temperature is reduced and the building’s heating
6 Energy distribution analysis

AECOM Final Report 88
Capabilities on project:
Building Engineering
system may be undersized to provide adequate heating at the lower average temperatures. In reality, there is some
flexibility here:
Building heating systems are often oversized, and there may be some leeway for operating at lower
temperatures without any impact on thermal comfort.
Heating systems are designed for extreme temperatures and therefore even if the temperatures from the
DHN are lower than the heating system’s design temperature, adequate heating will be available for the
majority of the year with only a small drop in extreme conditions (further information on this is provided in
the GLA secondary heating study, footnote 15).
For older buildings, the heating systems may be refurbished in the future, allowing the incorporation of lower
design temperature systems (effectively larger and more efficient heat emitters). In addition, thermal
efficiency improvements to existing buildings may have reduced the heating demand thus allowing for a
reduction in operating temperatures.
The considerations above mean that whilst the operating temperatures for buildings which are to connect to a DHN
are important, there is a degree of flexibility, and these alone should not determine the operating regime for the
network.
In addition to the building systems, the operating temperature needs to be suited to the energy supply technology.
At present, the majority of energy supply technologies are combustion based giving high grade heat to develop a
flow temperature of around 90C. In the future if lower carbon technologies are to be used to provide heat, including
the use of electrically driven heat pumps, the ability of the building heating systems to operate when supplied with
lower temperatures (for example 70/40C) will be important. Technologies such as heat pumps are either unable to
achieve the higher temperatures, or become very inefficient, and operate most efficiently at lower temperatures.
Therefore if DHNs are to be developed as a future proof heat supply infrastructure, the design needs to consider low
temperature operation.
There are limits on the operating temperature of a network. At 70/40C, the average temperature of 55C will
require higher output systems in buildings. This may be achievable for new buildings, but more difficult to achieve
with existing heating systems unless there is extensive retrofit. In addition, the network needs to be able to deliver a
high enough temperature to ensure that DHW systems do not develop legionella. This means storage of hot water
must be kept at 60C and heated above this temperature periodically. Local top-up heat boilers can be used for this
purpose in areas where this is an issue.
6.2.3 Layout type
There are two basic DH layout options as shown in Figure 32.
A branch network consists of a single set of flow and return pipes to each load or section of the network, with the
energy centre at the beginning of the system. This layout can be optimised such that the overall length of pipework
is minimised to help reduce costs. The disadvantage is that there is little resilience, and if part of the network fails,
there is no alternative route to distribute heat.
In a branch based system, the diameter of the pipework generally decreases further away from the energy centre
such that each section of pipe is sized for upstream loads only. The network layout is therefore heavily influenced
by the location of the energy centre.
In a ring configuration, the network consists of two sets of pipes from the energy centre which are linked to form a
ring. This means that if there is a failure at any point of the network, heat can be provided through the alternative
route. As an extreme case, the entire ring could be sized to take the total load – this provides full resilience and
flexibility for energy centre location. This would however be significantly oversized for the majority of the network
and correspondingly expensive. A compromise is for the ring to be sized as two halves (as shown in Figure 32) with
the network reducing in size each direction. This allows for some resilience, but not full load around the entire
network. However if a failure occurred, the network would still be able to provide part load to all customers, which in
combination with temporary changes to operation (for example increasing pump pressures) would be sufficient for
most periods except in the coldest weather.

AECOM Final Report 89
Capabilities on project:
Building Engineering
Figure 32: Types of DHN layout showing a branch layout (left) and ring layout (right).
In reality, large networks will probably comprise a mix of layouts with some areas being served by a ring and others
by a branch. The form of the network is often determined by the phased build out of the network over a period of
years which responds to changes in energy supply and heat loads.
6.2.4 Phasing and future expansion
This EMP aims to establish the future vision for DE in Kingston. It is unlikely that a large scale DHN will be
developed in one phase, and most likely that a DHN grow from a first phase scheme, potentially connecting a
number of smaller schemes together. It is therefore essential that the design of each element of the network and
each phased build out considers the long term DHN opportunity such that the network is future proofed as much as
possible.
There are a number of ways in which networks can be phased as illustrated in Figure 33.
C D A B
EC
EC
C
D A
B
Building load
Energy centre
Branch layout Ring layout

AECOM Final Report 90
Capabilities on project:
Building Engineering
Case 1: Connection to nodes
A number of smaller networks
develop, each with their own
energy centre. These are then
connected in the future by a
large network and energy
centre. By connecting to the
existing individual energy
centres, the phase 1 schemes
do not need to be sized for
future expansion.
Case 2: Expansion
A phase 1 network expands to
connect to additional loads.
This expansion may require a
larger energy centre located in a
different area. The phase 1
design may need to be
oversized to allow for the energy
centre re-location, and to enable
future expansion
Case 3: Linking
A number of smaller networks
link together linearly to form a
larger network. Some pipes in
the phase 1 network are
oversized to allow linking. A new
energy centre may be
developed in future phases.
Figure 33: Basic network phasing and expansion options
The types of expansion in Figure 33 are simplified and often more than one of these will occur or be desired. In each
of the cases, there are different consequences for the network design:
In Case 1, the long term vision has no impact on the phase 1 network/s due to future connections being
made at the energy centre locations. This means that the network sees the same heat loads and same
heat supply and is sized appropriately.
In Case 2, the network grows organically with new branches being added to the existing network. This
means that the phase 1 network needs some routes to be oversized to be capable of taking the future
loads. Whilst it may not be possible to predict the size or location of all future loads in the first phase, key
routes can be oversized to allow for this expansion, for example main transmission pipes and areas where
there may be pinch-points such as railway crossings or areas where future retrofit will be challenging.
Oversized phase 1 pipe for linking
Oversized phase 1 connection for energy centre relocation
Oversized phase 1 pipe for expansion
Phase 1 DHN
Future DHN
Phase 1 energy centre
Future energy Centre

AECOM Final Report 91
Capabilities on project:
Building Engineering
In Case 3, a number of smaller networks are joined together, such that they form part of a larger
transmission system. This means that certain elements of the smaller networks need to be oversized to
allow for heat provision to neighbouring networks as well as their own loads. It is possible that this linking
will also include a new larger energy centre and so some consideration is required of where this may be
located during phase 1. This case is typical of schemes where smaller starter networks are developed with
temporary plant which later link and connect to a single energy centre once the aggregated loads are
sufficient.
The design of networks in Kingston will need to consider which of these cases (or combination of) may be relevant
to allow phase 1 DHNs to expand and develop into a wider town centre scheme. This means that the design of
phase 1 DHNs will need to consider the long term vision for the Borough, and ensure that certain network
components are sized to allow this future expansion and connection.
6.2.5 Energy centre location
The descriptions above on layout type, and phasing and expansion, show the importance of the energy centre
location in terms of the network design and layout. In all cases, the DHN needs to be appropriately sized to enable
the required flow rates of LTHW to be achieved to meet loads in all part of the network, such that the capacity of the
network increases closer to the energy centre.
In the phase 1 schemes, the pipes can potentially be sized as a stand-alone scheme if it expands through a new
connection to the Phase 1 energy centre location. However in all other cases, the phase 1 network will need to be
oversized in some components to allow an alternative heat source location.
In the case of a ring network, there may be some flexibility in energy centre location although significant over-sizing
of the network is to be avoided to limit capital investment.
6.2.6 Distribution of energy supply sources
In a conventional network with centralised heat generation, possibly in a single energy centre, the network can be
sized to meet the peak load of each building. In the final section of each branch connection to the individual loads
the pipes will be sized for the peak capacity, whilst pipes closer to the energy centre meeting the loads of a number
of buildings can be potentially reduced in size due to diversity (not all buildings require peak capacity at the same
time).
An alternative option is to make use of a number of heat sources, including having centralised CHP plant, but using
the boilers in each building to provide top up. This can provide greater resilience (some/all buildings retain boiler
plant), reduce capital investment, and limit the land required for an energy centre. If this set-up is to be retained in
the future, then the DHN pipes can be sized so that they only distribute the CHP output and not the peak load,
reducing the capital investment.
However, maximum flexibility will be provided if the network is sized for centralised heat generation plant allowing
future changes and greater centralisation in heat supply. Whilst an undersized DHN with distributed heat supply
may be lower cost, there is reduced future flexibility without significant re-investment into the network. The cost
savings from under sizing the pipes may also be relatively small – the cost of the pipe is only one element of the
DHN investment and other costs such as civil engineering works and installation may be less dependent on pipe
size. Oversized pipe will increase capital costs but have the benefit of lower pumping costs if used to supply the
CHP output only in the initial phases.
6.2.7 Design considerations for Kingston
Section 6.2 sets out a number of considerations for network design. Based on this discussion, the following design
parameters are proposed for the development of DHNs in Kingston:
The network should be designed for operation at a T of 30C. This allows for future flexibility if larger Ts
can be used, whilst allowing for adequate heat provision to existing buildings in phase 1.

AECOM Final Report 92
Capabilities on project:
Building Engineering
The network should be designed with initial flow and return temperatures of 95/65C to ensure that
adequate heating can be supplied to existing buildings in future phases with minimal modifications. The
design should allow for lower temperature operation (for example 70/40C) in the future if retrofit of existing
buildings combined with purposed designed heating systems in new buildings allows. This will enable more
efficient operation (with lower thermal losses) and the ability to use alternative sources of heat.
The network should use a combination of ring and branch layouts where appropriate.
The design of early phases of the network should be compatible with the long term vision such that
expansion can be achieved with little or no modification or replacement of existing pipework. This means
that some sections of early phases will need to be oversized.
The design of the early phases will need to consider early and later phase energy centre locations. This
may impact on both the layout and sizing of branches of the network.
6.3 Concept design of DHNs in Kingston
This section outlines DHN options for Kingston to identify potential routes and layouts for further analysis. All routes
and layouts discussed in this report are based on the high level energy load information used, and basic mapping
analysis. These have been developed for the purpose of identifying strategic options, and further more detailed
feasibility analysis will be required to assess the layouts in more detail.
6.3.1 Long term vision
Based on the identification of energy sources in Section 4 and energy demands in Section 5, the combination of a
ring and branch based network has been developed. This allows for connection to the major loads identified in the
Town Centre and Hogsmill areas, and potential for sourcing heat from a number of locations to allow for future
flexibility.
The proposed layout for the long term vision of the DHN is shown in Figure 34 below.
The concept is based around a main ring network linking together the town centre and Hogsmill Valley area, and a
branch off the ring along Penrhyn Road. A number of smaller branches will also be required to connect small
groups of buildings or individual loads.

AECOM Final Report 93
Capabilities on project:
Building Engineering
Figure 34: Concept diagram of the long term DE vision

AECOM Final Report 94
Capabilities on project:
Building Engineering
6.3.2 Near term vision
As identified in Section 3, a potential Phase 1 scheme exists along Penrhyn Road linking together some key public
sector loads which are all located adjacent to each other. Penrhyn Road offers the most obvious route for the main
branch of the DHN although other routes using smaller roads may also be viable. The buildings identified for
connection are as follows:
Kingston University Penrhyn Road campus
County Hall (Surrey County Council)
Kingston Crown Court
Kingston College
Kingston County Court
Guildhall, Guildhall 2 (RBK)
Kingston Police Station
The buildings are all in the public sector which can help support the development of an early stage network, allowing
cooperation between parties, and reducing the need to provide an aggressive commercial heat price. The longevity
of the sites also allows long term contracts to be developed with the building occupiers / owners confident of long
term occupation. Connection to these buildings forms a baseline scheme, and sensitive’s are examined on this.
The energy supply for a first phase network could be from a number of sources:
Centralised CHP plant, with localised boiler provision. This will offer the lowest cost initial option.
Centralised CHP and boiler plant located on the phase 1 network.
Centralised CHP and boiler plant located elsewhere and connected to the phase 1 network. For example at
the re-developed Eden Walk area.
The location and layout of Phase 1, as shown in Figure 34 allows initial development independent of any future ring
network, and could therefore be viewed as a standalone scheme which can operate irrespective of future expansion.
This reduces the investment risk by removing the need for investment in Phase 1 which is to facilitate future phases,
for example, strategic pipe over-sizing.
6.4 Phase 1 network options
There are a number of possible options to be considered for the layout and extent of Phase 1. These are discussed
below:
6.4.1 Phase 1 Baseline design
Connection to the seven sites listed above, with energy supply from a centralised CHP and boiler plant located at
the south end of the re-developed Edenwalk area. Figure 35 shows a schematic of the preliminary Phase 1
network.

AECOM Final Report 95
Capabilities on project:
Building Engineering
Figure 35: Schematic of the Phase 1 network

AECOM Final Report 96
Capabilities on project:
Building Engineering
6.4.2 Phase 1 Network Variations
In addition to the baseline Phase 1 option, a number of variations are considered.
1. Centralised CHP and boiler plant located on the baseline Phase 1 network, located at Kingston College
This option is selected to determine the impact of locating the energy centre directly on the phase 1 network, and
not at the more distant Edenwalk site. The selection of Kingston College is for illustration purposes only – at present
it is uncertain whether an energy centre could be located on this site and no obvious areas were identified on the
site visit. However location of an energy centre on or close to this location could offer compatibility with an
extension to later phases as this is the likely area of connection with a Phase 2 network. This results in optimisation
of the DH pipe sizing as described in Case 1 of 6.2.4.
Whilst Kingston College does not appear to offer a realistic opportunity for location of an energy centre at present, if
this variation is attractive economically (see section 8), then it could promote the identification of sites immediately
on the Phase 1 network, either at the College or other locations.
2. Centralised CHP and boiler plant located on the baseline Phase 1 network, with flexibility of location, therefore
all pipes along the main branch are sized for total load
As the location of an energy centre is uncertain, this option offers flexibility of connection, both in the short term and
for future phases. The distribution main along Penrhyn Road is sized to take the total load, with a diameter of
300mm, and therefore an energy centre could in theory be connected anywhere along the Phase 1 network.
3. Centralised CHP plant as for baseline, with localised boiler provision
This option examines locating the CHP plant at a central boiler house, but makes use of distributed standby and top-
up boilers around the scheme (potentially the existing building’s boilers). This allows the energy centre to be
significantly smaller with no major boiler plant, and with a smaller land take. The costs of this option may also be
reduced if the network is sized for baseload heat supply from the CHP rather than peak heat supply. In this EMP, it
is assumed the network is sized for 50% of peak loads – this means that the future flexibility of the network is
reduced and that all buildings may need to retain boiler plant.
4. Kingston University Penrhyn Road campus not connected
Connection to the Penrhyn Road campus accounts for approximately a third of the pipe length, which increases the
capital cost, but also accounts for a third of the heat demand for Phase 1. This option allows the economic benefit of
connecting to the Kingston University Penrhyn Road campus to be assessed.
5. Connection of additional loads
This option assesses the impact of connecting some additional loads to the network which are not on the baseline
scheme.
Avante House
45-51 High Street Redevelopment
Stevens house
Garricks House

AECOM Final Report 97
Capabilities on project:
Building Engineering
These sites are more distant from the Phase 1 DH network than the rest of those identified for Phase 1, but they do
add additional heat load, and so there may be a case for connecting to them, either as part of the initial Phase 1
installation or as an extension in the future once the initial network has been established.
6.4.3 Summary of Phase 1 networks
Table 8 shows a summary of the baseline and variation phase 1 networks. The capital cost of the baseline network
is £2.2M resulting in a network with 16.8MW thermal load and a length of 1.6km. The capital cost per annual unit of
heat delivered is £0.16 per kWh (this in reality would be spread over the life of the network but is used as a simple
proxy for cost efficiency).
The most cost efficient network is Variation 1, with the location of the energy centre on the network resulting in a
reduction in network length of 265m and a cost reduction of around £0.6M. The large reduction in cost is due to the
fact that the reduction in length of the largest diameter pipe on the network.
The least cost efficient network is Variation 2 where the central distribution pipe is sized uniformly allowing flexibility
in energy centre location and some capacity for future expansion. This increase in cost needs to be balanced
against the benefits of future flexibility.
By using distributed boilers and only sizing the network for base load (Variation 3), the cost is reduced by £0.4M
which has a relatively small impact on the cost efficiency.
Table 8: Summary of Phase 1 networks (please note that capital costs include the DH network pipework only. The total scheme costs are provided in section 8).
Baseline
Network
Variation 1
Network
Variation 2
Network
Variation 3
Network
Variation 4
Network
Variation 5
Pipe length (m) 1635 1370 1635 1635 1090 2045
Length of Oversized pipe (m) - - 540 - - -
Total network capacity (kW) 16,820 16,820 16,820 8,410 10,330 21,800
Line load (kWh/m) 8220 9800 8220 8220 7590 8510
Capital cost of network
(£million) 2.21 1.65 2.62 1.82 1.32 2.79
Capital cost per metre (£/m) 1353 1206 1604 1115 1214 1363
Capital cost per kWh
(£/kWh) £0.16 £0.12 £0.20 £0.14 £0.16 £0.16
The distribution of DH pipe sizes is shown in Figure 36.

AECOM Final Report 98
Capabilities on project:
Building Engineering
Figure 36: Summary of pipe sizes in the baseline and variation options of Phase 1.
6.5 Phase 2 network options
The second phase for this scheme entails extending to the north, connecting to major loads across the town centre
and beyond, and extending south east towards the Kingston University Knights Park campus. This extension to the
Phase 1 network would be set out as two additional branches connected directly to the energy centre, so that Phase
1 remains independent of this later phase.
Rather than one main line, Phase 2 is considered to be made up of a number of branches which are spread out to
reach all of the larger energy customers in the town centre. The buildings are mostly private commercial properties
which may require some incentives for connection. A well established Phase 1 scheme based around the public
sector may also encourage connection for commercial customers by demonstrating costs and reliability.
The energy supply for a second phase network could be from a number of sources, similar to those listed for Phase
1, this includes:
Centralised CHP plant, with localised boiler provision.
Centralised CHP and boiler plant located on the Phase 2 network. For example at the re-developed Eden
Walk area.
There are a number of proposed redevelopments for the Kingston Town Centre, which have been identified in the
K+20 AAP. It is assumed that all major redeveloped areas would be connected to the DHN through planning
requirements, therefore heating systems should be designed such that they are suitable for connection if/when
Phase 2 is installed. The information used to model these redevelopments has been reviewed in Appendix 2:
Energy demand analysis
There are a number of possible options to be considered for the layout and extent of Phase 2 as discussed below.
6.5.1 Phase 2 Baseline
The baseline Phase 2 scheme has a connection to all sites listed in below and the Phase 1 network, with energy
supply from a centralised CHP and boiler plant located at the south end of the re-developed Edenwalk area. The
heat loads for all proposed redevelopments are included except Edenwalk shopping centre and the Leisure Centre.
The Edenwalk heat loads used are based on the current central atrium areas and Millennium House offices to reflect
the uncertainty over when the shopping centre will be redeveloped to allow connection of the retail units. A
0
100
200
300
400
500
600
700
800
900
32 40 50 65 80 100 125 150 200 250 300 350
Len
gth
of
pip
e (
m)
Pipe Diameter (mm)
Base line
Variation 1
Variation 2
Variation 3
Variation 4
Variation 5

AECOM Final Report 99
Capabilities on project:
Building Engineering
schematic is illustrated in Figure 37 which is a zoomed in section from Figure 34. The list of sites connected to the
Phase 2 network is given in Table 6.
Figure 37: Schematic of Phase 2 DHN layout
6.5.2 Phase 2 network Variations
In addition to the baseline Phase 2 option, a number of variations are considered.
1. Ring is sized at 300mm
The potential location of an energy centre for future phases is uncertain, therefore to allow for future flexibility of the
network the entire ring is set to a constant diameter pipe of 300mm, such that the energy centre can be connected
to anywhere along the pipe, with no change to the capital cost. This diameter is lower than the combined peak load
requirements, but assumes a degree of diversity.
2. Redevelopment of Edenwalk and Kingfisher Leisure centre

AECOM Final Report 100
Capabilities on project:
Building Engineering
If there is a large scale redevelopment of the Edenwalk site and the Kingfisher Leisure Centre, the load for these
sites will be higher than considered for the baseline case. Energy loads are based on the re-developed schedules.
3. No network development north of the railway
The potential customers over the railway (Kingston Power Station Redevelopment, Gasholders Redevelopment and
Kingston College Richmond Road Campus) are more distant than the rest of those listed for Phase 2, which may
not be cost effective, or may be more suitable as a future extension rather than the initial phase 2 installation. This
variation assesses the impact of not connecting these customers.
4. Alternative town centre layout
There are several possible layouts for the town centre area, so a second possible layout is examined. Whilst the
layouts proposed in this EMP are indicative, this variation allows sensitivity to layout options. A zoomed in sketch of
the proposed variation for the northern section of Phase 2 is shown in Figure 38.
Figure 38: Variation in town centre layout assumed
6.5.3 Summary of Phase 2 networks
Table 9 shows a summary of the baseline and variation Phase 2 networks. The capital cost of the baseline network
is £6.1M which is an additional £3.9M on top of the Phase 1 baseline. The connected load has more than doubled
to 38MW, and the length tripled to 4.8km. The cost efficiency of the network has reduced from £0.16 per kWh for
Phase 1 to £0.19 for Phase 2.
The Variation results show that if the Phase 2 network was oversized to allow peak load distribution from an energy
centre located in Phase 3 (Variation 1), then the capital cost increases by £1.8M and results in the lowest cost
efficiency. However if diversity is included in this resulting in oversizing to 300mm for the future ring main, the cost
increase is only £0.7M and the cost efficiency is £0.22 per kWh.
The results also show that re-development of the Kingfisher Leisure Centre area and Edenwalk Shopping centre
have a small benefit on the cost efficiency of the scheme.

AECOM Final Report 101
Capabilities on project:
Building Engineering
Table 9: Summary of Phase 2 networks (please note that capital costs include the DH network pipework only. The total scheme costs are provided in section 8).
Baseline
Network
Variation 1
Network
Variation 2
Network
Variation 3
Network
Variation 4
Network
Variation 5
Pipe length (m) 4835 4835 4835 4840 4265 4970
Length of Oversized pipe (m) - 1170 775 -
Total network capacity (kW) 37,865 37,865 37,865 40,378 34,205 37,865
Line load (kWh/m) 6540 6540 6540 6920 6610 6355
Capital cost of pipe (£million) 6.08 7.94 6.81 6.18 5.30 6.09
Capital cost per metre (£/m) 1,259 1,641 1,410 1,277 1,243 £1,225
Capital cost per kWh (£/kWh) 0.19 0.25 0.22 0.18 0.19 £0.19
Figure 39 shows a summary of the pipe sizes required for the Baseline and variation Phase 2 DHNs.
Figure 39: Summary of pipe sizes in the baseline and variation options of Phase 2.
6.6 Phase 3 network options
The two ends of the Phase 2 DHN could be further extended to form a large ring, extending west towards Kingston
Hospital and the Sewage Works, as shown in 6.3.1.
The extension for Phase 3 involves connection to Kingston Hospital, which accounts for a significant proportion of
the total heat load. The network is also expected to connect to a number of schools and more residential area, in
particular the Cambridge Road Housing owned by RBK.
0
200
400
600
800
1000
1200
1400
25 32 40 50 65 80 100 125 150 200 250 300 350 400 450 500
Len
gth
of
pip
e (
m)
Pipe Diameter (mm)
Base line
Variation 1
Variation 2
Variation 3
Variation 4

AECOM Final Report 102
Capabilities on project:
Building Engineering
The Phase 3 network opens up the opportunity to locate an energy centre around the Hogsmill Valley, including the
potential to use heat pumps to capture secondary heat from the STW outlet. It is likely that there would be additional
energy centres located at other points around the ring, options include:
Kingston Hospital (if further plant or space can be provided on site).
Edenwalk Redevelopment (i.e. retain Phase 1&2 Energy Centre)
Cambridge Road Development
Gas holders redevelopment site
Thames riverside location (for heap pump capture of secondary heat from the river).
6.6.1 Phase 3 baseline
The Phase 3 network represents the full extent of the town centre DE scheme. It includes connection to all sites
listed in below, with energy supply from a centralised CHP and boiler plant located at Hogsmill Sewage works. For
the main ring network, the pipes are sized at 300mm to allow for diversity of heat supply. This allows for future
flexibility of the networks as an energy centre as constant sizing allows for an energy centre to be located anywhere
on the ring. The preliminary layout is illustrated in Figure 37 which is a zoomed in section from Figure 34. A list of
the sites connected is provided in Table 6.
6.6.2 Phase 3 network Variations
In addition to the baseline Phase 3 option, a number of variations are considered.
1. Connection to Kingston University Clayhill Campus
The connection to the Clayhill Campus, for student accommodation, requires an additional length of network of
around 900m. The balance between the expenditure for this network length needs to be balanced against the
benefit of connecting to the site as a heat customer. This variation allows assessment of the cost effectiveness of
this connection.
2. No connection to Kingston Hospital
Kingston Hospital accounts for a significant proportion of the heat load for the network, but also has its own CHP
plant, which could in the future be expanded to cover more of the hospitals heat demand. There is also limited
potential for locating significantly more plant at the hospital due to the density of the site. In light of the relatively
long network connection to the Hospital, and the viability of the hospital as a stand-alone scheme, this variation
assesses the impact of not connecting.
The assumption for this model is that the whole branch towards the hospital is removed, so there is no connection to
Wolverton house or Buick house, which connect to that route
3. Removal of south-east corner of ring main
The location of an energy centre at Hogsmill Sewage Works requires long lengths of network to reach the
customers identified, and there are few customers on the south east section of the ring main to benefit. Therefore
an alternative scheme is proposed which removes this section of the ring.
The southern end of the network is left as it would be for Phase 2, with no further extension. The northern part of the
network starts from an energy centre at Kingsmeadow Sports Ground, connecting to the Cambridge Road
Development and then completing the rest of the phase 3 layout as stated for the baseline.

AECOM Final Report 103
Capabilities on project:
Building Engineering
The northern part of the network becomes an extension of Phase 2, ending at Cambridge Road Development. The
energy centre is located at Kingston Hospital, which already has a CHP system.
This variation may be more applicable if additional energy centres are located on the scheme in addition to Hogsmill
Valley (these may include in the Town Centre and at the riverside).
Figure 40: Schematic of Phase 3 variation 3 with the south-east section removed (NB: branches are not shown in this schematic)
6.6.3 Summary of Phase 3 networks

AECOM Final Report 104
Capabilities on project:
Building Engineering
Table 10 provides a summary of the Phase 3 network options. The capital cost of the baseline scheme is £24M, an
additional £18M over the baseline Phase 2 scheme, and the cost efficiency is reduced to £0.28 per kWh, around
half as efficient as the Phase 1 scheme. This is due to a lower heat density, and a higher proportion of larger
diameter pipes due to the ring main.
The energy density of the Phase 3 network is higher than for Phase 2 shown by the higher line loads which are
similar to Phase 1. However the increase in DHN cost due to the large investment in the ring means that the cost
efficiency is lower than for Phase 2.

AECOM Final Report 105
Capabilities on project:
Building Engineering
Table 10: Summary of Phase 3 Baseline and Variation DHNs (please note that capital costs include the DH network pipework only. The total scheme costs are provided in section 8).
Baseline
Network
Variation 1
Network
Variation 2
Network
Variation 3
Pipe length (m) 9,655 10,555 8,475 7,285
Total network capacity (kW) 94,500 97,200 49,970 93,400
Line load (kWh/m) 8260 7760 5221 10,940
Capital cost of pipe (£million) 16.1 17.1 13.3 11.9
Capital cost per metre (£/m) 1665 1620 1573 2207
Capital cost per kWh (£/kWh) 0.18 0.19 0.27 0.18
Figure 41 shows a summary of the pipe sizes required for the Baseline and variation Phase 3 DHNs. This
demonstrates the impact of the ring main with large amounts of pipework at 300mm.
Figure 41: Summary of pipe sizes in the baseline and variation options of Phase 3.
6.7 Summary
This section identifies a number of options for DHN schemes split into early, mid, and long term development
ambitions.
A Phase 1 scheme is identified along the Penrhyn Road area with a baseline capital cost of £2.2M and 16.8MW of
connected load. The assessment of various options and sensitivities shows that the change in cost efficiency is
relatively small due to the relatively efficiency layout. Locating an energy centre on the network within the
customers, rather than on a branch at the Eden Quarter provides the largest cost reduction and most cost effective
0
500
1000
1500
2000
2500
3000
3500
4000
4500
32 40 50 65 80 100 125 150 200 250 300 350 400 450 500 600 700
Len
gth
of
pip
e (
m)
Pipe Diameter (mm)
Base line
Variation 1
Variation 2
Variation 3

AECOM Final Report 106
Capabilities on project:
Building Engineering
network. However cost reduction also needs to be balanced against future flexibility and the highest cost option is
incurred when the central spine is oversized to allow additional future loads to be connected.
The Phase 2 baseline network costs an additional £3.9M over phase 1 and is less cost efficient in terms of £/kWh
due to the more dispersed nature of the buildings. This suggests that additional customers need to be identified in
the phase 2 area as shown in variation 2 where re-development of the Edenwalk area and the Kingfisher Leisure
Centre provide additional load.
The Phase 3 network presents a long term vision, and as such, there is much uncertainty over the loads which may
connect. It would probably develop over a number of intermediate phases. The additional cost of the baseline
Phase 3 network is around £18M with a total network value of £24M. Whilst the Phase 3 ring concept does provide
a degree of flexibility, particularly with uncertainty around energy centre location, it does come with a cost penalty,
and the removal of a section of the ring reduces the investment cost by around £5M. This shows the importance of
identifying and allocating a site early in the delivery of an RBK DE scheme to allow optimisation of future network
phases.

AECOM Final Report 107
Capabilities on project:
Building Engineering
7.1 Introduction
This section describes the options for selling both heat and electricity from DE schemes in the Borough. It looks at
the price at which energy can be sold and the mechanisms by which it can be sold. The ability to maximise revenue
from electricity is of great importance to the overall economic performance of CHP based DH, and an overview of
the proposed “licence lite” electricity regime is provided.
7.2 Heat sales
The prime purpose of a DH network is to distribute heat to customers, and where necessary to charge for the heat
use. There are a number of considerations when setting the price for heat:
Whether heat is metered or not.
The cost of heat production
What is included in the heat provision contract
The customer’s current / baseline costs of heat provision
Contract structures and terms
7.2.1 Heat metering
Heat meters operate by measuring the flow of hot water, and flow and return temperatures in the customers heat off
take pipes. The combination of temperature difference and flow allows the calculation of how much thermal energy
has been extracted from the DH equivalent to the heat used by the customer.
The use of heat meters on a DHN allows the billing of customers for the amount of heat used, and also monitoring of
heat consumption to help assess the performance of the system. Modern heat meters typically have automatic
meter reading (AMR) functionality such that they can be read remotely, preventing the need for access to individual
customer’s buildings, and allowing lower cost monitoring of consumption.
The information provided by heat meters can be used to bill customers according to the amount of heat used,
although there are a number of ways in which the tariff can be structured (see below).
Whilst heat meters are recommended for the majority of customers, especially where new heating systems are
being installed, there are cases where heat meters may not be used. Some historic DH schemes in the residential
sector have not used heat meters, but simply charge a fixed rate for heat provision, particularly in the social housing
sector. An argument could be that the relatively small levels of heat consumption in flats combined with the costs of
metering, meter reading, and billing, means that better value could be offered from a meter-less solution. AMR
systems combined with improvements in heat meter accuracy means that this may no longer be true, and the added
benefits of customers being able to understand consumption and control their bills promotes the use of meters .
However there may be retrofit applications where the existing heating systems (mainly in direct systems) means that
the installation of meters could be difficult. This is most likely in Kingston if areas of existing flats which currently
have communal heating systems are to be connected to the network.
7.2.2 Cost of heat production
The heat sales need to be sufficient to cover the costs of producing the heat and allowing the scheme to operate in
an economically viable manner, taking into account the other revenues which may also be received (for example
through the sales of electricity from a CHP scheme).
7 Energy sale

AECOM Final Report 108
Capabilities on project:
Building Engineering
The cost of producing the heat depends on both the heat generation plant, and the energy or fuel it consumes, and
also the cost of distributing the heat to the customers.
Where the operation costs are strongly influenced by energy or fuel costs, but less so on capital investment and
fixed annual costs, then the heat tariff structure is likely to have a large variable element. However if the capital
investment and fixed annual costs dominate, then the tariff structure is more likely to have a large fixed standing
charge element, and a lower variable element. Examples of the latter occur where the heat source is effectively low
cost or free, for example geothermal systems or waste industrial heat, but where the cost of capturing this is high.
7.2.3 Level of provision of heat and services included in the heat contract
The price charged for heat will need to consider the items which are included in the heat supply contract.
In general the heat supply contract will cover all heat for the customer. However if local generation is included on
the customer’s site (for example existing boiler plant), then the DH scheme may only provide a fraction of the annual
heat demand. The price for this heat will therefore reflect this partial provision, and may be strongly based on the
capacity of heat (for example a 1 MW limit) rather than the annual provision. The overall cost benefit of this
approach means that less centralised heat generation plant is required, and the DHN can be sized for baseload
rather than peak load to individual customers.
The HIUs or heat substations on a network will typically be owned and operated by the network operator. This is
important because they form part of the network and any malfunction or failure could have an adverse impact on the
network. Therefore the heat price will need to be sufficient to cover the operation and maintenance costs of these
items. In some circumstances, additional infrastructure (for example secondary networks or even heating circuits)
may also fall under the ownership or operation of the network and the heat price will also need to allow for these.
7.2.4 The customer’s current / baseline costs of heat provision
Without regulation in favour of DH the DH supply will need to be priced competitively against the alternative form of
heating. For existing customers, this will be the incumbent heating system (or any replacement if required), and for
new customers, it will be the proposed heating system that would be required to meet relevant regulations and
planning policy.
The baseline heating cost will consist of:
Provision and replacement of heat generation plant.
Maintenance and operation of heat generation plant
Fuel / energy provision for heat generation.
The combination of these costs can provide a baseline heating cost which can be expressed as an effective heat
cost in terms of p /kWh.
For a DHN to be commercially viable, customers will generally only connect if the DHN can offer a heat tariff which
is equivalent to or better than their current / proposed baseline rate. This means that understanding the customers’
baseline costs is important when setting customer specific heat tariffs.
A common option is to base the starting point heat tariff price on the customers baseline cost with a discount
applied. This tariff will then track a basket of energy prices over time to ensure that price changes are linked to
alternative heating fuels, but with a discount applied. This provides customers assurance that the DHN heat prices
will not increase more than the alternative baseline options, and that the price will remain competitive. For DHN
operators, it provides assurance that customers will hopefully commit for the long term, and that whilst they get a
good price, it never has an excessive discount.

AECOM Final Report 109
Capabilities on project:
Building Engineering
7.2.5 Contract structures and terms
Like any service, the price of heat depends on the contract structure and terms. This will need to consider the
aspects discussed above including the level of service and agreed heat capacity, and the tariff structure and pricing.
An important element will be the length of contract. In general, commercial customers wish to see a good
discounted tariff combined with flexibility in the form of shorter contract periods and termination allowances. There
is a balance for the network operator to provide a price which is good enough to encourage longer term connections
to reduce the risk of investment, whilst maintaining an economically viable scheme. Public sector bodies are likely
to accept a smaller discount, if any, on the heat tariff and long term contracts – periods of 10 or 20 years are
common on scheme where the public sector is a key stakeholder.
A further element is whether there is a minimum heat take within the contract which provides for a ‘take or pay’
arrangement thus reducing the risks to the DH company with respect to volume of heat sales.
7.2.6 Heat sales for DE in Kingston
A DE scheme in Kingston is likely to contain a wide range of customers, albeit with a public sector dominated first
phase. Therefore the structure of heat prices, tariffs, offered, and contract terms offered will need to take into
account all of the variables described in this section.
During the business case development for Phase 1, heat prices will need to be accurately calculated to allow
investment decisions to be taken, and provide the public sector buildings with a contract price to sign up to. It is
recommended that given the likelihood of the public sector being a key stakeholder in the scheme, and the
importance of Phase 1 being successful for further expansion, a tariff structure is used which ensures the scheme is
low risk, can be operated economically, and ensures long term heat purchase and connection. This could be
through 20 year contracts to all the public sector bodies.
If the scheme expands further, heat prices will need to be evaluated based on the additional development costs of
expanding the infrastructure, and the type of customer. Outside of phase 1, a large number of the customers are
existing commercial buildings, and so a more attractive heat tariff will need to be offered to encourage connection.
For new developments, planning policy can be used to enforce connection where a viable option exists. For this to
be economically viable, the price offered will need to be comparable or better than any alternative options open to
the developer which can provide the equivalent level of heat and meet the necessary regulations and policies.
It is recommended that all customers have provided with heat meters with AMR capability. An exception to this may
occur in areas of retrofit to existing flats which have existing communal systems. The most notable area of existing
flats is the Cambridge Road estate, but since these have recently been retrofitted with wet heating systems and
individual boilers, a metered strategy should be viable.
7.3 Electricity sales
Where electricity is generated as part of a DE scheme, the revenue from sales of the electricity will be important in
ensuring the scheme is financially viable, and for gas CHP schemes, is often the most critical factor.
7.3.1 Electricity sale for retail value
When the electricity can be sold directly to a customer, the highest revenue can be obtained due to the electricity
being sold at retail value (or with a small discount). This situation often occurs when there is a single, or small
number of large customers which are capable of purchasing the majority of the electricity. In many cases, the
electricity purchaser is also the generator, or a stakeholder in the DE scheme, such that the electricity simply offsets
their grid supply.
The value obtained for electricity will depend on the customer’s existing retail price, but will typically be around 8 p /
kWh or more, and there are no additional administration or billing costs.

AECOM Final Report 110
Capabilities on project:
Building Engineering
7.3.2 Electricity sale for licence exempt generators
If the electricity is to be sold to a wider number of customers (either domestic or commercial) who are not owners or
stakeholders in the scheme, then the electricity license regime needs to be considered. In general, this requires all
electricity suppliers to be licensed unless they meet certain exemptions (as set out in “The Electricity (Class
Exemptions from the Requirement for a Licence) Order 2001”). The exemptions are relatively complex, but in
essence exempt suppliers must have a generation capacity of less than 5 MW total, and a limit of 2.5 MW for
domestic customers.
For licence exempt suppliers, there are two options for the distribution and sales of the electricity:
i) Over the existing electricity grid. A generator may distribute and supply electricity of the existing
electricity grid by making a payment for Distribution Use of System (DUOS) charges to the Distribution
Network Operator (DNO). The retail price which can be offered to customers therefore will depend on
these additional costs which the supplier will need to pay. As a supplier of electricity, the generator will
be responsible for the customer’s entire supply, and will therefore need to purchase additional electricity
as required at times when the generator is not meeting demand.
ii) Over a private wire network. A generator may distribute electricity over a privately owned network to a
number of customers, thus removing the need to pay DUOS charges. However the costs of developing
a private wire network can be significant and outweigh the benefits of increased electricity sales value
and reduced DUOS. In addition the “Citiworks” case (a European Court of Justice ruling in 2008) has
resulted in the requirement for private wire networks to be opened to alternative suppliers in an open
market to prevent monopoly supply. This effectively removes any benefit. One area where private wire
networks may provide a benefit is where a network exists on a complex site (for example a hospital or
university campus) and a single customer can be contracted.
In light of the complexities and restrictions of being a licence exempt supplier, the cost benefit in terms of electricity
revenue can often be minimal, and rendering this option unfavourable.
7.3.3 Electricity sale at wholesale value
Perhaps the simplest solution for a small scale generator is to sell electricity to a large licensed supplier who will
then re-sell to their own customers under their licence. This means that the small scale generator is effectively
competing against large scale generation on the national grid, and only receives a wholesale value for the electricity.
This may typically be around 5 p / kWh – 6 p / kWh depending on the size of generation, and output profile.
A wholesale revenue value may have an adverse impact on CHP schemes and render then uneconomic.
7.3.4 Electricity sale under licence conditions
An option could be for the DE electricity supplier to become a licensed electricity supplier, allowing sales of
electricity over a private wire network, or over the local distribution network to a wider number of customers.
However this is not a practical option for small suppliers - the licensing requirements, in particular the Balancing and
Settlement Code and the Master Registration Agreement, are designed for, and suited to, large national suppliers
who have a significant capacity. The costs, risks, and complexities of becoming a licence supplier are too great for
smaller electricity suppliers, such as DE schemes, and therefore effectively prevent DE schemes from benefiting
from a good price for electricity unless specific direct sales circumstances exist.
This has been major hurdle to the development of DE, and has led to the concept of “licence lite”.
7.3.5 Licence lite – an introduction
In recognition of the problems faced by small electricity suppliers, the 2007 Energy White Paper announced the
intention to provide a mechanism for schemes to sell electricity. The final proposals were published by Ofgem in
2008 and consisted of changes to the licensing regime such that small suppliers do not need to be licensed, but
need to be covered by a larger supplier’s licence. This means that smaller supplier effectively “piggy back” on a

AECOM Final Report 111
Capabilities on project:
Building Engineering
large suppliers licence, and thus have a “lite licence”. Whilst the Ofgem proposals provide the mechanism for doing
this, they do not provide the detailed framework in which the scheme can operate.
The benefits of a licence lite system are that a licence lite DE supplier can sell electricity directly to customers over
the existing public electricity network without having to be involved in balancing and settling in the electricity market.
The licence lite holder will be responsible for metering and billing and therefore incur administration costs. It will
also (as any supplier on an open market) need to provide an attractive price to ensure customer interest, which may
mean tracking the price at or below market averages or best performance levels. This will mean the eventual price
received is likely to be less than a retail prices, but better than a wholesale price.
In return for being a licence lite supplier, and making use of another organisations licence, it is likely that the licence
holder will require a payment for the service which will equate to a p / kWh cost. The amount of this charge is
therefore likely to be critical to the success of licence lite.
7.3.6 GLA and licence lite
The ambitions of the GLA DEPDU are closely linked to the ability to develop economic schemes, and the electricity
value obtained by DE suppliers is therefore critical across the city. Given the lack of precedence, the development
of a licence lite framework is extremely complex and potentially costly, and likely to be unviable for individual
schemes or Boroughs. Therefore the GLA has decided to become a pan-London Licence Lite supplier under which
a number of different schemes can operate.
Over the last few years the GLA has conducted analysis on the potential financial benefits to ensure the process is
effective, followed by developing a legal framework for a licence lite contract, working closely with Ofgem. This has
culminated in a formal application from the GLA to Ofgem in early March 2013. The GLA is currently in the process
of going to market and is issuing a PQQ followed by a tender to the licenced suppliers to gauge interest and
hopefully find a partner with the intention of a 7 year agreement. It is important to recognise that given the lack of
precedent, the level of interest which may be obtained from licensed suppliers is uncertain, and indeed it may be the
case that there are no opportunities.
It is hoped that a licence will be obtained and a licence partner procured by Spring 2014.
The framework proposed by the GLA has the following basic function:
A number of individual DE schemes across London will sell electricity for a fixed price to the GLA licence lite
organisation.
The GLA will aggregate the electricity from all the schemes for subsequent sale.
The electricity will be sold to a small number of customers.
The GLA will aim to balance the supply and demand although there will probably be a small net export to
grid.
The full licence holder will be responsible for providing the net balance.
In the first instance, the GLA is intending to sell electricity to TFL. The policy of TFL to purchase DE sourced
electricity provides a ready market of sufficient size. The GLA is also keen to ensure that customers are public
sector to ensure that DE schemes and the GLA licence lite organisation are acting in the public interest. Once the
system develops, additional public sector organisations may also become customers.
It is the intention that DE electricity suppliers will be able to influence where some of the electricity is purchased.
For example a borough owned DE scheme may request that the Borough itself becomes the customer allowing the
electricity to be used in local authority buildings. All customers will be required to commit to a reasonable length
contract (say 3 years) to provide certainty to the GLA when purchasing electricity.

AECOM Final Report 112
Capabilities on project:
Building Engineering
7.3.7 How licence lite could be used by Kingston.
As a London Borough, a DE scheme developed in Kingston has the opportunity of making use of a potential GLA
licence lite regime. The process is simple for the Borough and will require the scheme to be a contracted electricity
supplier to the GLA without having to find and deal with customers.
The DE scheme / Kingston Borough may also have the desire to purchase the electricity from the GLA across their
estate if this is economically attractive.
In return for this service, the DE scheme will effectively pay a licence lite charge through the revenue which is
received. The GLA do not intend to make a profit from the electricity but will incur administration charges, billing and
metering charges, and the licence lite charge. The price received by DE scheme for selling electricity will therefore
equal the retail value (as sold to customers by the GLA) minus these charges. Financial modelling by the GLA
suggests that this will result in a revenue for DE schemes which is approximately 20% higher than if they sell directly
to the grid at wholesale prices. Once the tender returns from licensed suppliers have been received, the GLA will be
able to provide a more accurate price for electricity.
7.4 Summary
This section provides an overview of the energy sales options open to Kingston. Achieving a good revenue for the
sales of heat and electricity will be vital for the economic viability of a DE scheme, and should be central to all
further work on technical, financial, and delivery options.
The sale of heat needs to ensure that a wide range of customers are attracted to ensure a high uptake of heat off
take, and that this provides a long term low risk through encouraging long contract periods. In phase 1, the
emphasis is on the public sector and the scheme should aim for long heat supply contracts, typically 10 years or
more. As the scheme expands into the commercial sector, a combination of attractive prices combined with suitable
contract lengths will be needed to both encourage connection and maintain connection.
For electricity sales, it is recommended that RBK continue to work with the GLA to further explore the opportunities
for making use of the GLA Licence lite regime. This could offer a relatively simple solution for improving the
revenue for electricity. In addition, opportunities for exporting electricity directly to large electricity consuming
customers should also be considered and monitored so that the revenue can be maximised where possible. Such
opportunities may have an impact on the governance model for the scheme to allow licence exempt supply.

AECOM Final Report 113
Capabilities on project:
Building Engineering
8.1 Introduction
This section provides an overview of all of the outputs from modelling the District Heating Network in short, medium
and long term layouts. The base line option and a number of variations have been identified for each of the phased
network layouts, as discussed in 6.3.
8.2 Economic analysis
This section provides an assessment of the economic performance potential DE schemes in the Borough. A
lifecycle cost model has been used which takes into account capital and operational costs and revenues, comparing
them with alternative baseline options to assess the economic benefit.
The baseline economic analysis is based on a 25 year discounted cashflow and includes the following:
Capital expenditure of DH network, CHP and boiler plant, energy centre and utilities connections. Capital
expenditure incurred 2 years before scheme is operational.
Replacement costs of CHP plant and boiler after 15 years.
Energy costs based on customers current energy prices. Modelled as indexed (rising in line with the UK
Government’s IAG projections29
), and flat rate.
Electricity sales revenue based on sales to the grid at 6p / kWh.
On-going costs for administration, network and CHP operation included
Development costs at 5% of the capital cost. These are included as an allowance for activities post
feasibility work including commercial, legal, and procurement activities. This is indicative and the actual
costs will depend on the nature of the scheme, and procurement and governance options selected. An
example of the development process is illustrated in Figure 48.
CO2 valued at CRC levels for all customers30
.
CO2 content of the electricity grid at 15 year average, then in line with the UK Government IAG marginal
projections31
.
Discount rates for calculation of Net Present Value are based on 6%.
The value of heat for the DE scheme is based on a 5% reduction in heat price compared with a business as-usual
case of individual gas boilers, including the replacement and maintenance of the gas boilers.
8.3 Phase 1 – Short Term
8.3.1 Baseline design
The baseline option for Phase 1 is identified in Section 6.4 and considers an initial scheme along Penrhyn Road linking the following buildings:
Kingston University Penrhyn Road campus
29
Valuation of Energy Use and Greenhouse Gas Emissions. Interdepartmental Analysts Group (IAG), DECC. 30
Currently valued at £16 per tonne CO2. This reflects uncertainty in carbon pricing, but suggests that increasingly some form of carbon pricing will be applied to all larger consumers of energy. Due to the period over which the IRR is calculated the inclusion of carbon pricing at this cost has very little impact on IRRs. 31
The 15 year average emission factors are taken from the latest Standard Assessment Procedure values. http://www.bre.co.uk/filelibrary/SAP/2012/Emission-and-primary-factors-2013-2027.pdf
8 Analysis of options

AECOM Final Report 114
Capabilities on project:
Building Engineering
County Hall (Surrey County Council)
Kingston Crown Court
Kingston College
Kingston County Court
Guildhall, Guildhall 2 (RBK)
Kingston Police Station
It is assumed that the energy centre is located around the south end of the Edenwalk area which is likely to be
redeveloped, as identified in the Kingston TC AAP. This energy centre will provide all of the heat for the
development via a centralised CHP plant, with backup boilers and thermal storage appropriately sized to meet the
peak heat demand
The key outputs for the Phase 1 baseline scheme are shown in Table 11 and

AECOM Final Report 115
Capabilities on project:
Building Engineering
Table 12 below.
Table 11: Summary of Phase 1 Baseline scheme
Results Summary Units Base Case
Network
First year of operation 2016
Network length m 1635
Total network capacity kW 16,820
Energy Centre Size m² 500
Economic performance
Total Capital Cost £million 8.2
CHP capacity MWe 3.2
Energy centre boilers capacity MW 16.9
Gas CHP gas demand MWh/year 27,000
Peak boiler gas demand MWh/year 5,850
IRR (Indexed) 25 years % 3.0
IRR (Flat rate) 25 years % 0
NPV (indexed) 25 years £million -1.6
IRR (Indexed) 40 years % 5.2
IRR (Flat rate) 40 years % 0
NPV (indexed) 40 years £million --0.6
Effective cost of heat p/kWh 4.5
Environmental Performance
10 year carbon saving tonnes CO2 9,500
10 year carbon saving % 26%

AECOM Final Report 116
Capabilities on project:
Building Engineering
Table 12: Summary of capital cost breakdown for Phase 1 Baseline Scheme
Capital costs £million
DH network capex 2.21
CHP engine capex 1.60
Energy centre boilers capex 0.76
Energy centre building capex 1.00
Thermal store capex 0.38
HIU capex - commercial loads 1.68
HIU capex - domestic loads 0.00
Gas connection 0.10
Electricity connection 0.10
Development costs 0.39
Total capital costs 8.23
For the baseline scheme, the impact of two key sensitivities has also been assessed:
Capital cost. DH schemes are capital intensive, and reductions in capital cost through optimisation can have
a beneficial impact. Conversely, increases in costs can have a detrimental impact on schemes. The impact
of capital on the IRR can be either though actual cost adjustments in the scheme, or though a reduction in
the amount required for investment, for example with additional grant funding.
Electricity revenue. The sale of electricity from the CHP system is the largest revenue to the scheme, and
thus important in determining the IRR. The electricity revenue prices assumed in the modelling at £60 per
MWh are reasonably conservative allowing for some sale at retail prices or use on-site, but assuming that
the majority of electricity is sold to the grid. Therefore increases in this revenue through greater direct
electricity sales, or improvements through licence lite, may provide a benefit.
The impact of a plus and minus 20% adjustment of the capital costs and electricity revenues are shown in Table 13
below. The results show that the IRR is more sensitive to the electricity revenue, but both sensitivities show that
over 6% IRR can be achieved through a single input parameter adjustment. The compound effect of these (for
example both a lower capital cost AND higher electricity revenue) would have a larger impact.
Table 13: Sensitivity of IRR and NPV to capital cost assumptions and electricity revenue value for the baseline Phase 1 scheme.
Variance from
central
assumption
Capital costs Electricity revenue value
Capital cost IRR NPV Revenue value
(£/MWh) IRR NPV
-20% £6,585,000 6.6% -£127,000 £48 -1.7% -£3,763,000
-15% £6,996,000 5.8% -£507,000 £51 -0.1% -£3,234,000
-10% £7,408,000 5.1% -£887,000 £54 1.4% -£2,705,000
-5% £7,819,000 4.4% -£1,268,000 £57 2.6% -£2,177,000
0% £8,231,000 3.8% -£1,648,000 £60 3.8% -£1,648,000
5% £8,642,000 3.2% -£2,028,000 £63 4.8% -£1,119,000
10% £9,054,000 2.7% -£2,408,000 £66 5.8% -£591,000
15% £9,465,000 2.2% -£2,789,000 £69 6.8% -£62,000
20% £9,877,000 1.7% -£3,169,000 £72 7.7% £467,000

AECOM Final Report 117
Capabilities on project:
Building Engineering
8.3.2 Variations
1. Centralised CHP and boiler plant located on the baseline Phase 1 network, located at Kingston College
Variation 1 requires only a small difference in the model of the scheme, for this variation the length of pipe from the
energy centre to the main branch is shortened from 175m to 10m. The result of this is that the largest diameter pipe
on the network is reduced, therefore the cost is reduced, and to some extent the losses in the pipes, as the energy
centre is closer to the heat loads. The most noticeable difference from the base case is financial, the IRR improves
from 3.0% to 4.1%. This is a large change for a relatively minor variation and shows the importance of locating the
energy centre close to the network, reducing the length of the largest diameter pipes.
2. Centralised CHP and boiler plant located on the baseline Phase 1 network, with flexibility of location, therefore
all pipes along the main branch are sized for total load
Variation 2 considers the effect of increased flexibility of the network. If the location of the energy centre were
uncertain or not fixed throughout the schemes lifecycle, the pipes would have to be sized to allow for all possible
variations. The result of this is that all of the pipes along the main branch are all oversized to 300mm. The cost of
flexibility and uncertainty of design for this initial phase is approximately £0.4m, therefore there is a cost saving
associated with a more fixed plan for future development.
3. Centralised CHP plant as for baseline, with localised boiler provision
Variation 3 models the situation where all of the buildings connected to the main baseline network retain their own
boilers to meet the peak heat demand, but the base level is provided by a centralised CHP plant as determined for
the baseline. By not having to pay for centralised boiler plant up front, and by spreading the replacement of the
replacement distributed boilers out over a period of years (to reflect the current variation in ages), the IRR of the
scheme is increased slightly to 4.9%. This is the most economic case for Phase 1.
4. Kingston University Penrhyn Road campus not connected
Variation 4 is carried out to determine the effect of reducing the heat demand and the network length, and the
sensitivities to the size of the network. This is modelled by not connecting to the Kingston University site. As
expected the capital cost is a lot smaller due to the reduction in length of the network, smaller CHP engines and less
connection equipment, however the heat demand has shrunk to match this resulting in IRR that is similar to that for
the base case.
5. Connection of additional loads
Variation 5 is similar to 4 in that it is changing the total heat demand and the network length, however it is adding to
rather than subtracting from the baseline. There is also an increased domestic load on the network, which provides
a more variation in heat demand profile from building to building, but requires a greater capital cost for HIU in each
dwelling. The IRR for this variation is about 0.7% points higher than that for the baseline. There is also a greater
reduction in CO2 emissions by connecting to a greater number of properties, which would otherwise use boilers.
8.3.3 Phase 1 Summary
The result of the Phase 1 Baseline model and all variations can be seen in

AECOM Final Report 118
Capabilities on project:
Building Engineering
Table 14.

AECOM Final Report 119
Capabilities on project:
Building Engineering
Table 14: Summary of key results for Phase 1 Baseline and variations
Results Summary Units
Base Case
Variation 1
Variation 2
Variation 3
Variation 4
Variation 5
Network
First year of operation 2016 2016 2016 2016 2016 2016
Network length m 1635 1370 1635 1635 1090 2045
Total network capacity kW 16,820 16,820 16,820 8,410 10,330 21,803
Economic performance
Total Capital Cost £million 7.7 7.6 8.7 5.6 5.7 10.8
CHP capacity MWe 3.2 3.2 3.2 3.2 2.4 4.5
Energy centre boilers capacity MW 16.9 16.9 16.9 0.0 10.4 21.9
Gas CHP gas demand MWh/year 27,000 27,000 27,000 27,000 18,900 37,500
Peak boiler gas demand MWh/year 5,850 5720 5900 5780 2570 6570
IRR (indexed) 25 years % 3.0 4.1 2.3 4.9 2.4 3.7
NPV (indexed) 25 years £million -1.6 -1.0 -2.1 -0.4 -1.4 -1.7
Environmental Performance
10 year carbon saving tonnes CO2 9,500 9,800 9,450 9,108 6,820 13,400
10 year carbon saving % 26% 26% 25% 25% 30% 28%
The highest IRR is seen in variation 1, showing that the location of the energy centre can make a large difference
and that is it important to locate any plant close to the main network. Therefore locating the plant in one of the
building connected may offer a reasonable saving for the first phase, although later phases would have to take this
design into consideration.
Variations 4 and 5 illustrate the importance of the length of pipe in relation to the heat load. As long as the change
in length of pipe is proportional to the change in heat demand there is little change in the IRR of the scheme. The
greater the increase heat demand, in comparison to the increase in pipe length, the better the financial returns are
expected to be, as can be seen for variation 5, so it is recommended that large nearby sources should always be
considered for connection, but as the sites get further from the network, more research is required to determine the
financial viability of this extension. This rule may vary for larger changes to the network where the average diameter
of pipe may be significantly altered by the addition of large heat loads, such as Kingston hospital.
The lowest IRR is given in Variation 3 which examines the use of distributed boiler provision. This results in higher
capital, replacement, and operation costs for the smaller distributed boilers, but provides greater resilience for
customers. It also can result in a smaller land requirement for an energy centre.
All NPVs are predicted to be negative at the assumed 6% discount rate – this is due to the IRRs being less than 6%.
This means that for an investor who assumes a discount rate of 6%, the investment to them is assumed to have
made a loss over the investment period, i.e. has a negative value.
8.4 Phase 2 – Medium Term
The methodology for the modelling of Phase 2 remains the same unless otherwise stated. The analysis is carried
out based on a cumulative model of Phases 1 and 2, assuming that the first year of operation is 2020. This is the
first year of operation for each and every part of the network.
The extensions to Phase 1, which connect to a number of multi address buildings are included in this second phase
model.

AECOM Final Report 120
Capabilities on project:
Building Engineering
8.4.1 Baseline design
The second, medium term phase for this scheme entails extending to the north, connecting to major loads across
Kingston TC and beyond, and extending south east towards the Kingston University Knights Park campus. This
extension to the Phase 1 network is be set out as two additional branches connected directly to the energy centre,
so that Phase 1 remains an independent branch.
Rather than one main line, Phase 2 is considered to be made up of a number of branches which are spread out to
reach all of the larger energy customers in the town centre. The buildings are mostly private commercial properties
which may require some incentives for connection. A well established Phase 1 scheme based around the public
sector may also encourage connection for commercial customers by demonstrating costs and reliability.
The energy supply for the Phase 2 baseline model is from a centralised CHP and boiler plant located at the south
end of the re-developed Edenwalk area, as for Phase 1 base line. The heat loads for all proposed redevelopments
are included except Edenwalk shopping centre and the Leisure Centre redevelopments which are more uncertain. A
list of all of the heat customers considered for connection to Phase 2 (which includes all Phase 1 buildings) can be
found in Table 6.
The location and layout of this medium term scheme is shown in blue in Figure 42.
Please note that all capital costs presented unless otherwise stated are for the entire Phase 2 scheme (including the
phase 1 components). In reality, some of these costs will have been incurred during the development of phase 1,
and partially paid off, and so the IRRs presented may be improved through optimisation of the phasing and
expenditure.

AECOM Final Report 121
Capabilities on project:
Building Engineering
Figure 42: Proposed layout showing short, medium and long term phases

AECOM Final Report 122
Capabilities on project:
Building Engineering
The key outputs for the Phase 2 baseline scheme are shown in Table 15 below.
Table 15: Summary of Phase 2 Baseline scheme
Results Summary Units Base Case
Network
First year of operation 2020
Network length m 5245
Total network capacity kW 42,850
Energy Centre Size m² 750
Economic performance
Total Capital Cost £million 22.2
CHP capacity MWe 7.9
Energy centre boilers capacity MW 43.1
Gas CHP gas demand MWh/year 77,400
Peak boiler gas demand MWh/year 12,200
IRR (Indexed) 25 years % 3.9
IRR (Flat rate) 25 years % 0
NPV (indexed) 25 years -3.0
IRR (Indexed) 40 years % 5.7
IRR (Flat rate) 40 years % 0
NPV (indexed) 40 years £million -0.6
Effective cost of heat p/kWh 5.6
Environmental Performance
10 year carbon saving tonnes CO2 11,500
10 year carbon saving % 12%
Table 16: Summary of capital cost breakdown for Phase 2 Baseline Scheme
Capital costs (including Phase 1) £million
DH network capex 6.6
CHP engine capex 3.9
Energy centre boilers capex 1.9
Energy centre building capex 1.5
Thermal store capex 1.0
HIU capex - commercial loads 3.3
HIU capex - domestic loads 2.7
Gas connection 0.1
Electricity connection 0.1
Development costs 1.1
Total capital costs 22.2
8.4.2 Variations
1. Ring is sized at 300mm
The first variation is selected to determine the effect of designing for possible connection to a later, long term phase,
which would form a large ring shaped network, rather than optimising the phase for the loads present during Phase
2. To allow for future connection, the pipe that is likely to form part of the ring is modelled to be 300mm pipe – this is
the typical diameter for network of this size, it large enough to carry high loads, but also allows for diversity and the

AECOM Final Report 123
Capabilities on project:
Building Engineering
possibility of multiple energy centres. A constant size is selected to allow for flexibility of location of an energy
centre. The additional capital cost of designing for extension for a later phase is £0.7m, this result in an IRR of 3.4%,
compared to a base line value of 3.9%. If this design consideration is not taken into account, and the network is
optimised for Phase 2, the cost of retrofitting the pipes for a later phase would be much greater. There therefore
needs to be some consideration of the likelihood of extending the network, to determine if this additional cost is
worthwhile to maintain flexibility.
2. Redevelopment of Edenwalk and Kingfisher Leisure centre
The purpose of variation 2 is to determine the change in cost if the network were designed to meet the demands of
a large scale redevelopment of the Edenwalk area. The increase in cost is approximately £1million for the oversized
pipes, this is a relatively small price to pay (less than 5% increase) for additional flexibility, and if the redevelopment
goes ahead as modelled the resulting network will achieve a higher IRR. Part of the reason for this relatively small
increase in cost is that the proposed energy centre is located near to the redevelopment, so a larger diameter is only
needed for a short length of pipe. If the Energy Centre were further away from Edenwalk the IRR would be smaller
as the length of oversized pipe increases.
3. No network development north of the railway
Similar to variation 4 for the initial Phase 1 scheme, this variation examines the effect of cutting off a section of the
network. This variation is considered as it may not be possible to connect beyond the railway, depending on the
routes over/under. The expense of crossing a railway may not be outweigh the benefit of connecting.
The capital cost of connecting beyond the railway can be seen to be £2.5m, and by not connecting to the northern
section, the scheme has a higher IRR and NPV over a 25 year life. There may however be some benefit to
connecting to these sites in terms of possible locations for energy centres – CHP or other technologies which make
use of the proximity to the Thames. The predicted load may also change, so that if the load increases, extension of
the network in this direction becomes more viable. This area should therefore still be considered for connection, in
particular in the context of any other railway redevelopment which may reduce the installation costs or increase the
heat load available.
4. Alternative town centre layout
Variation 4 proposes an alternative layout for the northern section of the network from level with Clarence Street
northwards. This is a densely packed area with lot of commercial units and some pedestrianised streets. Any routes
selected for this area will cause disruption and it uncertain which streets would be most suitable for installation of a
DH Network. The results for this variation show that there is little change in the finance or the CO2 savings for the
scheme. This shows that the general form of the layout can vary without significant changes, therefore other
considerations outside of the modelling should be used to determine the exact route the pipe takes, assuming it is
approximately the same length and meets the same loads.
5. Heat pump as energy source
Variation 5 considers the effect of an alternative technology, this would be a heat pump using water from the
Thames as a heat source. The location of the heat pump is unknown so a nominal length of pipe of 500m at a
300mm diameter, to match the main ring is included. The heat pump is sized for a total capacity of 10MW, made up
of No2 x5MW heat pumps.
Heat pump schemes currently receive funding from the Renewable Heat Incentive, for large river source heat
pumps as proposed for this variation, the funding would be 3.5p/kWh of heat delivered to buildings. This has been
included in the model as a sensitivity. Whilst there is no long term certainty over incentive schemes, it could promote
the use of heat pumps in the near term.

AECOM Final Report 124
Capabilities on project:
Building Engineering
The model result gives a negative IRR for the use of heat pumps at this stage without RHI, and an IRR of 0.45%
with RHI, however a higher, positive value could be achieved if there were a CHP present to meet the summer base
load and meet some of the electricity demand for the heat pumps. This cost saving would have to be balanced
against an increase in the CO2 emissions compared with the heat pump only situation, using grid electricity. This
situation is examined further for Phase 3 variation 5
The reduction in CO2 emissions is approximately 4 times greater for heat pumps than for the baseline CHP option,
so this offers the most environmentally sustainable option for the period 2020 to 2030 and using average grid
emissions.
8.4.3 Phase 2 Summary
The result of the Phase 2 Baseline model and all variations can be seen in Table 17
Table 17: Summary of key results for Phase 2 Baseline and variations
Results Summary Units
Base Case
Variation 1
Variation 2
Variation 3
Variation 4
Variation 5
Network
First year of operation 2020 2020 2020 2020 2020 2020
Network length m 5245 5245 5250 4675 5380 5245
Total network capacity kW 42,850 42,850 45,400 39,188 42,850 42,850
Economic performance
Total Capital Cost (including Phase 1)
£million 22.2 23.0 23.4 19.7 22.3 19.5
CHP capacity MWe 7.9 7.9 8.9 7.9 7.9 N/A
Energy centre boilers capacity MW 43.1 43.1 45.6 39.4 43.1 43.1
Gas CHP gas demand MWh/year 77,350 77,400 83,700 71,100 77,400
0 (9,100
electric)
Peak boiler gas demand MWh/year 12,200 12,200 12,600 10,400 12,200 10,900
IRR (indexed) 25 years % 3.9 3.4 4.3 4.2 3.9
0 (0.45
with RHI)
NPV (indexed) 25 years £million -3.0 -3.8 -2.6 -2.3 -0.3
-6.4 with RHI
Environmental Performance
10 year carbon saving tonnes CO2 11,500 11,400 12,400 10,600 11,400 44,300
10 year carbon saving % 12% 12% 12% 12% 12% 45%
The reason for the lower carbon savings than expected compared with Phase 1 is that the date for the start of
operation is later resulting in a lower average electricity grid emission factor over the 10 year period. This means
that gas fired CHP systems save less CO2 than in Phase 1, but heat pumps can save more CO2 than they would do
earlier.

AECOM Final Report 125
Capabilities on project:
Building Engineering
8.5 Phase 3 – Long term
The modelling of the three network includes all other parts of the earlier schemes proposed in Phase 1 and 2. For the purpose of the model it is assumed that this is all installed at the same time, rather than installed phase by phase over a long term plan.
8.5.1 Phase 3 baseline
The Phase 3 network represents the full extent of the town centre DE scheme. It includes connection to all sites
listed in below, with energy supply from a centralised CHP and boiler plant located at Hogsmill Sewage works. For
the main ring network, the pipes are sized at 300mm to allow for diversity of heat supply. This allows for future
flexibility of the networks as an energy centre as constant sizing allows for an energy centre to be located anywhere
on the ring. Figure 42 above shows the proposed layout for all phases. A list of all of the heat customers considered
for connection to Phase 3 (which includes all Phase 1 and 2 buildings) can be found in Table 6.
The key outputs for the Phase 3 baseline scheme are shown in Table 18 below.
Please note that all capital costs presented unless otherwise stated are for the entire Phase 3 scheme (including the
phase 1 and 2 components). In reality, some of these costs will have been incurred during the development of
phase 1, and partially paid off, and so the IRRs presented may be improved through optimisation of the phasing and
expenditure.
Table 18: Summary of Phase 3 Baseline scheme
Results Summary Units Base Case
Network
First year of operation 2025
Network length m 9655
Total network capacity Kw 94,000
Energy Centre Size m² 2500
Economic performance
Total Capital Cost (including Phase 1 and Phase 2)
£million 49.7
CHP capacity MWe 20.1
Energy centre boilers capacity MW 95.5
Gas CHP gas demand MWh/year 180,000
Peak boiler gas demand MWh/year 29,300
IRR (Indexed) 25 years % 4.9
IRR (Flat rate) 25 years % 0
NPV (indexed) 25 years -3.4
IRR (Indexed) 40 years % 6.6
IRR (Flat rate) 40 years % 0
NPV (indexed) 40 years £million 2.6
Effective cost of heat p/kWh 5.2
Environmental Performance
10 year carbon saving tonnes CO2 -73,500
10 year carbon saving % -29%

AECOM Final Report 126
Capabilities on project:
Building Engineering
Table 19: Summary of capital cost breakdown for Phase 3 Baseline Scheme
Capital costs (including Phase 1 and Phase 2) £million
DH network capex 16.1
CHP engine capex 10.1
Energy centre boilers capex 4.3
Energy centre building capex 2.5
Thermal store capex 2.3
HIU capex - commercial loads 7.9
HIU capex - domestic loads 4.1
Gas connection 0.1
Electricity connection 0.1
Development costs 2.4
Total capital costs 49.7
8.5.2 Phase 3 Variations
1. Connection to Kingston University Clayhill Campus
The connection to the Clayhill Campus, for student accommodation, requires a long length of network of around
900m, which may cancel out the benefit of connecting to the site as a heat customer. This variation allows
assessment of the cost effectiveness of this connection.
2. No connection to Kingston Hospital
Kingston Hospital accounts for a significant proportion of the heat load for the network, however it also requires a
relatively long length of pipe to connect to the network. The hospital may be better off maintaining its own CHP plant
to meet its demand, this variation is carried out to examine the viability of the Phase 3 networks, it if did not connect
to Kingston Hospital.
3. Removal of south-east corner of ring main
The location of an energy centre at Hogsmill Sewage Works requires long lengths of pipe to reach the customers
identified, and there are few customers on the south east section of the ring main. Therefore an alternative scheme
is proposed which removes this section of the ring. The details of this layout are given in section 6.6.2. This variation
is modelled by subtracting the capital cost of the pipes required from the overall cost.
The carbon saving and cost savings listed in the result table would actually be larger than given as the model only
considers reduction in capital cost to the network. Maintenance cost and pipe losses are not considered for this
variation, but would have some effect on the result.
The carbon saving is not included for this variation as the model does not give a representative value, however the
saving will be greater than for the base case as there will be less heat losses due to a shorter length of pipe
between the energy centre and the heat loads.
4. Capital costs for Phase 3 only included in economic assessment
This variation is not listed in the previous section as it has no effect on the layout of the network. This variation
considers only the costs associated with the new Phase 3 pipes and energy centre, by subtracting the capital cost of
Phase 1 and 2 from the model. In this situation, it is assumed that the costs for Phase 1 and Phase 2 are paid off.

AECOM Final Report 127
Capabilities on project:
Building Engineering
This is an optimistic scenario, and in reality, the operation of Phase 3 will also have to pay back an element of the
Phase 1 and Phase 2 investment.
This version gives the cost of extending the network beyond Phase 2, by only considering the capital cost of
additional pipework. The annual costs modelled are for the whole network, including the earlier phases. This cost is
taken from the Phase 2 baseline case where the capital cost of the network is £6.6m.
5. Heat pump as energy source
Variation 5 considers the effect of an alternative technology, this would be a heat pump from the Thames and from
the sewage works. The two locations would each be sized for 10MW, using No.4 x5MW heat pumps in total. The
location of the heat pump is unknowns so a nominal length of pipe of 500m at a 300mm diameter, to match the main
ring.
This variation is modelled with just heat pumps and with a CHP engine (capacity 3MWe) to provide some of the
electricity and meet the base load. Both of these options are detailed in Table 20 below.
The results show that heat pumps do not provide a rate of return without the RHI, but in combination with a 3MWe
baseload CHP unit and the RHI, can provide a 3% IRR.
8.5.3 Phase 3 Summary
The result of the Phase 3 Baseline model and all variations can be seen in Table 20
Table 20: Summary of key results for Phase 3 Baseline and variations
Results Summary Units Base Case
Variation 1
Variation 2
Variation 3
Variation 4
Variation 5
Variation 5
Network
No CHP CHP
First year of operation 2025 2025 2025 2025 2025 2025 2025
Network length m 9,700 10,600 8,500 7,285 9655 9800 9800
Total network capacity kW 94,500 97,200 50,000 93,400 94,500 94,500 94,500
Economic performance
Total Capital Cost (including Phase 1 and Phase 2)
£million 49.7 51.0 33.5 45.5 43.1 43.7 45.3
CHP capacity MWe 20.1 20.1 9.7 20.1 20.1 N/A 3.0
Energy centre boilers capacity
MW 95.5 98.3 50.9 95.5 95.5 95.5 95.5
Gas CHP gas demand MWh/ year
180,000 182,000 95,300 2025 180,000 0 (18,700 electric)
41,600 (16,200 electric)
Peak boiler gas demand
MWh/ year
29,300 31,900 16,700 9655 29,300 27,400 18,900
IRR (indexed) 25 years % 4.9 4.6 0.5 6.1 6.9
0 (0 with RHI)
0 (1.2 with
RHI)
NPV (indexed) 25 years
£million -3.4 -4.5 -10.8 0.3 2.5 -17.2 with
RHI -13.1 with
RHI
Environmental Performance
10 year carbon saving tonnes CO2
-73,500 -74,800 -41,400 -73,500 -73,500 127,300 95,000
10 year carbon saving % -29% -33% -34% -33% -33% 58% 43%

AECOM Final Report 128
Capabilities on project:
Building Engineering
8.6 Financial and Environmental benefits for developers
The use of DH, and connection to wider DH schemes may be of benefit to developers through providing a low
carbon heat source, and potential economic benefits. A full discussion of future Building Regulations standards and
GLA policy standards is provided in Appendix 3: Impact on new development, with an assessment of how these
standards may or may not promote the use of DH in new development. This appendix provides a summary of:
An outline of the proposed zero carbon standards relating to Part L of the Building Regulations
(Conservation of Fuel and Power), future policy thinking, and the GLA policy relating to CO2 emissions on
new development.
An assessment of how future Part L standards and the GLA policy may promote the use of DH schemes,
and the benefit this may provide to developers.
Examples of cost and environmental modelling on a range of building types to demonstrate the performance
of DH against alternative solutions to meeting the standards.
Under the current Part L 2010 and the proposed 2013 standards (to be introduced later in 2013), the CO2 targets do
not necessitate the use of a DH scheme and alternative lower cost options are open to developers. However under
the GLA’s energy hierarchy, the use of a district heating system is required where viable. Without the GLA policy, it
is unlikely that developers would make use of DH on new development due to the lower targets.
For “zero carbon” regulations (2016 for domestic and 2019 for non domestic) there is much uncertainty around the
technical standards, the level of carbon compliance, and the allowable solutions mechanism. This means that it is
(a) not possible to state how well different technologies will perform in relation to targets (which are currently
uncertain, and (b), it is not possible to make an assessment of the economic viability, especially due to the lack of
clarity around the costs of allowable solutions. However in line with current Government thinking, it is unlikely that
future standards will be set at a level which require off-site connections and complex site-wide strategies, and more
likely they will be developed around using building scale solutions such as PV. In high density developments, the
lack of roof space for PV may be one trigger for including low carbon heating from DH, but changes to the future
regulations and standards for high rise flats may remove this advantage for DH.
The costs of achieving CO2 reductions on site can not consider only capital investment, but also need to take into
account lifecycle revenues and costs, and the balance of investment from different parties. The ability of developers
to capitalise future revenues, either through increased building value, or reduced capital investment, depends on the
strategy and delivery mechanism. For DH, the costs to developers will depend very much on the cost effectiveness
of DH on each scheme, and the level of investment the DH scheme operator is willing to provide. This needs to be
balanced against the alternative solutions and delivery mechanisms.
Full details are provided in Appendix 3: Impact on new development.
8.7 Summary
This section provides an assessment of the economic and environmental performance of the three phases of DE
scheme under a number of sensitivities.
The results demonstrate that a Phase 1 scheme could provide an IRR of up to 4.1 % and CO2 savings in the order
of 25%. Whilst these IRRs are not commercially attractive, they could be potentially improved through optimisation
at detailed feasibility stage to a level which can attract public sector investment, or even commercial investment.
Sensitivity analysis on the baseline results shows that a 20% increase in electricity revenue price (equivalent to 1.2p
/ kWh extra) could increase the IRR to around 7.5% which would attract public sector investment.
The phase 2 schemes all provide IRRs of around 4% except for the river water heat pump option which drops to
0.45% even with RHI income. These IRRs include investment in the entire network, and so if the phase 1

AECOM Final Report 129
Capabilities on project:
Building Engineering
component is considered to be partially paid back, then the effective IRR would increase further. The stability of the
IRRs across the variations demonstrates that the Phase 2 options are not critical when defining phase 1 of the
network.
The IRRs for the long term Phase 3 network improve over the initial 2 phases with up to around 6% if the layout is
changed to remove the poorly utilised section of the ring main. As with Phase 2, some of the capital for Phase 2 and
1 will have been paid off and therefore the effective IRRs of this later phase will be higher. The heat pump options
are not predicted to be cost effective without additional generation, but when a 3MWe CHP system is included in the
scheme, (a relatively small contribution), an IRR of 3% is achieved with RHI income.
These results all demonstrate that there are potentially viable short, middle, and long term DE options in Kingston
Town Centre. Phase 3 demonstrates that the viability of the scheme improves with size, and whilst the phase 1
scheme gives low IRRs, it is anticipated that optimisation of the network at the detailed feasibility stage combined
with improvements to the electricity revenue (though either on-site electricity sales, or improved licence lite rates)
could increase the IRR to public sector investment levels. One option for phase 1 is to develop a scheme with
distributed boilers which remain in the operation of customers, and only sell baseload heat. Whilst this does not
offer such a large discount on the customers overall heating bill, it provides an economically attractive scheme
which could act as a catalyst.

AECOM Final Report 130
Capabilities on project:
Building Engineering
9.1 Introduction
The development of DE schemes can be complex and requires the collaboration of a number of parties. During all
stages of the scheme development, from feasibility to operation, a number of risks may be encountered which will
need to be overcome. The lack of regulation of heat supply can be a particular issue, alongside the perceived
immaturity of DE schemes in the UK. The risk analysis presented here identifies key project risks in the delivery of
the proposed DE scheme (technical, economic, legislative, and consumer issues) and suggests mitigation measures
and action holders. Project risks have been ranked in order of their importance and potential impact.
9.2 Types of risk
The risks associated with developing a DE scheme can be categorised a number of ways depending on the focus of
the risk assessment process. The following categories of risk are assessed in this section:
Technical viability. Risks associated with identifying and delivering a scheme which is technically viable.
Economic viability. Risks associated with the economic performance of a scheme, and the ability to deliver
a rate of return.
Commercial. Risks associated with customers, lease agreements, and suppliers.
Regulatory / policy. Risks associated with uncertainty around future regulation and policy at national and
local level.
Development and construction. Risks associated with the development and construction of a scheme –
these may cover a range of technical, economic, and commercial issues.
Future strategy. Risks associated with the ability of the scheme to be future proof and have a long term
strategy.
Other general risks. Any other risks not falling into the above categories.
9.3 Measuring risk
The consideration and measurement of risk requires an understanding of two properties:
Impact. The impact of the risk is the outcome that may occur if the risk is not properly managed. For
example, if sufficient economic analysis is not conducted and sensitivities assessed, the impact of economic
viability risk may be that a scheme is not economic once developed.
Probability. This is the chance that a risk may occur and is independent of the impact.
The outcome of impact and probability is an overall measure of risk. If the impact and probability are both deemed
to be high, the overall level of risk is high. If the impact and probability are both deemed to be low, then the overall
risk is low. For intermediate situations, a matrix is used to assess the overall risk. For example a high impact
combined with a low probability results in a medium risk. Figure 43 shows the risk assessment matrix used in this
study.
9 Risk assessment

AECOM Final Report 131
Capabilities on project:
Building Engineering
Figure 43: Risk assessment matrix taking into account probability and impact.
9.4 Assessment of risk for RBK
Table 21 provides an initial risk assessment for DE schemes in RBK. For each identified risk, the impact,
probability, and overall measure are given along with mitigation measures and organisation responsible.
It should be noted that this is a first stage risk register based on the masterplanning work, and this will need to be
continually updated if any project proceeds. The risk register is provided in spreadsheet format for this purposed
alongside this report.
At this initial high level masterplanning / feasibility stage, the project ownership and control lies almost entirely with
RBK, and so the current risk owner for all items is identified as RBK. As the scheme progresses, some risks will
transfer ownership to other responsible parties.
1 2 3 4 5
1 1 2 3 4 5
2 2 4 6 8 10
3 3 6 9 12 15
4 4 8 12 16 20
5 5 10 15 20 25
Imp
act
ProbabilityRating

AECOM Final Report 132
Capabilities on project:
Building Engineering
Table 21: Risk assessment of DE schemes in RBK
Risk category Risk ID Project Risk RBK Risk register
Prior to mitigation
Pro
bab
ility
Imp
act
Ratin
g
Mitigation
Ow
ner
Commercial 19 Failing to attract a high uptake of customers willing to commit prior to construction
4 4 16 Communications strategy, regular contact with key stakeholders required.
RBK
Commercial 20 Heat sale price not yet known and needs to be competitive to secure customers.
4 4 16
Phase 1 feasibility work needs to examine the heat sales price further to provide indicative costs for customers. If not competitive, network unlikely to be developed.
RBK
Commercial 21 Willingness of customers to accept long term contracts and long term stability of customers
4 4 16 Close engagement is required with customers to promote the economic and other benefits DH can provide.
RBK
Commercial 22 Delivery and governance structures not agreed
4 4 16
RBK need to assess potential options for the delivery of the scheme. Engagement at Chief Exec level in the Borough will be essential.
RBK
Commercial 24 Failure to secure project funding 3 5 15 RBK need to assess potential funding and deliver options to ensure that this can be obtained.
RBK
Commercial 23 Ability to retain customers on shorter term contracts
3 4 12 Heat sales prices and contracts will need to be robust and attractive.
RBK
Commercial 18 Ability of economic performance to allow discounted heat sales
3 3 9 This is of lower risk to phase 1 due to the larger public sector involvement and likelihood of accepting a smaller discount.
RBK
Commercial 25
Potential lease agreements needed for energy centre location, agreements for access to distributed boiler rooms etc.
3 3 9 Explore further once location of plant established at phase 1 feasibility stage.
RBK

AECOM Final Report 133
Capabilities on project:
Building Engineering
Development and construction
30
Impact on road transportation. Development of the DHN may cause disruption to key or busy roads, and impact on traffic.
3 4 12
It is likely that the installation will cause disruption. Once exact routes are known, coordination with the Council transport department is required to ensure that the works are conducted in a way which causes minimal disruption.
RBK
Development and construction
32
Existing buried services. The extent of existing utilities may impact on the routing of the DH network and cost of installing.
3 3 9 Detailed review and survey of existing utilities will be required during the design and construction stages.
RBK
Development and construction
33 Programme delays giving increased costs
2 3 6
Careful management during the development and construction phases will be necessary to ensure any delays are managed and minimised
RBK
Development and construction
29 Lack of integration with existing and planned works
2 2 4
No major existing or planned works have been identified which require coordination. However the EMP can be used to help identify where future works may have an impact.
RBK
Development and construction
31 Land ownership constraints for routing of DH network.
2 2 4 Explore in more detail at feasibility stage. No major issues identified in the EMP.
RBK
Economic viability
17 The rate of return is too low to attract investment
4 4 16
It is possible that the rate of return is to low to be of commercial interest, but options using public sector funding (eg PWLB) may be used.
RBK
Economic viability
13 Achieving a reliable and sufficient electricity revenue
3 5 15
This EMP assesses the option of using License Lite, but the viability of this is uncertain. RBK need to keep engaged with the GLA over License Lite options, and also examine further options for maximising electricity revenue.
RBK / GLA
Economic viability
16 Uncertainty over capital cost 2 4 8 Further feasibility work needs to examine captital costs in more detail, including for energy centre development
RBK
Economic viability
14 Uncertainty over future energy prices for development of business plan
2 3 6
The future of energy prices is uncertain, and so further economic viability work for phase 1 needs to examine sensitivies to energy prices
RBK
Economic viability
15 Uncertainty over future operation and maintenance costs of energy plant and
2 2 4 The phase 1 scheme proposes a gas CHP unit which is reliable and mature technology.
RBK

AECOM Final Report 134
Capabilities on project:
Building Engineering
network
Economic viability
12 Achieving an acceptable debt rate with customers for heat sales
1 3 3
In the first phase, the majority of customers are public sector and so this should be limited. For private sector customers, robust contracts are required.
RBK
Future strategy 36
Level of control over future strategy of network by council, such that network will expand as desired.
3 3 9
This is dependent on the governance and delivery structure. If the scheme is delivered with strong council control / ownership, then control will be retained. If a commercial deliver route is taken, this control may be reduced.
RBK
Future strategy 37
Limited identification and encouragement of future connections to the network with existing buildings and new developments.
3 3 9 RBK need to keep a watching brief to identify, and engage with, any new potential customers.
RBK
Future strategy 34 Lack of flexibility in phase 1 network for future expansion
2 4 8 The EMP considers options for providing additional capacity in the phase 1 network.
RBK
Future strategy 35
Technical capacity of energy centre to expand for future extensions to network including the provision of additional plant and capacity of utilities connections.
2 4 8 The EMP provides a number of phased options, which rely on both phase 1 plant and additional plant for future phases.
RBK
Future strategy 38
Capacity of network to integrate technically and commercially with other networks where potential exists.
2 3 6
The network proposals for DH schemes across London are based on similar operation parameters. However any connection issues will need to be dealt with on a case-by-case basis.
RBK / GLA
General / miscellaneous
2
Local political risk. Changes to council administrations results in lower priority for DH schemes or even abandonments through removal of resource.
3 4 12
Engagement with the Council and Exec and Director level is essential for the scheme to be given the resources and priority required.
RBK
General / miscellaneous
3
National political risk. Changes to national administration or strategy results in move away from DH, or powers which allow local authorities to develop and invest in DH schemes.
2 3 6 This may place a greater emphasis on schemes being economically attractive for commercial investment.
RBK

AECOM Final Report 135
Capabilities on project:
Building Engineering
Regulatory / policy
28 Regulated incentives for gas CHP are not favourable reducing viability of the scheme.
2 4 8 RBK need to monitor incentives for gas CHP and DH to monitor the impact this may have on a scheme.
RBK
Regulatory / policy
26 Energy centre environmental impacts e.g. air quality
2 3 6
This needs examining further at phase 1 feasibility stage. No immediate specific issues have been identified as part of this EMP.
RBK
Regulatory / policy
27
Energy centre can not obtain planning permission due to nature and size of building and associated flues.
2 3 6
The energy centre will need careful design consideration but following consultation with the planners, there are not believed to be any fundamental constraints.
RBK
Technical viability
8 Identification of an energy centre location for phase 1
3 5 15
The sites in the EMP need to be examined further and engagement commenced with other parts of RBK and third parties to ensure a location can be identified.
RBK
Technical viability
5 Existing heating systems are not suitable for connection to a DE scheme
3 4 12 Review existing plant in buildings at the feasibility stage to assess the high level viability of connection.
RBK
Technical viability
4 Lack of suitable loads for producing a diverse heat load profile for a DE scheme.
3 3 9 Assess the viability of loads at the technical feasibility stage, including sensitivity of including each load.
RBK
Technical viability
7
Flexibility of the network to future energy supply options to allow operation at low temperatures
3 3 9 Any designs need to be future proofed to ensure the network has the capacity to operate at lower temperatures.
RBK
Technical viability
6 Suitable routes can not be found for the network due to other constraints
2 4 8 Further feasibility work needs to identify the routes in detail and examine constraints such as existing utilities.
RBK
Technical viability
9
Availability of suitable gas and electricity infrastructure connections at the energy centre site.
2 4 8 These need to be assessed at the detailed feasibility stage for each phase of the network.
RBK
Technical viability
11 Ability of the network to provide CO2 reductions in the longer term
3 2 6
The EMP identifies that heat pumps can provide longer term CO2 savings, but this requires the network to be operated at lower temperatures, and a suitable source of secondary heat found.
RBK
Technical viability
10 Ability of network to give required CO2 reductions in the short term
2 2 4 The EMP identifies that gas fired CHP can provide large CO2 savings in the short term.
RBK

AECOM Final Report 136
Capabilities on project:
Building Engineering
10.1 Introduction
This section provides an overview of a delivery plant for taking forwards DE in RBK. It addresses the key areas of
project governance and structure, a programme for the delivery of a project, and next steps.
10.2 Project governance and structure
10.2.1 The balance of risk
The fundamental issue facing local authorities is whether they are willing to invest directly in the DH scheme and
what the relationship is with the private sector. The evaluation of the options usually revolves around a number of
considerations:
The balance between taking on project risk and having control over project outcomes;
The rate of return for the project will actually support and the recognition that the cost of capital or the
required rate of return for the private sector is generally greater than for the public sector which on a capital
intensive project has a major impact on viability; and
The availability of capital to both public and private sector is limited but is also closely linked to the degree of
risk involved and the organisations’ understanding of the risks involved.
Figure 44 and Figure 45 illustrate some of the above issues.
Figure 44: Appetite for risk and reward against availability of capital
10 Delivery plan and next steps
Delivery Vehicles for DH
Higher risk Greater Control Higher rewards
Appetite for
Risk
Low risk Limited Control Low rewards
Availability
of capital to
City Council
Capital available
Capital limited
Council leads project, conventional construction contract, most operation is in - house
Private sector ESCo leads project, Council facilitates
Council provides finance, risk limited by contracts with private sector
Council leads but seeks finance from external Sources (eg, grants)

AECOM Final Report 137
Capabilities on project:
Building Engineering
Figure 45: Appetite for risk and reward against project performance
Governance means the structure by which control is exercised over an operation which follows the decisions around
business structures.
Procurement means the process by which services from the private sector are contracted by the public sector.
Both of these issues are subsidiary and subsequent to taking decisions on the more fundamental question of
delivery structures.
10.2.2 Typical energy scheme governance structures
As for the privatised electricity and gas industries there are three clearly identifiable businesses in a district heating
scheme:
A generation business producing the heat and selling electricity (GenCo).
A distribution business distributing heat through the district heating network (DistCo).
A supply business buying heat from the producers, selling energy to customers and paying the distribution
company for the transport of energy (SupplyCo).
The separation of these three businesses would potentially enable competition between heat generators and
competition in the supply of energy to customers on the network as for electricity. The distribution business is a
natural monopoly and if privately owned would ideally be subject to regulation to protect customers and to ensure
open access for suppliers in a similar way to the gas and electricity networks.
In many cases, particularly small schemes, all these businesses have been combined as a vertically integrated
organisation partly to reduce risk and partly for simplicity, although this may change as larger systems develop and
grow. However it is helpful to consider each element separately when evaluating options for a scheme.
It is also important to recognise the differing characteristics of these three businesses:
Delivery Vehicles for DH
Higher risk Greater Control Higher rewards
Appetite for Risk by Local Authority
Low risk Limited Control Low rewards
Project Performance
High IRR
Low IRR
Council leads project and retains surpluses to expand scheme
Project does not proceed unless low cost finance available e.g. grant funding
Private sector ESCo
leads project, Council facilitates
Council leads but needs low cost finance to proceed and may not expand

AECOM Final Report 138
Capabilities on project:
Building Engineering
The heat generation plant typically has a shorter technical operating life and a higher requirement for
operation and maintenance. Once built it is unlikely to require additional investment until plant replacement
or major overhaul. The major contracts will be for purchase of fuel and selling electricity.
In contrast the DH network has a very long life and is likely to require regular small additional incremental
investments as it expands to serve new customers.
The supply business will need to be customer focused able to manage a large number of small contracts
with a wide range of requirements.
In the other utility markets where natural monopolies exist a Regulator has been appointed to ensure that capital
investments
Energy supply is regulated by OFGEM and it is likely that if heat supply (currently un-regulated) becomes a
regulated business, then OFGEM or a similar Government body would be responsible for overseeing the process.
At a local level, Local Authorities involvement in schemes can help provide a degree of certainty and confidence to
customers, but this would not “regulate” heat supply.
The DistCo business may be divided into two levels – the distribution network which supplies energy to customers
and the transmission network which will generally only supply energy to the more local distribution network.
The SupplyCo is responsible for reading meters, billing and debt collection although this may be sub-contracted out
to a separate company. The ownership of meters at the customer locations may be with either the SupplyCo or the
DistCo.
Figure 46: The basic elements of a delivery and governance structure for a district heating scheme.
10.2.3 Structure for district heating companies
The structure previously described was developed when established large-scale businesses in electricity and gas
were privatised. The development of district heating as a new energy infrastructure has a number of characteristics
which mean a direct transfer of the above concepts may not be realistic.
GenCo
Produces energy
Customer
Buys energy
SupplyCo
Buys and sells energy
Regulator
DistCo
Distributes energy

AECOM Final Report 139
Capabilities on project:
Building Engineering
These differences are:
The district heating networks will be more local than the national electricity or gas grid. In the early days of a
heat network or on small schemes, it may not be practical or possible to have multiple energy suppliers who
compete to supply a heat market; a single heat energy source is more likely;
There is currently no system of regulation for the heat network so there is limited consumer protection. As a
result there is a stronger desire by the Local Authority to own the network to provide some protection;
The district heating network enables strategic objectives including CO2 emissions reductions, affordability,
resilience and energy security to be met and these will be realised through taking a wider strategic view
that may go beyond the obligations and economic considerations of a private company;
There is a critical need to measure and confirm that the benefits of the heat network are being achieved and
delivered over time and a detailed metering and data gathering strategy at the consumer’s sites will be
required; and
Existing utilities have ownership in perpetuity and an obligation to connect customers. A DH scheme set up
as a concession agreement for a finite period raises questions as to what happens at the end of the period.
There is a risk also that investment becomes progressively more limited as the time left to recover that
investment decreases. This may be the opposite of what is desirable for the project.
Typically, the options evaluated for DH schemes are:
Fully private sector model – selecting an Energy Services Company (ESCo) to deliver the scheme;
Fully public sector model – setting up an internal department to deliver the project;
A hybrid (“joint venture”) scheme where an ESCo is set up as a special purpose vehicle (SPV) with the local
authority as one of the stakeholders and other public and private sector partners.
Further variations within the hybrid scheme may have benefits depending on the circumstances and political aims.
For example an option might be to include: replacing shareholder ownership with a membership scheme that
receives a dividend for investment into the scheme or a limited liability partnership; or creating a not-for-profit co-
operative scheme. Creating a mutual or co-operative allows an asset lock to be place on the distribution of
surpluses which are instead either re-invested in the business, shared with customers through lower heat prices or
channelled into adjacent activities eg Green Deal.
The three main options of private, public or a private/public partnership can be applied to all of the three businesses
together or each business could be treated separately.
In addition the development of the project can be further subdivided into the construction, ownership and operation.
In many cases the construction and operation will be taken forward through sub-contracts with specialist
organisations.
Figure 47 shows a number of delivery options based on taking the three businesses (generation, distribution,
supply), the three ownership options (public, private and partnership) and the three functions of construction,
ownership and operation and combining these in various combinations. The matrix is not exhaustive but it does
cover the most commonly found arrangements used so far in the UK.

AECOM Final Report 140
Capabilities on project:
Building Engineering
OPTION Heat generation District Heating Network Supply of heat
Build Own Operate Build Own Operate
A PSC PSC PSC PSC PSC PSC PSC
B1 C C C C C C C
B2 C C PSC C C PSC C
C1 PPP PPP PPP PPP PPP PPP PPP
C2 PPP PPP PSC PPP PPP PSC PPP
D1 PSC PSC PSC C C C PSC
D2 PSC PSC PSC C C C C
E1 C C C PSC PSC PSC PSC
E2 C C C PSC PSC PSC C
Key
C = Council PSC = Private sector energy services company PPP = Joint private/public sector company Note: Where C is indicated as responsible for any of the functions, this does not preclude contracting with the private sector for actual delivery of this function.
Figure 47: Possible options for delivery structures for DH
Comparisons of the options and solutions are outlined below
A. All private sector. A private sector company constructs, owns and operates the CHP and the new heat network
and sells heat to each customer on the new network at each building connection. There is no public sector
involvement.
B. Predominantly public sector. The Council (C) constructs, owns and operates the CHP and the new heat
network, and sells heat to customers on the new network (Option B1) with no private sector involvement. The
day to day operational risk to C can be reduced if the operation and maintenance of the CHP and DH network
are contracted to experienced private sector companies (Option B2).
C. Public private partnership (PPP) ownership. A PPP is formed between C and a private sector company to jointly
build and own the scheme and sell energy to customers. To reduce the public sector risk in operation, a private
sector company could be contracted for the on-going operation requirements (option C2).
D. Split assets – network in public ownership. A private sector company constructs, owns and operates the CHP
plant. The heat network is constructed, owned, and operated by C who either sell heat directly to the customers
(option D1), or who charge the private sector company a rental on the network on the basis of capacity and units
of heat transferred in return for the private sector company selling heat to the customers (option D2).
E. Split assets – network in private ownership. C constructs, owns and operates the CHP plant, whilst a private
sector company constructs, owns, and operates the heat network. The private sector company can purchase
heat off C and sell to customers over the network (option E1) or alternatively, C can sell heat to customers by
paying the private sector company network owner/operator a distribution charge (option E2).

AECOM Final Report 141
Capabilities on project:
Building Engineering
In addition to the above options and as detailed in Figure 47, there are many other theoretical options. However we
believe the above options represent the most practicable, and are the most fruitful to pursue further for RBK.
10.3 Project plan
This EMP sets out a high level vision for DE across the Kingston Town Centre area, with potential for connection to
neighbouring schemes and areas. A project plan needs to consider both the near term and long term delivery of this
vision. These are discussed further below.
10.3.1 Near term project plan and next steps
The project plan for the near term needs to consider the stages of work required to deliver the first phase of a
scheme, including from initial engagement and strategy (which this EMP is part of), through viability assessment and
development of business plans, to the delivery a scheme.
Key early phase actions are as follows:
On the back of this EMP, engage with relevant decision makers within RBK including at Director and
Executive level to ensure the outputs from this work are understood and develop a strategic vision and
vehicle for taking forwards DE schemes in the Borough. This process must consider the potential
governance models available to ascertain the Councils willingness to accept risk, the level of control desired
over a scheme, and the ability of the Council to raise finance.
Identify sources of funding for further development work for the phase 1 scheme to cover further viability
work and business case development. It is suggested that this may cost circa £200k over the next two
years.
Procure more detailed feasibility work for a Phase 1 scheme. This EMP suggests that there may be an
economically viable phase 1 scheme which warrants further investigation. This needs to examine in further
detail the energy loads and profiles, locations for an energy centre, network routes, and conduct a more
detailed costing exercise.
Engage with the potential customers on a Phase 1 scheme, in particular with Kingston University. Whilst no
information can be provided initially on exact heat costs, these discussions should aim to develop a good
working relationship to ensure further information exchange and data collection is possible, and an
understanding of potential contract terms (including length) can be developed.
Work with the planning department and potential customers to identify suitable energy centre locations. In
particular, there needs to be strong representation of the DE scheme within the Kingston Futures group as
this appears to be a major opportunity.
Once these early stage actions have been completed, the programme until construction is expected to be circa 3
years although this clearly depends on the complexity of the scheme and how it is delivered. Figure 48 provides an
indicative development programme for phase 1.

AECOM Final Report 142
Capabilities on project:
Building Engineering
Figure 48: indicative project plan for phase 1 of the scheme.
DEVELOPMENT OF A DISTRICT HEATING NETWORK
Activity Month 1 2 3 4 5 6 7 8 9 10 11 12 13 14 15 16 17 18 19 20 21 22 23 24 25 26 27 28 29 30 31 32 33 34 35 36 37 38 39 40
Development stage
Establish development budget
Procure advisors
Appoint advisors X
Engineering development
Commercial appraisals
Business structure development
Review development stage
Agreement to proceed X
Planning Permissions
Prepare planning documents
Public consultations
Submit planning application X
Planning permission obtained X
Procurement stage
Develop tender documents
Advertise and shortlist
Issue tender documents X
Tender period
Tenders returned X
Formation of business structure
Develop key documents
Obtain commitments from parties
Tender appraisal and negotiation
Appraisal to select preferred contractor
Negotiations with contractor construction phase
Negotiations on operating phase
Commercial and technical risk review of project
Approvals by all Client bodies and Contractor
Notification of Contractor X
Standstill period
Confirmation of Contractor X
Financial Close X
Construction Period
Mobilisation
Design development
Construction starts on site X

AECOM Final Report 143
Capabilities on project:
Building Engineering
10.3.2 Mid-term project plan and next steps
The work required in the mid-term depends on the outcome of the phase 1 scheme. However the following items
will need to be considered:
Identification and engagement with key potential customers to develop a robust potential customer base for
further feasibility and business case work.
(Further) development and implementation of planning policy to ensure that developments in areas
mentioned in this EMP, and other developments in the DH network areas, are designed and built such that
they are suitable for connection. RBK will need to work strategically with landowners and developers to
ensure that this is achievable, including how the scheme will be managed.
Identification of sites for future energy centres, including engagement with Thames Water over the Hogsmill
STW, continued engagement with Kingston Futures, and identification of river-side sites.
Consideration of heat pumps as a heat provision technology to provide long-term carbon savings. This will
need to influence the future network design, and potentially customers on the existing network.
Close engagement with the Hospital to ensure that future renovation and re-development facilitates
connection to a site-wide DH scheme, and identification of opportunities for locating additional plant at the
hospital site.
10.3.3 Long-term project plan and next steps
The long term plan is clearly loosely defined at present and subject to many influencing factors relating to the scale
of the Phase 3, and outcome from earlier phases. However at a strategic level, the following need to be considered:
Continued identification and engagement with potential customers, and ensuring new development can
connect.
Assessment of performance of existing phases and environmental performance, and ensuring that
technology strategies (eg gas CHP or heat pumps) can deliver the required economic and environmental
performance.
Engagement with the GLA and neighbouring Boroughs to ensure opportunities for wider connections are
identified and facilitated.
10.4 Phasing considerations for DHN development
The proposal for a 3 phase system in this EMP is based on the short, mid, and long term opportunities for DE development. In reality following an initial first phase, the scheme is likely to expand in a number of smaller phases with larger more strategic extensions being added as and when required. However the 3 phase model allows a simple outline of phasing considerations to be developed as shown in

AECOM Final Report 144
Capabilities on project:
Building Engineering
Table 22 below:

AECOM Final Report 145
Capabilities on project:
Building Engineering
Table 22: Phased feasibility considerations for the DHN development
Timing for considerations at feasibility stage
Relevant
Layout Phase 1 feasibility period Phase 2 feasibility period Phase 3 feasibility period
Ph
ase 1
Identification and assessment of which buildings to connect to; load, type of customer
Energy centre location: space/availability, temporary or permanent, suitable for connection to phase; flexibility to vary location
Retained boilers; in which buildings and for how long (i.e. permanent or temporary)
Network route; connection details;
Flexibility for future development; connection to a later phase; extension in other directions - south or west
Ph
ase 2
EC location and size; use same location for Phase 1&2 – may also retain engines, or use a second energy centre.
Location of connection of Phase 2 network to Phase 1 and identification of suitable capacity in Phase 1 proposals.
Identify other planned infrastructure works to coordinate with phase 2.
EC location; one or more? Use of existing phase 1 energy centre?
Technology – gas engine CHP or heat pumps?
Which sites to connect to: load, customer type.
Size for future redevelopments
Network route; connection details; phase with other works
Difficult routes – over railway and river, can these be phased with other works; are these sites worth connecting with.
Phasing of installation: all at one; main line and then additional extensions at later date.
Ph
ase 3
Ensure phase 1 network proposals reflect ongoing engagement with future customers and energy centre locations, eg Hogsmill STW.
Number of energy centres – retain phase 2 EC or develop additional capacity.
Differing technologies – WSHP from river Thames, design layout to account for this
How and where to connect to Phase 2
Compatibility of Phase 2 with Phase 3 – pipe sizing for appropriate future load
Phasing of connection; joining a number of smaller networks (Hospital, Cambridge Road etc) or extending out ‘from scratch’
Energy Centre location – land availability, fixed or variable location
Network route and layout (including decision for ring or branches.
Identification of phase 3 customers and engagement.

AECOM Final Report 146
Capabilities on project:
Building Engineering
11.1 Introduction
This section sets out the conclusions and recommendations relating to the potential to develop DE schemes serving
two locations in Kingston-upon-Thames, taking into account existing and future public sector, quasi-public sector
and private sector energy demands, existing heating installations, and clustering of energy loads. Potential network
routes and energy sources have been considered. This has enabled the economic feasibility, environmental
benefits and a wide range of risks to be assessed, so that the overall feasibility and likely location and phasing of DE
schemes can be set out. A project plan has been prepared which will be owned by RBK and updated by the Council
in line with any changes to the project elements. The next steps are also noted.
The information used for this report is based on a number of sources. The most significant dataset is from the RBK
heat mapping study which is used for the basis of the EMP. This identifies the key loads, and proposes areas of
interest for DE scheme development, mainly the KTC area. The datasets from the RBK study are assessed and
amended where required. For core sites including redevelopment opportunities and possible energy centre
locations, additional information was collected from site visits and more detailed discussion where necessary.
11.2 Review of Information
The town centre contains a number of large energy users in close proximity, which offers a significant opportunity for
a DH network to be established. Further out from the Kingston Town Centre there is a large housing estate on
Cambridge Road and Kingston Hospital which have potential to be future heat customers.
The scope of a DH network in the Tolworth areas appears limited. The only site that is deemed possible for
connection is Tolworth Tower as the major ‘Tesco site’ nearby already includes a CHP plant sized for the whole
development. Unless a number of smaller customers can be found that are able to connect, the most viable scheme
is to provide for Tolworth Tower only and not connect to other customers.
11.3 Energy Production
Analysis of the available technologies identified two possible heat sources as gas fired CHP systems and large
scale heat pumps. Finding land for an energy centre is critical to the development of the network. For the short term,
the Phase 1 network could make use of distributed boiler plant and a central energy centre as land becomes
available. The main long term option for an energy centre is the Hogsmill valley area, as there are some areas of
unused land, which is less likely to be developed for other purposes. This site also provides an opportunity for
secondary heat from the STW outlet using a large heat pump for future phases.
In addition to this site there may also be potential to use heat pumps to take secondary heat from the river Thames.
This requires a site along the river bank, therefore suitable locations, including potentially as a future addition to the
power station site, need to be identified and promoted through planning.
11.4 Energy distribution
It is proposed that the network develop in 3 phases
Phase 1 – Short term – comprising of a small group of council owned buildings the Courts, the police
station, Kingston College and Kingston University
Phase 2 – Medium term – extension northwards into the town centre and up to level with the railway,
connecting to the larger retail units throughout the town.
Phase 3 – Long term – extending east to the Cambridge Road estate and to Kingston Hospital to form a ring
with an energy centre located at the sewage treatment works.
11 Conclusions and recommendations

AECOM Final Report 147
Capabilities on project:
Building Engineering
For each of these phases a number of variations are proposed to find an optimal configuration. Table 23
summarises some of the key details for the baseline schemes as well as the range of IRR calculated from the
proposed variations
Table 23: Summary of three phase plan for Kingston Town Centre DHN for the base case scenarios
Phase 1
Short Term
Phase 2
Medium Term
Phase 3
Long Term
Capital cost (£million) 8.2 22.2 49.7
New DHN capital cost
(£million) 2.2 4.4 11.7
Heat load (MW) 16.8 37.9 94.5
Annual average CO2
saving (tonnes) 9,500 11,500
*up to
127,300
Annual average CO2
saving (%) 26% 12% *up to 58%
IRR (indexed, 25 years) for
variations 2.3 - 4.9% 0.5 – 4.3% 0 – 6.9%
*The carbon savings of the long term phase 3 network are highly dependent on the future mix of grid electricity.
The results demonstrate that the baseline Phase 1 scheme with a central energy centre located in the Eden Quarter
on existing RBK land (currently surface car parking) providing all of the schemes heat could provide an IRR of 3%.
By locating the energy centre closer to the customers (and therefore reducing the DH network length), the IRR is
increased to 4.1%. The highest IRR of 4.9% is obtained when the DH network provides baseload heat only
(Variation 3) and peak and back-up heat supply is from the customer’s existing boilers.
Whilst these IRRs are not commercially attractive, they could be potentially improved through optimisation at
detailed feasibility stage to a level which can attract public sector investment, or even commercial investment. It
should be noted that the assumptions used in this EMP are purposely conservative to reflect the high level nature of
the analysis, and therefore it is possible that optimisation could be beneficial. Sensitivity analysis on the baseline
results shows that:
a 20% increase in electricity revenue price (equivalent to 1.2p / kWh extra) could increase the IRR to
around 7.5% for the baseline Phase 1 scheme. This would attract public sector investment.
A 20% reduction in capital costs (representing either a real cost reduction, or input of funding from grants of
local sources such as CIL) would result in an IRR of 6.6% for the baseline Phase 1 scheme.
The phase 2 schemes all provide IRRs of around 4% except for the river water heat pump option which drops to
0.45% even with RHI income. These IRRs include investment in the entire network (including the Phase 1
components), and so if the phase 1 component is considered to be partially paid back, then the effective IRR would
increase further. The stability of the IRRs across the variations demonstrates that the Phase 2 options are not
critical when defining phase 1 of the network.
The IRRs for the long term Phase 3 network improve over the initial 2 phases with up to around 6% for an optimised
network (this includes removal of a section of the ring main which is poorly utilised - variation 3). As with Phase 2,
some of the capital for Phase 2 and 1 will have been paid off and therefore the effective IRRs of this later phase will
be higher – if is assumed that only the network costs for Phase 3 need to be paid off then the IRR increases to 6.9%
(variation 5). The heat pump options are not predicted to be cost effective as a single heat source, but with
additional CHP generation included in the scheme (a relatively small contribution), an IRR of 3% is achieved with
RHI income.

AECOM Final Report 148
Capabilities on project:
Building Engineering
These results all demonstrate that there are potentially viable short, middle, and long term DE options in Kingston
Town Centre. Phase 3 demonstrates that the viability of the scheme improves with size, and whilst the phase 1
scheme gives lower IRRs, the assumptions used in this EMP are conservative and it is anticipated that optimisation
of the network at the detailed feasibility stage combined with improvements to the electricity revenue (though either
on-site electricity sales, or improved licence-lite rates) could increase the IRR to public sector investment levels or
better.
A phase 1 scheme is connected to primarily public sector customers which helps de-risk the initial investment and
should allow the establishment of long-term heat supply contracts. The scheme could make use of a centralised
energy centre providing all heat, potentially based on the RBK owned land in the Eden Quarter which allows for
future expansion. Alternatively it could make use of existing boilers for peak and back-up heat supply with a smaller
energy centre for the CHP and associated equipment. The latter could be a temporary solution prior to a longer
term central energy centre, and have the plant located at potentially the County Hall or Kingston University Penrhyn
Road site amongst others.
Future phases of a DE scheme have a number of options which will need further investigation following the
establishment of a phase 1 scheme. A key issue to address for future phases is the transition in heat supply
technologies from gas-fired CHP to heat pumps. Future work is required to examine in more detail the feasibility of
heat pumps taking secondary heat from the Hogsmill outlet and the river Thames, and this will also need to consider
the future changes in the electricity grid carbon intensity. Alongside the transition of heat supply technologies, future
phases of a network will also need to consider lower temperature regimes to allow the distribution of the lower
temperature heat from heat pumps, whilst meeting the customers heating demands.
11.5 Energy Sale
The sale of heat needs to ensure that a wide range of customers are attracted to ensure a high uptake of heat off
take, and that this provides a long term low risk through encouraging long contract periods. In phase 1, the
emphasis is on the public sector and the scheme should aim for long heat supply contracts, typically 10 years or
more. As the scheme expands into the commercial sector, a combination of attractive prices combined with suitable
contract lengths will be needed to both encourage connection and maintain connection.
For electricity sales, it is recommended that RBK continue to work with the GLA to further explore the opportunities
for making use of the GLA Licence lite regime. This could offer a relatively simple solution for improving the revenue
for electricity. In addition, opportunities for exporting electricity directly to large electricity consuming customers
should also be considered and monitored so that the revenue can be maximised where possible. Such opportunities
may have an impact on the governance model for the scheme to allow licence exempt supply.
11.6 Risk assessment
An initial high level risk assessment for DE schemes is provided. For each identified risk, the impact, probability, and
overall measure are given along with mitigation measures and organisation responsible. This risk register will need
to be continually updated if any project proceeds
11.7 Recommendations
The report recommends that following:
Short term
The Council review the report’s findings and decide whether there is sufficient evidence for taking the next
steps in its development
If positive the Council should undertake more detailed feasibility studies for Phase 1 and examine the
various business structures available to them to implement the project, including the use of their own capital
resources or borrowing facilities

AECOM Final Report 149
Capabilities on project:
Building Engineering
A full business plan should then be established for which backing can be sought from all stakeholders within
the Council and outside
Work with the planning department and potential customers to identify suitable energy centre locations
A Programme Board should then be established to take the project forward.
Medium term
Identification and engagement with key potential customers to develop a robust potential customer base
(Further) development and implementation of planning policy to ensure that developments in areas
mentioned in this EMP, and other developments in the DH network areas, are designed and built such that
they are suitable for connection.
Identification of sites for future energy centres, including engagement with Thames Water over the Hogsmill
STW, continued engagement with Kingston Futures, and identification of river-side sites.
Consideration of heat pumps as a heat provision technology to provide long-term carbon savings.
Close engagement with the Hospital to ensure that future renovation and re-development facilitates
connection to a site-wide DH scheme.
Long Term
Continued identification and engagement with potential customers
Assessment of performance of existing phases and environmental performance, and ensuring that
technology strategies (eg gas CHP or heat pumps) can deliver the required economic and environmental
performance.
Engagement with the GLA and neighbouring Boroughs to ensure opportunities for wider connections are
identified and facilitated.

AECOM Final Report 150
Capabilities on project:
Building Engineering
Appendix 1: Site visits
Appendix 2: Energy demand analysis
Appendix 3: Impact on new development
Appendices

AECOM Final Report 151
Capabilities on project:
Building Engineering
Introduction
Site visits were made to some of the major town centre loads on 18th March 2013. The sites were selected based
on their size, the opportunity they present for connection to a DE scheme, and on the basis that some energy users
may be more complex, requiring a more in-depth understanding.
The following sites were visited:
RBK Guildhall buildings
Kingston College
County Hall
Kingston University Penrhyn Road site
Kingston University Knights Park site
Bentalls shopping centre
Edenwalk shopping centre
David Lloyd gym
The aim of the visits was to obtain information on:
The location of existing plant and distribution around sites
Access potential for a DHN connection
The type of existing heating system.
This section provides a summary of information gathered.
RBK Guildhall
The RBK offices comprise of the original 1930s Guildhall, a smaller modern (circa 1970s) additional building
(Guildhall 1), and a larger modern addition (Guildhall 2) which provides the majority of administrative
accommodation.
The Guildhall has a single boiler room which provides space heating to the entire building. There are 6
boilers totalling 756kW feeding a common heating header which connects to the separate heating circuits.
The boilers are around 14 years old with no short term need for replacement. The boiler plant is typically
switched off during April – October. The boiler room is located in the semi-basement to the right of the
Guildhall’s main entrance, affording a simple connection opportunity. The flow and return temperatures
taken from the BMS are 80C and 56C respectively. The plant room is well laid out and relatively spacious,
enabling further modification and the addition of small items of plant. There are independent point of use
water heaters serving the toilets.
Guildhall 1 is the smallest of the RBK offices and has a small 4th floor plant room with no spare space. The
plant comprises two ‘Regency 4’ boilers totalling 812 kW which provide space heating to a new radiator
system in the building. The gas connection is up a riser on the southern corner of the building. This may
offer opportunity for a DHN connection. The long term future of Guildhall 1 is uncertain and there is a
possibility the building will be sold or rented.
Guildhall 2 is the largest of RBK’s offices. All plant is located in the roofspace with 6 areas of air handling
equipment, but all fed by a single set of gas boilers. There are 8 gas boilers totalling 960 kW, 4-5 years old,
feeding a common header operating at a flow and return temperature of 74C and 71C (at the time of
Appendix 1: Site visits

AECOM Final Report 152
Capabilities on project:
Building Engineering
visiting, there had been a problem with the system which may have impacted the flow and return
temperature levels). In addition to the gas boilers, there are 3 relatively small gas-fired calorifiers. A riser up
the south side of the building is used for the gas connection. Whilst not seen, it was suggested this riser
has a large amount of space which could be used for a DHN connection.
County Hall
County Hall is the main administrative centre for Surry County Council and comprises a large courtyard structure
building, and a newer smaller wing used for IT services. The original parts of the building date from 1893, with a
number of subsequent alterations and extensions cumulating in the IT services wing in 1982.
A single boiler plant room is located in the basement in the centre of the complex and feeds two separate heating
circuits for the original building and new wing. Three 1.16 MW boilers are used for space heating, and two
additional boilers are used for a centralised DHW supply. The plant room is large and well laid out, but with limited
spare space for new major plant.
The space heating circuits are set to operate at 82C and 71C flow and return. It is thought that lower operating
temperatures may not be achievable due to the inefficient nature of the building combined with the original cast iron
radiators.
There are no short term plans for any plant replacement.
It is believed that the plant room can be accessed from the northern site using a vehicular entrance from The
Bittoms under the new wing which passes through the northern courtyard. This is the route used by the existing gas
connection. Access to the basement plant room could be via an underground route, or make use of above grade
access though a series of removable concrete slabs forming part of the plant room roof in the car park area.
Kingston College
The Kingston College site comprises four sets of buildings named stage 1 – 4.
Stage 1 and Stage 2 are the original (estimated 1960s / early 1970s) buildings heated from a single boiler
room located on the ground floor at the northern side. Stage 2 is an 11-storey block which has a separate
heating circuit via a Plate Heat Exchanger (PHE) for floors 5 and above. The boilers comprise four 650 kW
units, although in general only 2 or 3 are used at any one time to allow for cycling. The boilers are circa 10
years old and are expected to operate for at least another 10 years before replacement. Flow and return
temperatures are typically 80C and 75C respectively. The boiler plant is generally switched off each year
from April to October. In addition to the space heating, there are three 75 kW Calorifiers (335 litres each).
Access to the plant room is very good with a ground floor location adjacent to a car park entrance and close
to Kingston Hall Road.
Stage 3 is a more modern 4-storey building with a single boiler room. There are 7 boilers of circa 70 kW
each, with three providing heat for AHUs, and 4 providing heat for radiators. The boiler room is located at
ground level next to the College’s rear service road, off Penrhyn Road. There is one direct fired DHW boiler
that serves the kitchen.
Stage 4 is a new building (the ‘Arena’) used for sports and leisure. The boiler room was not visited, but
comprises 2 small boilers for space heating connected to AHUs. It is not believed that the heating loads are
high.
Kingston University – Penrhyn Road Campus
The University’s Penrhyn Road Campus is the larger of the two central sites examined in this study. It is
predominantly used for science, engineering, and computing teaching and research activities. There are a number
of plant rooms on the campus, although the majority of the heating load is fed by a small number of main boilers.

AECOM Final Report 153
Capabilities on project:
Building Engineering
Plant 1 (Main builing). This feeds the majority of buildings 1 and 2, and comprises three 1,050 kW boilers,
one 600 kW boiler and two 194kW calofiers. The boilers feed a common header of 200mm diameter The
plant room is at ground level, relatively large and spacious, and can be easily accessed from the on-site
road.
Plant 2 (Sopwith Building). This plant room feeds the Sopwith Building, and comprises two Ideal F480
boilers giving a total of 1000 kW heat output. The plant room is at ground level and easily accessed from
the University car park.
Plant 3 (Learning Resource Centre). This is a smaller plant room located on the roof of the Learning
Resource Centre (LRC). It consists of three packaged boilers totalling circa 300 kW. The location of risers
and access to the plant room is uncertain.
Plant 4. This plant room provides heat to the C-Scaipe facility32
, part of the main building, and comprises
five boilers totalling 500kW. The equipment is relatively old and inefficient, and it is thought that the heating
systems supplied from it will be connected to the main system instead. This plant room will therefore
become redundant.
Plant 5 (Townhouse). This ground floor plant room provides space heating for the ‘Townhouse’ and
comprises circa 500 kW capacity of boilers which are old and due for replacement. The Townhouse is a
temporary structure which is long past its original expected life and it is likely this will be redeveloped in the
short term.
Plant 6 (Tower block). This plant room is newly refurbished and provides heat for the tower block building.
The heating plant consists of four Bugens GB312 boilers totalling 1,040 kW, operating at flow and return
temperatures of 80C and 70C. The plant room is large, spacious, and easily accessible.
It is thought that the most suitable plant rooms for connection to a DHN are Plant 1, 2, and 6. The others are either
too small, or likely to become redundant.
Kingston University – Knights Park Site
The Knights Park site is north east of the Penrhyn Road Campus and is used for Arts and Architecture. Similarly to
the Penrhyn Road Campus, the site is relatively complex, with a number of buildings interconnected. There are
three main plant rooms:
Plant 1 (Quad building). This is a newly refurbished building with replacement plant. There are eight
modular boilers totalling circa 800 kW (estimated) operating at 80C and 60C flow and return providing
space heating and DHW. The plant room is not spacious, but it is thought that a PHE could be
accommodated with careful design. The plant room is at a basement level and whilst no obvious
connection routes were observed, it is believed that a suitable option can be found with further investigation.
Plant 2 (Tower Block). The tower block has a relatively small net floor area, and therefore the heating loads
are correspondingly low. The boiler plant is located in a roof top plant room and is made up of circa 300 kW
(estimated) of boiler plant for space heating and DHW. These boilers feed a common header of 100mm
diameter. Access to the plant room with a DH network would be via existing risers (which were not viewed),
although a more suitable option may be to connect with the heating system, if viable, at a lower level.
Plant 3 (“New Extension”). This building lies to the east of the site, and has a 4th floor plant room. There is a
total of 1,200 kW of boiler plant (in four 300 kW units) for space heating and DHW. The plant room is
spacious with adequate space for a PHE. Access would be via existing risers.
32
C-Scaipe = Centre for Sustainable Communities Achieved through Integrated Professional Education

AECOM Final Report 154
Capabilities on project:
Building Engineering
Bentalls shopping centre
The Bentalls shopping centre (not to be confused with the adjacent Bentalls Department Store) consists of a central
atrium area, central services, and a number of retail units.
The retail units are all responsible for their own services and make use of separate electric heating systems. This
means there is no potential for connection of the retail units to a DH network without significant refurbishment of the
centre. This is deemed unviable.
The central atrium / circulation area is heated and ventilated using a number of direct fired AHUs. No information
was available on the site visit of capacity or annual gas consumption, but it is believed that the AHUs could be
modified into an indirect system for connection to a DH scheme. All the AHUs are located on the roof, and access
would need to be via existing risers. There appeared to be adequate space on the roof for installation of the PHE,
with adequate access around the roof to individual AHUs.
The shopping centre also includes small ancillary heating plant for the management suite, and local DHW
generation. These are considered too small for connection to the DH scheme.
Edenwalk Shopping centre
The Edenwalk shopping centre is a large retail complex located in the Eden quarter of the town centre. The centre
includes a number of large and small individual retail units totalling 22,000 m2 (245,000 ft
2).
All retail units have their own separate heating systems, predominantly electricity based. There is no central plant
for the retail units and the disaggregated nature, combined with the use of existing electric systems, means that
there is little scope for a DHN connection in the short term.
The centre also includes the Millennium House office complex which is heated by central boiler plant located on the
roof. This comprises 4 Potterton Prestige boilers, of which 2 or 3 are used at any one time.
Gas and water services are brought up to the roof in a riser adjacent to the Millennium House entrance. It is
uncertain whether there is sufficient space for a DHN connection but this could potentially provide a route.
The longer term future of the Edenwalk shopping centre is uncertain. There are plans for re-development of the
Eden quarter, although the scale and nature of this is currently uncertain and may range from minor refurbishment
to large scale re-development. This could provide the opportunity for the installation of common heating systems
making the centre more suitable for DHN connection.
The Edenwalk centre is a joint venture by USS (Universities Superannuation Scheme) and British Land.
David Lloyd Gym
The David Lloyd Gym is located opposite the railway station and is part of the national David Lloyd chain. The gym
consists of a number of facilities including a swimming pool and Jacuzzi.
All heating is supplied from two 750 kW Hoval boilers (totalling 1,500 kW) located in a roof top plant room. Two
150mm headers distribute heat from the boilers to separate heat exchangers which feed the pool, space heating,
and DHW. A DH connection could be made onto these headers for meeting the loads of the entire gym.
Routes were not identified for accessing the header with the DH connection, but it is believed that a suitable route,
either externally, or via internal risers, could be identified with further investigation.

AECOM Final Report 155
Capabilities on project:
Building Engineering
Review of Existing Information
The RBK Heat Mapping study data has been used as the basis for this study, with additional information obtained
on the large loads as described above. . It is important to note that the RBK Heat Mapping dataset contains
information for a large number of buildings from a range of sources, and a comprehensive check of this data and
verification is beyond the scope of this EMP. Therefore a simple approach was taken to sense-check the
information
Where data is provided and based on data collection from the building occupiers or managers, this is
assumed to be correct. It is assumed that no further changes have been made to the buildings which affect
heat demand since the original data collection for the RBK Heat Mapping study.
Where benchmarks have been used for non-domestic buildings, a simple check has been made by dividing
the stated annual fuel consumption by the GIA where available. The expected energy consumption varies
for different building types so the buildings for connection to the DHN are categorized in terms of building
type and checked against the CIBSE Guide TM46 benchmarks.
For domestic buildings, the gas consumption per dwelling in the RBK heat mapping study ranges from
6.5MWh to 15MWh per year. The assumptions used for the new and proposed developments give a gas
consumption of approximately 4.5MWh per dwelling based on a relatively small flat size and current building
regulations. Both of these appear reasonable and in line with models of new dwellings and average
consumption from existing dwellings. Therefore the data from the RBK Heat Mapping study is assumed to
be reliable for flats.
Identified inconsistencies include:
The data for David Lloyd Gym seems too high, at 12,000MWh per year. The site visit confirmed that the peak boiler
demand cannot be greater than 1500kW, which is more consistent with a gas consumption of 1700MWh. It is
thought that annual data given has been provided for The Rotunda, which includes cinema, bowling alley and
restaurants, rather than just David Lloyd Gym. The connection details are only known for the Gym, so for modelling
of the network it is assumed that only the Gym will be connected. The model uses an annual gas consumption of
1700MWh, the monthly profile is calculated assuming 40% of the heating is for hot water, which forms the baseload.
The remaining load will be estimated using degree day analysis.
The Edenwalk shopping centre data suggests an energy demand of 760kWh/m2, which is much higher than the
benchmark for retail use. CIBSE TM46 Table 1 gives a benchmark of 170kWh/m2
for typical fossil fuel consumption,
of which 55% goes towards heating. Based on the area of 23,181m2 from the Heat Mapping Study this gives an
annual consumption of 2635MWh per year. This figure will be used to model situations where Edenwalk Shopping
Centre will be redeveloped, so that it is suitable for connection to DHN.
There is a large range of energy consumption for university and college campuses, however most are closer to the
baseline of 240kWh/m2, with a few outliers. For all campuses data has been collected, so the heat mapping data is
not used for these.
RBK Heat Mapping Study
The information on annual consumption for many of the major energy consumers was taken from the RBK Heat
Mapping Study carried out by URS. For these consumers the assumptions outlined in section 5 were applied to
estimate key information for modelling. Information from the heat mapping study has been used for the following
sites.
County Court
Police Station
HM Revenue & Customs
Curves
Appendix 2: Energy demand analysis

AECOM Final Report 156
Capabilities on project:
Building Engineering
Avante Court
Travelodge – Central
Schools Library Service
Museum and Heritage Service
Kingfisher Leisure Centre
Kingston Library
Quebec House
Stevens House
Garricks House
Bedelsford School
Kingston University Clayhill
St John’s C of E School
King Athelstan School
Tiffin School
Bausch & Lomb House
Buick House
Cambridge Road
Kingston Hospital
Wolverton House
The location of plant room for connection to these sites is taken to be the centre of the site for the purpose of
modelling pipe lengths.
The Cambridge Road Development is made up of a total of 600 dwellings. These a divided up into consists of 4 high
rise blocks, each containing 60 dwellings and 16 low rise blocks containing a total of 360 dwellings. For the
purposes of this high level model it is assumed that there will be four connections, each of which will join to one high
rise block and a quarter of the low rise blocks, therefore connecting to 150 flats.
The total annual gas consumption is based on an estimated gas consumption of 10.5MWh per flat, therefore
1575MWh for each of the four connections. The monthly profile is estimated using the assumptions in Section 5.
The peak demand is calculated using diversity to take into account that all flats will not be using their peak demand
at the same time.
Bedelsford School is included in the list above, however the heat mapping study only confirmed that the heating for
the site is provided by oil. The school is still included in this study so that it could be connected if it were refurbished.
The GIA is given, so benchmarks data from CIBSE Guide TM46 is used to estimate the demand. The CIBSE
benchmark for Schools is 150kWh/m2
and the school has a GIA 2275m2, therefore the annual demand is 341MWh.
This annual figure is used to model the site for connection to DHN, using the assumptions in Section5.
Key sites
Kingston College, Kingston Hall Road & Richmond Road

AECOM Final Report 157
Capabilities on project:
Building Engineering
Figure 49: Connection to Kingston College main site
This site is considered for connection to Phase 1 of the DHN.
Connection to DHN is likely to be from 2 separate branches from the main Phase 1 line, as shown on the plan
above.
Figure 50: Connection to Kingston College Richmond Road Site

AECOM Final Report 158
Capabilities on project:
Building Engineering
The DHN connection to the Richmond Road campus would form the end of a Phase 2 branch, the location of the
plant room on this site is unknown.
Information provided
Annual Gas consumption total for all three sites
Monthly gas consumption from August – December 2012 for each site
Annual Electricity consumption total for all three sites
No cooling demand
No plant replacement planned in the next few years
Modelling assumptions/DHN implications
The site of interest for the DHN is the main Kingston Hall Road Site, pictured above in Figure 49. The monthly data
confirmed the ratio of gas consumption between sites, with Kingston Hall Road accounting for 84% of the total. This
relationship is used to find the total annual consumption per site.
Monthly gas consumption data was only provided from August to December, so the other months were estimated.
The August load is taken to be the base load, so is applied to June and July. The remaining months’ profiles are
determined by using degree day analysis to reach the total annual demand.
The DHN layout assumes that there are two separate connections to Kingston College branching directly from the
main Phase 1 line; a north connection to Boiler House 1, and a south connection to Boiler house 2.
The monthly load is divided equally between the two connections. The peak load is based on the boilers identified
during the site visit;
Boiler House 1: No.3x75 kW Calorifiers, No.4x650 kW boilers, of which 3 are use at any one time, therefore peak =
2175kW
Boiler House 2: No.7x70 kW boilers, therefore peak =490kW
Boiler House 3 contains small boilers and would not be considered for connection to the DHN.
Monthly and peak gas demand was calculated for the Richmond Road site by the same method as for Kingston Hall
Road.
Kingston Crown Court
No site visit carried out
Information provided
No information provided on request, and not in URS or RBK database
Modelling assumptions/DHN implications
Assume load of 2000MWh per year and peak of 2000kW.

AECOM Final Report 159
Capabilities on project:
Building Engineering
Surrey County Council
Figure 51: possible access to Surrey County Council plant room indicated on google maps image
This site is considered for connection to Phase 1 of the DHN.
Connection to DHN is likely to be from a branch along The Bittoms, entering the site from the north, as shown
above.
Information provided
Annual Gas Consumption
Annual Electricity Consumption
Peak demand = 3000kW from 2 out of 3 1500kW boilers
Monthly gas consumption
5% hot water for kitchens
Energy cost – gas = 2.443p/kWh, electricity = 10.625p/kWh
Covered by CRC
No major cooling demand
No plant replacement planned in the next few years
Modelling assumptions/DHN implications
All required information provided therefore no assumptions were required for modelling.

AECOM Final Report 160
Capabilities on project:
Building Engineering
Kingston University Penrhyn Road
Figure 52: possible access to Penrhyn Road Campus plant room indicated on site plan
This site is considered for connection to Phase 1 of the DHN.
Connection to DHN is likely to be from 3 separate branches forming the southern end of the main Phase 1 line, as
shown on the plan above.
Information provided
Annual Gas Consumption
Annual Electricity Consumption
Monthly gas consumption from various meters across the site for 11 months
Energy cost – gas = 2.63p/kWh, electricity = 10.00p/kWh
Covered by CRC
No major cooling demand
No plant replacement planned in the next few years
Modelling assumptions/DHN implications
Meter readings were provided from the end of August 2011, to the end of July 2012, which gives 11 month worth of
data, missing out August, so the data for August was assumed to be the same as that for July.
The monthly load is divided equally between the three connections, as it is not known which meters are connected
to which plant rooms. The peak load is based on the boilers identified during the site visit;
Connection 1: C-Scaipe faculty and Tower block No.1x400kW, No.4x260kW, therefore peak =1.44MW, the
efficiency of these boilers is assumed to be 85% as they are relatively new.
Connection 2: Sopwith Building No.1x1MW boiler
Connection 3: Main Buildings and Learning Resource Centre No.3x1,050kW boilers, No.1x600 kW boiler, No.
3x100kW, therefore peak = 4.05MW

AECOM Final Report 161
Capabilities on project:
Building Engineering
Kingston University Knights Park and Middle Mill
Figure 53: possible access to Knights Park and Middle Mill plant room indicated on site plan
This site is considered for connection to Phase 2 of the DHN.
Connection to DHN is likely to be from 3 separate branches forming the end of the Phase 2 network, as shown on
the plan above. The plant room locations for the Middle Mill site are not known, so connections are not shown.
Information provided
Annual Gas Consumption
Annual Electricity Consumption
Monthly gas consumption from various meters across the site for 11 months
Energy cost – gas = 2.63p/kWh, electricity = 10.00p/kWh
Covered by CRC
No major cooling demand
No plant replacement planned in the next few years
Modelling assumptions/DHN implications
Meter readings were provided from the end of August 2011, to the end of July 2012, which gives 11 month worth of
data, missing out August, so the data for August was assumed to be the same as that for July.

AECOM Final Report 162
Capabilities on project:
Building Engineering
The monthly profile for the Knights Park site is divided equally between the two proposed connections, as it is not
known which meters are connected to which plant rooms. The peak load is based on the boilers identified during the
site visit;
Connection 1: Quadrangle and Tower Block No.8x100kW, No.3x100kW, therefore peak = 1100kW
Connection 2: New Extension No.4x300kW boiler, therefore peak = 1200kW
The peak load for the Middle Mill site is determined using annual consumption and the general assumptions outlined
in section 5 to give a peak of 675kW
Guildhall
Figure 54: possible access to Guildhall and Guildhall 2 plant room indicated on google maps image
Guildhall 1 has a relatively small heat load and is therefore not considered for connection to DHN. The main
Guildhall and Guildhall 2 are considered for connection to Phase 1, by a single connection to each building
branching from the northern end of the main Phase 1 line, as shown on the plan above.
Information provided
The following information was provided for the Guildhall, Guildhall 1 and Guildhall 2
Annual Gas Consumption per building
Annual Electricity Consumption per building
Monthly gas consumption per building
Energy cost - Gas Guildhall = 2.92p/kWh, Guildhall 2 = 2.22p/kWh
- Electricity Guildhall = 10.01p/kWh, Guildhall 2 = 9.76p/kWh
Peak heating demand Guildhall = 756kW, Guildhall 2 = 960kW

AECOM Final Report 163
Capabilities on project:
Building Engineering
Participant in Phase 1 of CRC, but not phase 2
No major cooling demand
No plant replacement planned in the next few years
Modelling assumptions/DHN implications
All required information provided therefore no assumptions were required for modelling.
Marks and Spencer
Site Visit
No
Figure 55: possible access to Marks & Spencer plant room indicated on google maps image
Figure 56: possible access to Marks & Spencer plant room indicated on google maps image
This site is considered for connection to Phase 2 of the DHN.
Marks and Spencer PLC is divided into two sites with the southern building for storage and collection and the
northern building as the main shop. The energy data was only provided for the main shop so it is assumed that this
would be the main point of connection, as shown in Figure 55 above. The location of the plant room for this site is
unknown.
Information provided
Annual and monthly Gas Consumption

AECOM Final Report 164
Capabilities on project:
Building Engineering
Annual and monthly Electricity Consumption
Covered by CRC
Modelling assumptions/DHN implications
The peak load for the Marks and Spencer is determined using annual consumption and the general assumptions
outlined in Section 5.5 to give a peak of 1096kW.
The location of the plant room is unknown, so the connection layout is based on images from google maps.
The energy costs are based on a the general assumptions as detailed in Section 5.5
Edenwalk Shopping Centre
Figure 57: possible access to Millennium House plant room indicated on google maps image
Figure 58: possible access to Millennium House plant room indicated on google maps image
This site is considered for connection to Phase 2 of the DHN.
The retail units in this large shopping centre each have their own heating systems, predominantly electricity based,
so offer no scope for DHN connection in the short term. There is a small central boiler plant for management area
and Millennium House office complex located on the roof, which may have space for a DHN connection.
Information provided
Annual Gas Consumption
Annual Electricity Consumption
Energy cost - Gas = 3.504p/kWh
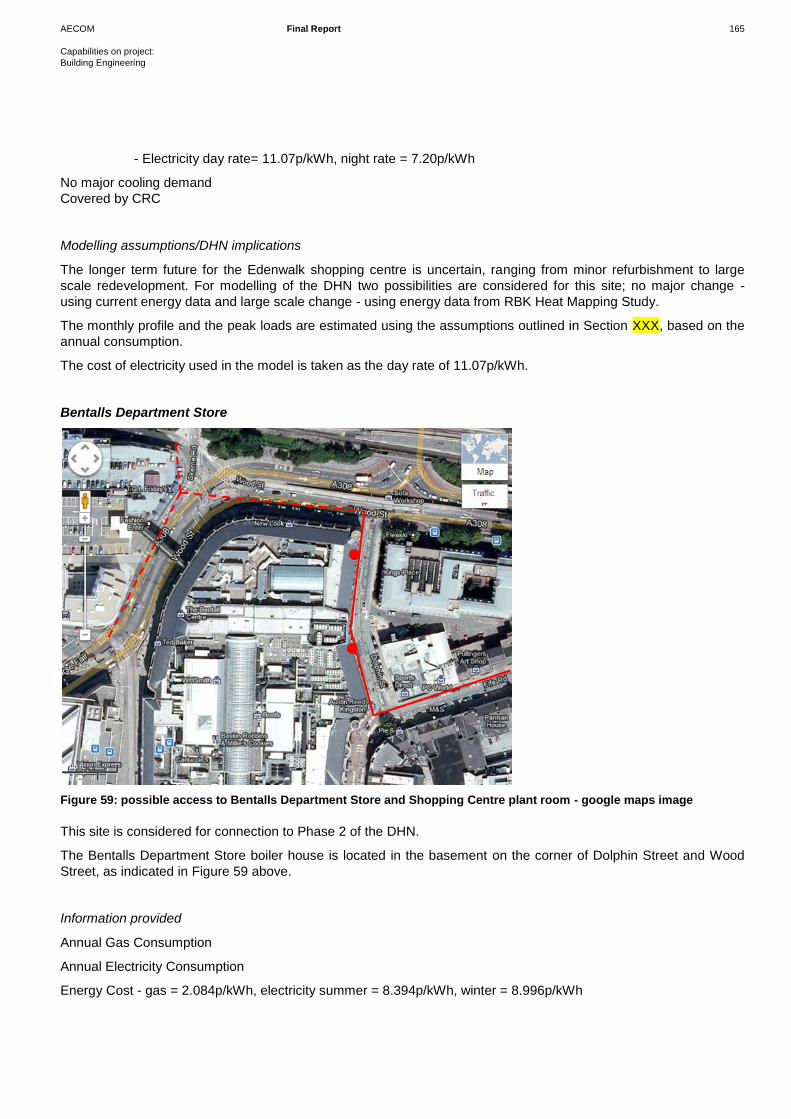
AECOM Final Report 165
Capabilities on project:
Building Engineering
- Electricity day rate= 11.07p/kWh, night rate = 7.20p/kWh
No major cooling demand
Covered by CRC
Modelling assumptions/DHN implications
The longer term future for the Edenwalk shopping centre is uncertain, ranging from minor refurbishment to large
scale redevelopment. For modelling of the DHN two possibilities are considered for this site; no major change -
using current energy data and large scale change - using energy data from RBK Heat Mapping Study.
The monthly profile and the peak loads are estimated using the assumptions outlined in Section XXX, based on the
annual consumption.
The cost of electricity used in the model is taken as the day rate of 11.07p/kWh.
Bentalls Department Store
Figure 59: possible access to Bentalls Department Store and Shopping Centre plant room - google maps image
This site is considered for connection to Phase 2 of the DHN.
The Bentalls Department Store boiler house is located in the basement on the corner of Dolphin Street and Wood
Street, as indicated in Figure 59 above.
Information provided
Annual Gas Consumption
Annual Electricity Consumption
Energy Cost - gas = 2.084p/kWh, electricity summer = 8.394p/kWh, winter = 8.996p/kWh

AECOM Final Report 166
Capabilities on project:
Building Engineering
Plant Equipment:
3 X Hoval SHR 1000 Boilers
3 x GT/H Burners
1x 40 VAL 600 Boiler
1x 10⁵ Burner
No major cooling demand
No plant replacement planned in the next few years
Covered by CRC
Modelling assumptions/DHN implications
The monthly profile for gas demand is estimated using the assumptions outlined in Section 5, based on the annual
consumption figure provided for Bentalls Department Store.
The peak demand is estimated based on the rated capacity of the boilers present. The peak is 2.6MW based on the
assumption that two out of three of the 1000kW boilers are used at a time and the 600kW boilers is also in use.
The cost of electricity is taken to be the average between summer and winter prices, therefore 8.695p/kWh.
Bentalls Shopping Centre
This site is considered for connection to Phase 2 of the DHN, the possible location of this connection is indicated in
Figure 59, above.
The retail units in this large shopping centre each have their own heating systems, which does not allow scope for
connection to DHN, however heating of the main atrium is provided by a direct gas fired AHU, which could be
connected. The location of the plant room for this site is unknown.
Information provided
Annual and monthly Gas Consumption
Annual and monthly Electricity Consumption
Covered by CRC
Modelling assumptions/DHN implications
The peak load is assumed to be 1MW, based on knowledge of similarly sized shopping centres, which can have
high loads for short bursts of time, therefore the general load factor assumption of 10% (see section XX) may not be
appropriate.
The energy costs are based on a the general assumptions as detailed in Section 5.
John Lewis PLC
No Site Visit carried out

AECOM Final Report 167
Capabilities on project:
Building Engineering
Figure 60: possible access to John Lewis indicated on google maps image
This site is considered for connection to Phase 2 of the DHN.
The location of the plant room for this site is unknown.
Information provided
Annual and half hourly Gas Consumption
Annual Electricity Consumption
Energy Cost – Gas = 3.3p/kWh, electricity = 9.8p/kWh
Covered by CRC
Peak heating demand is1500kW
Peak cooling demand - Department store = 500kW, Waitrose = 300kW
Waitrose will have all major plant replaced by November of this year. John Lewis have no planned replacement.
Modelling assumptions/DHN implications
All required information provided therefore no assumptions were required for modelling.

AECOM Final Report 168
Capabilities on project:
Building Engineering
David Lloyd Gym
Figure 61: Access to David Lloyd Gym – google Maps image
This site is considered for connection to Phase 2 of the DHN.
Information provided
Site visit confirm that the peak load is 1500kW
No information has been provided by David Lloyd gym.
Modelling assumptions/DHN implications
The monthly profile is estimated using the RBK Heat Mapping Study data and the general assumptions listed in
Section 5.
New / Proposed Developments
There are a number of proposed developments in the Kingston City centre area which may be suitable for
connection to DHN. The energy use for these sites is less certain so number of assumptions have to be made as
follows.

AECOM Final Report 169
Capabilities on project:
Building Engineering
1. Thames Side Wharf – Vicarage Road
SRE sustainability & Energy Statement states that the development will consist of parking, communal space,
storage and commercial units on ground floors, and 97 residential units above. The GIA is 10,546m2 and it is
proposed 4 Baxi Dachs MicroCHP engines as part of the communal heating installation.
The baseline energy loads have been predicted from modelling the proposed development. This gives an overall
fossil heating and hot water demand of 609,776kWh/year. This annual figure is used to model the site for connection
to DHN, using the assumptions in Section 5.
The assumed energy costs per unit are 4.1p/kWh for gas and 13.3p/kWh for electricity.
2. 45-51 High Street
This site is located west of Phase 1, which could be extended for connection to this site and Avante Court nearby.
The site comprises approximately 3500m2 of student accommodation and 500m
2 of commercial space. A communal
heating system is proposed for the development, with a 25kWe CHP engine to provide the base heating load.
Benchmarks from CIBSE TM46 have been used to determine the CO2 emissions for the baseline, and energy
modelling to determine the CO2 emissions for the improved performance case. This reduction over the baseline has
been used to determine the annual gas demand. This annual figure is used to model the site for connection to DHN,
using the assumptions in Section 5
3. Kingston Riverside & Kingston Heights– Power Station Redevelopment
The site is located to the north of Kingston town centre, over the railway from the Bentalls Shopping centre. The
scheme consists of 359 apartments and a 150 bedroom hotel. Kingston Riverside contains 222 apartments.
Kingston Heights contains the rest. A separate district heating scheme is proposed for each development, Kingston
Riverside will incorporate a 200kW biomass boiler and Kingston Heights a GSHP.
Whitecode Design Associates Energy Strategy Overview, dated June 2012 provides a thermal loadings summary
which predicts a demand of 1904MWh per year, with monthly profile given.
4. Eden Walk future
The long term future for Eden Walk Shopping Centre is uncertain, the possibilities range from small refurbishment to
large scale redevelopment. For the first case the site would remain the same, so there would remain little in terms of
scope for connection beyond current predictions. However if the site were redeveloped, it could be future-proofed to
allow for connection during construction to DHN.
As little is known about the possible changes to this area there are no predictions to base assumptions on, so the
annual consumption for the site is taken to be the URS figure from the RBK Heat Mapping Study, which is based on
the total fuel consumption from all assets. This annual figure is used to model the site for connection to DHN, using
the assumptions in Section 5
5. St James area
This area is highlighted in the Kingston Town Centre Area Action Plan, with the potential uses of shops, community
facilities and student housing.
AECOM have estimated that for a site of 0.8 hectares, 80 dwellings can be developed (assuming 100 dwellings per
hectare). Each flat is 65m2
and has gas demand of 70kWh/m2, based on compliant 2010 SAP modelling. Therefore
the annual demand for the site is 364MWh. This annual figure is used to model the site for connection to DHN, using
the assumptions in Section 5.
6. Bus Station / Leisure centre redevelopment
The current area consists of the bus terminal, car parking, leisure centre, library, museum and open space. The
potential uses for redevelopment are likely to include general enhancement of facilities, including open space and

AECOM Final Report 170
Capabilities on project:
Building Engineering
possibly some affordable housing, although there is no information on the number of potential dwellings or the area
for them.
To account for the possibility of affordable housing AECOM have estimated that 30 dwellings would be built in this
area. Each dwelling is 65m2 and has gas demand of 70kWh/m
2, based on compliant 2010 SAP modelling. Therefore
the annual demand for the site is 136.5MWh. This annual figure is used to model the site for connection to DHN,
using the assumptions in Section 5.
7. East of Clarence Street
This area currently houses a mix of high-street shops, commercial properties and student housing. However there is
currently an application to convert the commercial properties on some of the upper floors into student housing,
containing 64 bedrooms. If a communal heating system is installed during refurbishment there may be potential for
connection to DHN.
Energy use in University accommodation is dominated by domestic hot water. The following benchmarks are taken
from best practice literature and 3 University halls of residence built at the University of Nottingham.
Table 24. Energy benchmarks from literature and recently completed University buildings for residential use.
TOTAL Heat Demand, kWh/m
2
Electricity Demand (including
demand for cooling), kWh/m2
Benchmarks from literature
CIBSE Guide F 160 50
CIBSE TM 46 (energy benchmarks for DECs) 255 60
ECON 54: Energy Efficiency in Further and
Higher Education 204 85
Average 206 65
Some selected new University Halls of
Residence
Nottingham Jubilee Campus – purpose built
low energy campus
Melton Hall (3,510m2) 212 72
Southwell Hall (4,035m2) 166 59
Newark Hall (8,082m2) 153 61
Average 193 64
AECOM have estimated that each bedroom would have an area of approximately 20m2, with an additional 20m
2
utilisation area. Based on information in the above table there is a heat demand of 200kWh/m2. Therefore the total
gas demand for 64 rooms is estimated to be 512MWh. This annual figure is used to model the site for connection to
DHN, using the assumptions in Section 5.
AECOM have estimated that each bedroom would have an energy usage equivalent to that of a new flat. The
bedrooms will be smaller than a typical flat, but the building fabric will not perform as well for a refurbished building,
so the two effects would approximately cancel out. The gas demand per flat is 4550kWh per year, so the total
annual gas demand for this redevelopment is 291.2MWh. This annual figure is used to model the site for connection
to DHN, using the assumptions in Section 5.

AECOM Final Report 171
Capabilities on project:
Building Engineering
8. Gasholders, Richmond Road
The site is currently in a decommissioned state, there are uncertain plans for redevelopment and it is likely to be 3-5
years before and development commences. Telephone discussions have confirmed that the likely use for the area is
mixed, but with potential for 200 flats or student accommodation.
AECOM have estimated that each flat is 65m2
and has gas consumption of 70kWh/m2, based on compliant 2010
SAP modelling. Therefore the annual consumption for the site is 910MWh. This annual figure is used to model the
site for connection to DHN, using the assumptions in Section 5.
Potential Developments
Cumberland House and Kingsnympton Park not considered for connection to DHN as they are too far out from the
main network, however they should be highlighted as possible points of connection should the network expand in
this direction, towards the new Kingston university development.
Cumberland House and Kingsnympton Park are located north of the Hospital, along Kingston Hill. Cumberland
House is made up of 123 flats, divided into 3 low rise blocks and Kingsnympton Park is made up approximately 320
flats divided into 17 low rise blocks. Due to the large density of dwellings these areas may offer some potential for
connection to DHN in the future.
8
7
5
6
4
4
3
2
1

AECOM Final Report 172
Capabilities on project:
Building Engineering
Future policy and regulation
The Building Regulations were first introduced to improve the energy efficiency of buildings in the 1960s and the
latest revisions to the Building Regulations Part L (Conservation of Fuel and Power) continue to improve standards.
In 2002, the focus started to turn towards reducing CO2 emissions and further revisions to Part L in 2006 brought the
UK Building Regulations in line with the EU’s Energy Performance of Buildings Directive (EPBD), introducing,
amongst other things, the requirement for Energy Performance Certificates (EPCs).
Following consultation, the Government's Building a Greener Future: Policy Statement announced in July 2007 that
all new homes will be zero carbon from 2016. In the Budget 2008, the Government also announced its ambition that
all new non-residential buildings should be zero carbon from 2019 (with earlier targets for schools and other public
buildings). Again, these improvements will be implemented through the Building Regulations and most recently the
2013 budget reiterated the Governments ambitions for zero carbon homes from 2016.
The Definition of Zero Carbon Homes and Non-Residential Buildings consultation in 2009 sought to clarify the
definition of zero carbon that will be applied to new homes and buildings through proposed changes to the Building
Regulations. A statement by John Healey, Minister for Housing and Planning, in July 2009 confirmed the policy to
require all new homes to be zero carbon by 2016 and set out the proposals which will be taken forward to implement
this policy. This addressed the concern that the original definition, (which followed the definition of Code for
Sustainable Homes Level 6 and required both regulated and un-regulated emissions to be off-set on site), would not
be feasible or viable on many sites.
The current preferred approach for achieving zero carbon is shown in see Figure 62 .
Figure 62: The Government’s hierarchy for reducing CO2 emissions
The hierarchy is base around the following stages:
Energy Efficiency – which will set minimum standard for the performance of the building fabric;
Carbon Compliance – which will set a minimum on-site CO2 reduction target;
Allowable Solutions – which will require the residual CO2 emissions from the development to be ‘offset’
through payment into a fund to be used for CO2 reductions elsewhere.
Appendix 3: Impact on new development

AECOM Final Report 173
Capabilities on project:
Building Engineering
Work by the Zero Carbon Hub has been conducted to examine energy efficiency standards for domestic buildings33
.
Through the examination of a number of the performance and costs of different efficiency strategies, proposed
Fabric Energy Efficiency Standards (FEES) levels have been identified for total space heating and cooling loads:
39 kWh / m2.yr for flats and mid terraced houses.
46 kWh / m2.yr for end terraced, semi detached, and detached houses.
Part L 2010 is currently in force, and Part L 2013 will be introduced later this year. The government has outlined
preferred options for Part L 2013 in its consultation 34
:
Domestic: An 8% reduction in CO2 emissions over Part L 2010 in the aggregate. This includes the
requirement for meeting interim FEES, with different reductions for different dwelling types giving 7% in the
aggregate.
Non-domestic: A 20% reduction in CO2 emissions over Part L 2010 in the aggregate. This is preferred on
the basis of providing occupiers with large energy savings.
The options preferred for Part L 2013 are on the basis of technical viability with on-site solutions, and the
government’s approach appears to be that regulations should not impact on what is built where. Therefore it is
unlikely that regulations will require connection to off-site energy schemes.
The Part L 2013 consultation also provides some insight into future changes post 2013. In summary, relevant items
include:
Zero carbon homes. The Government re-iterates its commitment to zero carbon homes from 2016 and
outlines the need for further technical analysis. In particular it is concerned over the lack of solutions for
high rise blocks of flats (due to a lack of roof space for PV) and suggest introducing new standards to
prevent the requirement for off-site solutions (which may limit development).
Allowable solutions. The document outlines the need to develop the allowable solutions proposals.
Code for sustainable homes. The document outlines the growing discrepancy between the Code energy
standards and the Part L building regulations (which were originally aligned). The document discussed
whether Code standards should be reduced to meet the Part L standards, or whether the Code should
remain a “gold standard” to encourage innovation.
Zero carbon non-domestic buildings. The document re-iterates the introduction of zero carbon non-domestic
building standards in 2019. The preferred approach is using relative rather than absolute standards due to
the range and complexity of non-domestic buildings, and that the CO2 reduction targets will only include
regulatory loads, with non-regulatory loads being covered by other areas of regulation (for example, energy
performance standards on appliances).
It is clear from the future thinking section that there is still considerable uncertainty over the future standards.
The impact of regulation on District Heating
The increasing requirements for reducing CO2 emissions from new buildings may require more efficient building
designs and construction, and the inclusion of lower carbon forms of energy generation and supply. In general, a
“Fabric first” approach is most cost effective and this is reflected in the potential introduction of minimum FEES in
future regulations (and an interim version in Part L 2013).
33
Defining an Energy Efficiency Standard for Zero Carbon Homes12 (November 2009). http://www.zerocarbonhub.org/building.aspx?page=2 34
2012 consultation on changes to the Building Regulations in England Section two Part L (Conservation of fuel and power).

AECOM Final Report 174
Capabilities on project:
Building Engineering
If low carbon forms of energy supply are required, developers generally prefer to use systems which can be linked
to, or based on, individual homes or buildings, and which do not require an ongoing operation or management
regime. For this reason, PV and solar thermal is probably the most common technology, particularly in housing, due
to the “fit and forget” approach. Where higher CO2 savings are required, or where stand-alone solutions are not
viable, then DH could be one method through which lower CO2 standards can be met.
When assessing the potential for DH to assist with current and future building regulations, the uncertainties around
these future standards need to be considered. These uncertainties include:
At present Part L 2013 has been consulted on, but the final proposals have not been published. The final
level of CO2 reduction above Part L 2010 is not certain and therefore the technical solutions required are not
certain.
The carbon compliance levels for 2016 regulations have not been defined. Early versions of the proposed
zero carbon standard set a target initially of all regulated and un-regulated CO2 to be mitigated on site. This
was later reduced to just regulated emissions, and then to 70% of regulated emissions on viability grounds.
All of these levels may have required DH in some circumstances. However proposals from the Zero Carbon
Hub since have reduce Carbon Compliance proposals to circa 44% and 60% on the basis that carbon
compliance should be set at a level which allows the targets to be achieved without communal technologies,
i.e. DH 35
. This does not mean that DH is not viable, and may provide a lower cost solution in some cases,
but alternative options such as PV may also exist.
The allowable solutions mechanism for CO2 reductions above Carbon Compliance has not been defined.
Whilst there has been much analysis of how an allowable solutions scheme may operate, there are no final
proposals on the costs, or level of carbon compliance above which it will act. If the allowable solutions are
set at a level which is not too high, then developers are more likely to select this option over site
infrastructure. Thus may in fact benefit DE schemes as the allowable solutions funding could potentially be
used to fund the DE scheme development.
The inclusion of DH in future building regulations has not been defined, and the proposed methodologies
and assumptions which are use for DH when calculating Part L compliance can have a large impact on its
performance and ability to meet the CO2 savings.
The CO2 savings from DH alongside many other technologies is dependent on the electricity grid emission
factors assumed. These have evolved over time, both to reflect the current grid generation, and also
changing views on how grid emission factors should be calculated. Therefore until final proposals for grid
emission factors for Part L 2016 are known, it is not possible to state how much CO2 low carbon
technologies, including DE schemes, will save in relation to the building regulations.
Due to these uncertainties, it is not possible to state whether for future revisions to the Building Regulations Part L,
connection to a DE scheme will be necessary, provide a benefit, or be an economic solution over alternative
options. In general, the 2013 consultation on Part L and Government announcements around zero carbon in 2016
suggest that standards will be set at levels which allow developers a choice in strategies and are not deemed to
have an adverse effect on the market.
GLA requirements for District Heating
Policy 5.2: Minimising Carbon Dioxide Emissions, of the London Plan sets requirements for major developments.
Targets for CO2 reduction above Part L 2010 are set for periods aligning to revisions in the Part L Building
Regulations. Figure 63 and Figure 64 show the standards for Residential and Non-domestic buildings.
35
Carbon Compliance: Setting and appropriate limit for zero carbon new homes. Zero Carbon Hub. 2011.

AECOM Final Report 175
Capabilities on project:
Building Engineering
Figure 63: London Plan Policy 5.2 standards for Residential buildings.
Figure 64: London Plan Policy 5.2 standards for Non-domestic buildings.
In addition to these CO2 reduction targets, proposals are required to demonstrate that they have followed the energy
hierarchy:
i. Reducing the CO2 emissions through efficient design of buildings and services
ii. Providing decentralised energy including DH and CHP
iii. Including on-site renewable energy technologies.
The principle of the hierarchy is that more economic and robust CO2 savings are achieved as a priority which lock in
developments to long term CO2 savings, and provide opportunities through future connections to large scale DH
networks.
The intermediate target of 40% CO2 reduction from Part L 2010 (2013 – 2016) set in Policy 5.2 is more stringent
than the proposed Part L 2013 standards, and therefore will require developers to select strategies and technologies
which can deliver greater CO2 savings. It is highly unlikely that fabric efficiency standards alone can achieve a 40%
reduction due to the diminishing returns from improving fabric standards further, and so alternative options in the
form of DH or renewable technologies will be required. In smaller developments, in particular with individual houses
rather than flats, DH may not be economically viable, and there are greater opportunities for installing PV to achieve
the required CO2 savings. However in larger development, and most likely in flats (which are the predominant
residential form in London), it is possible that DH will be viable and therefore required under the Mayor’s energy
hierarchy, even if alternative renewable options could be used.
Post 2016, the Policy 5.2 refers to the national Zero Carbon standards. As discussed earlier, there is little clarity
over the levels and costs of this, but it is likely to be set at a level which allows flexibility for developers, and will
probably be similar to the Policy 5.2 2013 – 2016 standards. If the energy hierarchy remains active in this period, the
requirement to include DH where viable will remain.

AECOM Final Report 176
Capabilities on project:
Building Engineering
The costs of meeting CO2 targets for developers
The economic viability of meeting future targets for CO2 reduction in new development will depend on a number of
factors:
The additional capital investment required to install the technologies and infrastructure
The lifecycle costs of the strategies selected
The value which may be added to the building for sale or rent.
The initial capital investment varies by the cost of the systems installed, but also by how they are delivered. The
developer may bear all of the installation costs, or there may be a third party who invests in the equipment and
recoups their investment through future revenues. The level of investment which comes from third parties will vary
by development and economic viability.
The lifecycle costs will depend on the technology selected, the impact this has on energy bills and the potential to
obtain incentives such as feed in tariffs or the renewable heat incentive. If a third party invests in the systems, these
revenues (if they can be obtained by a third party) can be used to pay back the investment and allow a capital
contribution to a developer.
The ability of the developer to capitalise on future savings though attracting higher sales or rental values can also
impact on the economic viability. Whilst there is some evidence that more efficient building with lower energy bills
has some impact on value, the discount rate applied to future savings by occupiers or purchasers is very high, and
any increase in value is often insufficient to cover the capital investment.
The outcome from these factors is that the viability of a strategy for reducing CO2 emissions is dependent on both
the minimum savings or standards which much be achieved, but also the relative economic viability of different
technology or strategy options. Therefore a strategy which has a lower capital cost is not necessarily the most
economically viable option if the future revenues from a higher capital cost option can be capitalised by the
developer effectively.
A summary of capital costs and CO2 savings is provided in Figure 65 to Figure 74 for a sample of domestic and non-
domestic building types with a range of strategies for reducing CO2 emissions. Through examination of the CO2
savings in relation to the GLA’s 40% improvement target over Part L, and the carbon compliance levels proposed by
the Zero Carbon Hub, the following can be observed:
In all house types, there are a number of strategies which can be used to achieve a 40% reduction or
carbon compliance, including the stand alone solution of gas boilers, energy efficiency and PV. Gas CHP
and DH can also achieve these targets without the use of other technologies. Housing developers therefore
have a choice of strategies, providing that sufficient roof area is available for the necessary amount of PV.
This is largely determined by the number of storeys which determines the roof area available per unit.
In the non-domestic buildings, there is a much wider range of energy consumption and profiles and
therefore difference in relative performance of strategies. In general there are strategies based around gas
boilers and PV which can meet the targets, although for some building types additional technologies such
as heat pumps, biomass, or DH is required. Similarly the difference in energy profile means that CHP and
DH provides a variable level of benefit: in some buildings with lower heating demands such as retail, the
savings from CHP DH are relatively small and unable to meet the targets, whilst in buildings with higher
heat demands
Therefore across the range of building types, DH does have a role to play in providing CO2 reduction, but alternative
strategies also exist.
The capital costs presented in Figure 65 to Figure 74 show a wide variation for each building type across the
strategies. For the domestic buildings the strategies using heat pumps and DH are generally more expensive than

AECOM Final Report 177
Capabilities on project:
Building Engineering
strategies giving equivalent CO2 reduction using solar technologies. Therefore on a capital cost basis, developers
are more likely to select solar technologies where viable. For the non domestic buildings, the capital cost of the
strategies is more closely linked to the CO2 savings, and DH options are competitive with the other options.
Summary
This section provides an overview of the benefits of DH for developers in terms of CO2 savings and costs.
Under current Part L 2010 and the proposed 2013 standards, the CO2 targets do not necessitate the use of a DH
scheme and alternative lower cost options are open to developers. However under the GLA’s energy hierarchy, the
use of a district heating system is required where viable.
For “zero carbon” regulations (2016 for domestic and 2019 for non domestic) there is much uncertainty around the
technical standards, the level of carbon compliance, and the allowable solutions mechanism which means it is not
possible to predict which solutions will be most suitable. However a key factor will be the amount of roofspace
available for PV which in turn may trigger the need for an offsite solution such as DH.
The costs of achieving CO2 reductions on site can not consider only capital investment, but also need to take into
account lifecycle revenues and costs, and the balance of investment from different parties. The ability of developers
to capitalise future revenues, either through increased building value, or reduced capital investment, depends on the
strategy and delivery mechanism. For DH, the costs to developers will depend very much on the cost effectiveness
of DH on each scheme, and the level of investment the DH scheme operator is willing to provide.

AECOM Final Report 178
Capabilities on project:
Building Engineering
Cost and carbon performance of different measures – domestic
The following figures show the results of modelling a range of different measures in domestic buildings. These
results are based on benchmark performance and costs of technologies in indicative buildings, and should be used
for high level guidance only. They should not be used for testing of viability of developments.
Figure 65: Cost and CO2 performance of different measures in detached homes

AECOM Final Report 179
Capabilities on project:
Building Engineering
Figure 66: Cost and CO2 performance of different measures in semi-detached homes
Figure 67: Cost and CO2 performance of different measures in terraced homes

AECOM Final Report 180
Capabilities on project:
Building Engineering
Figure 68: Cost and CO2 performance of different measures in flats

AECOM Final Report 181
Capabilities on project:
Building Engineering
Cost and carbon performance of different measures – non domestic
The following figures show the results of modelling a range of different measures in non domestic buildings. These
results are based on benchmark performance and costs of technologies in indicative buildings, and should be used
for high level guidance only. They should not be used for testing of viability of developments.
Figure 69: Cost and CO2 performance of different measures in a secondary school
Figure 70: Cost and CO2 performance of different measures in general retail

AECOM Final Report 182
Capabilities on project:
Building Engineering
Figure 71: Cost and CO2 performance of different measures in a hospital

AECOM Final Report 183
Capabilities on project:
Building Engineering
Figure 72: Cost and CO2 performance of different measures in student accommodation
Figure 73: Cost and CO2 performance of different measures in offices

AECOM Final Report 184
Capabilities on project:
Building Engineering
Figure 74: Cost and CO2 performance of different measures in warehouses

AECOM Final Report 185
Capabilities on project:
Building Engineering