Embed Size (px)
Citation preview
Solar energetic particle (SEP) events and associated solar phenomena:
statistical studies in solar cycle 23
Rositsa Miteva research associate
Space Research and Technology Institute Bulgarian Academy of Sciences
In collaboration with: K.-L. Klein (France), O. Malandraki (Greece), S. W. Samwel (Egypt), H. A. S. Reid (Scotland), A. Nindos (Greece), A. Kouloumvakos (Greece)
Outlook I. SEP events – overview II. SEP origin – the debate III. Interplanetary conditions – a new parameter? IV. Two work topics: SEP statistics and SEP-radio signatures V. Remarks
Seminar, SRTI, Sofia, Bulgaria 29 January 2014 1
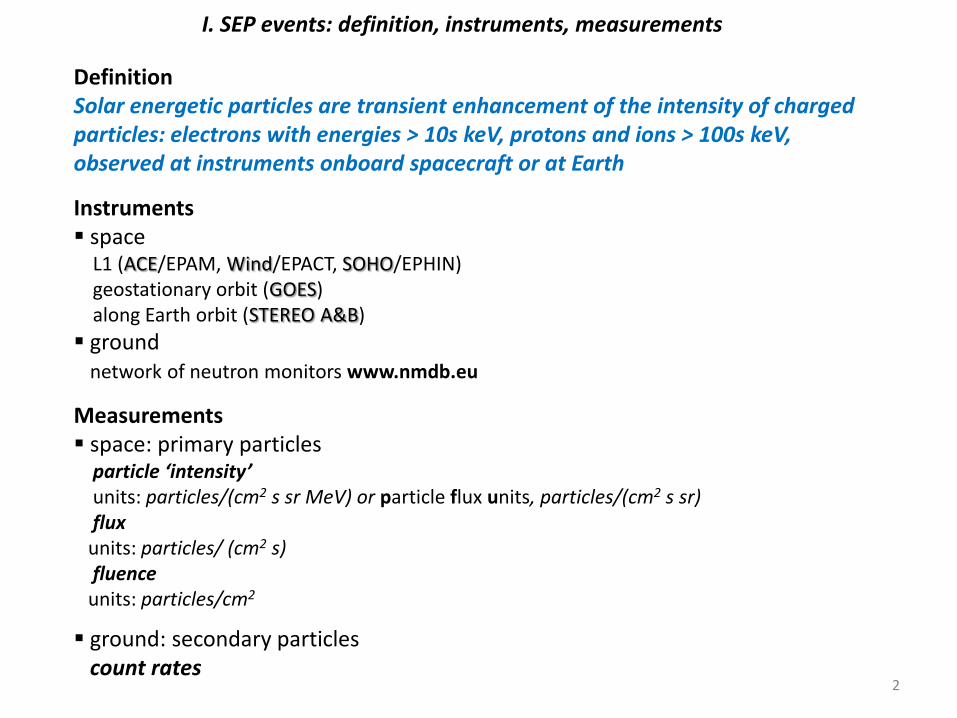
I. SEP events: definition, instruments, measurements
Definition Solar energetic particles are transient enhancement of the intensity of charged particles: electrons with energies > 10s keV, protons and ions > 100s keV, observed at instruments onboard spacecraft or at Earth
Instruments space L1 (ACE/EPAM, Wind/EPACT, SOHO/EPHIN) geostationary orbit (GOES) along Earth orbit (STEREO A&B)
ground network of neutron monitors www.nmdb.eu
Measurements space: primary particles particle ‘intensity’ units: particles/(cm2 s sr MeV) or particle flux units, particles/(cm2 s sr) flux units: particles/ (cm2 s) fluence units: particles/cm2
ground: secondary particles count rates
2
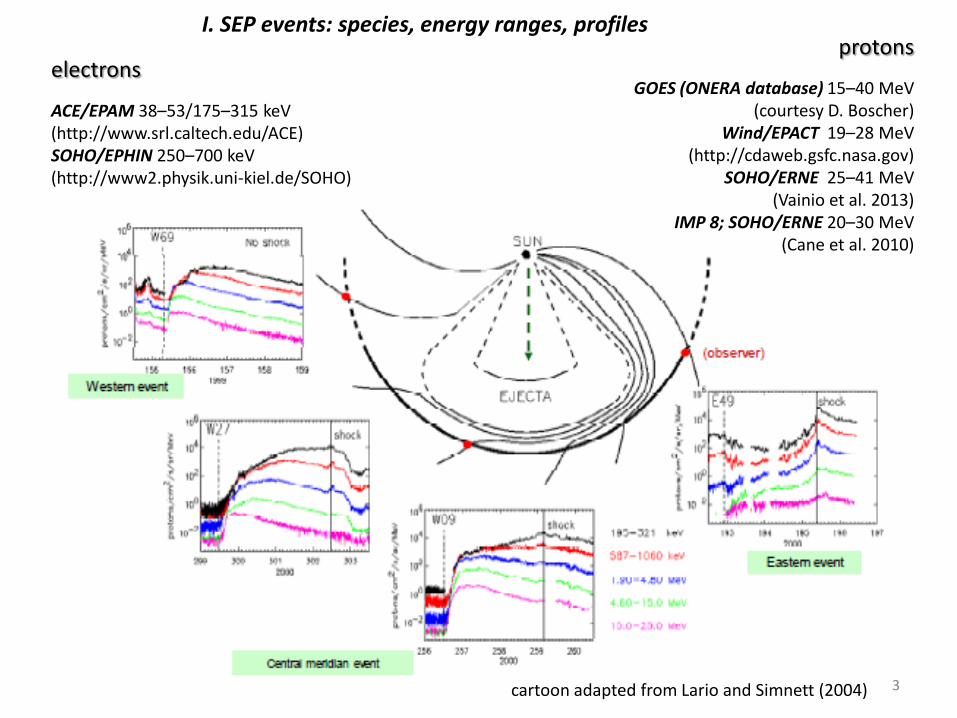
I. SEP events: species, energy ranges, profiles protons
GOES (ONERA database) 15–40 MeV (courtesy D. Boscher)
Wind/EPACT 19–28 MeV (http://cdaweb.gsfc.nasa.gov)
SOHO/ERNE 25–41 MeV (Vainio et al. 2013)
IMP 8; SOHO/ERNE 20–30 MeV (Cane et al. 2010)
electrons
ACE/EPAM 38–53/175–315 keV (http://www.srl.caltech.edu/ACE) SOHO/EPHIN 250–700 keV (http://www2.physik.uni-kiel.de/SOHO)
cartoon adapted from Lario and Simnett (2004) 3
I. SEP events: times, assumptions and uncertainties
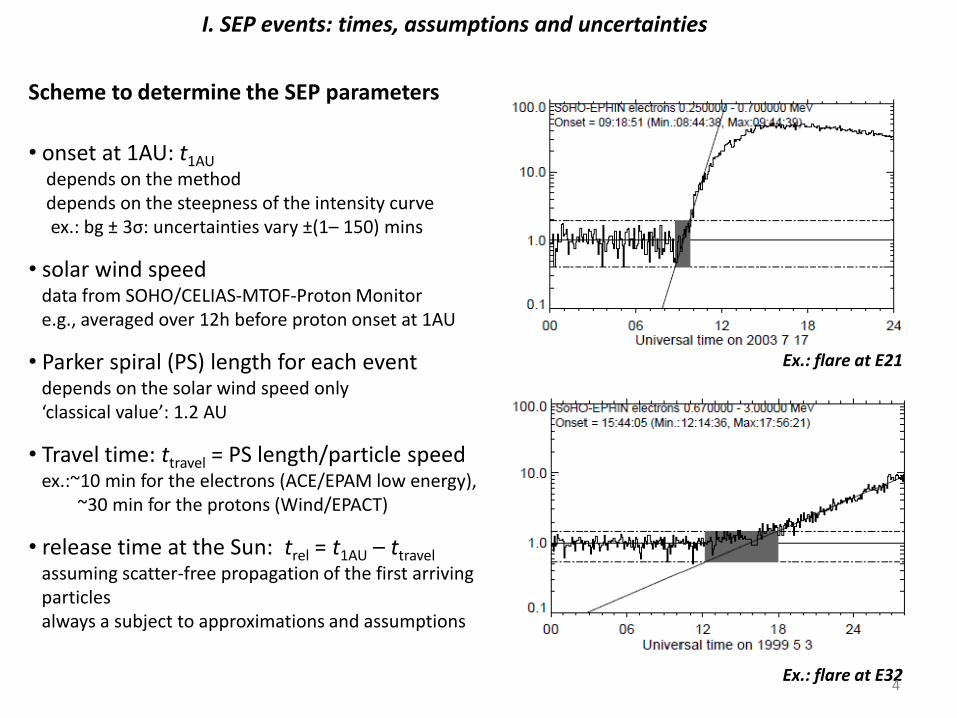
Scheme to determine the SEP parameters
• onset at 1AU: t1AU depends on the method depends on the steepness of the intensity curve ex.: bg ± 3σ: uncertainties vary ±(1– 150) mins
• solar wind speed data from SOHO/CELIAS-MTOF-Proton Monitor e.g., averaged over 12h before proton onset at 1AU
• Parker spiral (PS) length for each event depends on the solar wind speed only ‘classical value’: 1.2 AU
• Travel time: ttravel = PS length/particle speed ex.:~10 min for the electrons (ACE/EPAM low energy), ~30 min for the protons (Wind/EPACT)
• release time at the Sun: trel = t1AU – ttravel assuming scatter-free propagation of the first arriving particles always a subject to approximations and assumptions
Ex.: flare at E21
Ex.: flare at E32 4
II. The SEP accelerators in the solar corona: flares vs. CMEs
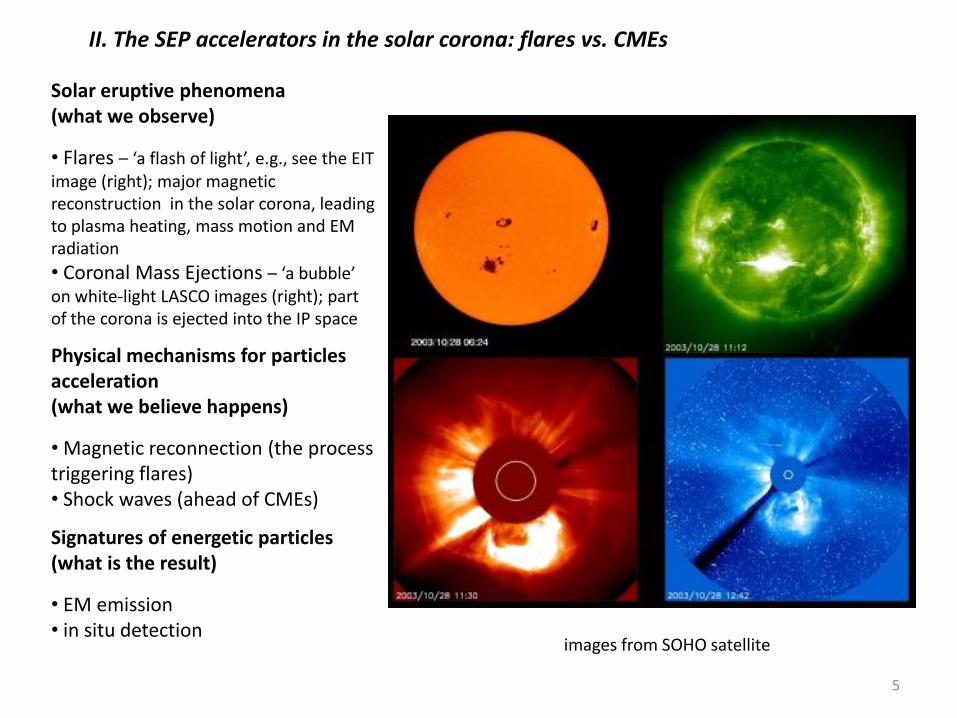
Solar eruptive phenomena (what we observe)
• Flares – ‘a flash of light’, e.g., see the EIT image (right); major magnetic reconstruction in the solar corona, leading to plasma heating, mass motion and EM radiation
• Coronal Mass Ejections – ‘a bubble’ on white-light LASCO images (right); part of the corona is ejected into the IP space
Physical mechanisms for particles acceleration (what we believe happens)
• Magnetic reconnection (the process triggering flares) • Shock waves (ahead of CMEs)
Signatures of energetic particles (what is the result)
• EM emission • in situ detection
images from SOHO satellite
5
II. SEP events: classification – implication for their solar origin
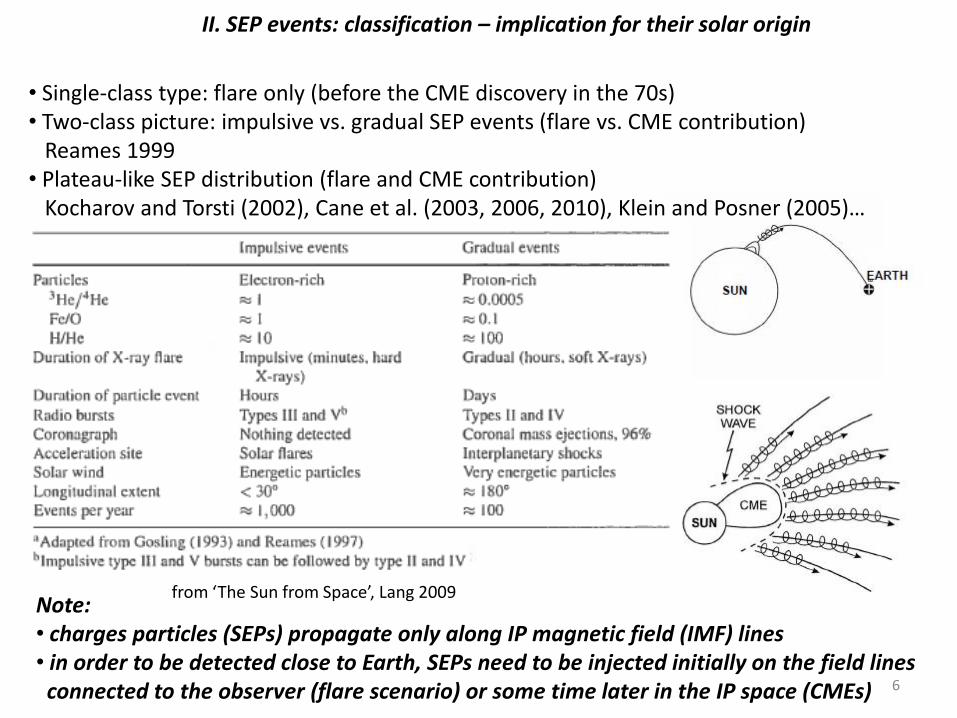
• Single-class type: flare only (before the CME discovery in the 70s) • Two-class picture: impulsive vs. gradual SEP events (flare vs. CME contribution) Reames 1999 • Plateau-like SEP distribution (flare and CME contribution) Kocharov and Torsti (2002), Cane et al. (2003, 2006, 2010), Klein and Posner (2005)…
from ‘The Sun from Space’, Lang 2009 Note: • charges particles (SEPs) propagate only along IP magnetic field (IMF) lines • in order to be detected close to Earth, SEPs need to be injected initially on the field lines connected to the observer (flare scenario) or some time later in the IP space (CMEs) 6
II. On the solar origin of SEP events: Timing analysis I
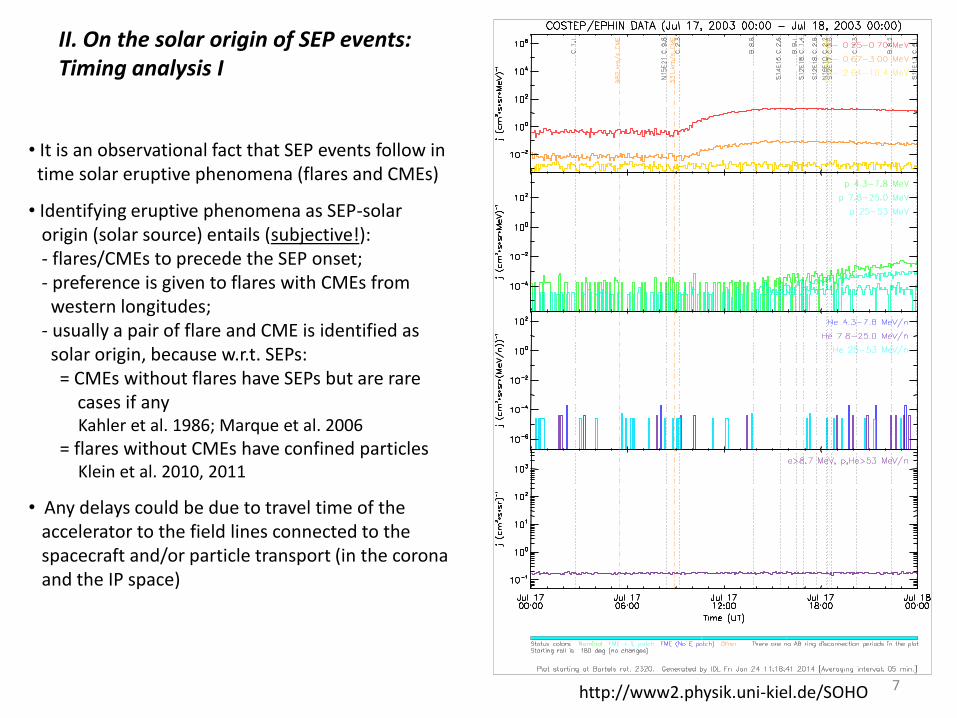
• It is an observational fact that SEP events follow in time solar eruptive phenomena (flares and CMEs)
• Identifying eruptive phenomena as SEP-solar origin (solar source) entails (subjective!): - flares/CMEs to precede the SEP onset; - preference is given to flares with CMEs from western longitudes; - usually a pair of flare and CME is identified as solar origin, because w.r.t. SEPs: = CMEs without flares have SEPs but are rare cases if any Kahler et al. 1986; Marque et al. 2006
= flares without CMEs have confined particles Klein et al. 2010, 2011
• Any delays could be due to travel time of the accelerator to the field lines connected to the spacecraft and/or particle transport (in the corona and the IP space)
http://www2.physik.uni-kiel.de/SOHO 7
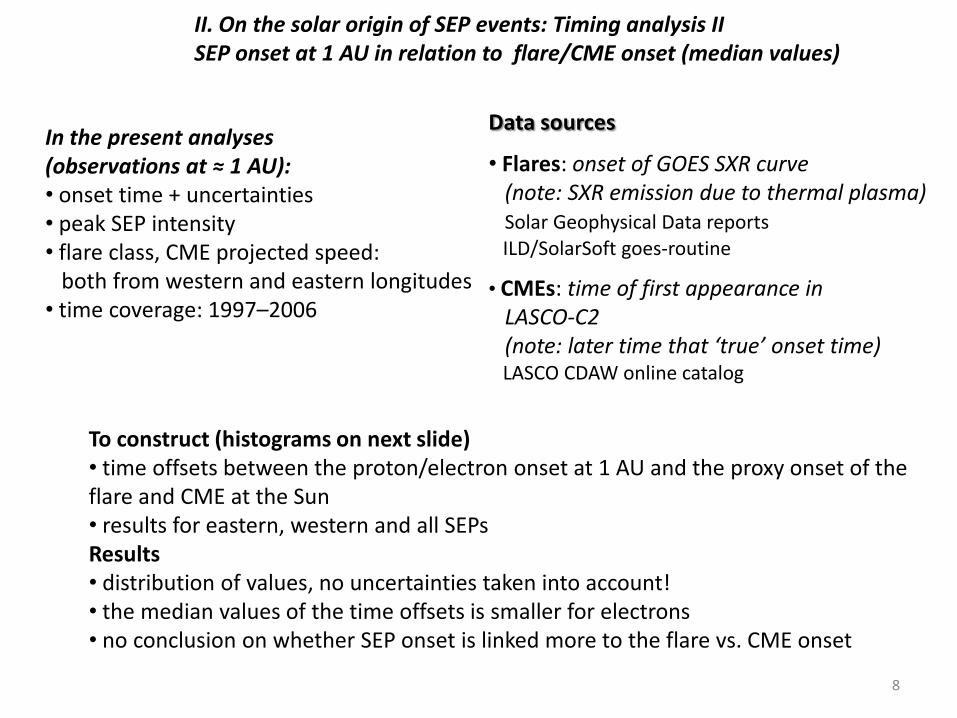
II. On the solar origin of SEP events: Timing analysis II SEP onset at 1 AU in relation to flare/CME onset (median values)
To construct (histograms on next slide) • time offsets between the proton/electron onset at 1 AU and the proxy onset of the flare and CME at the Sun • results for eastern, western and all SEPs Results • distribution of values, no uncertainties taken into account! • the median values of the time offsets is smaller for electrons • no conclusion on whether SEP onset is linked more to the flare vs. CME onset
In the present analyses (observations at ≈ 1 AU): • onset time + uncertainties • peak SEP intensity • flare class, CME projected speed: both from western and eastern longitudes • time coverage: 1997–2006
Data sources
• Flares: onset of GOES SXR curve (note: SXR emission due to thermal plasma) Solar Geophysical Data reports ILD/SolarSoft goes-routine
• CMEs: time of first appearance in LASCO-C2 (note: later time that ‘true’ onset time) LASCO CDAW online catalog
8
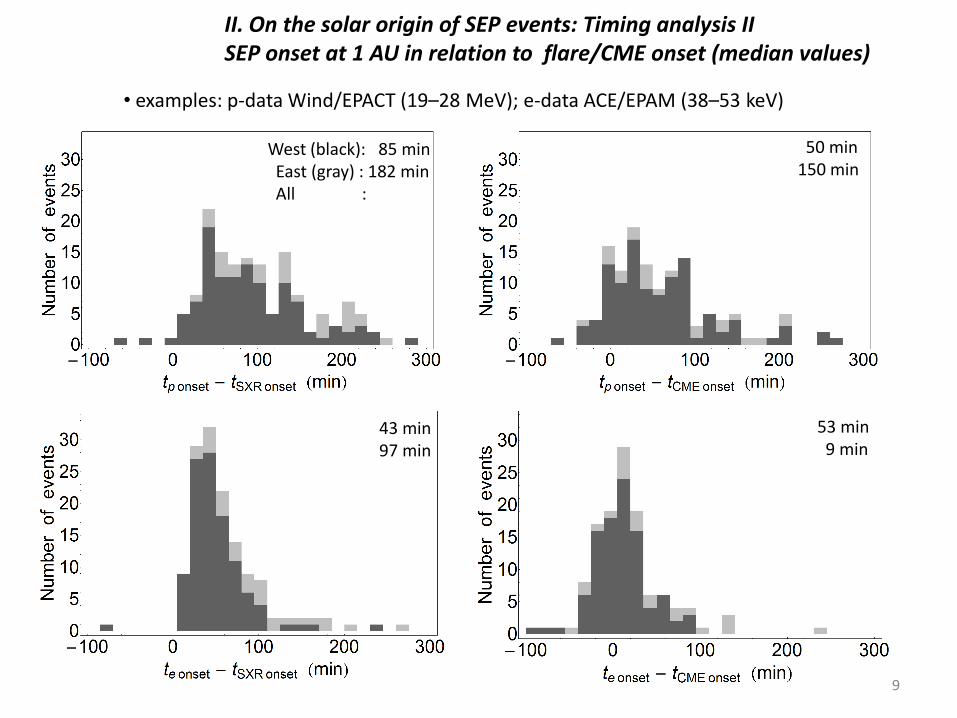
II. On the solar origin of SEP events: Timing analysis II SEP onset at 1 AU in relation to flare/CME onset (median values)
• examples: p-data Wind/EPACT (19–28 MeV); e-data ACE/EPAM (38–53 keV)
West (black): 85 min East (gray) : 182 min All :
43 min 97 min
53 min 9 min
50 min 150 min
9
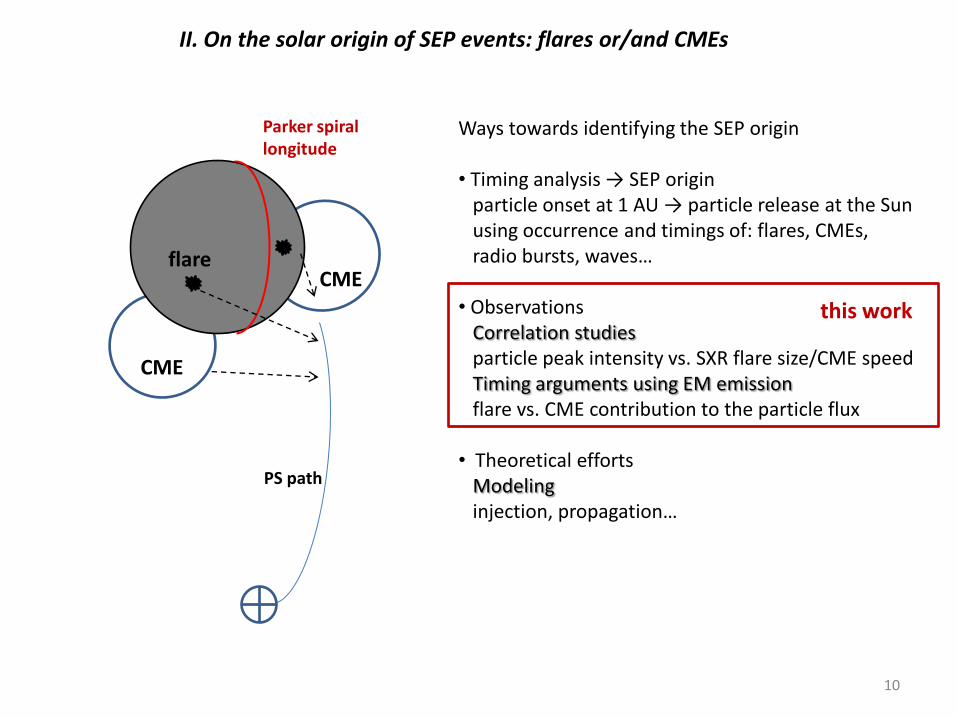
II. On the solar origin of SEP events: flares or/and CMEs
Parker spiral longitude
CME
flare CME
PS path
Ways towards identifying the SEP origin • Timing analysis → SEP origin particle onset at 1 AU → particle release at the Sun using occurrence and timings of: flares, CMEs, radio bursts, waves… • Observations Correlation studies particle peak intensity vs. SXR flare size/CME speed Timing arguments using EM emission flare vs. CME contribution to the particle flux • Theoretical efforts Modeling injection, propagation…
this work
10

Statistical studies on SEP events
Statistical studies on solar energetic particles → larger number of events → limitation: considering the overall properties only → evaluation of the statistical significance of the results is needed!
Solar cycle 23 (1997–2006) Cane et al. (2010) JGR: 1997–2006, 280 proton events > 25 MeV Laurenza et al. (2009) Space Weather: 1995–2005, 93 proton events > 10 MeV many other partial coverage lists → different SEP intensity thresholds used → no uncertainties estimated
Solar cycle 24 (2007–ongoing): status 2013 GOES SEP event list (http://umbra.nascom.nasa.gov/SEP/seps.html)
< 30 events, none during 2007–2009 SEPServer SEP lists (server.sepserver.eu)
~130 events in STEREO-A (2007–2013) ~50 events in STEREO-B (2007–2013)
11
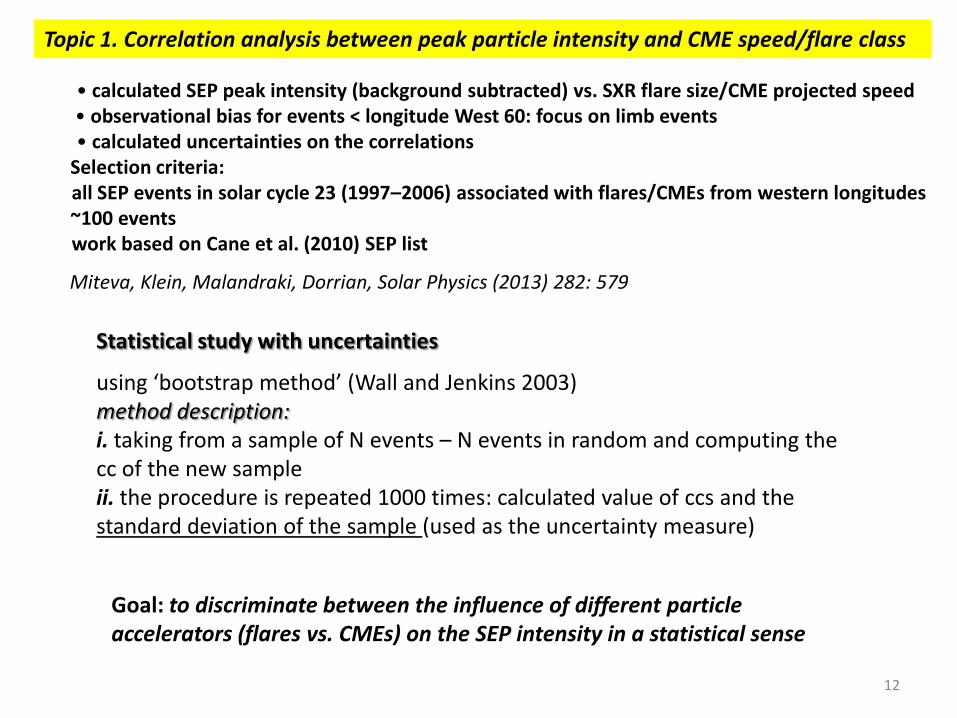
Topic 1. Correlation analysis between peak particle intensity and CME speed/flare class
Statistical study with uncertainties
using ‘bootstrap method’ (Wall and Jenkins 2003) method description: i. taking from a sample of N events – N events in random and computing the cc of the new sample ii. the procedure is repeated 1000 times: calculated value of ccs and the standard deviation of the sample (used as the uncertainty measure)
12
Goal: to discriminate between the influence of different particle accelerators (flares vs. CMEs) on the SEP intensity in a statistical sense
• calculated SEP peak intensity (background subtracted) vs. SXR flare size/CME projected speed • observational bias for events < longitude West 60: focus on limb events • calculated uncertainties on the correlations Selection criteria: all SEP events in solar cycle 23 (1997–2006) associated with flares/CMEs from western longitudes
~100 events work based on Cane et al. (2010) SEP list
Miteva, Klein, Malandraki, Dorrian, Solar Physics (2013) 282: 579

Correlation analysis between peak particle intensity and CME speed/flare class: results Western events
Results: Protons (GOES 15–40 MeV) All SEPs (81 events): cc = 0.63±0.05 for CME speed; cc = 0.59±0.07 for SXR flare class >W60 (24 events): cc = 0.64±0.09 for CME speed; cc = 0.60±0.11 for SXR flare class Earlier studies: Cane et al. (2010) cc = 0.6 for CME speed and for SXR flare class Gopalswamy et al. (2003) cc = 0.6 for CME speed , cc = 0.4 for SXR flare class Kahler (2001,1982) cc = 0.7 for CME speed, cc = 0.5 for SXR flare class → differences probably due to small number of events, different intensity thresholds, no uncertainties given
open circles: all events; filled circles: limb events > W60
13
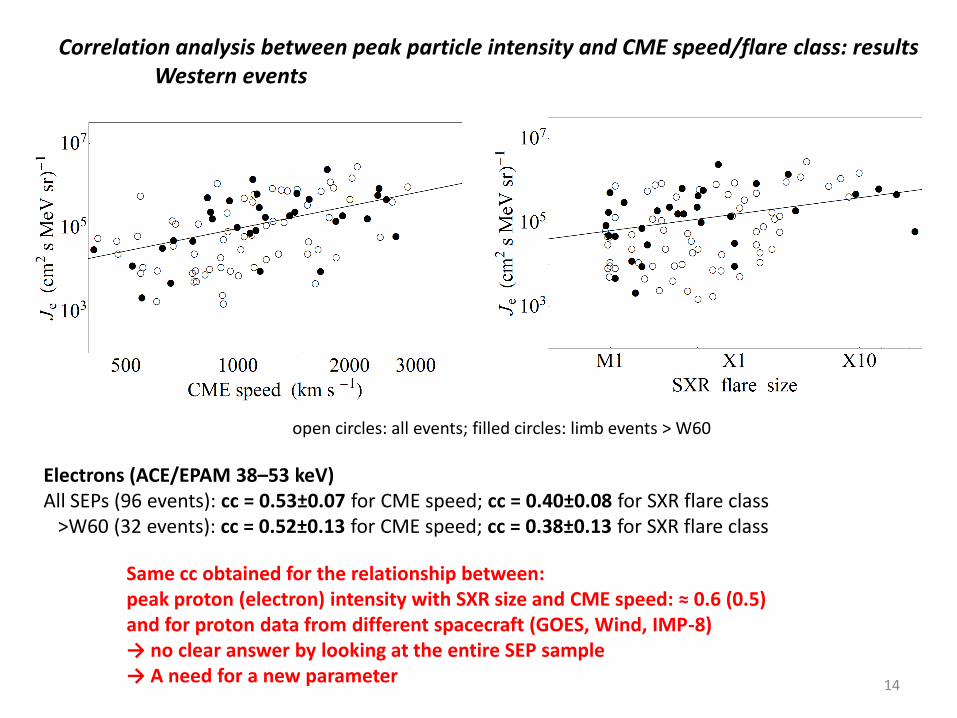
Electrons (ACE/EPAM 38–53 keV) All SEPs (96 events): cc = 0.53±0.07 for CME speed; cc = 0.40±0.08 for SXR flare class >W60 (32 events): cc = 0.52±0.13 for CME speed; cc = 0.38±0.13 for SXR flare class
Correlation analysis between peak particle intensity and CME speed/flare class: results Western events
open circles: all events; filled circles: limb events > W60
Same cc obtained for the relationship between: peak proton (electron) intensity with SXR size and CME speed: ≈ 0.6 (0.5) and for proton data from different spacecraft (GOES, Wind, IMP-8) → no clear answer by looking at the entire SEP sample → A need for a new parameter 14
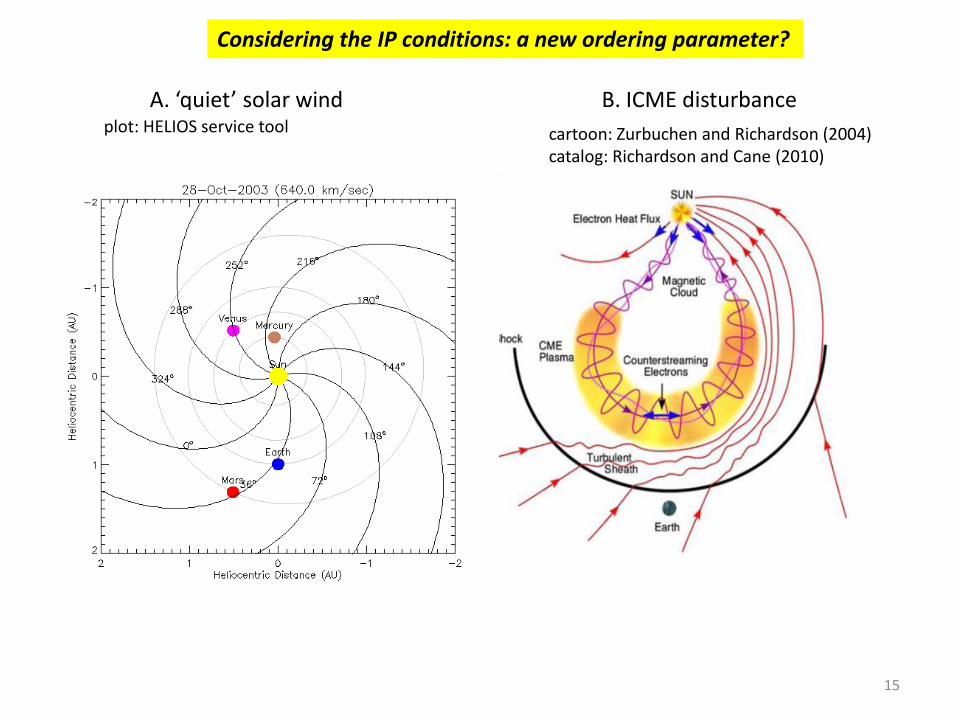
Considering the IP conditions: a new ordering parameter?
A. ‘quiet’ solar wind B. ICME disturbance
cartoon: Zurbuchen and Richardson (2004) catalog: Richardson and Cane (2010)
plot: HELIOS service tool
15
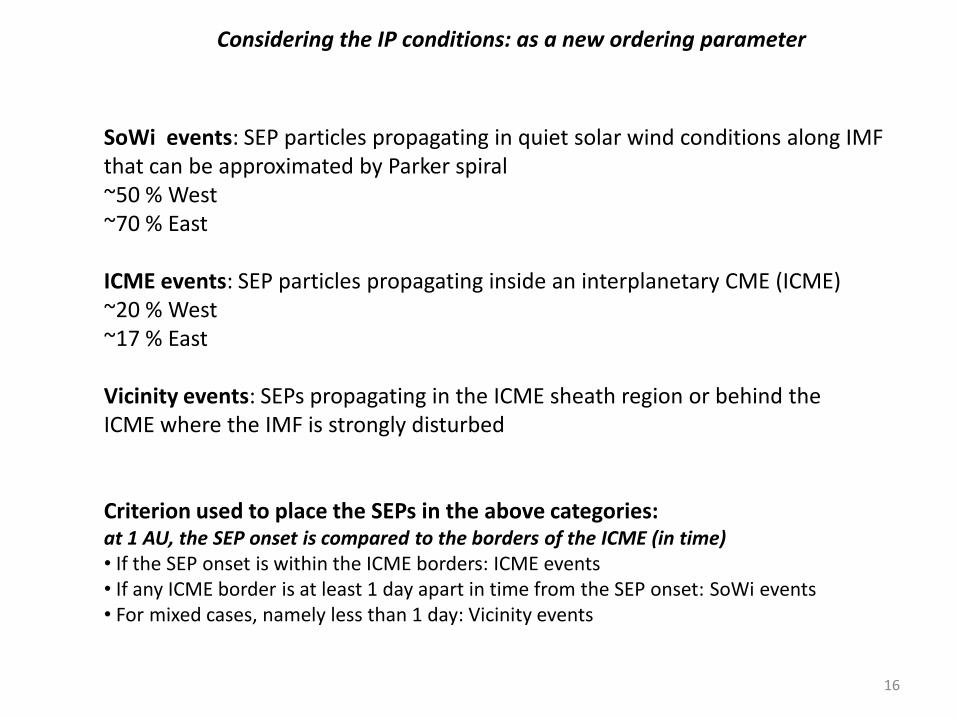
Considering the IP conditions: as a new ordering parameter
SoWi events: SEP particles propagating in quiet solar wind conditions along IMF that can be approximated by Parker spiral ~50 % West ~70 % East ICME events: SEP particles propagating inside an interplanetary CME (ICME) ~20 % West ~17 % East Vicinity events: SEPs propagating in the ICME sheath region or behind the ICME where the IMF is strongly disturbed Criterion used to place the SEPs in the above categories: at 1 AU, the SEP onset is compared to the borders of the ICME (in time) • If the SEP onset is within the ICME borders: ICME events • If any ICME border is at least 1 day apart in time from the SEP onset: SoWi events • For mixed cases, namely less than 1 day: Vicinity events
16
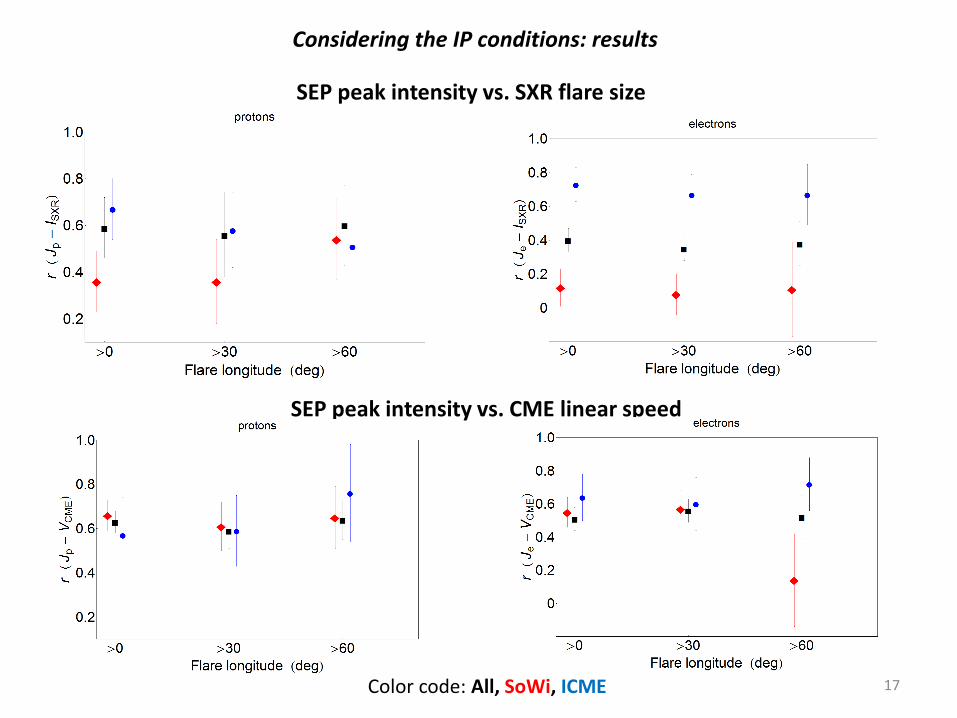
SEP peak intensity vs. CME linear speed
SEP peak intensity vs. SXR flare size
Color code: All, SoWi, ICME 17
Considering the IP conditions: results
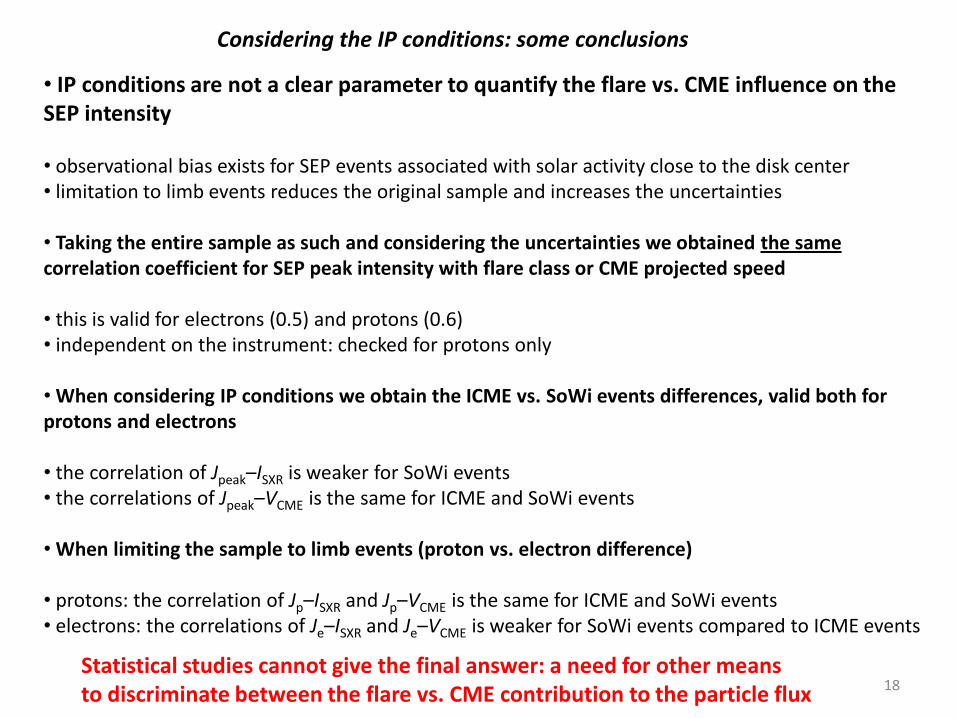
Considering the IP conditions: some conclusions
• IP conditions are not a clear parameter to quantify the flare vs. CME influence on the SEP intensity • observational bias exists for SEP events associated with solar activity close to the disk center • limitation to limb events reduces the original sample and increases the uncertainties • Taking the entire sample as such and considering the uncertainties we obtained the same correlation coefficient for SEP peak intensity with flare class or CME projected speed • this is valid for electrons (0.5) and protons (0.6) • independent on the instrument: checked for protons only • When considering IP conditions we obtain the ICME vs. SoWi events differences, valid both for protons and electrons • the correlation of Jpeak–ISXR is weaker for SoWi events • the correlations of Jpeak–VCME is the same for ICME and SoWi events • When limiting the sample to limb events (proton vs. electron difference) • protons: the correlation of Jp–ISXR and Jp–VCME is the same for ICME and SoWi events • electrons: the correlations of Je–ISXR and Je–VCME is weaker for SoWi events compared to ICME events
18 Statistical studies cannot give the final answer: a need for other means to discriminate between the flare vs. CME contribution to the particle flux
freq
uen
cy (
MH
z)
time
III
V
II
IV
IV
IV
photo- sphere
IP space
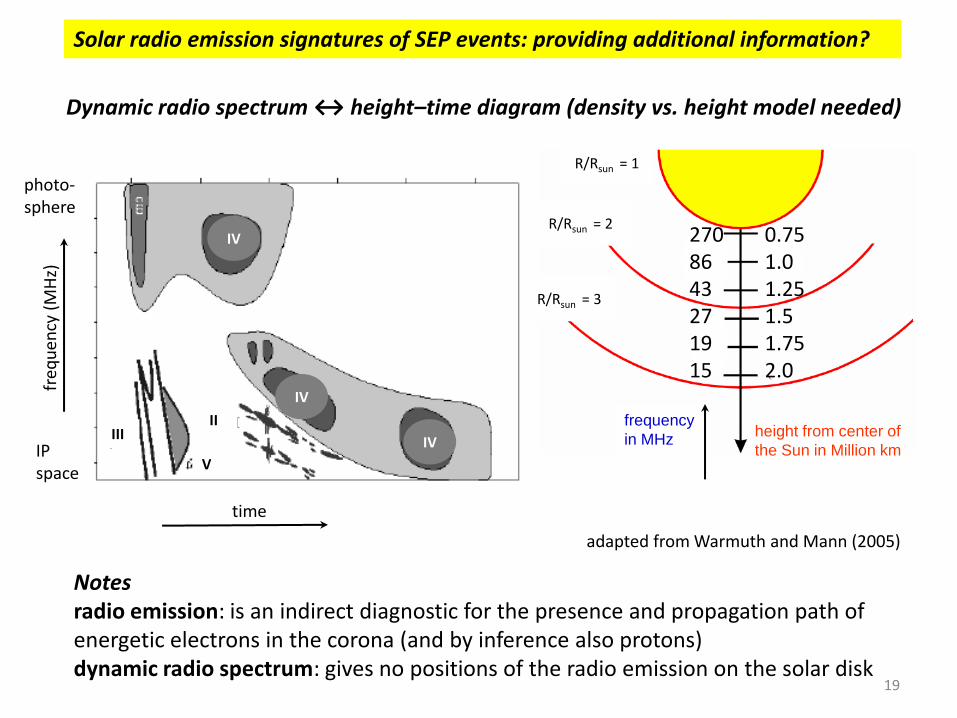
Solar radio emission signatures of SEP events: providing additional information?
Dynamic radio spectrum ↔ height–time diagram (density vs. height model needed)
adapted from Warmuth and Mann (2005)
frequency
in MHz height from center of
the Sun in Million km
R/Rsun = 1
R/Rsun = 2
R/Rsun = 3
270 86 43 27 19 15
0.75 1.0 1.25 1.5 1.75 2.0
19
Notes radio emission: is an indirect diagnostic for the presence and propagation path of energetic electrons in the corona (and by inference also protons) dynamic radio spectrum: gives no positions of the radio emission on the solar disk
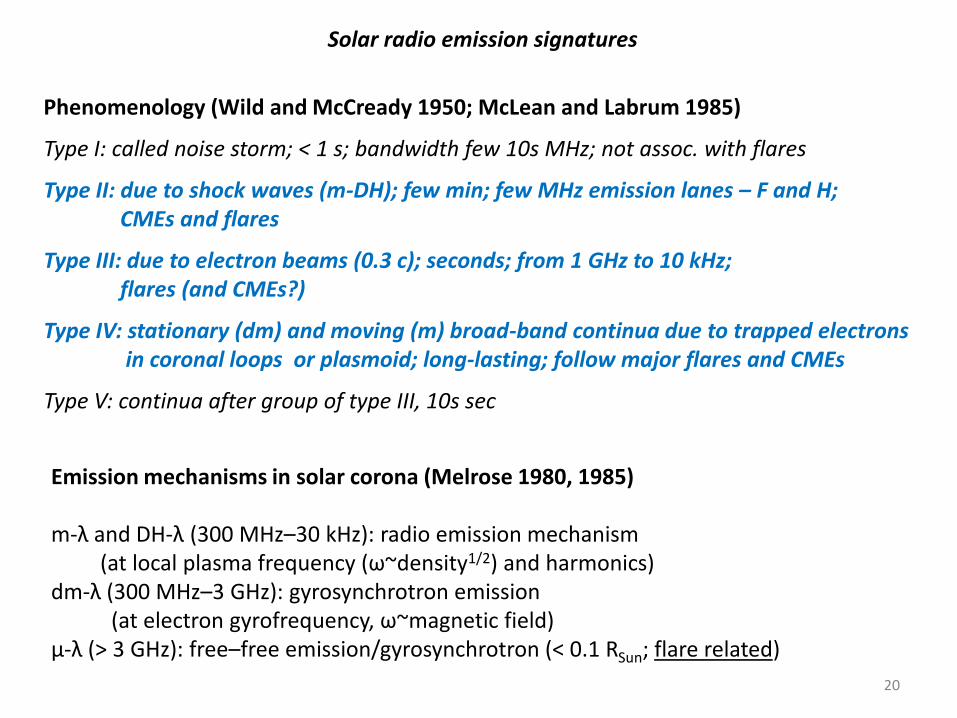
Solar radio emission signatures
Phenomenology (Wild and McCready 1950; McLean and Labrum 1985)
Type I: called noise storm; < 1 s; bandwidth few 10s MHz; not assoc. with flares
Type II: due to shock waves (m-DH); few min; few MHz emission lanes – F and H; CMEs and flares
Type III: due to electron beams (0.3 c); seconds; from 1 GHz to 10 kHz; flares (and CMEs?)
Type IV: stationary (dm) and moving (m) broad-band continua due to trapped electrons in coronal loops or plasmoid; long-lasting; follow major flares and CMEs
Type V: continua after group of type III, 10s sec
Emission mechanisms in solar corona (Melrose 1980, 1985) m-λ and DH-λ (300 MHz–30 kHz): radio emission mechanism (at local plasma frequency (ω~density1/2) and harmonics) dm-λ (300 MHz–3 GHz): gyrosynchrotron emission (at electron gyrofrequency, ω~magnetic field) μ-λ (> 3 GHz): free–free emission/gyrosynchrotron (< 0.1 RSun; flare related)
20
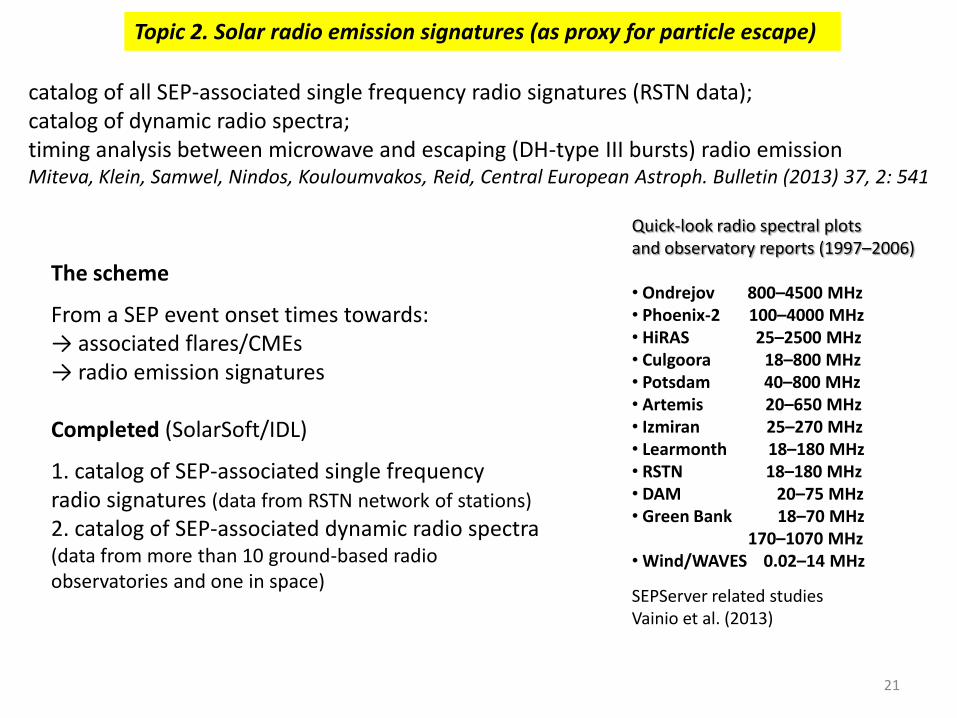
Topic 2. Solar radio emission signatures (as proxy for particle escape)
Quick-look radio spectral plots and observatory reports (1997–2006) • Ondrejov 800–4500 MHz • Phoenix-2 100–4000 MHz • HiRAS 25–2500 MHz • Culgoora 18–800 MHz • Potsdam 40–800 MHz • Artemis 20–650 MHz • Izmiran 25–270 MHz • Learmonth 18–180 MHz • RSTN 18–180 MHz • DAM 20–75 MHz • Green Bank 18–70 MHz 170–1070 MHz • Wind/WAVES 0.02–14 MHz
SEPServer related studies Vainio et al. (2013)
21
catalog of all SEP-associated single frequency radio signatures (RSTN data); catalog of dynamic radio spectra; timing analysis between microwave and escaping (DH-type III bursts) radio emission Miteva, Klein, Samwel, Nindos, Kouloumvakos, Reid, Central European Astroph. Bulletin (2013) 37, 2: 541
The scheme
From a SEP event onset times towards: → associated flares/CMEs → radio emission signatures Completed (SolarSoft/IDL)
1. catalog of SEP-associated single frequency radio signatures (data from RSTN network of stations)
2. catalog of SEP-associated dynamic radio spectra (data from more than 10 ground-based radio observatories and one in space)

Radio burst occurrence: results
black – dynamic radio spectra dark gray – observatory reports only light gray – data gap
SEPs are always related to radio emission Miteva et al. CEAB (2013) Other results All (Eastern+Western) SEPs • ~75% with DH-IIs 63% Cliver et al. 2004 100% Gopalswamy 2003 ~80% with m-IIs 82% Cliver et al. 2004
• ~100% with DH-IIIs ~90% MacDowall et al. 2003 ~90% with m-IIIs 100% Cane et al. 2002 ~40% with dm-IIIs
• ~60% with m-IVs 88% Kahler 1982 • ~60% with dm-IVs
Our final event list: selection of ~180 particle events associated with ≥ C9 flares, located ±90° Western activity: ~70 % Eastern activity: ~30 %
22
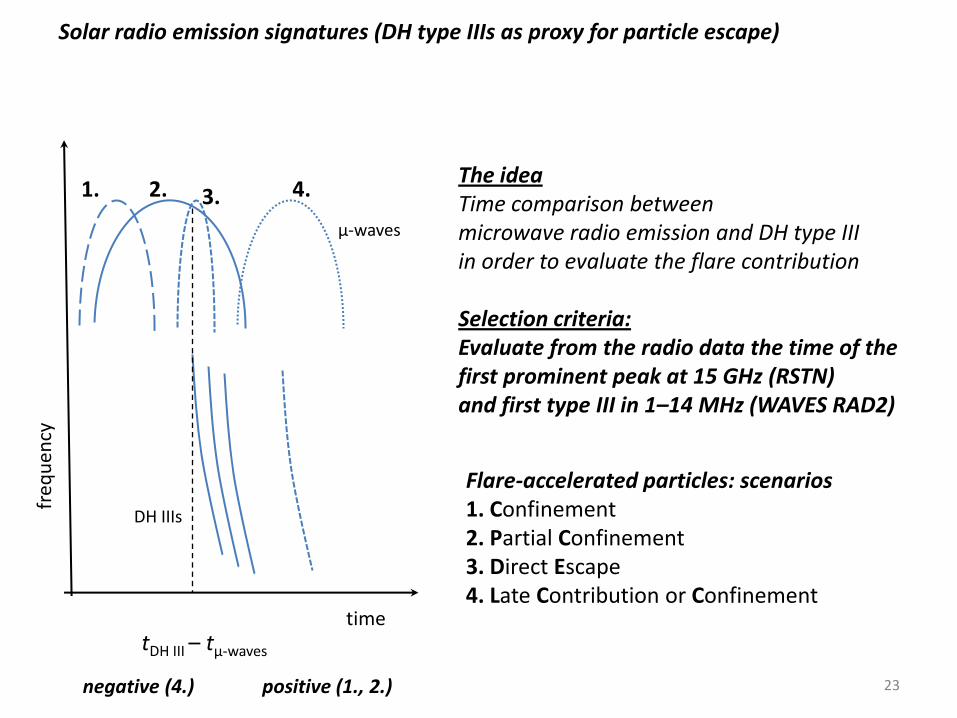
Solar radio emission signatures (DH type IIIs as proxy for particle escape)
The idea Time comparison between microwave radio emission and DH type III in order to evaluate the flare contribution Selection criteria: Evaluate from the radio data the time of the first prominent peak at 15 GHz (RSTN) and first type III in 1–14 MHz (WAVES RAD2)
time
DH IIIs
freq
uen
cy
μ-waves
1. 2. 3. 4.
Flare-accelerated particles: scenarios 1. Confinement 2. Partial Confinement 3. Direct Escape 4. Late Contribution or Confinement
tDH III – tμ-waves
positive (1., 2.) negative (4.) 23
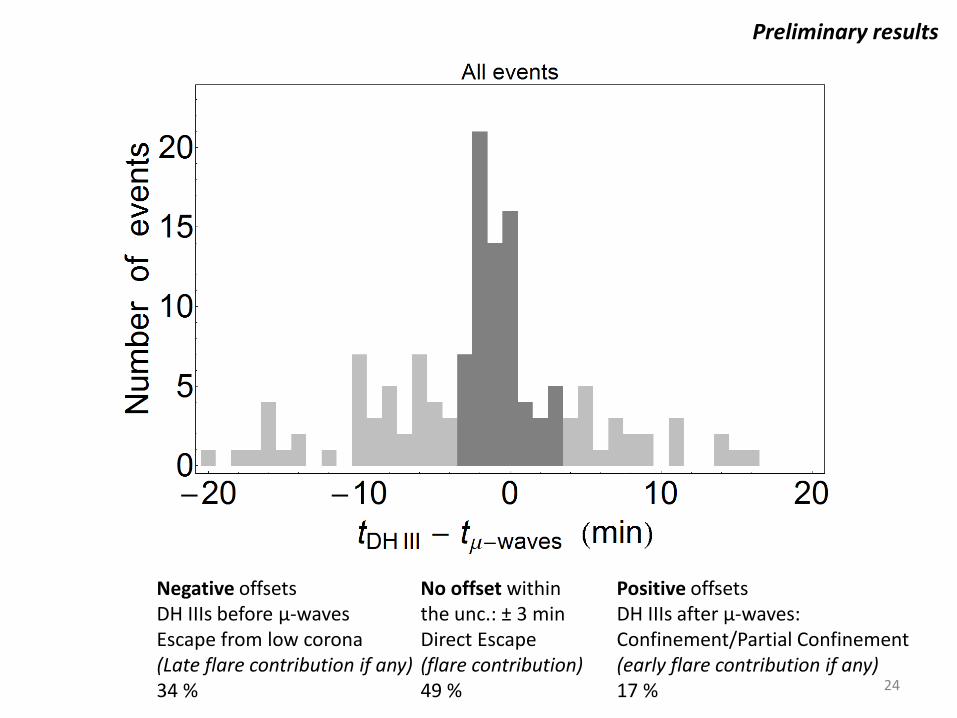
Preliminary results
No offset within the unc.: ± 3 min Direct Escape (flare contribution) 49 %
Positive offsets DH IIIs after μ-waves: Confinement/Partial Confinement (early flare contribution if any) 17 %
Negative offsets DH IIIs before μ-waves Escape from low corona (Late flare contribution if any) 34 % 24
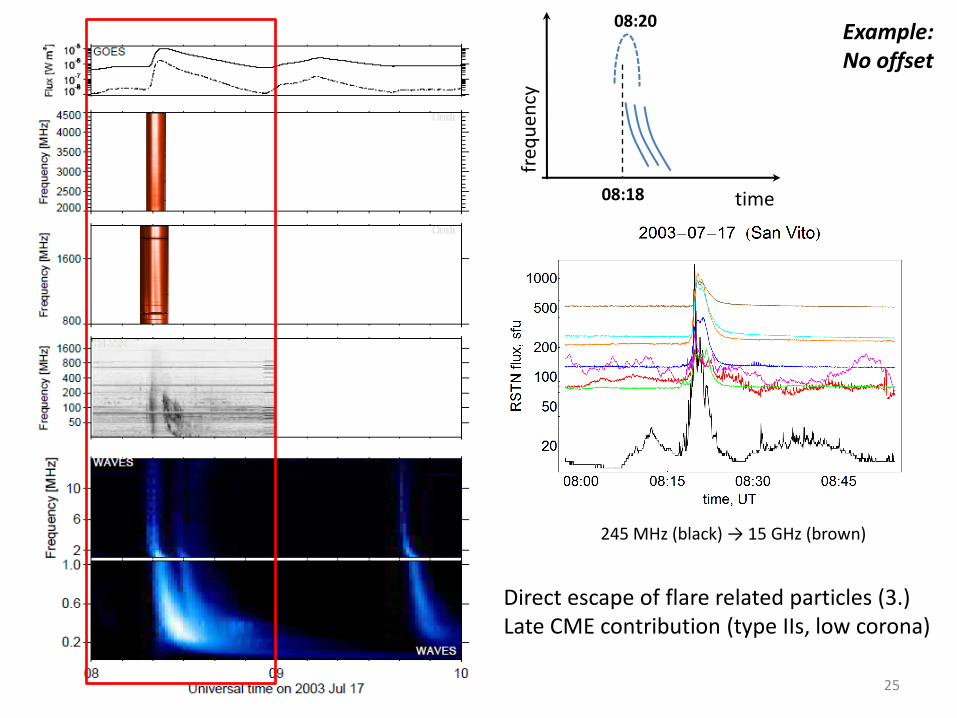
Example: No offset
time
freq
uen
cy
Direct escape of flare related particles (3.) Late CME contribution (type IIs, low corona)
08:18
08:20
245 MHz (black) → 15 GHz (brown)
25
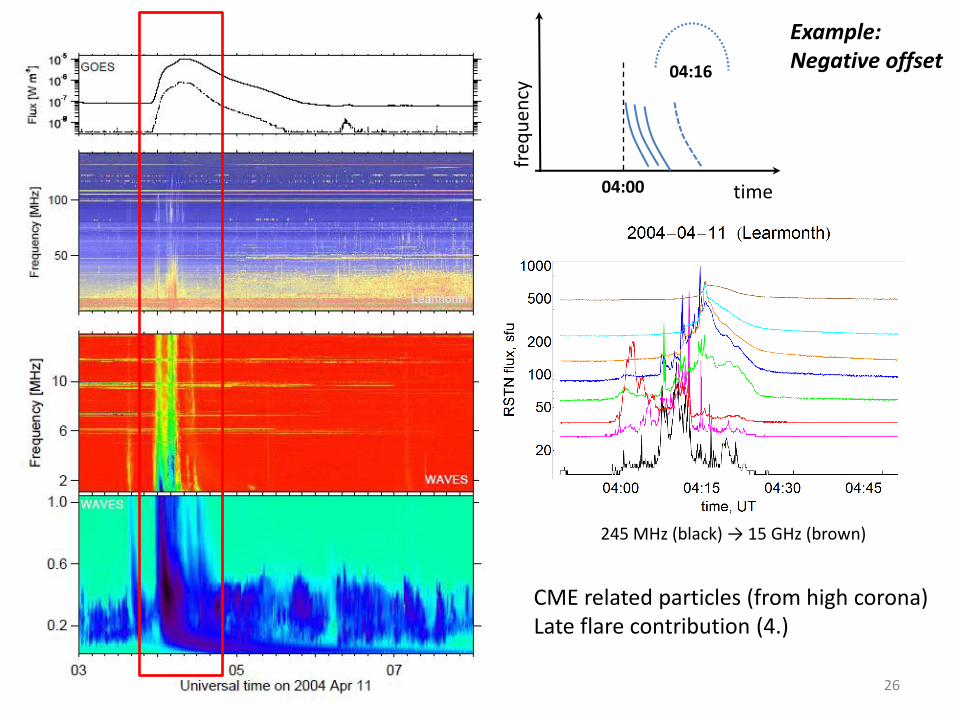
Example: Negative offset
CME related particles (from high corona) Late flare contribution (4.)
time
freq
uen
cy
04:00
04:16
245 MHz (black) → 15 GHz (brown)
26

Example: Positive offset
CME related particles (IIs, high corona) flare confinement (1.)
time
freq
uen
cy
07:54
07:46
245 MHz (black) → 15 GHz (brown)
27
Summary
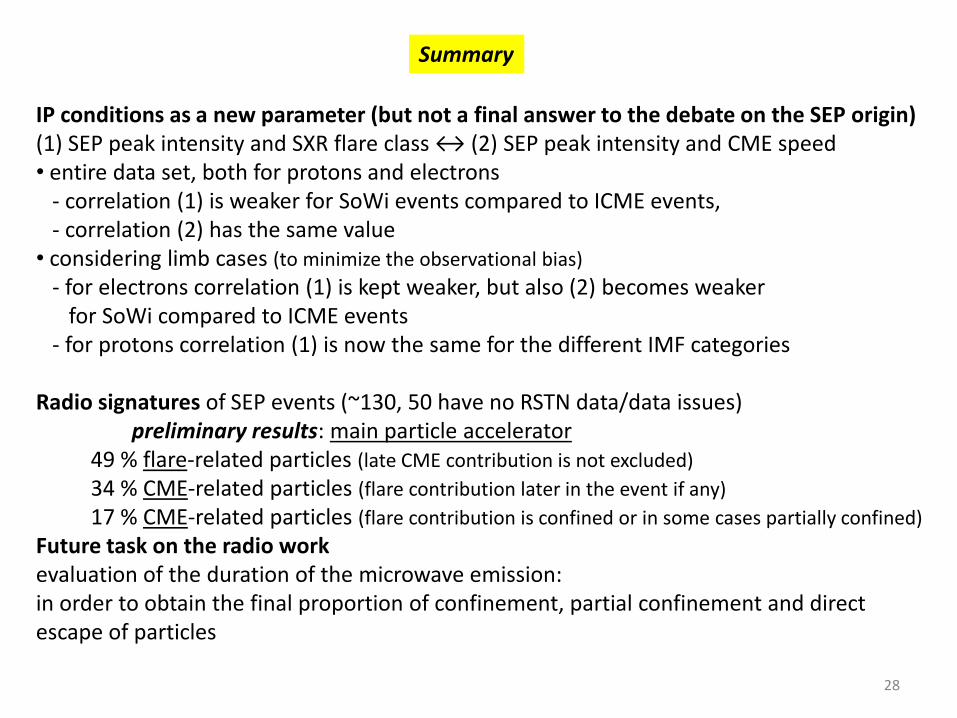
IP conditions as a new parameter (but not a final answer to the debate on the SEP origin) (1) SEP peak intensity and SXR flare class ↔ (2) SEP peak intensity and CME speed • entire data set, both for protons and electrons - correlation (1) is weaker for SoWi events compared to ICME events, - correlation (2) has the same value • considering limb cases (to minimize the observational bias)
- for electrons correlation (1) is kept weaker, but also (2) becomes weaker for SoWi compared to ICME events - for protons correlation (1) is now the same for the different IMF categories Radio signatures of SEP events (~130, 50 have no RSTN data/data issues) preliminary results: main particle accelerator 49 % flare-related particles (late CME contribution is not excluded)
34 % CME-related particles (flare contribution later in the event if any)
17 % CME-related particles (flare contribution is confined or in some cases partially confined)
Future task on the radio work evaluation of the duration of the microwave emission: in order to obtain the final proportion of confinement, partial confinement and direct escape of particles
28