Embed Size (px)
Citation preview
JWSF006-Philip October 31, 2007 7:32
1
A Brief Description of theROI Methodology
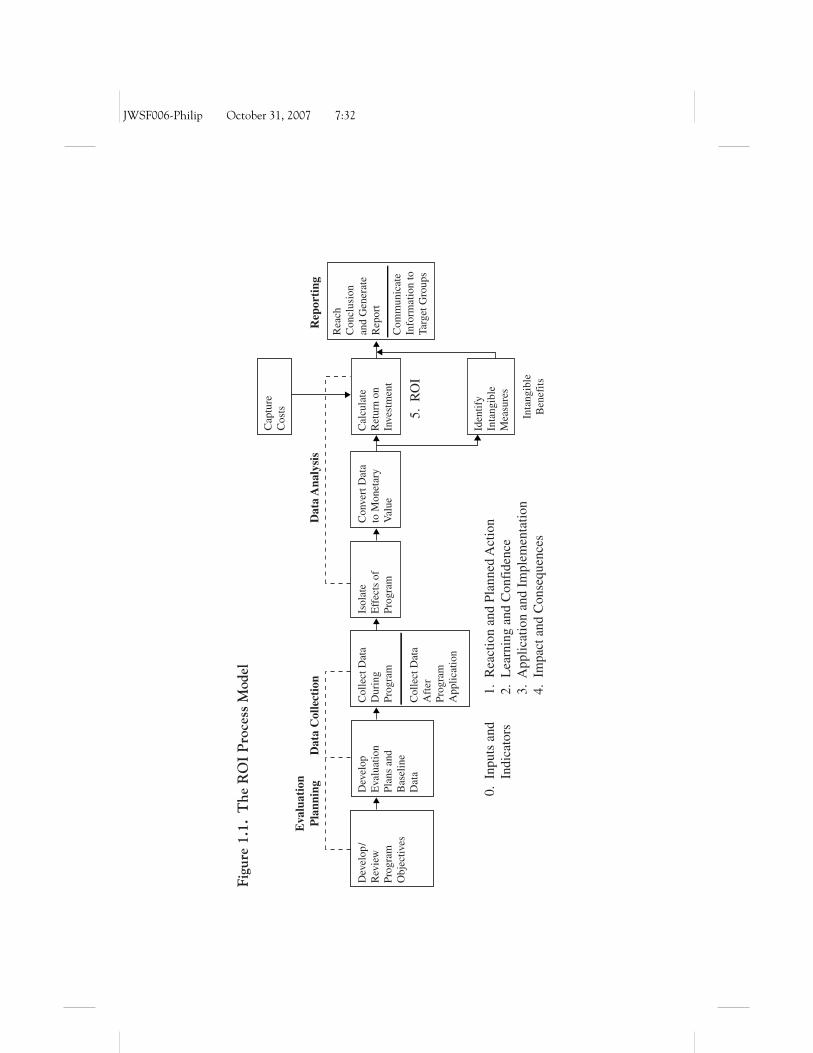
The ROI Methodology is represented by the basic model shownin Figure 1.1. This process model provides a systematic ap-
proach to ROI calculations; a potentially complicated process issimplified by breaking it into sequential steps. This step-by-stepapproach keeps the process manageable so that users can tackleone issue at a time. Applying the model also provides consistencyfrom one ROI calculation to another. This chapter provides a briefdescription of the ROI Methodology and how it fits into a compre-hensive process.
Evaluation Levels: A Beginning Point
The ROI Methodology collects and processes up to five levels ofevaluation results. The process also considers what is referred toas Level 0, the initial data or inputs, which represent activitiesand investment associated with a program or project. Each levelrepresents a different category of data; each category of data answersquestions asked by various stakeholders.
For example, Level 0, Inputs and Indicators, represents the var-ious inputs of the project or program. These data are collected forall programs; they include costs, efficiencies, duration (in hoursor days), participants, and topics. These data are input only anddo not necessarily correspond to the results; they merely represent
1
COPYRIG
HTED M
ATERIAL
JWSF006-Philip October 31, 2007 7:32
Figu
re1.
1.T
heR
OI
Pro
cess
Mod
el
Dat
a C
olle
ctio
nD
ata
Ana
lysi
sR
epor
ting
Cap
ture
Cos
ts
Rea
chC
oncl
usio
nan
d G
ener
ate
Rep
ort
Com
mun
icat
eIn
form
atio
n to
Targ
et G
roup
s
Eva
luat
ion
Pla
nnin
g Dev
elop
Eva
luat
ion
Plan
s an
dB
asel
ine
Dat
a
0. I
nput
s an
d
Ind
icat
ors
1. R
eact
ion
and
Plan
ned
Act
ion
2. L
earn
ing
and
Con
fide
nce
3. A
pplic
atio
n an
d Im
plem
enta
tion
4. I
mpa
ct a
nd C
onse
quen
ces
Col
lect
Dat
aD
urin
gPr
ogra
m
Col
lect
Dat
aA
fter
Prog
ram
App
licat
ion
Isol
ate
Eff
ects
of
Prog
ram
Con
vert
Dat
ato
Mon
etar
yV
alue
Cal
cula
teR
etur
n on
Inve
stm
ent
Iden
tify
Inta
ngib
leM
easu
res
Inta
ngib
leB
enef
its
Dev
elop
/R
evie
wPr
ogra
mO
bjec
tives
5. R
OI
JWSF006-Philip October 31, 2007 7:32
A Brief Description of the ROI Methodology 3
activity. Specific questions answered by data categorized at Level 0include
� What steps have been taken to implement the program?
� How many people are involved in the program?
� Who was involved in the program?
� How much time has been spent on the program?
� What did the program cost the organization?
Level 1, Reaction and Planned Action, represents reaction fromparticipants as well as actions planned as a result of the pro-gram. This level of evaluation is the first level that representsresults—results from the perspective of participants. Almost allorganizations evaluate at Level 1, usually with a generic end-of-program questionnaire. Specific questions answered by data col-lected at this level include
� Was the program delivered successfully?
� Was the content relevant to participants’ current work?
� Was the content important to participants’ current jobs?
� Do the participants intend to apply what they learned?
� Did the content represent new information?
� Will participants recommend the program to others?
While this level of evaluation is important as a customer satisfactionmeasure, a favorable reaction does not ensure that participants havelearned new skills or knowledge.
At Level 2, Learning and Confidence, measurements focus onwhat participants learned during the program; learning is assessed
JWSF006-Philip October 31, 2007 7:32
4 ROI FUNDAMENTALS
through self-assessments, checklists, role plays, simulations, groupevaluations, or other tools. A learning check is helpful to ensurethat participants have absorbed the desired content and messagesand know how to use or apply them properly. This level may alsomeasure the number of new professional contacts made and theextent to which existing contacts were strengthened through net-working that occurred during program implementation. Specificquestions that are answered with Level 2 data include
� Do the participants “get it”?
� Do participants know what to do?
� Do participants know how to do it?
� Have participants’ attitudes changed so that they areprepared to change behaviors or processes?
� Are participants confident in applying their newlyacquired skills, knowledge, or information?
It is important to remember, however, that a positive learning mea-sure is no guarantee that the learning or contacts acquired will ac-tually be used.
At Level 3, Application and Implementation, a variety offollow-up methods are used to determine whether participants haveapplied what they learned. Completion of action items, behaviorchange, use of skills, and follow-up with contacts are importantmeasures at Level 3. Questions answered by Level 3 data include
� Are participants applying their newly acquiredknowledge, skills, or information?
� Are participants applying their newly acquiredknowledge, skills, or information at the level offrequency expected?
JWSF006-Philip October 31, 2007 7:32
A Brief Description of the ROI Methodology 5
� If participants are applying their newly acquiredknowledge, skills, or information, what is supportingthem?
� If they are not, why not?
While Level 3 evaluations are important to gauge the success ofthe application, they still do not guarantee that a positive impactwill occur in the individual or the organization.
Level 4, Impact and Consequences, represents the actual results,or outcomes, achieved by participants as they successfully apply thecontent, messages, or contacts. Typical Level 4 measures includeoutput, sales, quality, costs, time, and customer satisfaction. Animportant step taken during Level 4 data collection and analysisis isolating the impact of the program on these measures. Specificquestions answered with Level 4 data include
� How does the application of newly acquired knowledge,skills, or information affect output, quality, cost, time,job satisfaction, employee satisfaction, or work habits?
� How does an organization know whether the programcaused the impact?
Although the program may produce a measurable business impact,a concern may still exist that the program costs too much.
At Level 5, Return on Investment—the ultimate level ofevaluation—the program’s monetary benefits are compared withthe program’s costs. Although ROI can be expressed in severalways, it is usually presented as a percentage or benefit-cost ratio.The evaluation chain is not complete until the Level 5 evaluation isconducted. Here, the analysis should answer the most fundamentalquestion: Do program benefits exceed program costs?
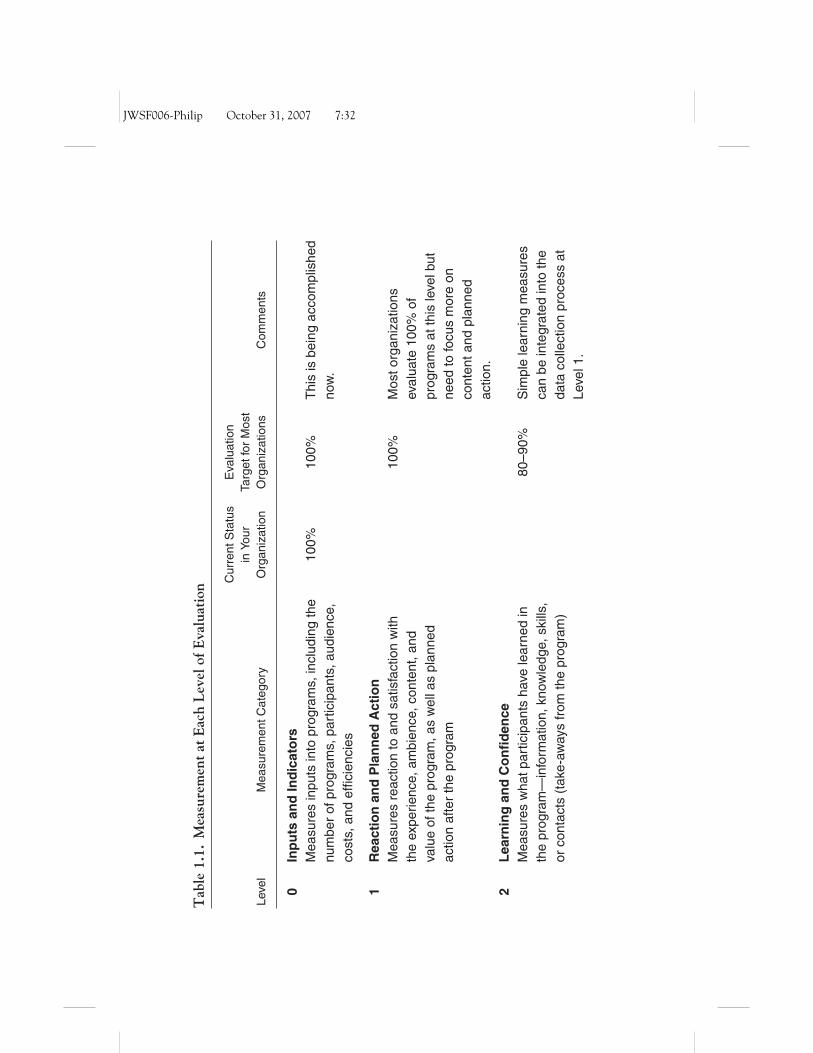
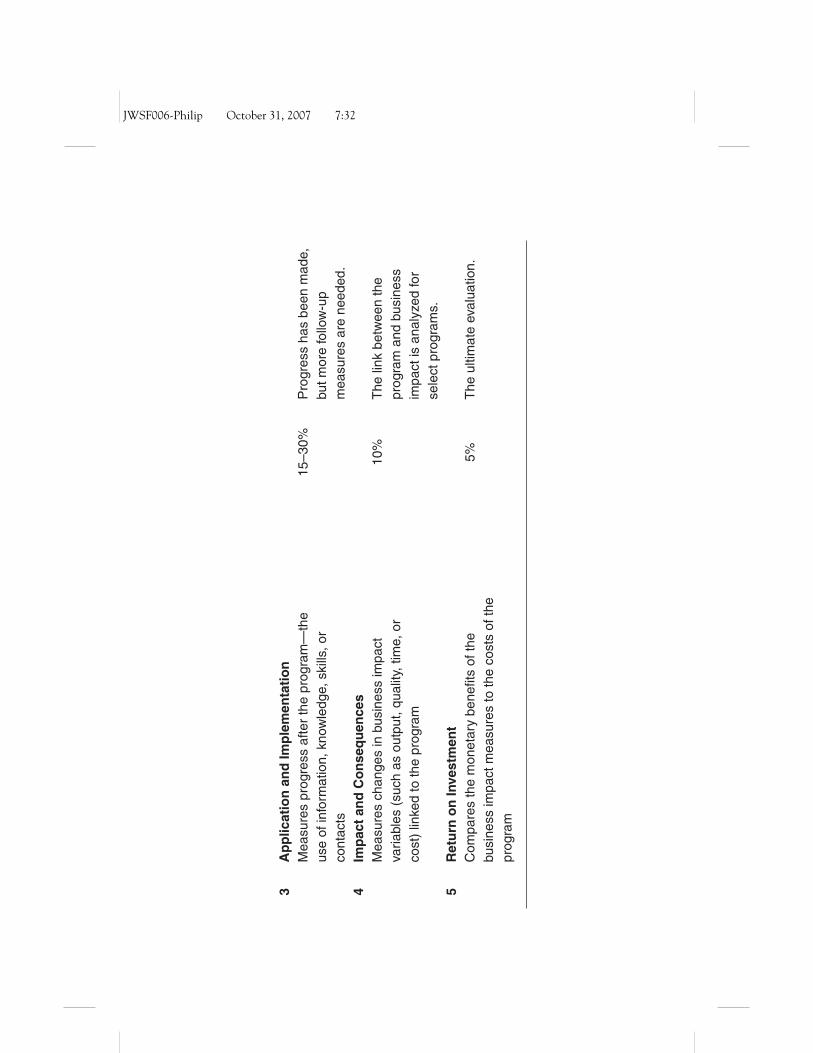
Table 1.1 summarizes the evaluation levels and the measuresdeveloped at each level. Readers should consider each level and
JWSF006-Philip October 31, 2007 7:32
Tab
le1.
1.M
easu
rem
ent
atE
ach
Lev
elof
Eva
luat
ion
Leve
lM
easu
rem
entC
ateg
ory
Cur
rent
Sta
tus
inYo
urO
rgan
izat
ion
Eva
luat
ion
Targ
etfo
rM
ost
Org
aniz
atio
nsC
omm
ents
0In
pu
tsan
dIn
dic
ato
rsM
easu
res
inpu
tsin
topr
ogra
ms,
incl
udin
gth
enu
mbe
rof
prog
ram
s,pa
rtic
ipan
ts,a
udie
nce,
cost
s,an
def
ficie
ncie
s
100%
100%
Thi
sis
bein
gac
com
plis
hed
now
.
1R
eact
ion
and
Pla
nn
edA
ctio
nM
easu
res
reac
tion
toan
dsa
tisfa
ctio
nw
ithth
eex
perie
nce,
ambi
ence
,con
tent
,and
valu
eof
the
prog
ram
,as
wel
las
plan
ned
actio
naf
ter
the
prog
ram
100%
Mos
torg
aniz
atio
nsev
alua
te10
0%of
prog
ram
sat
this
leve
lbut
need
tofo
cus
mor
eon
cont
enta
ndpl
anne
dac
tion.
2L
earn
ing
and
Co
nfi
den
ceM
easu
res
wha
tpar
ticip
ants
have
lear
ned
inth
epr
ogra
m—
info
rmat
ion,
know
ledg
e,sk
ills,
orco
ntac
ts(t
ake-
away
sfr
omth
epr
ogra
m)
80–9
0%S
impl
ele
arni
ngm
easu
res
can
bein
tegr
ated
into
the
data
colle
ctio
npr
oces
sat
Leve
l1.
JWSF006-Philip October 31, 2007 7:32
3A
pp
licat
ion
and
Imp
lem
enta
tio
nM
easu
res
prog
ress
afte
rth
epr
ogra
m—
the
use
ofin
form
atio
n,kn
owle
dge,
skill
s,or
cont
acts
15–3
0%P
rogr
ess
has
been
mad
e,bu
tmor
efo
llow
-up
mea
sure
sar
ene
eded
.4
Imp
act
and
Co
nse
qu
ence
sM
easu
res
chan
ges
inbu
sine
ssim
pact
varia
bles
(suc
has
outp
ut,q
ualit
y,tim
e,or
cost
)lin
ked
toth
epr
ogra
m
10%
The
link
betw
een
the
prog
ram
and
busi
ness
impa
ctis
anal
yzed
for
sele
ctpr
ogra
ms.
5R
etu
rno
nIn
vest
men
tC
ompa
res
the
mon
etar
ybe
nefit
sof
the
busi
ness
impa
ctm
easu
res
toth
eco
sts
ofth
epr
ogra
m
5%T
heul
timat
eev
alua
tion.
JWSF006-Philip October 31, 2007 7:32
8 ROI FUNDAMENTALS
note the percentage of programs within their organization that areevaluated at each level. They should compare the current status oftheir evaluations with the targeted percentages in the table. Thesetargets were developed on the basis of the evaluation practicesof organizations currently implementing the ROI Methodology. Asshown, not all programs should be evaluated at each level. Selectingprograms to be evaluated at the higher levels depends on a varietyof factors, including
� Purpose of evaluation
� Need for the program
� Program profile
� Stakeholders’ needs
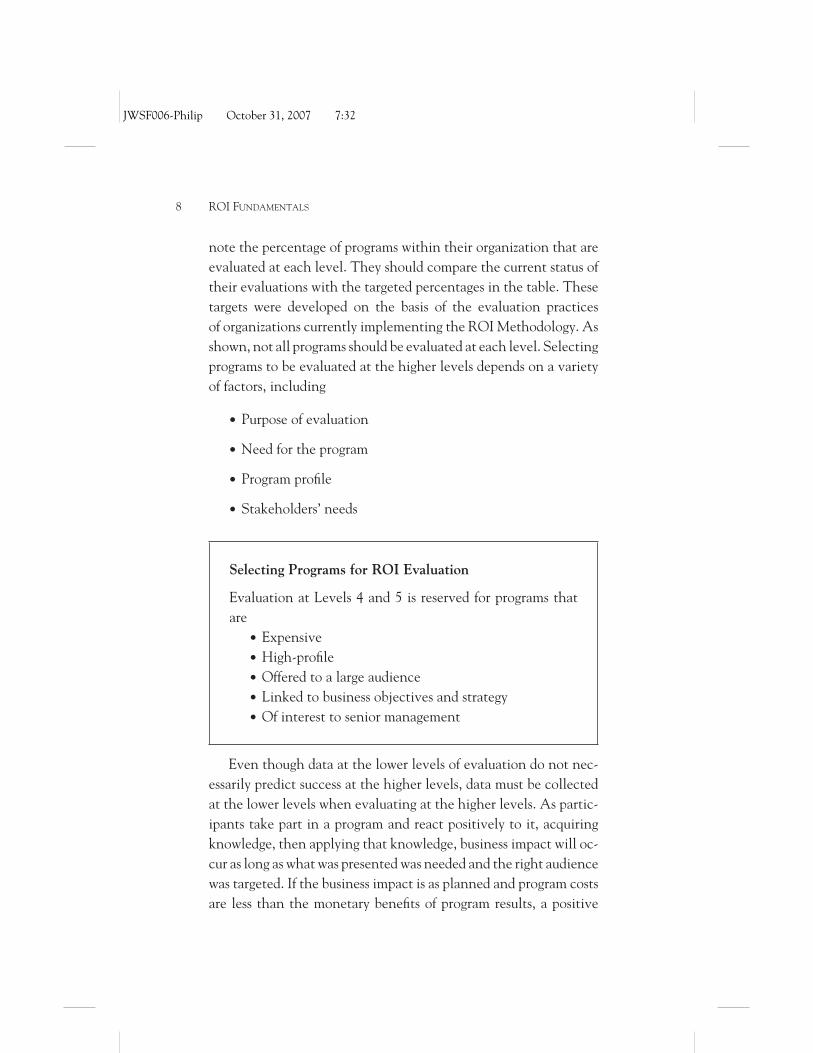
Selecting Programs for ROI Evaluation
Evaluation at Levels 4 and 5 is reserved for programs thatare
� Expensive� High-profile� Offered to a large audience� Linked to business objectives and strategy� Of interest to senior management
Even though data at the lower levels of evaluation do not nec-essarily predict success at the higher levels, data must be collectedat the lower levels when evaluating at the higher levels. As partic-ipants take part in a program and react positively to it, acquiringknowledge, then applying that knowledge, business impact will oc-cur as long as what was presented was needed and the right audiencewas targeted. If the business impact is as planned and program costsare less than the monetary benefits of program results, a positive
JWSF006-Philip October 31, 2007 7:32
A Brief Description of the ROI Methodology 9
ROI will occur. This chain of impact provides the complete story ofprogram success. Data important to all stakeholders are developed;together, these data can explain why the ROI is what it is and howit can be improved for future program implementations.
From the client’s perspective, the value of information increasesas evaluation moves up the chain of impact. The ROI Methodologyis a client-centered process, meeting the data needs of the individu-als who initiate, approve, and sponsor programs. Placing the clientat the center of the evaluation process is consistent with the prac-tices of benchmarking forum members of the American Society forTraining and Development (ASTD) (Van Buren, 2002) and thebest practices of corporate universities as identified in a study con-ducted by the American Productivity and Quality Center (Phillips,2000).
Evaluation Planning
Planning is a critical phase in the ROI Methodology. A solid eval-uation plan will foster successful execution as well as capture clientbuy-in before results are rendered. Several issues must be addressedwhen developing the evaluation plan for an ROI impact study. Fivespecific elements are important to evaluation success:
1. The evaluation purpose should be considered prior to developingthe evaluation plan because the purpose will determine the scopeof the evaluation, the types of instruments used, and the typesof data collected.
2. The feasibility of a Level 4 or 5 evaluation should be examined.Feasibility is determined not only by the type of program under-going evaluation but also by resources and time constraints.
3. It is imperative that objectives for different levels of evaluationbe developed. Program objectives position the program for suc-cess as well as give direction to the evaluation.
JWSF006-Philip October 31, 2007 7:32
10 ROI FUNDAMENTALS
4. Sources of data are an important consideration. While programparticipants will be the primary source of data in most cases,including other sources is also important to provide a balancedperspective and add credibility.
5. The timing of data collection is another consideration. In somecases, pre-program measurements are taken to compare withpost-program measures. In other cases, measures are taken at in-tervals throughout the program. Sometimes, pre-program mea-surements are not available but post-program follow-up measuresare still taken.
To complete the planning process, three simple planning doc-uments are developed: the data collection plan, the ROI analysisplan, and the project plan. These documents should be completedbefore the evaluation project is implemented (ideally, before theprogram is designed or developed). Appropriate up-front attentionwill save much time later when data are actually collected.
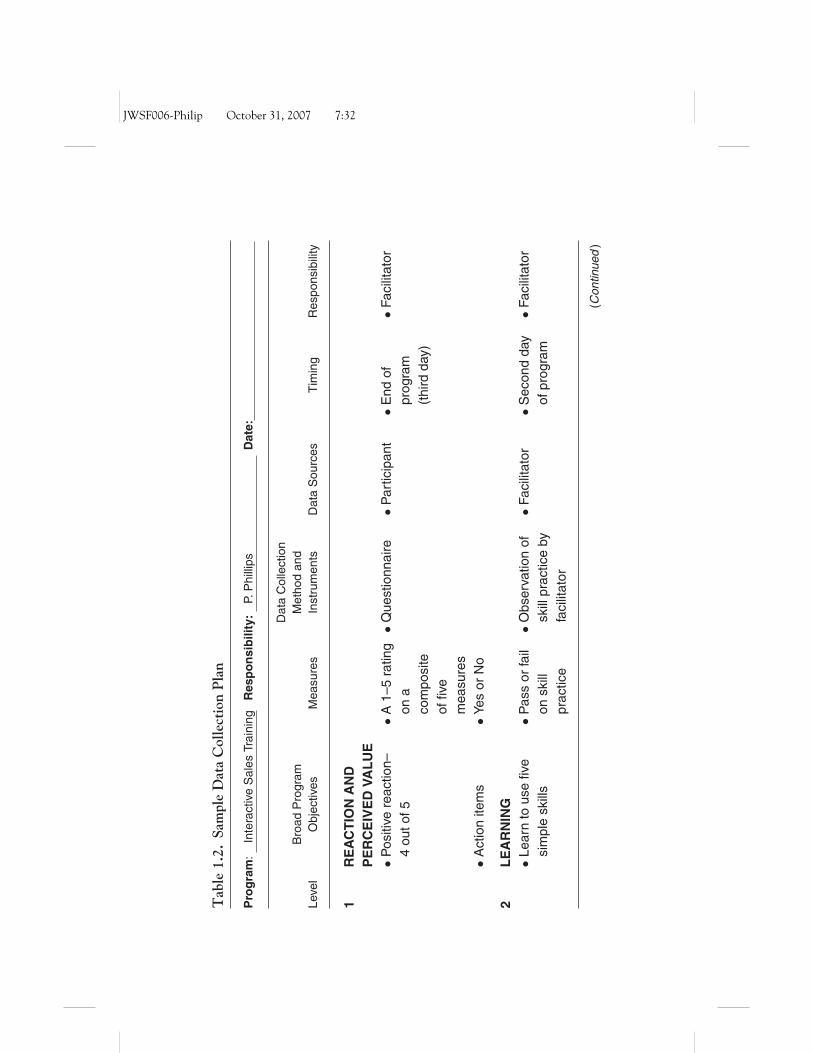
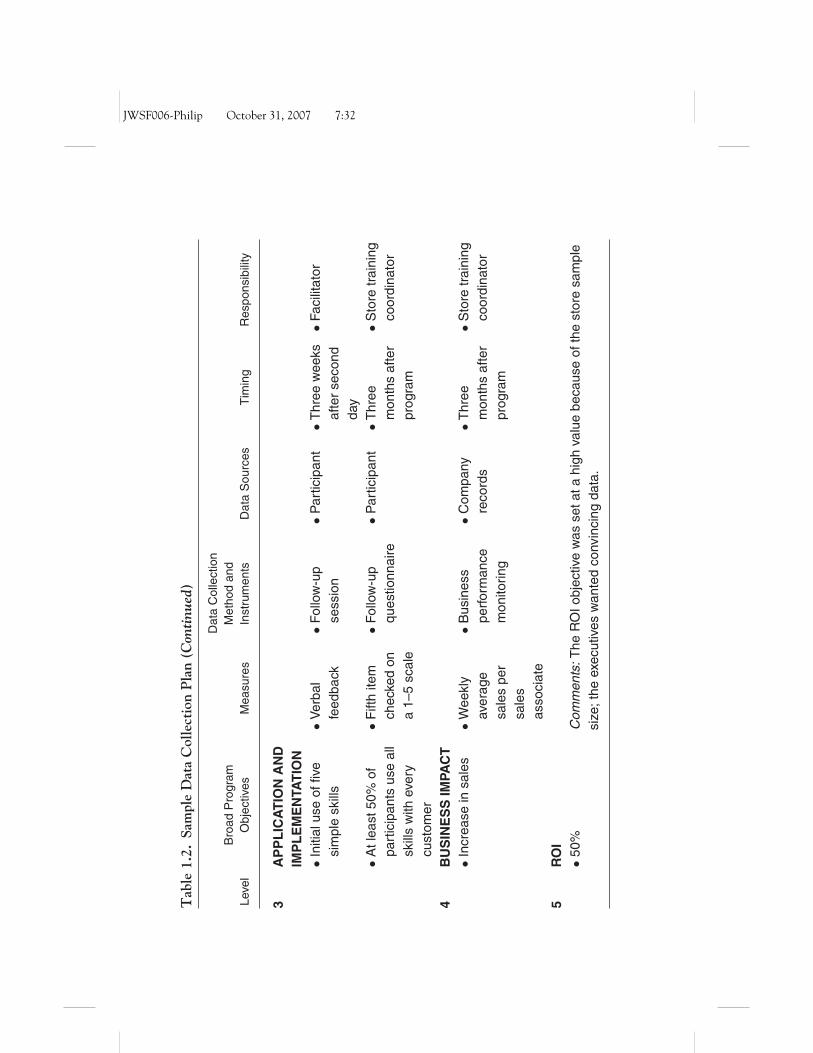
The data collection plan outlines the major elements and issuesinvolved in collecting data for evaluation at Levels 1 through 4. Atarget ROI (Level 5) is also established during planning. Table 1.2shows a completed data collection plan for a program on interactivesales skills. The three-day training program was designed for retailsales associates in the electronics department of a major store chain(Phillips and Phillips, 2001). An ROI calculation was planned fora pilot of three groups.
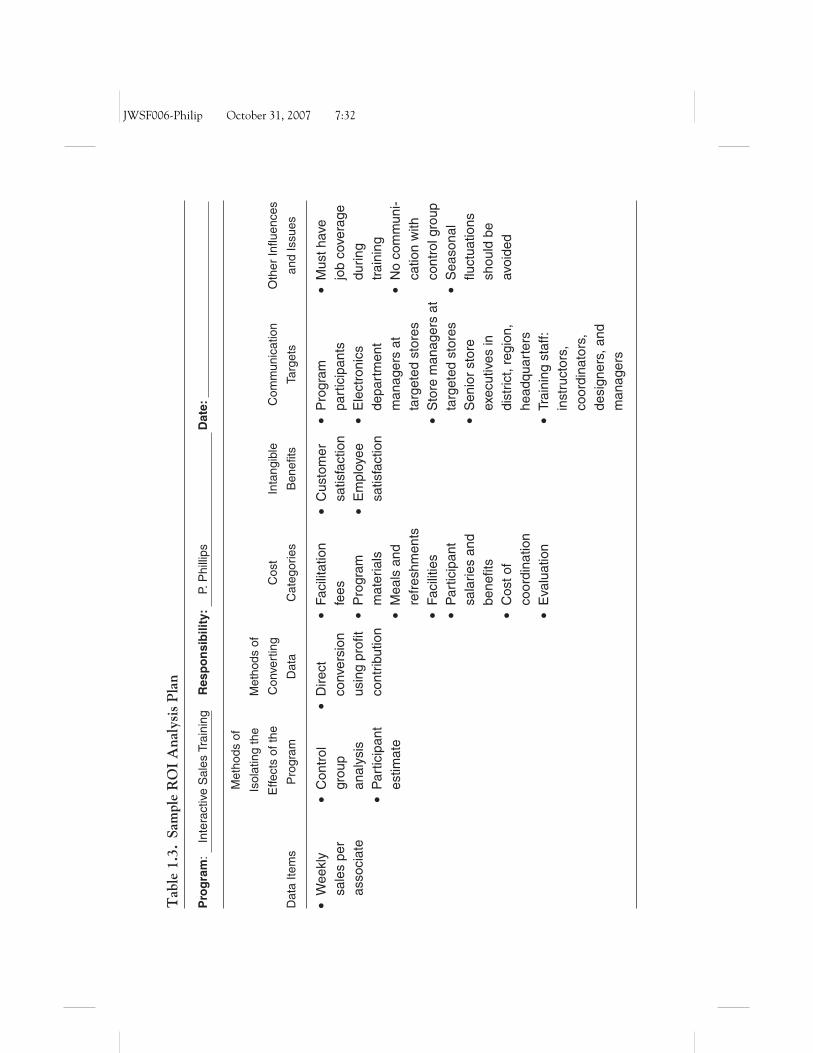
The ROI analysis plan is a continuation of the data collectionplan. It captures information on several key items that are necessaryto develop the actual ROI calculation, including techniques to iso-late the effects of the program as well as convert Level 4 measures tounits of money. Along with these elements, cost categories, intan-gible benefits, and communication targets are identified. Table 1.3shows a completed ROI analysis plan for the interactive sellingskills program.
JWSF006-Philip October 31, 2007 7:32
Tab
le1.
2.Sa
mpl
eD
ata
Col
lect
ion
Pla
n
Pro
gra
m:
Inte
ract
ive
Sal
esTr
aini
ngR
esp
on
sib
ility
:P.
Phi
llips
Dat
e:
Leve
lB
road
Pro
gram
Obj
ectiv
esM
easu
res
Dat
aC
olle
ctio
nM
etho
dan
dIn
stru
men
tsD
ata
Sou
rces
Tim
ing
Res
pons
ibili
ty
1R
EA
CT
ION
AN
DP
ER
CE
IVE
DVA
LU
E•P
ositi
vere
actio
n–4
outo
f5•A
1–5
ratin
gon
aco
mpo
site
offiv
em
easu
res
•Que
stio
nnai
re•P
artic
ipan
t•E
ndof
prog
ram
(thi
rdda
y)
•Fac
ilita
tor
•Act
ion
item
s•Y
esor
No
2L
EA
RN
ING
•Lea
rnto
use
five
sim
ple
skill
s•P
ass
orfa
ilon
skill
prac
tice
•Obs
erva
tion
ofsk
illpr
actic
eby
faci
litat
or
•Fac
ilita
tor
•Sec
ond
day
ofpr
ogra
m•F
acili
tato
r
(Con
tinue
d)
JWSF006-Philip October 31, 2007 7:32
Tab
le1.
2.Sa
mpl
eD
ata
Col
lect
ion
Pla
n(C
onti
nued
)
Leve
lB
road
Pro
gram
Obj
ectiv
esM
easu
res
Dat
aC
olle
ctio
nM
etho
dan
dIn
stru
men
tsD
ata
Sou
rces
Tim
ing
Res
pons
ibili
ty
3A
PP
LIC
AT
ION
AN
DIM
PL
EM
EN
TAT
ION
•Ini
tialu
seof
five
sim
ple
skill
s•V
erba
lfe
edba
ck•F
ollo
w-u
pse
ssio
n•P
artic
ipan
t•T
hree
wee
ksaf
ter
seco
ndda
y
•Fac
ilita
tor
•Atl
east
50%
ofpa
rtic
ipan
tsus
eal
lsk
ills
with
ever
ycu
stom
er
•Fift
hite
mch
ecke
don
a1–
5sc
ale
•Fol
low
-up
ques
tionn
aire
•Par
ticip
ant
•Thr
eem
onth
saf
ter
prog
ram
•Sto
retr
aini
ngco
ordi
nato
r
4B
US
INE
SS
IMPA
CT
•Inc
reas
ein
sale
s•W
eekl
yav
erag
esa
les
per
sale
sas
soci
ate
•Bus
ines
spe
rfor
man
cem
onito
ring
•Com
pany
reco
rds
•Thr
eem
onth
saf
ter
prog
ram
•Sto
retr
aini
ngco
ordi
nato
r
5R
OI
•50%
Com
men
ts:T
heR
OIo
bjec
tive
was
seta
tahi
ghva
lue
beca
use
ofth
est
ore
sam
ple
size
;the
exec
utiv
esw
ante
dco
nvin
cing
data
.
JWSF006-Philip October 31, 2007 7:32
Tab
le1.
3.Sa
mpl
eR
OI
Ana
lysi
sP
lan
Pro
gra
m:
Inte
ract
ive
Sal
esTr
aini
ngR
esp
on
sib
ility
:P.
Phi
llips
Dat
e:
Met
hods
of
Isol
atin
gth
eM
etho
dsof
Effe
cts
ofth
eC
onve
rtin
gC
ost
Inta
ngib
leC
omm
unic
atio
nO
ther
Influ
ence
s
Dat
aIte
ms
Pro
gram
Dat
aC
ateg
orie
sB
enefi
tsTa
rget
san
dIs
sues
�W
eekl
ysa
les
per
asso
ciat
e
�C
ontr
olgr
oup
anal
ysis
�P
artic
ipan
tes
timat
e
�D
irect
conv
ersi
onus
ing
profi
tco
ntrib
utio
n
�Fa
cilit
atio
nfe
es�
Pro
gram
mat
eria
ls�
Mea
lsan
dre
fres
hmen
ts�
Faci
litie
s�
Par
ticip
ant
sala
ries
and
bene
fits
�C
osto
fco
ordi
natio
n�
Eva
luat
ion
�C
usto
mer
satis
fact
ion
�E
mpl
oyee
satis
fact
ion
�P
rogr
ampa
rtic
ipan
ts�
Ele
ctro
nics
depa
rtm
ent
man
ager
sat
targ
eted
stor
es�
Sto
rem
anag
ers
atta
rget
edst
ores
�S
enio
rst
ore
exec
utiv
esin
dist
rict,
regi
on,
head
quar
ters
�Tr
aini
ngst
aff:
inst
ruct
ors,
coor
dina
tors
,de
sign
ers,
and
man
ager
s
�M
usth
ave
job
cove
rage
durin
gtr
aini
ng�
No
com
mun
i-ca
tion
with
cont
rolg
roup
�S
easo
nal
fluct
uatio
nssh
ould
beav
oide
d
JWSF006-Philip October 31, 2007 7:32
14 ROI FUNDAMENTALS
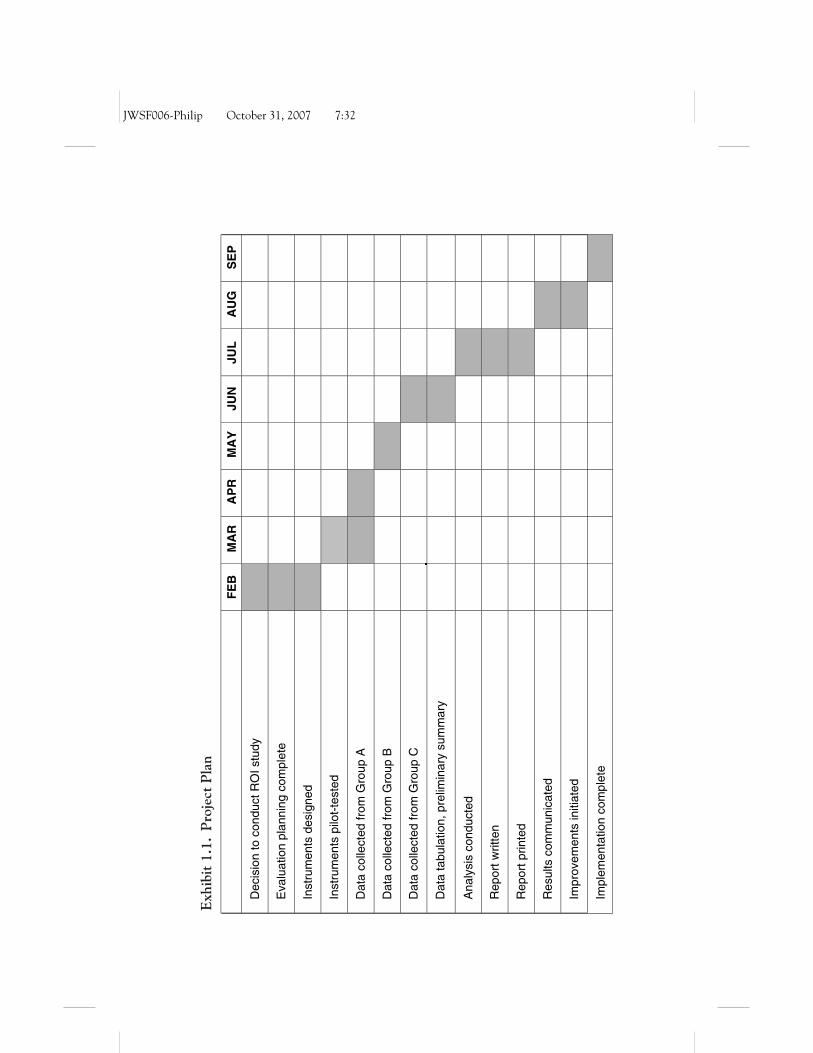
The third plan that is developed in the evaluation planningphase is a project plan, which provides a description of the programand a timeline for the project, from planning of the evaluation tocommunication of the results. Exhibit 1.1 shows a sample projectplan.
Collectively, these three planning documents provide the nec-essary direction for the ROI evaluation. Because most of the deci-sions about the evaluation process are made as these planning toolsare developed, the remainder of the project becomes a systematicprocess of implementing the plan. Time allocated to this processwill save precious time later.
Data Collection
Data collection is central to the ROI Methodology. Deciding howto collect the data, from whom to collect the data, and when tocollect the data is fundamental to a successful ROI study. Bothhard data (for example, output, quality, cost, and time data) andsoft data (for example, job satisfaction and customer satisfaction)are collected, using a variety of methods:
� Surveys are administered to determine whetherparticipants are satisfied with the program and to whatdegree, whether they have learned the desired skills andknowledge, and whether they have used various aspectsof the program. Survey responses usually consist ofperception or attitudinal data, often represented on ascale. Surveys are used to collect data at Levels 1, 2,and 3.
� Questionnaires are more detailed than surveys andcan be used to uncover a variety of quantitative andqualitative data. Participants provide responses to
JWSF006-Philip October 31, 2007 7:32
Exh
ibit
1.1.
Pro
ject
Pla
n
FE
BM
AR
AP
RM
AY
JUN
JUL
AU
GS
EP
Dec
isio
n to
con
duct
RO
I stu
dy
Eva
luat
ion
plan
ning
com
plet
e
Inst
rum
ents
des
igne
d
Inst
rum
ents
pilo
t-te
sted
Dat
a co
llect
ed fr
om G
roup
A
Dat
a co
llect
ed fr
om G
roup
B
Dat
a co
llect
ed fr
om G
roup
C
Dat
a ta
bula
tion,
pre
limin
ary
sum
mar
y
Ana
lysi
s co
nduc
ted
Rep
ort w
ritte
n
Rep
ort p
rinte
d
Res
ults
com
mun
icat
ed
Impr
ovem
ents
initi
ated
Impl
emen
tatio
n co
mpl
ete
JWSF006-Philip October 31, 2007 7:32
16 ROI FUNDAMENTALS
several types of open-ended and forced-responsequestions. Questionnaires can be used to capture data atLevels 1, 2, 3, and 4.
� Tests are conducted to measure changes in knowledgeand skills (Level 2). A wide variety of methods are used,ranging from formal (criterion-referenced tests,norm-referenced tests, performance tests, simulations,and skill practices) to informal (facilitator assessment,self-assessment, and team assessment).
� On-the-job observation captures actual skill applicationand use. Observations are particularly useful in customerservice training and are most effective when theobserver is unnoticeable to the participant beingobserved. Observations are appropriate for collectingLevel 3 data.
� Interviews are conducted with participants to determinethe extent to which learning has been used on the job.Interviewers can probe to uncover specific applications.Interviews are most often used for collecting Level 3data but can also be used to collect Level 1 and Level 2data. Occasionally, interviews are used to collect Level4 data.
� Focus groups are conducted to determine the degree towhich a group of participants has applied the program tojob situations. Focus groups are usually appropriate forcollecting Level 3 data, but are also used in making thelink between business impact and the program.
� Action plans and program assignments are developed byparticipants during the program and are implementedon the job after the program is completed. Follow-up onaction plans and program assignments provides
JWSF006-Philip October 31, 2007 7:32
A Brief Description of the ROI Methodology 17
evidence of program success. Level 3 and Level 4 datacan be collected using action plans.
� Performance contracts are developed by the participant,the participant’s supervisor, and the facilitator. They allagree on job performance outcomes from the program.Performance contracts are appropriate for collectingboth Level 3 and Level 4 data.
� Business performance monitoring is useful whenperformance records and operational data can beexamined for improvement. This method is particularlyuseful for collecting Level 4 data.
Along with selecting the appropriate data collection method,consideration must be given to the source of data, which is primarily(but not always exclusively) the participant. Timing is a third con-sideration. Fundamental timing considerations include the time atwhich data are needed, the availability of data, and the availabil-ity of resources. These issues are covered in more detail in DataCollection, the second book of this series.
Isolation of Program Effects
An issue that is overlooked in most evaluations is how to isolatethe effects of the program. In this step of the process, evaluationplanners explore specific techniques for determining the amountof impact directly related to the program. Because many factorswill affect performance data, this step is essential for increasing theaccuracy and credibility of ROI calculations. The following tech-niques have been used by organizations to address this importantissue.
� A control group arrangement is often used to isolate theimpact of a specific program. One group participates in
JWSF006-Philip October 31, 2007 7:32
18 ROI FUNDAMENTALS
the program, while another similar group (the controlgroup) does not participate. The difference in theperformance of the two groups is attributed to theprogram. When properly set up and implemented, thecontrol group arrangement is the most effective way toisolate the effects of a program or project.
� Trend lines are used to project the values of specificimpact measures before the program is undertaken. Theprojection is compared with the actual data after theprogram is conducted, and the difference represents anestimate of the impact of the program. Under certainconditions, this technique can accurately isolate theprogram impact.
� When mathematical relationships between input andoutput measures are known, a forecasting model can beused to isolate the effects of a program. The impactmeasure is predicted by using the forecasting model withpre-program data. The actual performance of the mea-sure, weeks or months after the program, is comparedwith the forecasted value. The results are an estimate ofthe impact.
� Participants estimate the amount of improvement that isrelated to the program. Participants are provided withthe total amount of improvement, based on a compari-son of pre- and post-program measurements, and areasked to indicate the percentage of the improvementthat is related to the program.
� Participants’ supervisors estimate the effect of the pro-gram on the impact measures. The supervisors are giventhe total amount of improvement and are asked toindicate the percentage that can be directly attributedto the program.
JWSF006-Philip October 31, 2007 7:32
A Brief Description of the ROI Methodology 19
� Senior management estimates the impact of the program.In such cases, managers provide an estimate of howmuch of the improvement is related to the program.Although it may be inaccurate, having senior manage-ment involved in the process has some advantages.
� Experts provide estimates of the program’s impact on theperformance measure. Because the estimates are basedon previous experience, the experts must be familiarwith the type of program and the specific situation.
� When feasible, all other influencing factors are identifiedand their impact is estimated or calculated; the remain-ing unexplained improvement is attributed to theprogram.
� In some situations, customers provide input on the ex-tent to which the program has influenced their decisionsto use a product or service. Although this strategy haslimited applications, it can be quite useful for isolatingthe effects of customer service and sales programs.
Collectively, these techniques provide a comprehensive set oftools to address the critical issue of isolating the effects of a program.The third book in this series, Isolation of Results, is devoted to thisimportant step in the ROI Methodology.
Data Conversion
To calculate the return on investment, Level 4 impact data areconverted to monetary values and compared with program costs.This step requires that a value be placed on each unit of dataconnected with the program. Many techniques for converting data
JWSF006-Philip October 31, 2007 7:32
20 ROI FUNDAMENTALS
to monetary values are available; which technique is appropriatedepends on the type of data and the situation.
� Output data are converted to profit contribution or costsavings. When using this technique, output increasesare converted to monetary values based on their unitcontribution to profit or the unit of cost reduction.Standard values for these items are readily available inmost organizations.
� The cost of quality is calculated, and quality improve-ments are converted directly to cost savings. Standardvalues for these items are available in manyorganizations.
� For programs in which employee time is saved, theparticipants’ wages and employee benefits are used todevelop a value for the time saved. Because a variety ofprograms focus on improving the time required tocomplete projects, processes, or daily activities, thevalue of time is an important issue. This is a standardformula in most organizations.
� Historical costs, developed from cost statements, are usedwhen they are available for a specific measure. Organi-zational cost data thus establish the specific monetarycosts saved or avoided by an improvement.
� When available, internal and external experts may be usedto estimate the value of an improvement. In this situa-tion, the credibility of the estimate hinges on theexpertise and reputation of the experts themselves.
� External databases are sometimes available to estimatethe value or cost of data items. Research, government,and industry databases can provide important informa-tion on these values. Although data are plentiful, the
JWSF006-Philip October 31, 2007 7:32
A Brief Description of the ROI Methodology 21
difficulty of this technique lies in finding a specificdatabase related to the program or situation.
� Participants estimate the value of the data item. For thisapproach to be effective, participants must be capable ofproviding a value for the improvement.
� Supervisors or managers can provide estimates if they areboth willing and able to assign values to the improve-ment. This approach is especially useful when the parti-cipants are not fully capable of providing this input or insituations in which supervisors need to confirm or adjustthe participants’ estimates. This approach is particularlyhelpful in establishing values for performance measuresthat are important to senior management.
� Soft measures are linked mathematically to other measuresthat are easier to measure and value. This approach isparticularly helpful in establishing values for measuresthat are very difficult to convert to monetary values—for example, data related to intangibles such as customersatisfaction, employee satisfaction, conflict, or employeecomplaints.
� Staff estimates may be used to determine a value for anoutput data item. The estimates must be provided on anunbiased basis.
The data conversion step is absolutely necessary in order todetermine the monetary benefits of a program. The process ischallenging, particularly when soft data are involved, but it canbe accomplished by methodically using one or more of the listedtechniques. Because of the importance of assigning monetary valuesto impact data, the fourth book in this series, Data Conversion, isdevoted to this step in the ROI Methodology, along with identify-ing intangible benefits.
JWSF006-Philip October 31, 2007 7:32
22 ROI FUNDAMENTALS
Intangible Benefits
In addition to their tangible monetary benefits, most programswill have intangible nonmonetary benefits. The ROI calculation isbased on converting both hard and soft data to monetary values.Intangible benefits are program benefits that individuals choose notto convert to monetary values. Intangible benefits often includesuch measures as
� Increased job satisfaction
� Increased employee engagement
� Improved teamwork
� Improved creativity
� Reduced complaints
� Reduced conflicts
During data analysis, every attempt is made to convert all datato monetary values. All hard data, such as those related to out-put, quality, and time, are converted to monetary values. Theconversion of soft data is attempted for each data item. How-ever, if the process used for conversion is too subjective or in-accurate, the resulting values lose credibility; in such cases, thedata are listed as an intangible benefit, with an appropriate expla-nation. For some programs, intangible nonmonetary benefits areextremely valuable, carrying as much influence as the hard dataitems.
Program Costs
The second part of a benefit-cost analysis is the program costs.Tabulating costs involves monitoring or developing all the related
JWSF006-Philip October 31, 2007 7:32
A Brief Description of the ROI Methodology 23
costs of the program targeted for ROI evaluation. Among the costcomponents that should be included are
� The cost of the needs assessment (when conducted)prorated over the program’s expected life
� The cost of designing and developing the program,possibly prorated over the program’s expected life
� The cost of all program materials provided to eachparticipant
� The cost of the instructor or facilitator, includingpreparation time as well as delivery time
� The cost of the facilities
� Travel, lodging, and meal costs of the participants, ifapplicable
� Salaries and employee benefits of the participants forthe time that they are involved in the program
� Administrative and overhead costs of the functionalunit, allocated in some convenient way
In addition, specific costs related to the needs assessment andevaluation should be included. The conservative approach is toinclude all these costs so that the total is fully loaded. Becauseof the importance of ascertaining program costs, the fifth book inthe series, Costs and ROI, is devoted to this step, along with ROIcalculation.
Return on Investment Calculation
The benefit-cost ratio (BCR) is calculated from the program bene-fits and costs. The benefit-cost ratio is the program benefits divided
JWSF006-Philip October 31, 2007 7:32
24 ROI FUNDAMENTALS
by the program costs. In formula form, it is written like this:
BCR = Program BenefitsProgram Costs
The ROI for a program is the program’s net benefits divided bythe program’s costs. (Net benefits are the program’s benefits minusthe program’s costs.) Thus, in formula form, ROI is as follows:
ROI (%) = Net Program BenefitsProgram Costs
× 100
This is the same basic formula that is used in evaluating otherinvestments, in which ROI is traditionally reported as earningsdivided by investment. The fifth book in our series, Costs and ROI,provides more detail on ROI calculations.
Reporting
The final step in the ROI Methodology is reporting. Reporting oftendoes not receive the attention and planning that is needed to ensureits success. This step involves developing appropriate informationin impact studies and other brief reports. The heart of the step isthe different techniques used to communicate to a wide varietyof target audiences. In most ROI studies, several audiences areinterested in and need the information. Careful planning in order tomatch the communication method with the audience is essential, toensure that the message is understood and that appropriate actionsfollow. The sixth book in the ROI Six Pack, Communication andImplementation, is devoted to this critical step.
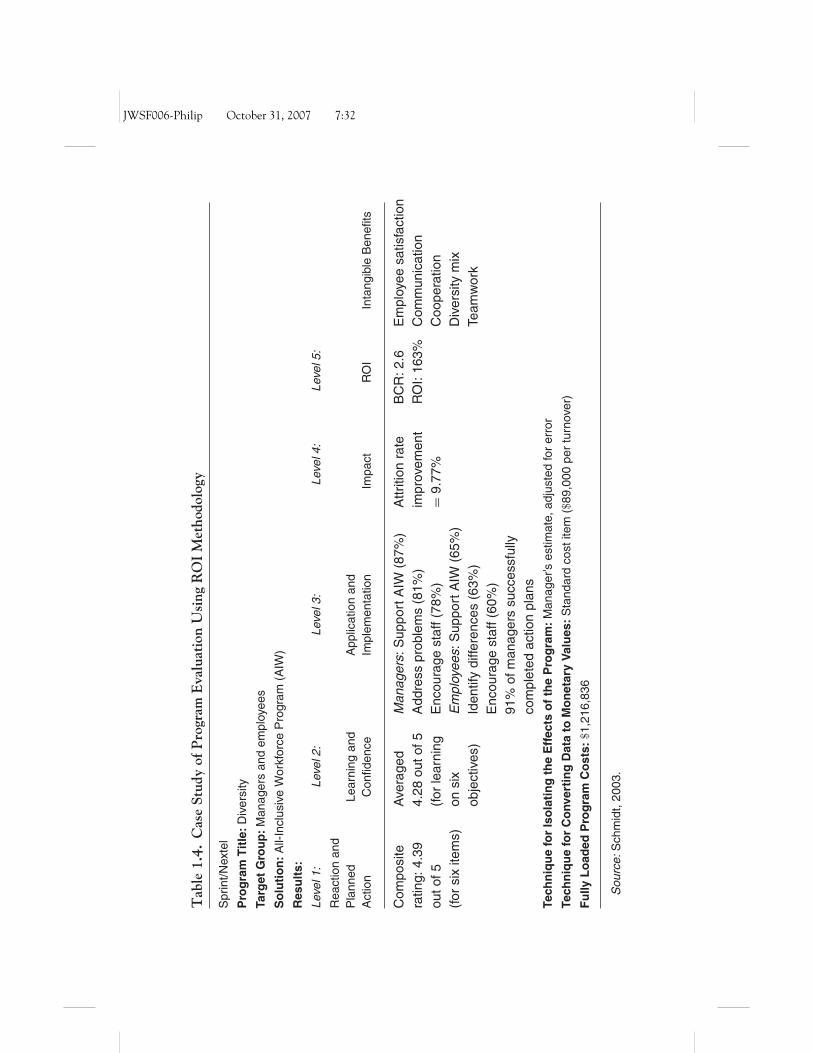
Case Study
Table 1.4 shows the results from a sample case study. The table in-cludes all the elements described in this chapter. The All-InclusiveWorkforce Program explored diversity issues and targeted both
JWSF006-Philip October 31, 2007 7:32
Tab
le1.
4.C
ase
Stud
yof
Pro
gram
Eva
luat
ion
Usi
ngR
OI
Met
hodo
logy
Spr
int/N
exte
l
Pro
gra
mT
itle
:D
iver
sity
Targ
etG
rou
p:
Man
ager
san
dem
ploy
ees
So
luti
on
:A
ll-In
clus
ive
Wor
kfor
ceP
rogr
am(A
IW)
Res
ult
s:
Leve
l1:
Leve
l2:
Leve
l3:
Leve
l4:
Leve
l5:
Rea
ctio
nan
dP
lann
edA
ctio
nLe
arni
ngan
dC
onfid
ence
App
licat
ion
and
Impl
emen
tatio
nIm
pact
RO
IIn
tang
ible
Ben
efits
Com
posi
tera
ting:
4.39
outo
f5(f
orsi
xite
ms)
Ave
rage
d4.
28ou
tof5
(for
lear
ning
onsi
xob
ject
ives
)
Man
ager
s:S
uppo
rtA
IW(8
7%)
Add
ress
prob
lem
s(8
1%)
Enc
oura
gest
aff(
78%
)E
mpl
oyee
s:S
uppo
rtA
IW(6
5%)
Iden
tify
diffe
renc
es(6
3%)
Enc
oura
gest
aff(
60%
)91
%of
man
ager
ssu
cces
sful
lyco
mpl
eted
actio
npl
ans
Attr
ition
rate
impr
ovem
ent
=9.
77%
BC
R:2
.6R
OI:
163%
Em
ploy
eesa
tisfa
ctio
nC
omm
unic
atio
nC
oope
ratio
nD
iver
sity
mix
Team
wor
k
Tech
niq
ue
for
Iso
lati
ng
the
Eff
ects
of
the
Pro
gra
m:
Man
ager
’ses
timat
e,ad
just
edfo
rer
ror
Tech
niq
ue
for
Co
nver
tin
gD
ata
toM
on
etar
yV
alu
es:
Sta
ndar
dco
stite
m($
89,0
00pe
rtu
rnov
er)
Fu
llyL
oad
edP
rog
ram
Co
sts:
$1,2
16,8
36
Sou
rce:
Sch
mid
t,20
03.
JWSF006-Philip October 31, 2007 7:32
26 ROI FUNDAMENTALS
managers and employees. All six types of data were collected,including the actual ROI. This summary shows all the types ofdata and also addresses the issues of isolating the effects of the pro-gram, converting the data to monetary values, and monitoring theprogram costs.
Final Thoughts
This chapter presents the basic process for calculating the return oninvestment for programs or projects. The step-by-step process breaksthe complicated problem of calculating ROI into simple, man-ageable tasks and steps. When the process is thoroughly planned,taking into consideration all potential strategies and techniques, itbecomes manageable and achievable. The remaining chapters focuson the major elements of this model and on ways to implement it.
References
Phillips, J. J. The Corporate University: Measuring the Impact of Learning. Houston,Tex.: American Productivity and Quality Center, 2000.
Phillips, P. P., and Phillips, J. J. In Action: Measuring Return on Investment. Vol. 3.Alexandria, Va.: ASTD, 2001. (See the chapter titled “Measuring Returnon Investment in Interactive Sales Training.”)
Schmidt, L. In Action: Implementing Training Scorecards. Alexandria, Va.: ASTD,2003.
Van Buren, M. E. State of the Industry. Alexandria, Va.: ASTD, 2002.