Embed Size (px)
Citation preview
1
Rockwell Hardness Testing of Steel Reinforcing Bar to Obtain Estimates of Tensile Strength
Tanner M. Robinson, Matthew T. Kalensky, Alexander M. Stanzel, Nicholas J. Gordon, and
Wayne L. Elban Department of Engineering Loyola University Maryland Baltimore, Maryland 21210
COPYRIGHT: Edmonds Community College 2016 This material may be used and reproduced for non-commercial educational purposes only. This module provided by MatEdU, the National Resource Center for Materials Technology Education, www.materialseducation.org. ABSTRACT: A procedure is described for performing Rockwell hardness testing of steel bar used for concrete reinforcement to obtain estimates of tensile strength. Analysis of the measurements was performed to assess the variation in hardness that exists in the bar. An estimate of its corresponding tensile strength resulted using a strength-hardness correlation available in the literature. Data analysis was accomplished using a spreadsheet and its plotting capability. As an optional activity, estimates of the yield strength can also be acquired using an empirical relationship between hardness and yield strength appearing in the literature. KEY WORDS: Rockwell hardness, steel reinforcing bar (rebar), mechanical property correlations, tensile strength, yield strength PREREQUISITE KNOWLEDGE: Junior/senior-level undergraduate laboratory experiment requiring knowledge of mechanical properties as described in an introductory materials science course and accompanying laboratory course together with a follow-on course on this materials science topic. OBJECTIVES: (a) Experimental Goals:
1. To perform a calibration of a Rockwell hardness tester using a standard test block; and
2. To measure the Rockwell hardness of a steel reinforcing bar, a widely used construction material.
(b) Learning Goals:
1. To be able to perform Rockwell hardness testing, a prominent technique for characterizing the mechanical response of materials, and to analyze and interpret the resultant hardness values;
2
2. To be able to obtain estimates of tensile strength using the hardness measurements; and
3. (Optional) To be able to acquire estimates of yield strength using the hardness measurements.
TYPE OF MODULE: Laboratory experiment
TIME REQUIRED: Hardness testing takes no more than 30 minutes; see Instructor Note 1.
MODULE LEVEL: Intermediate undergraduate
MatEdU CORE COMPETENCIES COVERED:
0.A Demonstrate good communication skills 0.B Prepare tests and analyze data 1.C Demonstrate laboratory skills 2.B Demonstrate proper use of units and conversions (for Optional activity) 3.A Practice appropriate computer skills and uses 3.B Demonstrate use of computer applications 4.A Demonstrate effective work with teams 8.A Demonstrate the planning and execution of materials experiments 8.B Apply mechanical testing processes to solid materials 8.E Perform appropriate tests of metallic materials
TABLE OF CONTENTS
Abstract 1 Objectives 1 Module data 2 MatEd core competencies covered 2 Materials and equipment required 2 Introduction 3 Module procedure 5 Comments 7 Instructor notes 8 References 10 Material sources 12 Acknowledgements 12 About the authors 13 Tables and Figures 15 Appendix A 20
Evaluation packet 23 EQUIPMENT AND MATERIALS: (1) Instron Wilson Rockwell hardness tester (model R2000) equipped with a 1/16 in. steel ball indenter; (2) Rockwell test standard (Wilson block serial no. 90041481; B scale hardness, HRB = 79.4 ± 1.0); (3) two or four steel reinforcement bar specimens (variable diameter depending on rebar designation and nominally 1/2 in. long); (4) Wilson (Hardness) Conversion Chart 60.
3
SAFETY PRECAUTIONS: No particular safety precautions are necessary. However, care must be taken to avoid moving the sample once the hardness tester commences its operating cycle. Sectioned samples, although deburred, may have sharp circumferential edges requiring careful handling to avoid fingers being cut. INTRODUCTION: General Background: Indentation hardness testing is a commonly used characterization technique to acquire information about the mechanical behavior of materials. Two basic methodologies have been developed that involve applying a constant load to an indenter of given shape such as ball, cone, or pyramid. One approach involves optically measuring a characteristic dimension of the resultant (plastic) impression once the indenter is removed. This measurement allows calculation of a hardness pressure by dividing the applied load by either a contact area (Brinell or Vickers hardness test) or projected area (Meyer or Knoop hardness test). The second approach was developed by S.P. Rockwell. A direct reading appears on an analog or digital display based on the measured change in penetration depth during a test cycle in which a preliminary force (minor load) followed by a total force (major load) is applied, both for fixed dwell times. The Rockwell test was chosen in this work because it is simple to conduct and provides reliable results when certain “best practices” [1,2] are carefully followed. Correlating hardness with mechanical properties determined from analyzing the stress-strain curve obtained from performing a uniaxial tensile test has been a topic of considerable interest. This is the case because hardness testing set-up and operation are much simpler and specimens of irregular size and shape can be readily characterized. It is widely used as a quality control tool for as-manufactured parts, something that is usually impossible with tensile testing due to its prescriptive sample geometry and dimension requirements. Correlating hardness with tensile strength, a readily identifiable feature on an engineering stress – engineering strain curve, is generally considered to be most reliable; their relationship has been established experimentally by obtaining hardness and tensile strength results on the same materials. Correlating hardness with yield strength has also been investigated, but this relationship has higher uncertainty because an empirical numerical constant typically taken to be 3 is used to relate the two material properties [3]. Concrete is widely regarded as an affordable material that exhibits good mechanical properties when subjected to compressive loads. However in tension, concrete is seen to have roughly 1/10th the load bearing capacity compared to when tested in compression. In hopes of expanding upon the variety of possible applications of concrete, efforts have been made to improve the properties of concrete in tension. A metal component was incorporated in a concrete matrix in order to create a material with overall better mechanical properties and specifically to lessen the undesirable fault regarding concrete's limited ability to withstand tensile loads. The metal component used in this reinforced concrete is known as reinforcing bar (rebar) and is typically a form of low carbon steel. It is understood that steel has markedly better tensile load bearing capabilities than concrete. Additionally, rebar and concrete have similar coefficients of thermal expansion and easily bond together. Therefore, temperature changes do not lead to catastrophic failures due to different thermal expansions of the two materials. Since these two materials are deemed to be compatible, the idea behind reinforced concrete is that the
4
rebar will improve the mechanical properties of the resulting material. Rebar is typically made by hot rolling steel billets into rod-shaped material that has been shaped to have ridges with various geometric designs on the exterior longitudinal surface. (Instructor Note 2) Problem Statement (Instructor Note 3): You have recently been hired as an engineer by a materials testing and consulting firm. The company president is intrigued by a recent article on tensile testing steel concrete reinforcing bar (rebar) [4]. Recognizing the projected growth in new construction over the next decade and the increasing awareness of the nation’s deteriorating infrastructure, particularly roads and bridges, a decision was made to launch a program to investigate the mechanical properties of rebar obtained from various places, both new coming from numerous domestic and foreign sources and recovered from several existing structures. Your part of the program involves an initial screening of materials received for tensile testing by performing Rockwell hardness testing on the sample provided to accomplish four (4) primary outcomes:
(a) Assessment of hardness uniformity throughout bar cross-sectional area; (b) Estimation of the tensile strength (TS) of the rebar using the measured Rockwell hardness values; (c) Assessment whether it is possible for the rebar to be ASTM A36 steel as some suppliers have claimed, based on the TS determined. (Obviously, more characterization such as chemical analysis would be needed to substantiate your conclusion.); and (d) Assessment of rebar classification using the ASTM A615 product standard with the same Item (c) disclaimer above and assuming the rebar being tested meets all other requirements appearing in the specification.
Schedule: Pre-lab class Special laboratory problem introduced accompanied with preliminary instructions (15 minutes)
Note your team number for pre-established three- or four-member teams posted on the Internet (Moodle). (Instructor Note 1)
Homework: Read References [4] and [5]
Class #1 First half of the teams: 25 minutes in Materials Lab; receive rebar specimens.
(Instructor Note 4)
Second half of the teams: 25 minutes in Materials Lab; receive rebar specimens. (Instructor Note 4)
(1) Receive instruction on using Rockwell hardness tester. (2) Perform hardness testing on calibration block as a test example.
5
(3) Discuss performing hardness testing on rebar specimens provided (actual access time(s) to tester scheduled using a sign-up sheet to accommodate all of the teams during the week).
Homework: Read References [2] and [6] (background reading on Rockwell hardness testing issues).
Class #2 (1) Enter Rockwell B scale hardness and tensile strength data appearing in Table
6 (Reference [5]) or alternatively in Wilson (Instron) Desk Chart 60 [7], for soft steel, gray and malleable cast iron and most non-ferrous metals, into Excel (or equivalent) and plot tensile strength as a function of Rockwell hardness and obtain an appropriate trend line for the data with accompanying R2 value. (2) Perform internet research on the following topics: (a) rebar: how it is made, compositions, and mechanical properties;
(b) ASTM A36 steel standard: mechanical properties and possible accounts of it being used in rebar; and (c) ASTM A615 steel rebar standard: grade classifications and corresponding mechanical properties.
Homework: Read References [8] and [9] (background reading on rebar).
Class #3 (1) Complete remaining testing and complete data analysis.
(2) Discuss the results and draw technical conclusions as a team. (3) Prepare outline of written report and delegate work among team members.
Post-lab class Submit group (team) written report. PROCEDURE: A. EXPERIMENTAL 1. Rockwell hardness testing Before commencing sample testing, it is necessary to verify that the hardness tester is working properly. (Instructor Note 5) The objective of this work is to perform Rockwell hardness testing on the cross-sections of the provided steel rebar specimens using an Instron Wilson Rockwell R2000 tester. Record measurements and any relevant observations with appropriate drawings.
(1) Perform a calibration measurement on a standard Rockwell B scale test block placed on the flat anvil of the tester such that the surface to be indented is orthogonal to the indenter axis. If the measurement lies outside the specified range (In this case, HRB = 79.4 ± 1.0.), repeat the measurement since properly seating the block can be an issue.
6
(2) Obtain a series of typically four to six hardness measurements on the cross-sectional areas of each of two (2) or four (4) specimens. (Instructor Note 4)
B. ANALYSIS Perform the following analyses and respond to any questions as completely as possible being sure to show all of your work and reasoning as partial credit can be earned. 1. Rockwell hardness measurements to obtain tensile strength estimates
a. Compute the average and standard deviation for the hardness measurements obtained for each specimen. Discuss and compare the uniformity in hardness of each specimen.
b. Using Excel (or equivalent), create a properly labeled plot of tensile
strength, ksi, versus Rockwell (B scale) hardness (HRB) given in References [5,7]. Obtain the appropriate trend line equation with R2 value and discuss the trend that exists.
c. Using Excel (or equivalent), determine the estimated tensile strength for
each rebar specimen utilizing the equation for the trend line in the plot prepared for Item 1.b.
d. Using the estimated tensile strength values, assess whether the rebar
sample could possibly be A36 steel [10]. e. Using the estimated tensile strength values, classify the rebar sample using
the A615 product standard [11]. 2. (Optional) Rockwell hardness measurements to obtain yield strength estimates
a. Using Excel (or equivalent), create a properly labeled plot of Brinell hardness (HB) determined using a 500 kgf load and a 10 mm ball as a function of Rockwell (B scale) hardness (HRB) obtained for soft steel, gray and malleable cast iron and most non-ferrous metals as given in Wilson (Instron) Desk Chart 60 [7]. Obtain the trend line equation with R2 value and discuss the trend that exists.
b. Using Excel (or equivalent), determine the corresponding HB value (using
the equation for the trend line in the plot prepared for Item 2.a) for each rebar specimen.
c. Convert the HB value to a Meyer hardness (HM) value using HM = 4P/πdp
2, (1)
7
where P is the applied load (500 kg) on the indenter, and dp is the diameter of the projected circular area of the indentation. The quantity dp
2 is determined from the equation used to calculate HB
HB = 2P/{πD[D – (D2 – dp
2)0.5]}, (2) where D is the ball diameter (10 mm). d. Determine corresponding estimates of yield strength, σy, for the HM
values for each rebar specimen using the empirical relationship HM = cσy, (3) where the constant c is approximately 3 for mild steel when HM and σ have the same units, say kgf/mm2.[3] (Instructor Note 6) To be consistent with the units of tensile strength, report yield strength in units of ksi. (Instructor Note 7)
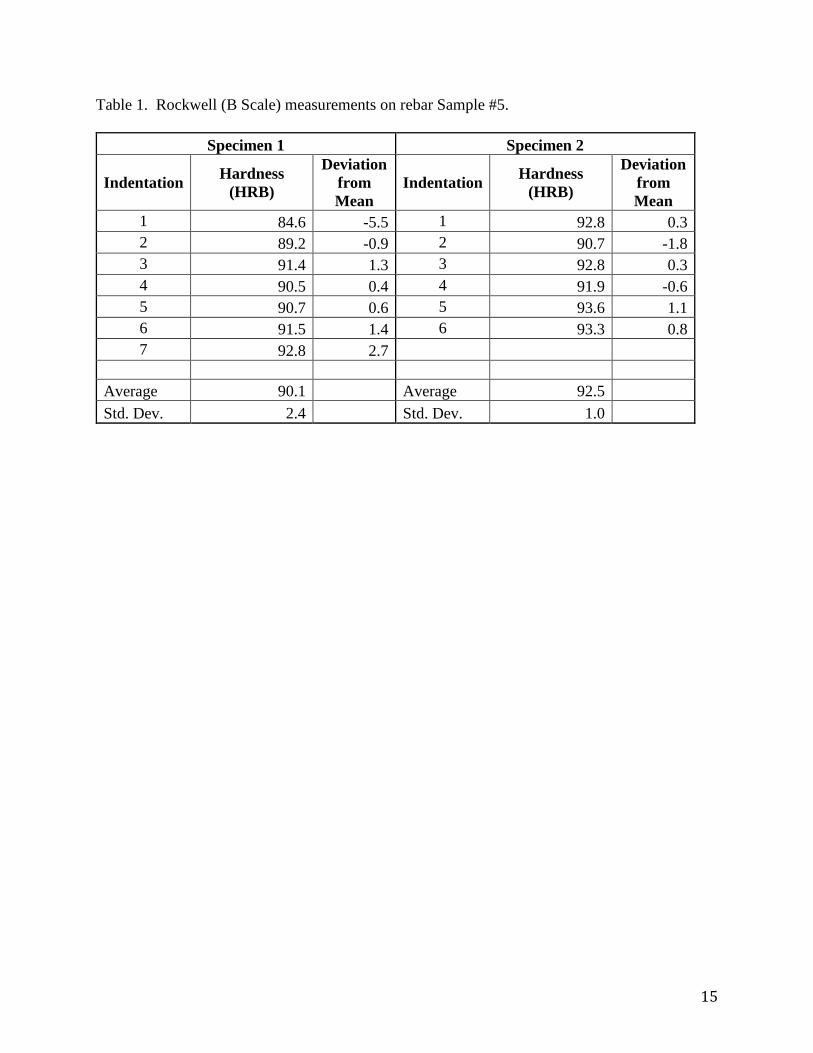
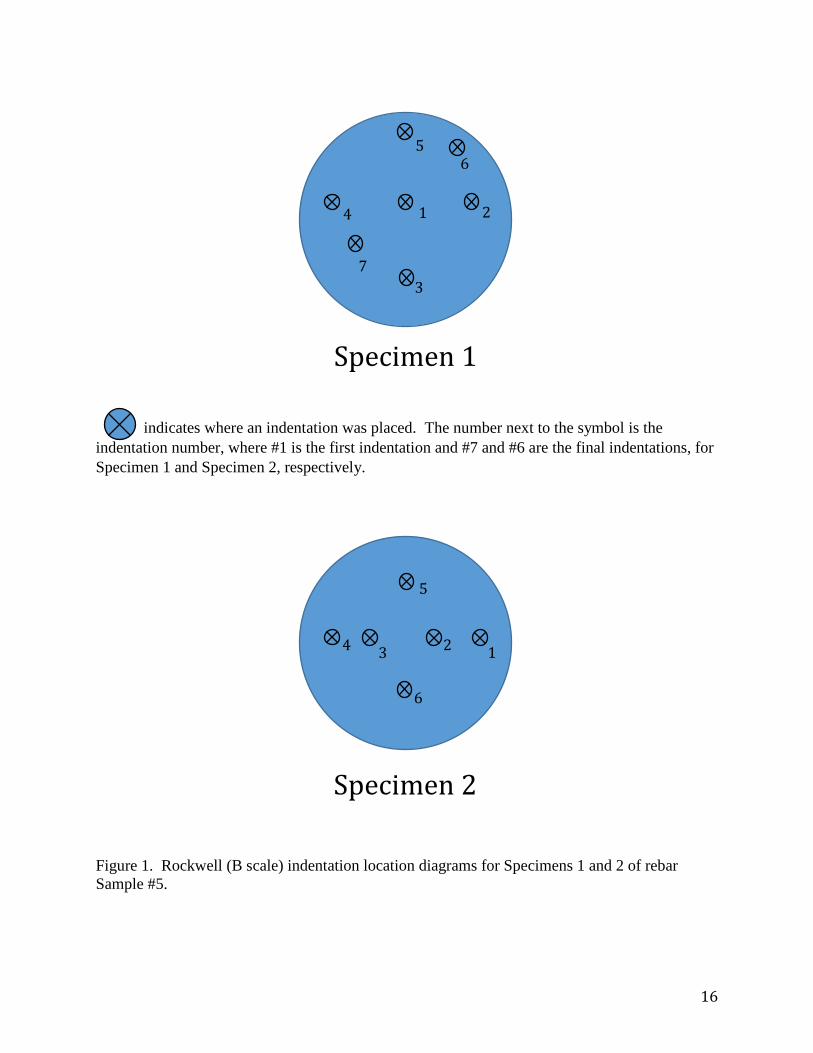
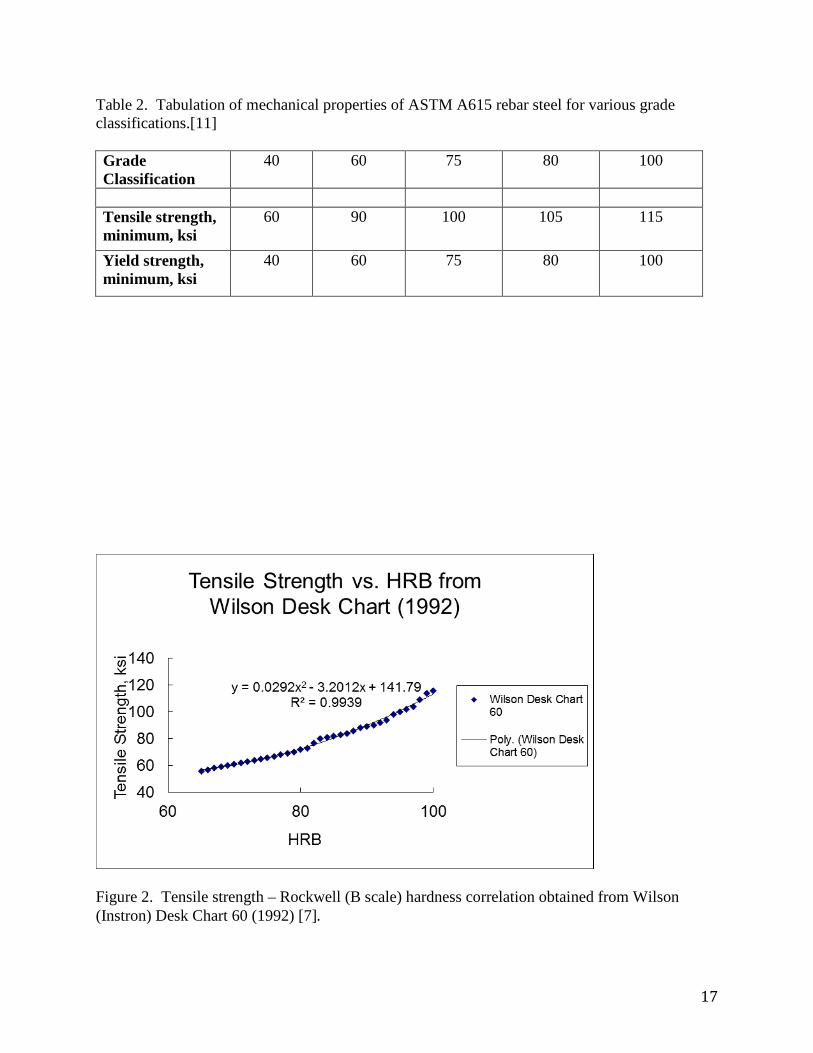
COMMENTS with Sample Data and Plots: Multiple experimental measurements were obtained to verify the results. A complete data set for all of the rebar samples acquired (Appendix A, Table A1) was obtained by one of the authors (WLE) and appears in Appendix A, Tables A2 and A3. The data appearing in the section below are considered to be representative. Rockwell hardness testing: Table 1 presents the hardness readings obtained for the two specimens of Rebar Designation (Sample) #5 (bar size #4) as well as the variation in the data. Specimen 1 was subjected to seven hardness tests yielding an average value of 90.1. Specimen 2 was subjected to six hardness tests resulting in a higher average hardness of 92.5. Both of these values compare very favorably with the value for the same sample appearing in Appendix, Table A2. The placement of the indentations on both specimens can be seen in the diagrams in Figure 1. In analyzing the standard deviation associated with the data for the two specimens, it can be seen that Specimen 1 exhibited significantly more scatter in the measurements than that for Specimen 2 with standard deviations of 2.7 and 1.1, respectively, being calculated. However, much of the explanation for the larger standard deviation of Specimen 1 is associated with a single significantly lower reading (5.5 less than the average hardness) obtained in the middle of the cross-section compared with the rest of the measurements. If this outlier is omitted, the average and standard deviation values would be 91.0 and 1.2, respectively. With the exception of the aforementioned center reading for Specimen #1, the hardness of the rebar sample appears to be reasonably uniform as indicated by the relatively small recalculated standard deviation. Tensile strength estimation: Figure 2 is a plot of tensile strength as a function of Rockwell (B scale) hardness for the tabulated data appearing both in References [5,7]. The curve is non-linear and not particularly smoothly varying for the upper portion. Using the trend line relationship obtained for the complete data set for this correlation, estimates for tensile strength values of
8
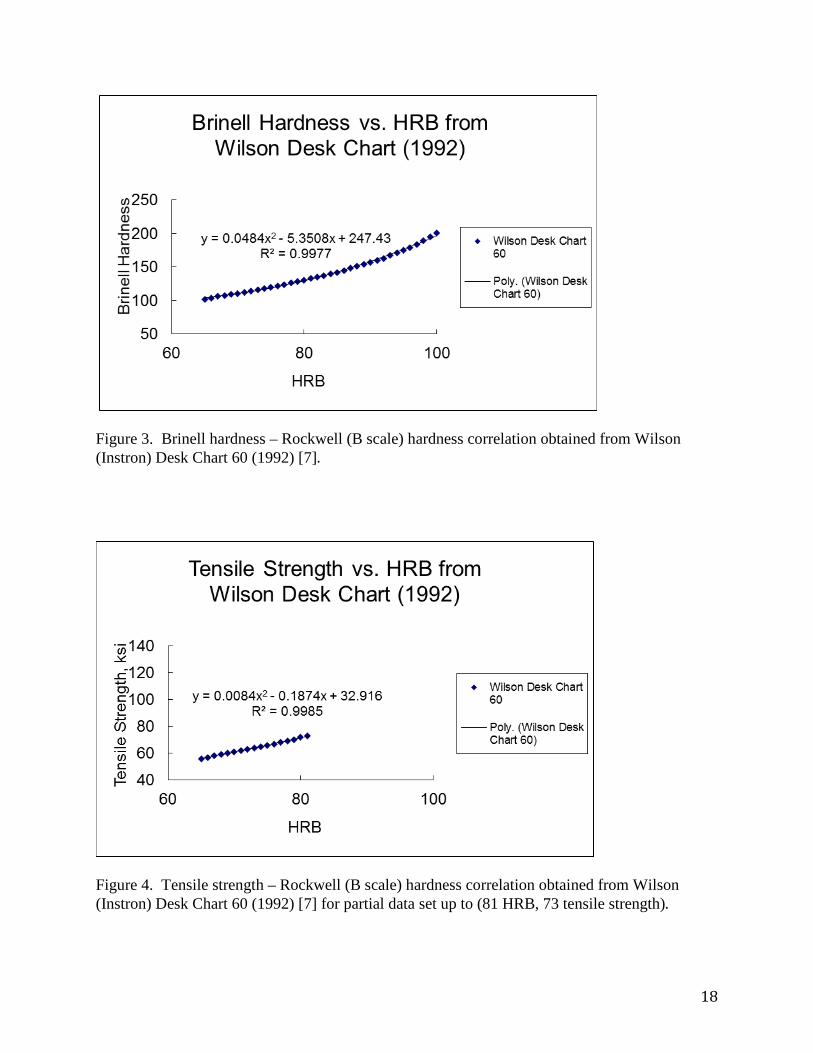
90.4 and 95.5 ksi were obtained for Specimen 1 and 2, respectively. (Instructor Note 8) Strength estimates obtained by tabular interpolation were similar: 89.1 and 93.0 ksi. The tensile strength of A36 steel appearing in the literature [10] is reported as a range from 58.0 to 79.8 ksi, which is well below the estimates obtained in this work. Judging from the values appearing in Table 2 taken from reference [11], the rebar tested, if in fact ASTM A615 steel, would be classified as Grade 60 having a minimum tensile strength of 90 ksi. Uncertainty analysis/sources of error: A single calibration measurement (78.8 HRB) was found to be within the calibration block’s specified range of 79.4 ± 1.0 HRB, indicating the hardness tester was operating properly. Care was taken to ensure that the locations on the specimens chosen for testing were not too close together. However, the large negative deviation in the first measurement on Specimen 1 from its mean hardness value indicates there may be some other problem with the measurement; alternatively the center may simply have been softer. The largest source of error was not having the top and bottom surfaces of the specimens being exactly parallel and highly flat across the entire cross-section. To mitigate this, the surface with the greatest stability (least or no amount of rocking when manipulated) was set face down on the anvil of the tester. Yield strength estimation (Optional): Figure 3 provides a plot of Brinell hardness as a function of Rockwell (B scale) hardness for the tabulated data, also available in References [5,7]. The curve is non-linear and smoothly varying. From the given trend line for the data, Brinell hardness values of 158.2 and 166.6 kgf/mm2 were obtained for Specimen 1 and Specimen 2, respectively. The corresponding Meyer hardness values were very similar: 159.8 and 168.2 kgf/mm2, respectively, resulting in estimated yield strengths of 75.8 and 79.7 ksi. (Instructor Note 7) Taking these values into account does not change ASTM A615 Grade 60 classification arrived at above. (Instructor Note 9) The tensile strength/yield strength ratios were calculated to be 1.19 and 1.20 for Specimen 1 and Specimen 2, respectively. It should be noted that these ratios are somewhat lower than the range (1.31 to 1.5) specified in ASTM A615 [11] which may indicate that the approach used to determine yield strength provides an overestimation or that the sample is not A615 steel. INSTRUCTOR NOTES: 1. Three 50-minute periods held on consecutive class days are set aside to work on the various aspects of this problem while accommodating a class of 25 students which was divided into eight teams of three or four members each. The obtainment of actual hardness measurements necessary in this experiment can be accomplished in no more than 30 min. Analysis and interpretation of hardness results were performed outside of class, although there was sufficient time in the scheduled lab time to begin this process. 2. Cold-rolled rebar is available commercially [12], and its distinctive properties and potential applications have been described [13]. The reviewer suggested trying to develop a procedure to distinguish between hot-rolled and cold-rolled rebar as an enhancement to the current experiment.
9
3. The current hardness experiment relates to several previous years’ NEW papers [14-18] and MatEdU modules [19-22] on various aspects of hardness testing. 4. A sizable selection of rebar samples (19 total) were gathered from a variety of sources having bar sizes ranging from #3 to #8 (Appendix A, Table A1); teams were provided specimens from a subset of available samples. For bar size #3, four 0.5 in. long specimens were supplied having a two-flute end mill finish on the top and bottom surfaces; each specimen was subsequently deburred with a hand file. For bar sizes #4 and greater, two 0.5 in. long specimens in the same condition were provided. 5. Tester verification is accomplished using a test block which in this work appears to be a brass material having a highly polished top surface and parallel bottom surface. Such standard reference blocks are available from the manufacturer of the tester and have a certified hardness specified with an upper/lower variation. Obtaining a hardness reading within the permitted range of values for the block indicates that the tester is working properly, and students can proceed testing specimens with confidence. However if a large number of measurements are being obtained, it is desirable to perform periodic additional calibration checks. 6. Alternatively, Rowe [23] offers a simpler approach that relates Brinell hardness directly to yield strength:
HB = cσy, (4)
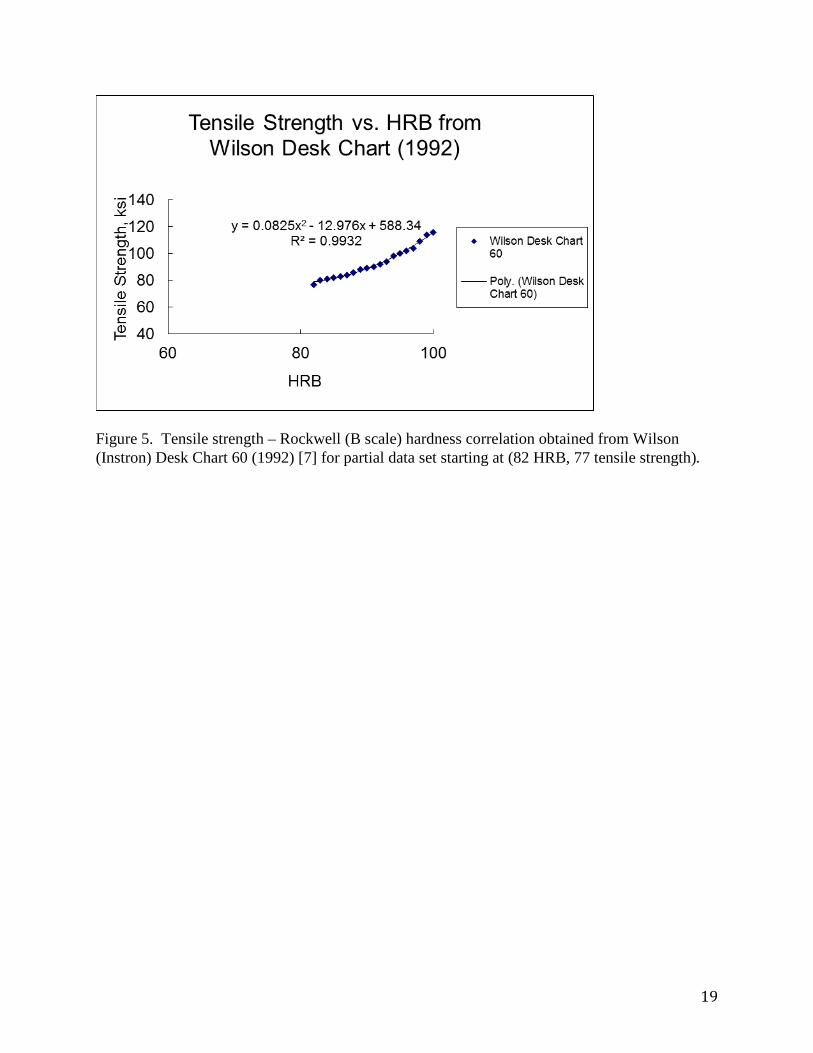
where the constant c is also approximately 3 for mild steel when HB and σ have the same units, say kgf/mm2. For this work, the difference in yield strength values estimated using Meyer hardness vs. Brinell hardness directly is minimal: 75.8 vs. 75.0 ksi, respectively, for Specimen 1 and 79.7 vs. 79.0 ksi, respectively, for Specimen 2. 7. To obtain yield strength in units of ksi to be consistent with those reported for tensile strength, the conversion factor 1 kgf/mm2 = 1.4223 ksi is used. 8. Instead of employing a single trend line, the data set can be divided with the break point occurring at (82 HRB, 77 ksi tensile strength), corresponding to when the data is no longer smoothly varying. The resulting plots of tensile strength as a function of Rockwell (B scale) hardness for the two segments, each with its own trend line, are given in Figures 4 and 5. Using the trend line in Figure 5, the estimated tensile strengths are 88.9 and 94.0 for Specimen 1 and 2, respectively, which are a bit closer to the estimates obtained by tabular interpolation. 9. The tensile strength estimates, consistent with the corresponding yield strength estimates, continue to govern and leave unchanged the ASTM A615 grade classifications. In this case, tensile strength estimates were used because they are considered to be more reliable than yield strength estimates.
10
REFERENCES: [1] Low, S.R.: Rockwell Hardness Measurement of Metallic Materials, NIST Recommended
Practice Guide, Special Publication 960-5, January 2001. [2] Online Engineering Materials Testing Information Resource – “Best Practices for
Rockwell Hardness Testing,” B. O’Neill. Web. 6/30/2015. <http://www.industrialheating.com/articles/88729-best-practices-for-rockwell-hardness-testing>.
[3] Tabor, D.: Indentation Hardness and Yield Properties of Solids, in Physics of Materials,
A Festschrift for Dr. Walter Boas on the occasion of his 75th Birthday, D.W. Borland, L.M. Clarebrough and A.J.W. Moore, editors, University of Melbourne, Australia, 1979, pp. 271-282.
[4] Shaffer, J.: Steel Reinforcement Bar: A Tensile Testing Guide, Advanced Materials &
Processes, Vol. 173, June 2015, pp. 23-27. [5] Online Engineering Materials Testing Information Resource – “Fundamentals of
Rockwell Hardness Testing,” Wilson (now Instron), 1988. Available on Web 5/23/2016. <http://eclass.uth.gr/eclass/modules/document/file.php/MHXC152/LAB_5_Hardness%20Test/WB1226~FundamentalsOfRockwellHardnessTesting.pdf>.
[6] McGhee, D.B.: “Common Problems in Rockwell Hardness Testing,” Heat Treating
Progress, May/June 2004, pp. 23-25. [7] “Wilson Desk Chart 60 (Hardness Conversion),” Wilson Instruments, an Instron
Company, 1992. [8] Online Engineering Materials Information Resource – “REBAR: Concrete Reinforcing
Bar,” J. Dempsey. Web. 6/26/2015. <http://www.anvilfire.com/FAQs/reb_faq_index.htm>.
[9] Online Engineering Materials Information Resource – “PURPOSES AND TYPES OF
REINFORCING STEEL,” Web. 6/26/2015. <http://www.tpub.com/steelworker2/76.htm>.
[10] Online Engineering Materials Information Resource – “ASTM A36 Steel, bar,” Web.
5/31/2016. <http://www.matweb.com/search/datasheet.aspx?matguid=d1844977c5c8440cb9a3a967f8909c3a&ckck=1>.
[11] “Standard Specification for Deformed and Plain Carbon-Steel Bars for Concrete
Reinforcements,” Designation A615/615M – 15a, ASTM, July 2015.
11
[12] Online Commercial Materials Product Information Resource – “Cold Rolled Steel Bar,” Web. 7/14/2016. <http://www.reinforcingsteelbar.com/reinforcingbar/cold-rolled-steel-bar.html>.
[13] Online Commercial Materials Product Information Resource – “The Difference Between
Cold Rolled Steel Bar and Hot Rolled Steel Bar,” Web. 7/14/2016. <http://www.jindimachinery.com/news/Cold_Rolled_Rebar.html>.
[14] Widener, E.L.: It’s Hard to Test Hardness, in National Educators' Workshop: Update 90,
NIST Special Publication 822, 1991, pp. 161-167. [15] Martin, D.H.; and Lash, B.: Application of Hardness Testing in Foundry Processing
Operations: A University and Industry Partnership, in National Educators' Workshop: Update 92, NASA Conference Publication 3201, 1993, pp. 221-232.
[16] Olesak, P.J.; and Widener, E.L.: Scleroscope Hardness Testing, in National Educators'
Workshop: Update 93, NASA Conference Publication 3259, 1994, pp. 451-455. [17] Spiegel, F.X.; and West, H.A.: A Novel Approach to Hardness Testing, in National
Educators' Workshop: Update 95, NASA Conference Publication 3330, 1996, pp. 323-328.
[18] Elban, W.L.; and Elban, M.D.: Rockwell Hardness Testing of Metals/Alloys and
Developing Computer-based Mechanical Property Correlations, in National Educators' Workshop: Update 2005, NIST CD-ROM (January 2007), no pagination.
[19] Online Engineering Materials Information Resource – “Effect of Rolling and Annealing
on Hardness of Brass,” 2009 and 2015, A. Cantrell. Web. 6/8/2016. <http://materialseducation.org/educators/matedu-modules/docs/Hardness_of_Brass.pdf>.
[20] Online Engineering Materials Information Resource – “Hardness of Materials--
Introduction,” 2009, M. Palmer and T. Stoebe. Web. 6/8/2016. <http://materialseducation.org/educators/matedu-modules/docs/Intro_to_Hardness.pdf>.
[21] Online Engineering Materials Information Resource – “Hardness Testing of Materials,”
2010, E. Merten. Web. 6/8/2016. <http://materialseducation.org/educators/matedu-modules/docs/Hardness_Testing_of_Materials.pdf>.
[22] Online Engineering Materials Information Resource – “Vickers Microindentation
Hardness Testing of Brazed Joints in Aluminum,” 2013, P.B. Roy, F.M. O’Connell, T.H. Callahan, E.J. Armellino, and W.L. Elban. Web 6/8/2016. <http://materialseducation.org/educators/matedu-modules/docs/Vickers_microindentation.pdf>.
12
[23] Rowe, G.W.: Elements of Metalworking Theory, Edward Arnold Ltd., London, 1979 (Reprinted 1984), pp. 9-10.
SOURCES OF SUPPLIES: Small lengths of steel rebar of various sizes are probably available from local construction contractors or may be purchased from building supplies stores. ACKNOWLEDGEMENTS: Dr. Yanko Kranov, Department of Engineering, Loyola University Maryland, provided the machined rebar specimens. Dr. Michael R. Staker, Department of Engineering, Loyola University Maryland, offered insightful comments about correlating tensile strength with Rockwell (B scale) hardness values. Dr. Ronald W. Armstrong, Department of Mechanical Engineering, University of Maryland, College Park, MD 20742, provided helpful comments about converting Brinell hardness to Meyer hardness. The identification of any manufacturer and/or product does not imply endorsement or criticism by the authors or Loyola University Maryland.
13
ABOUT THE AUTHORS: Tanner M. Robinson Tanner is a senior engineering major at Loyola University Maryland with a double concentration in mechanical engineering and materials engineering. He interned as a project engineer for Rommel Cranston Construction LLC during the summer after his sophomore year to the end of his junior academic year. He received the prestigious Hauber Fellowship in the summer of 2016 to perform research on large-scale plastic deformation in crystalline solids. Under the supervision of Drs. Robert B. Pond, Jr., and Wayne L. Elban, Tanner will acquire micro-indentation hardness profiles in the radial and axial directions of numerous crystalline materials that have been brought to failure in uniaxial tension. After graduating from Loyola University Maryland in the spring of 2017, he hopes to travel and utilize his undergraduate education in the field of materials research. Matthew T. Kalensky
Matt is a senior engineering major at Loyola University Maryland with a double concentration in mechanical engineering and materials engineering and will graduate in the spring of 2017. He is particularly interested in fluid mechanics and thermodynamics. Following his undergraduate degree, Matt plans to further his education by pursuing a doctorate degree in mechanical engineering within the discipline of thermal studies. In the fall of 2015, he began conducting research under the guidance of Dr. Robert T. Bailey. This research focused on developing a new, revolutionary strategy for conditioning an interior space that does not require a static supply point to improve thermal comfort and energy efficiency. To continue this research at the university in the summer of 2016, Matt was awarded the prestigious Hauber Fellowship. Additionally, he is a part-time intern for Phoenix Engineering Inc. and Johnson Mirmiran & Thompson Engineering in Cockeysville and Sparks, Maryland, respectively. He serves as a student representative for his department’s Industrial Advisory Board during the academic year. Alexander M. Stanzel Alex is a senior engineering major at Loyola University Maryland with a concentration in mechanical engineering. After graduation in the spring of 2017, Alex plans on pursuing a Master’s degree in automotive engineering. He is also the co-founder and co-president of Students Practicing Engineering and Construction Sciences, a university club that promotes the education and use of the machine shop. Nicholas J. Gordon Nick is a senior engineering major at Loyola University Maryland with a concentration in mechanical engineering. After graduating from Loyola in the spring of 2017, Nick plans on pursuing a masters of business administration degree. In the summer of 2016, he interned in the project management division of Commercial Real Estate Services in New York City.
14
Wayne L. Elban Since 1985, Professor Elban has taught engineering courses at Loyola College (now Loyola University Maryland), including introductory materials science, materials science lab, mechanical properties of materials, transformations in solids, and engineering materials and manufacturing processes. He received a BChE with distinction ('69) and a PhD in Applied Sciences: Metallurgy ('77) from the University of Delaware and a MS in Engineering Materials ('72) from the University of Maryland, College Park. From 1969-1985, he was a research engineer at the Naval Surface Warfare Center, White Oak Laboratory, Silver Spring, Maryland. In 1992, he was a Fulbright scholar at the University of Strathclyde (Glasgow), Department of Pure and Applied Chemistry. From 2001-2003, he was a working visitor at the Smithsonian Center for Materials Research and Education, Silver Hill, Maryland. From 2008-2011, he was a guest worker at the National Institute of Standards and Technology, Gaithersburg, Maryland. He is a member of ASM International and the Society of Manufacturing Engineers.
15
Table 1. Rockwell (B Scale) measurements on rebar Sample #5.
Specimen 1 Specimen 2
Indentation Hardness (HRB)
Deviation from Mean
Indentation Hardness (HRB)
Deviation from Mean
1 84.6 -5.5 1 92.8 0.3 2 89.2 -0.9 2 90.7 -1.8 3 91.4 1.3 3 92.8 0.3 4 90.5 0.4 4 91.9 -0.6 5 90.7 0.6 5 93.6 1.1 6 91.5 1.4 6 93.3 0.8 7 92.8 2.7
Average 90.1 Average 92.5 Std. Dev. 2.4 Std. Dev. 1.0
16
indicates where an indentation was placed. The number next to the symbol is the indentation number, where #1 is the first indentation and #7 and #6 are the final indentations, for Specimen 1 and Specimen 2, respectively.
Figure 1. Rockwell (B scale) indentation location diagrams for Specimens 1 and 2 of rebar Sample #5.
Specimen 1
Specimen 2
1 2
3
4
5 6
7
1 2 3 4
5
6
17
Table 2. Tabulation of mechanical properties of ASTM A615 rebar steel for various grade classifications.[11] Grade Classification
40 60 75 80 100
Tensile strength, minimum, ksi
60 90 100 105 115
Yield strength, minimum, ksi
40 60 75 80 100
Figure 2. Tensile strength – Rockwell (B scale) hardness correlation obtained from Wilson (Instron) Desk Chart 60 (1992) [7].
18
Figure 3. Brinell hardness – Rockwell (B scale) hardness correlation obtained from Wilson (Instron) Desk Chart 60 (1992) [7].
Figure 4. Tensile strength – Rockwell (B scale) hardness correlation obtained from Wilson (Instron) Desk Chart 60 (1992) [7] for partial data set up to (81 HRB, 73 tensile strength).
19
Figure 5. Tensile strength – Rockwell (B scale) hardness correlation obtained from Wilson (Instron) Desk Chart 60 (1992) [7] for partial data set starting at (82 HRB, 77 tensile strength).
20
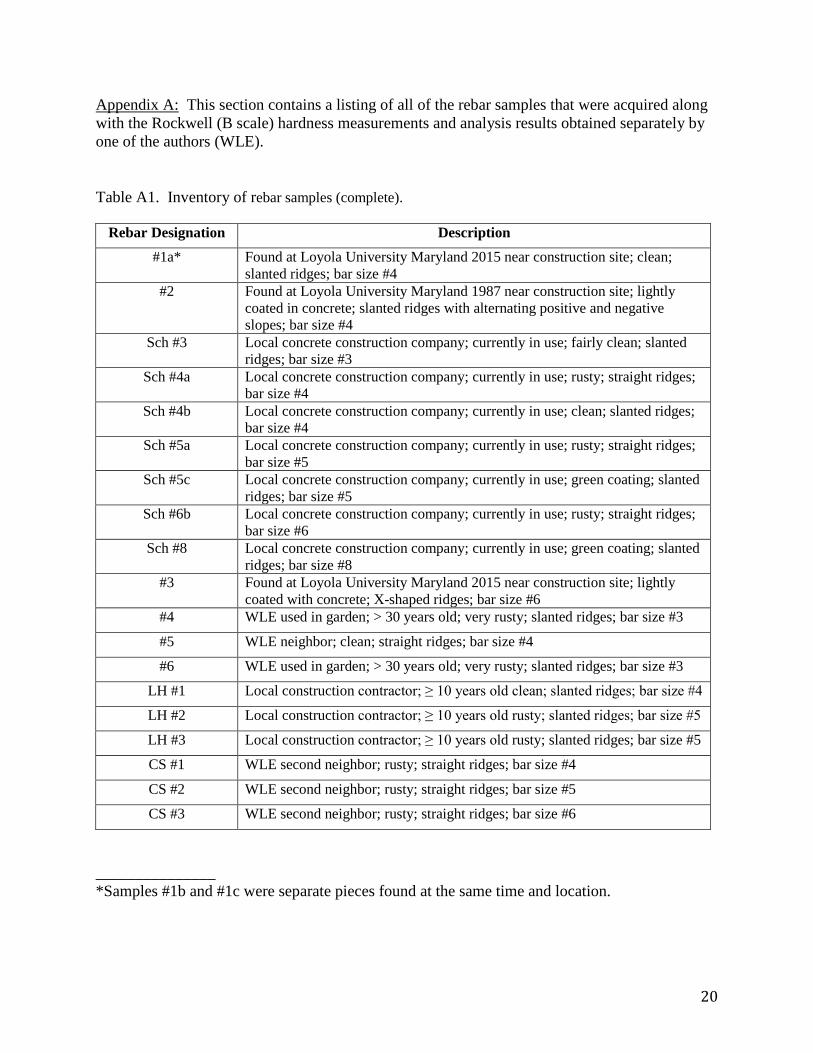
Appendix A: This section contains a listing of all of the rebar samples that were acquired along with the Rockwell (B scale) hardness measurements and analysis results obtained separately by one of the authors (WLE). Table A1. Inventory of rebar samples (complete).
Rebar Designation Description
#1a* Found at Loyola University Maryland 2015 near construction site; clean; slanted ridges; bar size #4
#2 Found at Loyola University Maryland 1987 near construction site; lightly coated in concrete; slanted ridges with alternating positive and negative slopes; bar size #4
Sch #3 Local concrete construction company; currently in use; fairly clean; slanted ridges; bar size #3
Sch #4a Local concrete construction company; currently in use; rusty; straight ridges; bar size #4
Sch #4b Local concrete construction company; currently in use; clean; slanted ridges; bar size #4
Sch #5a Local concrete construction company; currently in use; rusty; straight ridges; bar size #5
Sch #5c Local concrete construction company; currently in use; green coating; slanted ridges; bar size #5
Sch #6b Local concrete construction company; currently in use; rusty; straight ridges; bar size #6
Sch #8 Local concrete construction company; currently in use; green coating; slanted ridges; bar size #8
#3 Found at Loyola University Maryland 2015 near construction site; lightly coated with concrete; X-shaped ridges; bar size #6
#4 WLE used in garden; > 30 years old; very rusty; slanted ridges; bar size #3
#5 WLE neighbor; clean; straight ridges; bar size #4
#6 WLE used in garden; > 30 years old; very rusty; slanted ridges; bar size #3
LH #1 Local construction contractor; ≥ 10 years old clean; slanted ridges; bar size #4
LH #2 Local construction contractor; ≥ 10 years old rusty; slanted ridges; bar size #5
LH #3 Local construction contractor; ≥ 10 years old rusty; slanted ridges; bar size #5
CS #1 WLE second neighbor; rusty; straight ridges; bar size #4
CS #2 WLE second neighbor; rusty; straight ridges; bar size #5
CS #3 WLE second neighbor; rusty; straight ridges; bar size #6
_______________ *Samples #1b and #1c were separate pieces found at the same time and location.
21
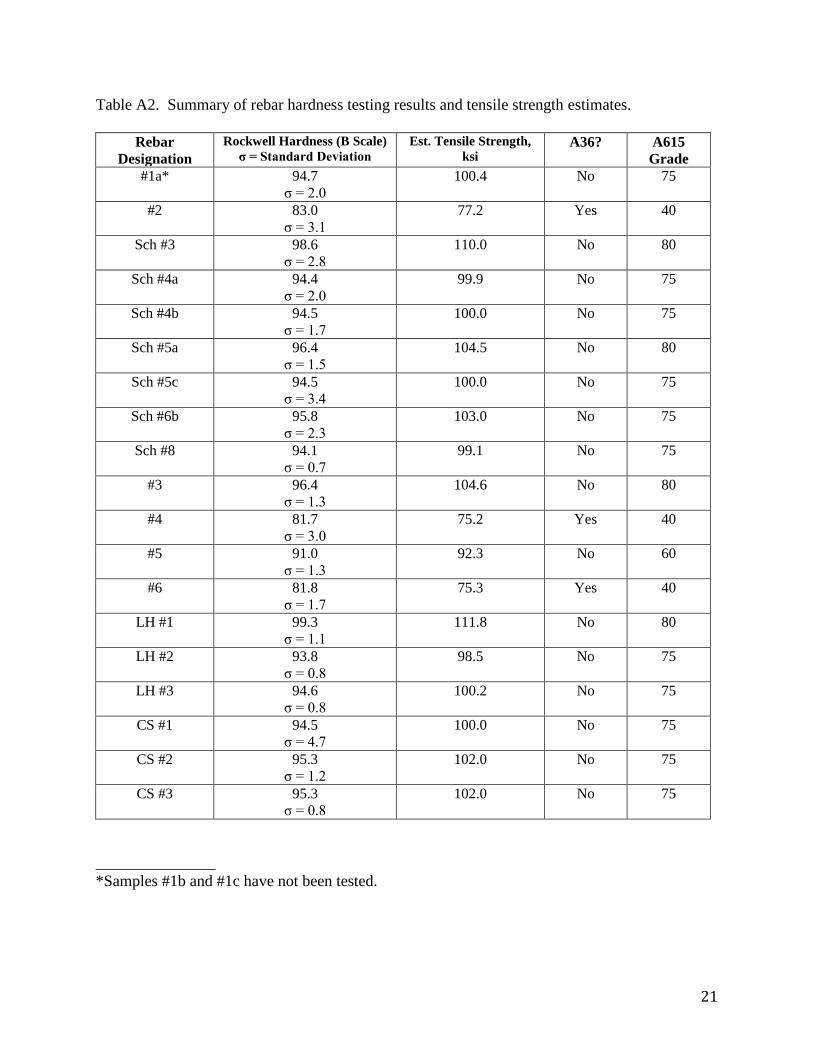
Table A2. Summary of rebar hardness testing results and tensile strength estimates.
Rebar Designation
Rockwell Hardness (B Scale) σ = Standard Deviation
Est. Tensile Strength, ksi
A36? A615 Grade
#1a* 94.7 σ = 2.0
100.4 No 75
#2 83.0 σ = 3.1
77.2 Yes 40
Sch #3 98.6 σ = 2.8
110.0 No 80
Sch #4a 94.4 σ = 2.0
99.9 No
75
Sch #4b 94.5 σ = 1.7
100.0 No 75
Sch #5a 96.4 σ = 1.5
104.5 No 80
Sch #5c 94.5 σ = 3.4
100.0 No 75
Sch #6b 95.8 σ = 2.3
103.0 No 75
Sch #8 94.1 σ = 0.7
99.1 No 75
#3 96.4 σ = 1.3
104.6 No 80
#4 81.7 σ = 3.0
75.2 Yes 40
#5 91.0 σ = 1.3
92.3 No 60
#6 81.8 σ = 1.7
75.3 Yes 40
LH #1 99.3 σ = 1.1
111.8 No 80
LH #2 93.8 σ = 0.8
98.5 No 75
LH #3 94.6 σ = 0.8
100.2 No 75
CS #1 94.5 σ = 4.7
100.0 No 75
CS #2 95.3 σ = 1.2
102.0 No 75
CS #3 95.3 σ = 0.8
102.0 No 75
_______________ *Samples #1b and #1c have not been tested.
22
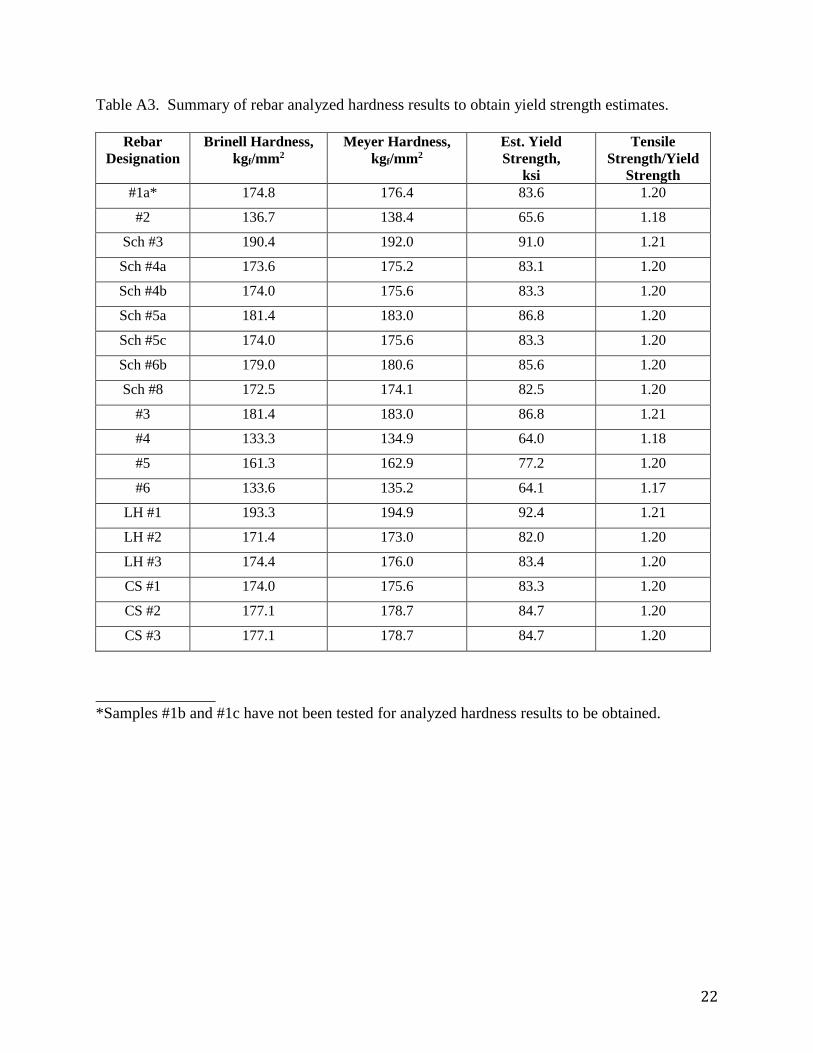
Table A3. Summary of rebar analyzed hardness results to obtain yield strength estimates.
Rebar Designation
Brinell Hardness, kgf/mm2
Meyer Hardness, kgf/mm2
Est. Yield Strength,
ksi
Tensile Strength/Yield
Strength #1a* 174.8 176.4 83.6 1.20
#2 136.7 138.4 65.6 1.18
Sch #3 190.4 192.0 91.0 1.21
Sch #4a 173.6 175.2 83.1 1.20
Sch #4b 174.0 175.6 83.3 1.20
Sch #5a 181.4 183.0 86.8 1.20
Sch #5c 174.0 175.6 83.3 1.20
Sch #6b 179.0 180.6 85.6 1.20
Sch #8 172.5 174.1 82.5 1.20
#3 181.4 183.0 86.8 1.21
#4 133.3 134.9 64.0 1.18
#5 161.3 162.9 77.2 1.20
#6 133.6 135.2 64.1 1.17
LH #1 193.3 194.9 92.4 1.21
LH #2 171.4 173.0 82.0 1.20
LH #3 174.4 176.0 83.4 1.20
CS #1 174.0 175.6 83.3 1.20
CS #2 177.1 178.7 84.7 1.20
CS #3 177.1 178.7 84.7 1.20
_______________ *Samples #1b and #1c have not been tested for analyzed hardness results to be obtained.
23
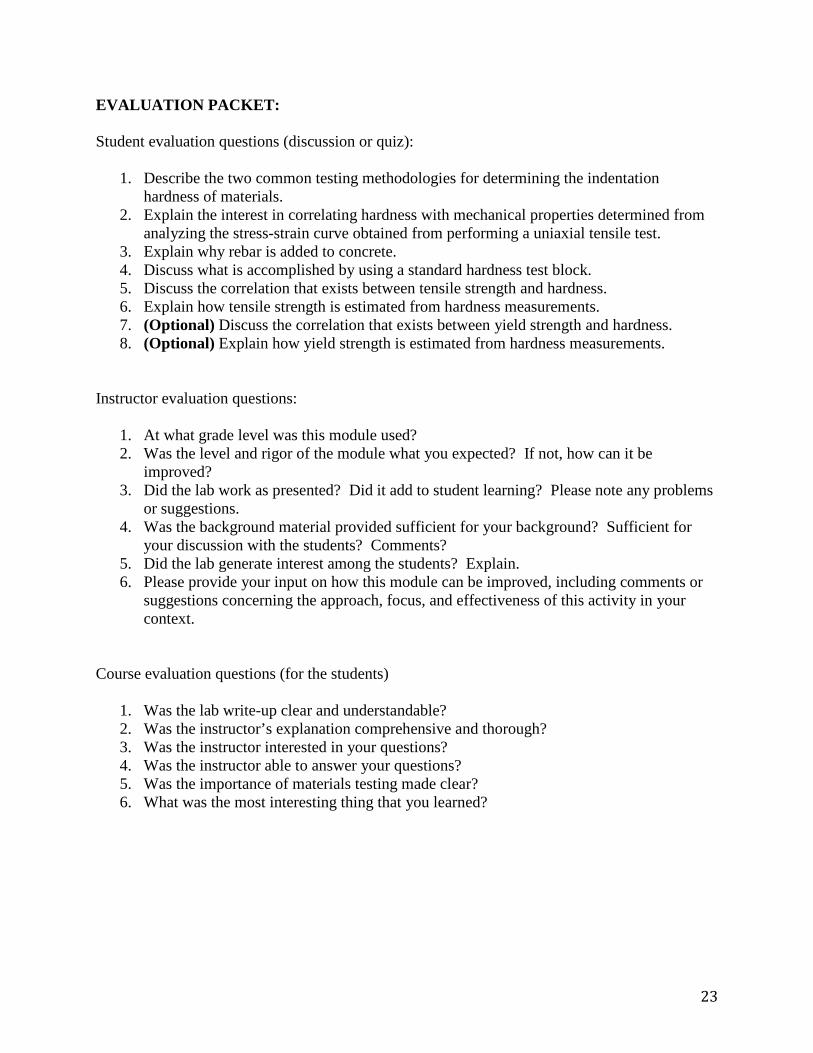
EVALUATION PACKET: Student evaluation questions (discussion or quiz):
1. Describe the two common testing methodologies for determining the indentation hardness of materials.
2. Explain the interest in correlating hardness with mechanical properties determined from analyzing the stress-strain curve obtained from performing a uniaxial tensile test.
3. Explain why rebar is added to concrete. 4. Discuss what is accomplished by using a standard hardness test block. 5. Discuss the correlation that exists between tensile strength and hardness. 6. Explain how tensile strength is estimated from hardness measurements. 7. (Optional) Discuss the correlation that exists between yield strength and hardness. 8. (Optional) Explain how yield strength is estimated from hardness measurements.
Instructor evaluation questions:
1. At what grade level was this module used? 2. Was the level and rigor of the module what you expected? If not, how can it be
improved? 3. Did the lab work as presented? Did it add to student learning? Please note any problems
or suggestions. 4. Was the background material provided sufficient for your background? Sufficient for
your discussion with the students? Comments? 5. Did the lab generate interest among the students? Explain. 6. Please provide your input on how this module can be improved, including comments or
suggestions concerning the approach, focus, and effectiveness of this activity in your context.
Course evaluation questions (for the students)
1. Was the lab write-up clear and understandable? 2. Was the instructor’s explanation comprehensive and thorough? 3. Was the instructor interested in your questions? 4. Was the instructor able to answer your questions? 5. Was the importance of materials testing made clear? 6. What was the most interesting thing that you learned?