Embed Size (px)
Citation preview
Comput Math Organ Theory (2009) 15: 303–328DOI 10.1007/s10588-009-9063-5
Robustness of centrality measures under uncertainty:Examining the role of network topology
Terrill L. Frantz · Marcelo Cataldo ·Kathleen M. Carley
Published online: 15 December 2009© Springer Science+Business Media, LLC 2009
Abstract This study investigates the topological form of a network and its impacton the uncertainty entrenched in descriptive measures computed from observed so-cial network data, given ubiquitous data-error. We investigate what influence a net-work’s topology, in conjunction with the type and amount of error, has on the abilityof a measure, derived from observed data, to correctly approximate the same of theground-truth network. By way of a controlled experiment, we reveal the differing ef-fect that observation error has on measures of centrality and local clustering acrossseveral network topologies: uniform random, small-world, core-periphery, scale-free,and cellular. Beyond what is already known about the impact of data uncertainty, wefound that the topology of a social network is, indeed, germane to the accuracy ofthese measures. In particular, our experiments show that the accuracy of identifyingthe prestigious, or key, actors in a network—according observed data—is consider-ably predisposed by the topology of the ground-truth network.
Keywords Network topology · Data error · Measure robustness · Centrality ·Observation error
T.L. Frantz (�) · K.M. CarleyCenter for Computational Analysis of Social and Organizational Systems (CASOS), Institute forSoftware Research, School of Computer Science, Carnegie Mellon University, 5000 Forbes Ave.,Pittsburgh, PA 15213, USAe-mail: [email protected]
K.M. Carleye-mail: [email protected]
M. CataldoTwo North Shore Center, Suite 320, Pittsburgh, PA 15212, USAe-mail: [email protected]
304 T.L. Frantz et al.
1 Introduction
Social network datasets are often incomplete and prone to observation error due tothe intricacy of collection-instrument design and the inherent vagueness of human-informant reliability and bias (Stork and Richards 1992; Feld and Carter 2002). Theerror in the observed data may be unintentional or intentional (Albert et al. 2000;Carley 2002; Calloway and Morrissey 1993; Freeman et al. 1987; Killworth andBernard 1976). No matter its nature, the presence of this error is a nontrivial issue(Marsden 1990; McKnight et al. 2007) and it raises the question of the impact of theuncertainty, relative to the accuracy of network measures computed from this data.In extensive efforts to ameliorate this problem, researchers have been examining andestimating the impact of observation error and exploring the reliability of descrip-tive network measures given the confines of errant data (e.g., Borgatti et al. 2006;Costenbader and Valente 2003; Kossinets 2006; Marsden 1993; Zemljic and Hlebec2005).
Past research taking the functional approach1 to the problem of uncertain data hasprimarily consisted of two complementary strategies; although, there are certainlyseveral other strategies (see Butts 2003; Robins et al. 2004). In the first strategy, re-searchers have used a variety of sampling techniques on the observed data (Ericksonand Nosanchuk 1983; Frank 1978, 1981; Galaskiewicz 1991; Gile and Handcock2006; Granovetter 1976; Handcock and Gile 2007). This strategy has been found toprovide “reasonable, if not excellent” (Galaskiewicz 1991, p. 347) estimates of thebona fide centrality measures for the true network. In the Galaskiewicz study, it wasshown that the lower the density of the network, the better the estimates of centralitywere, while network size did not appear to be an important factor. In another study,Costenbader and Valente (2003) showed that most of the centrality measures weresensitive to sampling size, network size and network density; however, the measuresremained robust for sampling levels between 50% and 80%. Further, they found thateigenvector centrality was considerably more robust relative to the other measures.
A second strategy used to estimate robustness of network measures, involves con-trolled experiments that statistically analyze computer-generated network data, i.e.,virtual experiments. Bolland (1998) uncovered considerable redundancy in central-ity measures under the condition of data uncertainty and found that such redundancyactually increases with the level of error. In a study that explored both generated andreal-world networks, Kossinets (2006) found that observation error involving missingnodes can significantly alter network-level statistics such as average degree centrality,clustering, and a variety of other descriptive measures. In another controlled experi-ment, Borgatti et al. (2006) explored measure robustness specific to case of uniform-random networks. They found that the common measures of centrality have a similarpattern of robustness across network size and density, and that the different type oferrors (missing or superfluous; nodes and edges) have surprisingly similar robustnessprofiles. Recently, Kim and Jeong (2007) found that in certain networks, closenesswas generally the most robust of the basic centrality measures.
1Much research investigating missing or over sampled data has taken the structural approach, which fo-cuses on what the incorrect data might be, whereas the functional approach focuses on the impact of theincorrect data and what to do about it (McKnight et al. 2007).
Robustness of centrality measures under uncertainty 305
Concurrent to the mounting research on the robustness of network measures, therehas also been growing interest in understanding the characteristics of the more holis-tic aspects of networks, and in particular, the topological aspects of a social network(e.g., Newman et al. 2002). The mathematically elegant Erdös and Rényi (1959) net-work topology, which we refer herein as the uniform random network, has beenwell studied by social scientists for many years. Recently, attention has shifted to-ward understanding the more complex, stylized networks—networks with a moreintricately defined topology—to the point that some related terms have even enteredthe populous vernacular. One topology, the small-world (Milgram 1967; Newmanand Watts 1999), has been found in numerous social settings (Davis et al. 2003;Watts 1999a), such as in the networks of film actors (Watts and Strogatz 1998) andcomputer discussion groups (Ravid and Rafaeli 2004), and is a notion that has evenbeen the basis for a popular play (Guare 1990). In other cases, such as business net-works (Powell et al. 2005), the Internet and other communication networks, it hasbeen found that they have a scale-free topology (Albert et al. 1999; Faloutsos et al.1999), likely as a result of the social phenomenon of preferential attachment (Simon1955). As Borgatti and Everett (1999) reported, the core-periphery topology has beenfound in areas such as systems, economics, collective actions, interlocking direc-torates, and other organizational areas, e.g., inter-organizational alliances (Stuart andRobinson 2000). Lastly, the cellular topology (Frantz and Carley 2005; Krebs 2002;Mayntz 2004; Tsvetovat and Carley 2005) is a socially-constructed network oftenassociated with covert organizations such a terrorist groups and is a topology that isfrequently associated with the “dark side” (Ronfeldt and Arquilla 2001, p. 2). Sincethe events of 9/11, the cellular form has garnered a great deal of academic and gov-ernment interest.
In this study, we conjoin the interest in the robustness of network measures withthat of network topology, and conjecture that the topology of the network has criticalrelevance to the robustness profiles of descriptive social-network measures. In theformal sense, we scrutinize the following conjecture: in the ubiquitous circumstanceof data uncertainty, the topological form of the true network has a measurable effecton the robustness of node-level measures when computed from the observed networkdata, relative to the analogous values computed from the ground-truth network.
By undertaking a combined perspective and endeavoring to conduct an experi-ment involving both the robustness of network measures and network topology, so-cial scientists and practitioners will improve their understanding of the impact thatobservation error has on network measures and, thus, will move closer to conceiv-ing a remedy to the inherent data-uncertainty problem. We explore the robustnessof network measures via a virtual experiment in a manner akin to that of Borgattiet al. (2006), but with a poignant focus on the topology of the network; specifically,we handle network topology of the true social-network as an independent variablein our experiments. We concentrate on the five topologies mentioned above, as weexamine the robustness of four traditional node-level, centrality measures: degree(Freeman 1979), betweenness (Freeman 1977), closeness (Freeman 1979), eigenvec-
306 T.L. Frantz et al.
tor (Bonacich 1987). We also examine the local clustering2 (Watts and Strogatz 1998;Watts 1999b) measure because we suspect that it may be relevant to future social net-work studies that are oriented toward topology-related classification.
The remainder of the paper is organized as follows: we detail the methodologyof the experiment, present the quantitative results, qualitatively discuss the findings,and present our conclusions. Finally, the limitations of the study and suggested futureresearch directions are presented.
2 Method
The aim of this experiment is to examine the relationship of a network’s ground-truth topology to the robustness of network measures that are derived from observeddata. In order to accomplish this, we designate the topology of a true-network as anindependent control variable of primary focus; other independent control variablesinclude the size and density of the true network as well as specific characteristicsof error approximating the uncertainty, resulting in an observed-network. Based ontheir involvement in the process, the control variables are organized into two groups:the network class and the uncertainty class. The network class variables specify thecharacteristics of the true network and are used in the generation of the true-networkdata. The uncertainty class variables are those that specify the characteristics of thedata error, i.e., the error in the observed network data and are used in transformingthe ground-truth data to an observed dataset. For response outcome variables, wefocus on observed-network-based metrics determined from rank-ordered lists of fivewidely-used node-level measures, namely: degree centrality, betweenness centrality,closeness centrality, eigenvector centrality, and local clustering. These measures willbe further expressed using two types of metrics: top-node and top-group; detail aboutthese outcome variables is provided later in this section (see Sect. 2.3).
This experiment has an amalgamated factorial block and randomized design: fourof the control variables are non-probabilistic, tiered samples constructed in a factorialand purposeful fashion, and one control variable has a combined quota and purposefulsampling methodology. Considering the five control variables, as shown in Table 1,some topological forms are infeasible at some network densities, so some experimentcell expectations are not fully satisfied. For example, a cellular network generatedwith a density of 0.70 is not possible to achieve, thus there are no samples of cellulartopologies at this density level; while for other topologies, such as uniform random,density at this level is realizable.
Procedurally, for each replication, we start by generating an undirected graph ofthe prearranged topology, size (number of nodes) and of a specific density (numberof edges), and then label it the true network, representing what the absolute truthnetwork scenario is to be. Next, an exact copy of the true network is systematicallyperturbed according to the prearranged error class variables (type and level), resulting
2Local clustering is a measure of how well connected the neighbors of a specific node are. The exactdefinition is: the count of the number of existing ties among an ego’s alters, divided by the count of thenumber of ties possible among the same alter nodes; its resulting value will be between 0 and 1.
Robustness of centrality measures under uncertainty 307
Table 1 Parameter space of control variables
Variable Number/nature of values Values
Network class: (used in generation of true network)
Network sizea 3 25, 50, 100
Network density Range 0.01–0.90
Topology 5 Uniform-random, small-world,scale-free, core-periphery, cellular
Uncertainty class: (used in transformation to observed network)
Error type 4 Edge-remove, edge-add, node-remove,node-add
Error levelb 5 1%, 5%, 10%, 25%, 50%
Replicationsc Range 10–250
aNumber of nodes
bPercentage of nodes or edges to be perturbed, according to the error typecActual number of replication per cell varies due to stochastic nature of the network generation algorithms
in a transformation to a separate, undirected graph, which is labeled, the observednetwork. This observed network represents what uncertain data the researcher in pointof fact collects; therefore, in the real-world, it is this data that is actually used tocompute measures that are reported. It follows that then each experimental replicationis represented by a pair of networks composed of a true network and its correspondingobserved network.
For each network in the pair, we compute the five node-level measures for eachindividual node in the network, and then rank order the nodes according to theirmeasure value in decreasing order. This results in five node-lists for each networkand therefore, five paired node-lists; each pair consists of one rank-ordered list for thetrue network and one for the observed network. Using the paired node-list for eachmeasure, several metrics are computed using the lists that indicate the congruence ofthe two lists, resulting in the ability to quantify and evaluate the discrepancy betweenthe ground-truth values and the observed values.
For the remainder of this section, we describe how the true networks are gener-ated specific to their topology, how uncertainty is introduced in the correspondingobserved network, and how the robustness metrics are determined.
2.1 Generating the true networks
In order to independently generate each true network, we applied an algorithm de-signed to produce a plausible approximation of the particular topology; accordingly,we have five generating-algorithms, each unique to a specific topology. Each algo-rithm takes as one of its input parameters the size of the desired network (number ofnodes), whose value is set as specified by the network size variable. The properties ofeach algorithm restricts the implementation of a consistent network density specifi-cation across all the algorithms. In some cases density is a direct input parameter andresults in networks of that exact density, e.g., uniform random and core-periphery,
308 T.L. Frantz et al.
while in other cases, e.g., small-world, scale-free and cellular, the density of the ac-tual network generated is approximately the value of the desired density. The gen-erative algorithms have been reviewed and the density of the networks produced issufficiently near the desired density value. The details and the parameter settings foreach of these topologies are described below.
To generate a uniform random network, we used the method to generate an ErdösRandom Graph (Bollobás 2001) as implemented in the Organizational Risk Analyzer(ORA) software. We selected this generator over equivalent others both because itwas used in the Borgatti et al. (2006) experiment—therefore our experimental pro-cedures can be straightforwardly authenticated—and because its parameter require-ments fit precisely with the experiment’s variables. The algorithm requires two inputparameters: number-of-nodes, and number-of-edges. We simply compute the valuefor the number-of-edges parameter based on the density and network size variables.To generate the graph, the algorithm randomly selects pairs of vertices (without re-placement) from the set of all possible and joins the pair, until the number-of-edgesparameter has been satisfied. Each pair has an equal probability of being selected.The probability value is the inverse of the number of nodes, squared. Any resultingself-loops are discarded. This algorithm produces a graph with the network densityvalue matching exactly the density parameter and variable.
To generate a small-world network, we used an edge-add (as opposed re-wire)approach described as TOPOLOGY 3 (Small-world) in Airoldi and Carley (2005).However, we modify the original procedure slightly by converting the graph’s di-rected edges to be undirected and by disabling some of the algorithm’s advancedfeatures by effectively nullifying several inessential parameters. Subsequently, the re-configured algorithm calls for three parameters: number-of-nodes, number-of-edges,and distance-of-close-neighbors. The algorithm first constructs a ring lattice with thespecified number-of-nodes set to the variable network size value, and the distance-of-close-neighbors parameter set to one value in {1, 2, 3, 4, 5, 8, 10, 20}; this value isbounded by what is possible given the number of nodes in the graph. This will gen-erate a multitude of fixed ring-lattices with a pre-determined number of edges;3 thus,this is also a graph with a pre-determined density. Next, edges are added randomlyuntil the desired density, according to the density variable, is reached. Generated net-works are then assigned into the appropriate experiment cell according to value ofthe actual density of the true network.
To generate a scale-free network, we used the algorithm, SCALE FREE 2, pro-posed by Airoldi and Carley (2005), which applies a power law with preferentialattachment technique, as proposed by Barabasi and Albert (1999), but allows forgenerating graphs with a specified and fixed number of nodes and edges. The algo-rithm requires three parameters: number-of-nodes, number-of-edges, and power-law-exponent. Like other algorithms, we simply compute the value for the number-of-edges parameter based on the density and network size variables. For all graphs of
3For example, a minimal lattice of 10 nodes, connected to 1 neighbor, has a fixed density of 0.11, thereforeit is impossible to have a small-world network of this node-size with density of 0.01, 0.02, etc. The experi-ment cells for these impossibilities are left unfilled. The 100-node lattice provides a full range of densitiesto fill the range of experiment cells for the small-world topology, accordingly.
Robustness of centrality measures under uncertainty 309
this topology, we arbitrarily fix the power-law-exponent parameter to 2.0 because thisrounded value approximates the exponent of scale-free networks empirically found inthe real-world, e.g. the Internet. The algorithm constructs an ordered degree distribu-tion vector of normalized probabilities based on the sequential order of the node, thetotal number of nodes, and power-law-exponent parameter. The normalized probabil-ity is then computed by dividing the number of ties for the node (the current vectorvalue) by the total number of ties in the desired graph (based on the density desired).Then the ties-creation processes based on the vector of probabilities is repeated untilall edges have been created as proscribed; that is, we randomly select a node pairand add an edge or not between the pair with probability according to the distributionprobabilities in the vector.
To generate a core-periphery network, we used an algorithm, conceived and oper-ationalized by Borgatti and Reminga (2005), that is part of the Organizational RiskAnalyzer (ORA) software, which reproduces the formalization described by Bor-gatti and Everett (1999). The algorithm requires three parameters: number-of-nodes,network-density, and power-law-exponent. As was done with the scale-free topologygeneration process, we fixed the power-law-exponent to 2.0. The algorithm first cre-ates a node-degree distribution vector in the same manner as the scale-free algorithm,i.e., constructing an ordered degree distribution vector of normalized probabilitiesbased on the sequential order of the node, the total number of nodes, and power-law-exponent parameter. From this vector, a two-dimension matrix of all possible edgecombinations is then formed, where each cell in the matrix is then filled with a scorevalue that is the product of the values from degree distribution vector for the twopaired nodes. Potential edges for the graph are then randomly selected from cells inthis matrix. The value of the selected cell is then used as an-exists probability untilthe number of edges called for in the network construction is reached.
To generate a cellular network, we used the algorithm, CELLULAR 2, proposedby Airoldi and Carley (2005). The algorithm requires five parameters: number-of-nodes, number-of-cells, probability-of-edges-within-a-cell, probability-of edges-between-cells, and a power-law-exponent. The number-of-cells parameter is deter-mined by rotation though a value in {0.2 0.4, 0.6, 0.8} that is multiplied by thenumber-of-nodes and rounded, to establish the value for the number-of-cells para-meter, resulting in {2, 4, 6, 8} cells in the case of a 100-vertex graph, and {1, 2}cells in the case of a 10-vertex graph. Both the probability-of-edges-within-a-cell andthe probability-of edges-between-cells parameters are each separately determined byrotation though the values in {0.01, 0.02, 0.05, 0.10, 0.30, 0.50, 0.70, 0.90}. As withthe scale-free and core-periphery topology generation processes, we fix the power-law-exponent to 2.0. Each generated network is then assigned into the appropriateexperiment cell according to value of the actual density of the true network.
2.2 Introducing uncertainty
The data for the observed network is generated by perturbing a copy of a previously-generated true network. The uncertainty in the observed data is modeled using a ran-dom process that perturbs the true network according to the error class variables (errortype and error level) of the experiment cell in which the network pair is a member of.
310 T.L. Frantz et al.
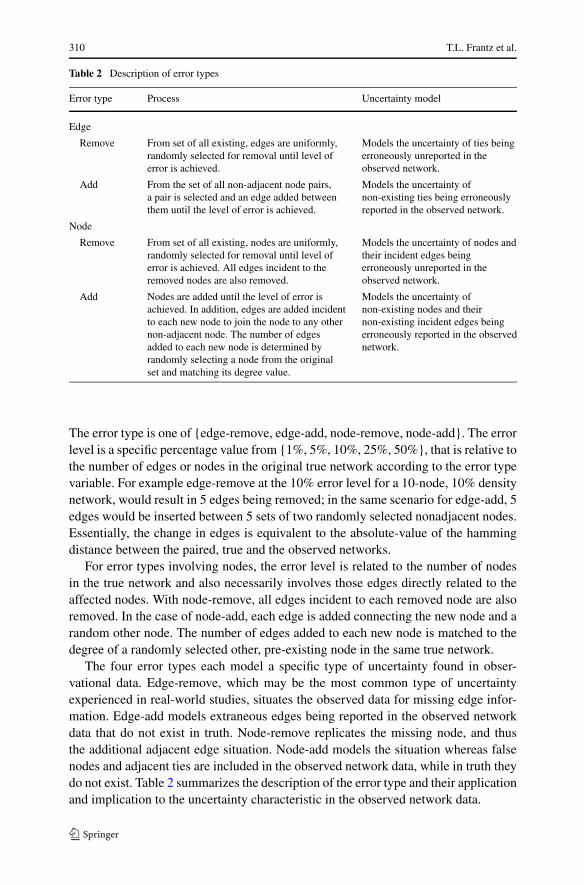
Table 2 Description of error types
Error type Process Uncertainty model
Edge
Remove From set of all existing, edges are uniformly,randomly selected for removal until level oferror is achieved.
Models the uncertainty of ties beingerroneously unreported in theobserved network.
Add From the set of all non-adjacent node pairs,a pair is selected and an edge added betweenthem until the level of error is achieved.
Models the uncertainty ofnon-existing ties being erroneouslyreported in the observed network.
Node
Remove From set of all existing, nodes are uniformly,randomly selected for removal until level oferror is achieved. All edges incident to theremoved nodes are also removed.
Models the uncertainty of nodes andtheir incident edges beingerroneously unreported in theobserved network.
Add Nodes are added until the level of error isachieved. In addition, edges are added incidentto each new node to join the node to any othernon-adjacent node. The number of edgesadded to each new node is determined byrandomly selecting a node from the originalset and matching its degree value.
Models the uncertainty ofnon-existing nodes and theirnon-existing incident edges beingerroneously reported in the observednetwork.
The error type is one of {edge-remove, edge-add, node-remove, node-add}. The errorlevel is a specific percentage value from {1%, 5%, 10%, 25%, 50%}, that is relative tothe number of edges or nodes in the original true network according to the error typevariable. For example edge-remove at the 10% error level for a 10-node, 10% densitynetwork, would result in 5 edges being removed; in the same scenario for edge-add, 5edges would be inserted between 5 sets of two randomly selected nonadjacent nodes.Essentially, the change in edges is equivalent to the absolute-value of the hammingdistance between the paired, true and the observed networks.
For error types involving nodes, the error level is related to the number of nodesin the true network and also necessarily involves those edges directly related to theaffected nodes. With node-remove, all edges incident to each removed node are alsoremoved. In the case of node-add, each edge is added connecting the new node and arandom other node. The number of edges added to each new node is matched to thedegree of a randomly selected other, pre-existing node in the same true network.
The four error types each model a specific type of uncertainty found in obser-vational data. Edge-remove, which may be the most common type of uncertaintyexperienced in real-world studies, situates the observed data for missing edge infor-mation. Edge-add models extraneous edges being reported in the observed networkdata that do not exist in truth. Node-remove replicates the missing node, and thusthe additional adjacent edge situation. Node-add models the situation whereas falsenodes and adjacent ties are included in the observed network data, while in truth theydo not exist. Table 2 summarizes the description of the error type and their applicationand implication to the uncertainty characteristic in the observed network data.
Robustness of centrality measures under uncertainty 311
2.3 Computing measure accuracy
Each distinct network-pair has several statistics associated with it that indicate mea-sure agreement from a variety of standpoints, i.e., its exact accuracy from variousperspectives at several levels. There are 20 separate statistics computed for each dis-tinct network-pair. The assemblage of these statistics can be envisaged as a two-dimension table: across one dimension are the five network measures, e.g., degreecentrality; across the other dimension are four specially-crafted metrics.4 We con-ceptualize these metrics into two groups, labeled: top-node and top-group. Each met-ric is delineated according to how it is derived; this, therefore reflects the level ofits expressiveness towards a measure’s accuracy. The top-node metrics are named:top-1, top-3, and top-10%. The value assigned to each metric is the result of a com-parison between a rank-ordered list of nodes obtained from the true network witha similarly constructed list obtained from the observed network. The metrics areso named according to the size of a rank-ordered list of nodes obtained from theobserved network. The resulting value indicates a quantity reflecting the level ofagreement between the paired true and observed networks; thus, the value for eachstatistic indicates a given measure’s congruence, thus accuracy, at a different levelof strictness. The top-node metrics are indicative of how uncertainty affects the re-liability of a measure to accurately identify the individual node that truly has thehighest value for that measure, e.g., the top-ranked node according to degree cen-trality is the one note with the highest value of all nodes in the network. Essentiallythese indicate the agreement, or not, of The top-node metrics are particularly usefulwith respect to the key player question (Borgatti 2006), identifying nodes of rela-tive importance (White and Smyth 2003), and identifying network elites (Burt 1978;Masuda and Konno 2006), but can also be quantitatively indicative of measure ro-bustness as established by Borgatti et al. (2006).
To determine the value of the various metrics in the top-node group, we di-chotomize (a binary value, either 1 or 0, for true and false, respectively) a comparisonof the membership between the two rank-based lists: Top 1 is an indication that thetop-rank node in the true network is also the top-ranked node in the observed; Top 3is an indication that the top-rank node in the true network is one of the top 3 nodesin the observed network; and Top 10% is an indication that the top-rank node in thetrue network is also ranked in the top 10% (relative to number of nodes in the truenetwork) in the observed network.
The metric in the top-group is overlap, which is a value indicative of how uncer-tainty affects the reliability of a measure to accurately identify the top set of nodes in
4Herein, we adopted some of the same accuracy metrics as those crafted by Borgatti et al. (2006), so as toease the feasibility of conjoining our result and because of inherent limitations of the traditional statisticalapproaches. Indeed, other more traditional statistical approaches for evaluating rank data are available,e.g., Spearman rho and Kendall’s tau, but are not utilized here due to their constraint of requiring squareddata. In this study, there are situations when the two rank-ordered lists may not be complete, i.e., in thecase of node-remove error type. It should be noted that some work has been done on handling non-squaredata in this realm (see Papaioannou and Loukas 1984; Alvo and Cabilio 1995), but we purposefully opt tobe in harmony with Borgatti et al. For an experiment that assessed the reliability of complete rank-orderedlists under data uncertainty, we suggest reading Kim and Jeong (2007).
312 T.L. Frantz et al.
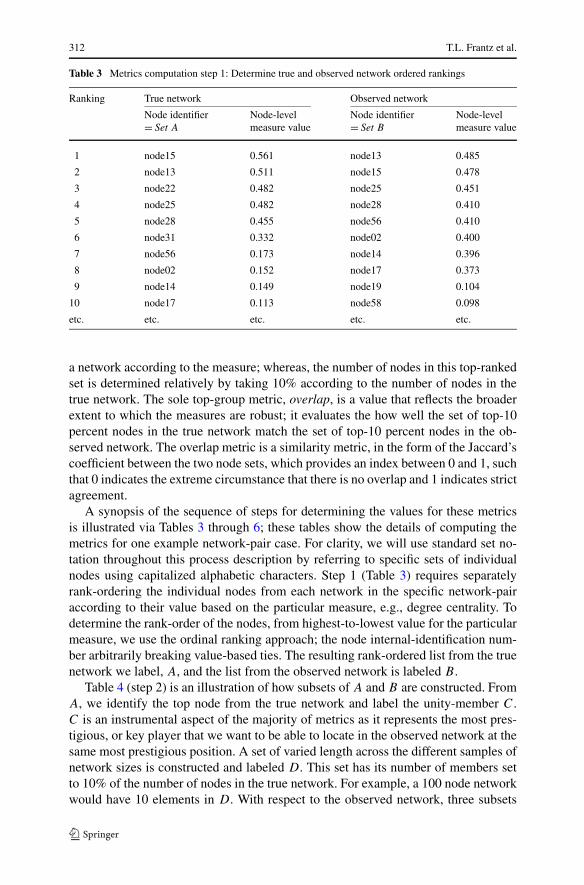
Table 3 Metrics computation step 1: Determine true and observed network ordered rankings
Ranking True network Observed network
Node identifier= Set A
Node-levelmeasure value
Node identifier= Set B
Node-levelmeasure value
1 node15 0.561 node13 0.485
2 node13 0.511 node15 0.478
3 node22 0.482 node25 0.451
4 node25 0.482 node28 0.410
5 node28 0.455 node56 0.410
6 node31 0.332 node02 0.400
7 node56 0.173 node14 0.396
8 node02 0.152 node17 0.373
9 node14 0.149 node19 0.104
10 node17 0.113 node58 0.098
etc. etc. etc. etc. etc.
a network according to the measure; whereas, the number of nodes in this top-rankedset is determined relatively by taking 10% according to the number of nodes in thetrue network. The sole top-group metric, overlap, is a value that reflects the broaderextent to which the measures are robust; it evaluates the how well the set of top-10percent nodes in the true network match the set of top-10 percent nodes in the ob-served network. The overlap metric is a similarity metric, in the form of the Jaccard’scoefficient between the two node sets, which provides an index between 0 and 1, suchthat 0 indicates the extreme circumstance that there is no overlap and 1 indicates strictagreement.
A synopsis of the sequence of steps for determining the values for these metricsis illustrated via Tables 3 through 6; these tables show the details of computing themetrics for one example network-pair case. For clarity, we will use standard set no-tation throughout this process description by referring to specific sets of individualnodes using capitalized alphabetic characters. Step 1 (Table 3) requires separatelyrank-ordering the individual nodes from each network in the specific network-pairaccording to their value based on the particular measure, e.g., degree centrality. Todetermine the rank-order of the nodes, from highest-to-lowest value for the particularmeasure, we use the ordinal ranking approach; the node internal-identification num-ber arbitrarily breaking value-based ties. The resulting rank-ordered list from the truenetwork we label, A, and the list from the observed network is labeled B .
Table 4 (step 2) is an illustration of how subsets of A and B are constructed. FromA, we identify the top node from the true network and label the unity-member C.C is an instrumental aspect of the majority of metrics as it represents the most pres-tigious, or key player that we want to be able to locate in the observed network at thesame most prestigious position. A set of varied length across the different samples ofnetwork sizes is constructed and labeled D. This set has its number of members setto 10% of the number of nodes in the true network. For example, a 100 node networkwould have 10 elements in D. With respect to the observed network, three subsets
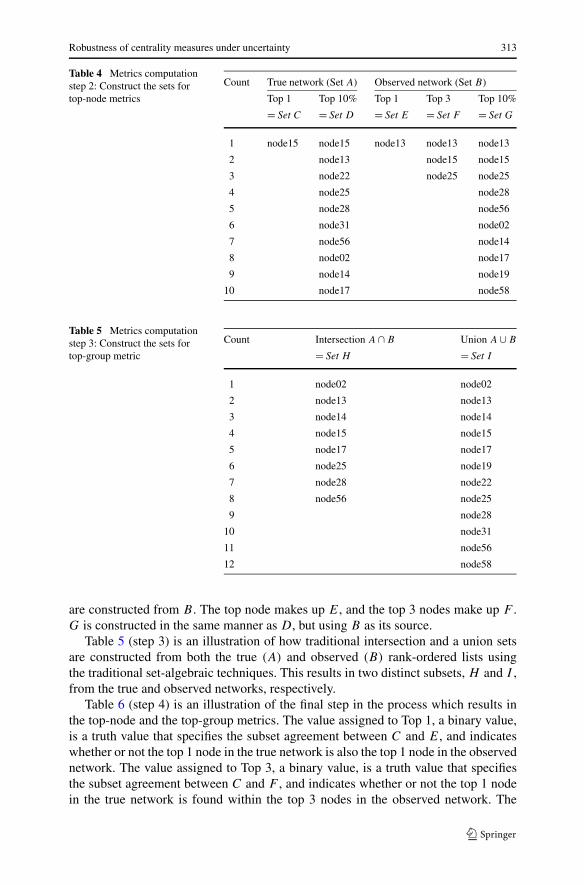
Robustness of centrality measures under uncertainty 313
Table 4 Metrics computationstep 2: Construct the sets fortop-node metrics
Count True network (Set A) Observed network (Set B)
Top 1 Top 10% Top 1 Top 3 Top 10%
= Set C = Set D = Set E = Set F = Set G
1 node15 node15 node13 node13 node13
2 node13 node15 node15
3 node22 node25 node25
4 node25 node28
5 node28 node56
6 node31 node02
7 node56 node14
8 node02 node17
9 node14 node19
10 node17 node58
Table 5 Metrics computationstep 3: Construct the sets fortop-group metric
Count Intersection A ∩ B Union A ∪ B
= Set H = Set I
1 node02 node02
2 node13 node13
3 node14 node14
4 node15 node15
5 node17 node17
6 node25 node19
7 node28 node22
8 node56 node25
9 node28
10 node31
11 node56
12 node58
are constructed from B . The top node makes up E, and the top 3 nodes make up F .G is constructed in the same manner as D, but using B as its source.
Table 5 (step 3) is an illustration of how traditional intersection and a union setsare constructed from both the true (A) and observed (B) rank-ordered lists usingthe traditional set-algebraic techniques. This results in two distinct subsets, H and I ,from the true and observed networks, respectively.
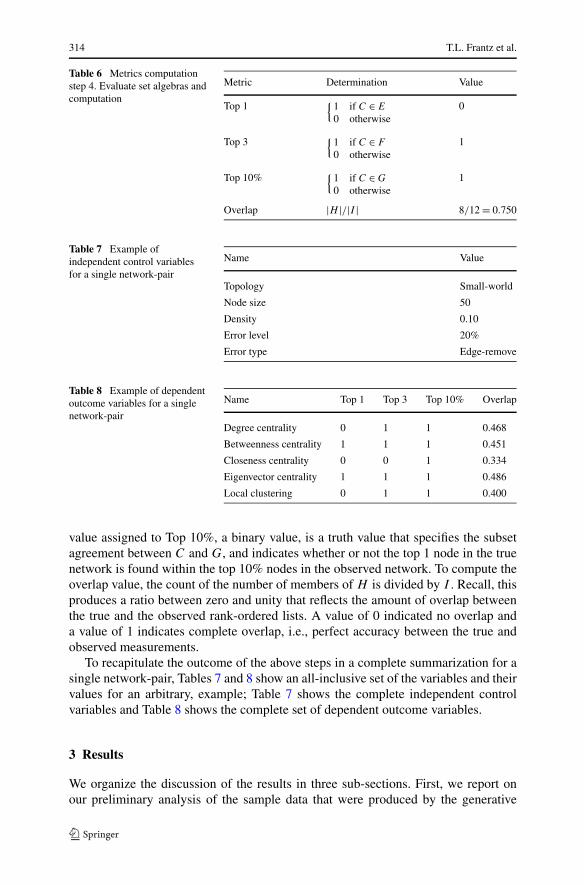
Table 6 (step 4) is an illustration of the final step in the process which results inthe top-node and the top-group metrics. The value assigned to Top 1, a binary value,is a truth value that specifies the subset agreement between C and E, and indicateswhether or not the top 1 node in the true network is also the top 1 node in the observednetwork. The value assigned to Top 3, a binary value, is a truth value that specifiesthe subset agreement between C and F , and indicates whether or not the top 1 nodein the true network is found within the top 3 nodes in the observed network. The
314 T.L. Frantz et al.
Table 6 Metrics computationstep 4. Evaluate set algebras andcomputation
Metric Determination Value
Top 1{
1 if C ∈ E
0 otherwise0
Top 3{
1 if C ∈ F
0 otherwise1
Top 10%{
1 if C ∈ G
0 otherwise1
Overlap |H |/|I | 8/12 = 0.750
Table 7 Example ofindependent control variablesfor a single network-pair
Name Value
Topology Small-world
Node size 50
Density 0.10
Error level 20%
Error type Edge-remove
Table 8 Example of dependentoutcome variables for a singlenetwork-pair
Name Top 1 Top 3 Top 10% Overlap
Degree centrality 0 1 1 0.468
Betweenness centrality 1 1 1 0.451
Closeness centrality 0 0 1 0.334
Eigenvector centrality 1 1 1 0.486
Local clustering 0 1 1 0.400
value assigned to Top 10%, a binary value, is a truth value that specifies the subsetagreement between C and G, and indicates whether or not the top 1 node in the truenetwork is found within the top 10% nodes in the observed network. To compute theoverlap value, the count of the number of members of H is divided by I . Recall, thisproduces a ratio between zero and unity that reflects the amount of overlap betweenthe true and the observed rank-ordered lists. A value of 0 indicated no overlap anda value of 1 indicates complete overlap, i.e., perfect accuracy between the true andobserved measurements.
To recapitulate the outcome of the above steps in a complete summarization for asingle network-pair, Tables 7 and 8 show an all-inclusive set of the variables and theirvalues for an arbitrary, example; Table 7 shows the complete independent controlvariables and Table 8 shows the complete set of dependent outcome variables.
3 Results
We organize the discussion of the results in three sub-sections. First, we report onour preliminary analysis of the sample data that were produced by the generative
Robustness of centrality measures under uncertainty 315
processes described in the Method section. Next, we report on our statistical analysisof the effect of the network topology on the accuracy of top-node outcome metrics.Lastly, we report on the statistical effects of network topology on the accuracy oftop-group outcome metrics.
3.1 Preliminary analysis of sample data
The sample-data generation process yielded 622,719 independent network-pairs;each whose true-network was constructed by one of the topology-specific genera-tive algorithms, and a copy then perturbed according to specific error characteristics.The true-networks were constructed of fixed network size of 25, 50 or 100 nodes andwere effectively drawn from a range of possible densities according to the precinctsof the stylized topology. The uncertainty in the observed network was introduced inthe form of a specific error type and level, e.g., edge-remove, 10%.
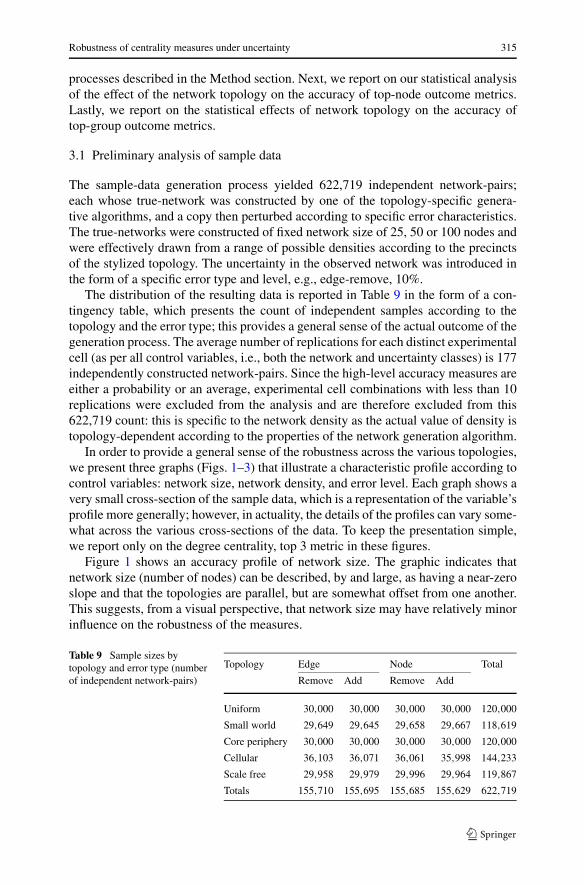
The distribution of the resulting data is reported in Table 9 in the form of a con-tingency table, which presents the count of independent samples according to thetopology and the error type; this provides a general sense of the actual outcome of thegeneration process. The average number of replications for each distinct experimentalcell (as per all control variables, i.e., both the network and uncertainty classes) is 177independently constructed network-pairs. Since the high-level accuracy measures areeither a probability or an average, experimental cell combinations with less than 10replications were excluded from the analysis and are therefore excluded from this622,719 count: this is specific to the network density as the actual value of density istopology-dependent according to the properties of the network generation algorithm.
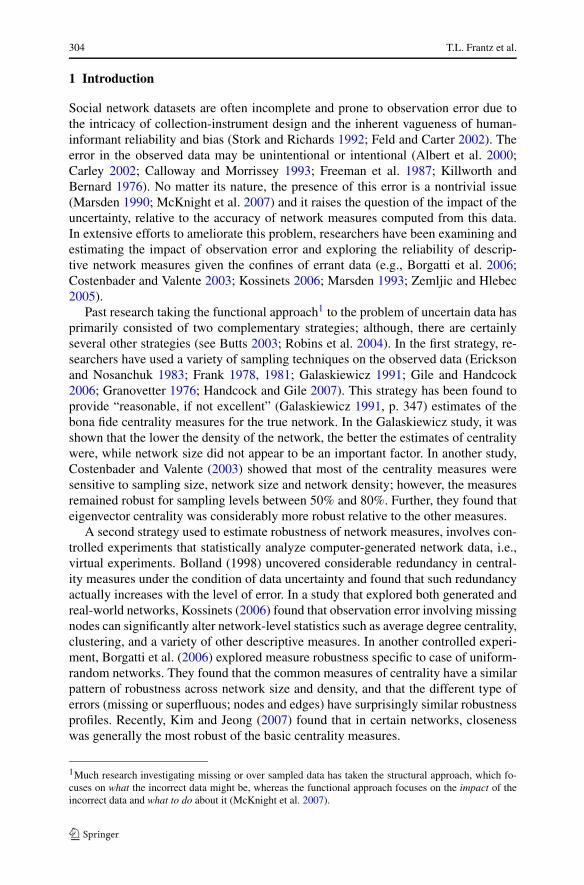
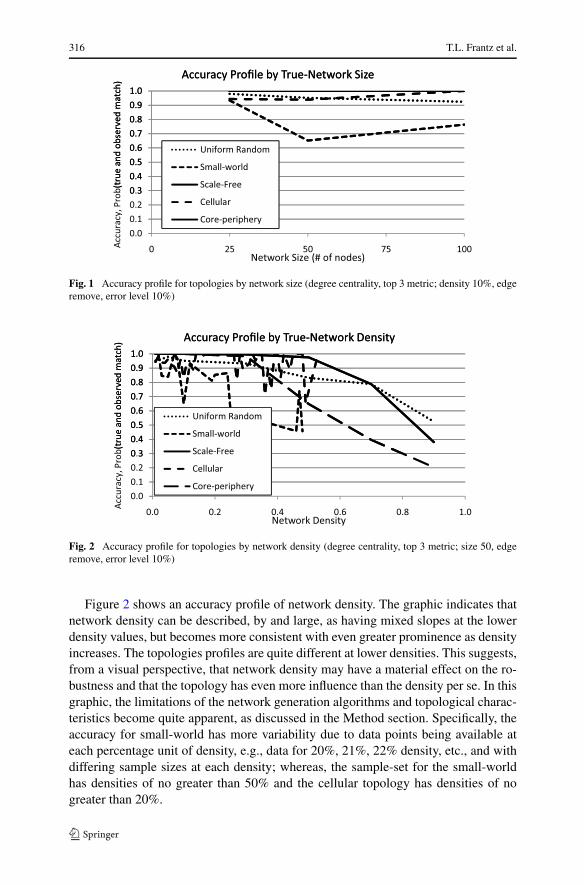
In order to provide a general sense of the robustness across the various topologies,we present three graphs (Figs. 1–3) that illustrate a characteristic profile according tocontrol variables: network size, network density, and error level. Each graph shows avery small cross-section of the sample data, which is a representation of the variable’sprofile more generally; however, in actuality, the details of the profiles can vary some-what across the various cross-sections of the data. To keep the presentation simple,we report only on the degree centrality, top 3 metric in these figures.
Figure 1 shows an accuracy profile of network size. The graphic indicates thatnetwork size (number of nodes) can be described, by and large, as having a near-zeroslope and that the topologies are parallel, but are somewhat offset from one another.This suggests, from a visual perspective, that network size may have relatively minorinfluence on the robustness of the measures.
Table 9 Sample sizes bytopology and error type (numberof independent network-pairs)
Topology Edge Node Total
Remove Add Remove Add
Uniform 30,000 30,000 30,000 30,000 120,000
Small world 29,649 29,645 29,658 29,667 118,619
Core periphery 30,000 30,000 30,000 30,000 120,000
Cellular 36,103 36,071 36,061 35,998 144,233
Scale free 29,958 29,979 29,996 29,964 119,867
Totals 155,710 155,695 155,685 155,629 622,719
316 T.L. Frantz et al.
Fig. 1 Accuracy profile for topologies by network size (degree centrality, top 3 metric; density 10%, edgeremove, error level 10%)
Fig. 2 Accuracy profile for topologies by network density (degree centrality, top 3 metric; size 50, edgeremove, error level 10%)
Figure 2 shows an accuracy profile of network density. The graphic indicates thatnetwork density can be described, by and large, as having mixed slopes at the lowerdensity values, but becomes more consistent with even greater prominence as densityincreases. The topologies profiles are quite different at lower densities. This suggests,from a visual perspective, that network density may have a material effect on the ro-bustness and that the topology has even more influence than the density per se. In thisgraphic, the limitations of the network generation algorithms and topological charac-teristics become quite apparent, as discussed in the Method section. Specifically, theaccuracy for small-world has more variability due to data points being available ateach percentage unit of density, e.g., data for 20%, 21%, 22% density, etc., and withdiffering sample sizes at each density; whereas, the sample-set for the small-worldhas densities of no greater than 50% and the cellular topology has densities of nogreater than 20%.
Robustness of centrality measures under uncertainty 317
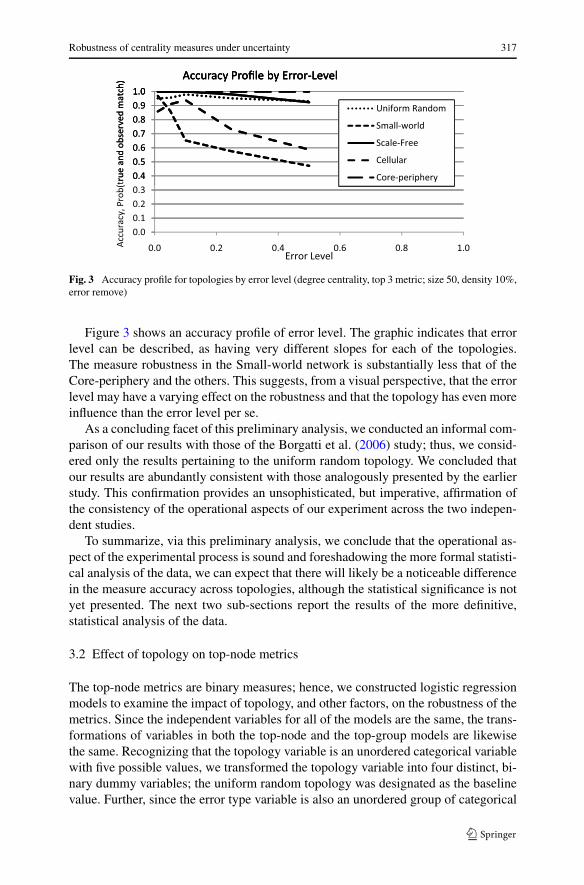
Fig. 3 Accuracy profile for topologies by error level (degree centrality, top 3 metric; size 50, density 10%,error remove)
Figure 3 shows an accuracy profile of error level. The graphic indicates that errorlevel can be described, as having very different slopes for each of the topologies.The measure robustness in the Small-world network is substantially less that of theCore-periphery and the others. This suggests, from a visual perspective, that the errorlevel may have a varying effect on the robustness and that the topology has even moreinfluence than the error level per se.
As a concluding facet of this preliminary analysis, we conducted an informal com-parison of our results with those of the Borgatti et al. (2006) study; thus, we consid-ered only the results pertaining to the uniform random topology. We concluded thatour results are abundantly consistent with those analogously presented by the earlierstudy. This confirmation provides an unsophisticated, but imperative, affirmation ofthe consistency of the operational aspects of our experiment across the two indepen-dent studies.
To summarize, via this preliminary analysis, we conclude that the operational as-pect of the experimental process is sound and foreshadowing the more formal statisti-cal analysis of the data, we can expect that there will likely be a noticeable differencein the measure accuracy across topologies, although the statistical significance is notyet presented. The next two sub-sections report the results of the more definitive,statistical analysis of the data.
3.2 Effect of topology on top-node metrics
The top-node metrics are binary measures; hence, we constructed logistic regressionmodels to examine the impact of topology, and other factors, on the robustness of themetrics. Since the independent variables for all of the models are the same, the trans-formations of variables in both the top-node and the top-group models are likewisethe same. Recognizing that the topology variable is an unordered categorical variablewith five possible values, we transformed the topology variable into four distinct, bi-nary dummy variables; the uniform random topology was designated as the baselinevalue. Further, since the error type variable is also an unordered group of categorical
318 T.L. Frantz et al.
values, it too was transformed into set of dummy variables; in the this case, we cap-tured their values within two distinct, binary variables. The error type edge removewas fashioned as the baseline value for this group, i.e., both dummy variables are si-multaneously set with a value of zero. Moreover, we examined each of the remainingthree non-categorical, main effect variables (size, density and error level) for linearityand determined that error level is the only variable that necessitated a transformationto meet the assumptions of the regression technique. We found that the logarithmicfunction provided the best linear transformation for the error level variable and usedthis transformation for all models. Furthermore, it was not necessary to transformeither the size or the density variables. Moreover, we ruled out the utility of usinginteraction terms in the regression equations as there was little expectation of a mate-rial statistical interaction between the independent variables; our initial examinationof various regression mixture models corroborated this. An analysis of pairwise cor-relation showed no colinearity problems. The resulting full, logit based, log-oddsregression model is shown as (1)
logit(pi) = β0 + β1 × size + β2 × ln(density) + β3 × errorLevel
+5∑
i=4
(βi × errorType) +9∑
i=6
(βi × topology) (1)
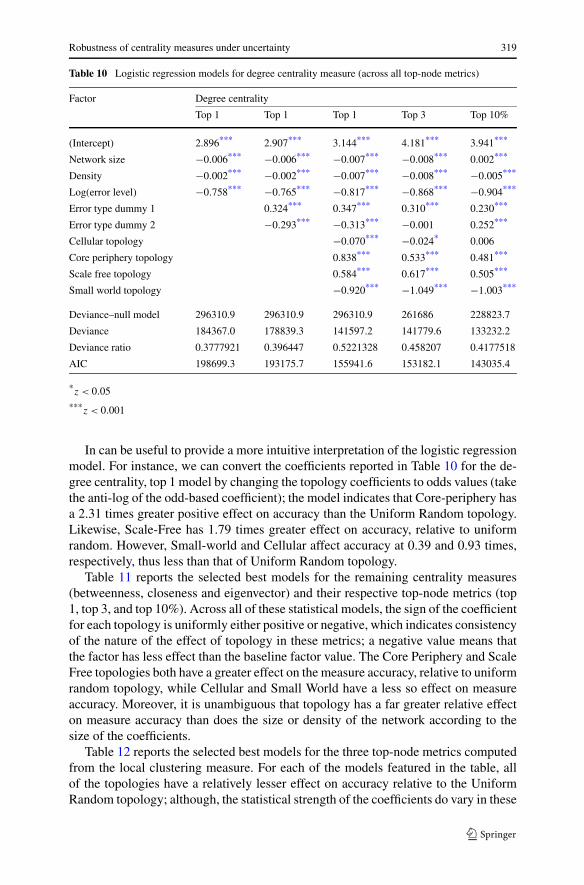
In order to appraise the extent to which a specific logit model is better than its basemodel (the model with only an intercept), the deviance difference is regularly com-puted between the two models of interest. These and all other combinations of possi-ble models were constructed and deviance computed. Table 10 reports the coefficientsof the logistic regression for a selected set of these models, specific to the degreecentrality measure, top-node metrics. We describe three complete models for Top 1,constructed step-wise by increasing the number of factors, then we present only theselected, best full-models for the Top 3 and Top 10% metrics. Since the models areconstructed using logistic regression, thus the regression equation is evaluated usingmaximum likelihood, the deviance is used as a criterion for quantifying the lack offit for a model to the observed data; therefore, the lower the value of the deviancestatistic, the better the model. When looking at only the first three Top 1 models re-ported in the table, the deviance is smallest for the model with the topology factorsand is an improvement over the simpler models. As would be expected, the devianceincreases as more terms are added to at the model, but since the Akaike (1973) in-formation criterion (AIC), which introduces a penalty for the number of parametersin a model, confirms that the additional parameters, thus increased complexity, ofthe model is justified. Focusing on the three finalized models Top 1, Top 3, and Top10%, reported in Table 10, error level has high negative-effect on accuracy and bothsize and density have relatively little effect on the accuracy. However, collectively,the topology variables have a larger effect on accuracy that approaches and even sur-passes the effect of log (error level). The negative coefficient of a logit model impliesthat the predicted probability curve goes down to the right, which is the case in allof the factors except the Core Periphery and Scale Free topologies. From this we canconclude there is a relationship between topology and the measures that differs acrossdiffering topologies.
Robustness of centrality measures under uncertainty 319
Table 10 Logistic regression models for degree centrality measure (across all top-node metrics)
Factor Degree centrality
Top 1 Top 1 Top 1 Top 3 Top 10%
(Intercept) 2.896*** 2.907*** 3.144*** 4.181*** 3.941***
Network size −0.006*** −0.006*** −0.007*** −0.008*** 0.002***
Density −0.002*** −0.002*** −0.007*** −0.008*** −0.005***
Log(error level) −0.758*** −0.765*** −0.817*** −0.868*** −0.904***
Error type dummy 1 0.324*** 0.347*** 0.310*** 0.230***
Error type dummy 2 −0.293*** −0.313*** −0.001 0.252***
Cellular topology −0.070*** −0.024* 0.006
Core periphery topology 0.838*** 0.533*** 0.481***
Scale free topology 0.584*** 0.617*** 0.505***
Small world topology −0.920*** −1.049*** −1.003***
Deviance–null model 296310.9 296310.9 296310.9 261686 228823.7
Deviance 184367.0 178839.3 141597.2 141779.6 133232.2
Deviance ratio 0.3777921 0.396447 0.5221328 0.458207 0.4177518
AIC 198699.3 193175.7 155941.6 153182.1 143035.4
*z < 0.05
***z < 0.001
In can be useful to provide a more intuitive interpretation of the logistic regressionmodel. For instance, we can convert the coefficients reported in Table 10 for the de-gree centrality, top 1 model by changing the topology coefficients to odds values (takethe anti-log of the odd-based coefficient); the model indicates that Core-periphery hasa 2.31 times greater positive effect on accuracy than the Uniform Random topology.Likewise, Scale-Free has 1.79 times greater effect on accuracy, relative to uniformrandom. However, Small-world and Cellular affect accuracy at 0.39 and 0.93 times,respectively, thus less than that of Uniform Random topology.
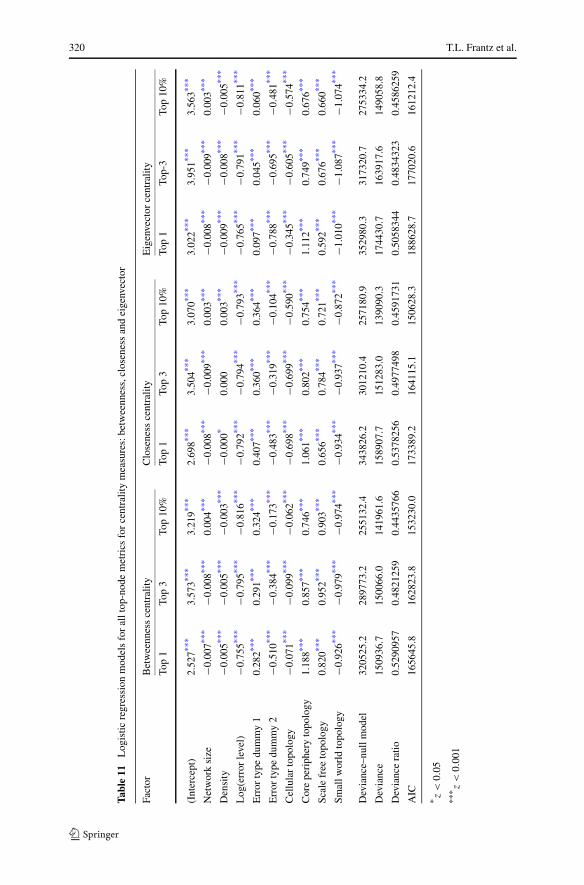
Table 11 reports the selected best models for the remaining centrality measures(betweenness, closeness and eigenvector) and their respective top-node metrics (top1, top 3, and top 10%). Across all of these statistical models, the sign of the coefficientfor each topology is uniformly either positive or negative, which indicates consistencyof the nature of the effect of topology in these metrics; a negative value means thatthe factor has less effect than the baseline factor value. The Core Periphery and ScaleFree topologies both have a greater effect on the measure accuracy, relative to uniformrandom topology, while Cellular and Small World have a less so effect on measureaccuracy. Moreover, it is unambiguous that topology has a far greater relative effecton measure accuracy than does the size or density of the network according to thesize of the coefficients.
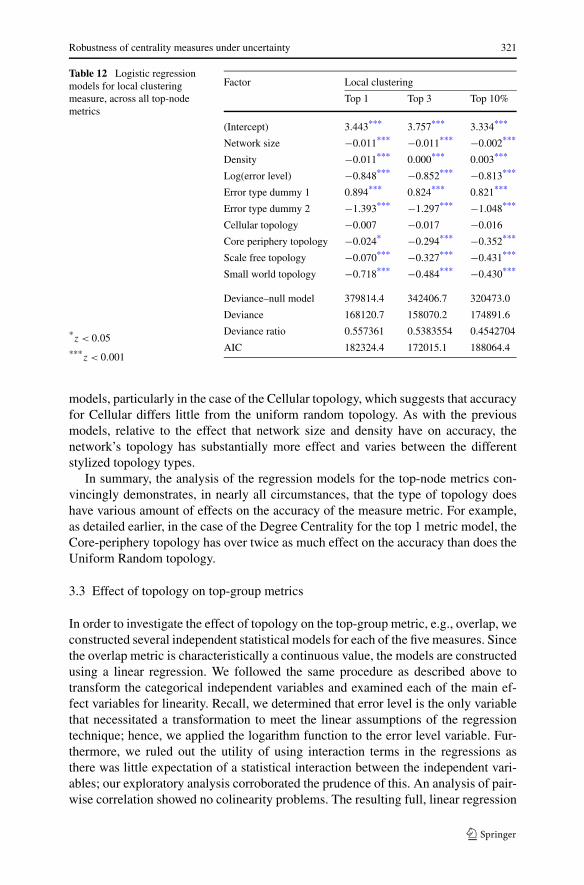
Table 12 reports the selected best models for the three top-node metrics computedfrom the local clustering measure. For each of the models featured in the table, allof the topologies have a relatively lesser effect on accuracy relative to the UniformRandom topology; although, the statistical strength of the coefficients do vary in these
320 T.L. Frantz et al.
Tabl
e11
Log
istic
regr
essi
onm
odel
sfo
ral
ltop
-nod
em
etri
csfo
rce
ntra
lity
mea
sure
s:be
twee
nnes
s,cl
osen
ess
and
eige
nvec
tor
Fact
orB
etw
eenn
ess
cent
ralit
yC
lose
ness
cent
ralit
yE
igen
vect
orce
ntra
lity
Top
1To
p3
Top
10%
Top
1To
p3
Top
10%
Top
1To
p-3
Top
10%
(Int
erce
pt)
2.52
7***
3.57
3***
3.21
9***
2.69
8***
3.50
4***
3.07
0***
3.02
2***
3.95
1***
3.56
3***
Net
wor
ksi
ze−0
.007
***
−0.0
08**
*0.
004**
*−0
.008
***
−0.0
09**
*0.
003**
*−0
.008
***
−0.0
09**
*0.
003**
*
Den
sity
−0.0
05**
*−0
.005
***
−0.0
03**
*−0
.000
*0.
000
0.00
3***
−0.0
09**
*−0
.008
***
−0.0
05**
*
Log
(err
orle
vel)
−0.7
55**
*−0
.795
***
−0.8
16**
*−0
.792
***
−0.7
94**
*−0
.793
***
−0.7
65**
*−0
.791
***
−0.8
11**
*
Err
orty
pedu
mm
y1
0.28
2***
0.29
1***
0.32
4***
0.40
7***
0.36
0***
0.36
4***
0.09
7***
0.04
5***
0.06
0***
Err
orty
pedu
mm
y2
−0.5
10**
*−0
.384
***
−0.1
73**
*−0
.483
***
−0.3
19**
*−0
.104
***
−0.7
88**
*−0
.695
***
−0.4
81**
*
Cel
lula
rto
polo
gy−0
.071
***
−0.0
99**
*−0
.062
***
−0.6
98**
*−0
.699
***
−0.5
90**
*−0
.345
***
−0.6
05**
*−0
.574
***
Cor
epe
riph
ery
topo
logy
1.18
8***
0.85
7***
0.74
6***
1.06
1***
0.80
2***
0.75
4***
1.11
2***
0.74
9***
0.67
6***
Scal
efr
eeto
polo
gy0.
820**
*0.
952**
*0.
903**
*0.
656**
*0.
784**
*0.
721**
*0.
592**
*0.
676**
*0.
660**
*
Smal
lwor
ldto
polo
gy−0
.926
***
−0.9
79**
*−0
.974
***
−0.9
34**
*−0
.937
***
−0.8
72**
*−1
.010
***
−1.0
87**
*−1
.074
***
Dev
ianc
e–nu
llm
odel
3205
25.2
2897
73.2
2551
32.4
3438
26.2
3012
10.4
2571
80.9
3529
80.3
3173
20.7
2753
34.2
Dev
ianc
e15
0936
.715
0066
.014
1961
.615
8907
.715
1283
.013
9090
.317
4430
.716
3917
.614
9058
.8
Dev
ianc
era
tio0.
5290
957
0.48
2125
90.
4435
766
0.53
7825
60.
4977
498
0.45
9173
10.
5058
344
0.48
3432
30.
4586
259
AIC
1656
45.8
1628
23.8
1532
30.0
1733
89.2
1641
15.1
1506
28.3
1886
28.7
1770
20.6
1612
12.4
*z<
0.05
***z<
0.00
1
Robustness of centrality measures under uncertainty 321
Table 12 Logistic regressionmodels for local clusteringmeasure, across all top-nodemetrics
*z < 0.05
***z < 0.001
Factor Local clustering
Top 1 Top 3 Top 10%
(Intercept) 3.443*** 3.757*** 3.334***
Network size −0.011*** −0.011*** −0.002***
Density −0.011*** 0.000*** 0.003***
Log(error level) −0.848*** −0.852*** −0.813***
Error type dummy 1 0.894*** 0.824*** 0.821***
Error type dummy 2 −1.393*** −1.297*** −1.048***
Cellular topology −0.007 −0.017 −0.016
Core periphery topology −0.024* −0.294*** −0.352***
Scale free topology −0.070*** −0.327*** −0.431***
Small world topology −0.718*** −0.484*** −0.430***
Deviance–null model 379814.4 342406.7 320473.0
Deviance 168120.7 158070.2 174891.6
Deviance ratio 0.557361 0.5383554 0.4542704
AIC 182324.4 172015.1 188064.4
models, particularly in the case of the Cellular topology, which suggests that accuracyfor Cellular differs little from the uniform random topology. As with the previousmodels, relative to the effect that network size and density have on accuracy, thenetwork’s topology has substantially more effect and varies between the differentstylized topology types.
In summary, the analysis of the regression models for the top-node metrics con-vincingly demonstrates, in nearly all circumstances, that the type of topology doeshave various amount of effects on the accuracy of the measure metric. For example,as detailed earlier, in the case of the Degree Centrality for the top 1 metric model, theCore-periphery topology has over twice as much effect on the accuracy than does theUniform Random topology.
3.3 Effect of topology on top-group metrics
In order to investigate the effect of topology on the top-group metric, e.g., overlap, weconstructed several independent statistical models for each of the five measures. Sincethe overlap metric is characteristically a continuous value, the models are constructedusing a linear regression. We followed the same procedure as described above totransform the categorical independent variables and examined each of the main ef-fect variables for linearity. Recall, we determined that error level is the only variablethat necessitated a transformation to meet the linear assumptions of the regressiontechnique; hence, we applied the logarithm function to the error level variable. Fur-thermore, we ruled out the utility of using interaction terms in the regressions asthere was little expectation of a statistical interaction between the independent vari-ables; our exploratory analysis corroborated the prudence of this. An analysis of pair-wise correlation showed no colinearity problems. The resulting full, linear regression
322 T.L. Frantz et al.
Table 13 Linear regression models for all measures (top-group metrics: overlap)
Factor Degree Betweenness Closeness Eigenvector Local
centrality centrality centrality centrality clustering
overlap overlap overlap overlap overlap
(Intercept) 0.869*** 0.851*** 0.853*** 0.905*** 1.040***
Network size −0.000*** −0.001*** −0.000*** −0.001*** −0.001***
Density 0.000*** 0.001*** 0.001*** −0.000*** −0.002***
Log(error level) −0.117*** −0.124*** −0.129*** −0.126*** −0.134***
Error type dummy 1 0.135*** 0.134*** 0.137*** 0.105*** 0.187***
Error type dummy 2 −0.088*** −0.132*** −0.113*** −0.146*** −0.222***
Cellular topology 0.068*** 0.048*** −0.039*** 0.016*** 0.019***
Core periphery topology 0.204*** 0.195*** 0.215*** 0.227*** 0.000
Scale free topology 0.097*** 0.126*** 0.103*** 0.093*** −0.044***
Small world topology −0.155*** −0.128*** −0.135*** −0.141*** −0.103***
Adjusted R2 0.4760208 0.4156237 0.4674364 0.3922854 0.4290301
***z < 0.001
model is shown as (2)
pi = β0 + β1 × size + β2 × ln(density) + β3 × errorLevel
+5∑
i=4
βierrorType +9∑
i=6
βi topology + ε. (2)
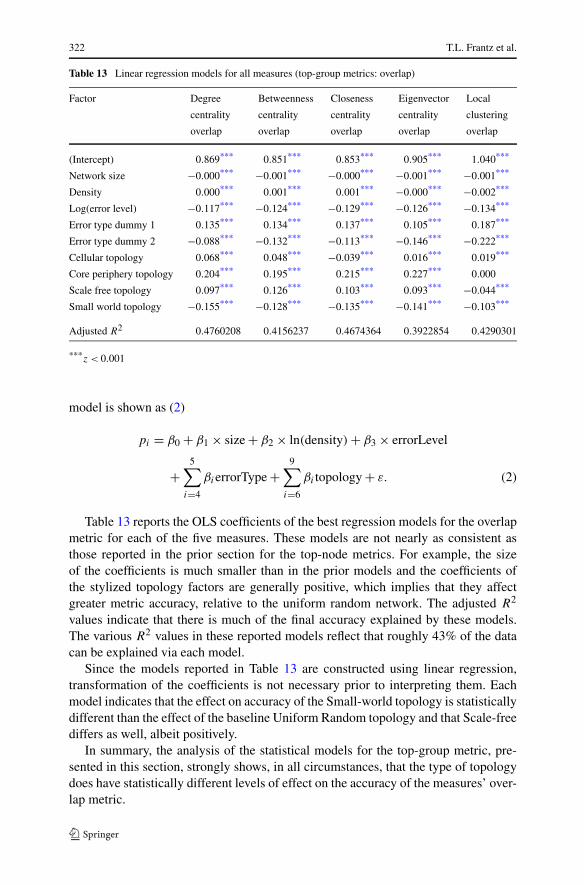
Table 13 reports the OLS coefficients of the best regression models for the overlapmetric for each of the five measures. These models are not nearly as consistent asthose reported in the prior section for the top-node metrics. For example, the sizeof the coefficients is much smaller than in the prior models and the coefficients ofthe stylized topology factors are generally positive, which implies that they affectgreater metric accuracy, relative to the uniform random network. The adjusted R2
values indicate that there is much of the final accuracy explained by these models.The various R2 values in these reported models reflect that roughly 43% of the datacan be explained via each model.
Since the models reported in Table 13 are constructed using linear regression,transformation of the coefficients is not necessary prior to interpreting them. Eachmodel indicates that the effect on accuracy of the Small-world topology is statisticallydifferent than the effect of the baseline Uniform Random topology and that Scale-freediffers as well, albeit positively.
In summary, the analysis of the statistical models for the top-group metric, pre-sented in this section, strongly shows, in all circumstances, that the type of topologydoes have statistically different levels of effect on the accuracy of the measures’ over-lap metric.
Robustness of centrality measures under uncertainty 323
4 Discussion
This paper reports a systematic examination of the robustness of several networkmeasures under different conditions of uncertainty, when controlling across severalstylized network topologies. The results supported the conjecture: in the circumstanceof uncertainty, the topological form of the true network has a measurable effect onthe robustness of the measures when taken from the observed network data, relativeto value taken from the ground truth. The chief finding this study is that the topologyof the in-truth network does have a statically strong effect on the level of reliabilityof the centrality and the local clustering measures as computed from the observeddata. Our findings suggest that making a priori classification of the topology of anetwork provides important additional information about the probabilistic reliabilityof the network measures that are computed over the observed data. Moreover, ourresults highlight the specific quantitative vulnerabilities of different topologies to thevarious combinations of error type, level and specific network measures.
Relative to a uniformly random network—one exclusive of being characterized asbeing of a stylized topology—topology can have either a greater positive or negativeeffect on the accuracy of measure, but often a material effect nonetheless. In otherwords, we found that the probability of the most prestigious actor or group of actorsidentified by an observed network dataset being accurate, in-actuality, is impacted bythe topology of the in-truth network.
In the situation of the uniform random topology, our results are consistent withthose reported by Borgatti et al. (2006). In terms of the other four topologies, themagnitudes of the effects on accuracy differ significantly across error type and thetopology. In particular, the results show that the level of the affect on accuracy dif-fers according to topology, more so than it differs across network size, density, errortype and error level. For instance, node-remove errors tend to impact scale-free net-works severely, particularly in the case of betweenness centrality. On the other hand,node-add error types have significantly higher impact on small-world networks, whenconsidering the local clustering measure, than to the rest of the topologies.
Our findings have implications to researchers and practitioners alike. In short, theamount of confidence we can have for estimating the truly prestige actors in a net-work, according to their network position, is affected, either hindered or improved,by the topology of the network. When estimating the level of confidence for a mea-sure taken from the data, we must first estimate the topology classification of thetrue network. The identification of these weaknesses in a particular network topolo-gies provide important guidance for future empirical work, particularly in the area ofidentifying “key players” (Borgatti 2006), in terms of the reliability of results underconditions of measurement error. This level of confidence may even be applicableto individuals during the selection process of them seeking new relationships (seeFortunato et al. 2006).
Finally, our results also have important implications from a data collection pointof view. In the inherent trade-off between resource cost and completeness of datacollected, our findings indicate that the researchers should include an estimate of thetrue topology of the subject network in making an assessment of this important trade-off. For instance, if we are interested in a key node based on degree centrality, in
324 T.L. Frantz et al.
order to achieve an 85% level of confidence that we accurately identified the mostprestigious actor in a 100-node, 10% density network, within a group of three, wewould require a 50% or greater level of accuracy in the data collection process if thenetwork is a Small World, but only a 40% level of accuracy for a Cellular network.Indeed, at this juncture, how to determine this accuracy level itself is an unknowntask. In other words, our findings provide guidelines on how accurate the data must bewhen collected in order to reach particular levels of accuracy in the network measuresunder consideration.
4.1 Limitations
We draw attention to three limitations of the methodology applied in this study. Eachof these is a matter that warrants future research. The most relevant limitation is theunproven nature of the network creation algorithms used in the true-network gen-eration procedure. It remains an open question whether the algorithms statisticallyand accurately simulate the drawing of a random sample from the complete distrib-ution of all the possible networks of a specific topology. There may be an unequalbias towards particular instances of isomorphic networks, within the topology; we areworking with generative models rather than utilizing a much preferred random sam-pling technique that draws uniformly from all possible configurations of a topologywith the given parameters. Verifying these algorithms is well known as a computa-tionally prohibitive task. Secondly, we acknowledge that the various characteristicsparticular to a given topology may alter the results when the entire range of possibleparameters for a topology is studied. That is to say, for example, the findings for ascale-free network may differ for alpha being set to 3, rather than a value of 2 as set inthis experiment. Moreover, we operate on the supposition that errors in social data arerandom in nature, when they may in fact have a variety of non-independent biases,sources and patterns (see Rubin 1976), which in turn, may present influences in thedata actually observed and, therefore the character of the observed error. Finally, ansignificant limitation of this study is that we only investigated errors of a single typerather than the more real-world scenario of a mixture of errors, i.e., observed networkdata having a blend of over and underreported, ties and nodes, in the same dataset.
4.2 Future research
We present five recommendations for future research that we believe would pro-vide further advancement towards a remedy to the inherent data-uncertainty problem.First, while we have shown that topology has an affect on the robustness of centralitymeasures, there is the next question about the precise extent to which each of themany different topologies and their variants distinctively affect the robustness pro-files. In the guise of network topology labels, subtle differences in the methodologyfor generating a given network may possibly result in diverse robustness levels. Per-haps it is a characteristic of a topology (thus a family of topologies) that matter, not aspecific topology itself. For example, there are many ways to generate a core periph-ery network; each variant needs to be explored and individually related to a specificrobustness profile. Further, technically, characteristically, a small-world network is
Robustness of centrality measures under uncertainty 325
also a scale-free network (Amaral et al. 2000), so there needs to be more attentionto the precise topological characteristics, beyond the approach of merely using thelabel-names of a topology, as is used herein.
Second, as we and others have openly acknowledged, errors in observed socialnetwork data most likely are not truly random in nature. Early, as well as this, re-search specific toward investigating robustness has been limited to being based onrandom error as opposed to more realistic, systemic or non-randomly influenced er-rors in the data. One notable exception to this is the Marsden (1990) study whichexamined both random and non-random errors. Certainly, this makes the researchmuch more complicated, but the community will be rewarded with theories based onricher scenarios.
Third, it should prove invaluable to analysts when they have statistically valid con-fidence levels and error bounds of descriptive network measures applicable to theirspecific observed network. Such quantities may possibly be based on the known pa-rameters and characteristics of the observed network combined with the a priori truenetwork information and error characteristics. To date, analysts are constrained by us-ing measures determined only from the observed network, thus are being limited toworking with descriptive statistic only. The analysis of networks will take a huge leapforward when confidence levels can be assigned to collected data that will ultimatelylead to including p-vales with the statistics we calculate from observed data.
Fourth, the issue of alias nodes is a matter of consequence. Particularly in studieswith data collection automated by computer, the problem of entity disambiguation,i.e., a single node being recorded as separate multiple nodes, is type of error thatlikely has very real implications to analysis. The resulting network measures based onthe observed data would most likely lead to meaningless information without somemathematical adjustments being applied; foremost, the impact of this type of errormust be understood.
Finally, the fifth area that can contribute to addressing the data-error scenario is tobegin to verify the results drawn from virtual experiments, such as this, by testing theresults against real-world, empirical networks; although, at this point we only brieflyponder how such a study might be designed, since the ground-truth in the real worldis never really known and thus cannot be used to verify the accuracy of the observed.
Acknowledgements The authors acknowledge and thank several indispensable people for their price-less contribution to this study. Edo Airoldi and Jeff Reminga provided critical algorithms and softwarecomponents for the study; Eunice J. Kim provided supportive feedback on the statistics and Brian Hirsh-man and Stephen Borgatti for scholarly advice as well. This work was supported by the Department ofDefense and National Science Foundation under MKIDS program (IIS0218466) and the Office of NavalResearch under Dynamic Network Analysis program (N00014-02-1-0973) and WVHTCFTAVI071375and N00014-06-1-0104, with additional support from the Air Force Office of Sponsored Research (MURI:Computational Modeling of Cultural Dimensions in Adversary Organizations, FA9550-05-1-0388), TAVI,HEINZ-IGERT TRAINING PROGRAM (NSF, DGE-9972762), VIBES (ARMY DAAD19-01C0065),Dynamic Network Analysis Applications to Counter-Narcotic Investigations Related to Marijuana (ONR,N00014-06-1-0104 (Mod#2)), MOAT Phase II, C2 Insight (DARPA, N0000610921), Network Analysisand Computational Modeling for Combating Terrorist Threats (DYNET:MMVOIA Quick Reaction Fund)(ONR, N000140610921), and Determine Ability to Model Terrorist Networks Unit (SPAWAR). The viewsand conclusions contained in this document are those of the authors and should not be interpreted as rep-resenting the official policies, either expressed or implied, of the Department of Defense, the NationalScience Foundation, the Office of Naval Research, or the US government.

326 T.L. Frantz et al.
References
Airoldi EM, Carley KM (2005) Sampling algorithms for pure network topologies: Stability and separabil-ity of metric embeddings. SIGKDD Explor 7:13–22. Special Issue on Link Mining
Akaike H (1973) Information theory and an extension of the maximum likelihood principle. In: Petrov BN,Csàki F (eds) Second international symposium on inference theory. Akadémiaia Kaidó, Budapest, pp267–281
Albert R, Jeong H, Barabasi AL (1999) Diameter of the World Wide Web. Nature 401:130–131Albert E, Jeong H, Barabasi AL (2000) Error and attack tolerance of complex networks. Nature 406:378–
382Alvo M, Cabilio P (1995) Rank correlation methods for missing data. Can J Stat (La Revue Canadienne
de Statistique) 23:345–358Amaral LAN, Scala A, Barthelemy M, Stanley HE (2000) Classes of small-world networks. Proc Nat Acad
Sci USA 97:11149–11152Barabasi AL, Albert E (1999) Emergence of scaling in random networks. Science 286:509–512Bollobás B (2001) Random graphs, 2nd edn. Cambridge University Press, CambridgeBonacich P (1987) Power and centrality: A family of measures. Am J Soc 92:1170–1182Borgatti SP (2006) Identifying sets of key players in a network. Comput Math Organ Theory 12:21–34Borgatti SP, Everett MG (1999) Models of core/periphery structures. Soc Netw 21:375–395Borgatti S, Reminga J (2005) Personal communicationBorgatti SP, Carley KM, Krackhardt D (2006) On the robustness of centrality measures under conditions
of imperfect data. Soc Netw 28:124–136Burt R (1978) Stratification and prestige among elite experts in methodological and mathematical sociol-
ogy circa 1975. Soc Netw 1(1978):105–158Butts CT (2003) Network inference, error, and informant (in)accuracy: a Bayesian approach. Soc Netw
25:103–140Carley KM (2002) Dynamic network analysis. In: Breiger R, Carley KM, Pattison P (eds) Dynamic social
network modeling and analysis: 2002 workshop summary and papers. National Academies Press,Washington
Calloway M, Morrissey JP (1993) Accuracy and reliability of self-reported data in interorganizationalnetworks. Soc Netw 15:377–398
Costenbader E, Valente TW (2003) The stability of centrality measures when networks are sampled. SocNetw 25:283–307
Davis GF, Yoo M, Baker WE (2003) The small world of the American corporate elite, 1982–2001. StrategOrgan 1:301–326
Erdös P, Rényi A (1959) On random graphs. Publ Math 6:290–297Erickson BH, Nosanchuk TA (1983) Applied network sampling. Soc Netw 5(4):367–382Feld SL, Carter WC (2002) Detecting measurement bias in respondent reports of personal networks. Soc
Netw 24:365–383Faloutsos M, Faloutsos P, Faloutsos C (1999) On power-law relationships of the Internet topology, ACM
SIGCOMM’99. Comput Commun Rev 29:251–262Fortunato S, Flammini A, Menczer F (2006) Scale-free network growth by ranking. Phys Rev Lett
96:218701Frank O (1978) Sampling and estimation in large social networks. Soc Netw 1:91–101Frank O (1981) A survey of statistical methods for graph analysis. In: Leinhardt S (ed) Sociological
methodology. Jossey-Bass, San FranciscoFrantz TL, Carley KM (2005) A formal characterization of cellular networks. Technical report CMU-ISRI-
05-109, School of Computer Science, Carnegie Mellon UniversityFreeman LC (1977) A set of measures of centrality based on betweenness. Sociometry 40:35–41Freeman LC (1979) Centrality in social networks: I conceptual clarification. Soc Netw 1:215–239Freeman LC, Rommey Kimball A, Freeman SC (1987) Cognitive structure and informant accuracy. Am
Anthropol 89:310–325Galaskiewicz J (1991) Estimating point centrality using different network sampling techniques. Soc Netw
13:347–386Gile K, Handcock MA (2006) Model-based assessment of the impact of missing data on inference for
networks. Working paper, no. 66, Center for Statistics and Social Sciences, University of WashingtonGranovetter M (1976) Network sampling: Some first steps. Am J Soc 81:1287–1303Guare J (1990) Six degrees of separation: A play. Vintage, New York
Robustness of centrality measures under uncertainty 327
Handcock MS, Gile K (2007) Modeling social networks with sampled or missing data. Working paper, no.75, Center for Statistics and Social Sciences, University of Washington
Killworth PD, Bernard HR (1976) Informant accuracy in social network data. Human Organ 35:269–286Kim PJ, Jeong H (2007) Reliability of rank order in sampled networks. Eur Phys J B 55:109–114Kossinets G (2006) Effect of missing data in social networks. Soc Netw 28:247–268Krebs VE (2002) Mapping networks of terrorist cells. Connections 24:43–52Marsden PV (1990) Network data and measurement. Ann Rev Soc 16:435–463Marsden PV (1993) The reliability of network density and composition measures. Soc Netw 15:300–421Masuda N, Konno N (2006) VIP-club phenomenon: Emergence of elites and masterminds in social net-
works. Soc Netw 28:297–309Mayntz R (2004) Organizational forms of terrorism: Hierarchy, network, or a type sui generis? MpIfG
discussion paper 04.4. Max Planck Institute for the Study of SocietiesMcKnight PE, McKnight KM, Sindani S, Figueredo AJ (2007) Missing data. Guilford, New YorkMilgram S (1967) The small world problem. Psychol Today 2:60–67Newman ME, Watts DJ (1999) Scaling and percolation in the small-world network model. Phys Rev E
60:7332–7342Newman ME, Watts DJ, Strogatz SH (2002) Random graphs models of social networks. Proc Nat Acad
Sci 99:2566–2572Papaioannou T, Loukas S (1984) Inequalities on rank correlation with missing data. J R Stat Soc, Ser B
46:68–71Powell WW, White DR, Koput KW, Owen-Smith J (2005) Network dynamics and field evolution: The
growth of interorganizational collaboration in the life sciences. Am J Soc 110:1132–1205Ravid G, Rafaeli S (2004) Asynchronous discussion groups as small world and scale free networks. First
Monday 9(9), SeptemberRobins G, Pattison P, Woolcock J (2004) Missing data in networks: Exponential random graph (p∗) models
for networks with non-respondents. Soc Netw 26:257–283Ronfeldt D, Arquilla J (2001) Networks, netwars, and the fight for the future. First Monday 6Rubin DB (1976) Inference and missing data. Biometrika 63:581–592Simon HA (1955) On a class of skew distribution functions. Biometrika 42:425–440Stork D, Richards WD (1992) Nonrespondents in communication network studies: Problems and possibil-
ities. Group Organ Manag 17:193–209Stuart T, Robinson D (2000) The origins of inter-organizational networks. Working paper, Columbia Busi-
ness SchoolTsvetovat M, Carley KM (2005) Structural knowledge and success of anti-terrorist activity: The downside
of structural equivalence. J Soc Struct 6 (2005)Watts DJ (1999a) Small worlds: The dynamics of networks between order and randomness. Princeton
University Press, PrincetonWatts DJ (1999b) Networks, dynamics, and the small-world phenomenon. Am J Sociol 105:493–527Watts DJ, Strogatz SH (1998) Collective dynamics of ‘small-world’ networks. Nature 393:440–442White S, Smyth P (2003) Algorithms for estimating relative importance in networks. ACM SIGKDD’03,
August 24–27, WashingtonZemljic A, Hlebec V (2005) Reliability of measures of centrality and prominence. Soc Netw 27:73–88
Terrill L. Frantz received an Ed.D. in Organization Change from Pepperdine University and is currentlya Ph.D. student in Computation, Organizations and Society at Carnegie Mellon University. He holds anM.S. from the School of Computer Science at Carnegie Mellon and an MBA from the Stern School ofBusiness at New York University; He earned his B.S. in Business Administration from Drexel Universityin 1984. He has extensive experience in Information Technology as a Vice President at Morgan Stanleyand at JP Morgan and other global and local institutions. Terrill’s research interests include OrganizationalPost-Merger Integration, Organizational Network Analysis, and Computational Organization Theory.
Marcelo Cataldo received M.S. and Ph.D. degrees in Computation, Organizations and Society fromCarnegie Mellon University in 2007. He also received a B.S. in Information Systems from UniversidadTecnologica Nacional (Argentina) in 1996 and a M.S. in Information Networking from Carnegie MellonUniversity in 2000. His research interests are in the area of distributed product development with specialfocus on the relationship between the product architecture and the structure of the technical organization.Marcelo Cataldo is a Senior Research Engineer at Robert Bosch’s Research and Technology Center.

328 T.L. Frantz et al.
Kathleen M. Carley is the director of the Center for Computational Analysis of Social and OrganizationalSystems (CASOS), a university wide interdisciplinary center that brings together network analysis, com-puter science and organization science (www.casos.cmu.edu). Her research combines cognitive science,social networks and computer science to address complex social and organizational problems; Specificresearch areas are dynamic network analysis, computational social and organization theory, adaptationand evolution, text mining, and the impact of telecommunication technologies and policy on communi-cation, information diffusion, disease contagion and response within and among groups particularly indisaster or crisis situations. Dr. Carley is the director of the center for Computational Analysis of Socialand Organizational Systems (CASOS) which has over 35 members, both students and research staff. Sheis the founding co-editor of CMOT and has co-edited several books in the computational organizations anddynamic network area.