Embed Size (px)
Citation preview
Journal of Food Engineering 88 (2008) 364–372
Contents lists available at ScienceDirect
Journal of Food Engineering
journal homepage: www.elsevier .com/locate / j foodeng
Robust color space conversion and color distribution analysis techniques fordate maturity evaluation
Dah-Jye Lee *, James K. Archibald, Yu-Chou Chang, Christopher R. GrecoDepartment of Electrical and Computer Engineering, Brigham Young University, 459 CB, Provo, UT 84602, United States
a r t i c l e i n f o
Article history:Received 1 November 2007Received in revised form 1 January 2008Accepted 19 February 2008Available online 4 March 2008
Keywords:Machine visionColor space conversionColor gradingDate maturity evaluation
0260-8774/$ - see front matter � 2008 Elsevier Ltd. Adoi:10.1016/j.jfoodeng.2008.02.023
* Corresponding author. Tel.: +1 801 422 5923; faxE-mail address: [email protected] (D.-J. Lee).
a b s t r a c t
Color is important in evaluating quality and maturity level of many agricultural products. Color grading isan essential step in the processing and inventory control of fruits and vegetables that directly affects prof-itability. Dates are harvested at different levels of maturity that require different processing before thedates can be packed. Maturity evaluation is crucial to processing control, but conventional methodsare slow and labor-intensive. Because date maturity level correlates strongly with color, automated colorgrading could be used. A novel and robust color space conversion and color index distribution analysistechnique for automated date maturity evaluation that is well suited for commercial production is pre-sented in this paper. In contrast with more complex color grading techniques, the proposed methodmakes it easy for a human operator to specify and adjust color preference settings for different colorgroups representing distinct maturity levels. The performance of this robust color grading technique isdemonstrated using date samples collected from field testing.
� 2008 Elsevier Ltd. All rights reserved.
1. Introduction
A typical date packing facility in the United States packs be-tween 45 and 175 million individual dates each year. Date growersharvest all fruit from their orchards at the same time, yieldingdates with varying levels of maturity. After harvesting, the fruitscurrently undergo manual inspection to determine if they are ripeand ready for packaging or if further processing is required. Unripedates are sent to gain moisture in a hydrating building (most ma-ture), to ripen in the sun (medium), or to dry in a heated building(least mature). After drying, most dates ripen and become ready forpackaging. However, insufficient drying can cause dates to rot andturn sour, while excessive drying can cause the fruit skin to peel,lowering the fruit quality and decreasing its value. It is thereforecritical that the maturity of each harvested date be evaluated accu-rately so that it can be processed appropriately.
Depending on the maturity level, date colors range from yellowto dark red with many shades in between. The strong correlationbetween maturity level and color allows experienced sorters todetermine maturity level by visually examining the color of thefruit, a process used by Bard Valley Medjool Date Grower Associa-tion in California, USA. This important but labor-intensive sortingprocess constitutes a major expense for packers and growers. A ro-
ll rights reserved.
: +1 801 422 0201.
bust color grading technique could automate sorting and reducecosts.
Machine vision technology has been employed in many agricul-tural applications involving color grading. Machine vision systemsfor real-time color classification (Lee and Anbalagan, 1995; Lee,2000; Zhang et al., 1998) have been commercialized to grade foodproducts based on color. Other agricultural applications includethe color grading of fresh market peaches (Nimesh et al., 1993;Miller and Delwiche, 1989a,b; Singh et al., 1992), apples (Vargheseet al., 1991; Hung et al., 1993), potatoes (Tao et al., 1995), peppers(Shearer and Payne, 1990), cucumbers (Lin et al., 1993), tomatoes(Choi et al., 1995), and dates (Janobi, 1998). Many of these systemshave shown very promising results. Color sorting machines for ap-ples, potatoes, and tomatoes are commercially available.
To improve consistency, most color-grading systems convertcolor images captured in red, green, and blue (RGB) color compo-nents to a hue-saturation-intensity (HSI) representation. Process-ing decisions are then made primarily on the basis of color hue.Typically, the hue of the product is compared against reference val-ues to determine its color grade (Miller and Delwiche, 1989a,b).Unfortunately, neither RGB nor HSI color spaces are particularlywell suited to color grading. Of greatest concern is that selectedreference colors seldom represent a convenient or intuitive parti-tioning of the multi-dimensional color space. In particular, it is dif-ficult to define and adjust the boundaries between adjacent colorgrades and to analyze color distribution. This problem is discussedin detail in Section 2.1.
D.-J. Lee et al. / Journal of Food Engineering 88 (2008) 364–372 365
An effective, user-friendly method to categorize the maturitylevels of dates based on an analysis of their colors is presented inthis paper. This method does not require complicated machinelearning or artificial intelligence algorithms. It allows the user toobtain results in a manner similar to human color perception bymaking simple adjustments to color boundary thresholds. Forexample, the method allows the threshold for a particular gradeto be adjusted so that it includes fruit that is ‘‘slightly darker red”or ‘‘brighter yellow”. In combination with the proposed color distri-bution analysis capable of handling partial colors, this robust colorspace conversion method has been applied in commercial produc-tion to evaluate date maturity levels with very high accuracy.
2. Materials and methods
2.1. Problem and motivation
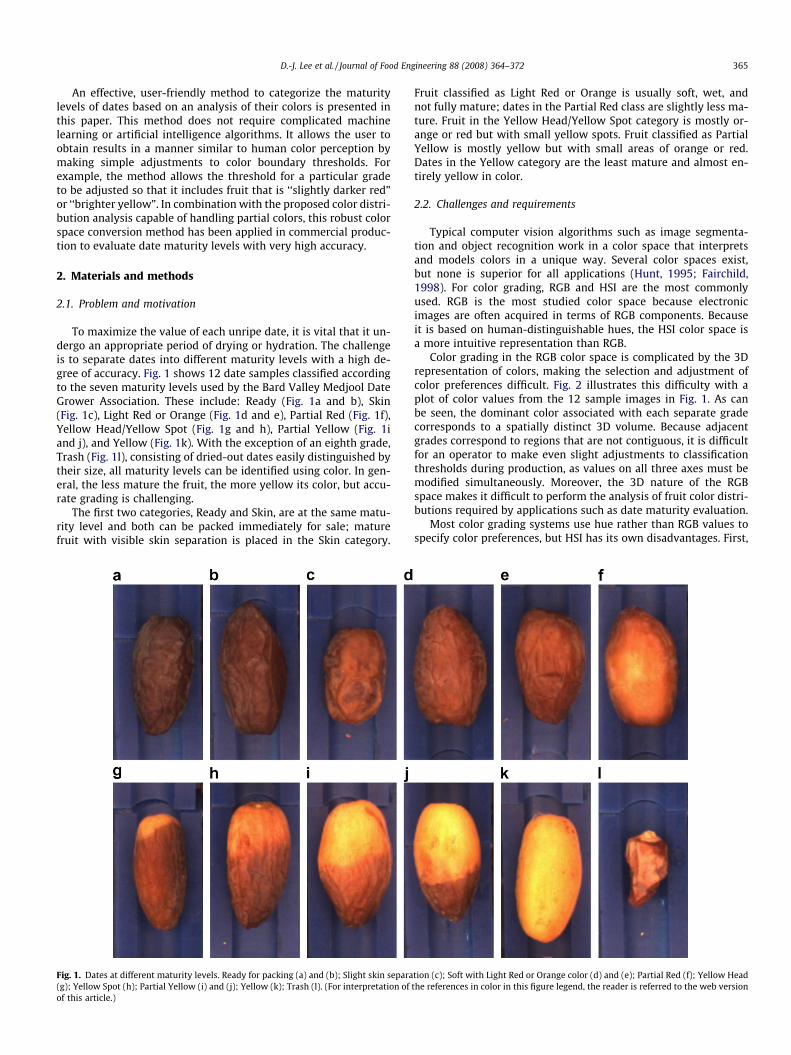
To maximize the value of each unripe date, it is vital that it un-dergo an appropriate period of drying or hydration. The challengeis to separate dates into different maturity levels with a high de-gree of accuracy. Fig. 1 shows 12 date samples classified accordingto the seven maturity levels used by the Bard Valley Medjool DateGrower Association. These include: Ready (Fig. 1a and b), Skin(Fig. 1c), Light Red or Orange (Fig. 1d and e), Partial Red (Fig. 1f),Yellow Head/Yellow Spot (Fig. 1g and h), Partial Yellow (Fig. 1iand j), and Yellow (Fig. 1k). With the exception of an eighth grade,Trash (Fig. 1l), consisting of dried-out dates easily distinguished bytheir size, all maturity levels can be identified using color. In gen-eral, the less mature the fruit, the more yellow its color, but accu-rate grading is challenging.
The first two categories, Ready and Skin, are at the same matu-rity level and both can be packed immediately for sale; maturefruit with visible skin separation is placed in the Skin category.
Fig. 1. Dates at different maturity levels. Ready for packing (a) and (b); Slight skin separa(g); Yellow Spot (h); Partial Yellow (i) and (j); Yellow (k); Trash (l). (For interpretation ofof this article.)
Fruit classified as Light Red or Orange is usually soft, wet, andnot fully mature; dates in the Partial Red class are slightly less ma-ture. Fruit in the Yellow Head/Yellow Spot category is mostly or-ange or red but with small yellow spots. Fruit classified as PartialYellow is mostly yellow but with small areas of orange or red.Dates in the Yellow category are the least mature and almost en-tirely yellow in color.
2.2. Challenges and requirements
Typical computer vision algorithms such as image segmenta-tion and object recognition work in a color space that interpretsand models colors in a unique way. Several color spaces exist,but none is superior for all applications (Hunt, 1995; Fairchild,1998). For color grading, RGB and HSI are the most commonlyused. RGB is the most studied color space because electronicimages are often acquired in terms of RGB components. Becauseit is based on human-distinguishable hues, the HSI color space isa more intuitive representation than RGB.
Color grading in the RGB color space is complicated by the 3Drepresentation of colors, making the selection and adjustment ofcolor preferences difficult. Fig. 2 illustrates this difficulty with aplot of color values from the 12 sample images in Fig. 1. As canbe seen, the dominant color associated with each separate gradecorresponds to a spatially distinct 3D volume. Because adjacentgrades correspond to regions that are not contiguous, it is difficultfor an operator to make even slight adjustments to classificationthresholds during production, as values on all three axes must bemodified simultaneously. Moreover, the 3D nature of the RGBspace makes it difficult to perform the analysis of fruit color distri-butions required by applications such as date maturity evaluation.
Most color grading systems use hue rather than RGB values tospecify color preferences, but HSI has its own disadvantages. First,
tion (c); Soft with Light Red or Orange color (d) and (e); Partial Red (f); Yellow Headthe references in color in this figure legend, the reader is referred to the web version
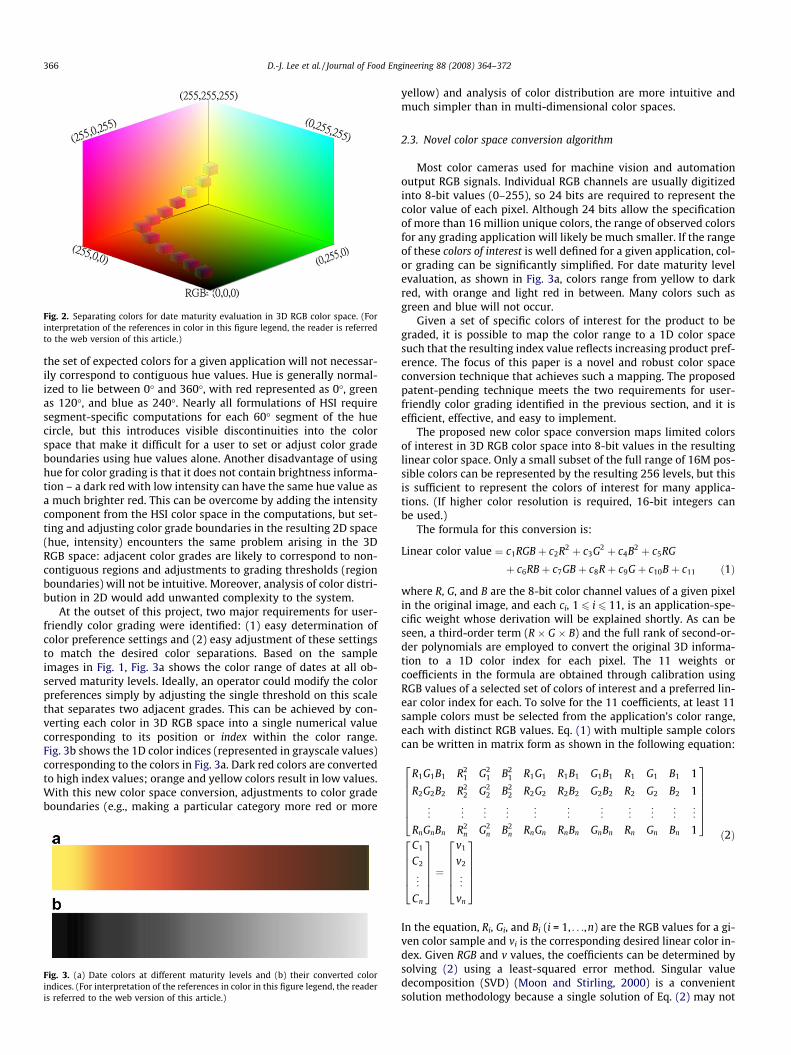
Fig. 2. Separating colors for date maturity evaluation in 3D RGB color space. (Forinterpretation of the references in color in this figure legend, the reader is referredto the web version of this article.)
366 D.-J. Lee et al. / Journal of Food Engineering 88 (2008) 364–372
the set of expected colors for a given application will not necessar-ily correspond to contiguous hue values. Hue is generally normal-ized to lie between 0� and 360�, with red represented as 0�, greenas 120�, and blue as 240�. Nearly all formulations of HSI requiresegment-specific computations for each 60� segment of the huecircle, but this introduces visible discontinuities into the colorspace that make it difficult for a user to set or adjust color gradeboundaries using hue values alone. Another disadvantage of usinghue for color grading is that it does not contain brightness informa-tion – a dark red with low intensity can have the same hue value asa much brighter red. This can be overcome by adding the intensitycomponent from the HSI color space in the computations, but set-ting and adjusting color grade boundaries in the resulting 2D space(hue, intensity) encounters the same problem arising in the 3DRGB space: adjacent color grades are likely to correspond to non-contiguous regions and adjustments to grading thresholds (regionboundaries) will not be intuitive. Moreover, analysis of color distri-bution in 2D would add unwanted complexity to the system.
At the outset of this project, two major requirements for user-friendly color grading were identified: (1) easy determination ofcolor preference settings and (2) easy adjustment of these settingsto match the desired color separations. Based on the sampleimages in Fig. 1, Fig. 3a shows the color range of dates at all ob-served maturity levels. Ideally, an operator could modify the colorpreferences simply by adjusting the single threshold on this scalethat separates two adjacent grades. This can be achieved by con-verting each color in 3D RGB space into a single numerical valuecorresponding to its position or index within the color range.Fig. 3b shows the 1D color indices (represented in grayscale values)corresponding to the colors in Fig. 3a. Dark red colors are convertedto high index values; orange and yellow colors result in low values.With this new color space conversion, adjustments to color gradeboundaries (e.g., making a particular category more red or more
Fig. 3. (a) Date colors at different maturity levels and (b) their converted colorindices. (For interpretation of the references in color in this figure legend, the readeris referred to the web version of this article.)
yellow) and analysis of color distribution are more intuitive andmuch simpler than in multi-dimensional color spaces.
2.3. Novel color space conversion algorithm
Most color cameras used for machine vision and automationoutput RGB signals. Individual RGB channels are usually digitizedinto 8-bit values (0–255), so 24 bits are required to represent thecolor value of each pixel. Although 24 bits allow the specificationof more than 16 million unique colors, the range of observed colorsfor any grading application will likely be much smaller. If the rangeof these colors of interest is well defined for a given application, col-or grading can be significantly simplified. For date maturity levelevaluation, as shown in Fig. 3a, colors range from yellow to darkred, with orange and light red in between. Many colors such asgreen and blue will not occur.
Given a set of specific colors of interest for the product to begraded, it is possible to map the color range to a 1D color spacesuch that the resulting index value reflects increasing product pref-erence. The focus of this paper is a novel and robust color spaceconversion technique that achieves such a mapping. The proposedpatent-pending technique meets the two requirements for user-friendly color grading identified in the previous section, and it isefficient, effective, and easy to implement.
The proposed new color space conversion maps limited colorsof interest in 3D RGB color space into 8-bit values in the resultinglinear color space. Only a small subset of the full range of 16M pos-sible colors can be represented by the resulting 256 levels, but thisis sufficient to represent the colors of interest for many applica-tions. (If higher color resolution is required, 16-bit integers canbe used.)
The formula for this conversion is:
Linear color value ¼ c1RGBþ c2R2 þ c3G2 þ c4B2 þ c5RG
þ c6RBþ c7GBþ c8Rþ c9Gþ c10Bþ c11 ð1Þ
where R, G, and B are the 8-bit color channel values of a given pixelin the original image, and each ci, 1 6 i 6 11, is an application-spe-cific weight whose derivation will be explained shortly. As can beseen, a third-order term (R � G � B) and the full rank of second-or-der polynomials are employed to convert the original 3D informa-tion to a 1D color index for each pixel. The 11 weights orcoefficients in the formula are obtained through calibration usingRGB values of a selected set of colors of interest and a preferred lin-ear color index for each. To solve for the 11 coefficients, at least 11sample colors must be selected from the application’s color range,each with distinct RGB values. Eq. (1) with multiple sample colorscan be written in matrix form as shown in the following equation:
R1G1B1 R21 G2
1 B21 R1G1 R1B1 G1B1 R1 G1 B1 1
R2G2B2 R22 G2
2 B22 R2G2 R2B2 G2B2 R2 G2 B2 1
..
. ... ..
. ... ..
. ... ..
. ... ..
. ... ..
.
RnGnBn R2n G2
n B2n RnGn RnBn GnBn Rn Gn Bn 1
2666664
3777775
C1
C2
..
.
Cn
266664
377775 ¼
v1
v2
..
.
vn
266664
377775
ð2Þ
In the equation, Ri, Gi, and Bi (i = 1, . . .,n) are the RGB values for a gi-ven color sample and vi is the corresponding desired linear color in-dex. Given RGB and v values, the coefficients can be determined bysolving (2) using a least-squared error method. Singular valuedecomposition (SVD) (Moon and Stirling, 2000) is a convenientsolution methodology because a single solution of Eq. (2) may not
D.-J. Lee et al. / Journal of Food Engineering 88 (2008) 364–372 367
exist due to imperfect selection of sample colors and desired colorindices. Moreover, SVD allows the use of more than 11 sample col-ors in solving for the optimal solution. Once the coefficients areknown, all image pixels can be mapped to the linear color indicesused for grading.
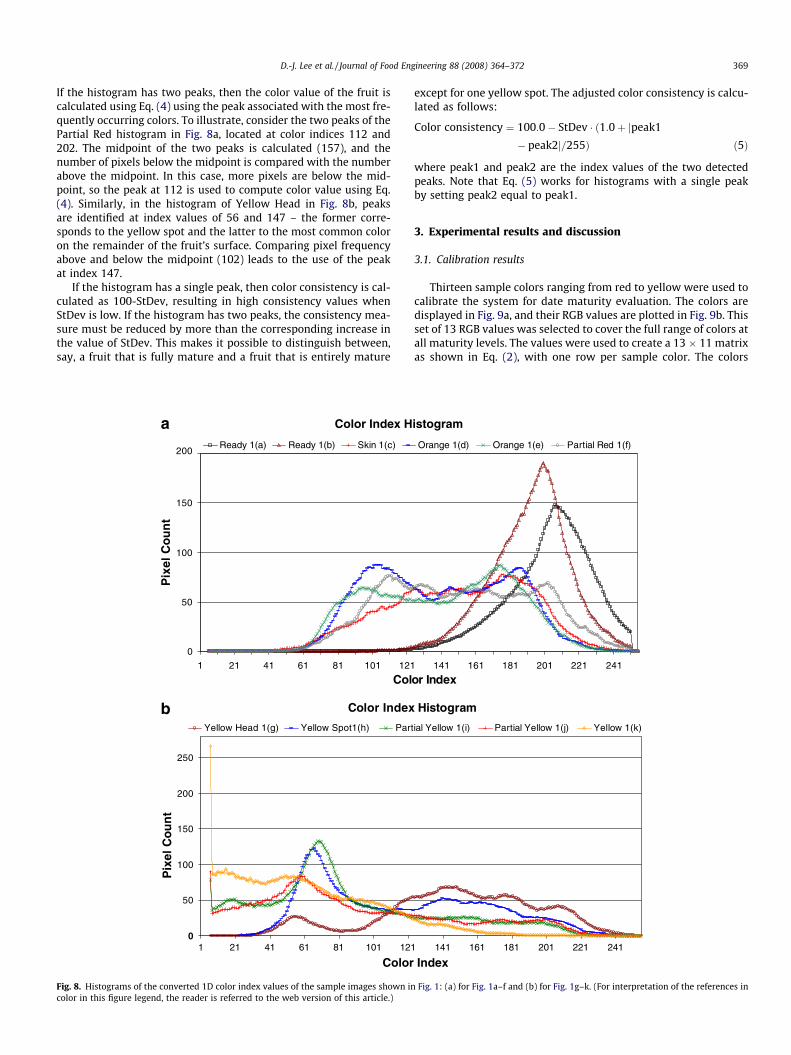
Fig. 4 illustrates the essential idea of the proposed new colorspace conversion technique. Fig. 4a shows the range of colors ofinterest for date maturity levels in 3D RGB color space, andFig. 4b shows (in 256-level grayscale) the corresponding index val-ues in the new 1D color space. Note that lower values representyellow fruit, while higher values represent more mature fruit.The ‘‘color tube” in Fig. 4a would effectively be widened if morecolors were observed in dates. In converting to the linear spaceusing Eq. (1), observed colors that lie outside the tube of pre-se-lected colors will be assigned an index value corresponding tothe closest RGB value within the tube.
2.4. Image processing
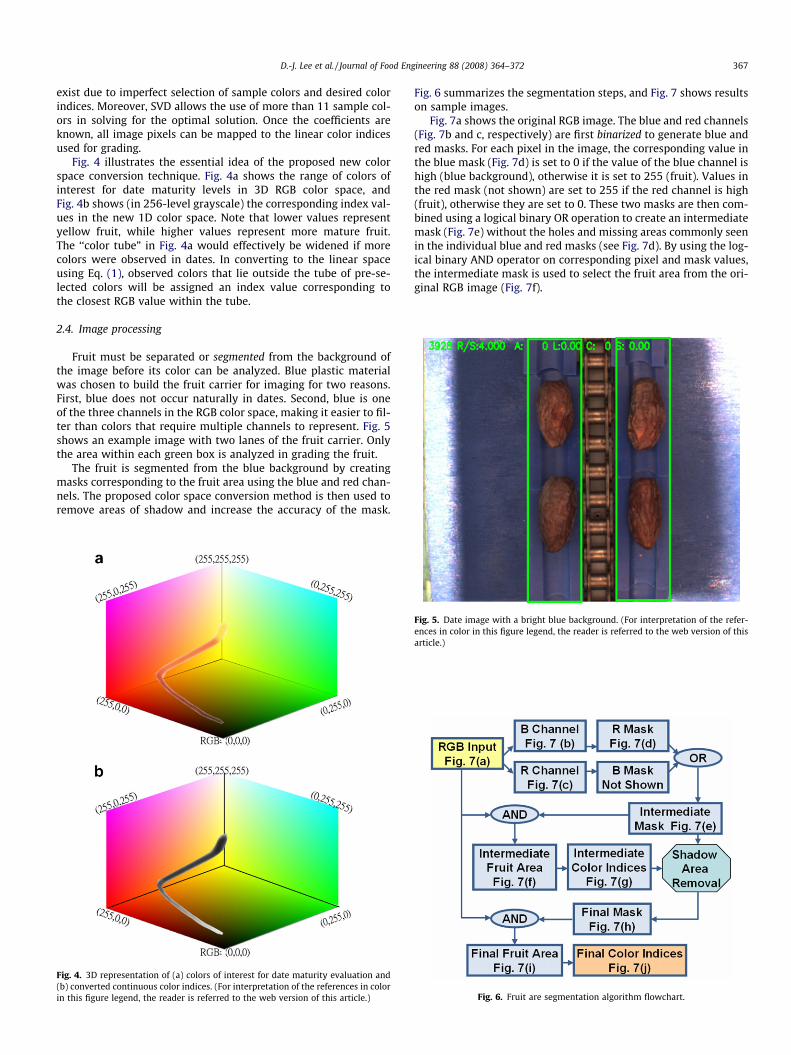
Fruit must be separated or segmented from the background ofthe image before its color can be analyzed. Blue plastic materialwas chosen to build the fruit carrier for imaging for two reasons.First, blue does not occur naturally in dates. Second, blue is oneof the three channels in the RGB color space, making it easier to fil-ter than colors that require multiple channels to represent. Fig. 5shows an example image with two lanes of the fruit carrier. Onlythe area within each green box is analyzed in grading the fruit.
The fruit is segmented from the blue background by creatingmasks corresponding to the fruit area using the blue and red chan-nels. The proposed color space conversion method is then used toremove areas of shadow and increase the accuracy of the mask.
Fig. 4. 3D representation of (a) colors of interest for date maturity evaluation and(b) converted continuous color indices. (For interpretation of the references in colorin this figure legend, the reader is referred to the web version of this article.)
Fig. 6 summarizes the segmentation steps, and Fig. 7 shows resultson sample images.
Fig. 7a shows the original RGB image. The blue and red channels(Fig. 7b and c, respectively) are first binarized to generate blue andred masks. For each pixel in the image, the corresponding value inthe blue mask (Fig. 7d) is set to 0 if the value of the blue channel ishigh (blue background), otherwise it is set to 255 (fruit). Values inthe red mask (not shown) are set to 255 if the red channel is high(fruit), otherwise they are set to 0. These two masks are then com-bined using a logical binary OR operation to create an intermediatemask (Fig. 7e) without the holes and missing areas commonly seenin the individual blue and red masks (see Fig. 7d). By using the log-ical binary AND operator on corresponding pixel and mask values,the intermediate mask is used to select the fruit area from the ori-ginal RGB image (Fig. 7f).
Fig. 5. Date image with a bright blue background. (For interpretation of the refer-ences in color in this figure legend, the reader is referred to the web version of thisarticle.)
Fig. 6. Fruit are segmentation algorithm flowchart.
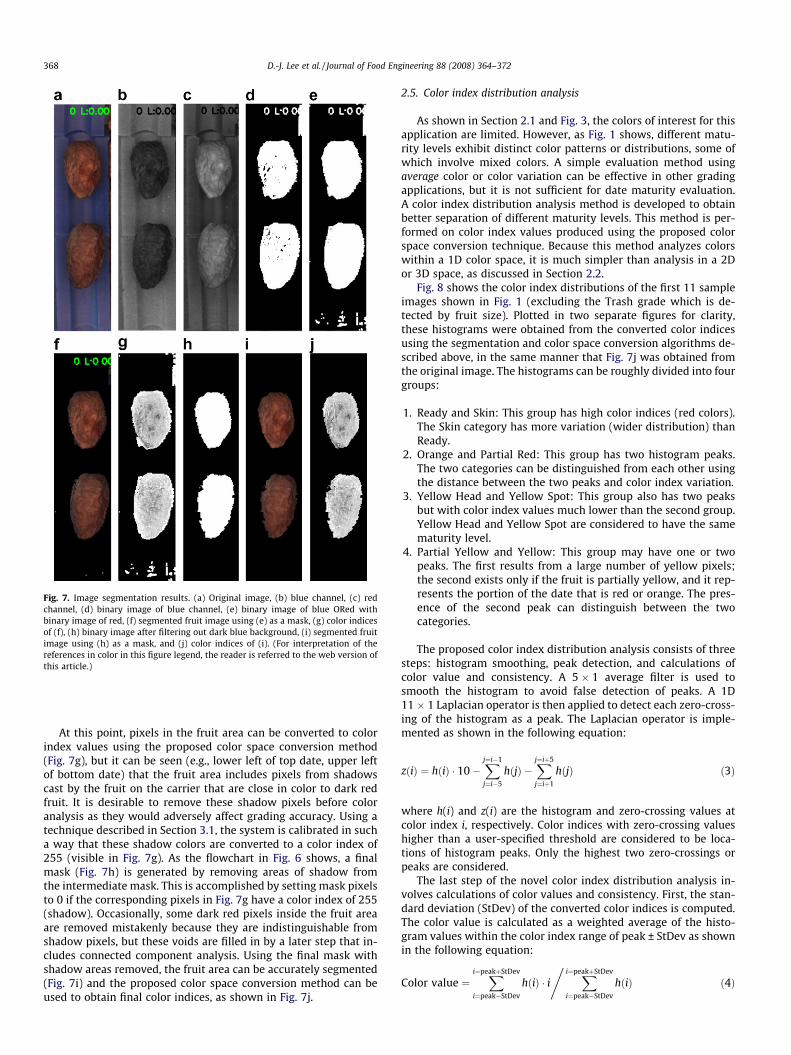
Fig. 7. Image segmentation results. (a) Original image, (b) blue channel, (c) redchannel, (d) binary image of blue channel, (e) binary image of blue ORed withbinary image of red, (f) segmented fruit image using (e) as a mask, (g) color indicesof (f), (h) binary image after filtering out dark blue background, (i) segmented fruitimage using (h) as a mask, and (j) color indices of (i). (For interpretation of thereferences in color in this figure legend, the reader is referred to the web version ofthis article.)
368 D.-J. Lee et al. / Journal of Food Engineering 88 (2008) 364–372
At this point, pixels in the fruit area can be converted to colorindex values using the proposed color space conversion method(Fig. 7g), but it can be seen (e.g., lower left of top date, upper leftof bottom date) that the fruit area includes pixels from shadowscast by the fruit on the carrier that are close in color to dark redfruit. It is desirable to remove these shadow pixels before coloranalysis as they would adversely affect grading accuracy. Using atechnique described in Section 3.1, the system is calibrated in sucha way that these shadow colors are converted to a color index of255 (visible in Fig. 7g). As the flowchart in Fig. 6 shows, a finalmask (Fig. 7h) is generated by removing areas of shadow fromthe intermediate mask. This is accomplished by setting mask pixelsto 0 if the corresponding pixels in Fig. 7g have a color index of 255(shadow). Occasionally, some dark red pixels inside the fruit areaare removed mistakenly because they are indistinguishable fromshadow pixels, but these voids are filled in by a later step that in-cludes connected component analysis. Using the final mask withshadow areas removed, the fruit area can be accurately segmented(Fig. 7i) and the proposed color space conversion method can beused to obtain final color indices, as shown in Fig. 7j.
2.5. Color index distribution analysis
As shown in Section 2.1 and Fig. 3, the colors of interest for thisapplication are limited. However, as Fig. 1 shows, different matu-rity levels exhibit distinct color patterns or distributions, some ofwhich involve mixed colors. A simple evaluation method usingaverage color or color variation can be effective in other gradingapplications, but it is not sufficient for date maturity evaluation.A color index distribution analysis method is developed to obtainbetter separation of different maturity levels. This method is per-formed on color index values produced using the proposed colorspace conversion technique. Because this method analyzes colorswithin a 1D color space, it is much simpler than analysis in a 2Dor 3D space, as discussed in Section 2.2.
Fig. 8 shows the color index distributions of the first 11 sampleimages shown in Fig. 1 (excluding the Trash grade which is de-tected by fruit size). Plotted in two separate figures for clarity,these histograms were obtained from the converted color indicesusing the segmentation and color space conversion algorithms de-scribed above, in the same manner that Fig. 7j was obtained fromthe original image. The histograms can be roughly divided into fourgroups:
1. Ready and Skin: This group has high color indices (red colors).The Skin category has more variation (wider distribution) thanReady.
2. Orange and Partial Red: This group has two histogram peaks.The two categories can be distinguished from each other usingthe distance between the two peaks and color index variation.
3. Yellow Head and Yellow Spot: This group also has two peaksbut with color index values much lower than the second group.Yellow Head and Yellow Spot are considered to have the samematurity level.
4. Partial Yellow and Yellow: This group may have one or twopeaks. The first results from a large number of yellow pixels;the second exists only if the fruit is partially yellow, and it rep-resents the portion of the date that is red or orange. The pres-ence of the second peak can distinguish between the twocategories.
The proposed color index distribution analysis consists of threesteps: histogram smoothing, peak detection, and calculations ofcolor value and consistency. A 5 � 1 average filter is used tosmooth the histogram to avoid false detection of peaks. A 1D11 � 1 Laplacian operator is then applied to detect each zero-cross-ing of the histogram as a peak. The Laplacian operator is imple-mented as shown in the following equation:
zðiÞ ¼ hðiÞ � 10�Xj¼i�1
j¼i�5
hðjÞ �Xj¼iþ5
j¼iþ1
hðjÞ ð3Þ
where h(i) and z(i) are the histogram and zero-crossing values atcolor index i, respectively. Color indices with zero-crossing valueshigher than a user-specified threshold are considered to be loca-tions of histogram peaks. Only the highest two zero-crossings orpeaks are considered.
The last step of the novel color index distribution analysis in-volves calculations of color values and consistency. First, the stan-dard deviation (StDev) of the converted color indices is computed.The color value is calculated as a weighted average of the histo-gram values within the color index range of peak ± StDev as shownin the following equation:
Color value ¼Xi¼peakþStDev
i¼peak�StDev
hðiÞ � i, Xi¼peakþStDev
i¼peak�StDev
hðiÞ ð4Þ
D.-J. Lee et al. / Journal of Food Engineering 88 (2008) 364–372 369
If the histogram has two peaks, then the color value of the fruit iscalculated using Eq. (4) using the peak associated with the most fre-quently occurring colors. To illustrate, consider the two peaks of thePartial Red histogram in Fig. 8a, located at color indices 112 and202. The midpoint of the two peaks is calculated (157), and thenumber of pixels below the midpoint is compared with the numberabove the midpoint. In this case, more pixels are below the mid-point, so the peak at 112 is used to compute color value using Eq.(4). Similarly, in the histogram of Yellow Head in Fig. 8b, peaksare identified at index values of 56 and 147 – the former corre-sponds to the yellow spot and the latter to the most common coloron the remainder of the fruit’s surface. Comparing pixel frequencyabove and below the midpoint (102) leads to the use of the peakat index 147.
If the histogram has a single peak, then color consistency is cal-culated as 100-StDev, resulting in high consistency values whenStDev is low. If the histogram has two peaks, the consistency mea-sure must be reduced by more than the corresponding increase inthe value of StDev. This makes it possible to distinguish between,say, a fruit that is fully mature and a fruit that is entirely mature
Color Index H
0
50
100
150
200
1 21 41 61 81 101 121
Col
Pix
el C
ou
nt
Ready 1(a) Ready 1(b) Skin 1(c)
Color Index
0
50
100
150
200
250
1 21 41 61 81 101 121
Color
Pix
el C
ou
nt
Yellow Head 1(g) Yellow Spot1(h) Part
a
b
Fig. 8. Histograms of the converted 1D color index values of the sample images shown incolor in this figure legend, the reader is referred to the web version of this article.)
except for one yellow spot. The adjusted color consistency is calcu-lated as follows:
Color consistency ¼ 100:0� StDev � ð1:0þ jpeak1
� peak2j=255Þ ð5Þ
where peak1 and peak2 are the index values of the two detectedpeaks. Note that Eq. (5) works for histograms with a single peakby setting peak2 equal to peak1.
3. Experimental results and discussion
3.1. Calibration results
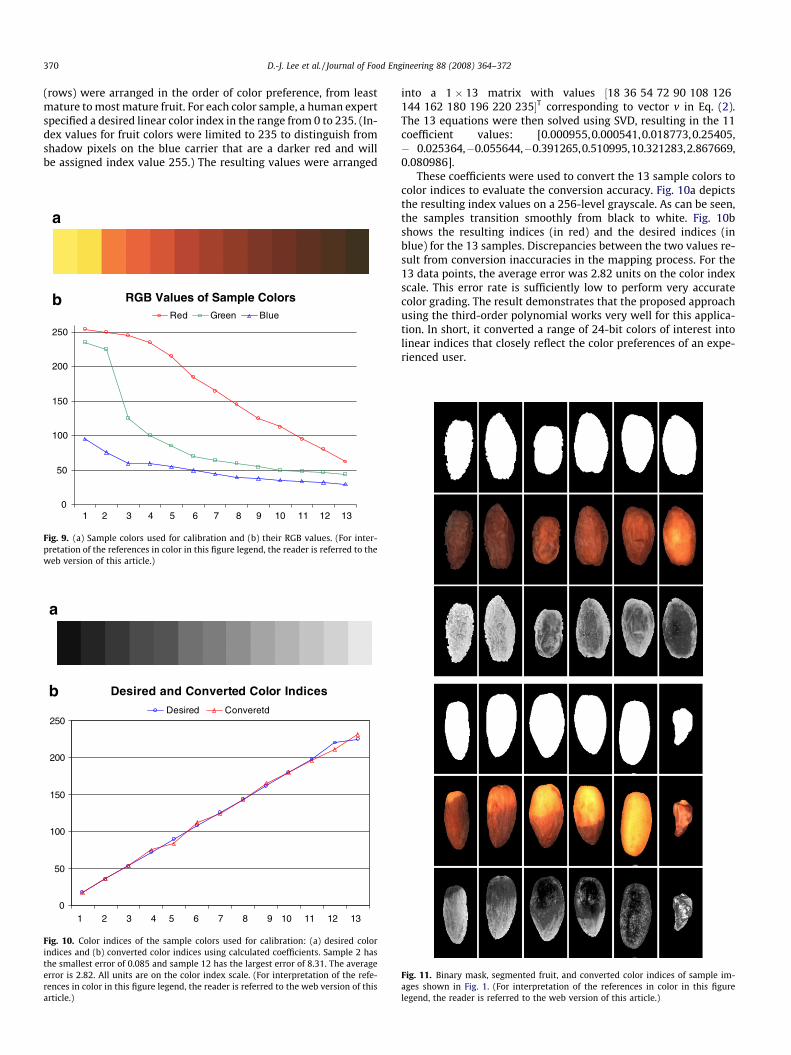
Thirteen sample colors ranging from red to yellow were used tocalibrate the system for date maturity evaluation. The colors aredisplayed in Fig. 9a, and their RGB values are plotted in Fig. 9b. Thisset of 13 RGB values was selected to cover the full range of colors atall maturity levels. The values were used to create a 13 � 11 matrixas shown in Eq. (2), with one row per sample color. The colors
istogram
141 161 181 201 221 241
or Index
Orange 1(d) Orange 1(e) Partial Red 1(f)
Histogram
141 161 181 201 221 241
Index
ial Yellow 1(i) Partial Yellow 1(j) Yellow 1(k)
Fig. 1: (a) for Fig. 1a–f and (b) for Fig. 1g–k. (For interpretation of the references in
370 D.-J. Lee et al. / Journal of Food Engineering 88 (2008) 364–372
(rows) were arranged in the order of color preference, from leastmature to most mature fruit. For each color sample, a human expertspecified a desired linear color index in the range from 0 to 235. (In-dex values for fruit colors were limited to 235 to distinguish fromshadow pixels on the blue carrier that are a darker red and willbe assigned index value 255.) The resulting values were arranged
Desired and Converted Color Indices
0
50
100
150
200
250
1 2 3 4 5 6 7 8 9 10 11 12 13
Desired Converetd
a
b
Fig. 10. Color indices of the sample colors used for calibration: (a) desired colorindices and (b) converted color indices using calculated coefficients. Sample 2 hasthe smallest error of 0.085 and sample 12 has the largest error of 8.31. The averageerror is 2.82. All units are on the color index scale. (For interpretation of the refe-rences in color in this figure legend, the reader is referred to the web version of thisarticle.)
RGB Values of Sample Colors
0
50
100
150
200
250
1 9 10 11 12 13
Red Green Blue
2 3 4 5 6 7 8
a
b
Fig. 9. (a) Sample colors used for calibration and (b) their RGB values. (For inter-pretation of the references in color in this figure legend, the reader is referred to theweb version of this article.)
into a 1 � 13 matrix with values ½18 36 54 72 90 108 126144 162 180 196 220 235�T corresponding to vector v in Eq. (2).The 13 equations were then solved using SVD, resulting in the 11coefficient values: [0.000955,0.000541,0.018773,0.25405,� 0.025364,�0.055644,�0.391265,0.510995,10.321283,2.867669,0.080986].
These coefficients were used to convert the 13 sample colors tocolor indices to evaluate the conversion accuracy. Fig. 10a depictsthe resulting index values on a 256-level grayscale. As can be seen,the samples transition smoothly from black to white. Fig. 10bshows the resulting indices (in red) and the desired indices (inblue) for the 13 samples. Discrepancies between the two values re-sult from conversion inaccuracies in the mapping process. For the13 data points, the average error was 2.82 units on the color indexscale. This error rate is sufficiently low to perform very accuratecolor grading. The result demonstrates that the proposed approachusing the third-order polynomial works very well for this applica-tion. In short, it converted a range of 24-bit colors of interest intolinear indices that closely reflect the color preferences of an expe-rienced user.
Fig. 11. Binary mask, segmented fruit, and converted color indices of sample im-ages shown in Fig. 1. (For interpretation of the references in color in this figurelegend, the reader is referred to the web version of this article.)
Color Index Distribution and Separation
20
30
40
50
60
70
80
90
020406080100120140160180200220
Color Index
Co
lor
Co
nsi
sten
cy
Ready Skin Light Red or Orange Partial Red Yellow Head/Spot Partial Yellow Yellow
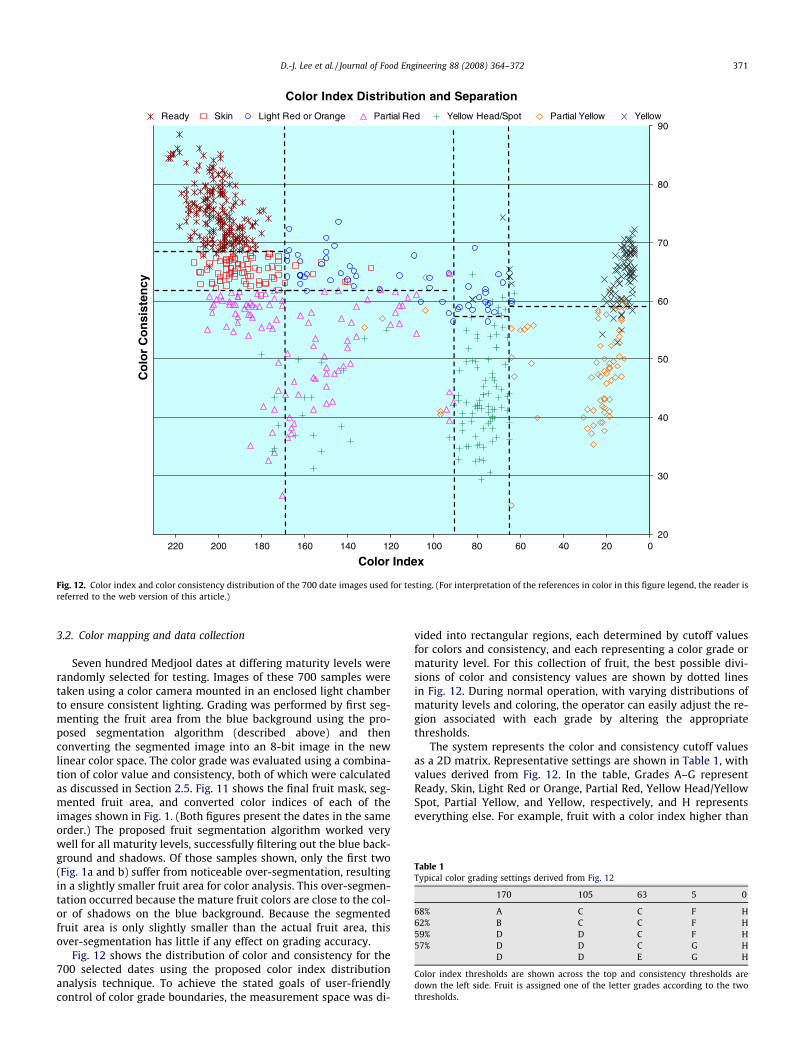
Fig. 12. Color index and color consistency distribution of the 700 date images used for testing. (For interpretation of the references in color in this figure legend, the reader isreferred to the web version of this article.)
Table 1Typical color grading settings derived from Fig. 12
170 105 63 5 0
68% A C C F H62% B C C F H59% D D C F H57% D D C G H
D D E G H
Color index thresholds are shown across the top and consistency thresholds aredown the left side. Fruit is assigned one of the letter grades according to the twothresholds.
D.-J. Lee et al. / Journal of Food Engineering 88 (2008) 364–372 371
3.2. Color mapping and data collection
Seven hundred Medjool dates at differing maturity levels wererandomly selected for testing. Images of these 700 samples weretaken using a color camera mounted in an enclosed light chamberto ensure consistent lighting. Grading was performed by first seg-menting the fruit area from the blue background using the pro-posed segmentation algorithm (described above) and thenconverting the segmented image into an 8-bit image in the newlinear color space. The color grade was evaluated using a combina-tion of color value and consistency, both of which were calculatedas discussed in Section 2.5. Fig. 11 shows the final fruit mask, seg-mented fruit area, and converted color indices of each of theimages shown in Fig. 1. (Both figures present the dates in the sameorder.) The proposed fruit segmentation algorithm worked verywell for all maturity levels, successfully filtering out the blue back-ground and shadows. Of those samples shown, only the first two(Fig. 1a and b) suffer from noticeable over-segmentation, resultingin a slightly smaller fruit area for color analysis. This over-segmen-tation occurred because the mature fruit colors are close to the col-or of shadows on the blue background. Because the segmentedfruit area is only slightly smaller than the actual fruit area, thisover-segmentation has little if any effect on grading accuracy.
Fig. 12 shows the distribution of color and consistency for the700 selected dates using the proposed color index distributionanalysis technique. To achieve the stated goals of user-friendlycontrol of color grade boundaries, the measurement space was di-
vided into rectangular regions, each determined by cutoff valuesfor colors and consistency, and each representing a color grade ormaturity level. For this collection of fruit, the best possible divi-sions of color and consistency values are shown by dotted linesin Fig. 12. During normal operation, with varying distributions ofmaturity levels and coloring, the operator can easily adjust the re-gion associated with each grade by altering the appropriatethresholds.
The system represents the color and consistency cutoff valuesas a 2D matrix. Representative settings are shown in Table 1, withvalues derived from Fig. 12. In the table, Grades A–G representReady, Skin, Light Red or Orange, Partial Red, Yellow Head/YellowSpot, Partial Yellow, and Yellow, respectively, and H representseverything else. For example, fruit with a color index higher than
Table 2Columns 1 and 2: Maturity levels and their letter grades shown in Table 1
Maturity Grade # of samples # classified Accuracy (%)
Ready A 188 185 98.40Skin B 82 74 90.24Light Red/Orange C 56 50 89.29Partial Red D 103 101 98.06Yellow Head/Spot E 106 79 74.53Partial Yellow F 71 62 87.32Yellow G 94 85 90.43
Total # 700 636 90.86
Column 3: number of samples for each grade. Column 4: number of samples cor-rectly classified. Column 5: classification accuracy of each grade and the overallaverage accuracy.
372 D.-J. Lee et al. / Journal of Food Engineering 88 (2008) 364–372
170 is classified as Grades A, B, or D depending on its consistency(greater than 68%, between 68% and 62%, or below 62%). Fruit witha color index between 105 and 170 and color consistency above62%, or with a color index between 63 and 105 and color consis-tency above 57%, is classified as Grade C (Light Red or Orange).Other entries in the table can be similarly interpreted.
Using the settings from Table 1, the 700 Medjool samples se-lected for testing were classified, resulting in the grading accuracyshown in Table 2. Because it has consistent color and a simple his-togram with a single peak, the Ready category has the highestgrading accuracy of 98.4%. Yellow Head/Yellow Spot and PartialRed both have dual peaks and similar histograms. Yellow Head/Yellow Spot can be misclassified as Partial Red if the color of the‘‘Yellow Head” portion is close to orange. The overall grading accu-racy is 636 out of 700, approximately 90.9%.
The proposed color space conversion and color index distribu-tion analysis techniques have been implemented and proven suc-cessful in evaluating date maturity in commercial production. Aprototype system was built and tested in a packing facility in Ari-zona, USA. The system meets the maturity evaluation standard setby the Bard Valley Medjool Date Grower Association, and it meetsthe industry requirement of grading at least 20 pieces of fruit persecond using a single commercial personal computer with twocameras for four processing lanes.
4. Conclusion
A new color space conversion method and color index distribu-tion analysis technique specifically for automated date maturityevaluation has been presented. The proposed approach uses athird-order polynomial to convert 3D RGB values into a simple1D color space. Unlike other color grading techniques, this ap-proach makes the selection and adjustment of color preferenceseasy and intuitive. Moreover, it allows a more complicated distri-bution analysis of fruit surface colors. The user can change color
and consistency cutoff points in a manner consistent with humancolor perception, simply sliding a cutoff point to include fruit thatis ‘‘slightly darker” or ‘‘lighter red”. Moreover, changes in preferredcolor ranges can be completed without reference to precise colorvalues. Furthermore, by converting 3D colors to a linear colorspace, color distribution analysis required for date maturity evalu-ation is much more straightforward.
The implementation of this new color space conversion methodand the results presented demonstrate the simplicity and accuracyof the proposed technique. To calibrate the system, an experiencedgrader specifies a set of colors of interest, each accompanied by apreferred index value on a linear scale. Provided that the selectedcolor samples cover the complete range of expected colors, accu-rate color grading will result. This new technique can be appliedto other color grading applications that require the setting andadjustment of color preferences.
References
Choi, K.H., Lee, G.H., Han, Y.J., Bunn, J.M., 1995. Tomato maturity evaluation usingcolor image analysis. Transactions of the ASAE 38 (1), 171–176.
Fairchild, M.D., 1998. Color Appearance Models. Addison-Wesley, Reading, MA.Hung, Y.C., Morita, K., Shewfelt, R., Resurreccion, A., Prussia, S., 1993. Color
evaluation of apples. American Society of Agricultural Engineers 93 (6541), 15.Hunt, R.W.G., 1995. The reproduction of colour in photography. Printing and
Television, fifth ed. Fountain Press, England.Janobi, A., 1998. Color line scan system for grading date fruits. In: ASAE Annual
International Meeting, Orlando, FL, USA, 12–16 July.Lee, D.J., Anbalagan, R., 1995. High-speed automated color sorting vision system. In:
SPIE Optical Engineering Midwest ‘95, Chicago, IL 2622, pp. 573–579.Lee, D.J., 2000. Color space conversion for linear color grading. In: Proceedings of
SPIE Intelligent Robots and Computer Vision XIX, Boston, MA 4197, USA, pp.358–366.
Lin, W.C., Hall, J.W., Klieber, A., 1993. Video imaging for quantifying cucumber fruitcolor. HortTechnology 3 (4), 436–439.
Miller, B.K., Delwiche, M.J., 1989a. Automatic grading of fresh peaches using colorcomputer vision. Acta-Horticulturae 254, 161–166.
Miller, B.K., Delwiche, M.J., 1989b. A color vision system for peach grading.Transactions of the ASAE 32 (4), 484–1490.
Moon, T.K., Stirling, W.C., 2000. Mathematical Methods and Algorithms for SignalProcessing. Prentice Hall, Upper Saddle River, NJ.
Nimesh, S., Delwiche, M.J., Johnson, R.S., 1993. Image analysis methods for real-timecolor grading of stonefruit. Computers-and-Electronics-in-Agriculture 9 (1), 71–84.
Shearer, S.A., Payne, F.A., 1990. Color and defect sorting of bell peppers usingmachine vision. Transactions of the ASAE 33 (6), 2045–2050.
Singh, N., Delwiche, M.J., Johnson, R.S., Thompson, J., 1992. Peach maturity gradingwith color computer vision. American Society of Agricultural Engineers 92(3029), 23.
Tao, Y., Heinemann, P.H., Varghese, Z., Morrow, C.T., Sommer, H.J., 1995. Machinevision for color inspection of potatoes and apples. Transactions of the ASAE 38(5), 1555–1561.
Varghese, Z., Morrow, C.T., Heinemann, P.H., Sommer, H.J., Tao, Y., Crassweller, R.W.,1991. Automated inspection of Golden Delicious apples using color computervision. American Society of Agricultural Engineers 91 (7002), 16.
Zhang, M., Ludas, L.I., Morgan, M., Krutz, G.W., Precetti, C.J., Zhang, M., Meyer, G.E.,DeShazer, J.A., 1998. Applications of color machine vision in the agricultural andfood industries. SPIE Proceedings Precision Agriculture and Biological Quality3543, 208–219.