Embed Size (px)
Citation preview

by Robin V. Davis, P.G. Project Manager Utah Department of Environmental Quality Leaking Underground Storage Tanks [email protected] 801-536-4177
Developing and Applying Screening Criteria for the
Petroleum Vapor Intrusion Pathway
Petroleum Vapor Intrusion Workshop Sunday September 13, 2015
1:00 pm – 5:00 pm
25th National Tanks Conference Phoenix, Arizona

Understand why petroleum vapor intrusion (PVI) is very rare despite so many petroleum LUST sites
Show mechanisms, characteristics, degree of vapor bioattenuation
Show distances of vapor attenuation relative to source strength
Understand causes of PVI
Apply as Screening Criteria, screen out low-risk sites, avoid unnecessary investigation, soil gas/air sampling

Field Data from 3 Countries, Published Field Studies
Paired, concurrent measurements of source strength and associated soil gas measurements
Source strength: LNAPL in soil and GW, dissolved-phase
1000s of sample points and measurements at 100s of sites
Extensive peer review and quality control checks
Distances of vapor attenuation quantified
EPA Database Report of Empirical Studies, Jan. 2013
Some US States
Australia 2012
ITRC October 2014
EPA final PVI June 2015
Guidance Documents Issued:

124/>1000
Perth Sydney
Tasmania
Australia
Davis, R.V., 2009-2011 McHugh et al, 2010 Peargin and Kolhatkar, 2011 Wright, J., 2011, 2012, Australian data Lahvis et al, 2013 EPA Jan 2013, 510-R-13-001
REFERENCES
4/13
70/816
Canada
United States
MAP KEY
# geographic locations evaluated
# paired concurrent measurements
of subsurface benzene soil vapor
& source strength
70
EPA OUST Jan. 2013
Australian sites evaluated separately
816
Petroleum Vapor Database of Field Studies

January 2013
Petroleum Database Report
• Compilation of field data: LNAPL in soil & GW, & dissolved
sources, and concurrent associated vapor data
http://www.epa.gov/oust/cat/pvi/PVI_Database_Report.pdf

http://www.epa.gov/oust/cat/pvi/pvi-guide-final-6-10-15.pdf
June 2015
Final PVI Guide
• Thickness of clean, non-source soil required to attenuate
vapors associated with LNAPL in soil & GW, & dissolved
sources

EPA OUST PVI Guide, Figure 1 Decision Flow Chart for Evaluating PVI

CAPILLARY ZONE
a) LNAPL SOURCE
UNSATURATED ZONE
SATURATED ZONE
sharp reaction
front
O2
VOCs
b) DISSOLVED-PHASE SOURCE
CAPILLARY ZONE
UNSATURATED ZONE
SATURATED ZONE
high massflux
limited mass flux
sharp reaction
front
constituent distributions
O2
VOCs
constituent distributions
Conceptual Characteristics of Petroleum Vapor Transport and Biodegradation
After Lahvis et al 2013 GWMR
O2/Hydrocarbon
Vapor Profile
O2/Hydrocarbon
Vapor Profile
KEY POINTS
• LNAPL sources have high
mass flux, vapors attenuate
in longer distances than
dissolved sources
• Aerobic biodegradation of
vapors is rapid, occurs over
short distances
• Oxygen demand is a
function of source strength
0
1
0
1

UST system
Dissolved contamination
Clean, Non-Source Soil
High vapor concentrations, high mass flux
from LNAPL & soil sources
Low vapor concentrations, low
mass flux from dissolved sources
Define extent & degree of contamination
Apply Screening Criteria Building
Collect Basic Data, Characterize Site, Construct Conceptual Site Model
LNAPL in soil
LNAPL in soil & GW
Soil Boring/MW Soil Boring/MW
Utility line

>100 years of research proves rapid vapor biodegradation by 1000s of indigenous microbes
Studies show vapors biodegrade and attenuate within a few feet of sources
No cases of PVI from low-strength sources
Causes of PVI are well-known

Causes of Petroleum Vapor Intrusion
Preferential pathway: sumps, elevator shafts
High-strength source in direct contact with building (LNAPL, high dissolved, adsorbed)
Groundwater-Bearing Unit
BUILDING
Unsaturated Soil
Affected GW
LNAPL
LNAPL
4 1
3
LNAPL
High-strength source in close proximity to building, within GW fluctuation zone
2
Drawing after Todd Ririe, 2009
High-Strength Sources Direct contact or close proximity to buildings
Preferential pathways: engineered & natural
Preferential pathway: bad connections of utility lines; natural fractured and karstic rocks

(ITRC PVI Tech Reg, 2014)
Preferential Pathway: Engineered
Petroleum Source

(ITRC PVI Tech Reg, 2014)
Preferential Pathway: Natural

1.E+00 1.E+02 1.E+04 1.E+06 1.E+08
0
5
10
15
0 5 10 15 20
Benzene (ug/m3)
O2 & CO2 (% V/V)
Coachella, CA COA-2 (Ririe, et al 2002)
1.E+001.E+021.E+041.E+061.E+08
-5
0
5
10
15
20
0 5 10 15 20 25
Benzene (ug/m3)
Salina Cash Saver VMW-1 (UDEQ 7/27/07)
OA
IA
LNAPL
LNAPL
1.E+00 1.E+02 1.E+04 1.E+06 1.E+08
0
5
10
15
0 5 10 15 20 25
Benzene (ug/m3)
Dep
th,
fee
t b
elo
w g
rad
e
O2 & CO2 (% V/V)
Beaufort, SC NJ-VW2 (Lahvis, et al., 1999)
Oxygen
Carbon Dioxide
Benzene
Benzene in GW
16,000 ug/L
Signature Characteristics of Aerobic Biodegradation of Subsurface Petroleum Vapors
• Vapors aerobically biodegraded by oxygen-consuming microbes, waste product carbon dioxide
• Vapors attenuate in short distances

Vapor Bioattenuation Limited by Contaminated Soil
1.E+00 1.E+02 1.E+04 1.E+06 1.E+08
0
5
10
15
0 5 10 15 20
Benzene (ug/m3)
De
pth
, fe
et
be
low
gra
de
O2 & CO2 (% V/V)
Conneaut, OH VMP-1
(Roggemans, 1998; Roggemans et al., 2001)
Oxygen
Carbon Dioxide
Benzene
LNAPL in Soil (sand, silty sand)
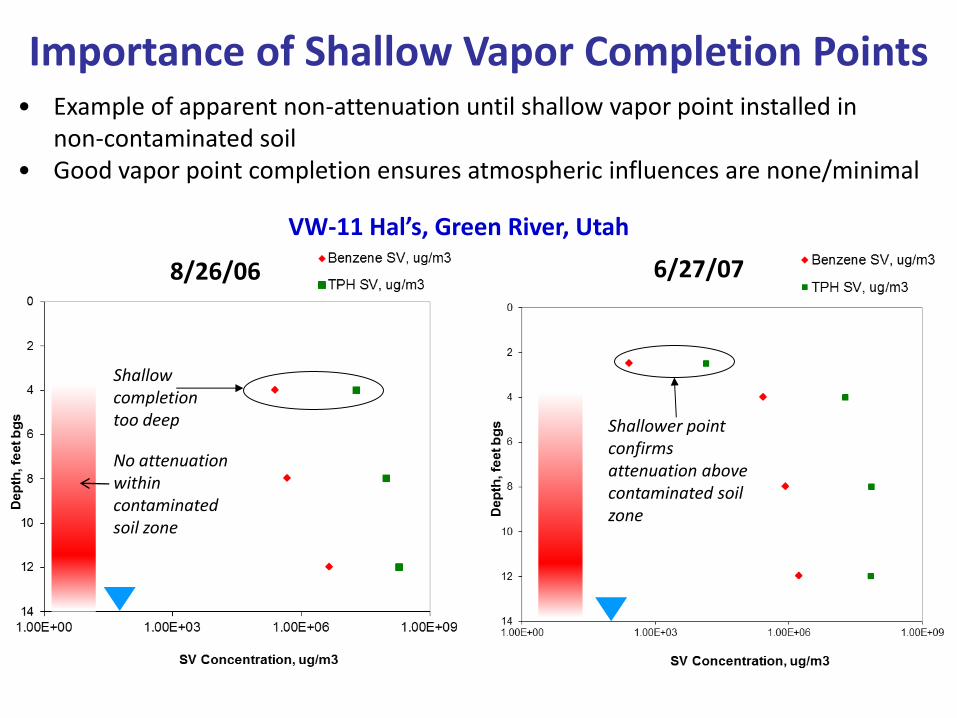
8/26/06 6/27/07
Importance of Shallow Vapor Completion Points
Shallower point confirms attenuation above contaminated soil zone
Shallow completion too deep
• Example of apparent non-attenuation until shallow vapor point installed in non-contaminated soil
• Good vapor point completion ensures atmospheric influences are none/minimal
VW-11 Hal’s, Green River, Utah
No attenuation within contaminated soil zone
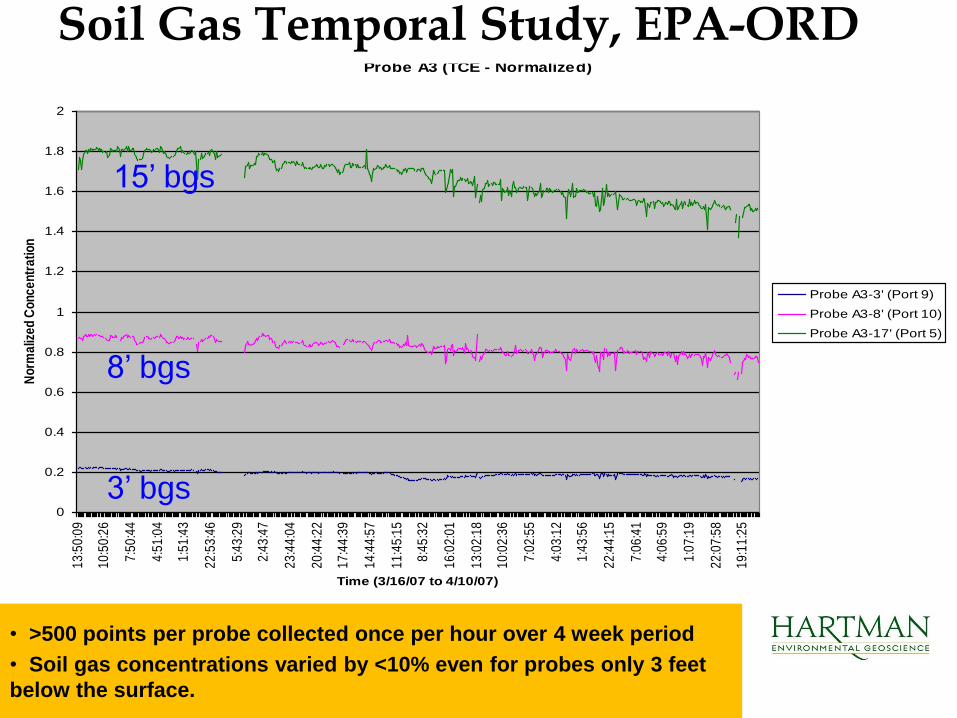
Probe A3 (TCE - Normalized)
0
0.2
0.4
0.6
0.8
1
1.2
1.4
1.6
1.8
2
13
:50
:09
10
:50
:26
7:5
0:4
4
4:5
1:0
4
1:5
1:4
3
22
:53
:46
5:4
3:2
9
2:4
3:4
7
23
:44
:04
20
:44
:22
17
:44
:39
14
:44
:57
11
:45
:15
8:4
5:3
2
16
:02
:01
13
:02
:18
10
:02
:36
7:0
2:5
5
4:0
3:1
2
1:4
3:5
6
22
:44
:15
7:0
6:4
1
4:0
6:5
9
1:0
7:1
9
22
:07
:58
19
:11
:25
Time (3/16/07 to 4/10/07)
No
rma
lize
d C
on
ce
ntr
ati
on
Probe A3-3' (Port 9)
Probe A3-8' (Port 10)
Probe A3-17' (Port 5)
Soil Gas Temporal Study, EPA-ORD
3’ bgs
8’ bgs
15’ bgs
• >500 points per probe collected once per hour over 4 week period
• Soil gas concentrations varied by <10% even for probes only 3 feet
below the surface.
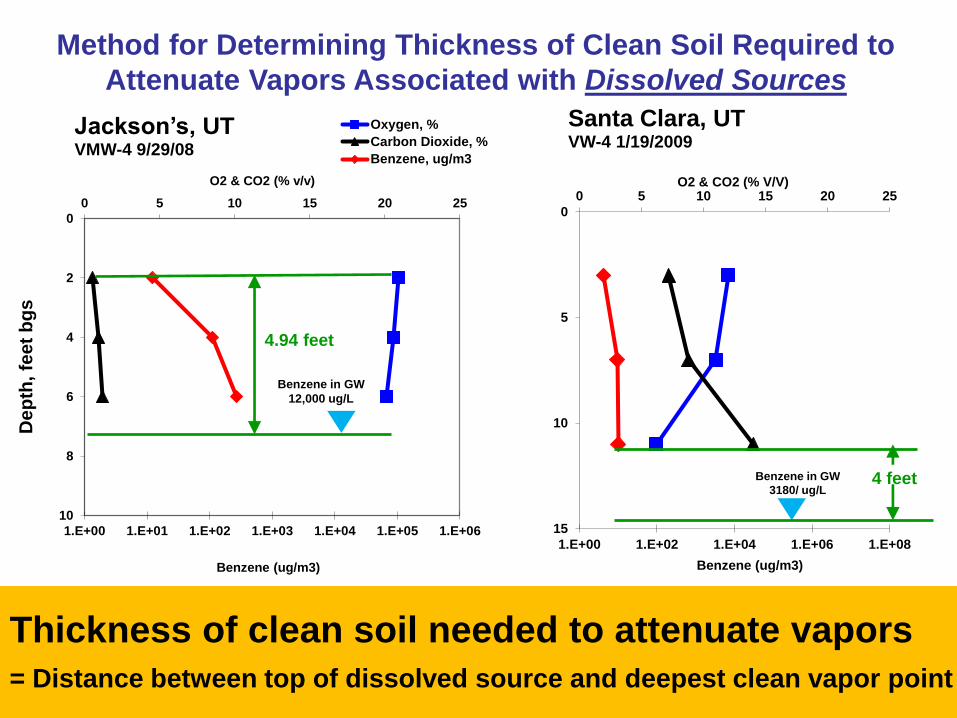
1.E+00 1.E+02 1.E+04 1.E+06 1.E+08
0
5
10
15
0 5 10 15 20 25
Benzene (ug/m3)
O2 & CO2 (% V/V)
Santa Clara, UT VW-4 1/19/2009
4 feet Benzene in GW
3180/ ug/L
1.E+00 1.E+01 1.E+02 1.E+03 1.E+04 1.E+05 1.E+06
0
2
4
6
8
10
0 5 10 15 20 25
Benzene (ug/m3)
De
pth
, fe
et
bg
s
O2 & CO2 (% v/v)
Jackson’s, UT VMW-4 9/29/08
Oxygen, %
Carbon Dioxide, %
Benzene, ug/m3
Benzene in GW
12,000 ug/L
4.94 feet
Method for Determining Thickness of Clean Soil Required to
Attenuate Vapors Associated with Dissolved Sources
Thickness of clean soil needed to attenuate vapors
= Distance between top of dissolved source and deepest clean vapor point

0
1
2
3
4
5
6
7
8
9
10
1 100 10,000 1,000,000
Th
ick
ne
ss
Cle
an
So
il R
eq
uir
ed
to
Att
en
ua
te T
PH
Va
po
rs
, fe
et
TPH, dissolved, ug/L
Near-Slab Multi-Depth, Sub-Slab
TPH: Soil Vapor & Dissolved Paired Measurements
All Soil Types
0
1
2
3
4
5
6
7
8
9
10
1 10 100 1,000 10,000 100,000
Th
ickn
es
s
Cle
an
S
oil R
eq
uir
ed
to
Att
en
uate
Ben
zen
e V
ap
ors
, fe
et
Benzene, dissolved, ug/L
Near-Slab Multi-Depth, Sub-Slab
Benzene: Soil Vapor & Dissolved Paired Measurements
All Soil Types
TPH: 73 exterior/near-slab + 24 sub-slab = 97 total Benzene: 199 exterior/near-slab + 37 sub-slab = 236 total
2009-2011 Analysis of Petroleum Vapor
Database for Dissolved Sources
5 feet of clean soil attenuates vapors associated with
dissolved sources: Benzene 1,000 ug/L, TPH 10,000 ug/L

1.E+00 1.E+02 1.E+04 1.E+06 1.E+08
0
5
10
15
0 5 10 15 20
Benzene (ug/m3)
O2 & CO2 (% V/V)
Coachella, CA COA-2 Ririe, et al 2002
9.5 feet
1.E+00 1.E+02 1.E+04 1.E+06 1.E+08
0
5
10
15
0 5 10 15 20 25
Benzene (ug/m3)
De
pth
, fe
et
be
low
gra
de
O2 & CO2 (% V/V)
Beaufort, SC NJ-VW2 Lahvis, et al., 1999
Oxygen
Carbon Dioxide
Benzene
Benzene in GW
16,000 ug/L
8 feet
Method for Determining Thickness of Clean Soil Required to
Attenuate Vapors Associated with LNAPL Sources
Thickness of clean soil needed to attenuate vapors
= Distance between top of LNAPL source and deepest clean vapor point

0
1
2
3
4
5
6
7
8
9
10
Th
ick
ne
ss o
f C
lea
n S
oil O
ve
rly
ing
LN
AP
LR
eq
uir
ed
to
Att
en
ua
te V
ap
ors
, fe
et
TPH SV Sample Event over LNAPL & Soil Sources
0
1
2
3
4
5
6
7
8
9
10
Th
ick
ne
ss o
f C
lea
n S
oil O
ve
rly
ing
LN
AP
LR
eq
uir
ed
to
Att
en
ua
te V
ap
ors
, fe
et
Benzene SV Sample Event over LNAPL & Soil Sources
Benzene TPH
48 exterior/near-slab + 23 sub-slab = 71 total 17 exterior/near-slab + 19 sub-slab = 36 total
1 Refinery Site
Sites Sites
2009-2011 Results of Vapor Attenuation
from LNAPL and Soil Sources
8 feet of clean soil attenuates vapors associated with
LNAPL and Soil Sources

Screening Distances
95%-100% Confidence for LUST Sites 93% Confidence for Refineries, Terminals
Dissolved Sources Benzene Vapors vs. Distance of Attenuation
LNAPL Sources (small sites) Benzene Vapors vs. Distance of Attenuation
6 ft 15 ft

Lahvis et al 2013 Results of Vapor Attenuation from LNAPL Sources
• Slightly different analysis, similar results
• 95% Confidence
that 13 ft vertical separation attenuates LNAPL source vapors
13 ft

LNAPL Indicators
24
LNAPL INDICATOR MEASUREMENTS
Current or historic presence of LNAPL in
groundwater or soil
Visual evidence:
Sheen on groundwater or soil, soil staining, measurable product
thickness
Groundwater, dissolved-phase
PHCs >0.2 times effective solubilities
(Bruce et al. 1991)
Benzene >3-5 mg/L
TPH-gro >20-30 mg/L
TPH-dro >5 mg/L
Soil, adsorbed-phase
PHCs >effective soil saturation (Csat)
Benzene >10 mg/kg
TPH-gro >250-500 mg/kg
EPA 2015 >100 mg/kg unweathered gasoline
>250 mg/kg weathered gasoline, diesel
Soil field measurements
Organic vapor analyzer/PID/OVA of soil
cores
Gasoline-contaminated soil: >100 ppm-v to >500 ppm-v
Diesel-contaminated soil: >10 ppm-v
Soil Gas measurements
- O2 depleted, CO2 enriched with increasing distance
from source
- Elevated aliphatic soil gas concentrations (eg Hexane >100,000ug/m3)
(after EPA 2015; Lahvis et al 2013)

Various methods of data analysis yield similar results
• Benzene <5 mg/L • TPH <30mg/L
LNAPL Sources require 13-15 feet separation: • Benzene >5 mg/L, >10 mg/kg • TPH >30mg/L, >250-500 mg/kg • 18 feet separation required for large industrial sites
“Clean Soil” within separation distance: • Non-source soil, LNAPL-free, biologically active, sufficient oxygen
and moisture to bioattenuate vapors • EPA 2015: <100 mg/kg TPH “clean” soil
Dissolved Sources require 5-6 feet separation:

Field Example:
Deep SV Benzene, ug/m3
Shallow SV Benzene, ug/m3
= AF
~7,000,000x contaminant reduction
~1 ug/m3
145,000 ug/m3 AF = = 7E-06
Measuring Magnitude of Subsurface
Vapor Attenuation
Subsurface Attenuation Factor (AF)
= Ratio of shallow to deep vapor concentration
Beaufort, SC NJ-VW2
(Lahvis, et al., 1999)
0
5
10
15
0 5 10 15 20 25
O2 & CO2 (% V/V)
1.E+00 1.E+02 1.E+04 1.E+06 1.E+08
Benzene (ug/m3)
Oxygen
Carbon Dioxide
Benzene
Benzene in GW
16,000 ug/L

0
20
40
60
80
100
1.E-021.E-03<1.E-04
Subsurface Vapor Attenuation Factors
Nu
mb
er
of
So
il V
ap
or
Sa
mp
le E
ve
nts
Benzene TPH
0
30
60
90
120
150
Reason 1: No
Clean
Overlying Soil
Reason 2: Low
Source
Strength
Reason 3:
Rapid
Attenuation
Near High-
Strength
Source
Nu
mb
er
of
So
il V
ap
or
Sa
mp
le E
ve
nts Benzene TPH
3 Reasons for
Insignificant
AFs 10x-100x
0
40
80
120
160
200
>1.E-011.E-011.E-021.E-03<1.E-04
Subsurface Vapor Attenuation Factors
Nu
mb
er
of
So
il V
ap
or
Sa
mp
le E
ve
nts
Benzene TPH
Distribution of Magnitude of Subsurface
Petroleum Vapor Attenuation Factors
Screen these out Reasonable Screening
AF 100x-1000x
Most events
exhibit Significant
AFs >10,000x

http://www.epa.gov/oswer/vaporintrusion/documents/vi-cms-v11final-2-24-2012.pdf
Vertical and Lateral Attenuation Distances

Lateral Distance, meters
Ve
rtic
al
Dis
tan
ce B
elo
w G
rad
e,
mete
rs
10 20 30 40 80 90 50 60 70
0
2
4
6
8
0
2
4
6
8
LNAPL Vapor Source
200,000,000 ug/m3
8 m deep (26 ft)
Lateral
Attenuation
5m (16 ft)
Building with
Basement
Vertical
Attenuation
6m (20 ft)
Oxygen
Model:
20 ft vertical 16 ft lateral Field Data:
15 ft vertical
8 ft lateral
Conclusions: - Models under-predict
attenuation
- Vapors attenuate in
shorter distances
laterally than vertically
Oxygen

Benzene in GW
16,000 ug/L
TPH in GW
67,100 ug/L
RESULTS BioVapor Model under-predicts subsurface attenuation by
100x to 10,000x
Compared to BioVapor Model
Beaufort, South Carolina (Lahvis et al 1999)

Reference
Screening
Distance
(feet)
Screening
Concentration
Benzene, TPH (ug/L)
Other
Criteria
EPA OUST Petroleum
Database Report
5
15
<5000, <30,000
LNAPL
LNAPL UST sites. 18 ft for large sites.
Clean soil <250 mg/kg TPH
Wright, J., Australia,
2011 5 <1000 Includes large industrial sites
30 LNAPL
California 5 <100 Soil Gas Oxygen not required
5 <1000 Soil Gas Oxygen required >4%
10 <1000 Soil Gas Oxygen not required
30 LNAPL
Indiana
5 <1000 Soil Gas Oxygen not required
Distances apply vertically & horizontally
AFs for GW & SG 30 LNAPL
New Jersey 5 <100 Soil Gas Oxygen not required
5 <1000 Soil Gas Oxygen required >2%
10 <1000 Soil Gas Oxygen not required
100 LNAPL Distances apply vertically & horizontally
Wisconsin 5 <1000 Distances apply vertically & horizontally
20 >1000
30 LNAPL

THANK YOU


![pvicollective.compvicollective.com/.../uploads/2012/09/pvi-annual-report-2… · Web viewpvi. collective: [performance] [video] [intervention][] pvi. pvi. collective. collective](https://img.dokumen.tips/doc/110x75/5aadeb937f8b9a5d0a8b7182/web-viewpvi-collective-performance-video-intervention-pvi-pvi-collective.jpg)