Embed Size (px)
Citation preview
Robin V. Davis, P.G. Project Manager
Utah Department of Environmental Quality Leaking Underground Storage Tanks
[email protected] 801-536-4177
Petroleum Vapor Intrusion Workshop Sunday September 13, 2015
1:00 pm – 5:00 pm
Recommended Field and Analytical Practices for Assessing the
Authors Blayne Hartman, Ph.D.
HARTMAN ENVIRONMENTAL
GEOSCIENCE www.hartmaneg.com
858-204-6170
25th National Tanks Conference Phoenix, Arizona
Petroleum Vapor Intrusion Pathway

2
PVI Investigations Are Very Intrusive
Cutting up carpet
Day-drinking resident
State Project Manager
Wild Turkey
Children & Toys
Assistant State
Project Manager

3
ITRC Guides

Soil Vapor Sampling
Technical Toolkit
Version 1.4
This work was funded by Chevron Environmental Management Company and performed by Chevron Energy Technology
Company, Health, Environment and Safety Group, Environmental Unit.
Copyright© 2005 Chevron Energy Technology Company. All Rights Reserved. This report and its appendices are intended
to be used by those conducting work for Chevron Environmental Management Company and Chevron Corporation
Brian M. Davis, Lead Hydrogeologist
Environmental Unit
Health, Environment and Safety Group
Chevron Energy Technology Company
Richmond, California, USA
September 7, 2005

Difference in Methods of
Installing
Nested Multi-Depth
Vapor Points

Best Practice Drill One Boring per Each
Multi-Depth Vapor Point Completion

6-inch Stainless Steel Screens for Each
Vapor Point Completion

Short PVC Lengths Protect Vapor Tubing
Courtesy of Direct Push Services, Highland, Utah

Collect Vapor Samples in <1-Liter Summa Canisters

Highest Quality Completion, Highest Quality Data
v
v
Fee
t B
elo
w G
rad
e
0
15
10
5
v
v
v LNAPL
Sand Pack
Drill 1 boring per vapor point completion Hydrate all bentonite layers thoroughly Bentonite crumbles only in small lifts around sand pack
6-inch Stainless Steel Screen
Nylon Tubing
Bentonite Chips
Bentonite Crumbles
Cement

Fee
t B
elo
w G
rad
e
0
15
10
5
v LNAPL
Clayey Silt
Silt
Sand Pack
6-inch Stainless Steel Screen
Nylon Tubing
Bentonite Crumbles
Cement
NOT ADVISED 1 Boring for Multiple Vapor Point Completions
v
v
High Potential for Leaks and Non-Representative Samples: • Full hydration of bentonite in thick lifts is difficult to achieve
• High potential for tubing to bend, tangle and kink
• Big pore spaces develop and form preferential pathways

Example of Bad Vapor Point Installation
Deepest point set followed by shallower points, separated by thick lifts of bentonite crumbles

All 3 Vapor Points Set in Same Boring

Bentonite Hydration at End of Multi-Depth Vapor Well Completion
UNADVISED: Full Hydration & Seal Not Likely

Bentonite Chips
Vapor Screen
Bentonite Crumbles
Bentonite Crumbles
Bentonite Chips
Sand Pack
A
B C
NOT ADVISED
Bentonite Crumbles
Bentonite Crumbles Throughout = HUGE Pore Spaces Due to Incomplete Hydration
RECOMMENDED PRACTICE • Thin lifts of crumbles
only above and below sand pack
• Bentonite chips for thick layers
• Hydrate each lift slowly & thoroughly
Examples of Vapor Point Completion Integrity

Data Anomalies due to
Improper Completions
and
Purging and Sampling Practices

1.00E+00
1.00E+01
1.00E+02
1.00E+03
1.00E+04
1.00E+05
1.00E+06
1.00E+07
1.00E+08
0 5 10 15 20 25
Be
nze
ne
Va
po
r C
on
ce
ntr
atio
ns,
ug
/m3
Oxygen Soil Gas %
Small UST/AST & Large Industrial Sites
Paired Measurements of Benzene Vapor & Oxygen in Soil…
Oxygen vs Benzene for Dissolved & LNAPL Sources
Anomalies represent small data population in database (4%-6%)
No effect on overall observation of biodegradation
No effect on screening criteria
Anomalies
1.E+00 1.E+02 1.E+04 1.E+06 1.E+08
0
2
4
6
8
10
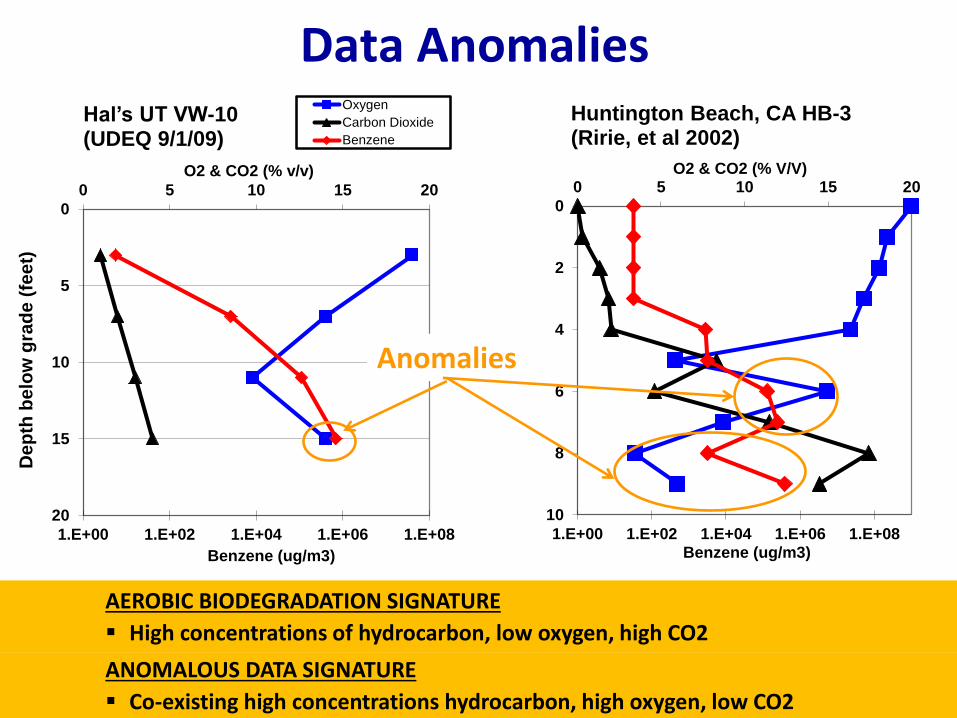
0 5 10 15 20
Benzene (ug/m3)
O2 & CO2 (% V/V)
Huntington Beach, CA HB-3 (Ririe, et al 2002)
O2%
CO2%
Data Anomalies
1.E+00 1.E+02 1.E+04 1.E+06 1.E+08
0
5
10
15
20
0 5 10 15 20
Benzene (ug/m3)
De
pth
be
low
gra
de
(fe
et)
O2 & CO2 (% v/v)
Hal’s UT VW-10 (UDEQ 9/1/09)
Oxygen
Carbon Dioxide
Benzene
Anomalies
ANOMALOUS DATA SIGNATURE
Co-existing high concentrations hydrocarbon, high oxygen, low CO2
AEROBIC BIODEGRADATION SIGNATURE
High concentrations of hydrocarbon, low oxygen, high CO2

0
5
10
15
20
0 5 10 15 20
De
pth
be
low
gra
de
(fe
et)
2006-2014 Oxygen
Over Time
O2 4/14/06 fixed lab
O2 8/26/06 fixed lab
O2 6/26/07 fixed lab
O2 9/1/09 fixed lab
O2 6/24/14 0.5 min purge (0.1L)(Sweeney field-measured)O2 6/24/14 2-min purge (0.4 L)(Sweeney field-measured)
O2 %
• 2014 high-purge data corresponds to 2009 high-volume sample data
• Over-purging/large sample volume= non-representative soil gas samples
1.E+00 1.E+02 1.E+04 1.E+06 1.E+08
0
5
10
15
20
0 5 10 15 20
Benzene (ug/m3)
Dep
th b
elo
w g
rad
e (
fee
t)
O2 & CO2 (% v/v)
VW-7 9/1/09
Oxygen
Carbon Dioxide
Benzene
TPH-gro
Anomalies
2009
Vapor Samples
6-L Containers
Hal’s Chevron
VW-7

High-purge, over-purging
Sampling with large containers (e.g. 6-L Summas)
Improper sample point completion
How Anomalies Happen
Results of Anomalous Data Drawing vapors from non-representative areas
Non-representative vapor samples exhibit:
• High concentrations of hydrocarbons and oxygen
• High hydrocarbon concentrations can be diluted due
to short-circuiting with uncontaminated zones
• Uncontaminated zones exhibiting high hydrocarbons

v
v
Fee
t B
elo
w G
rad
e
0
15
10
5
v
v
v LNAPL
Clayey Silt
Silt
3 ft Tubing Volume= 0.017 L
7 ft Tubing Volume = 0.037 L
11 ft Tubing Volume = 0.057 L
15 ft Tubing Volume = 0.076 L
Recommended Purging and Sampling Practice, Step 1:
• Purge 1 tubing volume

v
v
Fee
t B
elo
w G
rad
e
0
15
10
5
v
v
v LNAPL
Clayey Silt
Silt
3 ft Tubing+Sand Pack = 0.511 L
7 ft Tubing+Sand Pack = 0.531 L
11 ft Tubing+Sand Pack = 0.551 L
15 ft Tubing+Sand Pack = 0.571 L
Recommended Purging and Sampling Practice, Step 2:
• Purge 1 sand pack volume
v
v
Fee
t B
elo
w G
rad
e
0
15
10
5
v
v
v LNAPL
Clayey Silt
Silt
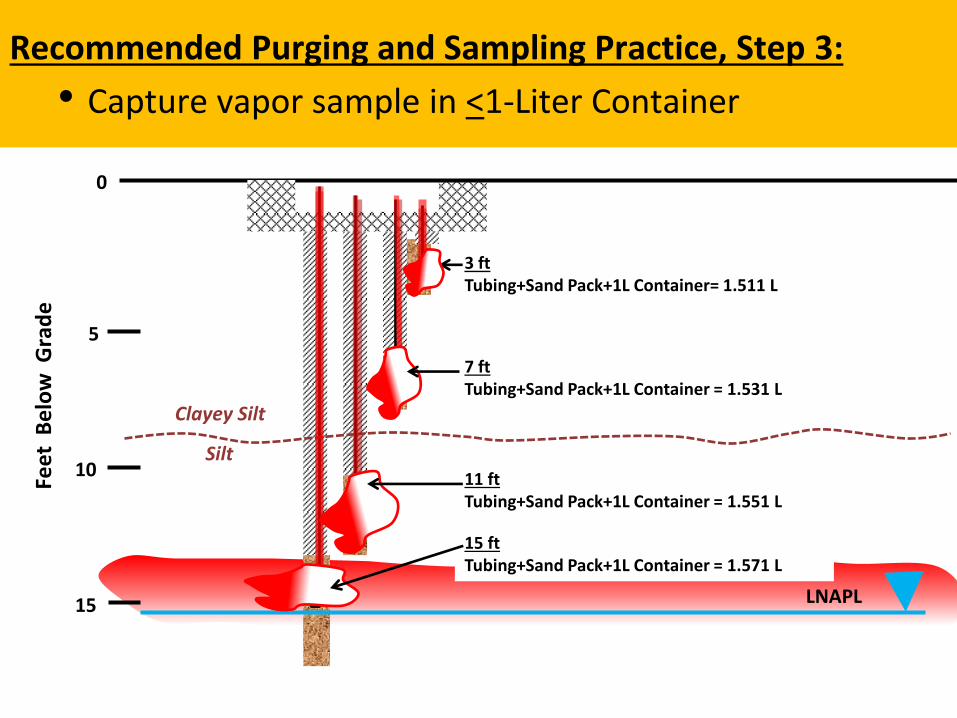
3 ft Tubing+Sand Pack+1L Container= 1.511 L
7 ft Tubing+Sand Pack+1L Container = 1.531 L
11 ft Tubing+Sand Pack+1L Container = 1.551 L
15 ft Tubing+Sand Pack+1L Container = 1.571 L
Recommended Purging and Sampling Practice, Step 3:
• Capture vapor sample in <1-Liter Container

v
v
Fee
t B
elo
w G
rad
e
0
15
10
5
v
v
v LNAPL
Clayey Silt
Silt 11 ft Tubing+Sand Pack+6L Container = 7.36 L
15 ft Tubing+Sand Pack+L Container = 7.37 L
3 ft Tubing+Sand Pack+6L Container = 7.32 L
7 ft Tubing+Sand Pack+6L Container = 7.34 L
• Purging and sampling excessive volumes results in vapors being drawn from
non-representative areas
• Non-representative vapor samples exhibit:
High concentrations of hydrocarbons and oxygen in the same sample
High hydrocarbon concentrations can be diluted due to short-circuiting with uncontaminated zones
Uncontaminated zones exhibiting high hydrocarbons

Soil Gas Temporal Study – EPA-ORD

Probe A3 (TCE - Normalized)
0
0.2
0.4
0.6
0.8
1
1.2
1.4
1.6
1.8
2
13
:50
:09
10
:50
:26
7:5
0:4
4
4:5
1:0
4
1:5
1:4
3
22
:53
:46
5:4
3:2
9
2:4
3:4
7
23
:44
:04
20
:44
:22
17
:44
:39
14
:44
:57
11
:45
:15
8:4
5:3
2
16
:02
:01
13
:02
:18
10
:02
:36
7:0
2:5
5
4:0
3:1
2
1:4
3:5
6
22
:44
:15
7:0
6:4
1
4:0
6:5
9
1:0
7:1
9
22
:07
:58
19
:11
:25
Time (3/16/07 to 4/10/07)
No
rma
lize
d C
on
ce
ntr
ati
on
Probe A3-3' (Port 9)
Probe A3-8' (Port 10)
Probe A3-17' (Port 5)
Soil Gas Temporal Study, EPA-ORD
3’ bgs
8’ bgs
15’ bgs
• >500 points per probe collected once per hour over 4 week period
• Soil gas concentrations varied by <10% even for probes only 3 feet
below the surface.

METHODS TO ASSESS VI
• Indoor Air Sampling
• Groundwater Sampling
• Soil Phase Sampling
• Predictive Modeling
• Measure Flux Directly
• Soil Gas Sampling
• Supplemental Tools/Data

GENERAL APPROACH FOR ASSESSING VI
•Indoor Air • Always find something
• Multiple sampling rounds
•Groundwater and Soil Data – Typically over-predicts risk
•Soil Gas Data
– Best Data to Collect for PVI Assessment

PVI-SPECIFIC SAMPLING ISSUES
• Soil Gas VOC Analysis • Benzene, ethylbenzene & naphthalene
• TPH??
• Might Need to Sample <5’ bgs • If samples >5’ bgs exceed allowable levels
• How to know? On-site analysis best
• If not, collect samples anyway
• Oxygen and Carbon Dioxide Data demonstrate biodegradation

Ingredients for Effective VI Assessments
• Investigatory Approach
• Determine Correct Screening Levels
• Sample & Analyze Properly
• Know & Use Supplemental Tools
• Demonstrating Bioattenuation

The Most Important Ingredient
• Experience:
– Consultant
– Collector – done soil gas before?
– Lab – certified for methods?
– Regulator
– Public
– YOU!
What level person is going in the field?

Most Common VI Bloopers
• Unit Confusion
– Assuming mg/L equivalent to ppmv
– Assuming ug/m3 equivalent to ppbv
• Screening Levels
– Comparing to generic screening levels
– Not calculating correct levels
• Sampling & Analysis Errors
– Program design: soil gas? GW? SS? IA?
– Using wrong hardware
– Using wrong analysis

Units: ppmv
Incorrect Units
Wrong Screening Values
It Won’t Happen To Me …
RLs Not Low Enough
Uncertified Lab

All deployed & retrieved at exact same minute!
All final vacuums at 0
It Won’t Happen To Me #2…

PASSIVE IA COLLECTORS
Longer Collection Times Increases Odds of False Positives

GOT A LIFE?
Longer Collection Times = False Positives

SHAMPOO & CONDITIONER
According to European and Canadian reports, carcinogens are in almost every brand
Compound Shampoo Conditioner Cancer
(µg/m3)
Noncancer
(µg/m3)
1,4-Dioxane 87 - 0.490 31
Chloromethane 170 88 n/a 94
Ethyl acetate 6,500 120 n/a 73
Isopropylbenzene - 280,000 n/a 420
(C9-C12) Aliphatics 11,000 32,000 0.54 1000
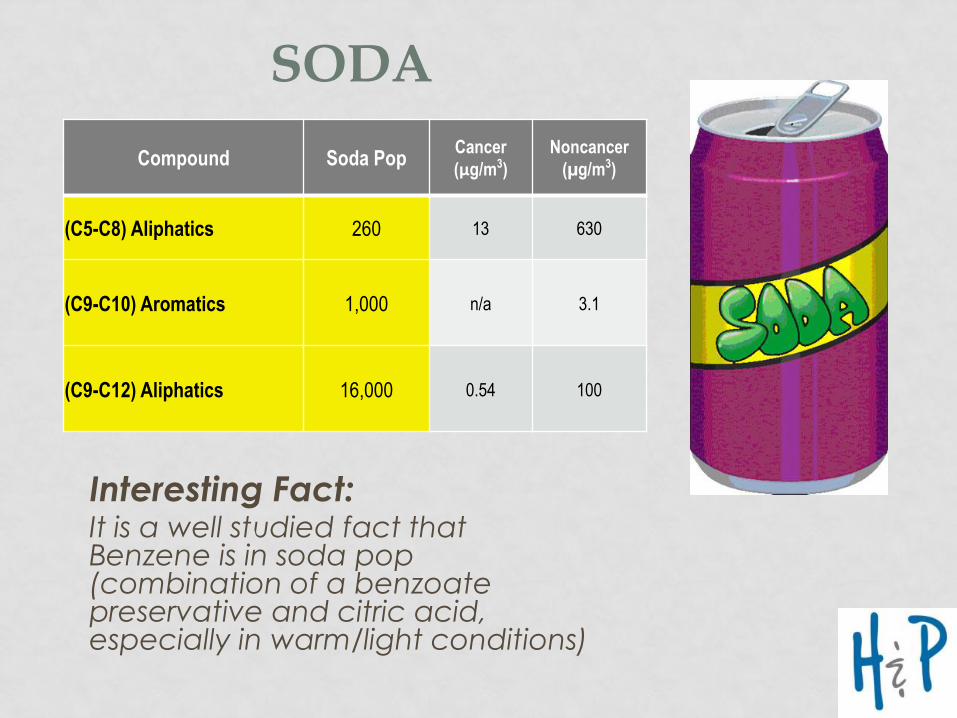
SODA
Interesting Fact: It is a well studied fact that Benzene is in soda pop (combination of a benzoate preservative and citric acid, especially in warm/light conditions)
Compound Soda Pop Cancer
(µg/m3)
Noncancer
(µg/m3)
(C5-C8) Aliphatics 260 13 630
(C9-C10) Aromatics 1,000 n/a 3.1
(C9-C12) Aliphatics 16,000 0.54 100

SILLY STRING

UDEQ 1st Floor, 6-L Summa Outside Boss’s Office

Indoor Air Data, Utah DEQ Building, 4-30-15 ug/m3
Compound
C-181
1st Floor
outside
boss's office
DERR
C-182
3rd Floor
inside
boss's office
DDW
EPA VISL
Commercial
Indoor Air (TR 10-06,
GW temp. 55 F)
Benzene 0.406 0.415 1.6
Toluene 6.86 1.93 22,000
Ethylbenzene 0.621 0.191 4.9c, 1482nc
Xylenes 1.97 0.895 440
Naphthalene 0.572 <1.05 0.36c, 4.39nc
MTBE < 0.072 <0.072 47c, 4380nc
Tetrachloroethene 0.203 <0.136 47
Trichloroethene < 0.107 <0.107 3.0
Trichlorofluoromethane 1.71 1.70 3100
Chlorodifluoromethane 1.70 1.76 220,000
Dichlororodifluoromethane 1.29 1.58 440
Chloromethane 1.38 1.36 390
1,2-Dibromoethane (EDB) < 1.54 <0.154 0.02
1,2-Dichloroethane (DCA, EDC) 0.162 0.142 0.47
Methanol 47.3 77.1 88,000
Ethyl Alcohol (Ethanol) 68.0 70.3 none
iso-Propyl Alcohol (Isopropanol) 5.8 9.88 880
Acetone 21.5 24.9 3100
2-Butanone 1.63 4.75 none
Methylene Chloride 2.89 <1.74 1200
Butane C4 1.66 1.63 none
Pentane C5 5.55 3.51 4400
Decane C10 3.03 <1.16 none
Undecane C11 2.72 <1.28 none
Dodecane C12 4.97 <1.39 none

Thank You


![pvicollective.compvicollective.com/.../uploads/2012/09/pvi-annual-report-2… · Web viewpvi. collective: [performance] [video] [intervention][] pvi. pvi. collective. collective](https://img.dokumen.tips/doc/110x75/5aadeb937f8b9a5d0a8b7182/web-viewpvi-collective-performance-video-intervention-pvi-pvi-collective.jpg)