Embed Size (px)
Citation preview
RIVER SYSTEMS AND LANDFORMS (2)
RIVER EROSION, DEPOSITION
AND LANDFORMS
1. Introduction
2. River energy
3. River erosion and deposition
4. Landforms: upper, middle and lower reaches
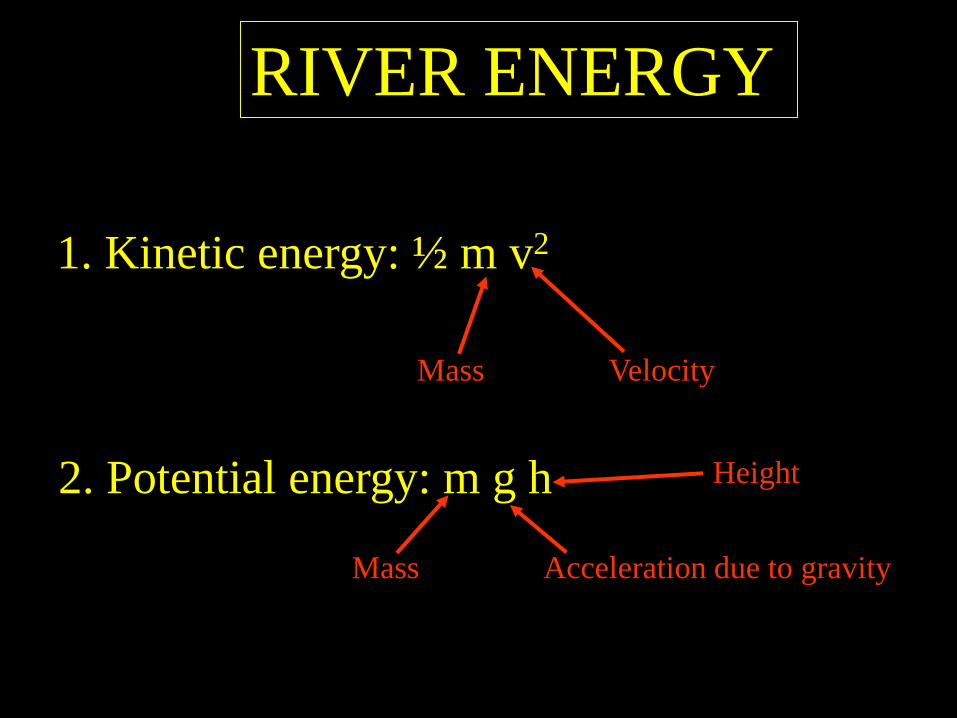
RIVER ENERGY
2. Potential energy: m g h
Mass Acceleration due to gravity
Height
1. Kinetic energy: ½ m v2
Mass Velocity
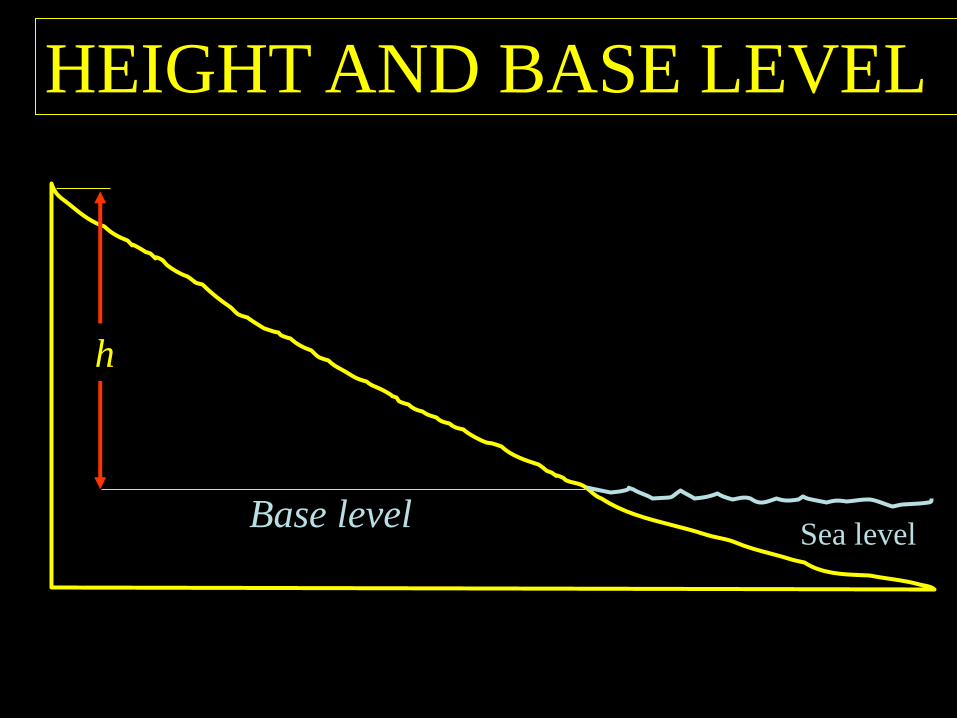
HEIGHT AND BASE LEVEL
h
Sea level Base level
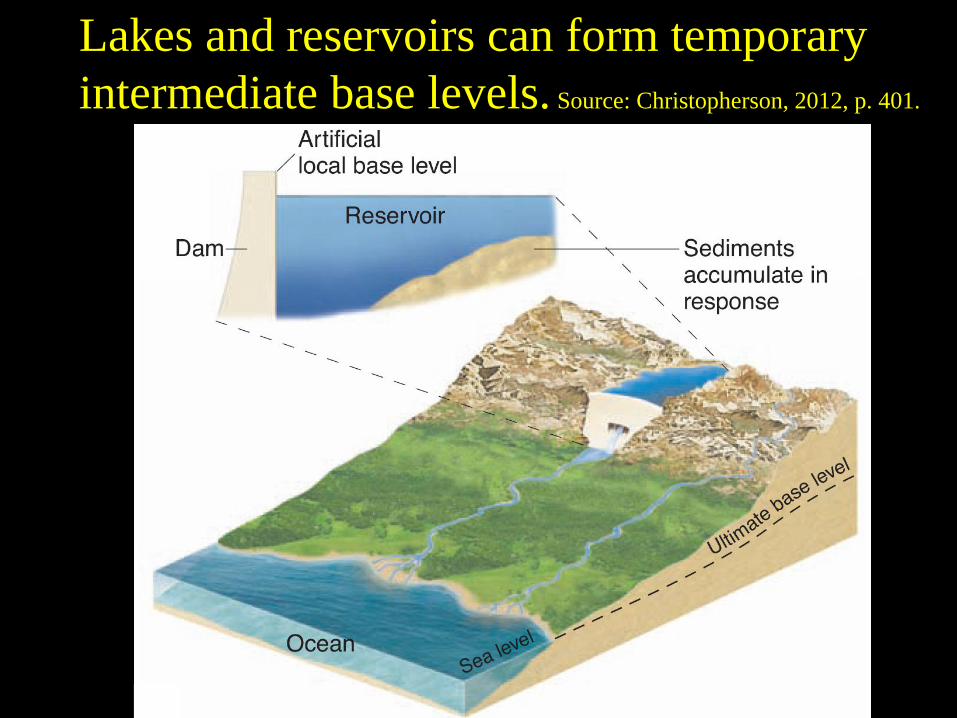
Lakes and reservoirs can form temporary
intermediate base levels. Source: Christopherson, 2012, p. 401.
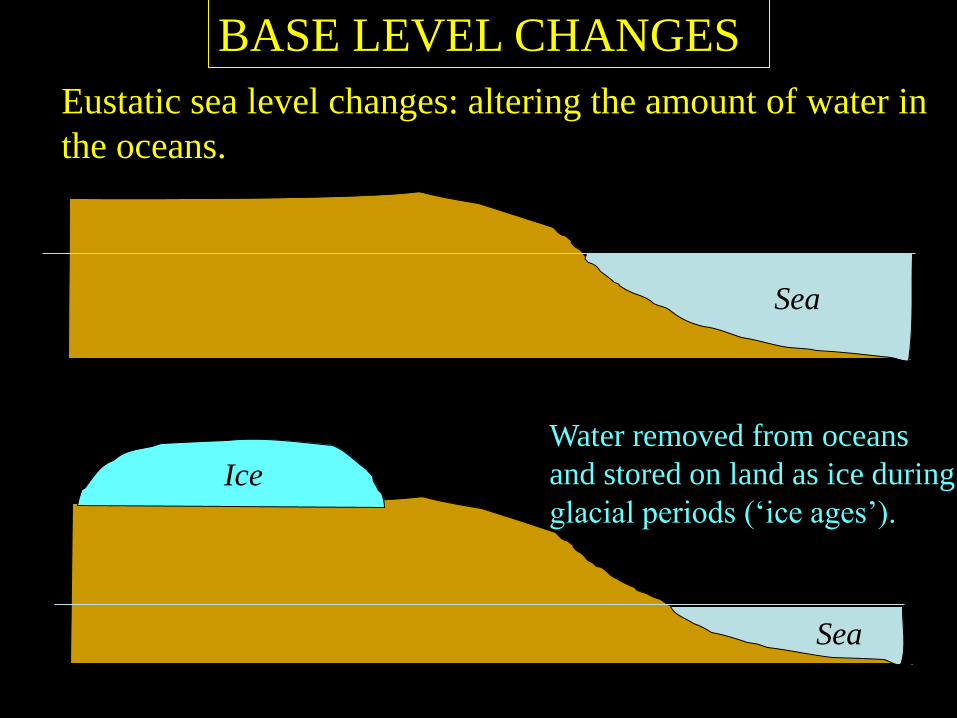
BASE LEVEL CHANGES
Sea
Sea
Ice
Water removed from oceans
and stored on land as ice during
glacial periods (‘ice ages’).
Eustatic sea level changes: altering the amount of water in
the oceans.
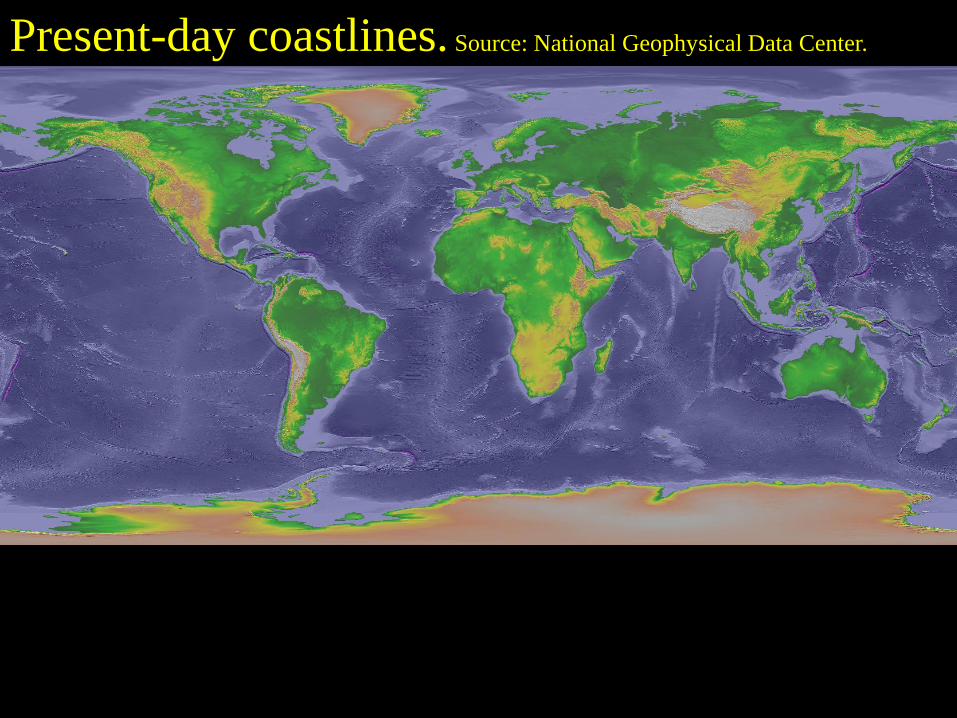
Present-day coastlines. Source: National Geophysical Data Center.
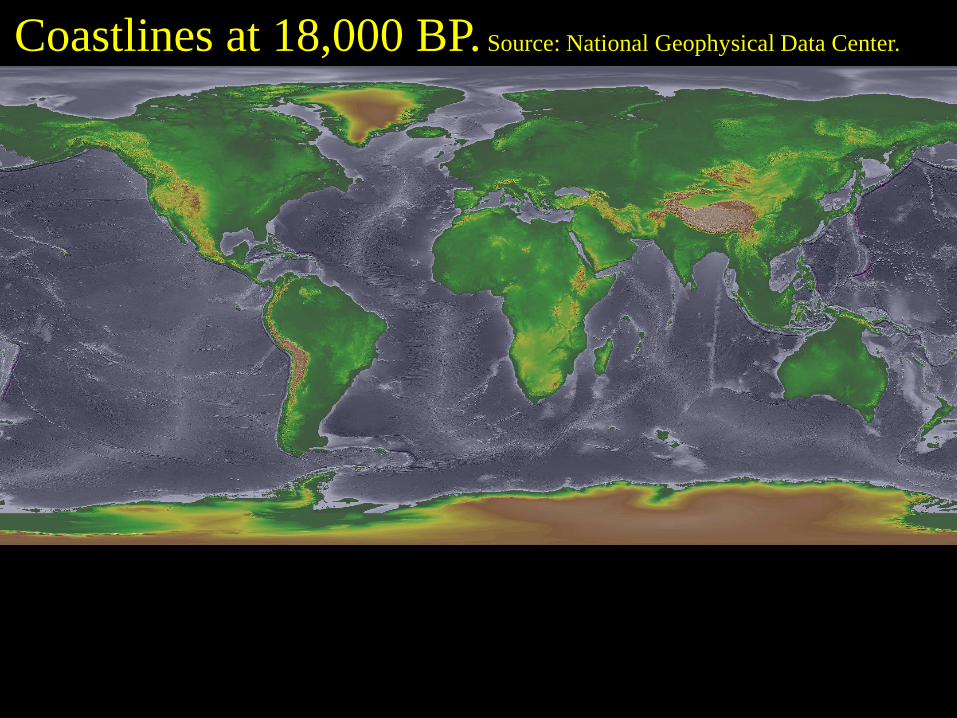
Coastlines at 18,000 BP. Source: National Geophysical Data Center.
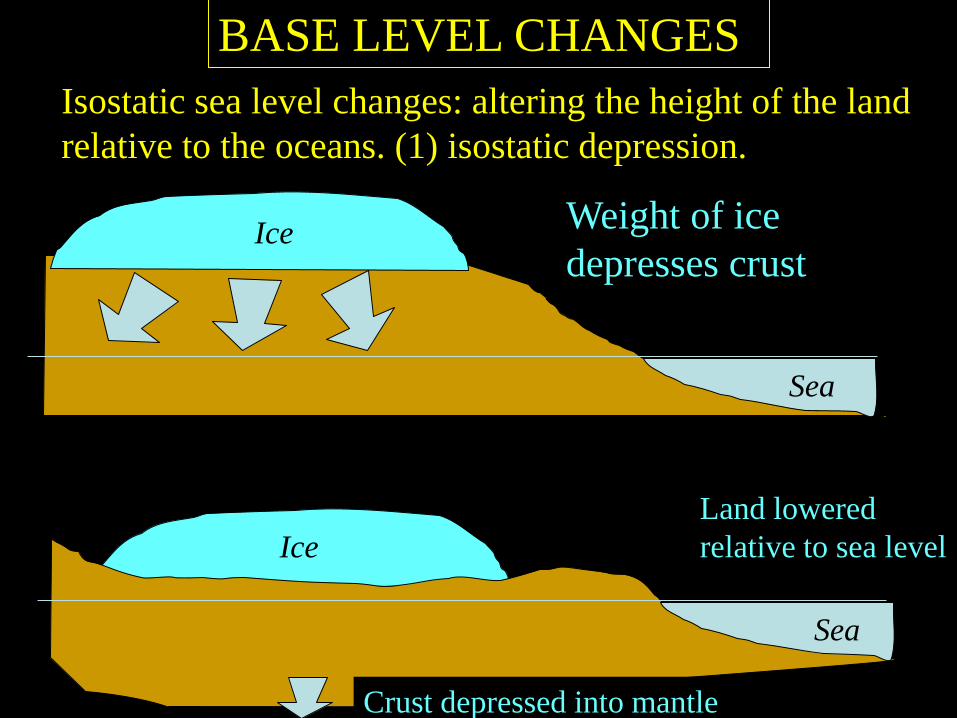
BASE LEVEL CHANGES
Sea
Ice
Isostatic sea level changes: altering the height of the land
relative to the oceans. (1) isostatic depression.
Weight of ice
depresses crust
Sea
Ice
Sea
Ice
Crust depressed into mantle
Land lowered
relative to sea level
Sea
BASE LEVEL CHANGES
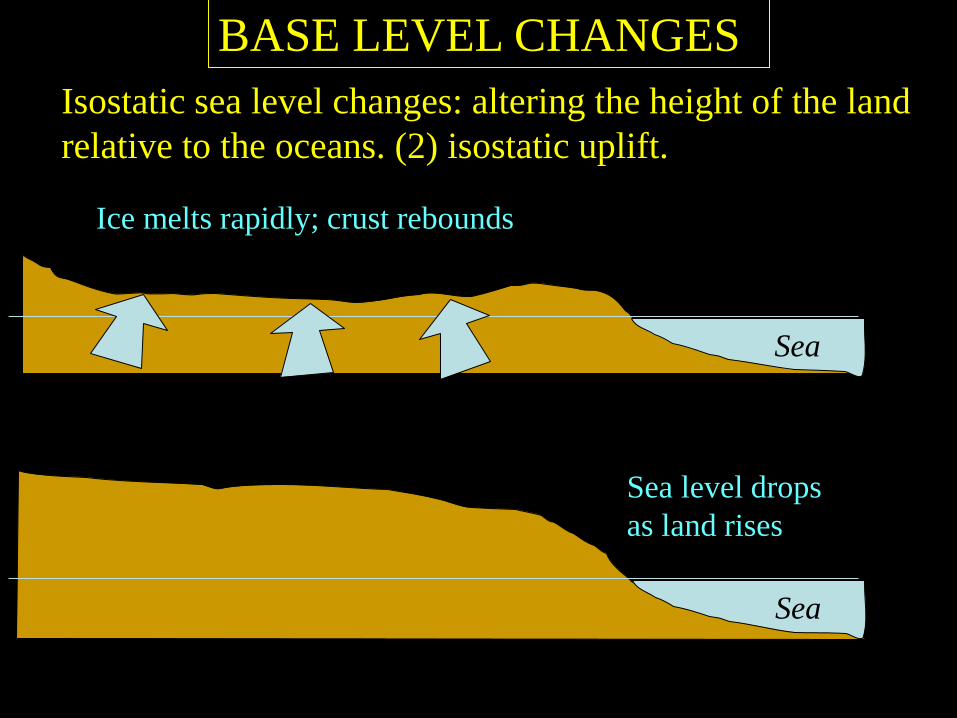
Isostatic sea level changes: altering the height of the land
relative to the oceans. (2) isostatic uplift.
Ice melts rapidly; crust rebounds
Sea
Sea level drops
as land rises
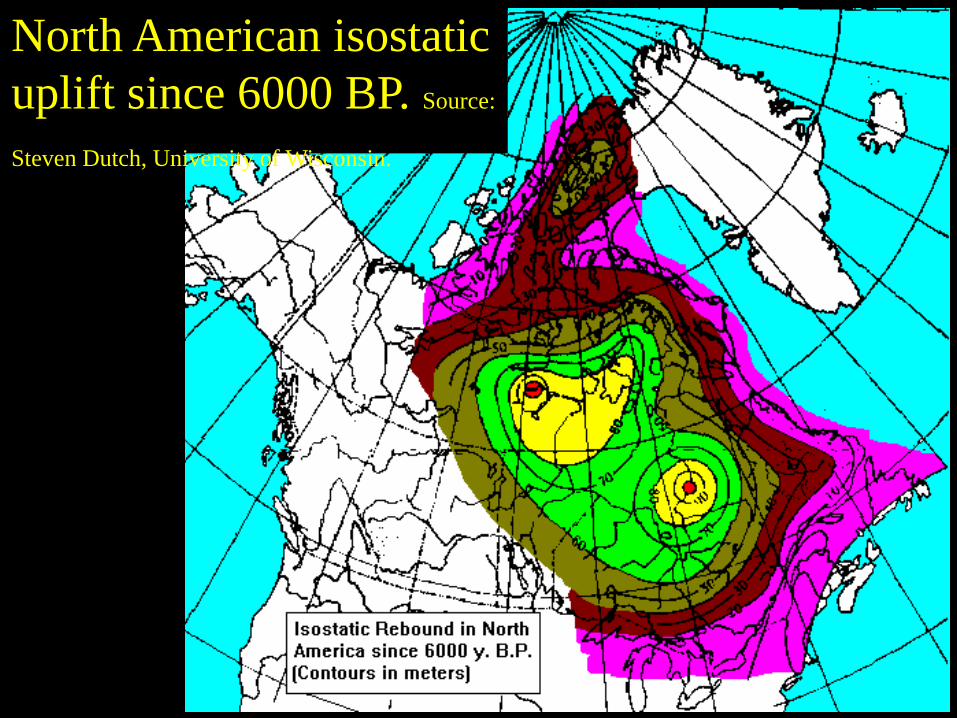
North American isostatic
uplift since 6000 BP. Source:
Steven Dutch, University of Wisconsin.
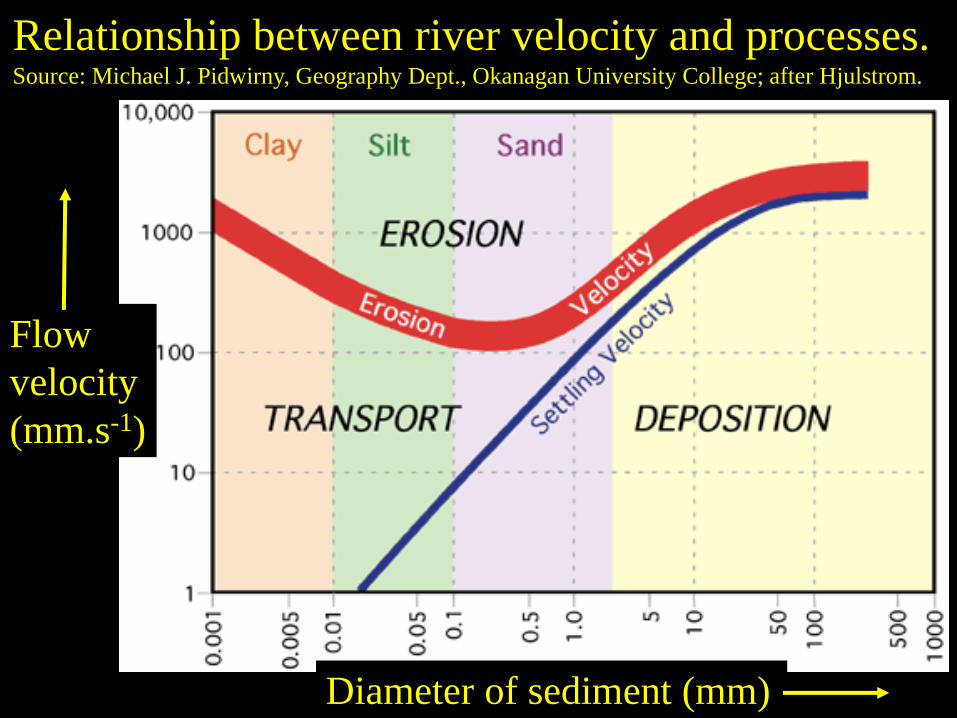
Relationship between river velocity and processes.
Source: Michael J. Pidwirny, Geography Dept., Okanagan University College; after Hjulstrom.
Diameter of sediment (mm)
Flow
velocity
(mm.s-1)

River velocity indicates river energy.
River energy may be used to erode the bed
and banks, and transport eroded material.

PROCESSES OF RIVER EROSION
1. Hydraulic action
2. Abrasion
3. Solution
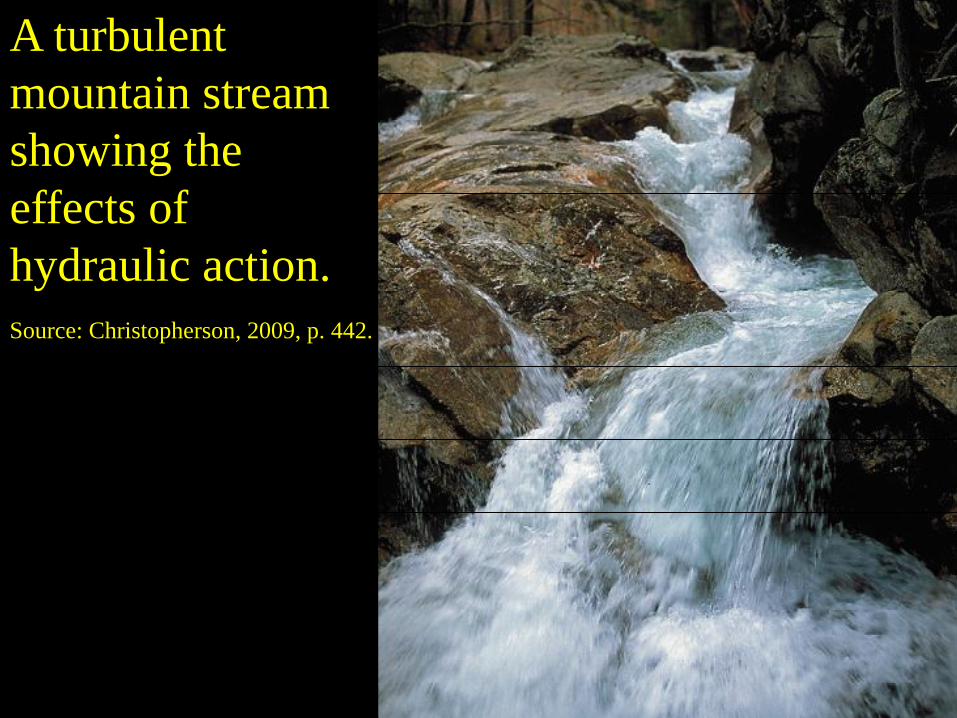
A turbulent
mountain stream
showing the
effects of
hydraulic action.
Source: Christopherson, 2009, p. 442.

River bed
River surface
TRACTION SALTATION
SUSPENSION
TOTAL RIVER LOAD = BED LOAD
+ SUSPENDED LOAD
+ DISSOLVED LOAD
Processes of river transport. After Christopherson, 2012, p. 409.
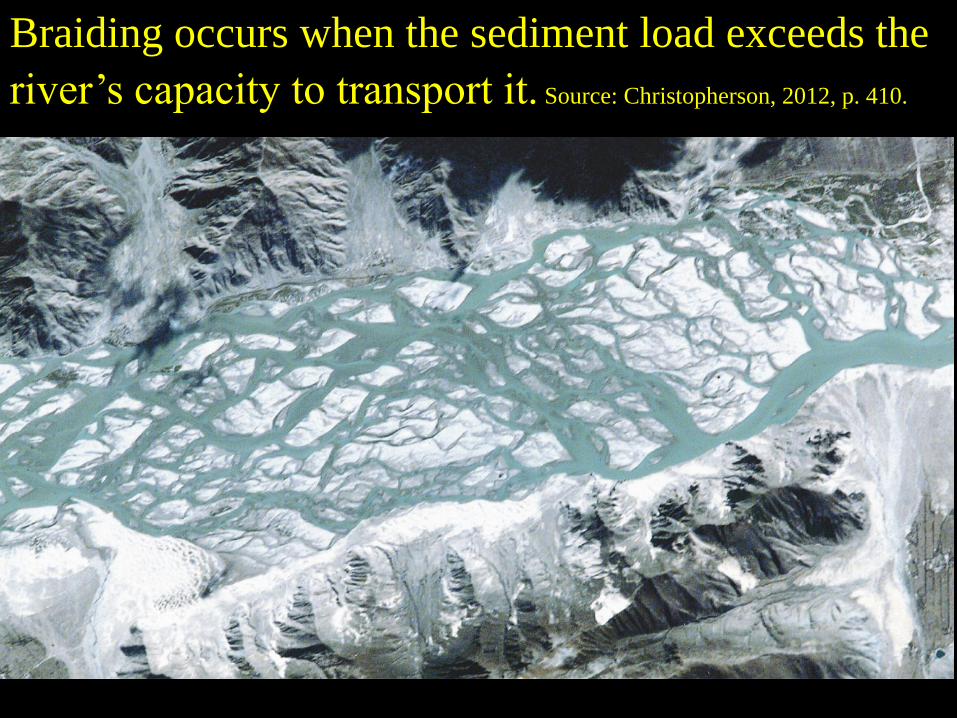
Braiding occurs when the sediment load exceeds the
river’s capacity to transport it. Source: Christopherson, 2012, p. 410.
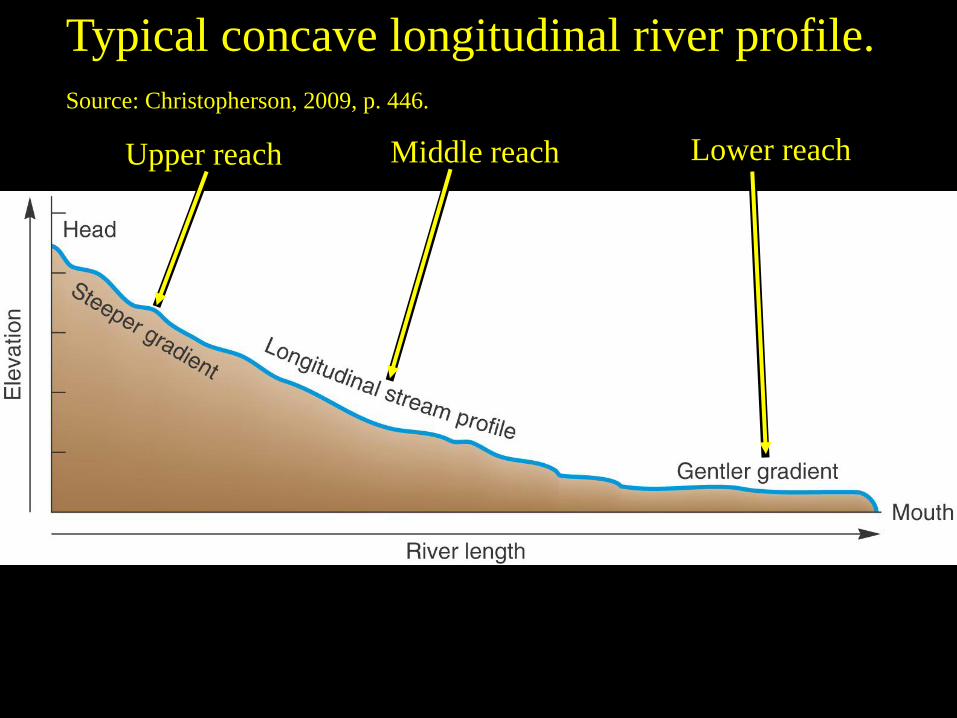
Typical concave longitudinal river profile.
Source: Christopherson, 2009, p. 446.
Upper reach Middle reach Lower reach

A turbulent
mountain stream
showing the
effects of
hydraulic action.
Source: Christopherson, 2009, p. 442.

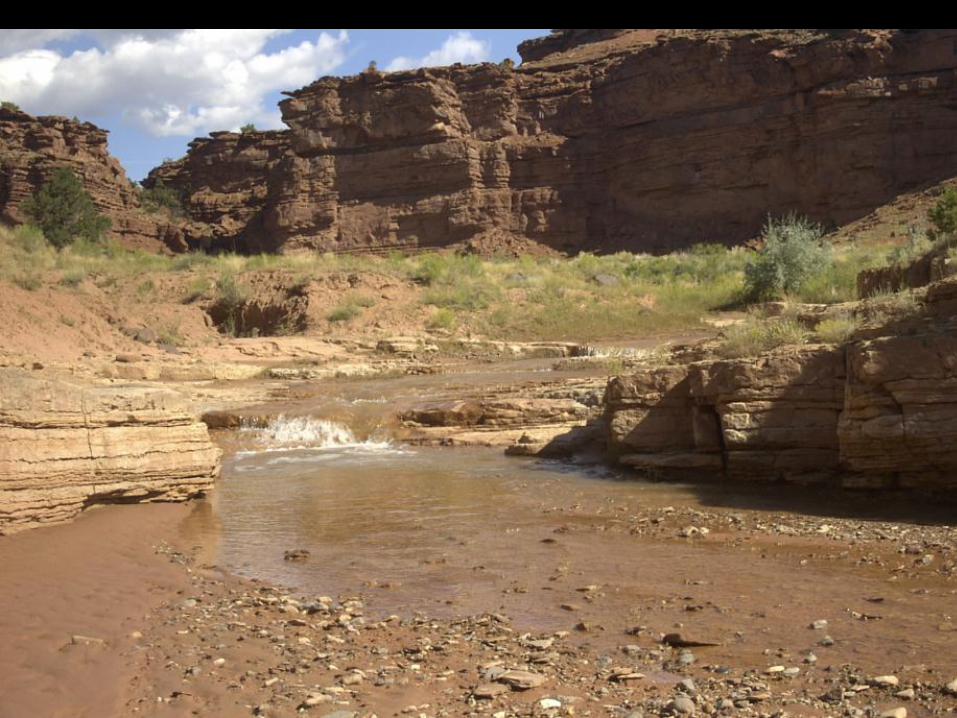
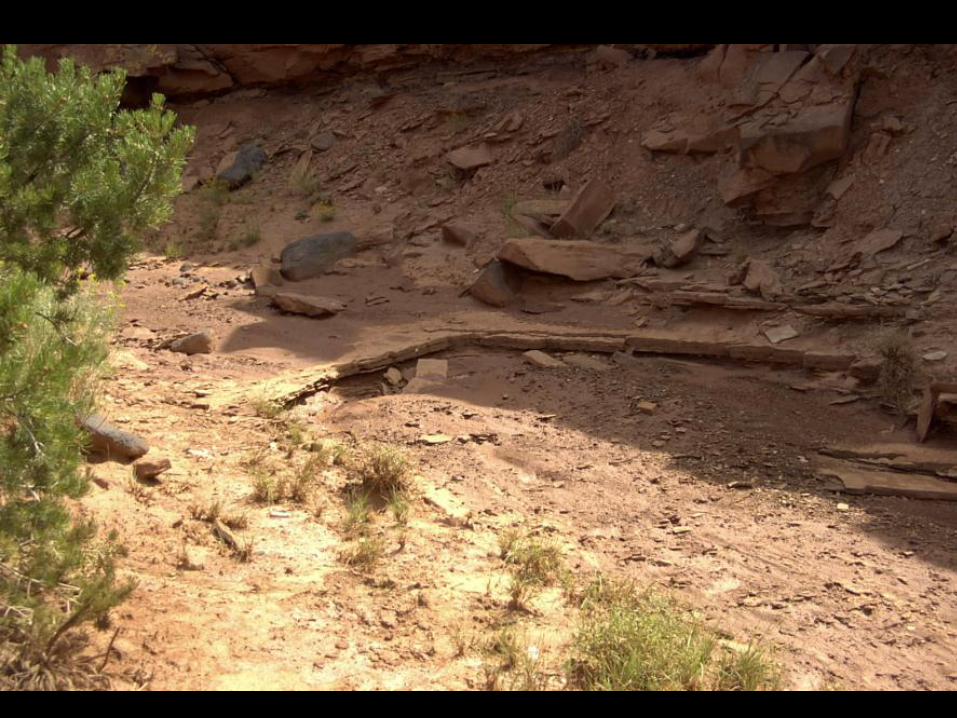
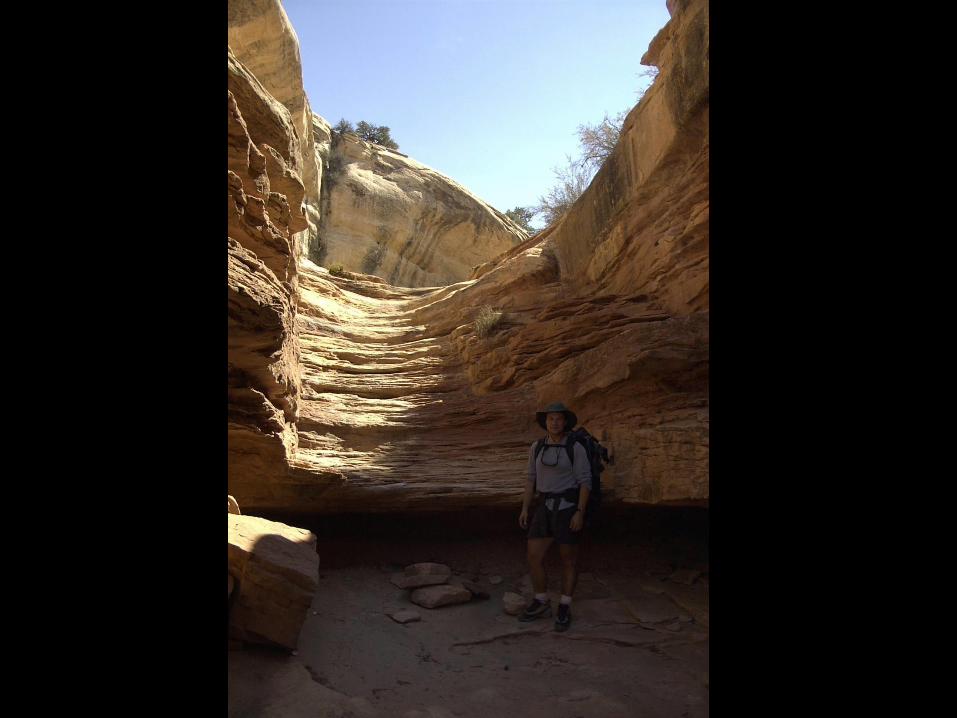
Cutting of V-shaped valleys in upper reaches.
Source: Steven Dutch, University of Wisconsin.
Low sediment load means river energy can be used mainly for erosion.
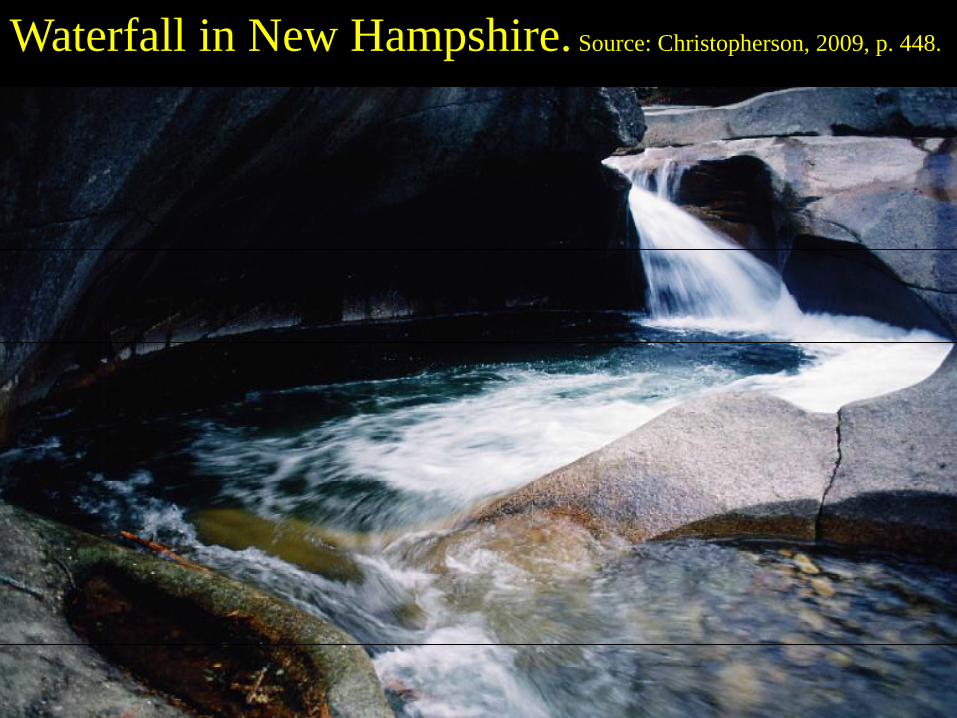
Waterfall in New Hampshire. Source: Christopherson, 2009, p. 448.

Waterfalls: common features of the upper reach.
Source: Christopherson, 2012, p. 414.
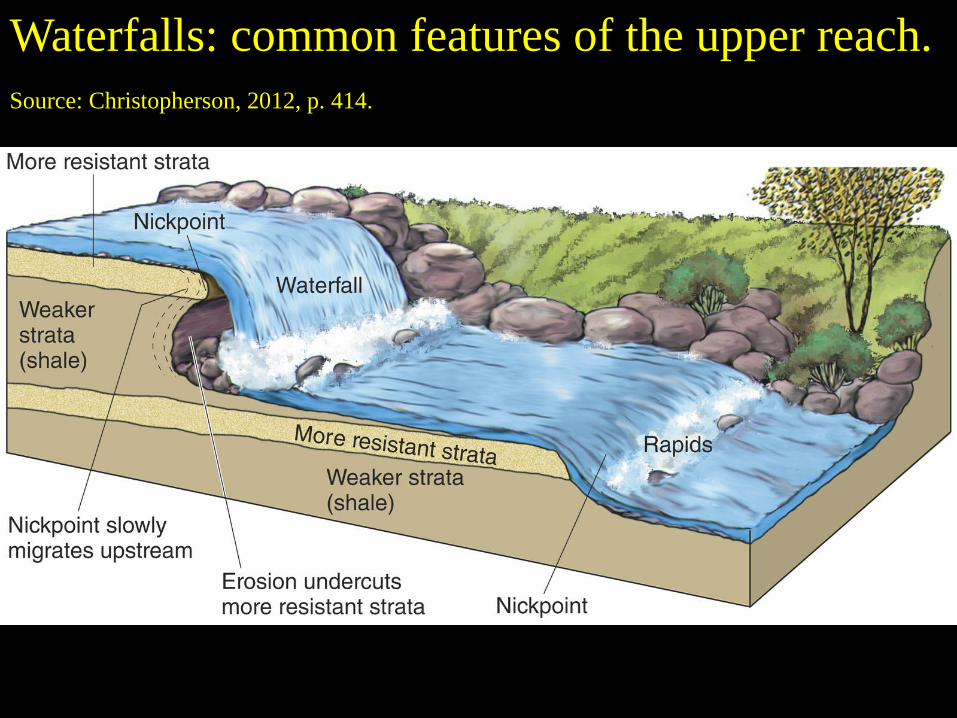
Waterfalls: common features of the upper reach.
Source: Christopherson, 2012, p. 414.
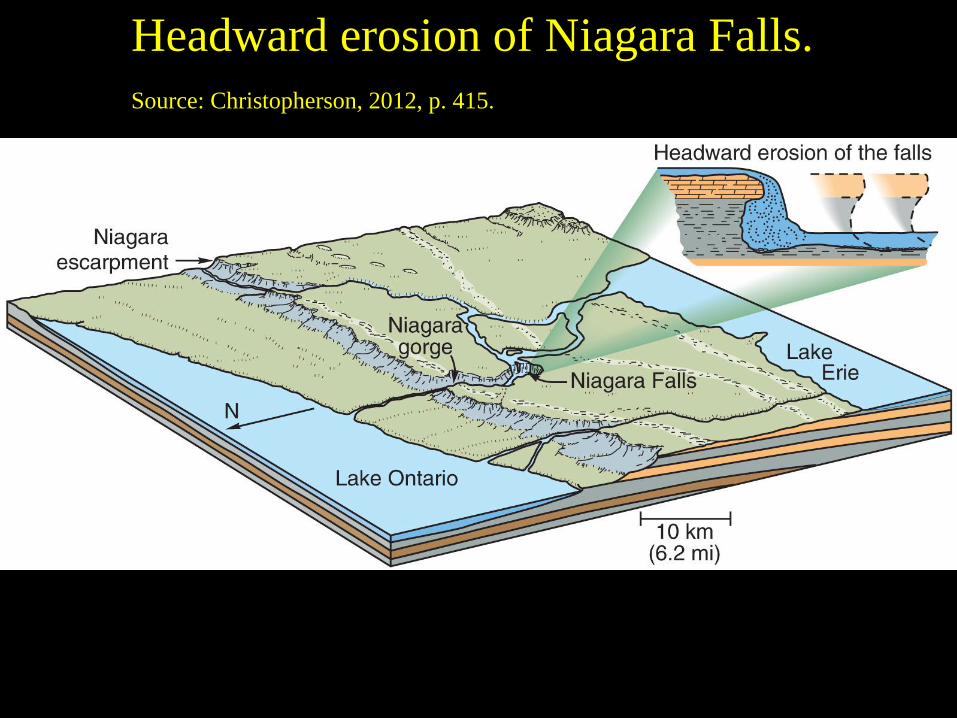
Headward erosion of Niagara Falls.
Source: Christopherson, 2012, p. 415.
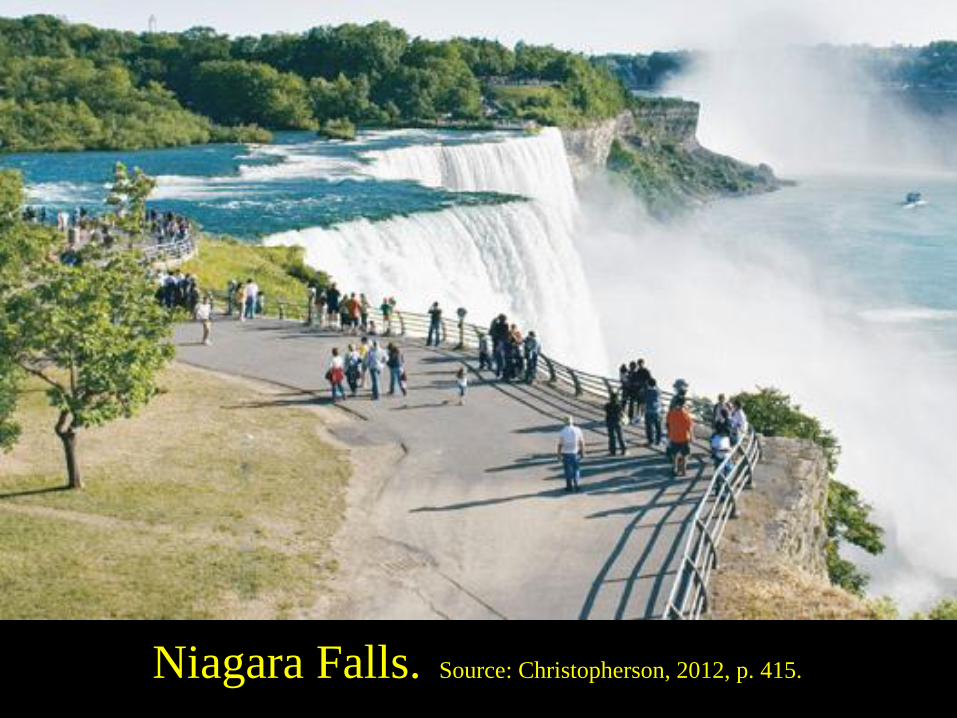
Niagara Falls. Source: Christopherson, 2012, p. 415.
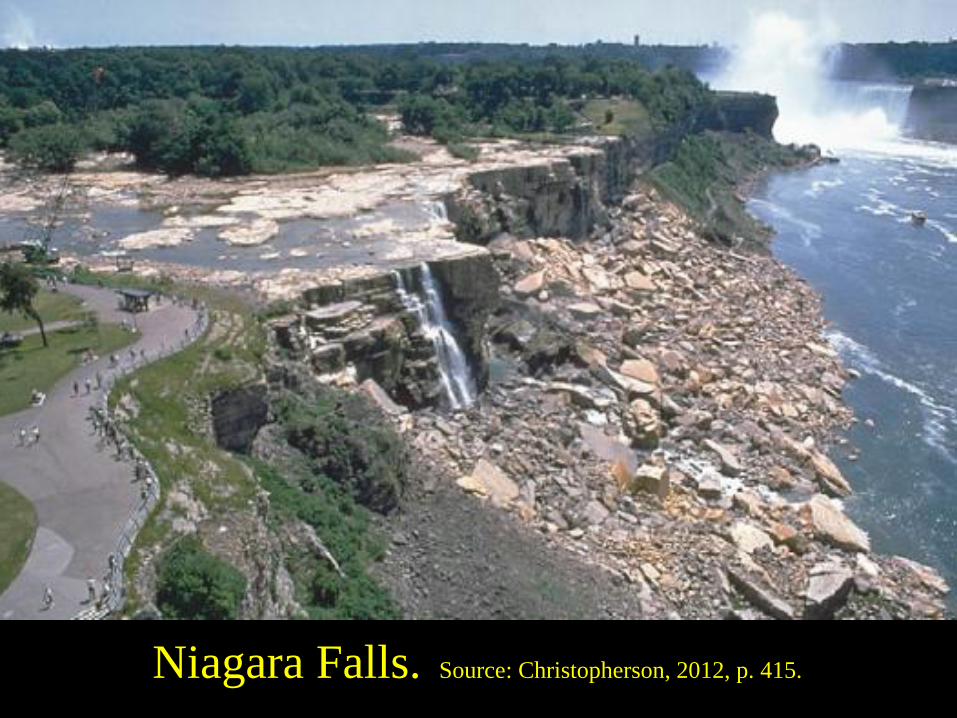
Niagara Falls. Source: Christopherson, 2012, p. 415.

Niagara Falls. Source: Christopherson, 2012, p. 415.

The Mississippi River.
Source: National Park Service/Mississippi National River and Recreation Area.
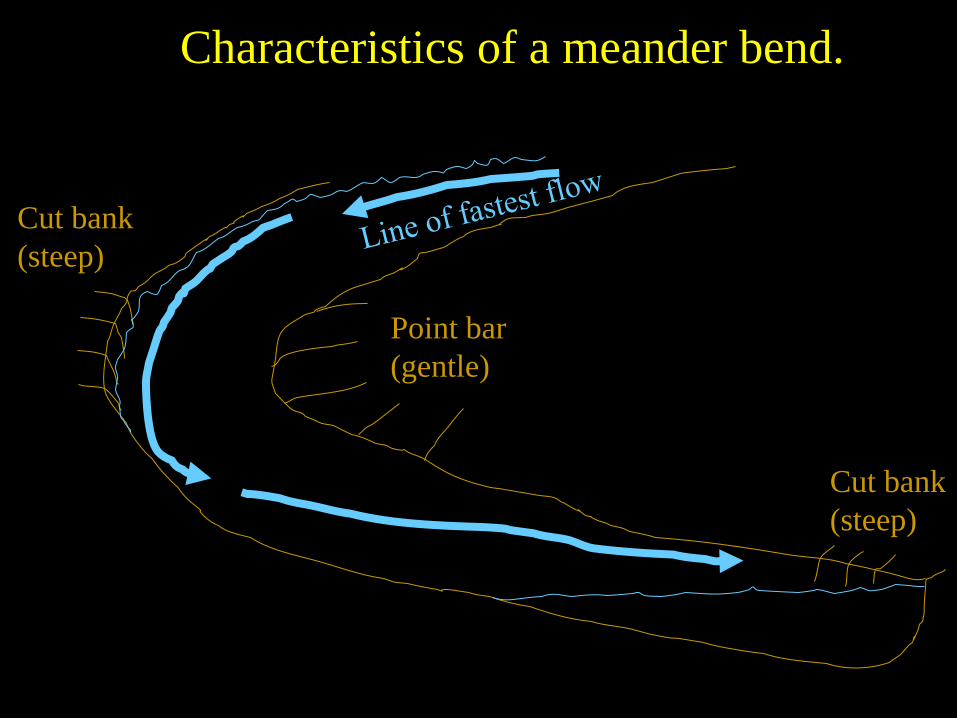
Cut bank
(steep)
Point bar
(gentle)
Cut bank
(steep)
Characteristics of a meander bend.
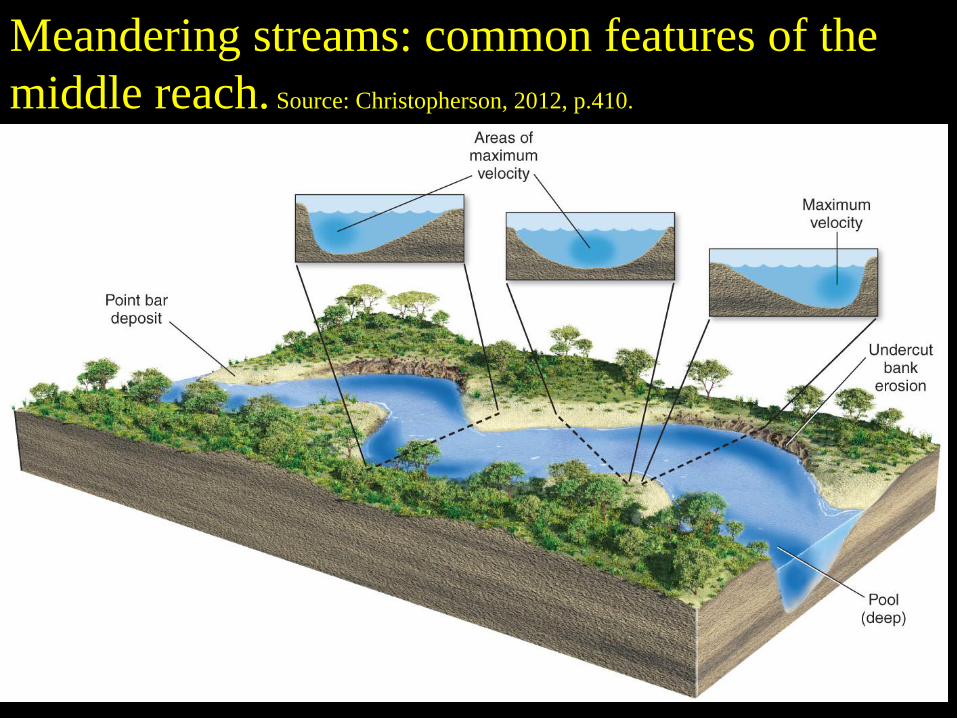
Meandering streams: common features of the
middle reach. Source: Christopherson, 2012, p.410.
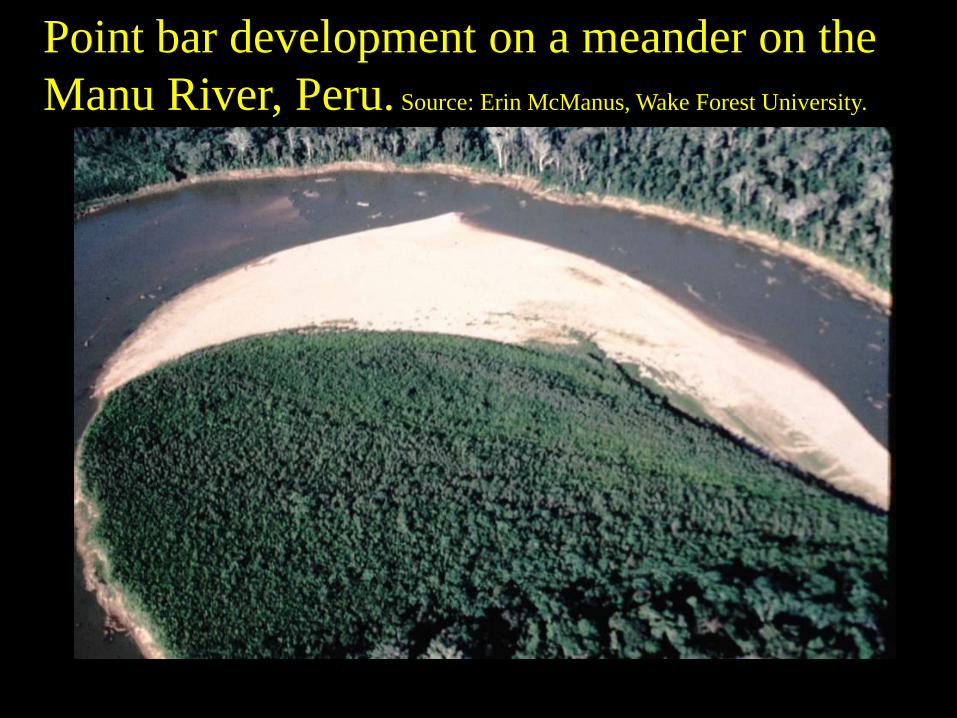
Point bar development on a meander on the
Manu River, Peru. Source: Erin McManus, Wake Forest University.
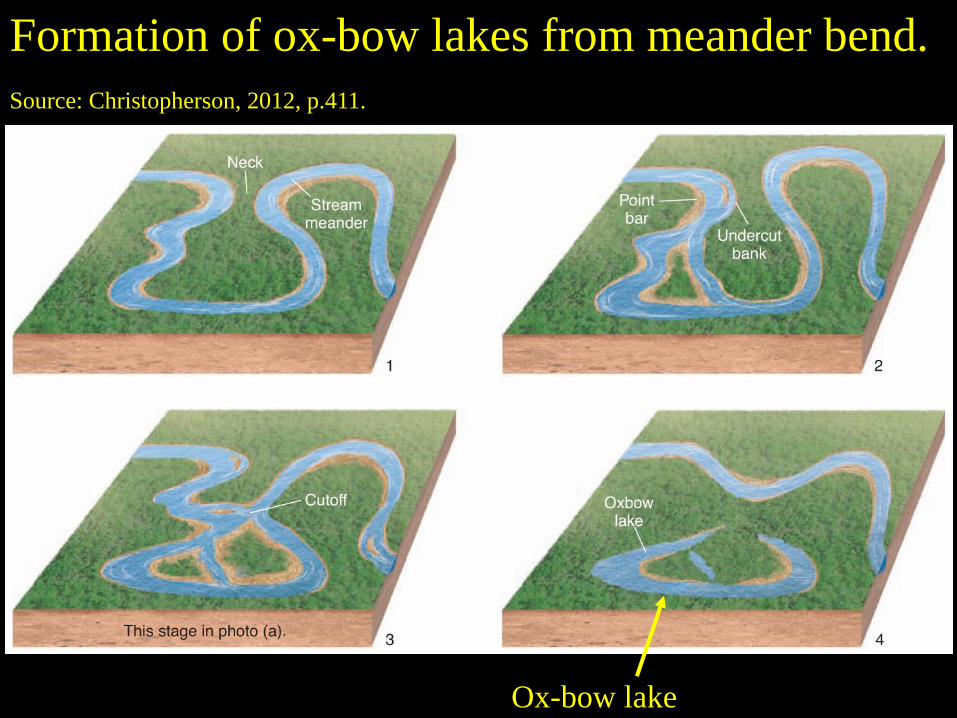
Formation of ox-bow lakes from meander bend.
Source: Christopherson, 2012, p.411.
Ox-bow lake
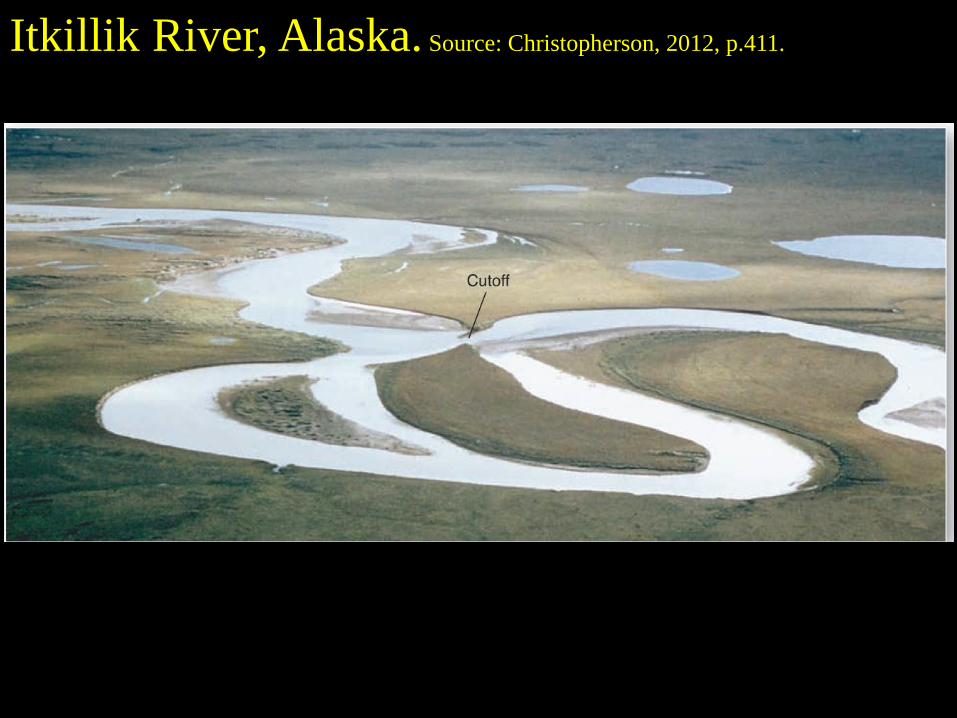
Itkillik River, Alaska. Source: Christopherson, 2012, p.411.

Formation of ox-bow lakes from meander bend.
Source: Christopherson, 2012, p.411.
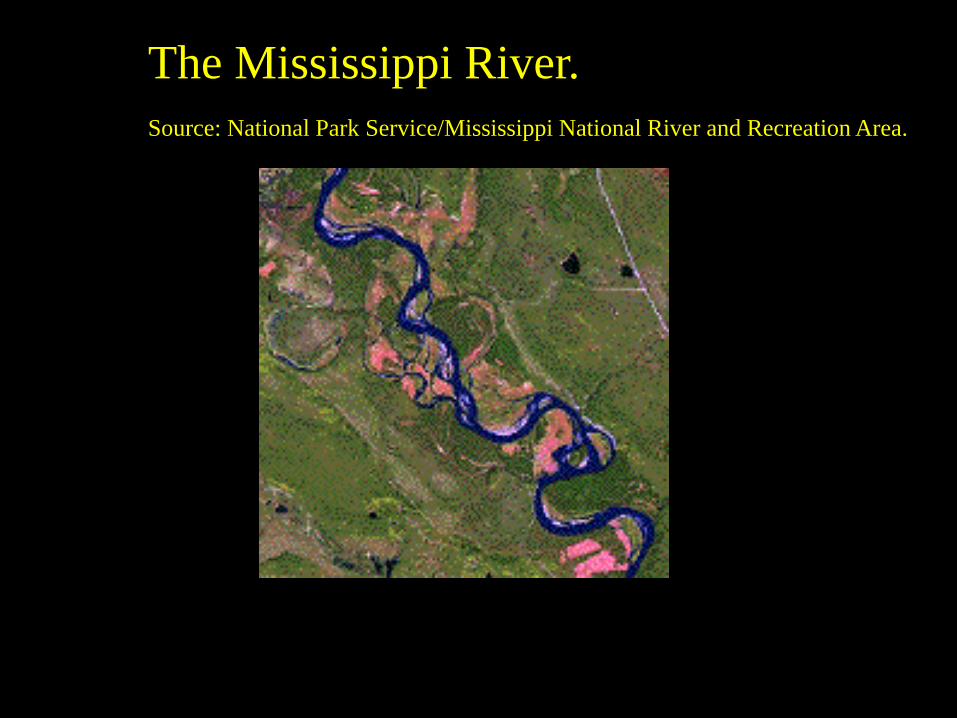
The Mississippi River.
Source: National Park Service/Mississippi National River and Recreation Area.
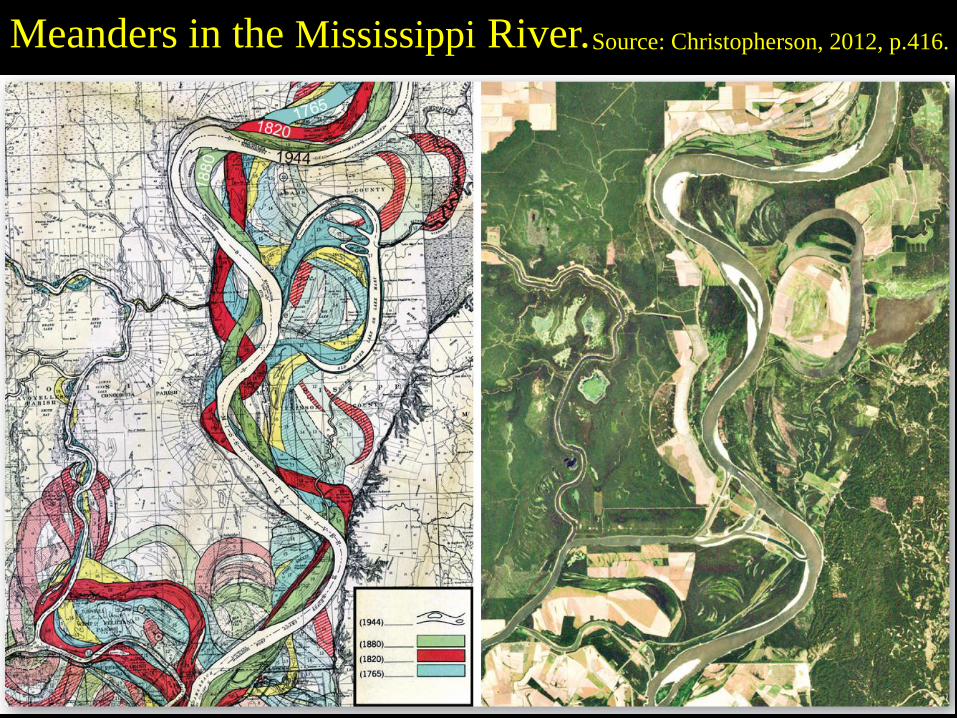
Meanders in the Mississippi River. Source: Christopherson, 2012, p.416.
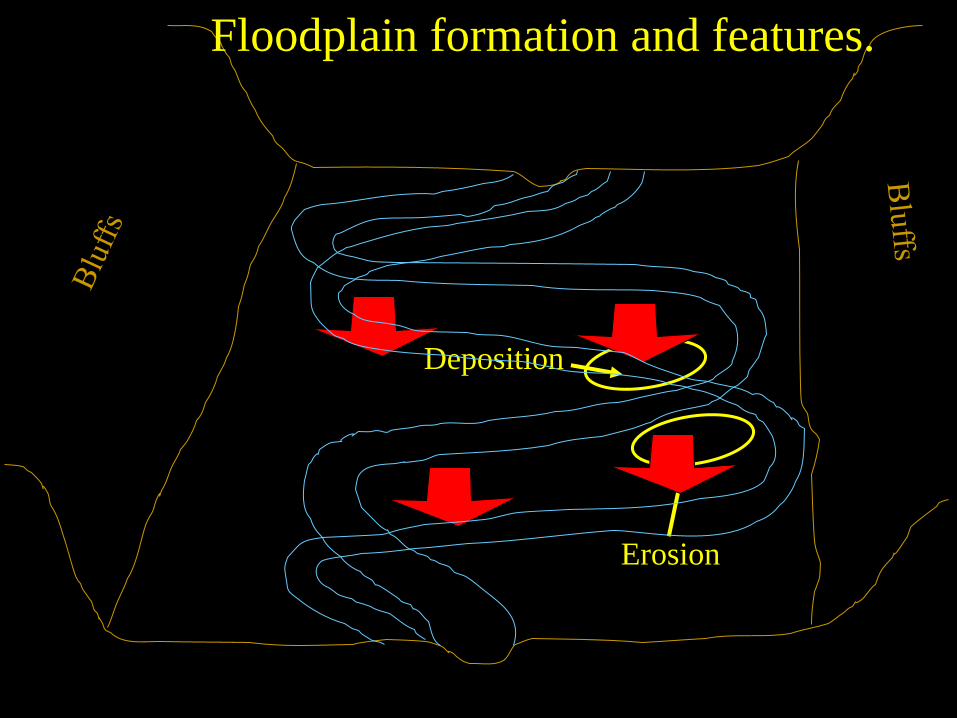
Erosion
Deposition
Floodplain formation and features.
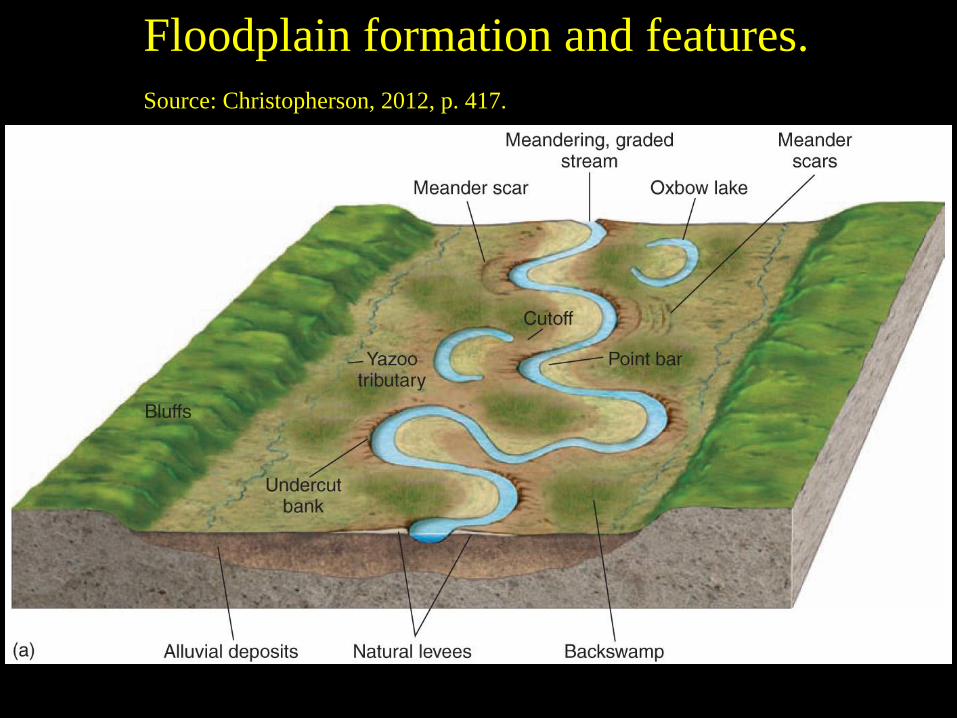
Floodplain formation and features.
Source: Christopherson, 2012, p. 417.
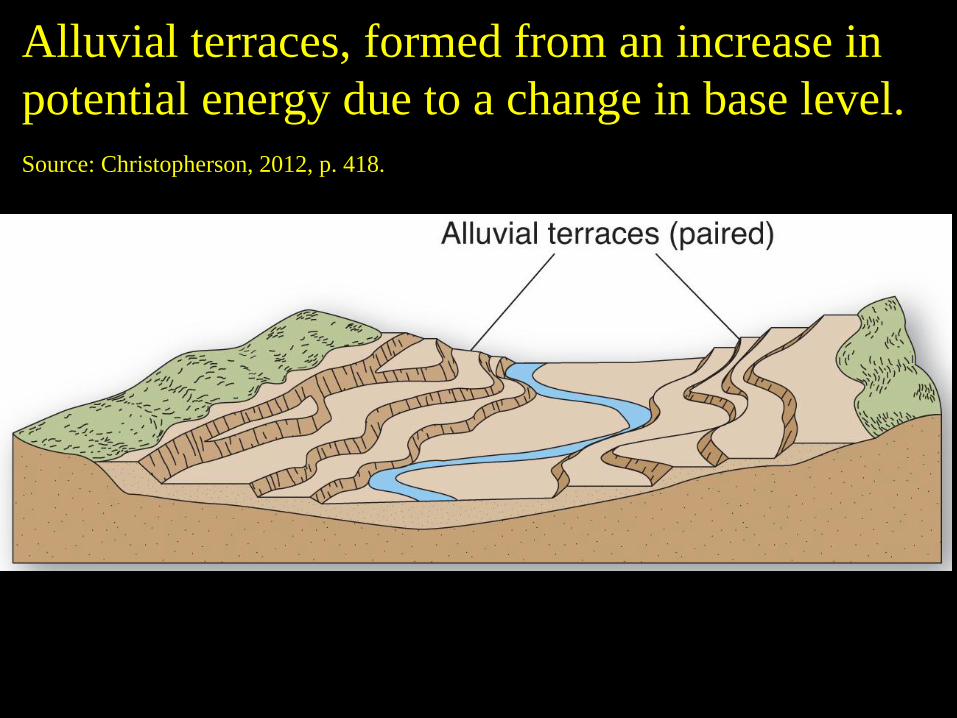
Alluvial terraces, formed from an increase in
potential energy due to a change in base level.
Source: Christopherson, 2012, p. 418.
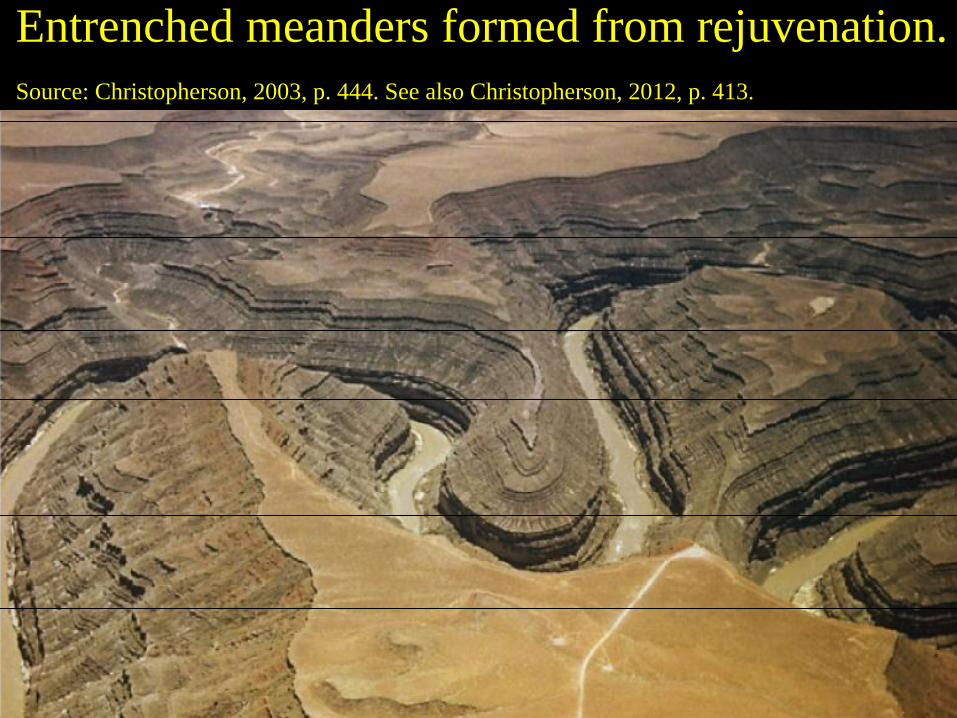
Entrenched meanders formed from rejuvenation.
Source: Christopherson, 2003, p. 444. See also Christopherson, 2012, p. 413.
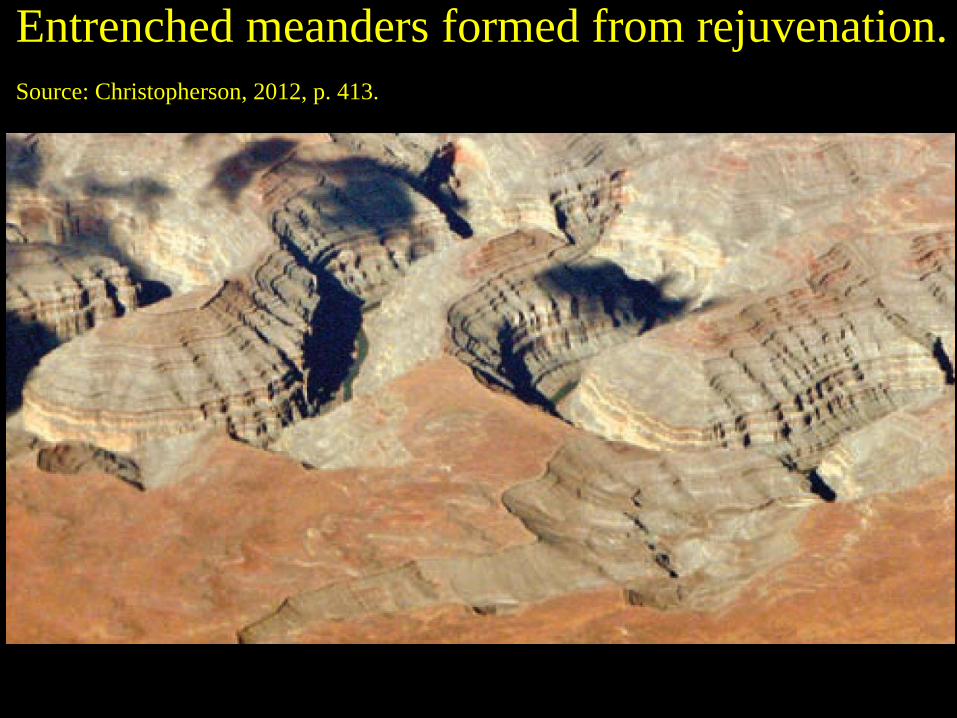
Entrenched meanders formed from rejuvenation.
Source: Christopherson, 2012, p. 413.

The Nile delta:
an arcuate delta.
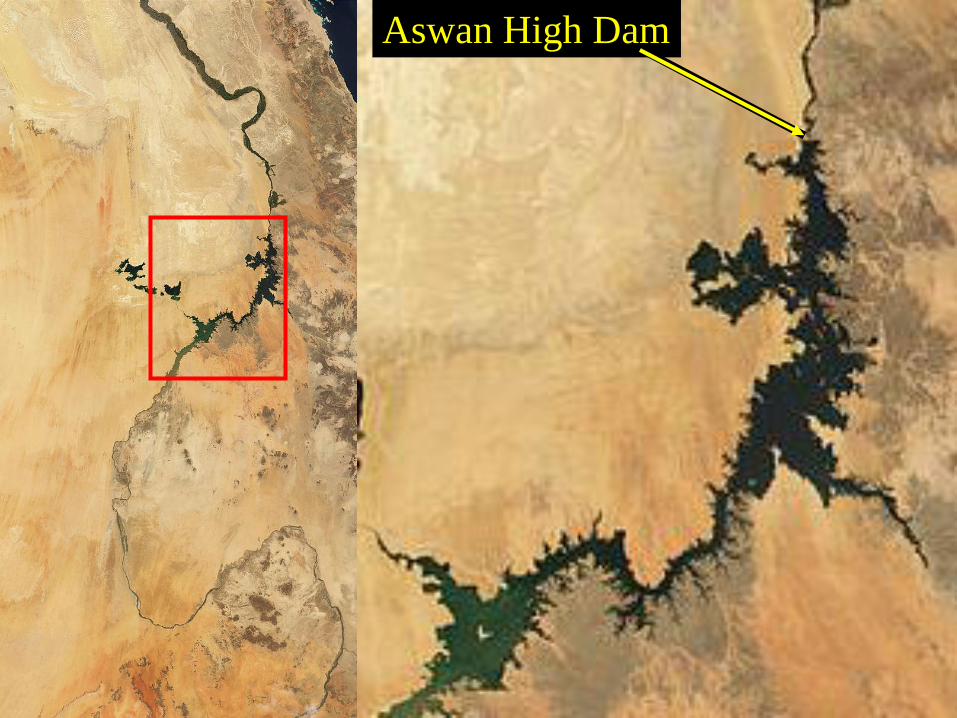
Aswan High Dam
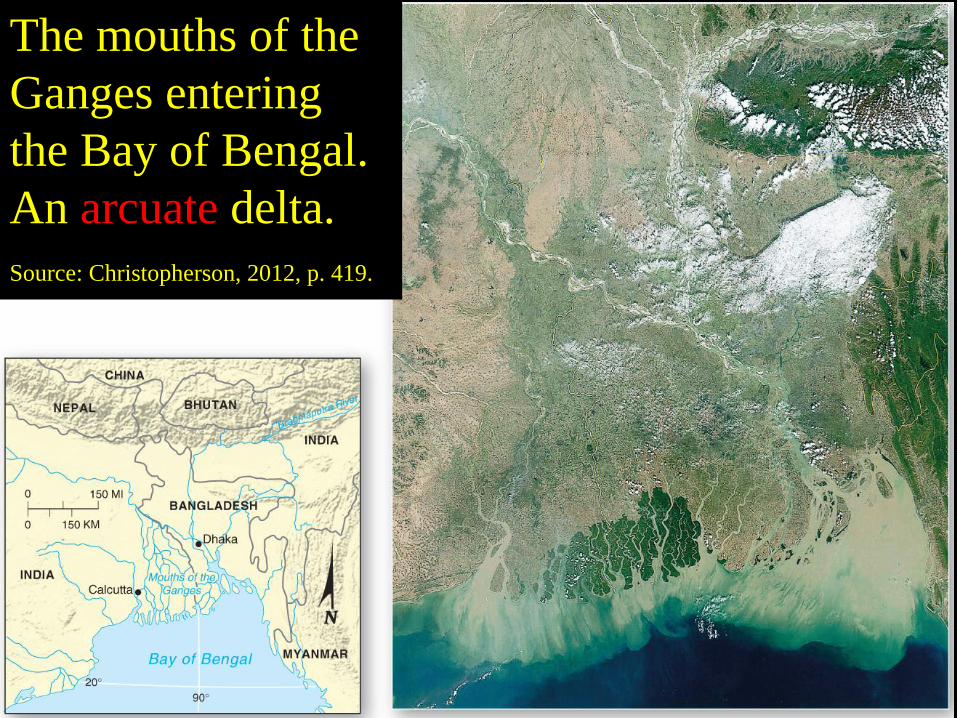
The mouths of the
Ganges entering
the Bay of Bengal.
An arcuate delta.
Source: Christopherson, 2012, p. 419.
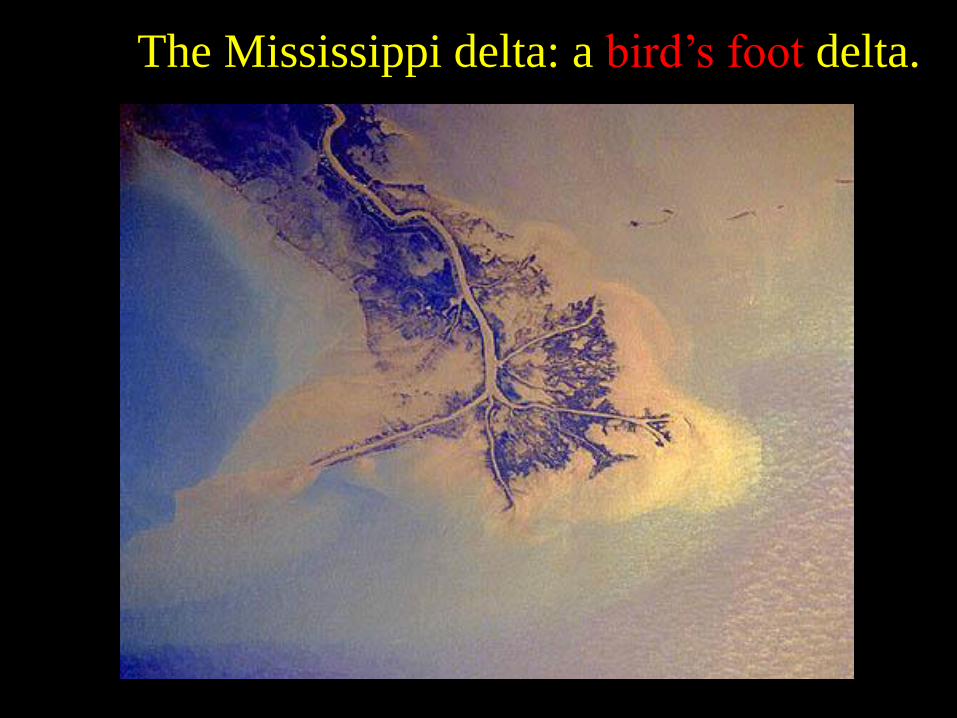
The Mississippi delta: a bird’s foot delta.

Satellite image of the Mississippi delta.
Source: Christopherson, 2012, p. 421.
Lake Pontchartrain
New Orleans
Mississippi
River
Atchafalaya
River
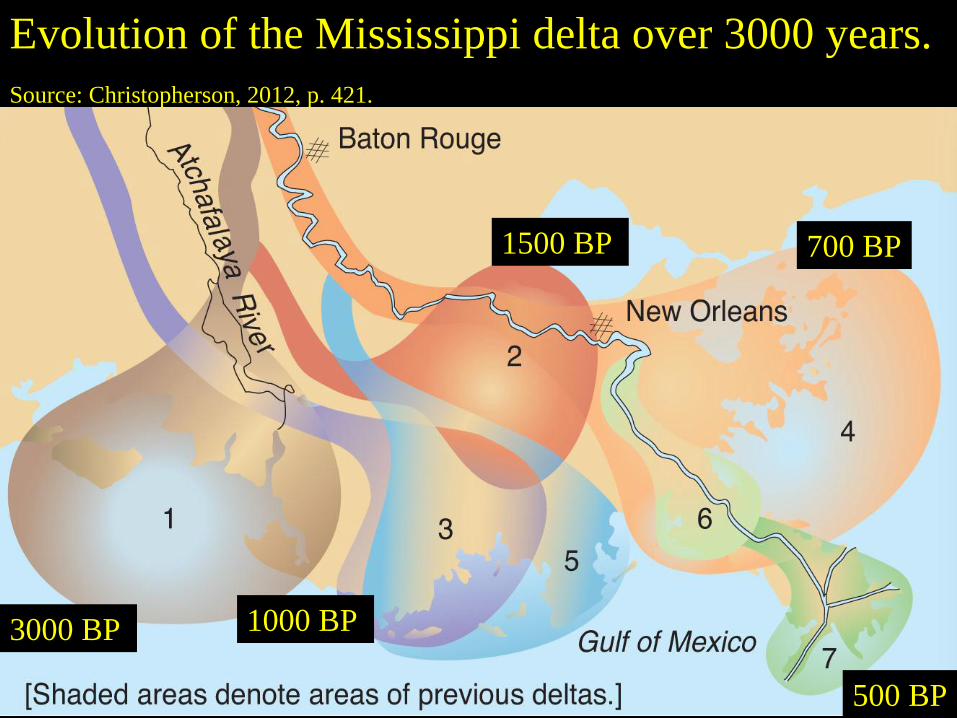
3000 BP
1500 BP
1000 BP
700 BP
500 BP
Evolution of the Mississippi delta over 3000 years.
Source: Christopherson, 2012, p. 421.
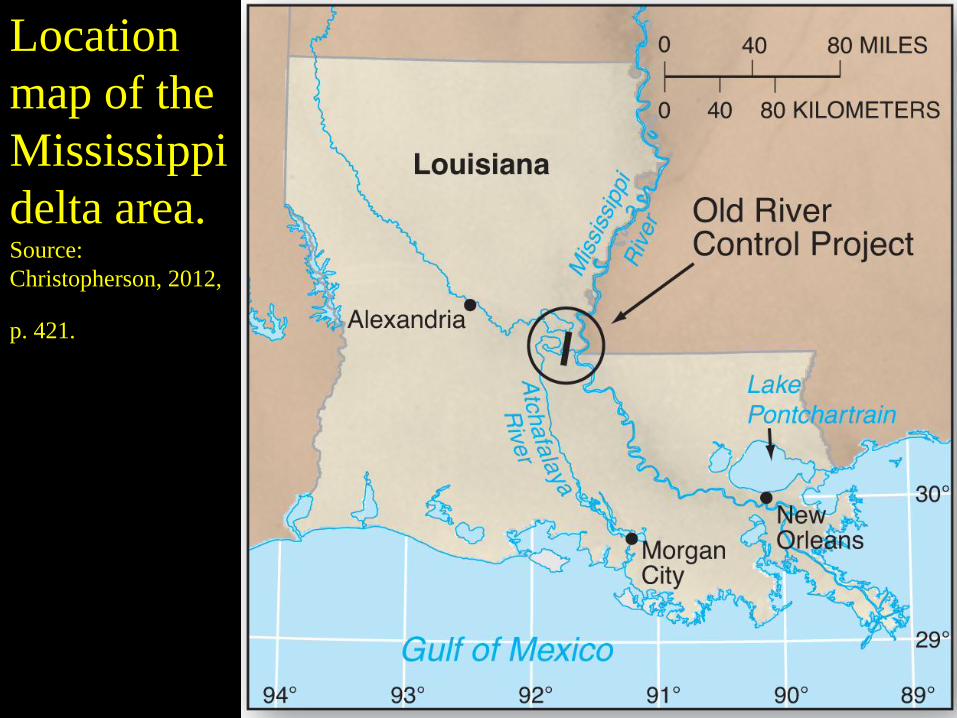
Location
map of the
Mississippi
delta area.
Source:
Christopherson, 2012,
p. 421.
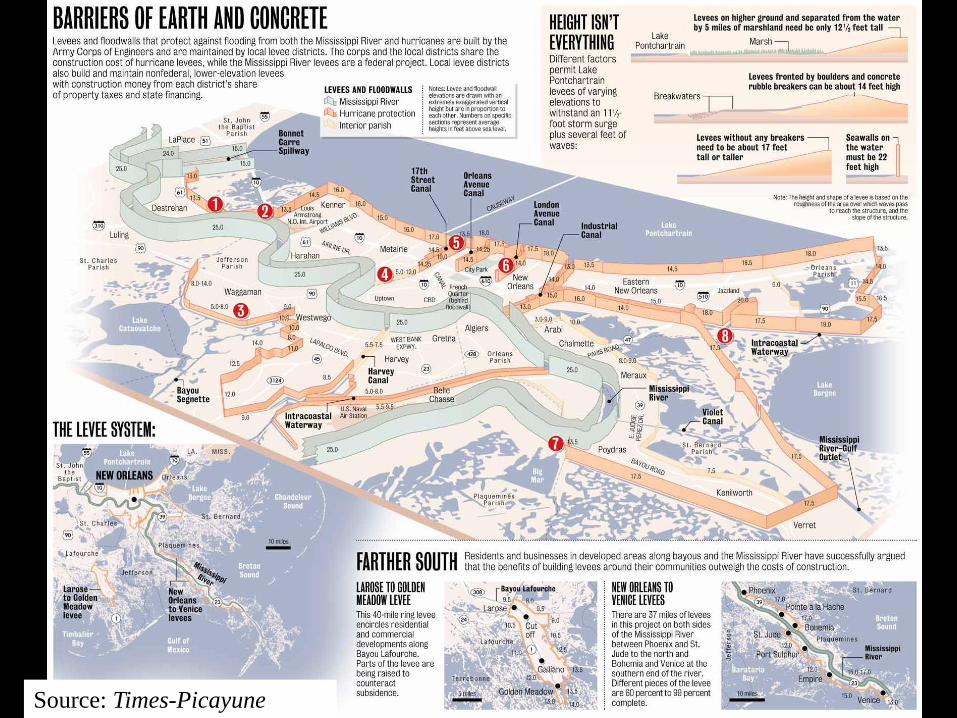
Source: Times-Picayune

Source: Times-Picayune