Embed Size (px)
Citation preview
AQR Capital Management, LLC Two Greenwich Plaza Greenwich, CT 06830 p: +1.203.742.3600 | w: aqr.com
The information set forth herein has been obtained or derived from sources believed by AQR Capital Management, LLC (“AQR”) to be reliable. However, AQR does not make any representation or warranty, express or implied, as to the information’s accuracy or completeness, nor does AQR recommend that the attached information serve as the basis of any investment decision. This document has been provided to you solely for information purposes and does not constitute an offer or solicitation of an offer, or any advice or recommendation, to purchase any securities or other financial instruments, and may not be construed as such. This document is intended exclusively for the use of the person to whom it has been delivered by AQR Capital Management, LLC, and it is not to be reproduced or redistributed to any other person. This document is subject to further review and revision. Please refer to the Fund’s PPM for more information on general terms, risks and fees. For one-on-one presentation use only.
Risk Parity An Application of Finance 101 (plus low beta investing)
Private and confidential For Educational and Investment Professional Use Only October 2013
Managing and Founding Principal Cliff Asness
Introduction
1
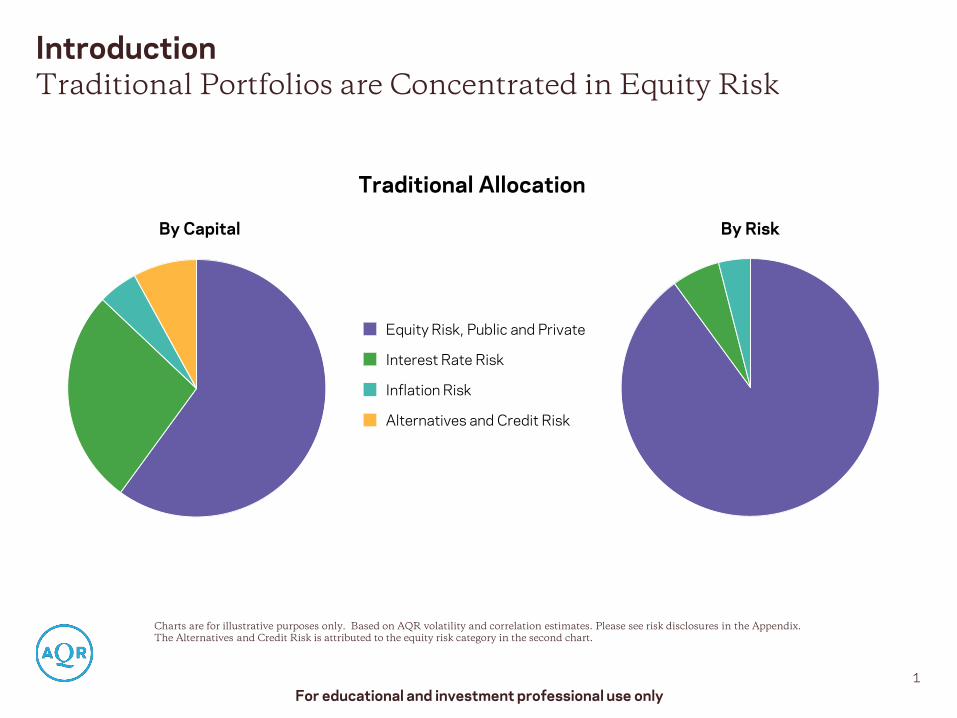
Traditional Portfolios are Concentrated in Equity Risk
Charts are for illustrative purposes only. Based on AQR volatility and correlation estimates. Please see risk disclosures in the Appendix. The Alternatives and Credit Risk is attributed to the equity risk category in the second chart.
For educational and investment professional use only
By Capital By Risk
Traditional Allocation
Interest Rate Risk
Inflation Risk
Alternatives and Credit Risk
Equity Risk, Public and Private
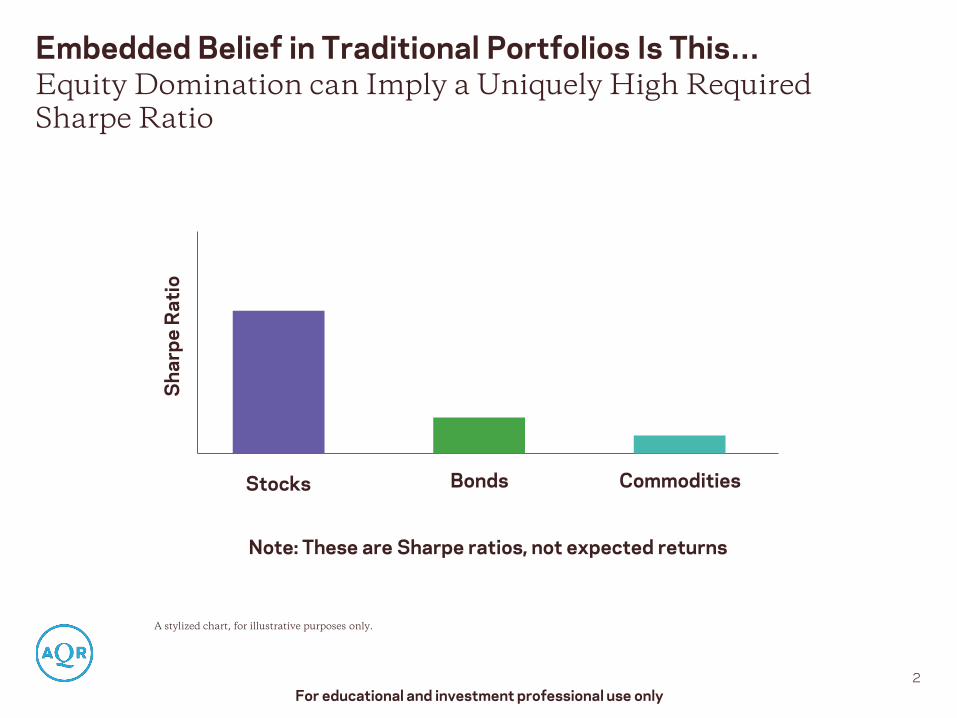
Embedded Belief in Traditional Portfolios Is This…
2
Equity Domination can Imply a Uniquely High Required Sharpe Ratio
A stylized chart, for illustrative purposes only.
FOR INVESTMENT PROFESSIONAL USE ONLY
Sha
rpe
Rat
io
Stocks Bonds Commodities
For educational and investment professional use only
Note: These are Sharpe ratios, not expected returns
0.0
0.1
0.2
0.3
0.4
0.5
Global Stocks
Global Bonds
Commodities
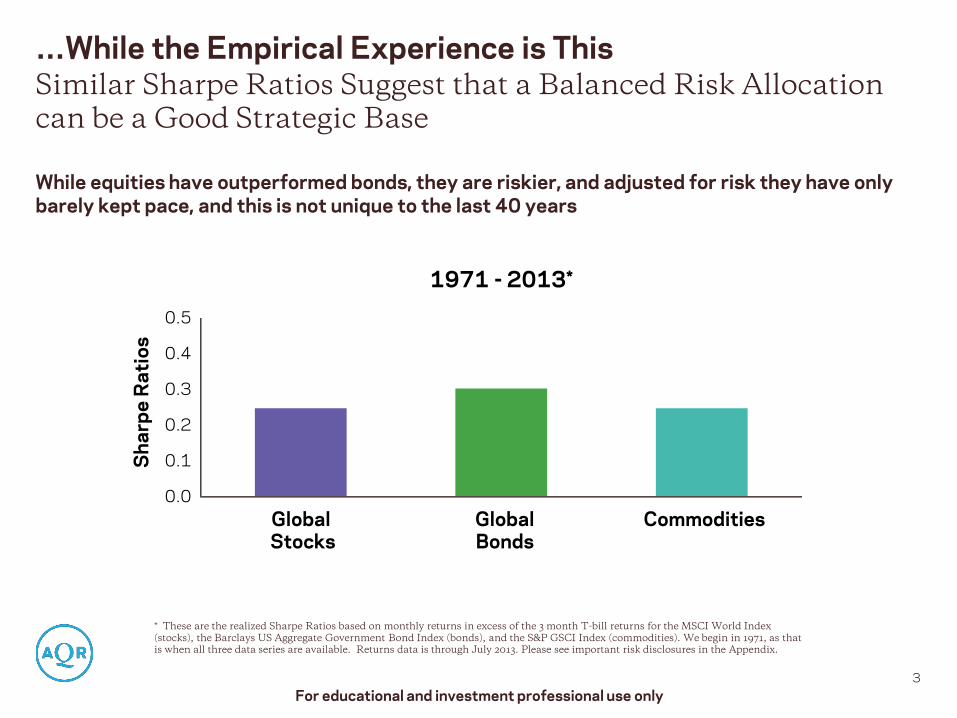
…While the Empirical Experience Is This
Sha
rpe
Rat
ios
1971 - 2013*
…While the Empirical Experience is This Similar Sharpe Ratios Suggest that a Balanced Risk Allocation can be a Good Strategic Base
* These are the realized Sharpe Ratios based on monthly returns in excess of the 3 month T-bill returns for the MSCI World Index (stocks), the Barclays US Aggregate Government Bond Index (bonds), and the S&P GSCI Index (commodities). We begin in 1971, as that is when all three data series are available. Returns data is through July 2013. Please see important risk disclosures in the Appendix.
3
While equities have outperformed bonds, they are riskier, and adjusted for risk they have only barely kept pace, and this is not unique to the last 40 years
For educational and investment professional use only
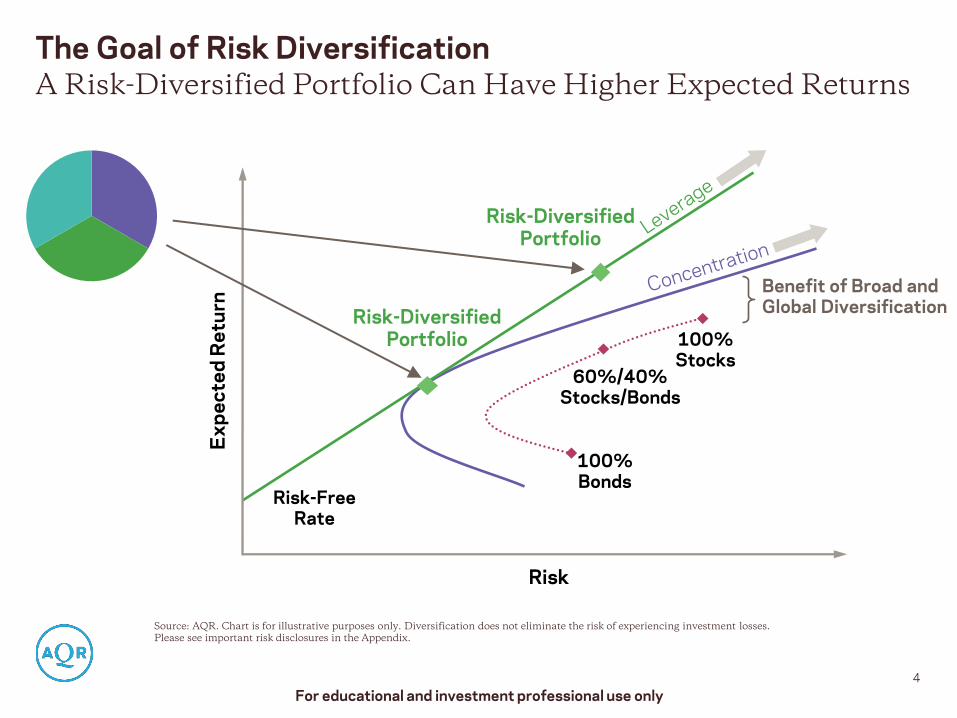
The Goal of Risk Diversification
4
A Risk-Diversified Portfolio Can Have Higher Expected Returns
Source: AQR. Chart is for illustrative purposes only. Diversification does not eliminate the risk of experiencing investment losses. Please see important risk disclosures in the Appendix.
Risk
Exp
ecte
d R
etur
n
Risk-Free Rate
Risk-Diversified Portfolio
60%/40% Stocks/Bonds
100% Bonds
100% Stocks
Benefit of Broad and Global Diversification Risk-Diversified
Portfolio
For educational and investment professional use only
Why Risk Parity Theories and Evidence
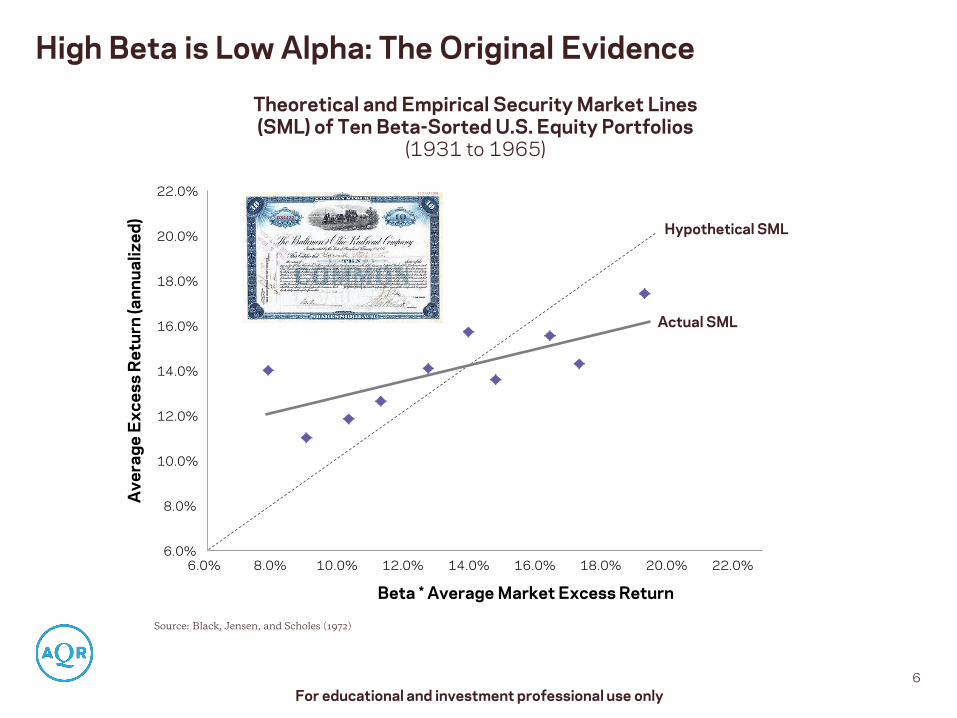
High Beta is Low Alpha: The Original Evidence
Source: Black, Jensen, and Scholes (1972)
Theoretical and Empirical Security Market Lines (SML) of Ten Beta-Sorted U.S. Equity Portfolios
(1931 to 1965)
6
6.0%
8.0%
10.0%
12.0%
14.0%
16.0%
18.0%
20.0%
22.0%
6.0% 8.0% 10.0% 12.0% 14.0% 16.0% 18.0% 20.0% 22.0%
Beta * Average Market Excess Return
Actual SML
Hypothetical SML
Ave
rage
Exc
ess
Ret
urn
(ann
ualiz
ed)
For educational and investment professional use only
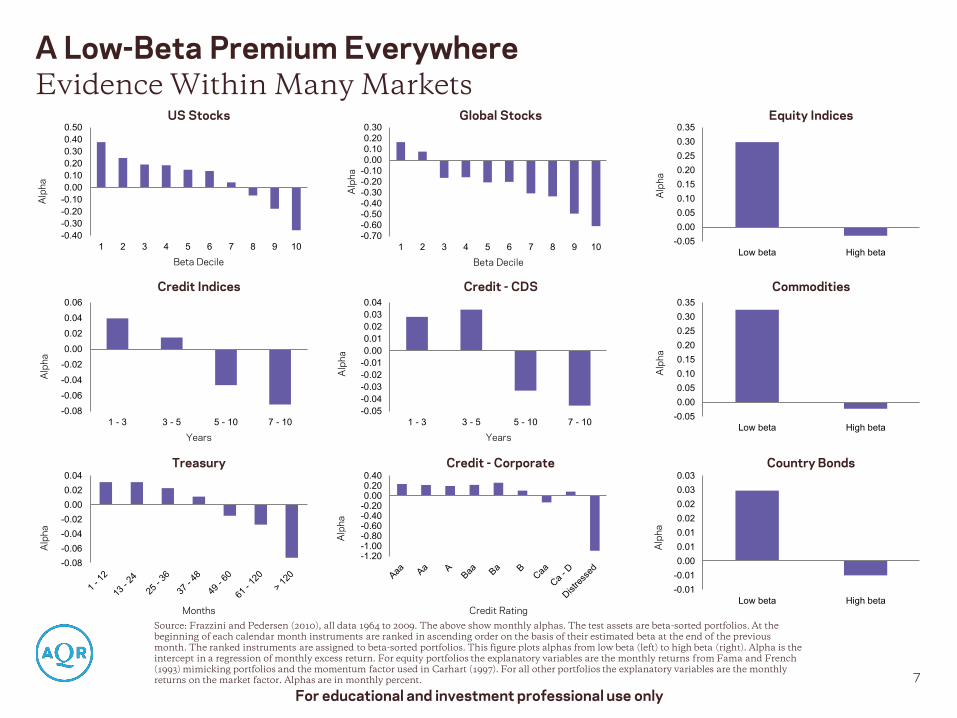
A Low-Beta Premium Everywhere Evidence Within Many Markets
Source: Frazzini and Pedersen (2010), all data 1964 to 2009. The above show monthly alphas. The test assets are beta-sorted portfolios. At the beginning of each calendar month instruments are ranked in ascending order on the basis of their estimated beta at the end of the previous month. The ranked instruments are assigned to beta-sorted portfolios. This figure plots alphas from low beta (left) to high beta (right). Alpha is the intercept in a regression of monthly excess return. For equity portfolios the explanatory variables are the monthly returns from Fama and French (1993) mimicking portfolios and the momentum factor used in Carhart (1997). For all other portfolios the explanatory variables are the monthly returns on the market factor. Alphas are in monthly percent.
7
US Stocks Global Stocks Equity Indices
Credit Indices Credit - CDS Commodities
Treasury Credit - Corporate Country Bonds
-0.40-0.30-0.20-0.100.000.100.200.300.400.50
1 2 3 4 5 6 7 8 9 10
Alp
ha
Beta Decile
-0.70-0.60-0.50-0.40-0.30-0.20-0.100.000.100.200.30
1 2 3 4 5 6 7 8 9 10
Alp
ha
Beta Decile
-0.08-0.06-0.04-0.020.000.020.04
Alp
ha
Months
-0.08
-0.06
-0.04
-0.02
0.00
0.02
0.04
0.06
1 - 3 3 - 5 5 - 10 7 - 10
Alp
ha
Years
-0.05-0.04-0.03-0.02-0.010.000.010.020.030.04
1 - 3 3 - 5 5 - 10 7 - 10
Alp
ha
Years
-1.20-1.00-0.80-0.60-0.40-0.200.000.200.40
Alp
ha
Credit Rating
-0.050.000.050.100.150.200.250.300.35
Low beta High beta
Alp
ha
-0.050.000.050.100.150.200.250.300.35
Low beta High beta
Alp
ha
-0.01-0.010.000.010.010.020.020.030.03
Low beta High beta
Alp
ha
For educational and investment professional use only
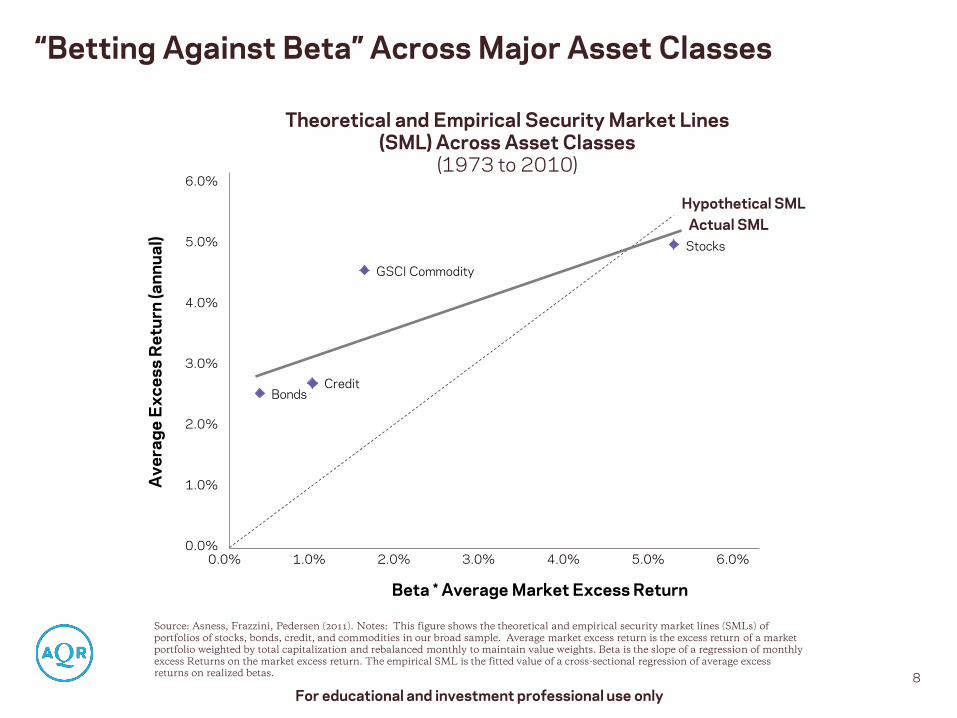
Theoretical and Empirical Security Market Lines (SML) Across Asset Classes
(1973 to 2010)
“Betting Against Beta” Across Major Asset Classes
Source: Asness, Frazzini, Pedersen (2011). Notes: This figure shows the theoretical and empirical security market lines (SMLs) of portfolios of stocks, bonds, credit, and commodities in our broad sample. Average market excess return is the excess return of a market portfolio weighted by total capitalization and rebalanced monthly to maintain value weights. Beta is the slope of a regression of monthly excess Returns on the market excess return. The empirical SML is the fitted value of a cross-sectional regression of average excess returns on realized betas. 8
Stocks
Bonds Credit
GSCI Commodity
0.0%
1.0%
2.0%
3.0%
4.0%
5.0%
6.0%
0.0% 1.0% 2.0% 3.0% 4.0% 5.0% 6.0%
Beta * Average Market Excess Return
Actual SML Hypothetical SML
Ave
rage
Exc
ess
Ret
urn
(ann
ual)
For educational and investment professional use only
Risk Parity Is Low Beta Applied to Asset Classes
• If leverage aversion, or other theories like lottery preferences or investor focus on relative returns, predicts that higher-risk portfolios have lower risk-adjusted returns, then a portfolio that overweights low-risk assets and underweights high-risk assets should act to capture some of this premium
Sounds like risk parity!
• We see risk parity as just low beta investing combined, again, with Finance 101, though we agree that it is sometimes oversold as a magic answer to a precise optimization
What Leverage Aversion can Mean for Portfolios
9 For educational and investment professional use only
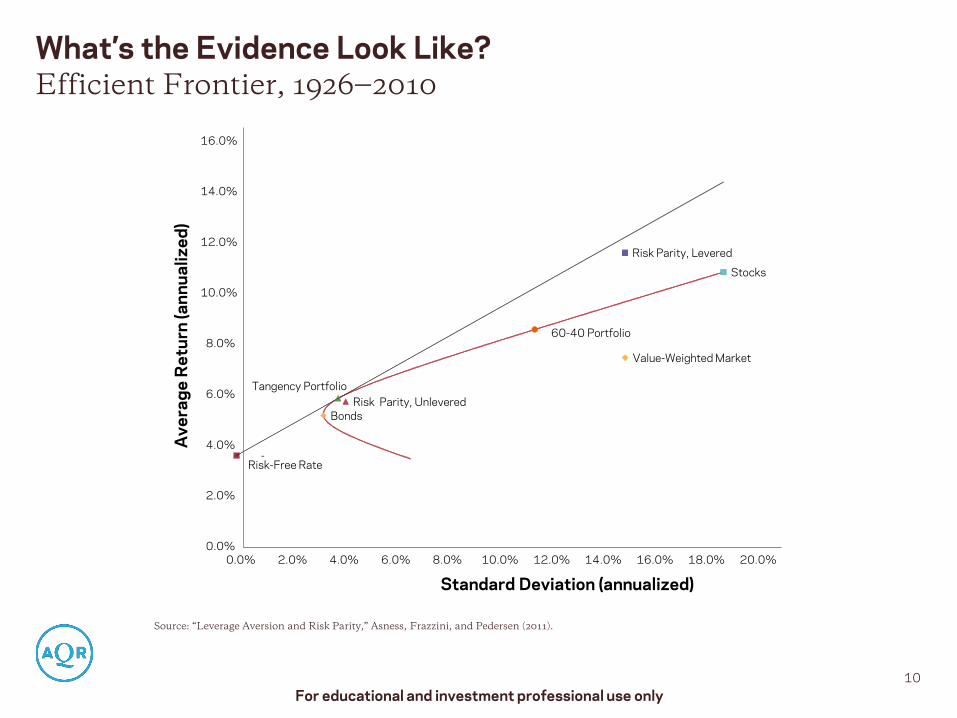
What’s the Evidence Look Like? Efficient Frontier, 1926‒2010
Source: “Leverage Aversion and Risk Parity,” Asness, Frazzini, and Pedersen (2011).
10
Risk-Free Rate -
Tangency Portfolio
Value-Weighted Market
60-40 Portfolio
Risk Parity, Levered
Risk Parity, Unlevered
Stocks
Bonds
0.0%
2.0%
4.0%
6.0%
8.0%
10.0%
12.0%
14.0%
16.0%
0.0% 2.0% 4.0% 6.0% 8.0% 10.0% 12.0% 14.0% 16.0% 18.0% 20.0%
Standard Deviation (annualized)
Ave
rage
Ret
urn
(ann
ualiz
ed)
For educational and investment professional use only
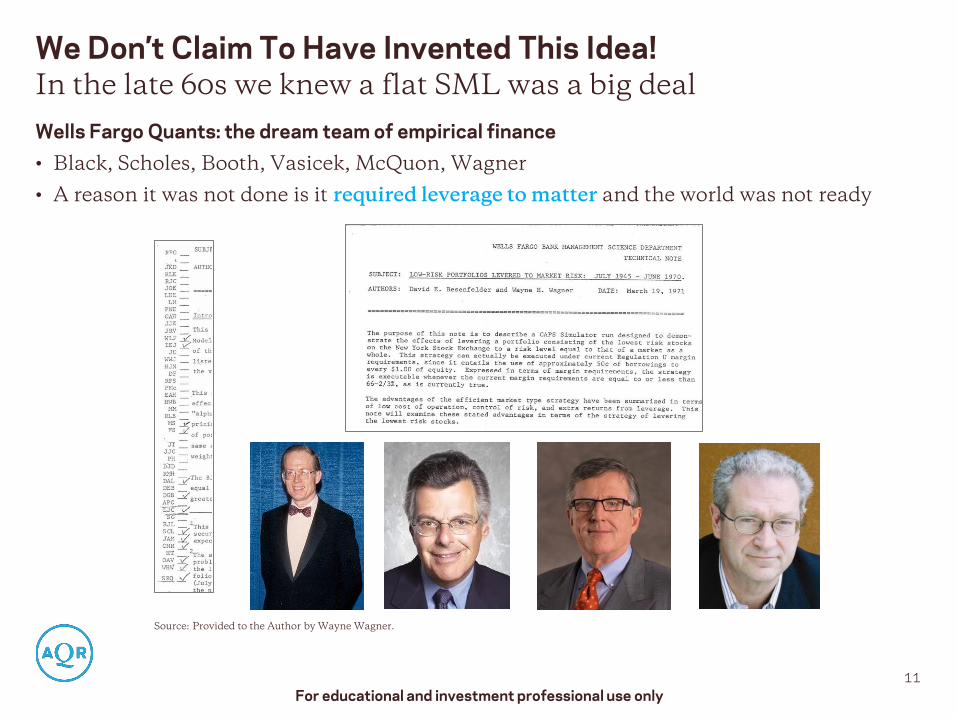
We Don’t Claim To Have Invented This Idea!
Wells Fargo Quants: the dream team of empirical finance • Black, Scholes, Booth, Vasicek, McQuon, Wagner • A reason it was not done is it required leverage to matter and the world was not ready
11
In the late 60s we knew a flat SML was a big deal
Source: Provided to the Author by Wayne Wagner.
For educational and investment professional use only

Question 1 What Happened This Year?
What Happened This Year?
We need to make judgments, but we do so too frequently
The second quarter of 2013 was a sharp drawdown • But the magnitude was not outside of a reasonable guess of what can (and will) happen on
occasion • Year-to-date returns are unexceptional compared to expectations and history • Yet, recent results feel pretty particularly bad because investors didn’t lose money the way
they usually lose money – in stocks; losing unconventionally always hurts more
We believe, and both theory and data support, that risk parity’s edge over traditional portfolios is modest but real • A “little bit better” can add up to quite a bit better over time • But unfortunately, also implies sometimes it is quite a bit worse • If you can forecast those times, and get the timing down with great precision (otherwise it
doesn’t help) more power to you!
A Bad Period ≠ A Broken Period
13 For educational and investment professional use only
Question 2 What About Rates?
What About Rates?
15
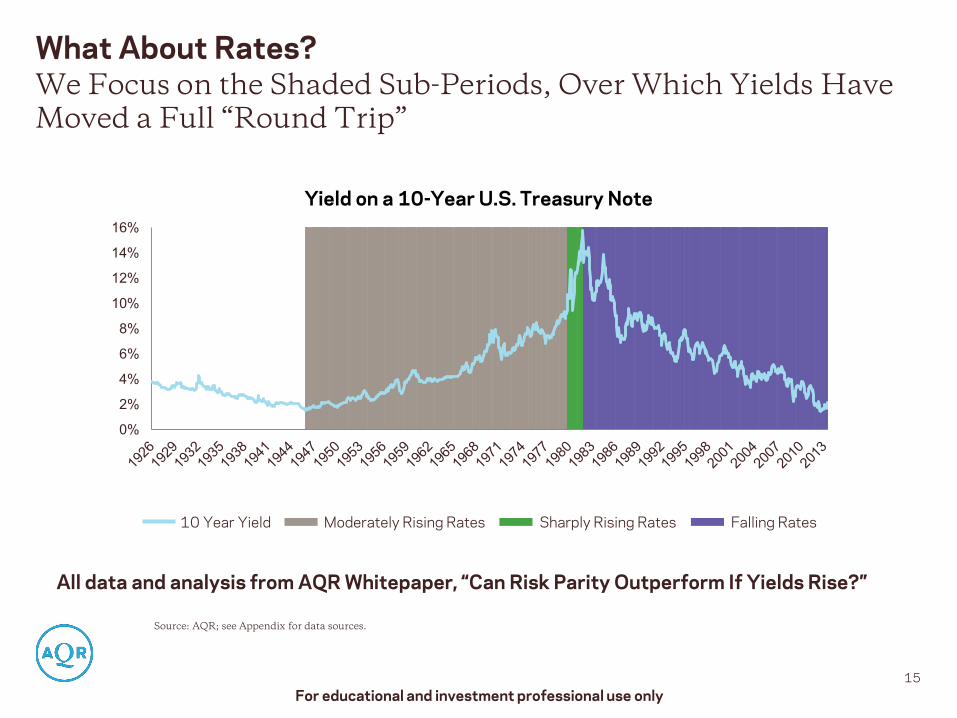
We Focus on the Shaded Sub-Periods, Over Which Yields Have Moved a Full “Round Trip”
Source: AQR; see Appendix for data sources.
0%
2%
4%
6%
8%
10%
12%
14%
16%
Yield on a 10-Year U.S. Treasury Note
10 Year Yield Moderately Rising Rates Sharply Rising Rates Falling Rates
For educational and investment professional use only
All data and analysis from AQR Whitepaper, “Can Risk Parity Outperform If Yields Rise?”
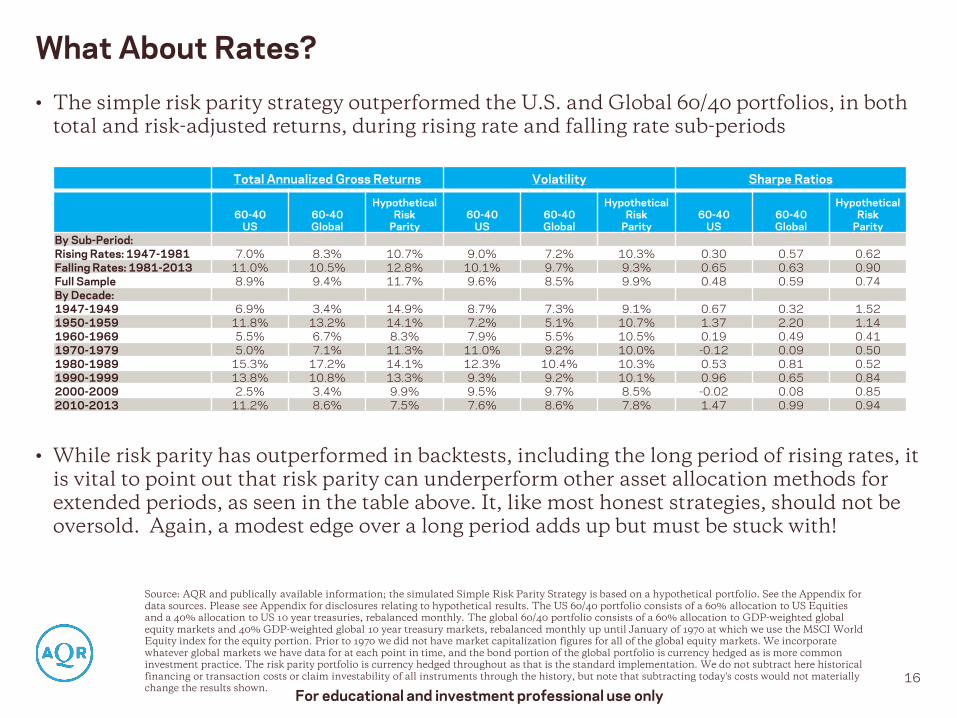
What About Rates? • The simple risk parity strategy outperformed the U.S. and Global 60/40 portfolios, in both
total and risk-adjusted returns, during rising rate and falling rate sub-periods
• While risk parity has outperformed in backtests, including the long period of rising rates, it is vital to point out that risk parity can underperform other asset allocation methods for extended periods, as seen in the table above. It, like most honest strategies, should not be oversold. Again, a modest edge over a long period adds up but must be stuck with!
16
Source: AQR and publically available information; the simulated Simple Risk Parity Strategy is based on a hypothetical portfolio. See the Appendix for data sources. Please see Appendix for disclosures relating to hypothetical results. The US 60/40 portfolio consists of a 60% allocation to US Equities and a 40% allocation to US 10 year treasuries, rebalanced monthly. The global 60/40 portfolio consists of a 60% allocation to GDP-weighted global equity markets and 40% GDP-weighted global 10 year treasury markets, rebalanced monthly up until January of 1970 at which we use the MSCI World Equity index for the equity portion. Prior to 1970 we did not have market capitalization figures for all of the global equity markets. We incorporate whatever global markets we have data for at each point in time, and the bond portion of the global portfolio is currency hedged as is more common investment practice. The risk parity portfolio is currency hedged throughout as that is the standard implementation. We do not subtract here historical financing or transaction costs or claim investability of all instruments through the history, but note that subtracting today's costs would not materially change the results shown.
Total Annualized Gross Returns Volatility Sharpe Ratios
60-40 US
60-40 Global
Hypothetical Risk
Parity 60-40
US 60-40 Global
Hypothetical Risk
Parity 60-40
US 60-40 Global
Hypothetical Risk
Parity By Sub-Period: Rising Rates: 1947-1981 7.0% 8.3% 10.7% 9.0% 7.2% 10.3% 0.30 0.57 0.62 Falling Rates: 1981-2013 11.0% 10.5% 12.8% 10.1% 9.7% 9.3% 0.65 0.63 0.90 Full Sample 8.9% 9.4% 11.7% 9.6% 8.5% 9.9% 0.48 0.59 0.74 By Decade: 1947-1949 6.9% 3.4% 14.9% 8.7% 7.3% 9.1% 0.67 0.32 1.52 1950-1959 11.8% 13.2% 14.1% 7.2% 5.1% 10.7% 1.37 2.20 1.14 1960-1969 5.5% 6.7% 8.3% 7.9% 5.5% 10.5% 0.19 0.49 0.41 1970-1979 5.0% 7.1% 11.3% 11.0% 9.2% 10.0% -0.12 0.09 0.50 1980-1989 15.3% 17.2% 14.1% 12.3% 10.4% 10.3% 0.53 0.81 0.52 1990-1999 13.8% 10.8% 13.3% 9.3% 9.2% 10.1% 0.96 0.65 0.84 2000-2009 2.5% 3.4% 9.9% 9.5% 9.7% 8.5% -0.02 0.08 0.85 2010-2013 11.2% 8.6% 7.5% 7.6% 8.6% 7.8% 1.47 0.99 0.94
For educational and investment professional use only
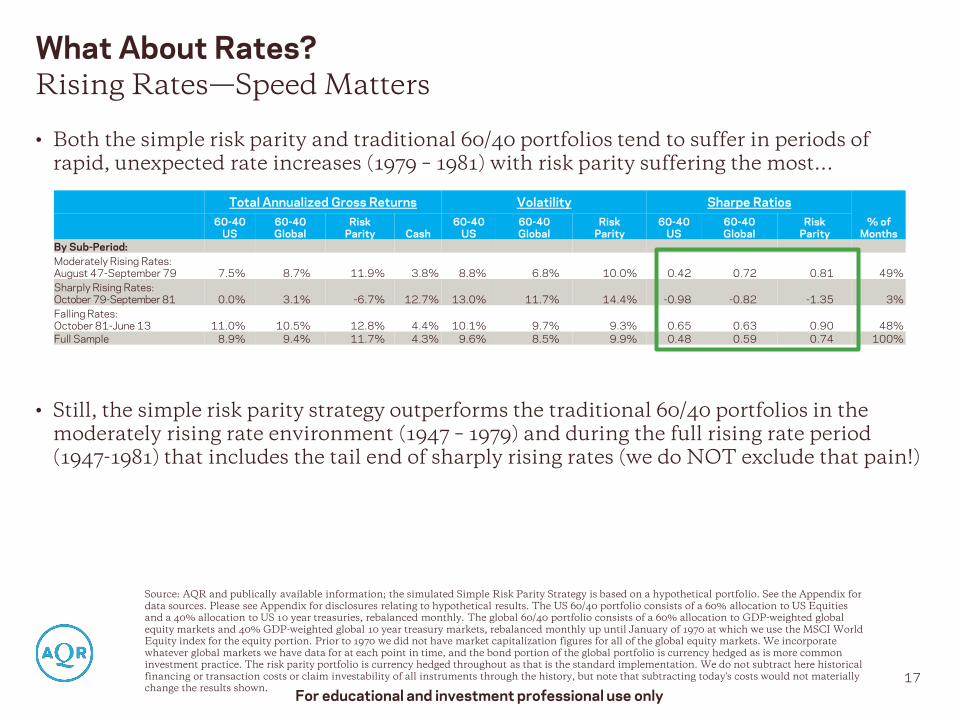
• Both the simple risk parity and traditional 60/40 portfolios tend to suffer in periods of rapid, unexpected rate increases (1979 – 1981) with risk parity suffering the most…
• Still, the simple risk parity strategy outperforms the traditional 60/40 portfolios in the moderately rising rate environment (1947 – 1979) and during the full rising rate period (1947-1981) that includes the tail end of sharply rising rates (we do NOT exclude that pain!)
Total Annualized Gross Returns Volatility Sharpe Ratios % of
Months 60-40
US 60-40 Global
Risk Parity Cash
60-40 US
60-40 Global
Risk Parity
60-40 US
60-40 Global
Risk Parity
By Sub-Period: Moderately Rising Rates: August 47-September 79 7.5% 8.7% 11.9% 3.8% 8.8% 6.8% 10.0% 0.42 0.72 0.81 49% Sharply Rising Rates: October 79-September 81 0.0% 3.1% -6.7% 12.7% 13.0% 11.7% 14.4% -0.98 -0.82 -1.35 3% Falling Rates: October 81-June 13 11.0% 10.5% 12.8% 4.4% 10.1% 9.7% 9.3% 0.65 0.63 0.90 48% Full Sample 8.9% 9.4% 11.7% 4.3% 9.6% 8.5% 9.9% 0.48 0.59 0.74 100%
What About Rates?
17
Rising Rates—Speed Matters
Source: AQR and publically available information; the simulated Simple Risk Parity Strategy is based on a hypothetical portfolio. See the Appendix for data sources. Please see Appendix for disclosures relating to hypothetical results. The US 60/40 portfolio consists of a 60% allocation to US Equities and a 40% allocation to US 10 year treasuries, rebalanced monthly. The global 60/40 portfolio consists of a 60% allocation to GDP-weighted global equity markets and 40% GDP-weighted global 10 year treasury markets, rebalanced monthly up until January of 1970 at which we use the MSCI World Equity index for the equity portion. Prior to 1970 we did not have market capitalization figures for all of the global equity markets. We incorporate whatever global markets we have data for at each point in time, and the bond portion of the global portfolio is currency hedged as is more common investment practice. The risk parity portfolio is currency hedged throughout as that is the standard implementation. We do not subtract here historical financing or transaction costs or claim investability of all instruments through the history, but note that subtracting today's costs would not materially change the results shown. For educational and investment professional use only

Closing Thoughts
Closing Thoughts • Risk Parity is not radical, leveraging the best risk-adjusted portfolio is basic financial theory that very
few people seem to actually implement
− Risk parity has excelled when equities, and most people's overall portfolio as dominated by equities, suffer. Now, 5 years after the crisis, perhaps we're getting complacent about that again
• It is one answer to a world with leverage constraints, our favorite theory, or other behavioral biases that lead to similar results, and is supported empirically (data from 1926 and across many other places than U.S. stocks or asset classes)
− It is not, and should not, be taken as an exact answer, we think some of the confusion lies here, the choice of the word parity implies too much precision or a magic formula!
− It is a tilt towards a solid (theory and data) factor, and whether that factor works for rational or irrational reasons, such a tilt can improve the Sharpe of a portfolio
− How much to tilt? We find the answer comes out to about “parity” and thus it’s a convenient marketing term for us Again, some people read too much into this word
− How much risk parity should you actually do? Well, that depends on real world concerns like what if you get bad luck at the start of a good process, if so your career (and ours) can suffer! (note we don’t forecast bad luck but you should choose an allocation to withstand it). Please note this isn't different from any other form of alpha that differs from the crowd. Our advice is do it, but at a survivable amount
• After choosing to do some risk parity lots of implementation choices remain – financial instruments used, volatility and correlation calculations, breadth of investments globally and across asset classes
19 For educational and investment professional use only
Disclosures The information set forth herein has been obtained or derived from sources believed by AQR Capital Management, LLC (“AQR”) to be reliable. However, AQR does not make any representation or warranty, express or implied, as to the information’s accuracy or completeness, nor does AQR recommend that the attached information serve as the basis of any investment decision. This document has been provided to you solely for information purposes and does not constitute an offer or solicitation of an offer, or any advice or recommendation, to purchase any securities or other financial instruments, and may not be construed as such. This document is intended exclusively for the use of the person to whom it has been delivered by AQR, and it is not to be reproduced or redistributed to any other person. This document is subject to further review and revision. For one-on-one presentation use only. The information contained herein does not constitute legal, tax or accounting advice or investment advice and is solely based on the opinion of AQR. The recipient should conduct his or her own analysis and consult with professional advisors prior to making any investment decisions. Any investment made will be in the sole discretion of the reader. AQR hereby disclaims any duty to provide any updates or changes to the analyses contained in this presentation. Past performance is not an indication of future performance. Hypothetical performance results (e.g., quantitative backtests) have many inherent limitations, some of which, but not all, are described herein. No representation is being made that any fund or account will or is likely to achieve profits or losses similar to those shown herein. In fact, there are frequently sharp differences between hypothetical performance results and the actual results subsequently realized by any particular trading program. One of the limitations of hypothetical performance results is that they are generally prepared with the benefit of hindsight. In addition, hypothetical trading does not involve financial risk, and no hypothetical trading record can completely account for the impact of financial risk in actual trading. For example, the ability to withstand losses or adhere to a particular trading program in spite of trading losses are material points which can adversely affect actual trading results. The hypothetical performance results contained herein represent the application of the quantitative models as currently in effect on the date first written above and there can be no assurance that the models will remain the same in the future or that an application of the current models in the future will produce similar results because the relevant market and economic conditions that prevailed during the hypothetical performance period will not necessarily recur. There are numerous other factors related to the markets in general or to the implementation of any specific trading program which cannot be fully accounted for in the preparation of hypothetical performance results, all of which can adversely affect actual trading results. Discounting factors may be applied to reduce suspected anomalies. This backtest’s return, for this period, will vary depending on the date it is run. Hypothetical performance results are presented for illustrative purposes only. Gross performance results do not reflect the deduction of investment advisory fees, which would reduce an investor’s actual return. For example, assume that $1 million is invested in an account with the Firm, and this account achieves a 10% compounded annualized return, gross of fees, for five years. At the end of five years that account would grow to $1,610,510 before the deduction of management fees. Assuming management fees of 1.00% per year are deducted monthly from the account, the value of the account at the end of five years would be $1,532,886 and the annualized rate of return would be 8.92%. For a ten-year period, the ending dollar values before and after fees would be $2,593,742 and $2,349,739, respectively. AQR’s asset based fees may range up to 2.85% of assets under management, and are generally billed monthly or quarterly at the commencement of the calendar month or quarter during which AQR will perform the services to which the fees relate. Where applicable, performance fees are generally equal to 20% of net realized and unrealized profits each year, after restoration of any losses carried forward from prior years. In addition, AQR funds incur expenses (including start-up, legal, accounting, audit, administrative and regulatory expenses) and may have redemption or withdrawal charges up to 2% based on gross redemption or withdrawal proceeds. Please refer to the Fund’s Private Offering Memoranda and AQR’s ADV Part 2A for more information on fees. Consultants supplied with gross results are to use this data in accordance with SEC, CFTC, NFA or the applicable jurisdiction’s guidelines. There is a risk of substantial loss associated with trading commodities, futures, options, derivatives and other financial instruments. Before trading, investors should carefully consider their financial position and risk tolerance to determine if the proposed trading style is appropriate. Investors should realize that when trading futures, commodities, options, derivatives and other financial instruments one could lose the full balance of their account. It is also possible to lose more than the initial deposit when trading derivatives or using leverage. All funds committed to such a trading strategy should be purely risk capital.
20
For educational and investment professional use only
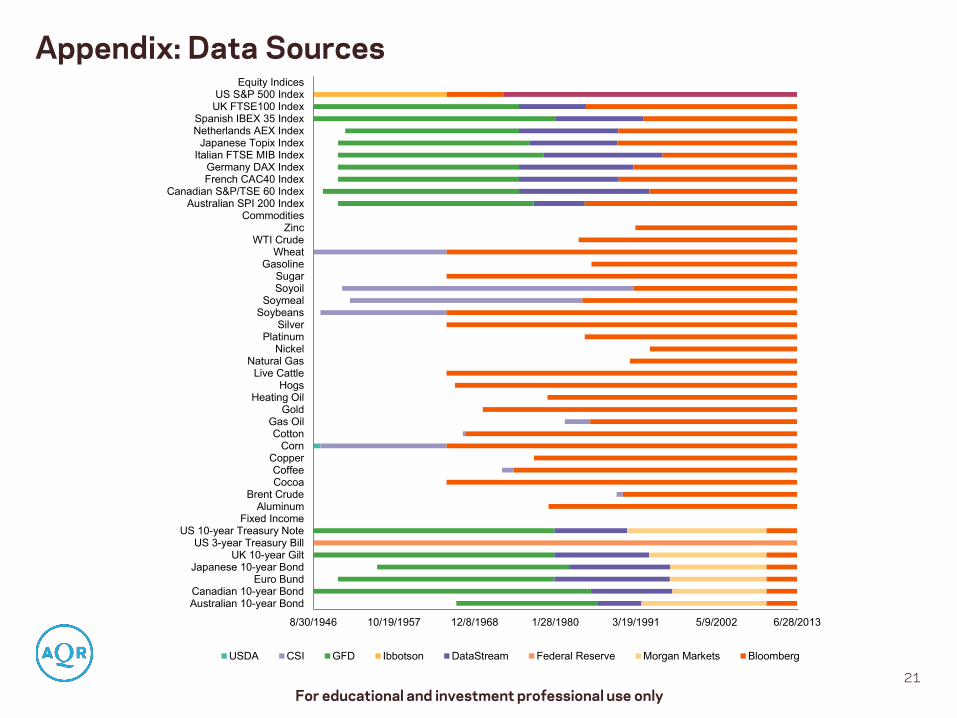
Appendix: Data Sources
21
8/30/1946 10/19/1957 12/8/1968 1/28/1980 3/19/1991 5/9/2002 6/28/2013
Australian 10-year BondCanadian 10-year Bond
Euro BundJapanese 10-year Bond
UK 10-year GiltUS 3-year Treasury Bill
US 10-year Treasury NoteFixed Income
AluminumBrent Crude
CocoaCoffee
CopperCorn
CottonGas Oil
GoldHeating Oil
HogsLive Cattle
Natural GasNickel
PlatinumSilver
SoybeansSoymeal
SoyoilSugar
GasolineWheat
WTI CrudeZinc
CommoditiesAustralian SPI 200 Index
Canadian S&P/TSE 60 IndexFrench CAC40 IndexGermany DAX Index
Italian FTSE MIB IndexJapanese Topix Index
Netherlands AEX IndexSpanish IBEX 35 Index
UK FTSE100 IndexUS S&P 500 Index
Equity Indices
USDA CSI GFD Ibbotson DataStream Federal Reserve Morgan Markets Bloomberg
For educational and investment professional use only