Embed Size (px)
Citation preview
Risk-based testing:Risk analysis fundamentals and metrics for software testing including
a ®nancial application case study
St�ale Amland *
TietoEnator Consulting AS, Koppholen 4, N-4313 Sandnes, Norway
Received 1 December 1999; accepted 1 December 1999
Abstract
The idea of risk-based testing is to focus testing and spend more time on critical functions. By combining the focused process with
metrics it is possible to manage the test process by intelligent assessment and to communicate the expected consequences of decisions
taken. This paper discusses an approach to risk-based testing and how risk-based testing was carried out in a large project in a
®nancial institution. The paper concludes with how practical risk-based testing experience should inform theory and provide advice
on organizational requirements that are necessary to achieve success. Ó 2000 Elsevier Science Inc. All rights reserved.
Keywords: Risk; Risk analysis; Risk-based testing; Risk management
1. Why risk-based testing?
IT projects are very rarely on time, schedule orbudget. Very often early project phases are delayed.Consequently, when it eventually comes down to testing,the time to delivery is extremely short and there is nobudget left due to the development overrun! Also, dur-ing development everybody is as a rule extremely busyresulting in test preparation activities not receiving theappropriate attention.
``Risk-based testing'' helps to address these problems.A methodology was needed to assist in prioritizing whatto test and in determining how thorough the testingshould be, in order to deliver perceived good qualitywithin the deadline. Also a technique was needed tocommunicate the prioritization and the level of testingto the testers and to convince the management that thetesting would be ``good enough''. The methodologyde®ned was inspired by évstedal and St�alhaneÕs ``A goaloriented approach to software testing'' (évstedal andSt�alhane, 1992). They presented a theory ± this projectput it into practice.
A technique was needed to optimize the e�ort of thetesting given a particular set of constraints (budget,
hours and deadline). It was also a requirement to be ableto measure and thereby communicate the ``conse-quences'' of this particular set of constraints in an ob-jective manner.
Traditional testers (working with hardware or soft-ware) have always used risk-based testing, but in an adhoc fashion based on their personal judgement. Whatthe project tried to achieve was an agreed upon priori-tization with an objective foundation.
2. The case
This paper is based on the system test stage of aproject developing a retail banking application. Theproject included an upgrade of a customer informationsystem being used by clients as a central customer, ac-count and product database, and a complete reengi-neering of a retail banking system. The project scopeincluded reengineering of the data model, technologychange from IMS/DL1 to CICS/DB2, rewrite from JSPCOBOL to COBOL-2 and a completely new physicaldesign.
During this rewrite a large investment was made inproductivity tools, design, quality assurance and testing.Test coverage tools were used during unit test requiring100% code coverage. It is reasonable to believe that the
The Journal of Systems and Software 53 (2000) 287±295www.elsevier.com/locate/jss
* Tel.: +47-51-96-30-19; fax: +47-51-96-30-01.
E-mail address: [email protected] (S. Amland).
0164-1212/00/$ - see front matter Ó 2000 Elsevier Science Inc. All rights reserved.
PII: S 0 1 6 4 - 1 2 1 2 ( 0 0 ) 0 0 0 1 9 - 4
project had substantial bene®ts from the extensive unittesting that took place before system testing, especiallysince the programmers in general were lacking businessknowledge. The programmers were mostly universitygraduates with no industry experience, but during theinduction programme and through senior personnelcoaching, they became a very pro®cient programmingteam.
The programmers did all unit testing. A team wasestablished to undertake system testing. Some pro-grammers were transferred to the test team on comple-tion of their programming and unit test work.
The applications consist of approximately 300 onlinetransactions and 300 batch programs, a total of 730,000SLOC 1 and 187 dB2 tables. This is the server part only,no GUI-client was tested in this project. A PC-based testbed was used to test the server transactions.
The project started in June 1994 and was delivered inOctober 1995. The project took approximately 40 man-years e�ort over 17 months. This paper documents ex-periences from the system test stage, which consumedapproximately 22% of the total project resources.
For online functional testing there was a test team ofseven testers with one team leader. The online ®x teamvaried from 3 to 6 people. The online test team leadermanaged both teams. Batch testing started approxi-mately two months after online testing, the total numberof people in test and ®xed increased dramatically at thispoint. Including a small test automation team, a non-functional test team and test management, the totalnumber of people involved in testing peaked at 40people.
The system test stage included:1. Technical system test, i.e., what is usually referred to
as environment test and integration test. Due to dif-ferences between the development environment andthe production environment, the system test stagehad to test all programs in the production environ-ment. During system test, the test team had to dothe integration test of the online system by testingand documenting all online interfaces (called mod-ules). The team also had to perform the integrationtest of the batch system(s) by testing and document-ing that all modules had been called and also testingthe complete batch ¯ow.
2. Functional system test, i.e., black box testing of allprograms and modules to detect any discrepanciesbetween the behavior of the system and its speci®ca-tions. The integration test veri®ed that all moduleshad been called, and therefore the functional systemtest was designed based on application functionality.
3. Non-functional system test. The system test also testedthe non-functional requirements, i.e., security, perfor-
mance (volume and stress test), con®guration (appli-cation consistency), backup and recovery proceduresand documentation (system, operation and installa-tion documentation).As for all projects, time and resources were limited.
At the beginning of construction (programming), thesystem test strategy was still not agreed upon. Since thedevelopment project was a very large project forthe vendor and therefore consumed nearly all availableresources, the number of people with experience avail-able for test planning was limited.
The ®nal strategy for the system test was agreed ap-proximately one month before the end of construction,and the time for planning was extremely short. A tra-ditional approach to system test planning based on testpreparation done in parallel with design and construc-tion, could therefore not be used.
3. What are the concepts risk and risk management?
Risk is something that might happen, whereas aproblem is something we know will happen (or has al-ready happened). If an event is associated with risk thenthere is a potential loss or impact associated with thatevent.
A simple risk model was used in this project, utilizingonly two elements of risk exposure: 2
1. the probability of a fault (in the online transaction orbatch program);
2. the cost (consequence or impact) of a fault in the cor-responding function if it occurs in production.Of main interest here are business risks. That is also
why only the above mentioned two elements of riskexposure have been used in this project. Several otherelements of risk exposure have been used in risk analysiswhen identifying risk impact, such as impact on systemperformance, schedule delays, etc. The simple calcula-tion used here is based on the assumption that aschedule delay without economic (i.e., cost) conse-quences is not a business risk. The same thing applies tobad system performance, if poor performance will nota�ect your business (for example, giving rise to customercomplaints or end-user dissatisfaction), there is no needto ®x it.
Mathematically risk exposure can be expressed as
Re�f � � P �f � � C�f �;where Re�f � is the risk exposure of function f; P�f � theprobability of a fault occurring in function f and C�f � isthe cost if a fault occurs (in production) in function f.
1 SLOC � Source Line of Code, excluding comments.
2 An overview of risk management and how it is performed is given
by P¯eeger (this issue) who also discusses di�erent problems with risk
management and provides a number of good references.
288 S. Amland / The Journal of Systems and Software 53 (2000) 287±295
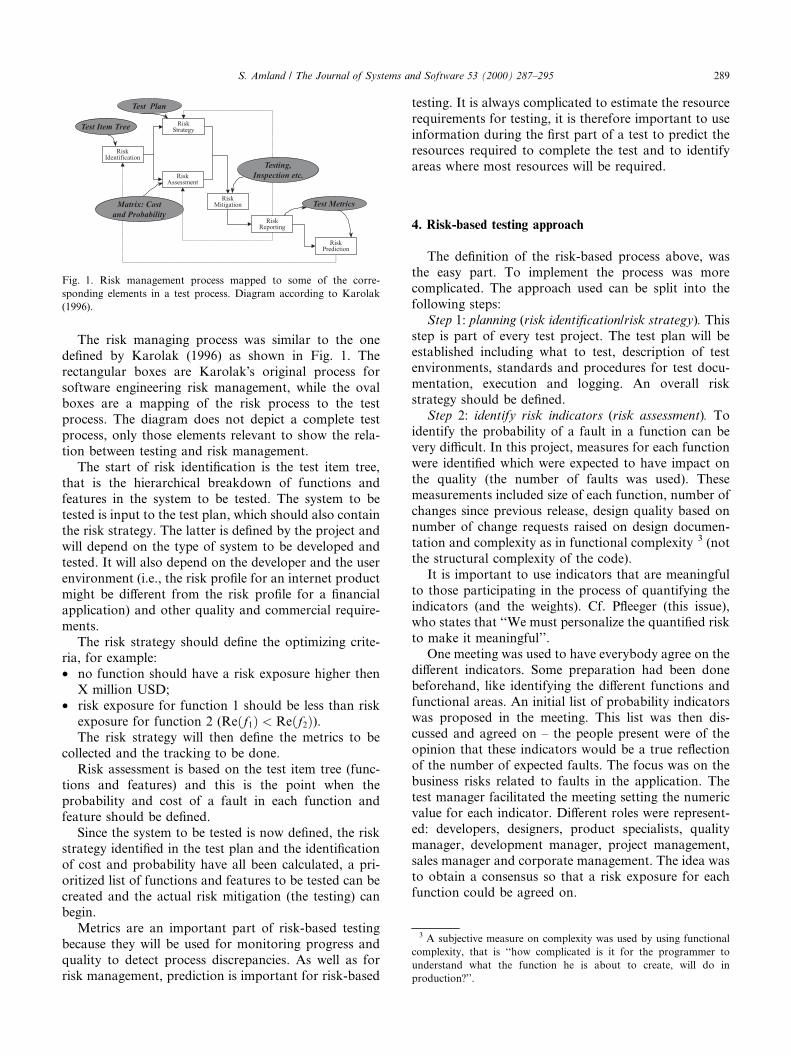
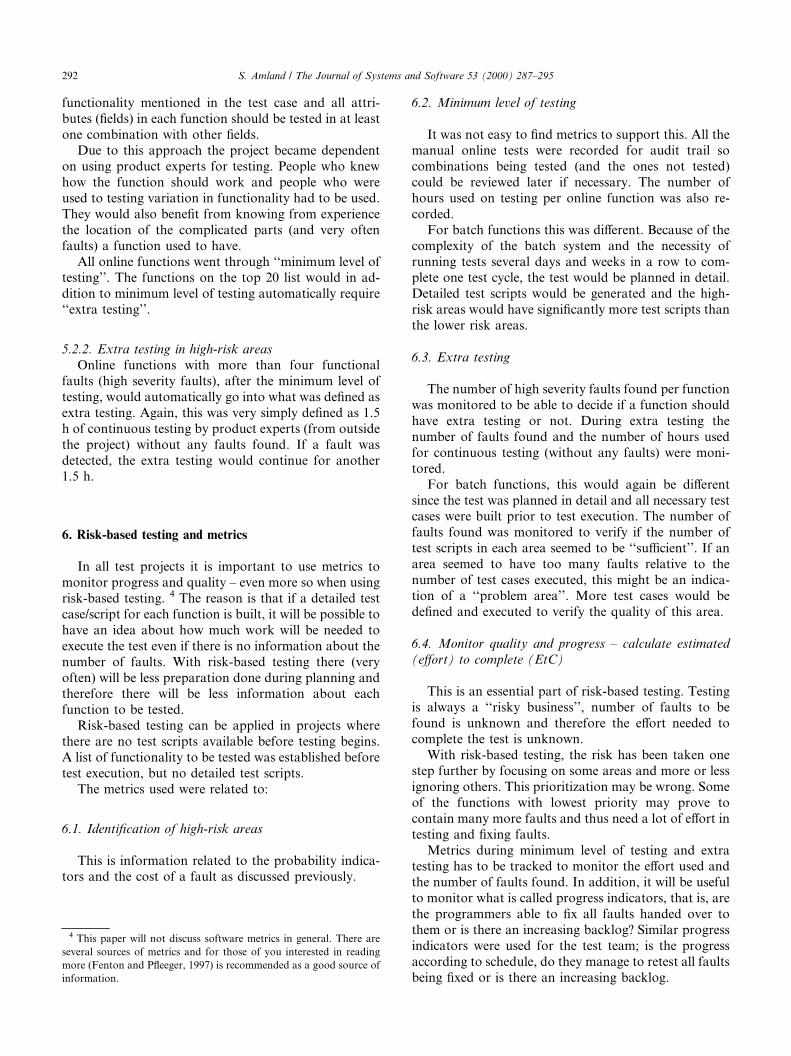
The risk managing process was similar to the onede®ned by Karolak (1996) as shown in Fig. 1. Therectangular boxes are KarolakÕs original process forsoftware engineering risk management, while the ovalboxes are a mapping of the risk process to the testprocess. The diagram does not depict a complete testprocess, only those elements relevant to show the rela-tion between testing and risk management.
The start of risk identi®cation is the test item tree,that is the hierarchical breakdown of functions andfeatures in the system to be tested. The system to betested is input to the test plan, which should also containthe risk strategy. The latter is de®ned by the project andwill depend on the type of system to be developed andtested. It will also depend on the developer and the userenvironment (i.e., the risk pro®le for an internet productmight be di�erent from the risk pro®le for a ®nancialapplication) and other quality and commercial require-ments.
The risk strategy should de®ne the optimizing crite-ria, for example:· no function should have a risk exposure higher then
X million USD;· risk exposure for function 1 should be less than risk
exposure for function 2 (Re�f1� < Re�f2�).The risk strategy will then de®ne the metrics to be
collected and the tracking to be done.Risk assessment is based on the test item tree (func-
tions and features) and this is the point when theprobability and cost of a fault in each function andfeature should be de®ned.
Since the system to be tested is now de®ned, the riskstrategy identi®ed in the test plan and the identi®cationof cost and probability have all been calculated, a pri-oritized list of functions and features to be tested can becreated and the actual risk mitigation (the testing) canbegin.
Metrics are an important part of risk-based testingbecause they will be used for monitoring progress andquality to detect process discrepancies. As well as forrisk management, prediction is important for risk-based
testing. It is always complicated to estimate the resourcerequirements for testing, it is therefore important to useinformation during the ®rst part of a test to predict theresources required to complete the test and to identifyareas where most resources will be required.
4. Risk-based testing approach
The de®nition of the risk-based process above, wasthe easy part. To implement the process was morecomplicated. The approach used can be split into thefollowing steps:
Step 1: planning (risk identi®cation/risk strategy). Thisstep is part of every test project. The test plan will beestablished including what to test, description of testenvironments, standards and procedures for test docu-mentation, execution and logging. An overall riskstrategy should be de®ned.
Step 2: identify risk indicators (risk assessment). Toidentify the probability of a fault in a function can bevery di�cult. In this project, measures for each functionwere identi®ed which were expected to have impact onthe quality (the number of faults was used). Thesemeasurements included size of each function, number ofchanges since previous release, design quality based onnumber of change requests raised on design documen-tation and complexity as in functional complexity 3 (notthe structural complexity of the code).
It is important to use indicators that are meaningfulto those participating in the process of quantifying theindicators (and the weights). Cf. P¯eeger (this issue),who states that ``We must personalize the quanti®ed riskto make it meaningful''.
One meeting was used to have everybody agree on thedi�erent indicators. Some preparation had been donebeforehand, like identifying the di�erent functions andfunctional areas. An initial list of probability indicatorswas proposed in the meeting. This list was then dis-cussed and agreed on ± the people present were of theopinion that these indicators would be a true re¯ectionof the number of expected faults. The focus was on thebusiness risks related to faults in the application. Thetest manager facilitated the meeting setting the numericvalue for each indicator. Di�erent roles were represent-ed: developers, designers, product specialists, qualitymanager, development manager, project management,sales manager and corporate management. The idea wasto obtain a consensus so that a risk exposure for eachfunction could be agreed on.
Fig. 1. Risk management process mapped to some of the corre-
sponding elements in a test process. Diagram according to Karolak
(1996).
3 A subjective measure on complexity was used by using functional
complexity, that is ``how complicated is it for the programmer to
understand what the function he is about to create, will do in
production?''.
S. Amland / The Journal of Systems and Software 53 (2000) 287±295 289
Other indicators (not used in this case study) might befrequency of use and function points (if available).
For all indicators (ij) only three values were used: low(1), medium (2) and high (3). However, each indicatorwas weighted (wj) with a weight ranging from 1 to 5 with5 being most important. The total probability of func-tion f will therefore be
P�f � �X4
j�1
ij � wj; where i � �1 � �3� and w � �1 � �5�:
The project used the following values for weight wj:
For example, the function ``Close Account'' had thefollowing indicators:
The probability for Close Account is therefore
P�f � � 2 � 5� 2 � 5� 2 � 1� 3 � 3 � 31:
Step 3: identify cost of a fault (risk assessment). This isa similar process to step 2. Again the project used low(1), medium (2) and high (3) for the cost. Together withthe customer, a cost was identi®ed for the customer andfor the supplier if a fault occurred. The assumption wasthat the two were equally important.
The same meeting that was used for agreeing onprobability indicators was used to have everybody agreeon the cost of a failure. The important thing was to havedi�erent roles present so the cost for the business ofcustomer and supplier could be assessed. It was essentialthat, for example, the cost for the supplierÕs technicaldepartment should not be too focused on.
Mathematically the costs can be expressed as (dividedby 2 to ®nd average)
C�f � � sc�f � � cc�f �2
;
where C�f � is the total cost if a failure occurs in functionf; sc�f � the supplierÕs cost if a failure occurs in function fand cc�f � is the customerÕs cost if a failure occurs infunction f.
For the function Close Account the cost for thesupplier was 1. This means that the supplier has su�-cient resources to ®x any problem ± even to go to thecustomerÕs site. It will not interrupt any other project orcause any maintenance problems for the supplier. Thefunction is well known.
However, the cost of a failure in Close Account couldhave dramatic consequences for the customer (they gaveit a 3). If, for example, a bankÕs commercial customerwanted to transfer all his funds to another bank and thesystem calculated the incorrect amount to be trans-ferred, a serious impact on reputation and client con®-dence could arise.
The total cost for function Close Account is therefore�1� 3�=2 � 2.
Step 4: identify critical elements (risk assessment). Theprobability (P from step 2) and cost (C from step 3) of afailure for each function, have now been identi®ed andthe risk exposure for each function can be calculated.This number can be used for ranking and prioritizationof the di�erent functions.
The risk exposure for the function Close Account willbe
Re�Close Account�� P �Close Account� �C�Close Account�� 31�2� 62:
However, very often there are other elements than thetwo numbers (probability and cost) which must be takeninto consideration when the prioritized list for testing isestablished. If risk analysis had been part of the devel-opment process there might be information to considerfrom that. The most important thing is to apply com-mon sense as well as knowledge about the system!
Another concern that should be highlighted is thatrisk (i.e., risk exposure) is expressed as a point(Re�f � � 62), while most other industries will alwaysexpress risk as a distribution (not as an exact number).This is further discussed by P¯eeger (this issue). Anothersimple way to overcome this is by reporting groups offunctions with Re( f ) within a range and not give theexact risk exposure number for each function. For moreinformation on this subject, please see Section 7.
Step 5: test execution (risk mitigation). Since theanalysis has been completed and a prioritized list offunctions has been established, it is time to start testing.A test process and an organization to support risk-basedtesting must be in place, otherwise the potential bene®tswill disappear.
The idea is to focus testing and spend more time onthe critical functions. However, if a prioritized list offunctions to be tested is given to the testers withoutmonitoring the progress and resource usage, the onlydi�erence from ordinary testing will be the sequence offunctions being tested.
Special attention must be paid to test sequencing andcritical function dependencies, as this will a�ect theprioritization of tests.
Step 6: estimate to complete (risk reporting andprediction). The idea is to use information aboutresource usage (i.e., metrics) collected during the ®rstpart of the test to predict the total resource requirements
New functionality 5Design quality 5Size 1Complexity 3
New func-tionality
Designquality
Size Com-plexity
Close Account 2 2 2 3
290 S. Amland / The Journal of Systems and Software 53 (2000) 287±295
and to identify critical areas based on probability indi-cators.
A more detailed discussion of this topic is given byAmland (1999).
5. Risk-based testing in practice
As in most areas of life, one thing is theory, another ispractice!
5.1. Batch testing
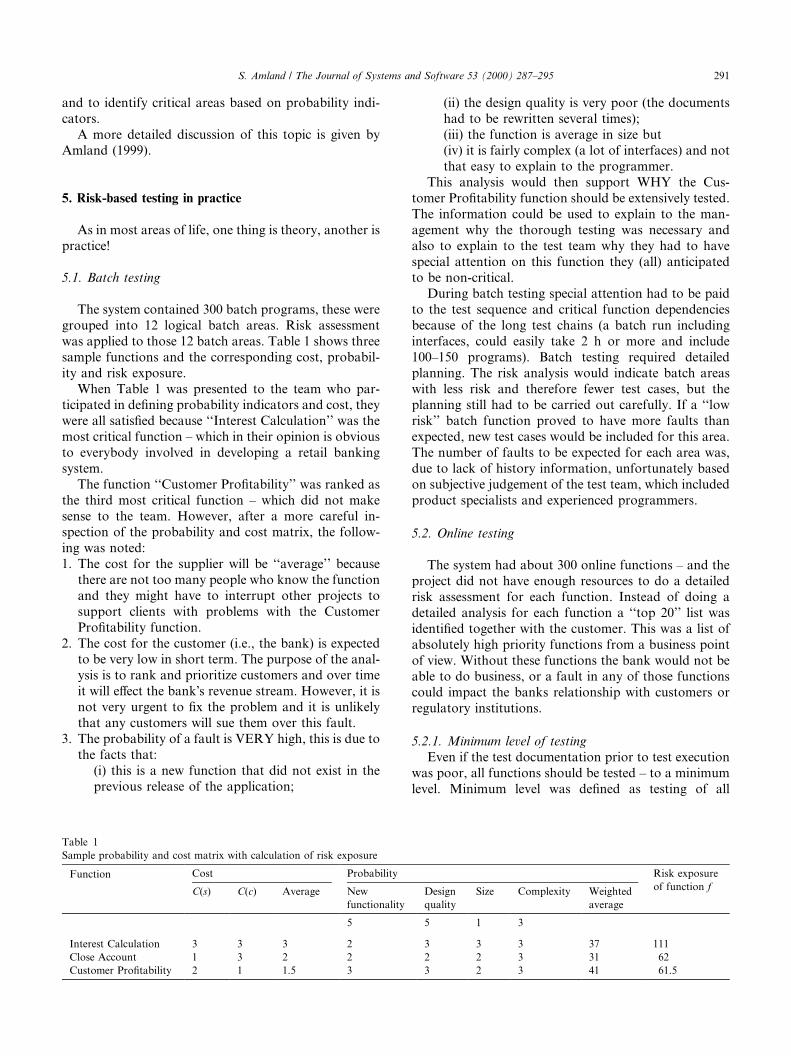
The system contained 300 batch programs, these weregrouped into 12 logical batch areas. Risk assessmentwas applied to those 12 batch areas. Table 1 shows threesample functions and the corresponding cost, probabil-ity and risk exposure.
When Table 1 was presented to the team who par-ticipated in de®ning probability indicators and cost, theywere all satis®ed because ``Interest Calculation'' was themost critical function ± which in their opinion is obviousto everybody involved in developing a retail bankingsystem.
The function ``Customer Pro®tability'' was ranked asthe third most critical function ± which did not makesense to the team. However, after a more careful in-spection of the probability and cost matrix, the follow-ing was noted:1. The cost for the supplier will be ``average'' because
there are not too many people who know the functionand they might have to interrupt other projects tosupport clients with problems with the CustomerPro®tability function.
2. The cost for the customer (i.e., the bank) is expectedto be very low in short term. The purpose of the anal-ysis is to rank and prioritize customers and over timeit will e�ect the bankÕs revenue stream. However, it isnot very urgent to ®x the problem and it is unlikelythat any customers will sue them over this fault.
3. The probability of a fault is VERY high, this is due tothe facts that:
(i) this is a new function that did not exist in theprevious release of the application;
(ii) the design quality is very poor (the documentshad to be rewritten several times);(iii) the function is average in size but(iv) it is fairly complex (a lot of interfaces) and notthat easy to explain to the programmer.
This analysis would then support WHY the Cus-tomer Pro®tability function should be extensively tested.The information could be used to explain to the man-agement why the thorough testing was necessary andalso to explain to the test team why they had to havespecial attention on this function they (all) anticipatedto be non-critical.
During batch testing special attention had to be paidto the test sequence and critical function dependenciesbecause of the long test chains (a batch run includinginterfaces, could easily take 2 h or more and include100±150 programs). Batch testing required detailedplanning. The risk analysis would indicate batch areaswith less risk and therefore fewer test cases, but theplanning still had to be carried out carefully. If a ``lowrisk'' batch function proved to have more faults thanexpected, new test cases would be included for this area.The number of faults to be expected for each area was,due to lack of history information, unfortunately basedon subjective judgement of the test team, which includedproduct specialists and experienced programmers.
5.2. Online testing
The system had about 300 online functions ± and theproject did not have enough resources to do a detailedrisk assessment for each function. Instead of doing adetailed analysis for each function a ``top 20'' list wasidenti®ed together with the customer. This was a list ofabsolutely high priority functions from a business pointof view. Without these functions the bank would not beable to do business, or a fault in any of those functionscould impact the banks relationship with customers orregulatory institutions.
5.2.1. Minimum level of testingEven if the test documentation prior to test execution
was poor, all functions should be tested ± to a minimumlevel. Minimum level was de®ned as testing of all
Table 1
Sample probability and cost matrix with calculation of risk exposure
Function Cost Probability Risk exposure
of function fC(s) C(c) Average New
functionality
Design
quality
Size Complexity Weighted
average
5 5 1 3
Interest Calculation 3 3 3 2 3 3 3 37 111
Close Account 1 3 2 2 2 2 3 31 62
Customer Pro®tability 2 1 1.5 3 3 2 3 41 61.5
S. Amland / The Journal of Systems and Software 53 (2000) 287±295 291
functionality mentioned in the test case and all attri-butes (®elds) in each function should be tested in at leastone combination with other ®elds.
Due to this approach the project became dependenton using product experts for testing. People who knewhow the function should work and people who wereused to testing variation in functionality had to be used.They would also bene®t from knowing from experiencethe location of the complicated parts (and very oftenfaults) a function used to have.
All online functions went through ``minimum level oftesting''. The functions on the top 20 list would in ad-dition to minimum level of testing automatically require``extra testing''.
5.2.2. Extra testing in high-risk areasOnline functions with more than four functional
faults (high severity faults), after the minimum level oftesting, would automatically go into what was de®ned asextra testing. Again, this was very simply de®ned as 1.5h of continuous testing by product experts (from outsidethe project) without any faults found. If a fault wasdetected, the extra testing would continue for another1.5 h.
6. Risk-based testing and metrics
In all test projects it is important to use metrics tomonitor progress and quality ± even more so when usingrisk-based testing. 4 The reason is that if a detailed testcase/script for each function is built, it will be possible tohave an idea about how much work will be needed toexecute the test even if there is no information about thenumber of faults. With risk-based testing there (veryoften) will be less preparation done during planning andtherefore there will be less information about eachfunction to be tested.
Risk-based testing can be applied in projects wherethere are no test scripts available before testing begins.A list of functionality to be tested was established beforetest execution, but no detailed test scripts.
The metrics used were related to:
6.1. Identi®cation of high-risk areas
This is information related to the probability indica-tors and the cost of a fault as discussed previously.
6.2. Minimum level of testing
It was not easy to ®nd metrics to support this. All themanual online tests were recorded for audit trail socombinations being tested (and the ones not tested)could be reviewed later if necessary. The number ofhours used on testing per online function was also re-corded.
For batch functions this was di�erent. Because of thecomplexity of the batch system and the necessity ofrunning tests several days and weeks in a row to com-plete one test cycle, the test would be planned in detail.Detailed test scripts would be generated and the high-risk areas would have signi®cantly more test scripts thanthe lower risk areas.
6.3. Extra testing
The number of high severity faults found per functionwas monitored to be able to decide if a function shouldhave extra testing or not. During extra testing thenumber of faults found and the number of hours usedfor continuous testing (without any faults) were moni-tored.
For batch functions, this would again be di�erentsince the test was planned in detail and all necessary testcases were built prior to test execution. The number offaults found was monitored to verify if the number oftest scripts in each area seemed to be ``su�cient''. If anarea seemed to have too many faults relative to thenumber of test cases executed, this might be an indica-tion of a ``problem area''. More test cases would bede®ned and executed to verify the quality of this area.
6.4. Monitor quality and progress ± calculate estimated(e�ort) to complete (EtC)
This is an essential part of risk-based testing. Testingis always a ``risky business'', number of faults to befound is unknown and therefore the e�ort needed tocomplete the test is unknown.
With risk-based testing, the risk has been taken onestep further by focusing on some areas and more or lessignoring others. This prioritization may be wrong. Someof the functions with lowest priority may prove tocontain many more faults and thus need a lot of e�ort intesting and ®xing faults.
Metrics during minimum level of testing and extratesting has to be tracked to monitor the e�ort used andthe number of faults found. In addition, it will be usefulto monitor what is called progress indicators, that is, arethe programmers able to ®x all faults handed over tothem or is there an increasing backlog? Similar progressindicators were used for the test team; is the progressaccording to schedule, do they manage to retest all faultsbeing ®xed or is there an increasing backlog.
4 This paper will not discuss software metrics in general. There are
several sources of metrics and for those of you interested in reading
more (Fenton and P¯eeger, 1997) is recommended as a good source of
information.
292 S. Amland / The Journal of Systems and Software 53 (2000) 287±295
Monitoring backlogs as well as progress according toschedule will give an early warning if something is wrong.
6.5. Managing the test process
If the e�ort required to ®nd and to ®x a fault as wellas the average number of faults per function are moni-tored, it is possible to calculate the e�ort required tocomplete the test project. This will become importantinformation when discussing deadlines and availableresources. The decision might be to cut back on mini-mum testing and prioritize even harder to be able tomeet the deadline while through the risk exposurefunctions, calculate the consequence of the decisions.
By using risk-based testing it is possible to intelli-gently reason about and communicate the expectedconsequences of decisions taken.
7. Risk reporting
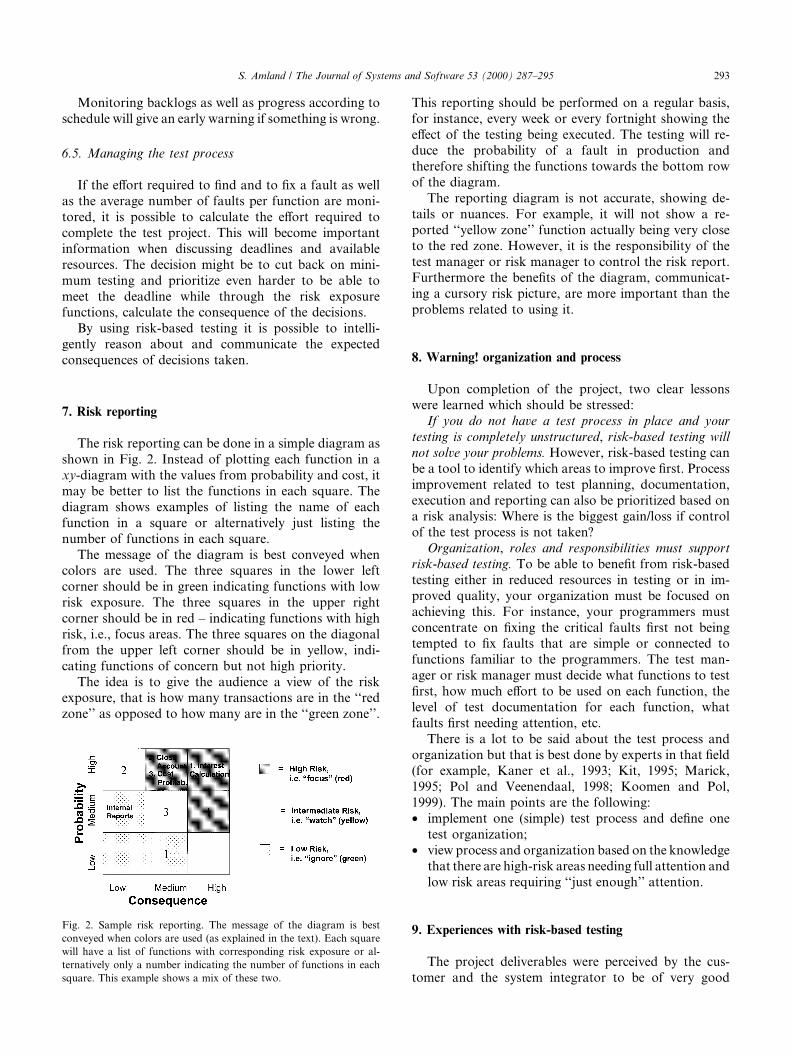
The risk reporting can be done in a simple diagram asshown in Fig. 2. Instead of plotting each function in axy-diagram with the values from probability and cost, itmay be better to list the functions in each square. Thediagram shows examples of listing the name of eachfunction in a square or alternatively just listing thenumber of functions in each square.
The message of the diagram is best conveyed whencolors are used. The three squares in the lower leftcorner should be in green indicating functions with lowrisk exposure. The three squares in the upper rightcorner should be in red ± indicating functions with highrisk, i.e., focus areas. The three squares on the diagonalfrom the upper left corner should be in yellow, indi-cating functions of concern but not high priority.
The idea is to give the audience a view of the riskexposure, that is how many transactions are in the ``redzone'' as opposed to how many are in the ``green zone''.
This reporting should be performed on a regular basis,for instance, every week or every fortnight showing thee�ect of the testing being executed. The testing will re-duce the probability of a fault in production andtherefore shifting the functions towards the bottom rowof the diagram.
The reporting diagram is not accurate, showing de-tails or nuances. For example, it will not show a re-ported ``yellow zone'' function actually being very closeto the red zone. However, it is the responsibility of thetest manager or risk manager to control the risk report.Furthermore the bene®ts of the diagram, communicat-ing a cursory risk picture, are more important than theproblems related to using it.
8. Warning! organization and process
Upon completion of the project, two clear lessonswere learned which should be stressed:
If you do not have a test process in place and yourtesting is completely unstructured, risk-based testing willnot solve your problems. However, risk-based testing canbe a tool to identify which areas to improve ®rst. Processimprovement related to test planning, documentation,execution and reporting can also be prioritized based ona risk analysis: Where is the biggest gain/loss if controlof the test process is not taken?
Organization, roles and responsibilities must supportrisk-based testing. To be able to bene®t from risk-basedtesting either in reduced resources in testing or in im-proved quality, your organization must be focused onachieving this. For instance, your programmers mustconcentrate on ®xing the critical faults ®rst not beingtempted to ®x faults that are simple or connected tofunctions familiar to the programmers. The test man-ager or risk manager must decide what functions to test®rst, how much e�ort to be used on each function, thelevel of test documentation for each function, whatfaults ®rst needing attention, etc.
There is a lot to be said about the test process andorganization but that is best done by experts in that ®eld(for example, Kaner et al., 1993; Kit, 1995; Marick,1995; Pol and Veenendaal, 1998; Koomen and Pol,1999). The main points are the following:· implement one (simple) test process and de®ne one
test organization;· view process and organization based on the knowledge
that there are high-risk areas needing full attention andlow risk areas requiring ``just enough'' attention.
9. Experiences with risk-based testing
The project deliverables were perceived by the cus-tomer and the system integrator to be of very good
Fig. 2. Sample risk reporting. The message of the diagram is best
conveyed when colors are used (as explained in the text). Each square
will have a list of functions with corresponding risk exposure or al-
ternatively only a number indicating the number of functions in each
square. This example shows a mix of these two.
S. Amland / The Journal of Systems and Software 53 (2000) 287±295 293
quality. The quality reviews and experiences from pro-duction show that the number of faults was equal to orless than previous releases of the application. The pro-ject had been able to deliver acceptable quality within avery short time frame and with fewer resources thanoriginally estimated.
Risk-based testing should be viewed as a tool tosupport the testing process. In all test projects any tool isof little value unless it has the support of the organiza-tion and the correct process/method. What RBT bringsto the project is the early identi®cation of test issues,which can be started when the requirement speci®cationis completed.
Furthermore, risk-based testing moves the test phasefrom the latter part of the project to the start of theproject and allows the concept of life cycle testing to beimplemented.
As well as saving time and money in the actual pro-ject, risk-based testing allows the development of apragmatic and re-usable system test for later releasesand system changes. It forms a business-related modelto ensure that the software delivery will deliver the re-quired functionality.
The concept of RBT can be seen as a corner stone ifused in the early stages of the project, by identifyingcritical areas of the application in the requirementstages. Not only does it assist the test process, but alsothe development process, as in all businesses it is desir-able you place the best resources where they are mostneeded.
It is of interest to identify ``probability indicators''which will assist in identifying critical areas as early aspossible in the development lifecycle.
In the case study used in this paper a sample of 10online functions with no faults and 10 functions with thehighest number of high severity faults were used tocalculate McCabe Cyclomatic Complexity (McCabe,1976). In average, the 10 functions with highest numberof faults had 100% higher complexity. This is only asmall sample but an indication that use of complexitymeasures as part of risk-based testing might be worth-while analyzing further.
Risk-based testing was also used on a small projectfor an insurance company. The system only containedthree online functions (screens) and two batch functions(reports). The people working for the insurance com-pany did not think the formal prioritization process wasneeded. They felt that the three online functions wereobviously the most important ones.
However, after the analysis was complete the twobatch functions were listed on top of the prioritized list.The reason being the complexity and the number ofinterfaces of the reports.
Alternative discussions on risk-based testing is doneby Bach (1999) and Ottevanger (1999). Bach's hueristicanalysis is less rigorous, but includes some good lists of
quality criteria categories, generic risk lists and riskcatalogs with references. Ottevanger's risk-based teststrategy is interesting because it utilizes the bene®ts ofan analytical approach without using mathematics. Yetanother approach is software reliability engineering asdocumented by Musa (1998). Several large organiza-tions like Bank of America, Maersk Data and IBM havebeen using risk-based approaches for project manage-ment and test management for some time. Hopefully,practical experiences from these organizations will bepublished for the bene®t of others.
10. Risk-based testing and test automation
As test automation can be complex and costly toimplement, it will work very well with a risk-based testapproach. Again the idea is to identify the most criticalareas of the system and to use test automation in theseareas ®rst. It is important to monitor the cost/bene®t oftest automation.
Test automation can also be part of extra testing asdiscussed previously. For example, automated regres-sion testing can be de®ned as part of the test process forhigh-risk functions.
For further information on test automation seeFewster and GrahamÕs ``Software Test Automation''(Graham and Fewster, 1999).
11. Summary
The intention of this paper is to show how risk-basedtesting can support the management of the test processby focusing on resource usage in high-risk areas and toassist in reasoning about and communicate the expectedconsequences of decisions taken.
It has also been important to discuss the importanceof managing the test organization, to bene®t from a risk-based approach.
The bene®ts of risk-based testing are:1. reduced resource consumption (i.e., more e�cient
testing), or2. improved quality by spending more time on critical
functions, or3. a combination of (1) and (2) above.
Acknowledgements
Special thanks to Hans Schaefer who gave me ideasabout risk-based testing. I will also thank Gro Bjerknesand Ged Hawkins for their comments and questions,Travers Sampson for his experiences from using risk-based testing with a number of clients and MartynHammond and Astrid K�ahler for helping out with my
294 S. Amland / The Journal of Systems and Software 53 (2000) 287±295
``Norwenglish''. Also a special thank to Bo K�ahler withwhom I have discussed these ideas for years.
References
Amland, S., 1999. In: Proceedings of the Conference Testing Computer
Software Õ99, Risk-Based Testing and Metrics, Washington, DC,
http://www.uspdi.org/.
Bach, J., 1999. Risk-based testing. How to conduct heuristic risk
analysis. Software Testing and Quality Engineering Magazine 1 (6).
Fenton, N.E., P¯eeger, S.L., 1997. Software Metrics, a Rigorous and
Practical Approach, second ed. International Thomson Computer
Press.
Graham, D., Fewster, M., 1999. Software test automation, Addison-
Wesley, UK.
Kaner, C., Falk, J., Nguyen, H.Q., 1993. Testing Computer Software,
second ed. Van Nostrand Reinhold, New York.
Karolak, D.W., 1996. Software Engineering Risk Management. IEEE
Computer Society Press, Silver Spring, MD.
Kit, E., 1995. Software Testing in the Real World. Addison-Wesley,
Wokingham.
Koomen, T., Pol, M., 1999. Test Process Improvement. Addison-
Wesley, Wokingham.
Marick, B., 1995. The Art of Software Testing. Prentice-Hall,
Englewood Cli�s, NJ.
McCabe, T.J., 1976. Initial paper on cyclomatic complexity de®nition.
In: McCabe, T.J. (Ed.), A Complexity Measure, IEEE Trans. on
SW Engineering, vol. 2 (4).
Musa, J.D., 1998. Software Reliability Engineering. McGraw-Hill,
New York.
Ottevanger, Ingrid, B., A Risk-Based Test Strategy, IQUIP Inform-
atica B.V. Diemen, The Netherlands, Presented at STARWest
1999, http://www.sqe.com/starwest.
évstedal, E.é., St�alhane, T., 1992. A goal oriented approach to
software testing. In: Reliability Engineering and System Safety.
Elsevier, UK.
P¯eeger, S.L. Risky business: what we have yet to learn about risk
management, Journal of Systems and Software, this issue.
Pol, M., Veenendaal, E. van, 1998. Structured Testing of Information
Systems. Kluwer Academic Publishers, Dordrecht.
Schaefer, H. Surviving under time and budget pressure, keynote STAR
West Õ98, [email protected].
S. Amland / The Journal of Systems and Software 53 (2000) 287±295 295