Embed Size (px)
Citation preview

Rhode Island State Energy Plan Business-As-
Usual Forecast
October, 2013
Authors: Varun Kumar & Jamie Howland, ENE
Submitted to: State of Rhode Island, Office of Energy Resources

Table of Contents 1 Introduction ...................................................................................................................................................... 3
2 Projected Fuels ................................................................................................................................................. 4
3 Schematics of Forecast Model used in the study ........................................................................................... 7
4 National Forecasts ........................................................................................................................................... 8
5 Policy Impacts ................................................................................................................................................ 10
6 Data Sources, Assumptions and Modifications Methodology ................................................................... 13
7 Forecast Model Assumptions and Methodology ......................................................................................... 16
8 Results ............................................................................................................................................................. 20
9 Works Cited .................................................................................................................................................... 40

1 Introduction
The Rhode Island State Energy Plan Business-As-Usual (RISEP BAU) analysis forecasts the energy demand, prices, expenditure and carbon dioxide emissions in Rhode Island through 2035, assuming no changes in existing or planned federal, regional and state energy policies and estimated resource availability. The forecast model used is based on historical data from the Energy Information Administration (EIA) State Energy Data System (SEDS), EIA form 923 and EIA Renewable and Alternative Fuels database. Projected data is from the EIA Annual Energy Outlook (AEO) energy price and consumption forecasts. AEO projections are based on estimated changes in long term energy supply and demand. AEO model inputs are public and its results are widely accepted for high level projections
of energy markets in the future.
ENE believes that energy markets in the New England region are significantly influenced by the economics of petroleum products and natural gas. These fuel markets have relatively high levels of uncertainty, as they are impacted by a range of complex national and international factors. The forecast model that ENE used establishes different alternative forecasts, based on AEO alternate cases, to capture a range of potential market uncertainty.
Further, the analysis is adjusted to include impacts of state and regional energy policies that are not included in AEO forecasts. The additional policies evaluated by our forecast model are:
Rhode Island Comprehensive Energy Conservation, Efficiency and Affordability Act – Enacted
in 2006, this legislation requires utilities to acquire all cost-effective energy efficiency. Under this
requirement, the Rhode Island 2012-2014 Energy Efficiency Procurement Plan established one
of the most aggressive savings targets in the nation.i
The Rhode Island Petroleum Savings and Independence Advisory Commission – The
Commission proposes targets to reduce petroleum consumption by procuring maximum
economically achievable savings.ii
Regional Greenhouse Gas Initiative (RGGI), with New Cap - RGGI is a cooperative regional
effort of Northeastern and Mid-Atlantic States to reduce CO2 emissions from power plants
using a market based cap and trade program. In order to lock in emissions reductions and ensure
the continuing effectiveness of the program, states have recently agreed to reduce the annual
emissions cap from 165 million short tons of CO2 to 91 million short tons. Reducing the cap to
2012 emissions levels accounts for reductions in pollution that have occurred as natural gas
generation has increased and investments in renewables and efficiency have continued to grow.
Furthermore, the lower cap will ensure that there is an incentive for plants to continue cutting
emissions.
The AEO forecast already includes impacts of other key policies such as Renewable Portfolio Standards, RGGI (Old Cap) and Corporate Average Fuel Economy (CAFE) standards for model years 2017 through 2025. These policies need not be adjusted by the ENE forecast model.

4
2 Projected Fuels
Table 2-1 below shows all the fuels consumed in Rhode Island in the electricity, transportation and thermal sectors that are projected by the ENE forecast model.
Table 2-1: Fuels Consumed in Rhode Island by Sector
RISEP Sectors EIA Sectors Projected Fuels* Fuel’s consumption estimated as percentage of total consumption in the sector (Based on EIA SEDS 2010 Data unless noted)
Notes
Electricity Electricity Power Generation
Natural Gas 96.8% Landfill gas-to-energy, Hydroelectricity and Wind constitute the remaining fuels and are not projected.
Distillate Fuel Oil 0.2%
Residual Fuel Oil 0.1%
Electricity Sector Total Consumption Covered by Projected Fuels
97.1% (Data based on EIA 923)
Electricity Consumption
Electricity consumed in residential sector.
Electricity consumed in commercial sector.
Electricity consumed in industrial sector.
Electricity consumed in transportation sector
Thermal Residential Distillate Fuel Oil 48.2% Geothermal, solar energy and wood constitute the remaining fuels and are not projected. Kerosene (Consumption/Emissions only) 0.3%
Propane 2.0%

5
Natural Gas 47.6%
Sector Total Consumption Covered by Projected Fuels
98.1%
Commercial Distillate Fuel Oil 26.3% Wood and Gasoline constitute the remaining fuels and are projected. Kerosene (Consumption/Emissions only) 0.02%
Propane 2.0%
Natural Gas 67.7%
Residual Fuel Oil 3%
Sector Total Consumption Covered by Projected Fuels
99.0 %
Industrial Distillate Fuel Oil 8.1% Wood and Waste-to-energy constitute the remaining fuels and are not projected.
Asphalt and Road oil, Lubricants, Special Napthas and Waxes are excluded while calculating total consumption of Thermal fuels, because they are not used as energy.
Gasoline industrial sector future prices are not available from Annual Energy Outlook. Transportation sector prices are used to calculate expenditure.
Propane 2.4%
Natural Gas 74.5%
Residual Fuel Oil 6%
Gasoline 8.5%
Sector Total Consumption Covered by Projected Fuels
99.4%
Total Thermal Thermal Sector Total Consumption Covered by Projected Fuels
98.5%

6
Transportation Transportation Distillate Fuel Oil 15.1% Aviation Gasoline is the remaining fuel and is not projected.
Lubricants are excluded while calculating total consumption of Transportation fuels because they are not used as energy.
Motor Gasoline is currently E10, a blend of 90% Gasoline and 10% Ethanol.
Fuel Ethanol E85 is a blend of 85% Ethanol and 15% Gasoline.
Jet Fuel 5.7%
Propane 0.1%
Motor Gasoline currently E10 75.7%
Natural Gas 2.5%
Residual Fuel Oil 1%
Fuel Ethanol E85 (Consumption/Emissions only)
0.01% (Data is based on EIA Alternative Fuels Dataset)
Transportation Sector Total Consumption Covered by Projected Fuels
99.96%
*For each fuel, Price, Consumption, Expenditure and Emissions are forecasted with the exception of Kerosene and E85. For Kerosene and E85, only consumption and emissions are forecasted as their price data is not available from the AEO.

7
3 Schematics of Forecast Model used in the study

8
4 National Forecasts
As described above, ENE’s model analyzed different alternative forecasts to reflect uncertainty in the petroleum and natural gas markets. The analysis yielded range of forecasts based on different assumptions of price and demand, informed by the Annual Energy Outlook (AEO) reference and alternate cases. The study conducted 4 alternative forecasts in addition to the base forecast, as described below:
RISEP BAU Base Forecast
This forecast is based on the AEO 2013 Early Release (AEO 2013ER) reference case. In this, the AEO projects energy demand and prices based on up-to-date estimates of resource availability, technological breakthroughs, regulatory changes, economic growth and population growth. The AEO case was adjusted to include 1) the impacts of increases in energy efficiency as required by the Rhode Island Comprehensive Energy Conservation, Efficiency and Affordability Act and 2) impacts of changes in cap levels of the Regional Greenhouse Gas Initiative (RGGI).
RISEP BAU Low Oil Price Forecast
This scenario differs from the RISEP BAU Base forecast because it assumes a lower price for petroleum-based fuels. It uses the AEO 2012 Low Oil Price case, which assumes lower demand for petroleum and other liquid fuels in the non-OECD countries and higher global supply compared to the AEO reference case. The forecast is adjusted with the difference between AEO 2013 ER and AEO 2012 reference case values to account for the impacts of updated assumptions made for AEO 2013 ER.
RISEP BAU High Oil Price Forecast
This scenario differs from the RISEP BAU Base forecast because it assumes a higher price for petroleum-based fuels. It uses the AEO 2012 High Oil Price case, which assumes higher demand for petroleum and other liquid fuels in the non-OECD countries and lower global supply compared to AEO reference case. The forecast is adjusted with the difference between AEO 2013 ER and AEO 2012 reference case values to account for the impacts of updated assumptions made for AEO 2013 ER. Further, the forecast is adjusted to account for the impacts of the Rhode Island Petroleum Savings and Independence Advisory Commission’s recommended targets.
RISEP BAU Low Natural Gas Price Forecast
This scenario differs from the RISEP BAU Base forecast with a lower price for natural gas. It uses the AEO 2012 Oil and Gas: High Technically Recoverable Resources (TRR) case, which assumes lower cost shale gas and tight oil production due to 8 wells per square mile of spacing and higher fuel recovery from wells. The forecast is adjusted with the difference between AEO 2013 ER and AEO 2012 reference case values to include the impact of updated assumptions made for AEO2013 ER.
RISEP BAU High Natural Gas price Forecast
This scenario differs from the RISEP BAU Base forecast because it assumes a higher price for natural gas. It uses the AEO 2012 Oil and Gas: Low EUR case, which assumes higher cost shale gas and tight oil production due to lower fuel recovery from wells. The forecast is adjusted with the difference between AEO 2013 ER and AEO 2012 reference case values to account for the impact of updated assumptions made for AEO 2013 ER.

9
RISEP BAU High Carbon Fee Forecast
This scenario differs from the RISEP BAU Base forecast with an applied economy-wide carbon fee starting at $15 and rising by 5 percent per year from 2013 through 2035. The forecast is adjusted with the difference between AEO 2013 ER and AEO 2012 reference case values to account for the impact of updated assumptions made for AEO 2013 ER.
Please refer to the EIA AEO 2012 assumptions document and AEO 2013 assumption updates for details on AEO reference and alternate casesiii.

10
5 Policy Impacts
Policy impacts already included in AEO results
The AEO is generated by EIA, using their National Energy Modeling System (NEMS). NEMS is a regional model which takes federal, regional and state legislation and regulations into account while forecasting energy consumption and prices. AEO 2013, which was used as the base forecast for this study, includes legislation and regulations known as of the end of September 2012. The alternative forecasts used in this study, which are based on AEO 2012, are modified and are assumed to include the same legislation and regulations as AEO 2013. Regulation impacts are assumed to not be in effect after their sunset dates for AEO cases used in this analysis. Policies included for the electric, thermal, and transportation sectors are, for example: federal and states tax credits, incentives, performance standards, portfolio standards and others.
For further details about legislation and regulations included in the AEO, refer to its assumptions and methodology document.iv The methodology document is available for AEO 2012. The AEO 2013 document is not yet released, but key assumption updates from AEO 2012 are available.v The AEO results also include the impacts of economic and population growth. The economic growth assumptions are found in the explanation of the NEMS macroeconomic module, while population growth is an input in the demand modules. Some of the key policies analyzed by NEMS and included in the AEO forecast data are:
Renewable Portfolio Standards (RPS) – Since AEO NEMS is a regional model, the RPS targets
for Connecticut, Maine, Massachusetts, New Hampshire, Rhode Island are included as
Northeast Power Coordinating Council/Northeast NPCC-NE region’s aggregated RPS
target. AEO calculated aggregated regional targets to be 10.8% in 2015, 14.5 % in 2025, and
14.7% in 2035. The following assumptions were made by EIA:
o Vermont does not have a mandatory RPS, but is still included in the calculation, to help
translate the state targets into a regional target.
o Not all sales are subject to the RPS requirement, and the aggregate target looks at
required credits over total sales, not just covered sales.
o The Class III portion of the goal for Connecticut is not included, since it is exclusively
for CHP and efficiency, and NEMS only models the renewable portion of the goal.
o For Massachusetts, NEMS terminates the target progression at 15% in 2020, as opposed
to allowing the 1% per year progression that is technically specified in the current
legislation.
o For New Hampshire, NEMS excludes the thermal component of the Class I target,
which also has the effect of slightly decreasing the overall target.
State policies in Rhode Island such as the Distributed Generation Standard Contracts Act and the Long-term Contracting for Renewables Act facilitate renewable development and use in the state and are supportive in meeting RPS requirements. Hence their contributions are assumed to be reflected in the RPS impacts.
Greenhouse Gas Emissions and Corporate Average Fuel Economy (CAFE) Standards for model
years 2017 through 2025 light duty vehicles – The U.S. Environment Protection Agency (EPA)
and the National Highway Traffic Safety Administration (NHTSA) promulgated this rule on
October 15, 2012 for carbon dioxide (CO2) emissions and CAFE standards for light duty

11
vehicles, model years 2017 through 2025. The EPA ruling requires a fleet-wide average of 163
grams CO2 per mile through 2025, which is equivalent to a fleet-wide average of 54.5 miles per
gallon (mpg), if reached only through fuel economy. EPA standards can also be met by reducing
air conditioning leakage and the use of alternative refrigerants. NHTSA fuel economy standards
from 2017 through 2021 require passenger cars and light duty trucks to have fleet-wide average
of 40.3 miles per gallon in 2021. The second phase from 2022-2025 requires the fleet-wide
average to be 48.7 miles per gallon in 2025.
Regional Greenhouse Gas Initiative (RGGI) Old Cap – The impacts of the original RGGI cap
level (set at 165 million short tons of CO2 annually) are already included in the AEO results. As
mentioned before, RGGI Inc. has changed the cap levels to achieve further emission reductions.
Our forecast model evaluated the impacts of the change in cap levels. This is discussed in detail
in the next section.
Additional Policies Included in the ENE Forecast Model
Additional policies which were not included in the AEO modeling but included in the ENE forecast model and are described below:
Rhode Island Comprehensive Energy Conservation, Efficiency and Affordability Act – Enacted
in 2006, this legislation requires utilities to acquire all cost-effective energy efficiency. Under this
requirement, the Rhode Island 2012-2014 Energy Efficiency Procurement Plan established one
of the most aggressive savings targets in the nation.vi In this analysis, impacts of electric and
natural gas efficiency programs on the residential, commercial and industrial sectors are
evaluated. Implementing efficiency reduces energy consumption and expenditures. In the case of
electric efficiency, the reduction in load also leads to a decrease in electric generation. Energy
Efficiency programs are funded mostly by ratepayers through an Energy Efficiency Program
Charge (EEPC) on their bills, so an increase or decrease in efficiency measures will have a rate
impact. Also in the case of electric efficiency, reduction in demand or load will cause price
suppression due to market changes resulting from a reduction in electric demand and capacity
needs, commonly referred to as Demand Reduction Induced Price Effect (DRIPE). The ENE
forecast model accounts for all of these impacts on demand, generation and cost.
Regional Green House Gas Initiative (RGGI) New Cap – RGGI is a cooperative regional effort
of Northeastern and Mid-Atlantic States to reduce CO2 emissions from power plants using a
market based cap and trade program. Under RGGI, power plants purchase allowances (permits
to emit) for each ton of CO2 that they release into the atmosphere. The quantity of allowances
declines over time, increasing the emissions reduction requirement. Revenue from the sale of
allowances is reinvested in energy efficiency, renewable energy, and other state programs. Since
states agreed to a carbon pollution limit (the “old cap”) in 2005, emissions have dropped
precipitously, falling 45% below the old cap in 2012. This decline is due to a number of factors:
decreasing electricity generation from carbon-intensive fuel oil and coal; increasing generation
from low cost natural gas and renewables; and increases in energy efficiency. In order to lock in
future emissions reductions and ensure the continuing effectiveness of the program, states have

12
agreed to reduce the emissions cap from 165 million short tons of CO2 annually to 91 million
short tons. The lower cap will ensure that there is an incentive for plants to continue cutting
emissions. Old cap impacts were already included in the AEO results. In the ENE forecast
model, natural gas consumption in the power generation sector and electric energy and capacity
prices were adjusted to include the impacts of the change in cap levels. Natural gas consumption
changes lead to changes in projected electricity generation emissions, which are also accounted
for in the ENE forecast model.vii
The Rhode Island Petroleum Savings and Independence Advisory Commission – The
Commission proposes targets to reduce petroleum consumption by procuring maximum
economically achievable savings.viii The targets are: 30% overall reduction in petroleum products
consumption from 2007 levels by 2030; and 50% reduction by 2050. In this study, the reduction
potential from these targets is analyzed by comparing it to total petroleum products
consumption in the High Oil Price forecast.

13
6 Data Sources, Assumptions and Modifications Methodology
Historical data
Historical Rhode Island and New England annual energy consumption and price data used for the forecast comes from EIA SEDS, EIA Form 923, and the EIA Renewable and Alternative Fuels database. New England consumption data is the sum of values for all New England states (Connecticut, Massachusetts, New Hampshire, Rhode Island and Vermont). New England price data is the average for all New England states (total fuel expenditures divided by total consumption)1. The consumer price index for the years from 1990 through 2012, which was used to convert price and expenditure data into 2012$, is from the U.S. Department of Labor, Bureau of Labor Statistics.ix
Forecast data
Aggregated New England annual energy consumption and price data from the Energy Information Administration (EIA) Annual Energy Outlook (AEO) is used to derive Rhode Island specific results. Data for the base case is from AEO 2013 Early Release (AEO 2013 ER). Data for alternate cases comes from AEO 2012 (as described in the ‘National Forecasts’ section of this report). To update AEO 2012 data with assumptions changes made for the AEO 2013 ER, differences between the AEO 2012 and 2013 ER reference cases were evaluated. These differences were assumed to represent all the changes in assumptions for AEO 2013 ER compared to the AEO 2012 reference case. These differences were added to AEO 2012 data that was used to generate alternate forecasts. The consumer price index for the years 2013 through 2035 is derived from AEO price data. Emission factors used to derive emissions are from EIA, EPA and ISO New England (ISO NE).x
Policy Impacts - Energy Efficiency Programs Data
Energy efficiency program projected savings targets are used to derive policy impacts on Rhode Island’s future energy data. The savings targets are based on information from opportunity reports, energy efficiency program reports and plans, and (for years after 2014) ENE projections, as shown in the Table 6-1 and Table 6-2 below for electric and natural gas efficiency.
Table 6-1: Electric Efficiency Savings Targets
Year Electric Efficiency Savings Target (Percentage of 2009 Sales)
Source
2011 (Base Efficiency) 1.26% Based on 2011 Energy Efficiency Program Report
2012 1.7% RI Energy Efficiency Procurement Plan 2012-14xi
2013 2.1%
2014 2.5%
2015-2021 2.7% Based on KEMA RI Energy Efficiency Opportunity Report
xii
1 For Natural gas in transportation sector, direct average of price values in New England states was used. This is due to an abnormality in EIA SEDS expenditure data for fuel in that sector.

14
2022-2024 2% ENE estimate of additional efficiency potential
2025-2035 1.5%
Table 6-2: Natural Gas Efficiency Savings Targets
Year Natural Gas Efficiency Savings Target (Percentage of 2009 Sales)
Source
2011 (Base Efficiency) 0.32% Based on 2011 Energy Efficiency Program Report
2012 0.6% RI Energy Efficiency Procurement Plan 2012-14xi
2013 0.8%
2014 1%
2015-2017 1% Based on VEIC Optimal Consultant Team RI Gas Opportunity Report
xiii
2018-2020 1% ENE estimate of additional efficiency potential
2021-2035 0.5%
Installed measure lifespans are assumed to be 11 years for electric efficiency and 14 years for gas efficiency programs, based on the average of the previous 3-year implemented measure life.xiv Half of the implemented efficiency is assumed to remain after completion of an installed measure’s life, due to anticipated improvements in the baseline efficiency of products.
An annual efficiency cost of $347/MWh-annual savings for electricity and $37.83/MMBTU-annual savings for gas programs is used for the analysis. It is based on the average of the previous 3-years of implemented efficiency cost.xv
To address electricity price changes due to the Demand Reduction Induced Price Effect (DRIPE), data was used from the Rhode Island 2013 Energy Efficiency Plan.xvi The reduction in electricity demand cuts down the need for generation capacity and energy. This reduces the cost of generation and has an impact on electricity auction prices. DRIPE savings and lifetime savings from the 2013 energy efficiency plan are divided to derive DRIPE $/MWh-lifetime savings. The percentage apportionment of DRIPE $/MWh-lifetime savings over the 12-year impact period is multiplied by DRIPE $/MWh-lifetime to derive the DRIPE $/MWh rate for each year distributed over the 12-year period. The annual rate is further used to derive the projected DRIPE benefit in each year.
All additional efficiency is assumed to be funded through the Energy Efficiency Program Charge (EEPC). Potential changes in efficiency funding from RGGI (with changes in cap levels) are not estimated in this analysis.
Policy Impacts - Regional Greenhouse Gas Initiative Data
RGGI Inc. conducted forecast modeling to evaluate impacts of the old and new cap on natural gas consumption, electricity prices and emissions from 2012 through 2020. This study uses the RGGI Inc. modeling results to evaluate impacts caused by the change in cap levels. Impacts due to the change in

15
cap levels are evaluated as differences in the values between the old and new cap. RGGI Inc. modeling results are not available for the year 2017 and 2019. Evaluated impacts were interpolated for these years using values for years 2016, 2018 and 2020. Impacts for the period from 2021-2035 are assumed to be equal to year 2020.

16
7 Forecast Model Assumptions and Methodology
The ENE model projects Rhode Island energy fuel consumption and prices using EIA AEO New England 2011 through 2035 data. It then adjusts the results with policy impacts not evaluated by NEMS, which generates the AEO data. It converts fuels prices into 2012 dollars. Finally, it calculates emissions and expenditures caused by fuels using consumption and price data.
The parameters used to derive Rhode Island specific data from New England data are proportions B1 and B2:
B1 = Rhode Island Consumption/New England Consumption.
B2 = Rhode Island Price/New England Price.
First, these proportions through 2010 are derived using Rhode Island and New England consumption and price historical data for each fuel by sector. Then forecasted proportions are evaluated using a trend analysis of historical data. For proportions B1 and B2 with no trend, recent year averages were used to derive proportion values for years 2011 through 2035. B2 historical data analysis showed no trend for all fuels. B1 trends were forecasted using a logarithmic function-based trend line. The trend line was used as a conservative assumption to counter uncertainty regarding future changes in Rhode Island demand compared to other New England states. A logarithmic function is suitable to forecast a recent trend that dampens towards a steady-state in the future. Some of the B1 and B2 trends are shown in Figure 7-1 and Figure 7-2 below:
Figure 7-1: B1 Trends

17
Figure 7-2: B2 Trends
These forecasted proportions are multiplied by New England data from AEO to derive Rhode Island specific fuel price and consumption data for the years from 2011 through 2035.
Further, consumption data is multiplied by emission factors to derive emissions. Price data for all years is converted into 2012 dollars by multiplying it by the ratio of the 2012 CPI and the respective year’s CPI. Also, prices are multiplied by consumption to derive expenditures. Where available, forecasted data for the year 2011 and 2012 for fuels is replaced by actual data from EIA.
For the commercial and industrial electricity sector, B1 was projected for the combined consumption of both sectors. This is based on an EIA recommendation to deal with the potential uncertainty in classification of industrial and commercial historical data, as both customer classes are difficult to break out due to similarities. Projected combined consumption was divided into individual sectors based on the forecast of historical Rhode Island sector contributions (Commercial Usage \ (Commercial Usage + Industrial Usage)) and (Industrial Usage / (Commercial Usage + Industrial Usage)).
Industrial sector natural gas consumption was projected directly based on the New England growth rate from EIA AEO and does not follow above mentioned methodology. This is due to unrealistic trends in historical data.
Policy Impacts Adjustment – Energy Efficiency Programs
For electric efficiency programs, residential, commercial and industrial sector electricity consumption is adjusted based on the percentage savings targets shown in the previous section. First, percentage cumulative savings are derived using percentage annual savings targets and measure life. As described above, half of the installed efficiency is taken off from percentage cumulative savings at the end of a measure’s life (11 years). Percentage cumulative savings are converted into cumulative savings (MWh) by

18
multiplying them by consumption in the year 2009 from EIA SEDS. Then the calculated cumulative savings are subtracted from baseline consumption (without efficiency) to derive consumption with efficiency each year.
The residential, commercial and industrial sector electricity Electric Efficiency Program Charge (EEPC) is adjusted to represent funding for the additional efficiency projected to be implemented in the years 2012 through 2035. Efficiency in the year 2011 is assumed to be the base efficiency. Annual savings are derived by multiplying their percentages by consumption in the year 2009. Additional efficiency savings are derived by subtracting annual savings in each year from base efficiency savings. Additional efficiency savings are further multiplied by the annual efficiency cost of $347/MWh to derive total additional efficiency cost per year. Then the derived cost is divided by the total of consumption with efficiency for the residential, commercial and industrial sectors to derive the electricity price adjustment in $/MWh due to additional efficiency. Another factor which causes an electricity price change is Demand Reduction Induced Price Effect (DRIPE). To derive the DRIPE benefits, all sectors’ total annual savings were multiplied by the DRIPE $/MWh-annual rate for each year over 12 years. This gives the DRIPE benefits due to each year’s annual savings, distributed over the period of 12 years. Total DRIPE benefits was evaluated for each year and divided by all sectors’ total consumption with efficiency in that year to derive the electricity price adjustment in $/MWh. Finally, the price adjustment due to additional efficiency cost was added and DRIPE was subtracted from the electricity price without efficiency to derive the electricity price with efficiency for each sector.
Reductions in fossil fuel use for electricity generation due to changes in demand are calculated based on ISO New England level data. This is based on the assumption that the generation mix of electricity consumed by Rhode Island is equal to the ISO NE generation mix and that the state’s demand reduction will impact generation in all New England states. For each year, total cumulative savings from all sectors are proportionately subtracted from coal, natural gas, residual fuel and distillate fuel based generation. First, the percentage of total generation was calculated for coal, natural gas, residual fuel and distillate fuel based power plants. Cumulative savings were distributed into reductions for each fuel based on their percentage of total generation. Finally, derived generation reductions were subtracted from generation without efficiency to derive generation with efficiency.
For natural gas efficiency programs, residential, commercial and industrial sector gas consumption is adjusted based on the percentage savings targets shown in the previous section. First, percentage cumulative savings are derived using percentage annual savings targets and measure life. As described above, half of the installed efficiency was taken off from percentage cumulative savings at the end of a measure’s life. Percentage cumulative savings are converted into cumulative savings (MMBTU) by multiplying them by consumption in the year 2009. Then the calculated cumulative savings are
subtracted from consumption without efficiency to derive consumption with efficiency each year.
The residential, commercial and industrial sector natural gas efficiency charge is adjusted to represent funding for additional efficiency projected to be implemented in the years 2012 through 2035. Efficiency in the year 2011 is assumed to be the base efficiency. Annual savings are derived by multiplying their percentages by consumption in the year 2009. Additional efficiency savings are derived by subtracting annual savings in each year from base efficiency savings. Additional efficiency savings are further multiplied by the annual efficiency cost of $37.83/MMBTU to derive total additional efficiency cost per year. Then the derived cost is divided by the total of consumption with efficiency for the residential, commercial and industrial sectors to derive the gas price adjustment in $/MMBTU due to additional efficiency. Finally, the derived price adjustment is added to the gas price without efficiency to derive the gas price with efficiency for each sector

19
Policy Impacts Adjustment – Regional Green House Gas Initiative
As previously stated, the impacts of the old RGGI cap were already included in the AEO results. The impacts due to the change in cap level were subtracted from electric power sector natural gas consumption without the policy to derive consumption with the policy. Changes in electricity prices for all sectors were evaluated similarly by subtracting impacts from prices without the policy to derive prices with the policy.
Policy Impacts Adjustment – The Rhode Island Petroleum Savings and Independence Advisory Commission proposed targets
These policy impacts were evaluated only for the RISEP BAU High Oil Price Forecast. The petroleum target for total consumption of fuels for year 2030 was found to be met. To calculate impacts at the year 2050 target, total petroleum fuels were forecasted from 2036 through 2050 using a linear trend. This trend line was used for forecasting based on steady trends in the preceding forecast years. Total required reductions to achieve year 2050 target were evaluated by subtracting consumption without the policy in the year 2050 with 50% of consumption in the year 2007. Required reductions were divided uniformly to calculate annual reductions from 2031 onwards to reach the target. Total petroleum fuels consumption with the policy each year from 2031 through 2035 was derived by subtracting the annual reduction from consumption without the policy as shown in the Figure 7-3 below:
Figure 7-3: Petroleum Fuels Consumption With and Without Voluntary Targets

20
8 Results
Electricity Sector - Consumption
For the base forecast, results show electricity consumption and associated carbon dioxide emissions following a downward trend that stabilizes in the later years. In the case of the Low Natural Gas Price forecast, consumption and emissions stay slightly higher than the base forecast and vice-versa for the High Natural Gas Price and Carbon Fee forecasts. This is due to the significant proportion of electric generation in the region that is fueled by natural gas, and its price variation affects electricity prices. Also, carbon fees will lead to higher electricity prices. Lower electricity prices lead to higher consumption and higher electricity prices lead to lower consumption. Figure 8-1 and Figure 8-2 below show total electricity consumption and emissions trends for the different forecasts:
Figure 8-1: Rhode Island Total Electricity Consumption

21
Figure 8-2: Rhode Island Electricity Consumption Sector Total Emissions
Expenditures due to electricity consumption for the base forecast are projected to follow a downward trend for most of the years with a slight upward trend in the later years. In the case of the Low Natural Gas Price forecast, expenditures stay lower than the base forecast and vice-versa for the High Natural Gas Price and Carbon Fee forecasts. As mentioned above, price variation of natural gas and carbon fees affect electricity prices and hence expenditures. Lower electricity prices lead to lower expenditures, and higher electricity prices lead to higher expenditures. Figure 8-3 shows total electricity expenditure trends for the different forecasts:

22
Figure 8-3: Rhode Island Electricity Consumption Sector Total Expenditure.
The following factors are causing observed trends in the sector:
Policy Impacts
Electric Efficiency Programs – Electric efficiency programs will cause an overall drop in
electricity consumption and expenditures in both the residential and commercial sectors due to
the projected improvements in insulation, heating equipment and other efficiency measures in
Rhode Island homes and businesses. Table 8-1 below shows total savings projected to be
achieved by efficiency in different sectors:
Table 8-1: Projected Electric Efficiency Total Savings
Figure 8-4 below shows total base case electricity consumption with and without efficiency:
Electric Efficiency Total Savings (GWH)
Year 2012 2020 2030
Residential 50 661 890
Commercial and Industrial Combined 80 1053 1418
Total 129 1714 2308

23
Figure 8-4: Rhode Island Electricity Consumption With and Without Efficiency Savings
Renewable Portfolio Standards (RPS) - The standard is leading to increases in clean renewable
generation in the ISO NE region, which is decreasing the system’s emissions factor and hence
Rhode Island emissions due to electricity consumption.
Table 8-2 and Table 8-3 below show consumption, emissions, price and, expenditure data for the sector:
Table 8-2: Rhode Island Base Case Electricity Consumption and Emissions
2010 2020 2030 2010 2020 2030
Residential 3,118 2,369 2,132 1,248,339 891,799 802,488
Commercial 3,693 3,222 3,034 1,478,549 1,212,960 1,142,038
Industrial 961 761 659 384,751 286,292 247,890
Transportation 27 19 29 10,810 7,333 11,038
All Sectors 7,799 6,371 5,853 3,122,448 2,398,384 2,203,456
Sector Consumption Sector
Consumption (GWH) Emissions (Metric Tons)
Electricity
Consumption

24
Table 8-3: Rhode Island Base Case Electricity Price and Expenditure
Figure 8-5 below shows the breakdown of electricity consumption by residential, commercial, transportation and industrial sector over the years for base forecast:
Figure 8-5: Rhode Island Electricity Consumption by Sector
2010 2020 2030 2010 2020 2030
Residential 16.77 16.79 18.31 523 398 390
Commercial 13.80 12.77 13.31 510 411 404
Industrial 12.44 11.06 10.90 120 84 72
Transportation 14.59 22.11 24.89 4 4 7
All Sectors 14.82 14.09 14.92 1,156 897 873
Sector Fuel Name
Price (2012Cents Per KWH) Expenditure (2012$ Millions)
Electricity
Consumption

25
Electricity Sector – Power Generation
Natural gas is the dominant fuel in the power sector in Rhode Island, comprising 97% of total generation in 2010. Fuel consumption and associated emissions in the Rhode Island power generation sector for the base forecast are projected to increase in future years. In the case of the Low Natural Gas Price forecast, consumption and emissions are higher than the base forecast and vice-versa for the High Natural Gas Price and Carbon Fee forecasts. As significant generation in the state is from natural gas, its price variation affects total generation. Carbon fees also increase fuel prices. Lower fuel prices lead to higher generation and higher prices lead to lower generation. Figure 8-6 and Figure 8-7 below show total power generation fuel consumption and emissions trends for the different forecasts:
Figure 8-6: Rhode Island Power Generation Sector Total Fuel Consumption

26
Figure 8-7: Rhode Island Power Generation Sector Total Emissions
The following factors are causing observed trends in the sector:
Policy Impacts
Regional Greenhouse Gas Initiative - The initiative will continue to encourage the region to
move towards cleaner generation. With new proposed natural gas power plant capacity coming
online in 2014-2015, Rhode Island is projected to increase its total generation in future years. See
Table 8-4 and Table 8-5 below for details.
Electric Efficiency Programs – The reduction in load caused by electric efficiency programs
leads to a reduction in total generation. This is reflected in the power generation projected fuels
consumption.
Renewable Portfolio Standard (RPS) – Rhode Island standards lead to an increase in renewable
generation in the New England region. The RPS may cause an increase in Rhode Island-based
renewable generation, which is not forecasted in the study. See Figure 8-8 below for details.

27
Market Impacts
Low projected natural gas prices in future years compared to other fuels will encourage an
increase in natural gas generation.
Tables 8-4 and 8-5 below show consumption, emissions, price and, expenditure data for the sector:
Table 8-4: Rhode Island Base Case Power Generation Fuel Consumption and Emissions:
Table 8-5: Rhode Island Base Case Power Generation Fuel Price and Expenditure:
Figure 8-8: New England Renewable Energy
2010 2020 2030 2010 2020 2030
Natural Gas 58,417 69,142 70,094 3,097,253 3,665,883 3,716,364
Distillate Fuel Oil 132 38 29 9,782 2,816 2,156
Residual Fuel Oil 12 2 0 910 146 0
Emissions (Metric Tons)
Electric Power
Generation
Sector Consumption Sector
Consumption (Billion BTUs)
2010 2020 2030 2010 2020 2030
Natural Gas 5.66 5.65 6.64 331 391 466
Distillate Fuel Oil 17.37 32.22 38.36 2 1 1
Electric Power
Generation
Sector Fuel Name
Price (2012$PerMMBTU) Expenditure (2012$ Millions)

28
A comparison of electricity consumption and generation emissions for Rhode Island shows opposite trends for most of the years (Figure 8-9). Increases in generation and associated emissions are driven by the projected low natural gas prices relative to other fuels. Also, the tighter Regional Greenhouse Gas Initiative (RGGI) cap will encourage increased natural gas generation relative to other fossil fuels because of its comparatively lower carbon intensity at the smokestack. Electricity consumption emissions are projected to drop due to efficiency impacts.
Figure 8-9: Rhode Island Electricity Consumption and Power Generation Emissions

29
Thermal Sector
The thermal sector comprises residential and commercial fuel consumption primarily for space and water heating purposes and industrial sector fuel consumption to generate process heat. The base case forecast shows that total projected fuel consumption and associated carbon dioxide emissions follow a slight downward trend. In the case of the Low Natural Gas and Oil Price forecasts, consumption and emissions stay higher than the base forecast, and vice-versa for the High Natural Gas Price and Carbon Fee forecasts. This is because natural gas and oil are the dominant fuels in the sector and lower prices lead to higher consumption, while higher prices lead to lower consumption. Figure 8-10 and Figure 8-11 below show thermal sector projected fuels total consumption and emissions trends for the different forecasts:
Figure 8-10: Rhode Island Thermal Sector Total Consumption

30
Figure 8-11: Rhode Island Thermal Sector Total Emissions
The total projected fuel expenditure for the base forecast follows a slight upward trend. In the case of the Low Natural Gas and Oil Price forecasts, expenditures stay lower than base forecast and vice-versa for the High Natural Gas and Carbon Fee forecasts. This is due to lower natural gas and oil prices leading to lower expenditures and higher prices leading to higher expenditures. Figure 8-12 below shows thermal sector projected fuels total expenditure trends for the different forecasts:

31
Figure 8-12: Rhode Island Thermal Sector Total Expenditure2
The following factors have significant contribution to the observed trends in the sector:
Market Impacts
Distillate fuel consumption for the residential sector is projected to decrease by approximately
34% between 2010 and 2030. This could be due to users opting for natural gas or other cheaper
alternatives, as distillate fuel prices are projected to increase over the years, and the difference
between the price of oil and gas is projected to increase. See Tables 8-7 and 8-8 below for details.
In 2010, natural gas is observed to represent around 74% of the total consumption in the
industrial sector. Most of the remaining consumption is of petroleum products. Natural gas
consumption in the industrial sector is projected to increase over the years due to the lower price
of gas relative to oil. See Tables 8-7 and 8-8 below for details.
Policy Impacts
Natural Gas Efficiency Programs - Natural gas efficiency programs will cause an overall drop in
natural gas consumption in the residential and commercial sectors due to the projected
2 Kerosene expenditure is not included in the total as price data is unavailable.

32
improvements in insulation, heating equipment and other efficiency measures in Rhode Island
homes and businesses. Table 8-6 shows total savings projected to be achieved by efficiency in
different sectors:
Table 8-6: Projected Natural Gas Efficiency Total Savings:
Figure 8-13 below shows base case natural gas consumption with and without efficiency:
Figure 8-13: Residential, Commercial and Industrial Sector Natural Gas Consumption With and
Without Efficiency Savings
Table 8-7 and Table 8-8 below show consumption, emissions, price, and expenditure data for the sector:
Natural Gas Efficiency Total Savings (MMCF)
Year 2012 2020 2030
Residential 107 1499 1998
Commercial 64 897 1196
Industrial 46 647 863
Total 217 3044 4058

33
Table 8-7: Rhode Island Base Case Thermal Sector Fuels Consumption and Emissions:
Table 8-8: Rhode Island Base Case Thermal Sector Fuels Price and Expenditure:
Figure 8-14 below shows natural gas and distillate fuel consumption in Rhode Island buildings (residential and commercial sectors):
2010 2020 2030 2010 2020 2030
Distillate Fuel Oil Million Gallons 125 101 83 1,301,496 1,052,123 864,069
Kerosene Million Gallons 1 0 0 7,595 3,284 2,256
Propane Million Gallons 8 6 4 44,620 32,224 19,981
Natural Gas Million Cubic Feet 16,859 13,530 10,900 918,890 737,472 594,111
Distillate Fuel Oil Million Gallons 29 35 34 307,298 363,092 358,607
Kerosene Million Gallons 0 0 0 226 145 62
Propane Million Gallons 4 3 2 19,790 15,524 13,777
Natural Gas Million Cubic Feet 10,407 10,047 8,902 567,208 547,581 485,189
Residual Fuel Oil Million Gallons 3 4 2 35,453 40,557 17,696
Distillate Fuel Oil Million Gallons 6 7 7 66,008 78,078 78,289
Propane Million Gallons 3 2 0 15,918 8,417 2,549
Natural Gas Million Cubic Feet 7,994 8,908 10,558 435,718 485,524 575,477
Residual Fuel Oil Million Gallons 5 7 8 48,776 74,791 81,196
Gasoline Million Gallons 8 13 16 66,358 113,433 143,647
Consumption
Physical Unit
Consumption (Physical Unit)
Fuel NameSector
Residential
Commercial
Industrial
Emissions (Metric Tons)
2010 2020 2030 2010 2020 2030
Distillate Fuel Oil 23.77 27.78 32.28 418 395 376
Kerosene 26.64
Propane 38.32 33.94 37.27 28 18 12
Natural Gas 16.96 15.20 16.68 294 211 187
Distillate Fuel Oil 20.61 27.28 31.81 85 134 154
Kerosene 26.64
Propane 24.08 21.41 24.50 8 5 5
Natural Gas 14.89 12.42 13.30 159 128 122
Residual Fuel Oil 14.92 16.05 20.15 7 9 5
Distillate Fuel Oil 20.78 26.96 31.47 19 28 33
Propane 28.47 21.12 24.36 7 3 1
Natural Gas 12.49 7.91 8.54 103 72 93
Residual Fuel Oil 14.92 16.43 20.63 10 17 23
Gasoline 24.00 29.60 32.48 23 48 66
Expenditure (2012$ Millions)Price (2012$PerMMBTU)
Fuel Name
Residential
Commercial
Industrial
Sector

34
Figure 8-14: Natural Gas and Distillate Fuel Consumption in Rhode Island Buildings
35
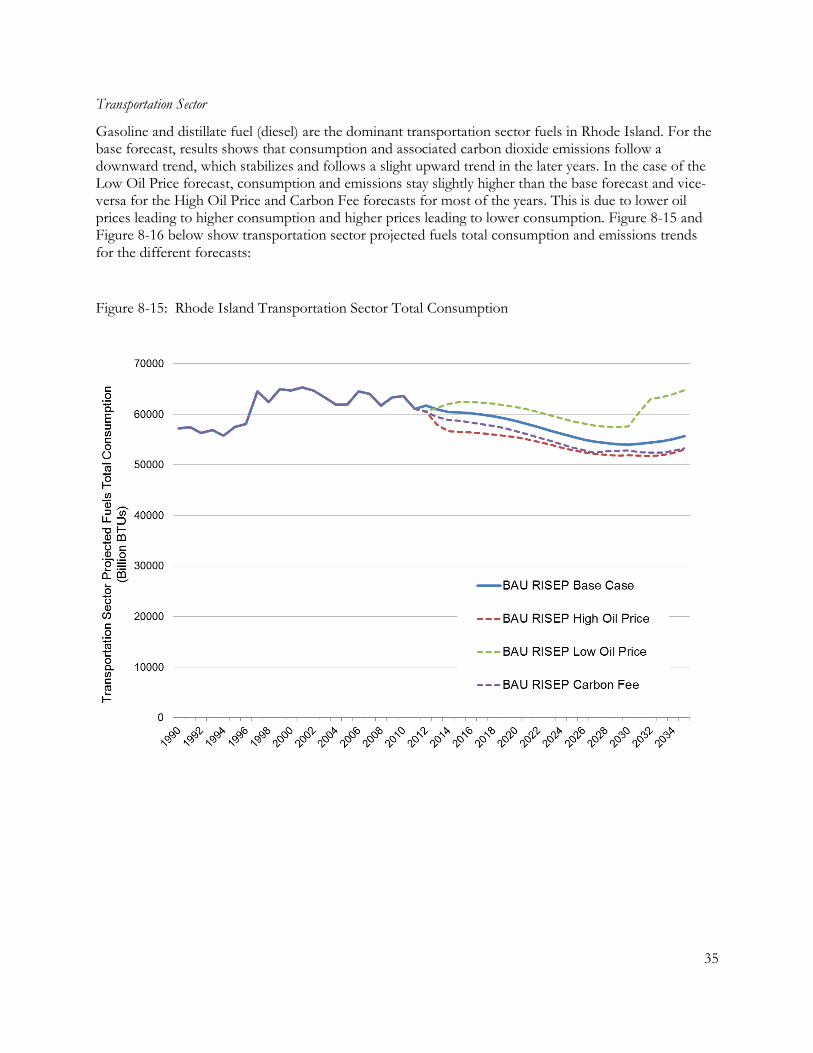
Transportation Sector
Gasoline and distillate fuel (diesel) are the dominant transportation sector fuels in Rhode Island. For the base forecast, results shows that consumption and associated carbon dioxide emissions follow a downward trend, which stabilizes and follows a slight upward trend in the later years. In the case of the Low Oil Price forecast, consumption and emissions stay slightly higher than the base forecast and vice-versa for the High Oil Price and Carbon Fee forecasts for most of the years. This is due to lower oil prices leading to higher consumption and higher prices leading to lower consumption. Figure 8-15 and Figure 8-16 below show transportation sector projected fuels total consumption and emissions trends for the different forecasts:
Figure 8-15: Rhode Island Transportation Sector Total Consumption

36
Figure 8-16: Rhode Island Transportation Sector Total Emissions
The total projected fuel expenditures for the base forecast are projected to decrease over the initial years and then follow an upward trend in later years. In the case of the Low Oil Price forecast, expenditures stays lower than the base forecast and vice-versa for the High Oil and Carbon Fee forecasts for most years. This is due to lower oil prices leading to lower expenditures and higher prices lead to greater expenditures. Figure 8-17 shows transportation sector projected fuels total expenditure trends for the
different forecasts:

37
Figure 8-17: Rhode Island Transportation Sector Total Expenditure3
The following factors make significant contributions to the observed trends in the sector:
Market Impacts
Natural gas consumption in the sector is observed to increase over the years due to gas
becoming cheaper compared to oil. Increased natural gas consumption in the sector leads to
increased expenditures. See Tables 8-9 and 8-10 below for details.
Distillate fuel (diesel) consumption is projected to increase at a steady rate, due to an increase in
demand, primarily from heavy duty vehicles. See Tables 8-9 and 8-10 below for details.
Policy Impacts
Greenhouse Gas Emissions and Fuel Economy Standards – This federal standard on light duty vehicles for model years 2017 through 2025 will cause a significant decrease in gasoline consumption. This is confirmed by comparing the gasoline consumption forecast for AEO 2012 reference case (which does not include CAFE impacts) with fuel’s consumption forecast for AEO 2013 reference case used in our projection. The AEO 2012 reference case gives higher gasoline consumption compared to the latter. A
3 Fuel Ethanol (E85) expenditure is not included in the total as price data is unavailable.

38
major portion of that difference is assumed to be due to improvement in vehicle’s fuel economy as a result of the CAFE standards.
Table 8-9 and Table 8-10 below show consumption, emissions, price, and expenditure data for the
sector:
Table 8-9: Rhode Island Base Case Transportation Sector Fuels Consumption and Emissions:
Table 8-10: Rhode Island Base Case Transportation Sector Fuels Price and Expenditure:
The figure below shows gasoline and distillate fuel (diesel) consumption in the Rhode Island transportation sector:
2010 2020 2030 2010 2020 2030
Distillate Fuel Oil Million Gallons 68 84 87 710,533 877,782 909,822
Jet Fuel Million Gallons 27 32 32 261,509 310,327 315,248
Propane Million Gallons 0.38 1.22 1.15 2,151 6,805 6,444
Motor Gasoline
currently E10
Million Gallons 385 324 267 3,379,759 2,843,646 2,345,232
Natural Gas Million Cubic Feet 1,558 1,715 3,588 84,938 93,461 195,537
Residual Fuel Oil Million Gallons 4 1 1 45,519 9,723 9,502
Fuel Ethanol E85 Million GEG 0.06 0.07 0.08 532 642 667
Sector Fuel Name
Consumption
Physical Unit
Consumption (Physical Unit) Emissions (Metric Tons)
Transportation
2010 2020 2030 2010 2020 2030
Distillate Fuel Oil 23.31 29.70 34.09 224 352 419
Jet Fuel 17.28 22.22 26.79 63 95 117
Propane 25.67 27.42 30.01 1 3 3
Motor Gasoline
currently E10 24.00 29.60 32.48 1,155 1,199 1,085
Natural Gas 12.06 21.32 21.06 19 38 78
Residual Fuel Oil 11.36 14.18 17.63 7 2 2
Expenditure (2012$ Millions)
Transportation
Sector Fuel Name
Price (2012$PerMMBTU)

39
Figure 8-18: Rhode Island Transportation Sector Gasoline and Distillate Fuel (Diesel) Consumption
9 Works Cited
i Comprehensive Energy Efficiency, Conservation, and Affordability Act of 2006, R.I.G.L. § 39-1-27.7, http://www.rilin.state.ri.us/Statutes/TITLE39/39-1/39-1-27.7.HTM. ii The Rhode Island Petroleum Savings and Independence Advisory Commission
http://webserver.rilin.state.ri.us/Statutes/TITLE42/42-140.4/42-140.4-1.HTM
iii EIA AEO 2012 Assumption Document:
http://www.eia.gov/forecasts/aeo/assumptions/pdf/0554(2012).pdf
iv, AEO 2012: http://www.eia.gov/forecasts/aeo/assumptions/index.cfm v AEO 2013 changes from AEO 2012: http://www.eia.gov/forecasts/aeo/legs_regs_all.cfm#intro vi Comprehensive Energy Efficiency, Conservation, and Affordability Act of 2006, R.I.G.L. § 39-1-27.7, http://www.rilin.state.ri.us/Statutes/TITLE39/39-1/39-1-27.7.HTM. vii http://www.rggi.org/design/program_review/materials-by-date viii The Rhode Island Petroleum Savings and Independence Advisory Commission
http://webserver.rilin.state.ri.us/Statutes/TITLE42/42-140.4/42-140.4-1.HTM
ix ftp://ftp.bls.gov/pub/special.requests/cpi/cpiai.txt x http://www.epa.gov/climateleadership/documents/emission-factors.pdf xi Rhode Island Public Utilities Commission Docket 4202, Electric and Natural Gas Least Cost Procurement Savings Targets for 2012-2014, http://www.ripuc.org/eventsactions/docket/4202-EERMC-EST-Filing(9-1-10).pdf xii Based on KEMA RI Energy Efficiency Opportunity Report http://www.ripuc.org/eventsactions/docket/4202-EERMC-EST-KEMARept.pdf xiii Based on VEIC Optimal Consultant Team RI Gas Opportunity Report http://www.rieermc.ri.gov/documents/RI%20Gas%20Opportunity%20Report%202012.pdf xiv National Grid Electric and Gas Energy Efficiency Programs Year End Reports http://www.nationalgridus.com/EnergyEfficiencyReports.as xv National Grid Electric and Gas Energy Efficiency Programs Year End Reports http://www.nationalgridus.com/EnergyEfficiencyReports.as xvi Rhode Island Public Utilities Commission, Docket No. 4366, National Grid’s 2013 Energy Efficiency Program Plan for Rhode Island. Available from: http://www.ripuc.org/eventsactions/docket/4366-NGrid-2013EEPP(11-2-12).pdf
For Further Information: Varun Kumar, Policy and Data Analyst, ENE-CLEAN Center, 860-246-7121, [email protected] Jamie Howland, Director, ENE-CLEAN Center, 860-246-7121, [email protected]
8 Summer Street, PO Box 583, Rockport, ME 04856 / (207) 236-6470 / Boston, MA / Providence, RI / Hartford, CT / Ottawa, ON, Canada / [email protected] / www.env-ne.org / Daniel L. Sosland, Executive Director
ENE is a nonprofit research and advocacy organization focusing on the Northeastern United States and Eastern Canada. Our mission is to address
large-scale environmental challenges that threaten regional ecosystems, human health, or the management of significant natural resources. We use policy analysis, collaborative problem solving, and advocacy to advance the environmental and economic sustainability of the region.