Embed Size (px)
Citation preview

Rhode Island Department of Transportation
Quarterly Report
January – March 2016
April 29, 2016

2
Statutory Reporting Requirements
The RhodeWorks plan to repair roads and bridges was approved by the Rhode Island General Assembly and
signed into law by Governor Gina M. Raimondo on February 11, 2016. The legislation (2016-H 7409Aaa, 2016-S 2246Aaa) creates a funding source that will allow the Rhode Island Department of Transportation (RIDOT) to repair more than 150 structurally deficient bridges and make repairs to another 500 bridges to prevent them from becoming deficient, bringing 90 percent of the state’s bridges into structural sufficiency by 2024. Incorporated into the new legislation are the following reporting requirements:
RIGL 42-13.1-16. Reporting. -- The department shall submit to the office of management and budget, the house fiscal advisor, and the senate fiscal advisor, a report on the progress of implementation of this chapter within thirty (30) days of the close of each of the fiscal quarters of each year. The reports shall also be posted on the department’s website. The reports shall include, at a minimum:
(1) Construction and design contracts of five hundred thousand dollars ($500,000) or greater planned to be advertised in the upcoming federal fiscal year, their value and expected award date;
(2) Construction and design contracts of five hundred thousand dollars ($500,000) or greater awarded in the prior federal fiscal year, date of award, value, and expected substantial completion date;
(3) Expected final cost of:
(i) Any construction contracts of five hundred thousand dollars ($500,000) or greater that reached substantial completion in the prior federal fiscal year; and
(ii) Any design contracts of five hundred thousand dollars ($500,000) or greater completed in the prior federal fiscal year; and
(4) Total number of workers employed through the contract and the number of the workers in that total with a Rhode Island address.

3
April 29, 2016
Sharon Reynolds Ferland Stephen Whitney Jonathan Womer House Fiscal Advisor Senate Fiscal Advisor Office of Management & Budget 82 Smith Street 82 Smith Street One Capitol Hill Providence, RI Providence, RI Providence, RI Dear Ms. Reynolds Ferland, Messrs. Whitney and Womer:
Rhode Island’s bridges are ranked the worst in the country – 50th out of 50 states. When the RhodeWorks legislation was signed into law this February, we were given a sustainable source of funding to tackle this challenge and a tremendous responsibility to do it right. We recognize that in order to rebuild Rhode Island’s crumbling infrastructure, we first need to rebuild RIDOT. We need a new way of doing business – we need to be more open, accountable, and innovative.
This first quarterly progress report under the RhodeWorks legislation is an important part of that process and a huge first step toward earning the public’s trust in our Department. In addition to the legislative requirements detailing design and construction contracts greater than $500,000, we have included useful information to allow you and the general public to track our progress and performance. To that end, this report provides budgets and schedules for every current RIDOT project. We have also included progress reports for bridge sufficiency, pavement condition, and of course, safety.
As you’ll see in this report, RIDOT is moving swiftly to implement the RhodeWorks legislation, put shovels in the ground, and get Rhode Islanders back to work repairing our bridges. Between March and September of 2016, RIDOT will advertise twice as many bridge projects as we could have without the additional funding provided by RhodeWorks. In fact, federal fiscal year 2017 will have the largest program since the federal stimulus in 2009. At the same time, we are also working tirelessly to transform the department to more effectively and efficiently manage and deliver projects on time and on budget. We have implemented a project management system so that there is a single point of accountability at all stages of a project, and we are placing an increased focus on maintenance.
Moving forward, we will continue to add to this report with details to track Physical Alternation Permits, performance in transit operations, our progress in addressing stormwater issues, and other performance measures. We will also work to add an interactive website that will allow Rhode Islanders to look up projects in our 10-Year Plan by type and by location.
As I’ve previously stated in my RhodeWorks testimony, I welcome the transparency provided by this reporting because it will enable you and all Rhode Islanders to hold RIDOT accountable. My commitment to you as Director is that there will be no more empty promises, no more wasting money on designing projects that have no money to construct, no more passing the buck. I look forward to continuing to work together to ensure the successful implementation of the RhodeWorks legislation.
Sincerely,
Peter Alviti Jr., P.E.

4

5
Table of Contents
Key Accomplishments Key Accomplishments…………………………………………………………………………………………….…………………………………………7 Statutory Requirements Statutory Requirements…………………………………………………………………………………………………………………………………..11
Operations Bridge Condition…………………..………………………… ............................................................................................. ……26 Personnel and Organizational Structure ............................................................................................................... 28 Maintenance and Winter Operations ................................................................................................................... 30 Safety .................................................................................................................................................................... 32 Projects Project Overview ................................................................................................................................................... 36 Project Performance ............................................................................................................................................. 38 Special Projects ..................................................................................................................................................... 40 Resolving Legacy Issues ......................................................................................................................................... 43 Financials Expenditures ........................................................................................................................................................ 46 Construction Contract Awards .............................................................................................................................. 50
Appendices
Appendix A: Project Budgets and Schedules ..................................................................................................... AA1
Appendix B: FFY 2015 DBE & Construction Sector Employment ...................................................................... AB1
Appendix C: Glossary......................................................................................................................................... AC1

6

7
Key
Accomplishments

8
Key Accomplishments RhodeWorks Implementation
RhodeWorks Legislation – After significant public discourse, the RhodeWorks legislation passed the General Assembly in February by an overwhelming majority. With $300 million in new bonding authority, $120 million in GARVEE refinancing and the authorization for ongoing funding from tractor trailer tolling, RhodeWorks represents the largest legislative change in transportation funding in the history of Rhode Island. The day after RhodeWorks passed, we moved quickly to advertise contracts for the implementation of tractor trailer tolling.
10 Year Plan – With the passage of RhodeWorks, RIDOT was able to finalize its recommendations for Rhode Island’s first 10 Year Transportation Plan. Since the quarter closed, the State Planning Council has approved RIDOT’s 10 Year Plan for public comment. The state is poised to become the third in the nation to adopt a constrained 10 Year Statewide Transportation Improvement Plan.
Construction Project Pipeline – This past quarter, RIDOT solicited bids for $33.8 million in new construction contracts and the Department is on track to advertise more than $140 million in new contracts this federal fiscal year – including an increase of nearly $50 million as a result of the RhodeWorks legislation. Next year, RIDOT anticipates more than $210 million in contracts – the highest level of construction awards since the Federal American Recovery and Reinvestment Act of 2009.
6/10 Interchange Reconstruction – RIDOT began modifying the design of the 6/10 Interchange Reconstruction project to reflect stakeholder input over the last several months. In February, the Federal Government announced the availability of discretionary funding for projects of regional and national significance. Thanks to the $400 million in funding made available for the 6/10 project in RhodeWorks, RIDOT was well positioned in this competitive federal grant award process. RIDOT moved quickly to submit an application by April 14th. RIDOT expects the federal government will make announcements of awards by the fall.
GARVEE Refinancing – Working with the Department of Administration, the Treasurer’s Office and the Department of Commerce, RIDOT continued to advance the refinancing of existing GARVEE debt service. The refinancing is expected to be completed in June.
RIDOT Reorganization & Project Management Implementation
Reorganization – RIDOT continued to implement the largest reorganization in its history, moving to a best-practice project management structure. Existing staff were assigned to many of the new roles in an acting capacity as the positions were posted in a nationwide search. More than 850 applications were received from throughout the country. RIDOT will be announcing key new appointments shortly.
Project Management – Beyond the reorganization, RIDOT made significant progress in implementing a new Project Management approach. New training classes were developed and more than 100 employees were trained in January and February. RIDOT also advertised for task order engineering contracts, an industry best practice that speeds procurement while enhancing competition. While Project Management is a standard best practice in the private sector, less than half of the state DOTs in the country have adopted a Project Management approach.
Expanding Maintenance – RIDOT maintenance crews expanded by 33 new employees as the department continues to on-board a total of 40 new maintenance employees. These 40 new positions were created by repurposing funded vacant administrative positions. Our Maintenance Department also took delivery of 13 new trucks.

9
Key Accomplishments Transit Improvements
Public-Private Partnerships – Working with the Department of Commerce and the Division of Capital Asset Management & Maintenance in the Department of Administration, RIDOT continues to advance a public-private partnership for the new transit hub at Providence Station. This past quarter, RIDOT conducted stakeholder outreach and began industry review. Public solicitation on the project is expected to be advertised in June. RIDOT also continued to advance the new I95 Welcome Center in Hopkinton, which was awarded a $9 million federal TIGER grant last fall. This project is expected to be advertised this summer.
Pawtucket/Central Falls Station – RIDOT worked on the application for the construction of a new Pawtucket/Central Falls Train Station under the federal TIGER program. The RhodeWorks legislation made $80 million additional transit funding available over the next 10 years, enabling strong local match for the TIGER grant. The application for the $40 million project was submitted at the end of April. Again, RIDOT expects the federal government will announce awards by the fall.
Economic Development Drivers– RIDOT worked closely with the I-195 Redevelopment Commission to accelerate the Providence Pedestrian Bridge project. RIDOT received its Coastal Resources Management Council (CRMC) permit and expects to solicit bids for construction by this summer.
Improved Operations
Safety – Working with the State Police and the Rhode Island Department of Health, RIDOT continued its efforts to make our roadways safer. This past quarter, RIDOT deployed its new “BATmobile” mobile Blood Alcohol Testing facility for St. Patrick Day parades throughout the state.
Civil Rights – In the area of Civil Rights, RIDOT made significant progress this quarter. RIDOT’s Title VI Plan, which is required under the Civil Rights Act of 1964, received a complete rewrite. The updated plan was approved by the Federal Highway Administration (FHWA) on 1/29/2016. RIDOT also rewrote its Americans with Disabilities Act (ADA) Transition Plan. FHWA approved the draft transition plan for public comment as part of the Statewide Transportation Improvement Plan process currently underway.
Potholes – The steps the department has taken to address potholes are bearing fruit. Our Maintenance Department made use of new “pothole killer” direct injection technology for the first time this winter. Thanks to those efforts and the focus last summer on key pothole problem areas, pothole claims are down more than 70% as compared to the five year average. Importantly, the severity of this winter season was average as compared to the past five years.
Quarterly Report – Finally, during the quarter RIDOT developed its first RhodeWorks quarterly report. Over 120 project budgets and schedules were analyzed for inclusion in the report. New systems were put in place to facilitate the comparison of budgets to actuals as well as track expenditures consistent with the new organization.

10

11
Statutory
Requirements

CONSTRUCTION FFY15 COMPLETE
CONSTRUCTION CONTRACTS AT SUBSTANTIAL COMPLETION IN FFY 2015 (Oct. 1, 2014 ‐ Sep. 30, 2015)
Construction Contract (Project Name)Completion Date
(Mon‐Year)
Expected Final Contract Cost
($M)
Number of
Workers
Number of RI
Workers
% Share w/ RI
Residence
FFY 2015 1st Quarter ‐ October 1‐December 31, 2014Statewide Pavement Striping ‐ East Bay Oct‐14 2.0$ 18 10 56%Traffic Safety Improvements to Plainfield Pike at Interstate I‐295 (HSIP Funds)
Oct‐14 0.8$ 13 13 100%
Reconstruction of Two Mile Corner ‐ Stormwater Management Facility
Oct‐14 0.8$ N/A N/A N/A
I‐295 Safety & Bridge C‐3B, Bridge 750 Oct‐14 13.6$ 381 182 48%Relocated Rt. 403 Phase 2 Landscape C‐4 Nov‐14 0.6$ N/A N/A N/A
High Risk Rural Roads Safety Improvements (HRRR/HSIP) Nov‐14 1.4$ 5 4 80%
Kent Dam Spillway Bridge No. 84 & Scituate Ave 1R Nov‐14 2.8$ 92 36 39%Barton Corner Bridge No. 518 Nov‐14 9.7$ 114 82 72%Trestle Trail ‐ East Section Nov‐14 8.0$ 130 93 72%South County Bike Path Maint & Signing Contract Nov‐14 0.5$ 28 24 86%High Priority Limited Resurfacing of I‐95 Nov‐14 2.0$ 10 10 100%2014 HSIP Near‐Term Improvements ‐ Contract 1 Nov‐14 2.6$ 112 62 55%
Highway Safety Improvement Program (HSIP) ‐Contract 4‐ Central Dec‐14 2.4$ 33 22 67%
Replacement of Warren Ave Ramp Br. No. 465 Dec‐14 3.0$ 40 16 40%Type 2 Emergency Repair to Wampanoag Trail Bridge No. 477 Dec‐14 0.5$ 56 41 73%
1R Improvements to Elmwood Avenue (C‐3) Dec‐14 5.6$ 132 95 72%Subtotal 56.3$ 1,164 690 59%
FFY 2015 2nd Quarter ‐ January 1‐March 31, 2015Dean Street and Cahir Street Lighting Improvements Jan‐15 0.5$ 13 13 100%Statewide Fence Replacement and Repair 2011 Mar‐15 0.9$ 32 23 72%Subtotal 1.4$ 45 36 80%
FFY 2015 3rd Quarter ‐ April 1‐June 30, 20152013 Rubberized Asphalt Chip Sealing May‐15 2.0$ 44 20 45%Magnolia Bridge No. 503 Removal May‐15 5.7$ 206 110 53%Morgan Ave. Bridge No. 109901 May‐15 0.8$ N/A N/A N/AStatewide High Friction Surface Treatments May‐15 0.6$ 17 13 76%Contract 3 – State Traffic Commission May‐15 1.3$ 59 48 81%2014 HSIP ‐ Systemic Improvements (Wrong‐Way Driving Mitigation) (HSIP Funds)
May‐15 1.8$ 46 41 89%
Subtotal 12.2$ 372 232 62%
FFY 2015 4th Quarter July 1 ‐ September 30, 2015Ten Rod Road Bridge No. 591 Jul‐15 6.1$ N/A N/A N/AI‐195 Relocation ‐ Contract 14 (West side city streets ) Jul‐15 13.6$ 284 124 44%Concrete Beam Repairs to Kingston Station RR Bridge No. 372 Jul‐15 0.6$ 11 2 18%RI*STARS ‐ Aquidneck Island ‐ America's Cup Avenue and Memorial Boulevard Improvements
Jul‐15 2.8$ 75 50 67%
Downtown Intermodal Park Comfort Station Aug‐15 1.3$ N/A N/A N/AI‐195 Relocation ‐ Contract 15 (East side city streets) Aug‐15 8.6$ 173 106 61%RIPTA R‐LINE TRANSIT SIGNAL PRIORITY – BROAD STREET Aug‐15 0.8$ 22 18 82%Crack Sealing ‐ Limited Access, 2015 Sep‐15 0.2$ N/A N/A N/AImprovements to US Route 1 in Charlestown Sep‐15 4.9$ 48 35 73%Subtotal 38.9$ 613 335 55%
TOTAL 108.9$ 2,194 1,293 59%
STATUTORY REQUIREMENT: Expected final cost of Construction Contracts $500,000 or greater that reached substantial completion in the prior fiscal year, and the total number of workers employed through the contract and the number of workers in that total with a Rhode Island Address.
12

CONSTRUCTION FFY16 COMPLETE
Construction Contract (Project Name)Completion Date
(Mon‐Year)
Expected Final Contract Cost
(M$)
Number of
Workers
Number of RI
Workers
% Share w/ RI
Residence
FFY 2016 1st Quarter ‐ October 1 ‐ December 31, 2015Ocean Avenue 1R Improvements Oct‐15 0.7$ 84 34 40%Colt State Park Bike Path Connector Oct‐15 1.5$ 84 23 27%Mineral Spring Avenue 1R Improvements Nov‐15 3.9$ N/A N/A N/ANew River Road & Victory Highway 1R Improvements Nov‐15 2.0$ N/A N/A N/AJamestown‐Verrazzano Bridge 800 & Cove Bridge 495 Dec‐15 4.8$ N/A N/A N/ASubtotal 12.9$ 168 57 34%
FFY 2016 2nd Quarter ‐ January 1, 2016 ‐ March 31, 2016I95 LED Lighting ‐ Exits 1, 2, 4, 5, and Weigh Stations Feb‐16 2.6$ N/A N/A N/AStatewide DMS Installation Jan‐16 2.3$ N/A N/A N/ASubtotal 4.9$ ‐ ‐ ‐
TOTAL 17.8$ 168 57 34%
CONSTRUCTION CONTRACTS AT SUBSTANTIAL COMPLETION IN FFY 2016 YTD (Oct. 1, 2015 ‐ March 31, 2016)
STATUTORY REQUIREMENT: Expected final cost of Construction Contracts $500,000 or greater that reached substantial completion in the prior fiscal year, and the total number of workers employed through the contract and the number of workers in that total with a Rhode Island Address.
Note: With passage of RhodeWorks, RIDOT is increasing efforts to ensure contractor compliance with Rhode Island Jobs reporting requirements.
13

CONSTRUCTION FFY15 AWARDS
CONSTRUCTION CONTRACTS AWARDED IN FFY 2015 (Oct. 1, 2014 ‐ Sep. 30, 2015)
Construction Contract (Project Name)Award Date (Mon‐
Year) Value ($M)
Exp. Completion Date (Mon‐Year)
FFY 2015 1st Quarter ‐ October 1‐December 31, 2014RI*STARS ‐ Aquidneck Island ‐ Contract 2 Oct‐14 2.8$ CompletedProvidence Train Station Improvements Dec‐14 6.9$ Jun‐16RIPTA R‐LINE Transit Signal Priority – Broad St. Nov‐14 0.8$ CompletedKingston Station RR Bridge Dec‐14 0.6$ CompletedBridge Repairs & Preservation to West Elmwood Bridge #660 Oct‐14 2.1$ Jun‐16Improvements to Route 146A and Park Avenue Intersection Dec‐14 0.7$ CompletedSubtotal 13.9$
FFY 2015 2nd Quarter ‐ January 1‐March 31, 20151R Improvements to Mineral Spring Ave. Jan‐15 3.7$ CompletedColt State Park Bike Path Connector EARMARK Jan‐15 1.5$ CompletedImprovements to US Route 1 in Charlestown Jan‐15 5.0$ CompletedStatewide DMS Installation Feb‐15 2.3$ CompletedStatewide Fence Repair and Replacement 2015‐2016 Feb‐15 0.7$ Sep‐16ADA Rehab of Park & Ride Lots Feb‐15 0.9$ CompletedPier Cap Replacement ‐ Woodruff Ave Br. Mar‐15 5.6$ Jun‐17Broadway Streetscape Improvement Project Mar‐15 5.8$ May‐17Enhanced Roadside & Recessed Freeway Delineation Mar‐15 2.4$ Aug‐16Subtotal 28.0$
FFY 2015 3rd Quarter ‐ April 1‐June 30, 2015Shippee Bridge Apr‐15 2.2$ Sep‐162015‐16 Statewide Pavement Markings‐East Bay May‐15 2.3$ Oct‐16State Traffic Commission, C‐4 Jun‐15 1.6$ Oct‐162015‐16 Statewide Pavement Markings‐North May‐15 2.5$ CompletedWest Elmwood RR Bridge No. 660 (69G) Jun‐15 2.1$ Jun‐16Improvements to Route 4 Jun‐15 2.8$ Completed1R Improvements to Route 37 Jul‐15 6.0$ Jun‐16Rubberized Asphalt Chip Seal ‐ West Main Rd. Jun‐15 1.3$ Jul‐16Subtotal 20.8$
FFY 2015 4th Quarter July 1 ‐ September 30, 20151R Improvements to Dexter St. & Bridge 935 Jul‐15 3.9$ Sep‐16I‐95 Corridor Bridge Preservation & Resurfacing Jul‐15 10.4$ Dec‐16Improvements to US Route 1 in South Kingstown Jul‐15 1.9$ Jun‐16Crack Sealing ‐ Limited Access, 2015 Aug‐15 0.2$ CompletedPleasant Valley Parkway Bridge #777 Aug‐15 5.6$ Jul‐17Repairs to the East Ave. West Bridge Jul‐15 1.8$ Jun‐16Rubberized Asphalt Chip Seal Jul‐15 2.0$ Nov‐16Improvements to New River Rd. & Victory Highway Jul‐15 1.3$ Completed1R Improvements to Route 102 C‐3 Aug‐15 5.2$ Sep‐16Improvements to Old River Road (Lincoln) Aug‐15 2.4$ Jun‐16Paver Placed Elastomeric Surface Treatment Aug‐15 1.7$ Oct‐16Statewide Drainage Improvements 2013 – Tower Hill Road Aug‐15 0.6$ CompletedDBP C10 Repairs to Hamlet Ave Bridge #500 Sep‐15 2.2$ Jul‐17Glennbridge Avenue and South County Trail Bridge Repairs Contract 3 Aug‐15 6.2$ Dec‐162015 Statewide Resurfacing Program, Contract‐1 Aug‐15 4.1$ Nov‐16Improvements to Rte. 116 ‐ Knotty Oak Rd. Sep‐15 1.4$ Jul‐16E. Shore Expway & McCormick Bridge Sep‐15 14.0$ Jun‐17Route 24 and I‐295 Bridge Preservation 2015 Oct‐15 4.3$ Dec‐16Subtotal 69.1$
TOTAL 131.7$
STATUTORY REQUIREMENT: Construction contracts of $500,000 or greater awarded in the prior fiscal year, date of awards, value and expected substantial completion date.
14

CONSTRUCTION FFY16 AWARDEDCONSTRUCTION CONTRACTS AWARDED IN FFY 2016 as of March 31, 2016
Construction Contract (Project Name)Award Date (Mon‐Year)
Value ($M) Ant. Completion Date (Mon‐Year)
FFY 2016 1st Quarter ‐ October 1‐December 31, 2015State Traffic Commission Contract 5 ‐ North Oct‐15 1.2$ Aug‐16ADA Improvements to South/North Main Streets Nov‐15 7.3$ Jun‐18Coles Bridge No. 134 (66) Nov‐15 0.6$ Dec‐161R Improvements to Woonasquatucket Avenue Nov‐15 3.5$ Nov‐16Subtotal: 12.6$
FFY 2016 2nd Quarter ‐ January 1‐March 31, 2016Clarence L. Hussey Memorial Bridge #11 Jan‐16 1.7$ Jun‐17High Priority Repairs to Pawtuxet River Bridge ‐ North Feb‐16 0.6$ Jun‐161R Improvements to Route 107 Mar‐16 2.4$ Apr‐17Airport Connector & Route 2 Bridge Preservation Mar‐16 5.7$ Jun‐19Safety Improvements to Francis St. at Memorial Blvd. Mar‐16 1.8$ May‐17Subtotal: 12.1$
SUBTOTAL FFY 2016 YTD: 24.8$
PROJECTS PENDING AWARDReconstruction of Two Mile Corner Apr‐16 6.6$ Dec‐17Harbor Junction Bridge Apr‐16 3.4$ Oct‐18Statewide LED Retrofit Project N/A 3.7$ Dec‐16Pedestrian Enhancements to Coronado Rd. N/A 2.3$ May‐17State Traffic Commission, C‐6 ‐ East Bay/South N/A 0.9$ May‐17Signal Improvements to Mineral Spring Ave (HSIP) N/A 2.1$ Jan‐19Rubberized Asphalt Chip Sealing N/A 1.2$ May‐172016‐17 Statewide Pavement Markings‐Central N/A 2.3$ Nov‐172016 Paver Placed Elastomeric Surface Treatment N/A 0.6$ Oct‐16Subtotal: 13.2$
TOTAL YTD and Pending 37.9$
15

CONSTRUCTION FFY16 PLANNED ADVERTISED
Construction Contract (Project Name)Expected Award Date (Month‐
Year) Value ($M)
Route 107 1R Improvements Mar‐16 2.6$ Portsmouth Maintenance Facility Mar‐16 6.0$ Airport Connector & Route 2 Bridges (53C & 81B) Mar‐16 5.5$ Memorial Blvd. & Francis Street Improvements Mar‐16 1.6$ Subtotal 15.7$
Harbor Junction Bridge No. 131 (57E) Apr‐16 3.8$ Two Mile Corner Reconstruction Apr‐16 7.2$ Coronado Road Pedestrian Enhancements May‐16 2.0$ East Bay/South, C‐6 ‐ STC May‐16 0.9$ Mineral Spring Avenue HSIP Feb‐16 1.4$ Crack Sealing ‐ North & East, 2016 Jun‐16 0.3$ Crack Sealing ‐South & Central, 2016 Jun‐16 0.3$ Pawtucket Avenue Bridge No. 471 (57B) Jun‐16 6.8$ Tefft Hill Trail Bridge No. 592 (67T ‐ B) Jun‐16 5.8$ Paver Placed Elastomeric Surface Treatment 2016 Jun‐16 1.0$ Rubberized Asphalt Chip Seal 2016 Jun‐16 1.1$ Statewide Pavement Striping ‐ Central, 2016‐2017 Apr‐16 2.5$ Statewide Pavement Striping ‐ Limited Access, 2016‐2017 May‐16 1.5$ Statewide Pavement Striping ‐ South, 2016‐2017 Jun‐16 2.5$ High Street & Kingstown Road Improvements Jul‐16 4.6$ Providence ‐ Downtown Improvements, C‐3 Jun‐16 2.0$ Traffic Signal Optimization, C‐2 Jun‐16 1.3$ Subtotal 45.0$
Blackstone River Bikeway ‐ Segment 1A Jul‐16 1.3$ Bridge End Treatments ‐ HSIP Aug‐16 1.5$ Warwick ‐ HSIP Aug‐16 0.4$ Capron Road Bridge No. 792 (70A) Oct‐16 3.0$ Mussey Brook Bridge No. 380 (56C) Sep‐16 0.6$ Pawtucket Area Bridges (53B) Oct‐16 4.2$ Ramp EI Bridge No. 10813 (56A) Oct‐16 0.4$ RI‐LEAP Westerly (Federal) ‐ Improvements to Cross St. Sep‐16 0.5$ Subtotal 12.0$
Providence River Pedestrian Bridge Oct‐16 10.0$ Statewide Guardrail 2017‐2019 Oct‐16 2.5$ Carolina Bridges (57F) Nov‐16 3.9$ South County Freeway Bridge No. 686 (52A) Nov‐16 1.2$ Wood River & Holburton Bridges Nos. 261, 262 (58D) Dec‐16 2.4$ Statewide Fence 2017‐2019 Nov‐16 0.9$ Aquidneck Avenue Improvements ‐ Middletown & Tiverton Nov‐16 0.9$ Pedestrian and Intersection Safety Improvements ‐ STC Nov‐16 1.0$ Central Street Bridge No. 449 (70B) Dec‐16 6.3$ Newman Avenue Bridge No. 224 (57D) Jan‐17 3.0$ Old Sakonnet River Bridge Demolition Dec‐16 15.8$ Providence Area Bridges Nos. 1080, 1082 (56B) Jan‐17 1.3$ Slatersville Stone Arch Bridge No. 273 (70C) Jan‐17 5.0$ Washington Bridge North No. 700 (57A T ‐ J) Jan‐17 10.0$ Statewide Impact Attenuator 2017‐2019 Jan‐17 2.0$ Old Stone Bridge Tiverton Dec‐16 1.6$ Route 102 & Route 117 Improvements ‐ Roundabout Jan‐17 2.1$ Subtotal 69.9$
Total 142.5$
FFY 2016 4th Quarter ‐ July 1, 2016 ‐ September 30, 2016
CONSTRUCTION CONTRACTS PLANNED TO BE ADVERTISED IN FFY 2016 (Oct. 1, 2015 ‐ Sep. 30, 2016)
FFY 2016 1st Quarter ‐ October 1, 2015 ‐ December 31, 2015
FFY 2016 2nd Quarter ‐ January 1, 2016 ‐ March 31, 2016
FFY 2016 3rd Quarter ‐ April 1, 2016 ‐ June 30, 2016
16

CONSTRUCTION FFY17 PLANNED ADVERTISED
Construction Contract (Project Name)Expected Award Date (Month‐
Year) Value ($ M)
FFY 2017 1st Quarter ‐ October 1, 2016 ‐ December 31, 2016Big River Bridge No. 34 (57K) Feb‐17 1.5$ Metacom Avenue ‐ HSIP Jan‐17 2.7$ North ‐ Johnston, C‐3 ‐ HSIP Feb‐17 0.7$ I‐95 Corridor Preservation ‐ Bridge Washing (58C) Jan‐17 3.4$ I‐95 Resurfacing (Elmwood Avenue to Eddy St) Mar‐17 8.0$ Route 4 Improvements, C‐2 Mar‐17 5.5$ Statewide Resurfacing C‐2, 2017 Feb‐17 2.0$ Cumberland I‐295 Corridor Bridges (37T ‐ I) Apr‐17 6.0$ Gorton RR Bridge No. 841 (57L) Apr‐17 1.5$ Louisquisset Pike North Bridge, I‐295 over Route 146 (35T ‐ H) Mar‐17 3.0$ Oxford Street Bridge No. 653 (2T) Mar‐17 4.0$ Wood River Valley Bridge No. 404, I‐95 North & South (7T ‐ A) Apr‐17 6.8$ East Main Road 1R Improvements Apr‐17 5.4$ Subtotal 50.4$
FFY 2017 2nd Quarter ‐ January 1, 2017 ‐ March 31, 2017Central RI Bridges ‐ Group 12 (32 Bridges) May‐17 14.5$ Division Street Bridge No. 760 (58A) Apr‐17 5.0$ Park Avenue RR Bridge No. 922 (59A) May‐17 2.0$ Diamond Hill Road Improvements Apr‐17 0.9$ High Friction Surface Treatments 2016 Apr‐17 0.8$ Traffic Signal Optimization, C‐3, 2016 Apr‐17 1.0$ Victory Highway Bridge No. 589 (71) May‐17 7.5$ US Route 6 (Hartford Ave), C‐1 May‐17 6.0$ Route 146 Improvements Jun‐17 10.0$ South (Route 2 and Route 102 Roundabout) ‐ HSIP Jun‐17 2.5$ Subtotal 50.2$
Horton Farm Bridge No. 472 (57M) Jul‐17 10.5$ Coventry ‐ Local Safety Improvements Sep‐17 0.3$ Hope Valley Bridges (69D) Sep‐17 4.0$ Simmonsville Bridge No. 326 (57C) Sep‐17 0.5$ Route 24 Improvements Sep‐17 6.0$ High Street/Kingstown Road Stormwater Mitigation Oct‐17 0.4$ Subtotal 21.7$
Browning Mill Bridge No. 38 (57J) Oct‐17 0.9$ I‐95 Resurfacing, C‐2 (Pawtucket) Oct‐17 3.0$ Snell Road Improvements Oct‐17 0.8$ Woodville Road Improvements Oct‐17 3.5$ Farnum Pike Bridges Nos. 44101, 44121 (38T ‐ L) Jan‐17 9.0$ I‐95 North & South Bridges at Toll Gate Road Nos. 683, 684 (5T ‐ B2, C) Nov‐17 15.0$ Cranston ‐ Local Safety Improvements Dec‐17 0.3$ Pine Street Bridge No. 548 (31) Dec‐17 4.8$ I‐195 Corridor Bridges (77) Dec‐17 10.8$ I‐295 & Route 6 Bridges Nos. 730, 732, 736, 737, 757 (9T ‐ G, H) Dec‐17 25.0$ I‐295 North at Route 6 Bridge. 737 (69T ‐ H) Dec‐17 7.0$ I‐95 Corridor Bridge Nos. 56101, 56102, 56201, 56221 (3T ‐ F) Jan‐18 7.0$ Route 146 Corridor Bridges (38) Jan‐18 9.4$ Subtotal 96.5$
Total 218.7$
CONSTRUCTION CONTRACTS PLANNED TO BE ADVERTISED IN FFY 2017 (Oct. 1, 2016 ‐ Sep. 30, 2017)
FFY 2017 3rd Quarter ‐ April 1, 2017 ‐ June 30, 2017
FFY 2017 4th Quarter ‐ July 1, 2017 ‐ September 30, 2017
STATUTORY REQUIREMENT: Construction Contracts of $500,000 or greater planned to be advertised in the upcoming federal fiscal year, their value and expected award date.
17

DESIGN FFY15 COMPLETE
DESIGN CONTRACTS COMPLETED IN FFY 2015 (Oct. 1, 2014 ‐ Sep. 30, 2015)
Design Contract (Project Name)Completion Date
(Mon‐Year)Expected Final Cost ($M)
Number of Workers
Number of RI Workers
Bridge Rehab/Replace Program ‐ Group 7 Nov‐14 1.9$ N/A N/ASubtotal 1.9$
Allens Avenue Feb‐15 0.9$ N/A N/ABridge Rehab/Replace Program ‐ Group 9 Feb‐15 0.9$ N/A N/ATraffic Signal Warrant Analysis/Design (C‐3) Feb‐15 1.1$ N/A N/ASubtotal 2.9$
Enhancements, Maintenance & Technical Support Apr‐15 2.6$ N/A N/AArterial Analysis of Traffic Signal Systems (C‐3) Apr‐15 1.6$ N/A N/ATraffic Signal Warrant Analysis/Design (C‐1) East Bay Apr‐15 0.6$ N/A N/AArterial Traffic Control Systems ‐ Contract 3 Apr‐15 0.6$ N/A N/AConsultant Engineering Liaison Services Apr‐15 0.8$ N/A N/AReconst. Rte. 4 / US Route 1 Jun‐15 4.5$ N/A N/ASubtotal 10.7$
I‐295 Safety & Bridge Sep‐15 1.8$ N/A N/ASubtotal 1.8$
TOTAL 17.3$
Note: RIDOT does not currently collect full employment and payroll information from contractors and subcontractors on design contracts, as this was not a legislated requirement prior to RhodeWorks. As such, RIDOT does not currently have sufficient information about number of unique employees per project or employee state of residence. Going forward, RIDOT will amend contract agreements to include such information for all non‐lump sum based contracts. RIDOT is developing a methodology to capture this information in the future and we are providing the best information available to date.
STATUTORY REQUIREMENT: Expected final cost of Design Contracts of $500,000 or greater completed in the prior federal fiscal year, and the total number of workers employed through the contract and the number of workers in that total with a Rhode Island Address.
FFY 2015 4th Quarter ‐ July 1‐September 30, 2015
FFY 2015 1st Quarter ‐ October 1‐December 31, 2014
FFY 2015 2nd Quarter ‐ January 1‐March 31, 2015
FFY 2015 3rd Quarter ‐ April 1‐June 30, 2015
18

DESIGN FFY16 COMPLETEDESIGN CONTRACTS COMPLETED IN FFY 2016 YTD
Design Contract (Project Name)Completion Date
(Mon‐Year) Expected Final
Cost ($M) Number of Workers
Number of RI Workers
FFY 2016 1st Quarter ‐ October 1‐December 31, 2015Complete Design of Improvements to I‐295 Contract 1 Sep‐15 1.8$ N/A N/AReplacement of the Point Street Bridge #980; Providence Oct‐15 1.2$ N/A N/ARepairs to Cliff Walk from Memorial Boulevard to Bellevue Ave; Newport Nov‐15 0.8$ N/A N/A
Bridge Engineering Services (Statewide) Nov‐15 5.2$ N/A N/ABridge Rehabilitation/Replacement Program ‐ Group 2 Nov‐15 1.1$ N/A N/AImprovements to Route 10 from Union Ave Interchange to Park Ave Nov‐15 3.4$ N/A N/AReconstruction of Post Road from West Main Street to the QuonsetPoint/Davisville Entrance; No. Kingstown
Nov‐15 1.5$ N/A N/A
Rehabilitation of Barrington Bridge #123 and Warren Bridge #124;Barrington & Warren
Nov‐15 4.2$ N/A N/A
Bridge Rehabilitation/Replacement Program ‐ Group 8 Dec‐15 2.3$ N/A N/ALocation Study / Complete Design for the Warwick Bicycle NetworkProject ‐ Statewide
Dec‐15 1.9$ N/A N/A
Subtotal 23.5$
FFY 2016 2nd Quarter ‐ January 1‐March 31, 2016Aquidneck Island Passenger Rail Study; Newport to Tiverton Feb‐16 0.9$ N/A N/AWarren Bike Path AUTH 9/9/08 HPP‐0635(003) Mar‐16 1.2$ N/A N/A3R Improvements to Route 146; Providence, No. Smithfield Mar‐16 2.5$ N/A N/ASubtotal 4.6$
TOTAL 28.1$
19

DESIGN FFY15 AWARDED
DESIGN CONTRACTS AWARDED IN FFY 2015 (Oct. 1, 2014 ‐ Sep. 30 2015)
Design Contract (Project Name)Award Date (Mon‐Year)
Expected Final Cost ($M)
Ant. Completion Date (Mon‐Year)
FFY 2015 1st Quarter ‐ October 1‐December 31, 20142014‐EH‐036 – On‐Call ADA Consultant Services – C1 Dec‐14 0.8$ Dec‐192014‐EH‐037 – On‐Call ADA Consultant Services – C2 Dec‐14 0.8$ Dec‐192014‐EH‐038 – On‐Call ADA Consultant Services – C3 Dec‐14 0.8$ Dec‐19Subtotal 2.3$
FFY 2015 2nd Quarter ‐ January 1‐March 31, 20152015‐ET‐004 – Professional Consultant Services and ITS Tech support to RIDOT/TMC
Feb‐15 5.5$ Jan‐18
2015‐ET‐003 On‐Call Highway Safety Improvement Program (HSIP) Engineering Support Services
Mar‐15 1.0$ Mar‐20
Subtotal 6.5$
FFY 2015 3rd Quarter ‐ April 1‐June 30, 20152015‐EH‐038 – 2015 Pavement Preservation Program – CONTRACT 1 May‐15 1.9$ May‐202015‐EH‐039 – 2015 Pavement Preservation Program – CONTRACT 2 May‐15 2.2$ May‐202015‐EH‐040 – 2015 Pavement Preservation Program – CONTRACT 3 May‐15 1.1$ May‐202015‐EH‐041 – 2015 Pavement Preservation Program – CONTRACT 4 May‐15 1.5$ May‐20Subtotal 6.6$
FFY 2015 4th Quarter ‐ July 1‐September 30, 20152015‐ET‐017 –On‐Call Traffic Design Consultant‐C‐1 Jun‐15 0.5$ Jun‐202015‐ET‐017 –On‐Call Traffic Design Consultant‐C‐2 Jun‐15 0.5$ Jun‐202015‐OI‐042‐ On‐Call Transit Planning Consultant Aug‐15 0.6$ Dec‐16Subtotal 1.6$
TOTAL 17.0$
STATUTORY REQUIREMENT: Design contracts of $500,000 or greater awarded in the prior federal fiscal year, their value and expected substantial completion date.
20
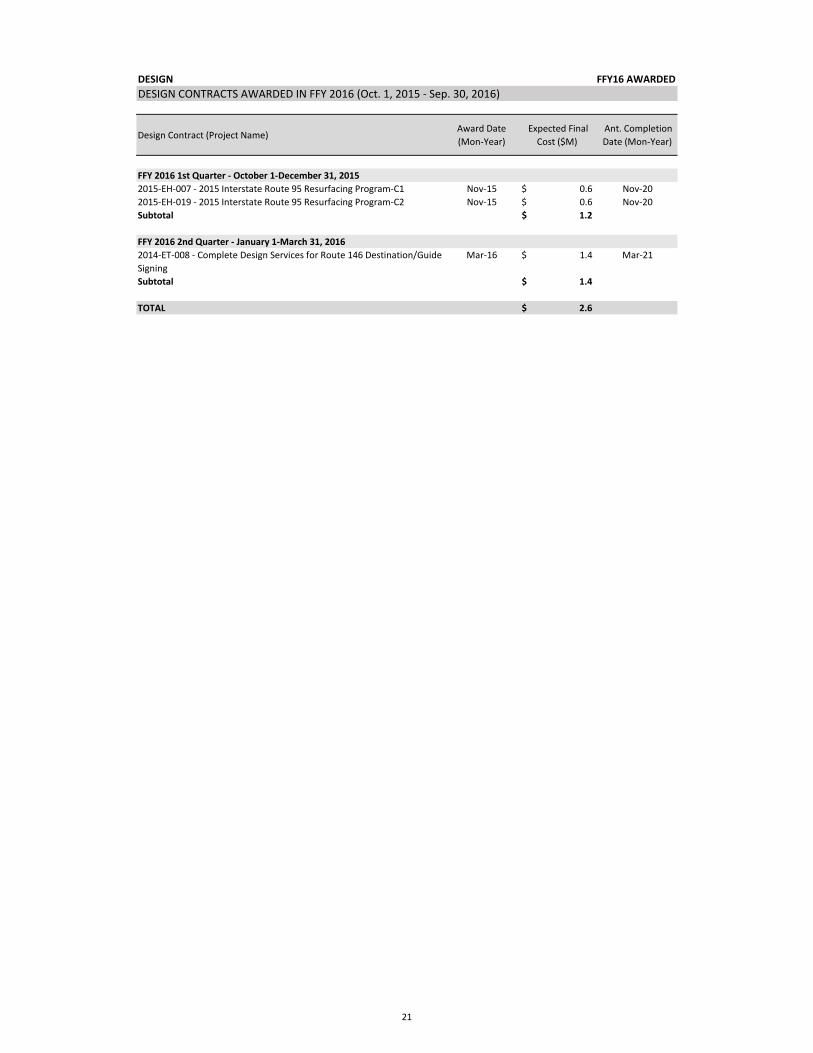
DESIGN FFY16 AWARDEDDESIGN CONTRACTS AWARDED IN FFY 2016 (Oct. 1, 2015 ‐ Sep. 30, 2016)
Design Contract (Project Name)Award Date (Mon‐Year)
Expected Final Cost ($M)
Ant. Completion Date (Mon‐Year)
FFY 2016 1st Quarter ‐ October 1‐December 31, 20152015‐EH‐007 ‐ 2015 Interstate Route 95 Resurfacing Program‐C1 Nov‐15 0.6$ Nov‐202015‐EH‐019 ‐ 2015 Interstate Route 95 Resurfacing Program‐C2 Nov‐15 0.6$ Nov‐20Subtotal 1.2$
FFY 2016 2nd Quarter ‐ January 1‐March 31, 20162014‐ET‐008 ‐ Complete Design Services for Route 146 Destination/Guide Signing
Mar‐16 1.4$ Mar‐21
Subtotal 1.4$
TOTAL 2.6$
21

DESIGN FFY16 ANTICIPATED AWARDS DESIGN CONTRACTS ANTICIPATED AWARDS FFY 2016 (Remaining) (April 1 ‐ Sep. 30, 2016)
Design Contract (Project Name)Expected Award Date (Mon‐Year)
Expected Final Cost ($M)
Ant. Completion Date (Mon‐Year)
FFY 2016 3rd Quarter ‐ April 1‐June 30, 2016Providence Station Transit Center Planning Project May‐16 0.7$ May‐17Bridge Engineering Services ‐ COMPLEX Jun‐16 10.0$ Jun‐21Bridge Engineering Services ‐ ROUTINE Jun‐16 8.0$ Jun‐21Bridge Engineering Services ‐ SIMPLE Jun‐16 6.0$ Jun‐21Facilities Design / Vertical Construction Services Jun‐16 5.0$ Jun‐21Highway Engineering Services ‐ IMPROVEMENTS Jun‐16 6.0$ Jun‐21Highway Engineering Services ‐ RESURFACING Jun‐16 6.0$ Jun‐21Route 6/10 Multimodal Corridor Improvement Project ‐ NEPA Jun‐16 1.0$ Jun‐17Route 6/10 Multimodal Corridor Improvement Project ‐ PE Jun‐16 3.0$ Jun‐18Stormwater Management Services ‐ MS4 & EPA Consent Decree Compliance Support
Jun‐16 2.5$ Jun‐21
Stormwater Management Services – Statewide Drainage Design Support Jun‐16 1.0$ Jun‐21Subtotal 49.2$
FFY 2016 4th Quarter ‐ July 1‐September 30, 2016On‐Call Design Consultant for the State Traffic Commission Sep‐16 0.5$ Sep‐21On‐Call Design Consultant for the State Traffic Commission Sep‐16 0.5$ Sep‐21Transit On‐Call Planning Assistance Sep‐16 0.5$ Sep‐18Subtotal 1.5$
TOTAL 50.7$
22

DESIGN FFY17 PLANNED
DESIGN CONTRACTS PLANNED TO BE ADVERTIZED IN FFY 2017 (Oct. 1, 2016 ‐ Sep. 30, 2017)
Design Contract (Project Name)Expected Award Date
(Mon‐Year)Expected Final Cost ($M)
FFY 2017 1st Quarter ‐ October 1‐December 31, 2016Pawtucket Station Design Dec‐16 3.0$ Subtotal 3.0$
TOTAL 3.0$
STATUTORY REQUIREMENT: Design contracts of $500,000 or greater planned to be advertised in the upcoming federal fiscal year, their value and expected award date.
Note: In an effort to accelerate project delivery, RIDOT has moved to task order contracts every other year. As a result, the number of anticipated design contracts for FFY 2017 is substantially reduced. FFY 2018 will see a new series of task order design contracts.
23

24

25
Operations

26
Bridge Condition
In 2015, Rhode Island’s bridges ranked 50th out of the 50 states – the worst bridges in America. As of March 31, 2016,
25% of Rhode Island bridge deck area was classified as structurally deficient. While the square footage of deck area
is used as a comparative value, it is also important to note that 243 of the 1,173 bridges in Rhode Island were
structurally deficient as of March 31, 2016.
The following chart details anticipated bridge condition through FFY 2025. As can be seen, RIDOT anticipates reaching
the federal minimum standard of 90% bridge sufficiency by 2025.
In order to accomplish this goal, RIDOT has outlined a schedule for advertising new bridge preservation and reconstruction
contracts for award over the next decade:
75%77% 76%
81%
86% 86% 87% 84%
90% 91%90% 90% 90% 90% 90% 90% 90% 90% 90% 90%
60%
65%
70%
75%
80%
85%
90%
95%
2016 2017 2018 2019 2020 2021 2022 2023 2024 2025
Rhode Island Bridge ConditionStructurally Sufficient Deck Area
RhodeWorks Plan Goal
Total
FFY Preservation Repair/Replace Preservation Repair/Replace Preservation Repair/Replace Bridges
2016 2 24 2 4 0 20 26
2017 32 53 - - 32 53 85
2018 84 27 - - 84 27 111
2019 104 5 - - 104 5 109
2020 38 7 - - 38 7 45
2021 36 10 - - 36 10 46
2022 3 9 - - 3 9 12
2023 129 27 - - 129 27 156
2024 44 1 - - 44 1 45
2025 0 18 - - 0 18 18
Totals 472 181 2 4 470 177 653
Advertise Schedule of Bridge Work
Planned to be Advertised Advertised to Date Remaining

27
Bridge Condition
RIDOT’s 10 Year Plan calls for increased expenditure on bridge preservation activities in addition to expenditures on
bridge reconstruction. As can be seen in the chart below, 11 bridges were removed from the structurally deficient
list in the last two quarters; however, 17 new bridges were also deemed structurally deficient after inspection. This
underscores the importance of not only repairing structurally deficient bridges, but also investing in preservation
projects to ensure those bridges that are not currently structurally deficient don’t fall into that category.
The Great Island bridge 049901 which passes over the TIDAL FLATS INLET in Narragansett was Replaced
The Tar Bridge bridge 051301 which passes over the WOONASQUATUCKET RIVER in Providence was Repaired
The Ten Rod Road NB bridge 059101 which passes over the RI 165 TEN ROD RD in Exeter was Replaced
The Ten Rod Road SB bridge 059121 which passes over the RI 165 TEN ROD RD in Exeter was Replaced
The Pettaconsett Ave bridge 061901 which passes over the JEFFERSON BLVD in Warwick was Repaired
The Huntington North bridge 066401 which passes over the I-95 NB & SB in Cranston was Repaired
The Huntington South bridge 066601 which passes over the I-95 NB & SB in Cranston was Repaired
The Wolf Spider bridge 123001 which passes over the Harris Brook in Smithfield was Replaced
The Wampanoag Trail bridge 047701 which passes over the RI 114 EAST SHORE EXPWY in East Providence was Repaired
The Atwells Ave Ramp West bridge 057701 which passes over the I-95 RAMP CA in Providence was Replaced
The Atwells Ave bridge 097501 which passes over the WOONASQUATUCKET RIVER in Providence was Repaired
Q2
Jan-Mar
2016
No Longer Structurally Deficient (Repaired, Replaced, or Removed) in FFY 2016
Q1
Oct-Dec
2015
The Meshanticut bridge 042201 which passes over the RI 5 OAKLAWN AV in Cranston
The Meshanticut Viaduct bridge 042301 which passes over the RI 5 OAKLAWN AV & LANE C in Cranston
The Wanskuck bridge 042801 which passes over the BRANCH AV in Providence
The Wampanoag Trail bridge 047701 which passes over the RI 114 EAST SHORE EXPWY in East Providence
The Ramp AD Civic Center bridge 057901 which passes over the AMTRAK,WOON RVR,RAMP BD in Providence
The Ramp DB Civic Center bridge 058301 which passes over the AMTRAK,CITY STS,WOON RVR in Providence
The Ramp B-EL bridge 066301 which passes over the WELLINGTON AV & AMTRAK in Cranston
The Huntington Viaduct bridge 066501 which passes over the I-95 NB & SB, AMTRAK in Cranston
The Church Street RR bridge 094301 which passes over the P&W RR in Cumberland
The Hammet Road bridge 123601 which passes over the FLAT RIVER in Coventry
The Esmond Mill bridge 124401 which passes over the Woonasquatucket River in Smithfield
The Lafayette RR bridge 024301 which passes over the AMTRAK in North Kingstown
The Purchase Street bridge 046801 which passes over the I-195 EB & WB in East Providence
The Airport bridge 077301 which passes over the US 1 POST RD in Warwick
The Rocky Hollow bridge 082701 which passes over the AMTRAK in East Greenwich
The Harris bridge 083601 which passes over the PAWTUXET RIVER N BRANCH in Coventry
The West River Street bridge 088301 which passes over the WEST RIVER in Providence
Q1
Oct-Dec
2015
Q2
Jan-Mar
2016
Bridges That Became Structurally Deficient in FFY 2016
28
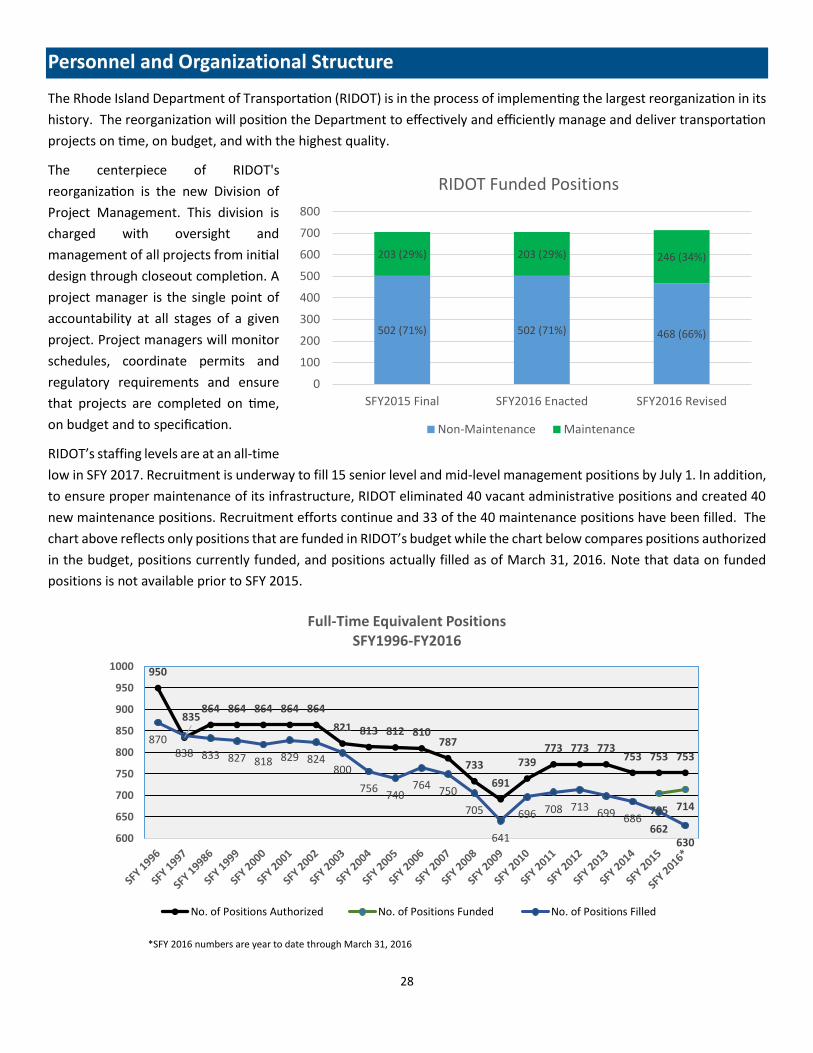
Personnel and Organizational Structure
The Rhode Island Department of Transportation (RIDOT) is in the process of implementing the largest reorganization in its
history. The reorganization will position the Department to effectively and efficiently manage and deliver transportation
projects on time, on budget, and with the highest quality.
The centerpiece of RIDOT's
reorganization is the new Division of
Project Management. This division is
charged with oversight and
management of all projects from initial
design through closeout completion. A
project manager is the single point of
accountability at all stages of a given
project. Project managers will monitor
schedules, coordinate permits and
regulatory requirements and ensure
that projects are completed on time,
on budget and to specification.
RIDOT’s staffing levels are at an all-time
low in SFY 2017. Recruitment is underway to fill 15 senior level and mid-level management positions by July 1. In addition,
to ensure proper maintenance of its infrastructure, RIDOT eliminated 40 vacant administrative positions and created 40
new maintenance positions. Recruitment efforts continue and 33 of the 40 maintenance positions have been filled. The
chart above reflects only positions that are funded in RIDOT’s budget while the chart below compares positions authorized
in the budget, positions currently funded, and positions actually filled as of March 31, 2016. Note that data on funded
positions is not available prior to SFY 2015.
950
835864 864 864 864 864
821 813 812 810787
733
691
739773 773 773
753 753 753
705 714
870838 833 827 818 829 824
800
756740
764750
705
641
696 708 713699 686
662630600
650
700
750
800
850
900
950
1000
Full-Time Equivalent PositionsSFY1996-FY2016
No. of Positions Authorized No. of Positions Funded No. of Positions Filled
502 (71%) 502 (71%) 468 (66%)
203 (29%) 203 (29%) 246 (34%)
0
100
200
300
400
500
600
700
800
SFY2015 Final SFY2016 Enacted SFY2016 Revised
RIDOT Funded Positions
Non-Maintenance Maintenance
*SFY 2016 numbers are year to date through March 31, 2016

29
Personnel and Organizational Structure

30
Maintenance and Winter Operations
The 2016 Season was close to average with 14 winter storms as of March 31, 2016. RIDOT had over 90% of its heavy plow
truck fleet operational for each storm and added 13 new plow trucks to its heavy winter fleet which helped keep the fleet
reliability number up. RIDOT’s salt stockpiles were very well stocked prior to the first snowfall and were kept adequately
filled for treating the roadways during the winter season. RIDOT added a 20,000 ton strategic salt reserve to its winter
operations plan for the first time this winter. That stockpile remained untouched this season and is available for the start
of next winter season.
Storm # Start Date Storm HoursSnowfall
(Inches)Salt (Tons)
Number of
RIDOT Heavy
Plow Trucks
in Fleet
Number of
RIDOT Heavy
Plow Trucks
Snow Ready
Percent (%)
RIDOT Heavy
Plow Trucks
Snow Ready
1 12/29/2015 11 1.0 4,776 106 98 92%
2 1/4/2016 13 0.5 1,466 106 93 88%
3 1/12/2016 8 1.0 3,371 106 98 92%
4 1/17/2016 15 2.0 8,767 106 98 92%
5 1/23/2016 25 15.5 14,223 109 108 99%
6 1/29/2016 12 0.0 649 109 105 96%
7 2/5/2016 19 7.5 12,884 109 107 98%
8 2/8/2016 30 6.0 17,758 110 103 94%
9 2/10/2016 12.5 1.0 1,252 110 106 96%
10 2/15/2016 16 1.0 6,870 110 101 92%
11 2/17/2016 4 1.0 414 110 101 92%
12 2/23/2016 16 1.0 3,116 110 102 93%
13 3/4/2016 6 1.0 164 110 103 94%
14 3/20/2016 20 4.5 6,785 110 101 92%
FY2016 Winter Operations Summary
49
19
48 45
65
4445
45
0
10
20
30
40
50
60
70
2011 2012 2013 2014 2015 2016
Winter Severity Index
Winter Severity Index (WSI) 2015 Previous 5 Year Average-WSI
The Winter Severity Index (WSI) is a weighted formula used across the industry to quantify the relative severity of the
winter seasons. Past data shows a correlation between the WSI and the number of pothole claims received in the
corresponding winter season.
429 57 304
858
1153
151
0
500
1000
1500
2011 2012 2013 2014 2015 2016
Jan-March Pothole Claims
*WSI = (Annual Snowfall * 0.5)
+ (Annual Duration of Snowfall
* 0.05) + (Annual Duration of
Blowing Snow * 0.05) + (Annual
Duration of Freezing Rain *0.1)
5 Year Average: 560

31
Maintenance and Winter Operations
This past winter, RIDOT received 151 pothole claims from motorists for
reimbursements of repair costs resulting from pothole damage on the
state’s roads – a drop of more than 70 percent compared to the previous
5-year average. Importantly, this winter was on par with the average
winter seasons for the past 5 years. A similar sharp decline was observed
in the number of pothole calls received at RIDOT’s Traffic Management
Center, with the number of calls received in March 2016 only a quarter of
the number of calls received in March 2015. These reductions can be
attributed to:
Less severe winter conditions compared to 2015. Past data does show some correlation between the Winter Severity Index (WSI) and the number of pothole claims and calls received in the corresponding winter season.
In 2015, RIDOT implemented the services of 4 automated pothole patching trucks during the spring and summer months, and maintained the use of 2 of these trucks through the fall and winter months. These newer style trucks are able to make permanent pothole repairs in less time, with minimal disruption to motorists with the operator safely in the cab of the vehicle. The RIDOT Maintenance District Facilities assigned the pothole patching trucks to many of the known hotspot areas for potholes around the State.
RIDOT resurfaced several roads in 2015 that had generated numerous pothole complaints such as RI-116, RI-102, RI-37, Cumberland Hill Road and sections of I-95.
Note: January/February 2015 pothole call data was not collected
312
262
85 9171
39 38 42
2841
44
11280
0
50
100
150
200
250
300
350
Pothole Calls to theTransportation Management Center
2015 2016

32
Safety
Although Rhode Island had a record low number of fatalities in calendar year 2015 (45), there were higher than average
fatalities and serious injuries in the first quarter of calendar year 2016. No definitive trend factors appear. Crashes
occurred from Woonsocket to Westerly, some on municipal roadways, some on state highways. These crashes involved
people from age 17– 80. Based on trends observed in recent years, likely factors include impairment, speed, distracted
driving and driver error. Many of the vehicle passengers involved were not wearing seatbelts. Five pedestrians were killed
during the first quarter of calendar year 2015.
During the first quarter of calendar year 2016, RIDOT used federal funds
provided by the U.S. Department of Transportation’s National Highway
Traffic Safety Administration to continue its enforcement and education
campaigns about seatbelt use, impaired driving and speeding. RIDOT’s
Office of Highway Safety also partnered with the State Police to create an
Impaired Driving Prevention Alliance led by three Rhode Island State
Troopers assigned to DOT’s Office on Highway Safety.
The state’s efforts to combat impaired driving were also boosted
significantly by the efforts of the Northern and Southern Rhode Island
Driving Under the Influence (DUI) Task Forces and use of a new tool, the Breath Alcohol Testing – or B.A.T – Mobile. The
B.A.T. is a 40-foot long vehicle containing two Intoxilyzer 9000 Breathalyzer Instrument stations and a portable LiveScan
criminal fingerprint/booking station. The vehicle is used during coordinated multijurisdictional drunk driving enforcement
blitzes to process impaired drivers. By positioning the B.A.T. Mobile in a centralized location, officers are able to arrest
suspected impaired drivers, test, process and release them to a responsible adult without having to travel to their
respective police stations, thus enabling them to more quickly return to patrol. It also serves as a highly visible reminder
to motorists of the consequences of drunk driving.
PERSON TYPE 2011 2012 2013 2014 2015 2016 Jan-Mar
Motor Vehicle Occupants 37 49 37 25 28 8
Motorcyclists 15 8 11 10 9 1
Pedestrians 14 5 14 14 8 5
Bicyclists 0 2 3 0 0 0
ATV 0 0 0 1 0 0
Person on Personal Conveyance 0 0 0 1 0 0
TOTAL 66 64 65 51 45 14
Fatality Analysis Reporting System (FARS) by Person Type 2011-2016 (calendar year)

33
Safety
66 64 65 51 45
14
7069 69
63
58
0
10
20
30
40
50
60
70
80
2011 2012 2013 2014 2015* 2016* YTD
Fatalities
Calendar Year 5 Yr Rolling Average
483 435 386 449 438
94
520
454 450 448 438
0
100
200
300
400
500
600
2011 2012 2013 2014 2015* 2016* YTD
Serious Injuries
Calendar year 5 Yr Rolling Average
*Calendar Year 2015 and Calendar Year 2016 are preliminary numbers due to timing lag for federal FARS
system data
*Calendar Year 2015 and Calendar Year 2016 are preliminary numbers due to timing lag for federal FARS
system data

34

35
Projects
36
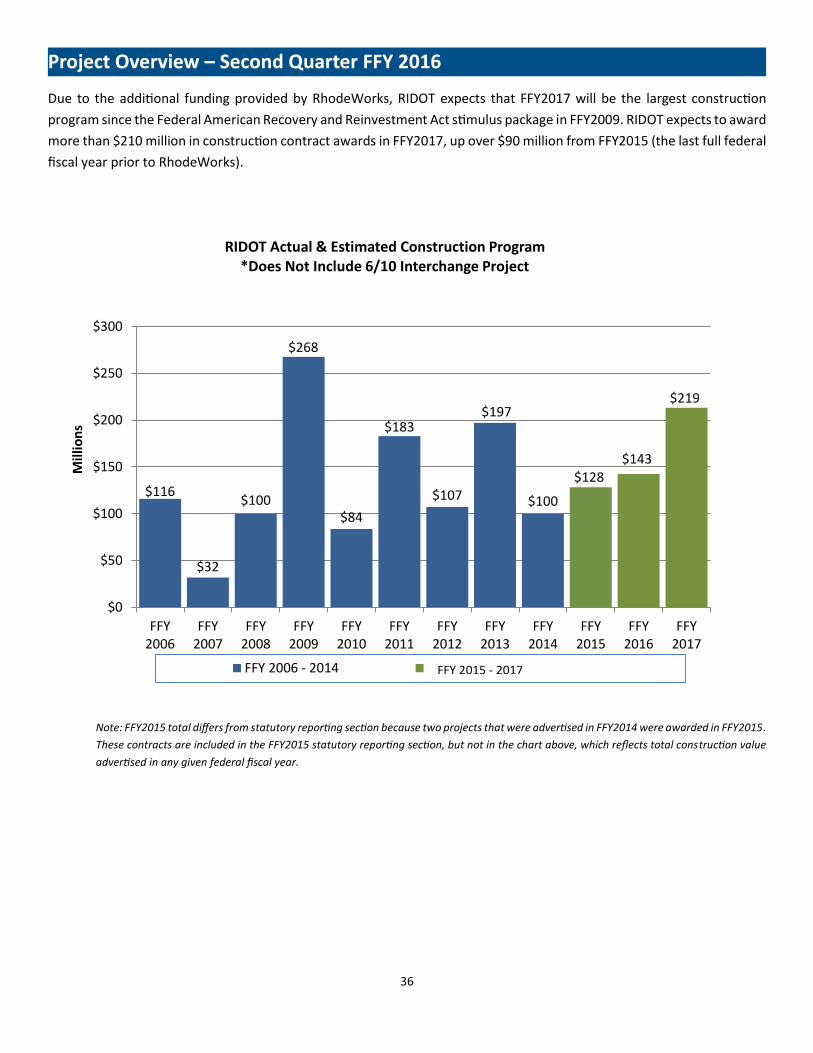
Project Overview – Second Quarter FFY 2016
Due to the additional funding provided by RhodeWorks, RIDOT expects that FFY2017 will be the largest construction
program since the Federal American Recovery and Reinvestment Act stimulus package in FFY2009. RIDOT expects to award
more than $210 million in construction contract awards in FFY2017, up over $90 million from FFY2015 (the last full federal
fiscal year prior to RhodeWorks).
Note: FFY2015 total differs from statutory reporting section because two projects that were advertised in FFY2014 were awarded in FFY2015.
These contracts are included in the FFY2015 statutory reporting section, but not in the chart above, which reflects total construction value
advertised in any given federal fiscal year.
$116
$32
$100
$268
$84
$183
$107
$197
$100
$128$143
$219
$0
$50
$100
$150
$200
$250
$300
FFY2006
FFY2007
FFY2008
FFY2009
FFY2010
FFY2011
FFY2012
FFY2013
FFY2014
FFY2015
FFY2016
FFY2017
Mill
ion
s
RIDOT Actual & Estimated Construction Program*Does Not Include 6/10 Interchange Project
FFY 2006 - 2014 Estimated Construction AwardsFFY 2015 - 2017

37
Project Overview – Second Quarter FFY 2016
RIDOT currently has 137 active projects through FF2017 with a total expected construction value of $634 million. Projects
progress through RIDOT’s project delivery process as follows: first, the project is included in the capital plan; then it goes
through a design phase; followed by an advertisement for construction; construction and substantial completion. The
chart below shows a roughly even split between projects in design and in construction, weighted by construction value.
Consistent with the purpose of RhodeWorks as a means to address Rhode Island’s worst-in-the-nation bridges, RIDOT is
increasing spending on bridges in FFY2016 and FFY2017, both in terms of absolute dollar value and as a percentage of
total spending. Spending on bridges is slated to increase by almost $100M between FFY15 and FFY17. The chart below
shows both construction value of bridge projects vs other and percent of total spending on bridge projects vs other.
Current Project Phase (Weighted by Project Construction Value)
Bridge Projects as Proportion of Total (Weighted by Project Construction Value)
156
(71%)

38
Project Performance – Second Quarter FFY 2016
RIDOT tracks projects by the federal fiscal year in which the project was advertised for construction. Of the current active
projects, RIDOT inherited 12 legacy projects from pre-FFY2015 which remain active, and 37 projects from FFY2015. Though
the new administration joined RIDOT partway through FFY2015, much of the project planning and design for these projects
had already been completed, providing limited opportunity to address issues ahead of advertisement. These projects
never had holistic budgets – only the construction bid value, not overall costs including design and overhead – to work
from. For FFY2016 and FFY2017, RIDOT has developed comprehensive budgets, and assigned a project manager that is
the single point of accountability to ensure that the project is successfully completed on time and on budget
Starting in this report and moving forward, RIDOT will publicly track overall metrics for on-budget and on-time status of
all projects. Summary data is presented in this section, and detailed information on a project-by-project basis can be found
in Appendix A.
Budget Metrics:
For FFY2013-2014 and FFY2015 Legacy Projects:
For all legacy projects, RIDOT retrospectively assigned the budgets for construction costs and contingency based on the
contract value at the time of award, plus 5% for contingencies, an industry standard value. Importantly, performance
metrics for legacy project budgets are based solely on construction costs and contingency values since full budgets
including design and overhead were not established.
For FFY2016 and FFY2017:
For FFY2016 and FFY2017 projects, the current RIDOT administration moved to a project management approach. Each
project has a budget that includes design, construction, contingency, and “other” costs. Examples of other costs include
project oversight, property purchases, police details, and utilities. The benchmark budget on which performance metrics
are based for FFY2016 and FFY2017 is set at Notice to Proceed, and used to track performance across the lifetime of the
project. RIDOT only tracks budget performance for projects that have already issued a Notice to Proceed.
Schedule Metrics:
For All Projects:
For legacy, FFY2016, and FFY2017, RIDOT established substantial completion schedule targets based on the construction
contract duration plus a 10% time contingency. Moving forward, RIDOT will also develop metrics to track the timeliness
of contract advertisement.

39
Project Performance – Second Quarter FFY 2016
As can be seen in the chart and graph below, the on-budget and on-time percentages improve over project classes. Pre-
2015 projects perform the worst, FFY 2015 improve substantially, and all five FFY2016 projects currently in construction
are on time and on budget. Since no FFY2017 projects are underway yet, we do not report project performance for that
class at this time.
Project On-Time and On-Budget Performance by Class
RIDOT also tracks construction change orders on projects. Moving forward, RIDOT will provide summary statistics for the
total value of change orders and percent of contract value by class of projects, as well as “soft costs” as a percent of
construction costs.
Detailed project-by-project data for on time and on budget status, and change order percentages for projects in
construction can be found in Appendix A.
On Budget %
(by Value)
On Time %
(by Value)
Construction Value
(of projects post-NTP)
On Budget %
(by Projects)
On Time %
(by Projects)
# of Projects
post-NTP
Legacy FFY13-14 38% 44% 144$ 58% 67% 12
Legacy FFY15 57% 60% 128$ 51% 68% 37
FFY2016 100% 100% 17$ 100% 100% 5
38%
57%
100%
44%
60%
100%
0%
20%
40%
60%
80%
100%
Legacy FFY13-14 Legacy FFY15 FFY2016
On-time & on-budget by project class (% of value)
On Budget % On Time %

40
Special Projects
Rhode Island Travel Plaza and Transit
Center
The Rhode Island Travel Plaza and Transit Center site is located at the southeast corner of the I-95 Exit 1/ RI Route 3 interchange in the town of Hopkinton, and about ½ mile from Connecticut border. The travel plaza was made possible by a $9M federal TIGER grant secured by RIDOT, and will include a 6,000 square foot Welcome Center with restrooms, food, convenience shops, bike amenities and tourist information. It will also have a park and ride facility for up to 200 vehicles serving RIPTA and intercity bus riders, as well as tourists and carpoolers. Site development will include up to 10 fueling stations (gasoline, natural gas, electric) and parking for up to 50 bicycles. A Request for Proposal to Design/Build/Operate this project is scheduled to be advertised in summer 2016. Actual construction is planned for the spring of 2017 and the facility is expected to be open to the public by the summer of 2019.
The Rhode Island Department of Transportation (RIDOT) has identified the Route 6 and Route 10 highways as priority corridors for infrastructure and transit investment. The Route 6/10 Multimodal Corridor Improvement Project includes replacement of the 6/10 Interchange, and the addition of a Bus Rapid Transit feature along Route 6 to Johnston, Route 10 to Cranston, and along Route 6/10 to downtown Providence in a future phase. These important changes will improve mobility within the Providence metropolitan area, and enhance pedestrian accessibility and economic development potential within the Olneyville area. After several forums to gain public input on the proposal, RIDOT submitted a FASTLANE Grant application on April 14th for $175M for the Route 6/10 Interchange project. The additional funding provided by RhodeWorks enabled a very strong local match of $420M for this application, which improves the chances of securing federal grant dollars. RIDOT will also begin to evaluate the Requests for Proposals received for the National Environmental Protection Act (NEPA) and Conceptual Design and Preliminary Engineering scopes of work. RIDOT plans to award these consultant contracts in May, 2016.
The Route 6/10 Multimodal Corridor Improvement Project
Providence Station Transit Center The Providence Station Transit Center Project will relocate RIPTA bus hub activities from Kennedy Plaza to a new facility adjacent to the Providence Station, in addition to developing a Downtown bus operations plan linking proposed transit centers with major employment and activity centers. The state’s rail and transit infrastructure is currently disjointed – the state’s most prominent and heavily used bus hub in Kennedy Plaza is several blocks away from the Providence train station. As RIPTA’s ridership continues to grow, Kennedy Plaza has also reached its capacity to accommodate more buses and riders. RIDOT envisions using a Public Private Partnership (P3) approach to create a larger transit-oriented development project by leveraging private sector involvement. Work continues in conjunction with the Division of Capital Asset Management & Maintenance, the Commerce Department, and RIPTA to issue a P3 Request for Qualifications in June, 2016. This project is made possible by a $35M general obligation bond passed in 2014 to create the transit hub, and a $1M federal TIGER grant for the planning study.

41
Special Projects
Providence Pedestrian Bridge
This project consists of the construction of a new pedestrian/bicycle bridge on the existing granite piers of the old I-195 bridge which crossed the Providence River. It will provide another crossing connection between the east side and west side of the Providence River midway between the Point St. Bridge and Crawford St. Bridge. It will also connect the proposed east side and west side parks as well as the proposed development that will occur on the former I-195 highway land. In addition to being a connection, the bridge will also be a destination. The bridge will be unique with varying widths and will have wood decks, dedicated seating areas, specialized railings, lighting, and a façade. RIDOT has been working with the I-195 Redevelopment Commission to accelerate the bridge timeline, and received the Coastal Resources Management Commission permit in March. It is expected to be bid in May with some construction occurring late in the season but primarily in 2017 and completing in 2018. This project was made possible by funding received from the land sale that formed the I-195 Redevelopment District.
A key component of RIDOT’s “RhodeWorks” Infrastructure
Improvement Plan is to assess user fees on tractor trailers to
fund the reconstruction of structurally deficient bridges. This
will be done by erecting All Electronic Tolling (AET) equipment
at these bridge locations. The toll will be set at a level to
generate enough revenue to pay for the amount of the bridge
reconstruction cost proportionate to the amount of damage
tractor trailers have caused.
Immediately upon passage of the enabling legislation, RIDOT
issued two separate Requests for Proposals (RFP) for Toll
Facility related consultants. The first was for a Toll Facilities
Consultant to assist RIDOT with preparing the Design-Bid
procurement package, prepare site plans, assist with
environmental permitting, and to assist with construction
oversight and system testing/acceptance. The second RFP was
for an Investment Grade - Traffic and Revenue Study which will
fine tune and validate the revenue forecasts.
Bridge Toll Facilities

42
Special Projects
Pawtucket/Central Falls Train Station
In 2007, the City of Pawtucket completed a feasibility study on the
restoration of commuter rail service in Pawtucket, with
recommendations on station locations. Through the efforts of our
Congressional Delegation, a “New Start” grant for $1.9 million was
secured from the Federal Transit Administration (FTA) to advance
the project into preliminary engineering and environmental
review. RIDOT hired a consultant in 2012 using the FTA funds and
a local match from the City. The preliminary
engineering/environmental phase will be completed in the
summer of 2016. Working in conjunction with the Cities of
Pawtucket and Central Falls, RIDOT has submitted a federal
“Transportation Investment Generating Economic Recovery” or
“TIGER” grant application for the construction of the station. RIDOT expects federal grant awards will be announced
before November.
Providence-Newport Ferry Service
Recognizing the value of Narragansett Bay as a transportation
asset, the new RIDOT administration proposed ferry services as
part of a transit working group which was charged with
developing options to increase Rhode Island’s transit usage.
While exploring many possible destinations and landing sites, in
an effort to test the market for ferry service, the group
recommended a start-up service for the 2016 summer season
(July-September) connecting Providence and Newport. RIDOT
worked with the Cities of Providence and Newport on landing
sites, and closely coordinated its efforts with the Rhode Island Department of Environmental Protection (DEM) and Rhode
Island Public Utilities Commission (PUC). RIDOT included $500,000 of Federal funds for FFY2016 in its 10 Year Plan to
support the service and prepared a public solicitation for a qualified operator, which was advertised on April 8, 2016. If
viable proposals are received, RIDOT will award a contract for the service in late May.

43
Resolving Legacy Issues
Barrington Bridge
RIDOT opened the reconstructed Barrington Bridge in September of 2009.
Prior to February 2015, there was an unresolved ongoing issue with the
expansion couplings in the water line that was installed beneath the bridge.
In August of 2014, the Bristol County Water Authority requested RIDOT
resolve the issue so that this emergency water line could be put into
service. After the winter of 2015, new damage to the water line was
discovered. The new RIDOT administration engaged Pare Engineering to
investigate the cause of the damage and propose a repair solution to the
ongoing issue. While Pare Engineering could not determine the cause of the
damage, it did develop an engineering fix to the entire water line. On October 8, 2015, RIDOT engaged Wallace
Construction Corp to replace the water line at a contract price of $320,000. Wallace completed installation of the waterline
on March 30, 2016. On April 15, 2016 the Final Inspection was completed and RIDOT is working to obtain Bristol County
Water Authority’s acceptance.
Wickford Junction Commuter Rail Station and Parking Garage Maintenance
RIDOT opened the Wickford Junction Train Station in 2012. Utilization of the
station and parking deck has been well below RIDOT’s original
estimates. Further, since the station’s opening, Wickford Junction was
operated and maintained by a private contractor.
After a review, the new management at RIDOT discovered that the private
contractor’s expenses for operations of Wickford Junction were significantly
more costly than RIDOT maintenance. The estimated cost to renew the
contract in 2015-2016 was $695,000. RIDOT estimated that in-sourcing the
operations and maintenance would save approximately $375,000 annually. On July 22, 2015, RIDOT notified the private
contractor that RIDOT was not renewing the Operating and Maintenance Agreement for the Wickford Junction
Garage. On August 28, 2015, the contractor (and its affiliates) filed suit for breach of contract in Superior Court. To settle
the suit, RIDOT agreed to pay the contractor and its affiliates $375,000 in FY16 and $375,000 in FY17. RIDOT will continue
to accrue the annual cost savings of approximately $375,000 thereafter.
RIDOT also took steps to increase utilization of the station. In December of 2015, it consolidated the nearby RIPTA bus
park & ride into the facility, substantially increasing Wickford Garage utilization (RIDOT is currently pursuing the sale of
the former park & ride and expects to gain close to $2 million from the sale). RIPTA has agreed to cross honor rail tickets
on buses, providing transit users with more choices. Despite these actions, the Wickford station itself is still underutilized.
RIDOT will continue exploring options to increase utilization and decrease costs moving forward.

44
Resolving Legacy Issues
IWAY Providence River Bridge – Guardrail Post Anchorage Issue
The IWAY Bridge in Providence was fully opened to traffic in 2011. In
May of 2013, a vehicle hit on the steel guardrails on the I-195
eastbound approach span of the Providence River Bridge caused a
significant level of damage. Upon further investigation, RIDOT
determined that the posts and the anchorage system for the
guardrail were not constructed in accordance with the approved
plans. The prior administration took steps to place temporary jersey
barrier to ensure the safety of the traveling public.
When the new RIDOT management team arrived in February 2015,
RIDOT had received a repair plan from the contractor. However,
RIDOT and the Federal Highway Administration rejected the
contractor’s approach. On June 18, 2015, RIDOT engaged its own engineering consultant to develop a plan for the repairs.
Those plans were received on September 14, 2015 and approved by the Federal Highway Administration on November
19, 2015. RIDOT directed the contractor to begin the repairs on December 1, 2015 and the contractor began working on
December 30, 2015. Repairs are expected to be completed by May 1, 2017.
US Dept. of Justice Enforcement Action against RIDOT for NIPDES Permit Violations
In 2011, the US Environmental Protection Agency (EPA) audited RIDOT for compliance
with stormwater pollution controls under the Clean Water Act. In Rhode Island, the
program is administered by the Rhode Island Department of Environmental
Management (DEM). In May 2014, the US Department of Justice (DOJ) notified RIDOT
that EPA had requested that DOJ bring a federal court action against RIDOT for
violations of conditions and limitations of its stormwater permit. The violations focused
on lack of actions related to the control of pollutants discharged to impaired water
bodies, illicit discharge program development and screening, and good housekeeping
measures such as inspection/cleaning of catch basins and street sweeping. DOJ offered
RIDOT the opportunity to discuss a resolution without the need for formal litigation
through execution of a consent decree. When the new RIDOT management arrived in February of 2015, it completed
negotiations of the consent decree, which became effective on December 22, 2015. Even prior to the execution of the
consent decree, RIDOT sought a contractor to help RIDOT generate an inventory of its drainage system. RIDOT also
incorporated stormwater drainage into its new 10 Year Plan, allocating over $112 million for stormwater improvements
over the next decade. Further, RIDOT created a new office of Stormwater Management as part of its re-
organization. RIDOT is currently conducting a national search for qualified personnel to head the newly created office.

45
Financials

46
Expenditures
OPERATING EXPENDITURES: Operating expenditures are costs associated with the day-to-day operations of RIDOT. These
costs include Highway Maintenance, Safety Programs, Administrative Expenses, Winter Operations, and Commuter Rail
expenses. Striping and bridge inspection are also included. RIDOT’s 10 Year Plan calls for increased attention to the
maintenance of the state’s transportation infrastructure, greater efficiency, and reductions to spending on striping, bridge
inspections, and administrative functions. Approximately 56% of RIDOT’s operating budget in SFY 2015 and 64% of the
operating budget in SFY 2016 to date was expended on Highway Maintenance. The increase in spending on Highway
Maintenance reflects new efforts to heighten the level of maintenance for the state's infrastructure. In SFY 2015, Winter
Operations accounted for 22% of operating expenditures. In SFY 2016 to date, only 14% of operating expenditures were
classified as Winter Operations expenses. This decrease reflected the less severe winter in SFY 2016. Safety and commuter
rail operations accounted for 6% each of SFY 2015 operating expenditures and 5% each of SFY 2016 operating expenditures
to date. Administrative costs are expected to remain flat over the period as savings associated with in-house labor will
likely be offset by a change in the overhead recovery rate.
Admin10%
Highway Maintenance56%
Safety6%
Rail6%
Winter 22%
SFY 2015 OPERATING EXPENDITURES
Admin11%
Highway Maintenance
64%
Safety5%
Rail5%
Winter14%
Emergency Projects1%
SFY16 YTD OPERATING EXPENDITURES

47
Expenditures
Actual operating expenditures totaled $101 million in SFY15, $28 million in Q3 SFY16, and $79 million for YTD SFY16.

48
Expenditures
CAPITAL EXPENDITURES: Capital expenditures include design, construction and oversight costs associated with capital
projects, expenditures to plan capital projects and debt service on capital debt. Some operating expenditures associated
with RIDOT overhead are also billed to capital projects. Capital costs other than those allocated to the construction
contract are considered “soft costs.” RIDOT’s 10 Year Plan calls for the reduction of soft costs over time to bring this
portion of capital expenditures down to industry standards through the implementation of project management. RIDOT
has begun implementing this approach and early results include the increased proportion of capital expenditures spent
on construction contracts from 59% in SFY15 to 60% in SFY16 to date, the reduction of RIDOT internal costs (In-House
Labor plus Overhead) from 19% in SFY15 to 18% in SFY16 to date and the reduction of spending on Consultant Contracts
from 16% of capital spending in SFY15 to 15% of capital spending in SFY16 to date.
In-House Labor13%
Overhead Recovery6%
Consultant Contracts16%
Construction Contracts
59%
Miscellaneous6%
SFY15 CAPITAL PROJECTS
In-House Labor12%
Overhead Recovery6%
Consultant Contracts
15%
Construction Contracts
60%
Miscellaneous7%
SFY16 YTD CAPITAL PROJECTS

49
Expenditures
Actual capital expenditures totaled $330 million in SFY15, $50 million in Q3 SFY16, and $208 million for YTD SFY16.
(In Thousands) SFY15 SFY16 Q1 SFY16Q2 SFY16Q3 SFY16 YTD
Debt
Debt Service 103,330$ 6,853$ 15,334$ 8,954$ 31,141$
Total Debt Service 103,330$ 6,853$ 15,334$ 8,954$ 31,141$
Planning
In-house Labor 4,441$ 1,034$ 926$ 774$ 2,734$
Overhead Costs 2,905$ 497$ 440$ 364$ 1,301$
Consultant Contracts 2,461$ 662$ 598$ 665$ 1,925$
Miscellaneous (Planning) 1,435$ 121$ 36$ 170$ 327$
Total Planning 11,242$ 2,314$ 2,000$ 1,973$ 6,287$
Capital Projects
In-house Labor 26,769$ 7,528$ 6,396$ 5,111$ 19,035$
Overhead Costs 12,660$ 3,341$ 2,895$ 2,309$ 8,545$
Consultant Contracts 33,155$ 8,293$ 9,818$ 5,764$ 23,875$
Construction Contracts 121,636$ 32,390$ 42,831$ 18,598$ 93,819$
Miscellaneous (Capital Projects) 11,568$ 3,485$ 5,078$ 2,940$ 11,503$
Total Capital Projects 205,788$ 55,037$ 67,018$ 34,722$ 156,777$
Capital Pass Throughs
Pass Throughs 10,274$ 2,953$ 5,969$ 4,554$ 13,476$
Total Capital Pass Throughs 10,274$ 2,953$ 5,969$ 4,554$ 13,476$
Total Capital Expenditures 330,634$ 67,157$ 90,321$ 50,203$ 207,681$
Total RIDOT Expenditures 431,751$ 90,465$ 117,613$ 78,495$ 286,573$
Capital Expenditures Detail (Actuals)

50
Construction Contract Awards FFY 2015
In Federal Fiscal Year 2015, RIDOT opened bids on 44 construction contracts. The engineer bid estimates totaled $134
million. The low bid prices were $127.7 million, some $3.7 million less than the engineer estimates. The chart below
details awards by contractor for FFY 2015.
Cardi
D'Ambra
JH Lynch
Manafort
Aetna
Roadsafe
All States Asphalt
Other
Contractor # of Contracts Total $ Awarded % Cumulative
Cardi 11 $43,104,843.90 33.76% 33.76%
D'Ambra 8 $26,053,766.39 20.40% 54.16%
JH Lynch 7 $21,002,104.53 16.45% 70.61%
Manafort 1 $12,663,713.77 9.92% 80.53%
Aetna 2 $6,334,287.00 4.96% 85.49%
Roadsafe 2 $4,766,709.49 3.73% 89.22%
All States Asphalt 3 $3,348,919.45 2.62% 91.85%
Other 10 $10,411,160.24 8.15% 100.00%
Totals 44 $127,685,504.77 100.00%
$FFY 2015 Awarded Construction Contracts by Contractor Total = $127.7 million
51
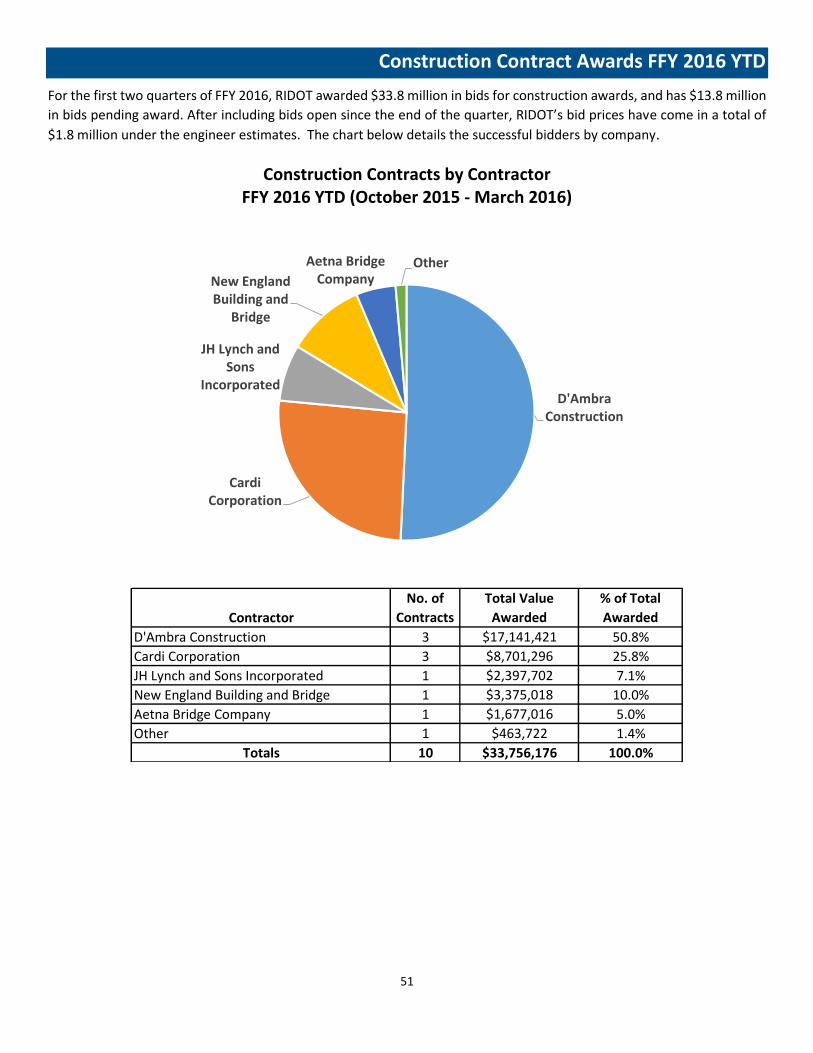
Construction Contract Awards FFY 2016 YTD
For the first two quarters of FFY 2016, RIDOT awarded $33.8 million in bids for construction awards, and has $13.8 million
in bids pending award. After including bids open since the end of the quarter, RIDOT’s bid prices have come in a total of
$1.8 million under the engineer estimates. The chart below details the successful bidders by company.
D'Ambra Construction
Cardi Corporation
JH Lynch and Sons
Incorporated
New England Building and
Bridge
Aetna Bridge Company
Other
Contractor
No. of
Contracts
Total Value
Awarded
% of Total
Awarded
D'Ambra Construction 3 $17,141,421 50.8%
Cardi Corporation 3 $8,701,296 25.8%
JH Lynch and Sons Incorporated 1 $2,397,702 7.1%
New England Building and Bridge 1 $3,375,018 10.0%
Aetna Bridge Company 1 $1,677,016 5.0%
Other 1 $463,722 1.4%
Totals 10 $33,756,176 100.0%
Construction Contracts by Contractor
FFY 2016 YTD (October 2015 - March 2016)

52

53
Appendices
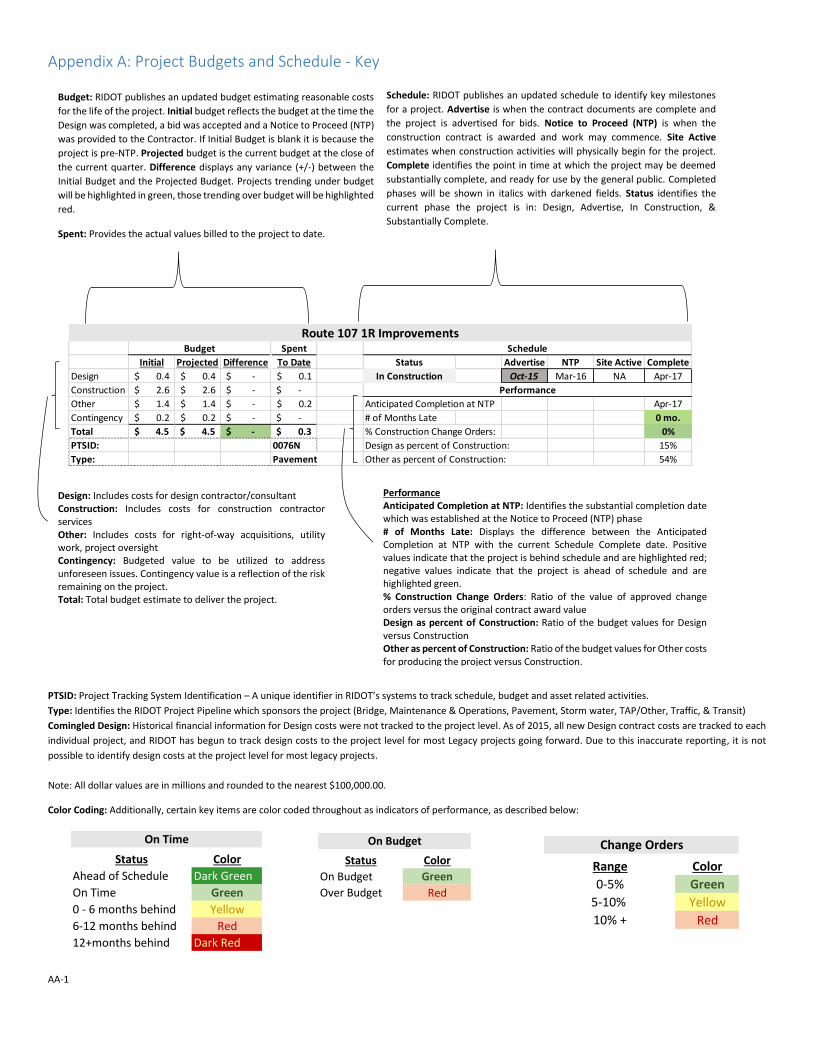
AA-1
Appendix A: Project Budgets and Schedule - Key
PTSID: Project Tracking System Identification – A unique identifier in RIDOT’s systems to track schedule, budget and asset related activities.
Type: Identifies the RIDOT Project Pipeline which sponsors the project (Bridge, Maintenance & Operations, Pavement, Storm water, TAP/Other, Traffic, & Transit)
Comingled Design: Historical financial information for Design costs were not tracked to the project level. As of 2015, all new Design contract costs are tracked to each
individual project, and RIDOT has begun to track design costs to the project level for most Legacy projects going forward. Due to this inaccurate reporting, it is not
possible to identify design costs at the project level for most legacy projects.
Note: All dollar values are in millions and rounded to the nearest $100,000.00.
Color Coding: Additionally, certain key items are color coded throughout as indicators of performance, as described below:
Budget Spent Schedule
Initial Projected Difference To Date Status Advertise NTP Site Active Complete
Design 0.4$ 0.4$ -$ 0.1$ In Construction Oct-15 Mar-16 NA Apr-17
Construction 2.6$ 2.6$ -$ -$ Performance
Other 1.4$ 1.4$ -$ 0.2$ Anticipated Completion at NTP Apr-17
Contingency 0.2$ 0.2$ -$ -$ # of Months Late 0 mo.
Total 4.5$ 4.5$ -$ 0.3$ % Construction Change Orders: 0%
PTSID: 0076N Design as percent of Construction: 15%
Type: Pavement Other as percent of Construction: 54%
Route 107 1R Improvements
Budget: RIDOT publishes an updated budget estimating reasonable costs
for the life of the project. Initial budget reflects the budget at the time the
Design was completed, a bid was accepted and a Notice to Proceed (NTP)
was provided to the Contractor. If Initial Budget is blank it is because the
project is pre-NTP. Projected budget is the current budget at the close of
the current quarter. Difference displays any variance (+/-) between the
Initial Budget and the Projected Budget. Projects trending under budget
will be highlighted in green, those trending over budget will be highlighted
red.
Spent: Provides the actual values billed to the project to date.
Design: Includes costs for design contractor/consultant Construction: Includes costs for construction contractor services Other: Includes costs for right-of-way acquisitions, utility work, project oversight Contingency: Budgeted value to be utilized to address unforeseen issues. Contingency value is a reflection of the risk remaining on the project. Total: Total budget estimate to deliver the project.
Schedule: RIDOT publishes an updated schedule to identify key milestones
for a project. Advertise is when the contract documents are complete and
the project is advertised for bids. Notice to Proceed (NTP) is when the
construction contract is awarded and work may commence. Site Active
estimates when construction activities will physically begin for the project.
Complete identifies the point in time at which the project may be deemed
substantially complete, and ready for use by the general public. Completed
phases will be shown in italics with darkened fields. Status identifies the
current phase the project is in: Design, Advertise, In Construction, &
Substantially Complete.
Performance Anticipated Completion at NTP: Identifies the substantial completion date which was established at the Notice to Proceed (NTP) phase # of Months Late: Displays the difference between the Anticipated Completion at NTP with the current Schedule Complete date. Positive values indicate that the project is behind schedule and are highlighted red; negative values indicate that the project is ahead of schedule and are highlighted green. % Construction Change Orders: Ratio of the value of approved change orders versus the original contract award value Design as percent of Construction: Ratio of the budget values for Design versus Construction Other as percent of Construction: Ratio of the budget values for Other costs for producing the project versus Construction.
On Time
Status Color
Ahead of Schedule Dark Green
On Time Green
0 - 6 months behind Yellow
6-12 months behind Red
12+months behind Dark Red
Change Orders
Range Color
0-5% Green
5-10% Yellow
10% + Red
On Budget
Status Color
On Budget Green
Over Budget Red

Pre‐FFY 2015 LEGACY PROJECTS Appendix A
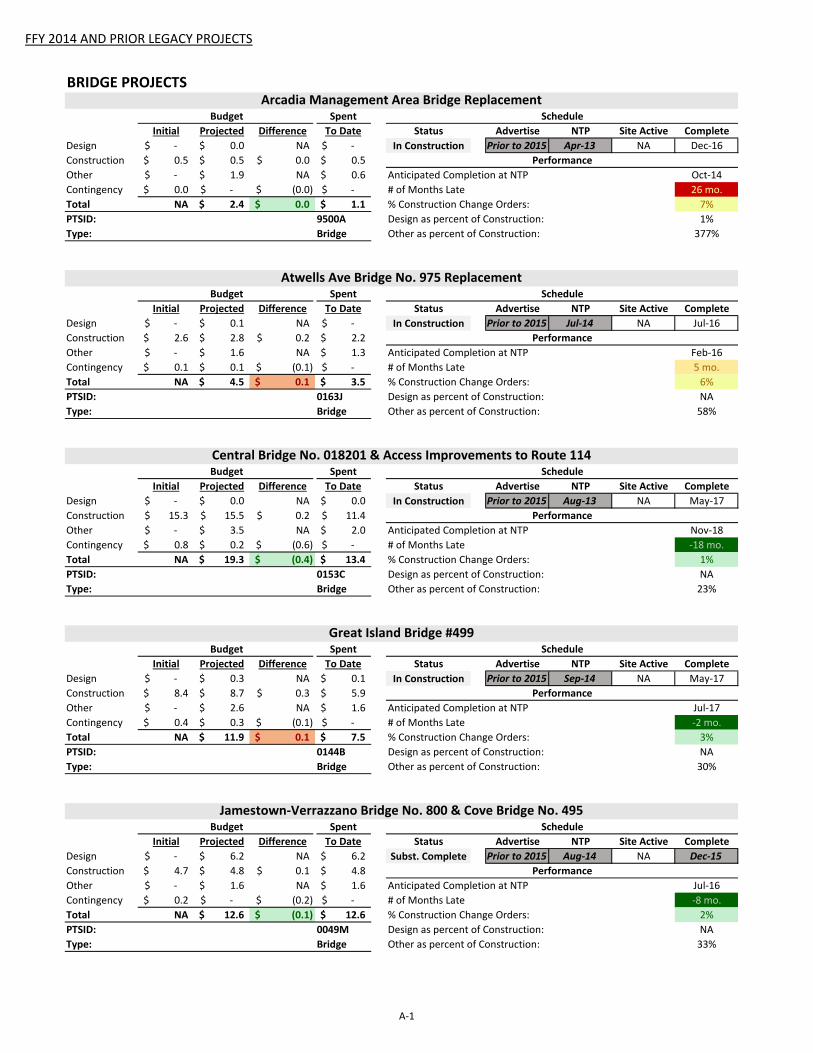
FFY 2014 AND PRIOR LEGACY PROJECTS
BRIDGE PROJECTSArcadia Management Area Bridge Replacement
Budget Spent ScheduleInitial Projected Difference To Date Status Advertise NTP Site Active Complete
Design ‐$ 0.0$ NA ‐$ In Construction Prior to 2015 Apr‐13 NA Dec‐16Construction 0.5$ 0.5$ 0.0$ 0.5$ PerformanceOther ‐$ 1.9$ NA 0.6$ Anticipated Completion at NTP Oct‐14Contingency 0.0$ ‐$ (0.0)$ ‐$ # of Months Late 26 mo.Total NA 2.4$ 0.0$ 1.1$ % Construction Change Orders: 7%PTSID: 9500A Design as percent of Construction: 1%Type: Bridge Other as percent of Construction: 377%
Atwells Ave Bridge No. 975 ReplacementBudget Spent Schedule
Initial Projected Difference To Date Status Advertise NTP Site Active CompleteDesign ‐$ 0.1$ NA ‐$ In Construction Prior to 2015 Jul‐14 NA Jul‐16Construction 2.6$ 2.8$ 0.2$ 2.2$ PerformanceOther ‐$ 1.6$ NA 1.3$ Anticipated Completion at NTP Feb‐16Contingency 0.1$ 0.1$ (0.1)$ ‐$ # of Months Late 5 mo.Total NA 4.5$ 0.1$ 3.5$ % Construction Change Orders: 6%PTSID: 0163J Design as percent of Construction: NAType: Bridge Other as percent of Construction: 58%
Central Bridge No. 018201 & Access Improvements to Route 114Budget Spent Schedule
Initial Projected Difference To Date Status Advertise NTP Site Active CompleteDesign ‐$ 0.0$ NA 0.0$ In Construction Prior to 2015 Aug‐13 NA May‐17Construction 15.3$ 15.5$ 0.2$ 11.4$ PerformanceOther ‐$ 3.5$ NA 2.0$ Anticipated Completion at NTP Nov‐18Contingency 0.8$ 0.2$ (0.6)$ ‐$ # of Months Late ‐18 mo.Total NA 19.3$ (0.4)$ 13.4$ % Construction Change Orders: 1%PTSID: 0153C Design as percent of Construction: NAType: Bridge Other as percent of Construction: 23%
Great Island Bridge #499Budget Spent Schedule
Initial Projected Difference To Date Status Advertise NTP Site Active CompleteDesign ‐$ 0.3$ NA 0.1$ In Construction Prior to 2015 Sep‐14 NA May‐17Construction 8.4$ 8.7$ 0.3$ 5.9$ PerformanceOther ‐$ 2.6$ NA 1.6$ Anticipated Completion at NTP Jul‐17Contingency 0.4$ 0.3$ (0.1)$ ‐$ # of Months Late ‐2 mo.Total NA 11.9$ 0.1$ 7.5$ % Construction Change Orders: 3%PTSID: 0144B Design as percent of Construction: NAType: Bridge Other as percent of Construction: 30%
Jamestown‐Verrazzano Bridge No. 800 & Cove Bridge No. 495Budget Spent Schedule
Initial Projected Difference To Date Status Advertise NTP Site Active CompleteDesign ‐$ 6.2$ NA 6.2$ Subst. Complete Prior to 2015 Aug‐14 NA Dec‐15Construction 4.7$ 4.8$ 0.1$ 4.8$ PerformanceOther ‐$ 1.6$ NA 1.6$ Anticipated Completion at NTP Jul‐16Contingency 0.2$ ‐$ (0.2)$ ‐$ # of Months Late ‐8 mo.Total NA 12.6$ (0.1)$ 12.6$ % Construction Change Orders: 2%PTSID: 0049M Design as percent of Construction: NAType: Bridge Other as percent of Construction: 33%
A‐1

FFY 2014 AND PRIOR LEGACY PROJECTS
New Providence Viaduct Southbound Bridge No. 578Budget Spent Schedule
Initial Projected Difference To Date Status Advertise NTP Site Active CompleteDesign ‐$ 5.0$ NA 1.0$ In Construction Prior to 2015 Jan‐13 NA May‐17Construction 68.9$ 74.4$ 5.5$ 61.9$ PerformanceOther ‐$ 23.4$ NA 19.6$ Anticipated Completion at NTP Mar‐16Contingency 3.4$ 1.8$ (1.7)$ ‐$ # of Months Late 14 mo.Total NA 104.6$ 3.8$ 82.5$ % Construction Change Orders: 8%PTSID: 0018A Design as percent of Construction: NAType: Bridge Other as percent of Construction: 31%
PAVEMENT PROJECTSApponaug Circulator By‐Pass
Budget Spent ScheduleInitial Projected Difference To Date Status Advertise NTP Site Active Complete
Design ‐$ 9.4$ NA 6.1$ In Construction Prior to 2015 Jul‐14 NA Nov‐17Construction 29.5$ 29.8$ 0.3$ 16.1$ PerformanceOther ‐$ 30.7$ NA 20.7$ Anticipated Completion at NTP Jan‐18Contingency 1.5$ 1.1$ (0.4)$ ‐$ # of Months Late ‐2 mo.Total NA 71.0$ (0.1)$ 42.9$ % Construction Change Orders: 1%PTSID: 0185A Design as percent of Construction: 32%Type: Pavement Other as percent of Construction: 103%
I‐195 Relocation ‐ Landscape Contract CBudget Spent Schedule
Initial Projected Difference To Date Status Advertise NTP Site Active CompleteDesign ‐$ ‐$ NA ‐$ In Construction Prior to 2015 Feb‐14 NA Nov‐16Construction 0.8$ 0.8$ 0.0$ 0.6$ PerformanceOther ‐$ 0.6$ NA 0.3$ Anticipated Completion at NTP Mar‐17Contingency 0.0$ 0.0$ (0.0)$ ‐$ # of Months Late ‐4 mo.Total NA 1.4$ (0.0)$ 0.9$ % Construction Change Orders: 1%PTSID: 0012E Design as percent of Construction: NAType: Pavement Other as percent of Construction: 73%
TRAFFIC PROJECTSI‐95 Highway LED Lighting ‐ Exits 1, 2, 4, 5 and Weigh Stations
Budget Spent ScheduleInitial Projected Difference To Date Status Advertise NTP Site Active Complete
Design ‐$ ‐$ NA ‐$ Subst. Complete Prior to 2015 Sep‐14 NA Feb‐16Construction 2.4$ 2.6$ 0.2$ 2.3$ PerformanceOther ‐$ 1.3$ NA 1.1$ Anticipated Completion at NTP Nov‐15Contingency 0.1$ ‐$ (0.1)$ ‐$ # of Months Late 3 mo.Total NA 3.9$ 0.1$ 3.4$ % Construction Change Orders: 8%PTSID: 0115Z Design as percent of Construction: 0%Type: Traffic Other as percent of Construction: 51%
I‐95 Sustainability – Phase IBudget Spent Schedule
Initial Projected Difference To Date Status Advertise NTP Site Active CompleteDesign ‐$ ‐$ NA ‐$ In Construction Prior to 2015 May‐13 NA Nov‐16Construction 0.6$ 0.6$ ‐$ 0.5$ PerformanceOther ‐$ 0.7$ NA 0.5$ Anticipated Completion at NTP Apr‐17Contingency 0.0$ 0.0$ (0.0)$ ‐$ # of Months Late ‐5 mo.Total NA 1.4$ (0.0)$ 1.0$ % Construction Change Orders: 0%PTSID: 0058L Design as percent of Construction: 0%Type: Traffic Other as percent of Construction: 111%
A‐2

FFY 2014 AND PRIOR LEGACY PROJECTS
MAINTENANCE & OPERATIONS PROJECTSGuardrail Repair and Replacement 2014‐2016
Budget Spent ScheduleInitial Projected Difference To Date Status Advertise NTP Site Active Complete
Design ‐$ ‐$ NA ‐$ In Construction Prior to 2015 Jun‐14 NA Jun‐16Construction 2.2$ 2.2$ ‐$ 1.0$ PerformanceOther ‐$ 1.0$ NA 0.4$ Anticipated Completion at NTP Sep‐16Contingency 0.1$ ‐$ (0.1)$ ‐$ # of Months Late ‐3 mo.Total NA 3.2$ (0.1)$ 1.4$ % Construction Change Orders: 0%PTSID: 7006F Design as percent of Construction: 0%Type: Operating Other as percent of Construction: 46%
Impact Attenuator Repair and Replacement 2014‐2016Budget Spent Schedule
Initial Projected Difference To Date Status Advertise NTP Site Active CompleteDesign ‐$ ‐$ NA ‐$ In Construction Prior to 2015 Apr‐14 NA Sep‐16Construction 1.6$ 1.6$ ‐$ 0.4$ PerformanceOther ‐$ 0.1$ NA (0.0)$ Anticipated Completion at NTP Dec‐16Contingency 0.1$ ‐$ (0.1)$ ‐$ # of Months Late ‐4 mo.Total NA 1.8$ (0.1)$ 0.4$ % Construction Change Orders: 0%PTSID: 7005F Design as percent of Construction: 0%Type: Operating Other as percent of Construction: 7%
A‐3

FFY 2015 LEGACY PROJECTS Appendix A

FFY 2015 LEGACY PROJECTS
BRIDGE PROJECTSClarence Hussey Bridge No. 11 (69B)
Budget Spent ScheduleInitial Projected Difference To Date Status Advertise NTP Site Active Complete
Design ‐$ 0.1$ NA 0.0$ In Construction Sep‐15 Jan‐16 NA Jun‐17Construction 1.7$ 1.7$ ‐$ 0.1$ PerformanceOther ‐$ 0.9$ NA 0.2$ Anticipated Completion at NTP Jul‐17Contingency 0.1$ 0.1$ 0.0$ ‐$ # of Months Late ‐1 mo.Total NA 2.8$ 0.0$ 0.3$ % Construction Change Orders: 0%PTSID: 0156A Design as percent of Construction: NAType: Bridge Other as percent of Construction: 52%
Coles Bridge No. 134 (66)Budget Spent Schedule
Initial Projected Difference To Date Status Advertise NTP Site Active CompleteDesign ‐$ 0.1$ NA 0.0$ In Construction Aug‐15 Nov‐15 NA Dec‐16Construction 0.6$ 0.6$ ‐$ 0.0$ PerformanceOther ‐$ 0.1$ NA 0.0$ Anticipated Completion at NTP Sep‐17Contingency 0.0$ 0.1$ 0.0$ ‐$ # of Months Late ‐10 mo.Total NA 0.8$ 0.0$ 0.1$ % Construction Change Orders: 0%PTSID: 0153D Design as percent of Construction: NAType: Bridge Other as percent of Construction: 27%
East Shore Expressway Bridges Nos. 475, 476Budget Spent Schedule
Initial Projected Difference To Date Status Advertise NTP Site Active CompleteDesign ‐$ 0.5$ NA 0.3$ In Construction May‐15 Sep‐15 NA Jun‐17Construction 14.0$ 14.0$ ‐$ 1.3$ PerformanceOther ‐$ 1.6$ NA 0.4$ Anticipated Completion at NTP Jul‐17Contingency 0.7$ 0.7$ (0.0)$ ‐$ # of Months Late ‐2 mo.Total NA 16.7$ (0.0)$ 1.9$ % Construction Change Orders: 0%PTSID: 0143D Design as percent of Construction: NAType: Bridge Other as percent of Construction: 11%
Glenbridge Ave and South County Trail Bridges (69F)Budget Spent Schedule
Initial Projected Difference To Date Status Advertise NTP Site Active CompleteDesign ‐$ 0.2$ NA 0.1$ In Construction Jun‐15 Aug‐15 NA Dec‐16Construction 6.2$ 6.3$ 0.1$ 2.2$ PerformanceOther ‐$ 0.9$ NA 0.4$ Anticipated Completion at NTP Dec‐16Contingency 0.3$ 0.7$ 0.4$ ‐$ # of Months Late 0 mo.Total NA 8.0$ 0.4$ 2.6$ % Construction Change Orders: 1%PTSID: 0113L Design as percent of Construction: NAType: Bridge Other as percent of Construction: 14%
Hamlet Ave. Bridge #500 (69C)Budget Spent Schedule
Initial Projected Difference To Date Status Advertise NTP Site Active CompleteDesign ‐$ 0.1$ NA 0.0$ In Construction Jun‐15 Sep‐15 NA Jul‐17Construction 2.2$ 2.2$ ‐$ 0.3$ PerformanceOther ‐$ 0.8$ NA 0.2$ Anticipated Completion at NTP Jul‐17Contingency 0.1$ 0.1$ (0.0)$ ‐$ # of Months Late 0 mo.Total NA 3.2$ (0.0)$ 0.6$ % Construction Change Orders: 0%PTSID: 0201I Design as percent of Construction: NAType: Bridge Other as percent of Construction: 36%
A‐4

FFY 2015 LEGACY PROJECTS
I‐95 Corridor Bridge Preservation & ResurfacingBudget Spent Schedule
Initial Projected Difference To Date Status Advertise NTP Site Active CompleteDesign ‐$ 0.2$ NA 0.0$ In Construction May‐15 Jul‐15 NA Dec‐16Construction 10.9$ 11.0$ 0.1$ 3.8$ PerformanceOther ‐$ 2.1$ NA 0.8$ Anticipated Completion at NTP Dec‐16Contingency 0.5$ 0.5$ ‐$ ‐$ # of Months Late ‐1 mo.Total NA 13.9$ 0.1$ 4.7$ % Construction Change Orders: 1%PTSID: 0201U Design as percent of Construction: NAType: Bridge Other as percent of Construction: 19%
Pleasant Valley Parkway Bridge No. 777Budget Spent Schedule
Initial Projected Difference To Date Status Advertise NTP Site Active CompleteDesign ‐$ 0.6$ NA 0.1$ In Construction Apr‐15 Aug‐15 NA Jul‐17Construction 5.6$ 5.8$ 0.1$ 1.7$ PerformanceOther ‐$ 2.5$ NA 0.6$ Anticipated Completion at NTP Feb‐18Contingency 0.3$ 0.1$ (0.2)$ ‐$ # of Months Late ‐7 mo.Total NA 8.9$ (0.1)$ 2.4$ % Construction Change Orders: 2%PTSID: 0163F Design as percent of Construction: NAType: Bridge Other as percent of Construction: 43%
Route 1/South County Pier Cap ReplacementsBudget Spent Schedule
Initial Projected Difference To Date Status Advertise NTP Site Active CompleteDesign ‐$ 0.0$ NA ‐$ In Construction Nov‐14 Mar‐15 NA Jun‐17Construction 5.6$ 5.8$ 0.2$ 2.3$ PerformanceOther ‐$ 1.6$ NA 0.9$ Anticipated Completion at NTP Nov‐16Contingency 0.3$ 0.0$ (0.2)$ ‐$ # of Months Late 7 mo.Total NA 7.3$ (0.1)$ 3.2$ % Construction Change Orders: 3%PTSID: 0143R Design as percent of Construction: NAType: Bridge Other as percent of Construction: 27%
Route 24 & I‐295 Bridge PreservationBudget Spent Schedule
Initial Projected Difference To Date Status Advertise NTP Site Active CompleteDesign ‐$ 0.1$ NA 0.0$ In Construction Jun‐15 Oct‐15 NA Dec‐16Construction 4.3$ 4.3$ ‐$ 0.5$ PerformanceOther ‐$ 0.6$ NA 0.2$ Anticipated Completion at NTP Jan‐18Contingency 0.2$ 0.2$ (0.0)$ ‐$ # of Months Late ‐13 mo.Total NA 5.2$ (0.0)$ 0.8$ % Construction Change Orders: 0%PTSID: 0113V Design as percent of Construction: NAType: Bridge Other as percent of Construction: 14%
Shippee Bridge No. 307 (69E)Budget Spent Schedule
Initial Projected Difference To Date Status Advertise NTP Site Active CompleteDesign ‐$ 0.1$ NA ‐$ In Construction Dec‐14 Apr‐15 NA Sep‐16Construction 2.2$ 2.2$ (0.0)$ 0.1$ PerformanceOther ‐$ 2.2$ NA 0.2$ Anticipated Completion at NTP Oct‐16Contingency 0.1$ 0.1$ (0.0)$ ‐$ # of Months Late ‐1 mo.Total NA 4.6$ (0.1)$ 0.3$ % Construction Change Orders: ‐2%PTSID: 0154B Design as percent of Construction: NAType: Bridge Other as percent of Construction: 102%
A‐5

FFY 2015 LEGACY PROJECTS
West Elmwood RR Bridge No. 660 (69G)Budget Spent Schedule
Initial Projected Difference To Date Status Advertise NTP Site Active CompleteDesign ‐$ 0.8$ NA 0.5$ In Construction Oct‐14 Jun‐15 NA Jun‐16Construction 2.2$ 2.4$ 0.2$ 1.7$ PerformanceOther ‐$ 0.8$ NA 0.7$ Anticipated Completion at NTP Aug‐16Contingency 0.1$ ‐$ (0.1)$ ‐$ # of Months Late ‐2 mo.Total NA 4.0$ 0.1$ 2.9$ % Construction Change Orders: 10%PTSID: 0201T Design as percent of Construction: NAType: Bridge Other as percent of Construction: 33%
PAVEMENT PROJECTSBroadway Streetscape Improvements Project
Budget Spent ScheduleInitial Projected Difference To Date Status Advertise NTP Site Active Complete
Design ‐$ ‐$ NA ‐$ In Construction Nov‐14 Mar‐15 NA May‐17Construction 5.8$ 6.1$ 0.3$ 3.1$ PerformanceOther ‐$ 1.8$ NA 0.8$ Anticipated Completion at NTP Aug‐17Contingency 0.3$ ‐$ (0.3)$ ‐$ # of Months Late ‐3 mo.Total NA 7.9$ 0.0$ 3.9$ % Construction Change Orders: 7%PTSID: 0173F Design as percent of Construction: NAType: Pavement Other as percent of Construction: 30%
Dexter Street 1R ImprovementsBudget Spent Schedule
Initial Projected Difference To Date Status Advertise NTP Site Active CompleteDesign ‐$ 0.0$ NA 0.0$ In Construction Apr‐15 Jul‐15 NA Sep‐16Construction 3.9$ 4.0$ 0.0$ 1.7$ PerformanceOther ‐$ 1.1$ NA 0.7$ Anticipated Completion at NTP Nov‐16Contingency 0.2$ 0.2$ 0.0$ ‐$ # of Months Late ‐2 mo.Total NA 5.3$ 0.0$ 2.3$ % Construction Change Orders: 1%PTSID: 0004B Design as percent of Construction: NAType: Pavement Other as percent of Construction: 28%
Mineral Spring Avenue 1R ImprovementsBudget Spent Schedule
Initial Projected Difference To Date Status Advertise NTP Site Active CompleteDesign ‐$ ‐$ NA ‐$ Subst. Complete Sep‐14 Jan‐15 NA Nov‐15Construction 3.7$ 3.9$ 0.2$ 3.2$ PerformanceOther ‐$ 1.4$ NA 1.4$ Anticipated Completion at NTP Dec‐15Contingency 0.2$ 0.0$ (0.2)$ ‐$ # of Months Late ‐1 mo.Total NA 5.3$ 0.0$ 4.6$ % Construction Change Orders: 5%PTSID: 0172F Design as percent of Construction: NAType: Pavement Other as percent of Construction: 37%
New River Road and Victory Highway 1R ImprovementsBudget Spent Schedule
Initial Projected Difference To Date Status Advertise NTP Site Active CompleteDesign ‐$ 0.1$ NA 0.1$ Subst. Complete Apr‐15 Jul‐15 NA Nov‐15Construction 2.1$ 2.0$ (0.0)$ 1.1$ PerformanceOther ‐$ 0.6$ NA 0.3$ Anticipated Completion at NTP Nov‐15Contingency 0.1$ ‐$ (0.1)$ ‐$ # of Months Late ‐1 mo.Total NA 2.7$ (0.1)$ 1.4$ % Construction Change Orders: ‐1%PTSID: 0166L Design as percent of Construction: NAType: Pavement Other as percent of Construction: 28%
A‐6
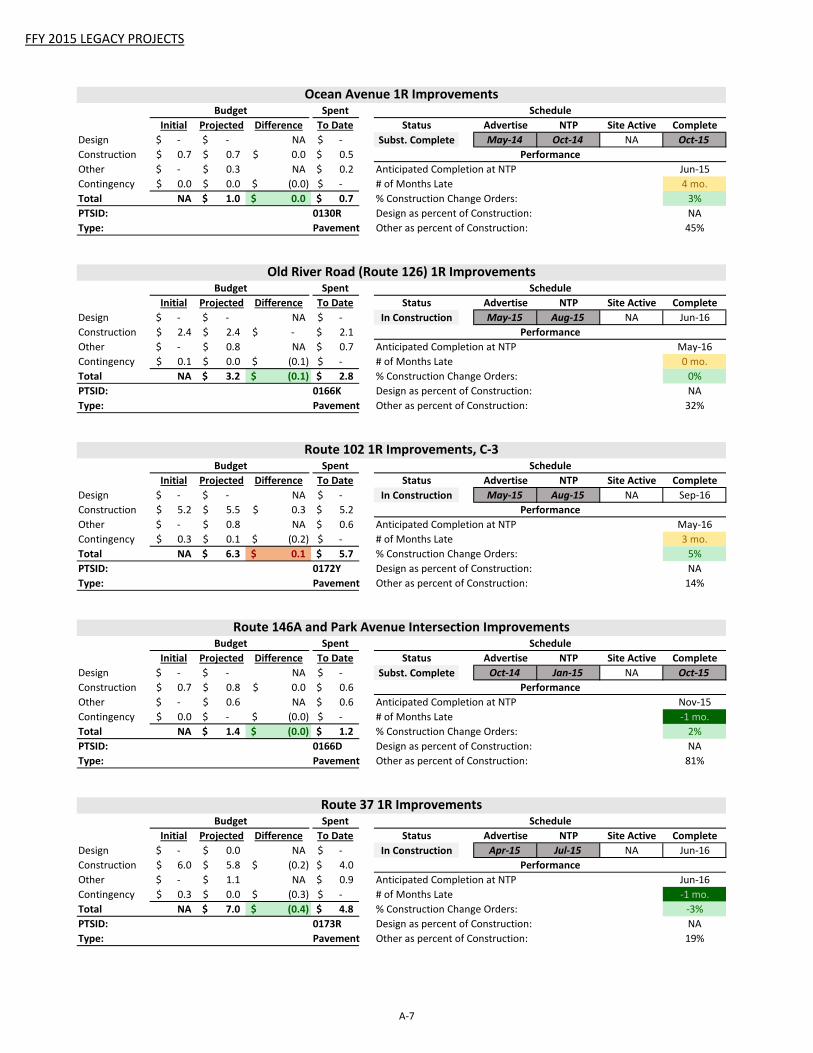
FFY 2015 LEGACY PROJECTS
Ocean Avenue 1R ImprovementsBudget Spent Schedule
Initial Projected Difference To Date Status Advertise NTP Site Active CompleteDesign ‐$ ‐$ NA ‐$ Subst. Complete May‐14 Oct‐14 NA Oct‐15Construction 0.7$ 0.7$ 0.0$ 0.5$ PerformanceOther ‐$ 0.3$ NA 0.2$ Anticipated Completion at NTP Jun‐15Contingency 0.0$ 0.0$ (0.0)$ ‐$ # of Months Late 4 mo.Total NA 1.0$ 0.0$ 0.7$ % Construction Change Orders: 3%PTSID: 0130R Design as percent of Construction: NAType: Pavement Other as percent of Construction: 45%
Old River Road (Route 126) 1R ImprovementsBudget Spent Schedule
Initial Projected Difference To Date Status Advertise NTP Site Active CompleteDesign ‐$ ‐$ NA ‐$ In Construction May‐15 Aug‐15 NA Jun‐16Construction 2.4$ 2.4$ ‐$ 2.1$ PerformanceOther ‐$ 0.8$ NA 0.7$ Anticipated Completion at NTP May‐16Contingency 0.1$ 0.0$ (0.1)$ ‐$ # of Months Late 0 mo.Total NA 3.2$ (0.1)$ 2.8$ % Construction Change Orders: 0%PTSID: 0166K Design as percent of Construction: NAType: Pavement Other as percent of Construction: 32%
Route 102 1R Improvements, C‐3Budget Spent Schedule
Initial Projected Difference To Date Status Advertise NTP Site Active CompleteDesign ‐$ ‐$ NA ‐$ In Construction May‐15 Aug‐15 NA Sep‐16Construction 5.2$ 5.5$ 0.3$ 5.2$ PerformanceOther ‐$ 0.8$ NA 0.6$ Anticipated Completion at NTP May‐16Contingency 0.3$ 0.1$ (0.2)$ ‐$ # of Months Late 3 mo.Total NA 6.3$ 0.1$ 5.7$ % Construction Change Orders: 5%PTSID: 0172Y Design as percent of Construction: NAType: Pavement Other as percent of Construction: 14%
Route 146A and Park Avenue Intersection ImprovementsBudget Spent Schedule
Initial Projected Difference To Date Status Advertise NTP Site Active CompleteDesign ‐$ ‐$ NA ‐$ Subst. Complete Oct‐14 Jan‐15 NA Oct‐15Construction 0.7$ 0.8$ 0.0$ 0.6$ PerformanceOther ‐$ 0.6$ NA 0.6$ Anticipated Completion at NTP Nov‐15Contingency 0.0$ ‐$ (0.0)$ ‐$ # of Months Late ‐1 mo.Total NA 1.4$ (0.0)$ 1.2$ % Construction Change Orders: 2%PTSID: 0166D Design as percent of Construction: NAType: Pavement Other as percent of Construction: 81%
Route 37 1R ImprovementsBudget Spent Schedule
Initial Projected Difference To Date Status Advertise NTP Site Active CompleteDesign ‐$ 0.0$ NA ‐$ In Construction Apr‐15 Jul‐15 NA Jun‐16Construction 6.0$ 5.8$ (0.2)$ 4.0$ PerformanceOther ‐$ 1.1$ NA 0.9$ Anticipated Completion at NTP Jun‐16Contingency 0.3$ 0.0$ (0.3)$ ‐$ # of Months Late ‐1 mo.Total NA 7.0$ (0.4)$ 4.8$ % Construction Change Orders: ‐3%PTSID: 0173R Design as percent of Construction: NAType: Pavement Other as percent of Construction: 19%
A‐7

FFY 2015 LEGACY PROJECTS
Route 116 Knotty Oak Rd.Budget Spent Schedule
Initial Projected Difference To Date Status Advertise NTP Site Active CompleteDesign ‐$ ‐$ NA ‐$ In Construction Jun‐15 Sep‐15 NA Jul‐16Construction 1.4$ 1.5$ 0.0$ 0.8$ PerformanceOther ‐$ 0.4$ NA 0.2$ Anticipated Completion at NTP Jun‐16Contingency 0.1$ 0.0$ (0.0)$ ‐$ # of Months Late 0 mo.Total NA 1.9$ 0.0$ 1.1$ % Construction Change Orders: 3%PTSID: 0173J Design as percent of Construction: NAType: Pavement Other as percent of Construction: 26%
South/North Main Streets ADA ImprovementsBudget Spent Schedule
Initial Projected Difference To Date Status Advertise NTP Site Active CompleteDesign ‐$ 0.1$ NA ‐$ In Construction Feb‐15 Nov‐15 NA Jun‐18Construction 7.3$ 7.3$ ‐$ 0.5$ PerformanceOther ‐$ 1.9$ NA 0.2$ Anticipated Completion at NTP Jan‐18Contingency 0.4$ 0.3$ (0.0)$ ‐$ # of Months Late 4 mo.Total NA 9.6$ (0.0)$ 0.7$ % Construction Change Orders: 0%PTSID: 0078G Design as percent of Construction: NAType: Pavement Other as percent of Construction: 26%
Statewide Resurfacing 2015, C‐1Budget Spent Schedule
Initial Projected Difference To Date Status Advertise NTP Site Active CompleteDesign ‐$ ‐$ NA ‐$ In Construction Jul‐15 Dec‐15 NA Nov‐16Construction 4.1$ 4.1$ 0.0$ ‐$ PerformanceOther ‐$ 0.8$ NA 0.0$ Anticipated Completion at NTP Oct‐16Contingency 0.2$ 0.3$ 0.0$ ‐$ # of Months Late 1 mo.Total NA 5.2$ 0.1$ 0.0$ % Construction Change Orders: 1%PTSID: 0055J Design as percent of Construction: NAType: Pavement Other as percent of Construction: 20%
US Route 1, South Kingstown ImprovementsBudget Spent Schedule
Initial Projected Difference To Date Status Advertise NTP Site Active CompleteDesign ‐$ ‐$ NA ‐$ In Construction Apr‐15 Jul‐15 NA Jun‐16Construction 1.9$ 1.8$ (0.1)$ 1.2$ PerformanceOther ‐$ 0.6$ NA 0.4$ Anticipated Completion at NTP Jun‐16Contingency 0.1$ 0.0$ (0.1)$ ‐$ # of Months Late 0 mo.Total NA 2.5$ (0.2)$ 1.6$ % Construction Change Orders: ‐2%PTSID: 0173N Design as percent of Construction: NAType: Pavement Other as percent of Construction: 36%
Woonasquatucket Avenue 1R ImprovementsBudget Spent Schedule
Initial Projected Difference To Date Status Advertise NTP Site Active CompleteDesign ‐$ 0.1$ NA 0.0$ In Construction Sep‐15 Nov‐15 NA Nov‐16Construction 3.5$ 3.5$ ‐$ 0.4$ PerformanceOther ‐$ 1.2$ NA 0.3$ Anticipated Completion at NTP Nov‐16Contingency 0.2$ 0.3$ 0.1$ ‐$ # of Months Late ‐1 mo.Total NA 5.0$ 0.1$ 0.7$ % Construction Change Orders: 0%PTSID: 0172B Design as percent of Construction: NAType: Pavement Other as percent of Construction: 35%
A‐8

FFY 2015 LEGACY PROJECTS
TRAFFIC PROJECTSEnhanced Roadside & Freeway Delineation
Budget Spent ScheduleInitial Projected Difference To Date Status Advertise NTP Site Active Complete
Design ‐$ ‐$ NA ‐$ In Construction Dec‐14 Mar‐15 NA Aug‐16Construction 2.4$ 2.4$ ‐$ 1.6$ PerformanceOther ‐$ 0.8$ NA 0.5$ Anticipated Completion at NTP Aug‐16Contingency 0.1$ 0.0$ (0.1)$ ‐$ # of Months Late 0 mo.Total NA 3.3$ (0.1)$ 2.1$ % Construction Change Orders: 0%PTSID: 0011C Design as percent of Construction: 0%Type: Traffic Other as percent of Construction: 34%
North, C‐5 ‐ STCBudget Spent Schedule
Initial Projected Difference To Date Status Advertise NTP Site Active CompleteDesign ‐$ 0.1$ NA 0.1$ In Construction Aug‐15 Oct‐15 NA Aug‐16Construction 1.2$ 1.2$ ‐$ ‐$ PerformanceOther ‐$ 0.4$ NA 0.1$ Anticipated Completion at NTP Sep‐16Contingency 0.1$ 0.1$ 0.0$ ‐$ # of Months Late ‐2 mo.Total NA 1.8$ 0.0$ 0.1$ % Construction Change Orders: 0%PTSID: 0102H Design as percent of Construction: 9%Type: Traffic Other as percent of Construction: 33%
North/Central, C‐4 ‐ STCBudget Spent Schedule
Initial Projected Difference To Date Status Advertise NTP Site Active CompleteDesign ‐$ 0.0$ NA 0.0$ In Construction Mar‐15 Jun‐15 NA Oct‐16Construction 1.6$ 1.6$ ‐$ 0.7$ PerformanceOther ‐$ 0.7$ NA 0.4$ Anticipated Completion at NTP Jul‐16Contingency 0.1$ 0.1$ 0.0$ ‐$ # of Months Late 2 mo.Total NA 2.4$ 0.0$ 1.1$ % Construction Change Orders: 0%PTSID: 0102G Design as percent of Construction: 1%Type: Traffic Other as percent of Construction: 46%
Statewide DMS InstallationBudget Spent Schedule
Initial Projected Difference To Date Status Advertise NTP Site Active CompleteDesign ‐$ ‐$ NA ‐$ Subst. Complete Sep‐14 Feb‐15 NA Jan‐16Construction 2.3$ 2.3$ ‐$ 2.2$ PerformanceOther ‐$ 0.5$ NA 0.4$ Anticipated Completion at NTP Dec‐15Contingency 0.1$ ‐$ (0.1)$ ‐$ # of Months Late 0 mo.Total NA 2.8$ (0.1)$ 2.6$ % Construction Change Orders: 0%PTSID: 0122H Design as percent of Construction: 0%Type: Traffic Other as percent of Construction: 23%
TAP/OTHER PROJECTSColt State Park Bike Path Connector
Budget Spent ScheduleInitial Projected Difference To Date Status Advertise NTP Site Active Complete
Design ‐$ ‐$ NA ‐$ Subst. Complete Oct‐14 Jan‐15 NA Oct‐15Construction 1.5$ 1.5$ 0.0$ 1.4$ PerformanceOther ‐$ 0.4$ NA 0.4$ Anticipated Completion at NTP Nov‐15Contingency 0.1$ ‐$ (0.1)$ ‐$ # of Months Late ‐1 mo.Total NA 2.0$ (0.0)$ 1.8$ % Construction Change Orders: 2%PTSID: 9603B Design as percent of Construction: NAType: TAP/ Other Other as percent of Construction: 28%
A‐9

FFY 2015 LEGACY PROJECTS
Providence Station EnhancementsBudget Spent Schedule
Initial Projected Difference To Date Status Advertise NTP Site Active CompleteDesign ‐$ 0.3$ NA 0.2$ In Construction Aug‐14 Dec‐14 NA Jun‐16Construction 6.9$ 6.9$ ‐$ 5.4$ PerformanceOther ‐$ 2.0$ NA 1.9$ Anticipated Completion at NTP Jul‐16Contingency 0.3$ 0.0$ (0.3)$ ‐$ # of Months Late ‐1 mo.Total NA 9.3$ (0.3)$ 7.6$ % Construction Change Orders: 0%PTSID: 9004D Design as percent of Construction: NAType: TAP/ Other Other as percent of Construction: 30%
TRANSIT PROJECTSKingston Station Capacity & Platform Improvements (Amtrak)Budget Spent Schedule
Initial Projected Difference To Date Status Advertise NTP Site Active CompleteDesign ‐$ ‐$ NA ‐$ In Construction * Jul‐15 NA Jul‐17Construction ‐$ ‐$ NA ‐$ PerformanceOther ‐$ 26.2$ NA 11.3$ Anticipated Completion at NTP Aug‐17Contingency ‐$ 0.7$ NA ‐$ # of Months Late ‐1 mo.Total NA 27.0$ ‐$ 11.3$ % Construction Change Orders: 0%PTSID: 9650A Design as percent of Construction: NAType: Transit Other as percent of Construction: NA
MAINTENANCE & OPERATIONS PROJECTSCrack Sealing ‐ Limited Access, 2015
Budget Spent ScheduleInitial Projected Difference To Date Status Advertise NTP Site Active Complete
Design ‐$ ‐$ NA ‐$ Subst. Complete Jun‐15 Aug‐15 NA Sep‐15Construction 0.2$ 0.2$ 0.0$ 0.2$ PerformanceOther ‐$ 0.1$ NA 0.0$ Anticipated Completion at NTP Oct‐15Contingency 0.0$ 0.0$ ‐$ ‐$ # of Months Late ‐1 mo.Total NA 0.3$ 0.0$ 0.2$ % Construction Change Orders: 13%PTSID: 0086U Design as percent of Construction: 0%Type: Operating Other as percent of Construction: 30%
Fence Repair and Replacement 2015‐2016Budget Spent Schedule
Initial Projected Difference To Date Status Advertise NTP Site Active CompleteDesign ‐$ ‐$ NA ‐$ In Construction Sep‐14 Feb‐15 NA Sep‐16Construction 0.7$ 0.7$ ‐$ 0.2$ PerformanceOther ‐$ 0.1$ NA 0.0$ Anticipated Completion at NTP Nov‐16Contingency 0.0$ ‐$ (0.0)$ ‐$ # of Months Late ‐3 mo.Total NA 0.8$ (0.0)$ 0.2$ % Construction Change Orders: 0%PTSID: 7009E Design as percent of Construction: 0%Type: Operating Other as percent of Construction: 17%
Pavement Striping ‐ East Bay, 2015Budget Spent Schedule
Initial Projected Difference To Date Status Advertise NTP Site Active CompleteDesign ‐$ ‐$ NA ‐$ In Construction Feb‐15 May‐15 NA Oct‐16Construction 2.3$ 2.3$ ‐$ 0.7$ PerformanceOther ‐$ 0.3$ NA 0.2$ Anticipated Completion at NTP Dec‐16Contingency 0.1$ ‐$ (0.1)$ ‐$ # of Months Late ‐3 mo.Total NA 2.6$ (0.1)$ 0.9$ % Construction Change Orders: 0%PTSID: 0116E Design as percent of Construction: 0%Type: Operating Other as percent of Construction: 13%
A‐10

FFY 2015 LEGACY PROJECTS
Rubberized Asphalt Chip Seal, 2015Budget Spent Schedule
Initial Projected Difference To Date Status Advertise NTP Site Active CompleteDesign ‐$ ‐$ NA ‐$ In Construction Apr‐15 Jul‐15 NA Nov‐16Construction 2.0$ 2.0$ ‐$ 0.1$ PerformanceOther ‐$ 0.2$ NA 0.1$ Anticipated Completion at NTP Dec‐16Contingency 0.1$ 0.1$ (0.0)$ ‐$ # of Months Late ‐1 mo.Total NA 2.3$ (0.0)$ 0.1$ % Construction Change Orders: 0%PTSID: 0086W Design as percent of Construction: 0%Type: Operating Other as percent of Construction: 10%
West Main Road (Route 77) Chip SealBudget Spent Schedule
Initial Projected Difference To Date Status Advertise NTP Site Active CompleteDesign ‐$ ‐$ NA ‐$ In Construction Mar‐15 Jun‐15 NA Jul‐16Construction 1.3$ 1.6$ 0.3$ 1.1$ PerformanceOther ‐$ 0.1$ NA 0.1$ Anticipated Completion at NTP Aug‐16Contingency 0.1$ 0.0$ (0.0)$ ‐$ # of Months Late ‐1 mo.Total NA 1.7$ 0.2$ 1.1$ % Construction Change Orders: 22%PTSID: 0086R Design as percent of Construction: 0%Type: Operating Other as percent of Construction: 9%
A‐11


FFY 2016 PROJECTS Appendix A

FFY 2016 PROJECTS
BRIDGE PROJECTSAirport Connector & Route 2 Bridges (53C & 81B)
Budget Spent ScheduleInitial Projected Difference To Date Status Advertise NTP Site Active Complete
Design 0.2$ 0.2$ ‐$ 0.1$ In Construction Dec‐15 Mar‐16 NA Jun‐19Construction 5.7$ 5.5$ (0.3)$ ‐$ PerformanceOther 1.9$ 1.9$ ‐$ 0.1$ Anticipated Completion at NTP Jun‐19Contingency 0.4$ 0.4$ ‐$ ‐$ # of Months Late 0 mo.Total 8.2$ 8.0$ (0.3)$ 0.2$ % Construction Change Orders: 0%PTSID: 0113U Design as percent of Construction: 3%Type: Bridge Other as percent of Construction: 35%
Capron Road Bridge No. 792 (70A)Budget Spent Schedule
Initial Projected Difference To Date Status Advertise NTP Site Active CompleteDesign ‐$ 0.4$ NA 0.2$ In Design Jun‐16 Oct‐16 NA Oct‐18Construction ‐$ 3.0$ NA ‐$ PerformanceOther ‐$ 1.0$ NA 0.1$ Anticipated Completion at NTP Oct‐18Contingency ‐$ 0.5$ NA ‐$ # of Months Late 0 mo.Total NA 4.9$ ‐$ 0.3$ % Construction Change Orders: 0%PTSID: 0153E Design as percent of Construction: NAType: Bridge Other as percent of Construction: 33%
Carolina Bridges (57F)Budget Spent Schedule
Initial Projected Difference To Date Status Advertise NTP Site Active CompleteDesign ‐$ 0.2$ NA 0.0$ In Design Aug‐16 Nov‐16 NA Jun‐19Construction ‐$ 3.9$ NA ‐$ PerformanceOther ‐$ 1.1$ NA 0.1$ Anticipated Completion at NTP Jun‐19Contingency ‐$ 0.6$ NA ‐$ # of Months Late 0 mo.Total NA 5.8$ ‐$ 0.1$ % Construction Change Orders: 0%PTSID: 0145B Design as percent of Construction: NAType: Bridge Other as percent of Construction: 28%
Central Street Bridge No. 449 (70B)Budget Spent Schedule
Initial Projected Difference To Date Status Advertise NTP Site Active CompleteDesign ‐$ 0.2$ NA 0.1$ In Design Sep‐16 Dec‐16 NA Oct‐18Construction ‐$ 6.3$ NA ‐$ PerformanceOther ‐$ 1.5$ NA 0.0$ Anticipated Completion at NTP Oct‐18Contingency ‐$ 1.0$ NA ‐$ # of Months Late 0 mo.Total NA 8.9$ ‐$ 0.1$ % Construction Change Orders: 0%PTSID: 0183B Design as percent of Construction: 3%Type: Bridge Other as percent of Construction: 24%
Harbor Junction Bridge No. 131 (57E)Budget Spent Schedule
Initial Projected Difference To Date Status Advertise NTP Site Active CompleteDesign ‐$ 0.2$ NA 0.0$ Advertised Jan‐16 Apr‐16 NA Oct‐18Construction ‐$ 3.8$ NA ‐$ PerformanceOther ‐$ 2.6$ NA 0.1$ Anticipated Completion at NTP Oct‐18Contingency ‐$ 0.4$ NA ‐$ # of Months Late 0 mo.Total NA 7.0$ ‐$ 0.1$ % Construction Change Orders: 0%PTSID: 0144E Design as percent of Construction: NAType: Bridge Other as percent of Construction: 68%
A‐12

FFY 2016 PROJECTS
Mussey Brook Bridge No. 380 (56C)Budget Spent Schedule
Initial Projected Difference To Date Status Advertise NTP Site Active CompleteDesign ‐$ 0.3$ NA 0.2$ In Design Jun‐16 Sep‐16 NA May‐18Construction ‐$ 0.6$ NA ‐$ PerformanceOther ‐$ 0.6$ NA 0.0$ Anticipated Completion at NTP May‐18Contingency ‐$ 0.1$ NA ‐$ # of Months Late 0 mo.Total NA 1.7$ ‐$ 0.2$ % Construction Change Orders: 0%PTSID: 0166J Design as percent of Construction: NAType: Bridge Other as percent of Construction: 94%
Newman Avenue Bridge No. 224 (57D)Budget Spent Schedule
Initial Projected Difference To Date Status Advertise NTP Site Active CompleteDesign ‐$ 0.3$ NA ‐$ In Design Sep‐16 Jan‐17 NA Jul‐19Construction ‐$ 3.0$ NA ‐$ PerformanceOther ‐$ 1.4$ NA 0.0$ Anticipated Completion at NTP Jul‐19Contingency ‐$ 0.4$ NA ‐$ # of Months Late 0 mo.Total NA 5.1$ ‐$ 0.0$ % Construction Change Orders: 0%PTSID: 0171B Design as percent of Construction: 10%Type: Bridge Other as percent of Construction: 46%
Old Sakonnet River Bridge DemolitionBudget Spent Schedule
Initial Projected Difference To Date Status Advertise NTP Site Active CompleteDesign ‐$ 2.4$ NA 0.3$ In Design Sep‐16 Dec‐16 NA Nov‐19Construction ‐$ 15.8$ NA ‐$ PerformanceOther ‐$ 3.1$ NA 0.0$ Anticipated Completion at NTP Nov‐19Contingency ‐$ 2.4$ NA ‐$ # of Months Late 0 mo.Total NA 23.6$ ‐$ 0.3$ % Construction Change Orders: 0%PTSID: 0031N Design as percent of Construction: 15%Type: Bridge Other as percent of Construction: 20%
Pawtucket Area Bridges (53B)Budget Spent Schedule
Initial Projected Difference To Date Status Advertise NTP Site Active CompleteDesign ‐$ 0.4$ NA 0.0$ In Design Jun‐16 Oct‐16 NA Oct‐18Construction ‐$ 4.2$ NA ‐$ PerformanceOther ‐$ 1.3$ NA 0.0$ Anticipated Completion at NTP Oct‐18Contingency ‐$ 0.6$ NA ‐$ # of Months Late 0 mo.Total NA 6.5$ ‐$ 0.0$ % Construction Change Orders: 0%PTSID: 0143U Design as percent of Construction: 8%Type: Bridge Other as percent of Construction: 31%
Pawtucket Avenue Bridge No. 471 (57B)Budget Spent Schedule
Initial Projected Difference To Date Status Advertise NTP Site Active CompleteDesign ‐$ 0.1$ NA ‐$ Advertised Mar‐16 Jun‐16 NA Aug‐18Construction ‐$ 6.8$ NA ‐$ PerformanceOther ‐$ 2.1$ NA ‐$ Anticipated Completion at NTP Aug‐18Contingency ‐$ 1.0$ NA ‐$ # of Months Late 0 mo.Total NA 10.0$ ‐$ ‐$ % Construction Change Orders: 0%PTSID: 0143K Design as percent of Construction: 2%Type: Bridge Other as percent of Construction: 31%
A‐13

FFY 2016 PROJECTS
Providence Area Bridges Nos. 1080, 1082 (56B)Budget Spent Schedule
Initial Projected Difference To Date Status Advertise NTP Site Active CompleteDesign ‐$ 0.1$ NA ‐$ In Design Sep‐16 Jan‐17 NA Jun‐18Construction ‐$ 1.3$ NA ‐$ PerformanceOther ‐$ 0.6$ NA 0.0$ Anticipated Completion at NTP Jun‐18Contingency ‐$ 0.3$ NA ‐$ # of Months Late 0 mo.Total NA 2.2$ ‐$ 0.0$ % Construction Change Orders: 0%PTSID: 0012L Design as percent of Construction: 4%Type: Bridge Other as percent of Construction: 46%
Providence River Pedestrian BridgeBudget Spent Schedule
Initial Projected Difference To Date Status Advertise NTP Site Active CompleteDesign ‐$ 0.3$ NA ‐$ In Design Jul‐16 Oct‐16 NA Oct‐18Construction ‐$ 10.0$ NA ‐$ PerformanceOther ‐$ 1.4$ NA 0.0$ Anticipated Completion at NTP Oct‐18Contingency ‐$ 1.5$ NA ‐$ # of Months Late 0 mo.Total NA 13.2$ ‐$ 0.0$ % Construction Change Orders: 0%PTSID: 0012R Design as percent of Construction: 3%Type: Bridge Other as percent of Construction: 14%
Ramp EI Bridge No. 1083 (56A)Budget Spent Schedule
Initial Projected Difference To Date Status Advertise NTP Site Active CompleteDesign ‐$ 0.1$ NA ‐$ In Design Jul‐16 Oct‐16 NA Dec‐17Construction ‐$ 0.4$ NA ‐$ PerformanceOther ‐$ 0.3$ NA ‐$ Anticipated Completion at NTP Dec‐17Contingency ‐$ 0.1$ NA ‐$ # of Months Late 0 mo.Total NA 0.9$ ‐$ ‐$ % Construction Change Orders: 0%PTSID: 0012N Design as percent of Construction: NAType: Bridge Other as percent of Construction: 80%
Slatersville Stone Arch Bridge No. 273 (70C)Budget Spent Schedule
Initial Projected Difference To Date Status Advertise NTP Site Active CompleteDesign ‐$ 1.2$ NA 0.5$ In Design Sep‐16 Jan‐17 NA Sep‐19Construction ‐$ 5.0$ NA 0.0$ PerformanceOther ‐$ 2.1$ NA 0.4$ Anticipated Completion at NTP Sep‐19Contingency ‐$ 0.8$ NA ‐$ # of Months Late 0 mo.Total NA 9.1$ ‐$ 0.9$ % Construction Change Orders: 0%PTSID: 0118A Design as percent of Construction: NAType: Bridge Other as percent of Construction: 42%
South County Freeway Bridge No. 686 (52A)Budget Spent Schedule
Initial Projected Difference To Date Status Advertise NTP Site Active CompleteDesign ‐$ 0.2$ NA 0.0$ In Design Aug‐16 Nov‐16 NA Aug‐18Construction ‐$ 1.2$ NA ‐$ PerformanceOther ‐$ 1.1$ NA 0.0$ Anticipated Completion at NTP Aug‐18Contingency ‐$ 0.2$ NA ‐$ # of Months Late 0 mo.Total NA 2.7$ ‐$ 0.0$ % Construction Change Orders: 0%PTSID: 0156C Design as percent of Construction: NAType: Bridge Other as percent of Construction: 92%
A‐14

FFY 2016 PROJECTS
Tefft Hill Trail Bridge No. 592 (67T ‐ B)Budget Spent Schedule
Initial Projected Difference To Date Status Advertise NTP Site Active CompleteDesign ‐$ 0.1$ NA ‐$ Advertised Mar‐16 Jun‐16 NA Sep‐18Construction ‐$ 5.8$ NA ‐$ PerformanceOther ‐$ 1.3$ NA 0.0$ Anticipated Completion at NTP Sep‐18Contingency ‐$ 0.7$ NA ‐$ # of Months Late 0 mo.Total NA 7.9$ ‐$ 0.0$ % Construction Change Orders: 0%PTSID: 0168E Design as percent of Construction: 2%Type: Bridge Other as percent of Construction: 22%
Washington Bridge North No. 700 (57A T ‐ J)Budget Spent Schedule
Initial Projected Difference To Date Status Advertise NTP Site Active CompleteDesign ‐$ 2.9$ NA 2.1$ In Design Sep‐16 Jan‐17 NA Sep‐19Construction ‐$ 10.0$ NA ‐$ PerformanceOther ‐$ 2.8$ NA 0.2$ Anticipated Completion at NTP Sep‐19Contingency ‐$ 1.5$ NA ‐$ # of Months Late 0 mo.Total NA 17.2$ ‐$ 2.4$ % Construction Change Orders: 0%PTSID: 0009N Design as percent of Construction: 29%Type: Bridge Other as percent of Construction: 28%
Wood River & Holburton Bridges Nos. 261, 262 (58D)Budget Spent Schedule
Initial Projected Difference To Date Status Advertise NTP Site Active CompleteDesign ‐$ 0.3$ NA ‐$ In Design Aug‐16 Dec‐16 NA Dec‐18Construction ‐$ 2.4$ NA ‐$ PerformanceOther ‐$ 1.0$ NA 0.0$ Anticipated Completion at NTP Dec‐18Contingency ‐$ 0.4$ NA ‐$ # of Months Late 0 mo.Total NA 4.0$ ‐$ 0.0$ % Construction Change Orders: 0%PTSID: 0154A Design as percent of Construction: NAType: Bridge Other as percent of Construction: 42%
PAVEMENT PROJECTSHigh Street & Kingstown Road Improvements
Budget Spent ScheduleInitial Projected Difference To Date Status Advertise NTP Site Active Complete
Design ‐$ 0.3$ NA 0.1$ Advertised Mar‐16 Jul‐16 NA Aug‐18Construction ‐$ 4.6$ NA ‐$ PerformanceOther ‐$ 1.4$ NA 0.3$ Anticipated Completion at NTP Aug‐18Contingency ‐$ 0.3$ NA ‐$ # of Months Late 0 mo.Total NA 6.5$ ‐$ 0.4$ % Construction Change Orders: 0%PTSID: 0165X Design as percent of Construction: NAType: Pavement Other as percent of Construction: 31%
Providence ‐ Downtown Improvements, C‐3Budget Spent Schedule
Initial Projected Difference To Date Status Advertise NTP Site Active CompleteDesign ‐$ 0.2$ NA ‐$ Advertised Mar‐16 Jun‐16 NA May‐17Construction ‐$ 2.0$ NA ‐$ PerformanceOther ‐$ 1.0$ NA 0.0$ Anticipated Completion at NTP May‐17Contingency ‐$ 0.2$ NA ‐$ # of Months Late 0 mo.Total NA 3.3$ ‐$ 0.0$ % Construction Change Orders: 0%PTSID: 0078U Design as percent of Construction: NAType: Pavement Other as percent of Construction: 50%
A‐15

FFY 2016 PROJECTS
RI‐LEAP Westerly (Federal) ‐ Improvements to Cross St.Budget Spent Schedule
Initial Projected Difference To Date Status Advertise NTP Site Active CompleteDesign ‐$ ‐$ NA ‐$ In Design Jun‐16 Sep‐16 NA Jul‐17Construction ‐$ 0.5$ NA ‐$ PerformanceOther ‐$ 0.2$ NA ‐$ Anticipated Completion at NTP Jul‐17Contingency ‐$ 0.0$ NA ‐$ # of Months Late 0 mo.Total NA 0.7$ ‐$ ‐$ % Construction Change Orders: 0%PTSID: 0074O Design as percent of Construction: 0%Type: Pavement Other as percent of Construction: 40%
Route 107 1R ImprovementsBudget Spent Schedule
Initial Projected Difference To Date Status Advertise NTP Site Active CompleteDesign 0.4$ 0.4$ ‐$ 0.1$ In Construction Oct‐15 Mar‐16 NA Apr‐17Construction 2.6$ 2.6$ ‐$ 0.0$ PerformanceOther 1.4$ 1.4$ ‐$ 0.2$ Anticipated Completion at NTP Apr‐17Contingency 0.2$ 0.2$ ‐$ ‐$ # of Months Late 0 mo.Total 4.5$ 4.5$ ‐$ 0.3$ % Construction Change Orders: 0%PTSID: 0076N Design as percent of Construction: NAType: Pavement Other as percent of Construction: 54%
Two Mile Corner ReconstructionBudget Spent Schedule
Initial Projected Difference To Date Status Advertise NTP Site Active CompleteDesign ‐$ 0.3$ NA ‐$ Advertised Jan‐16 Apr‐16 NA Dec‐17Construction ‐$ 7.2$ NA ‐$ PerformanceOther ‐$ 6.2$ NA 1.4$ Anticipated Completion at NTP Dec‐17Contingency ‐$ 0.5$ NA ‐$ # of Months Late 0 mo.Total NA 14.2$ ‐$ 1.4$ % Construction Change Orders: 0%PTSID: 0007F Design as percent of Construction: NAType: Pavement Other as percent of Construction: 86%
TRAFFIC PROJECTSAquidneck Avenue Improvements ‐ Middletown & Tiverton
Budget Spent ScheduleInitial Projected Difference To Date Status Advertise NTP Site Active Complete
Design ‐$ 0.1$ NA ‐$ In Design Aug‐16 Nov‐16 NA May‐18Construction ‐$ 0.9$ NA ‐$ PerformanceOther ‐$ 0.6$ NA 0.0$ Anticipated Completion at NTP May‐18Contingency ‐$ 0.1$ NA ‐$ # of Months Late 0 mo.Total NA 1.7$ ‐$ 0.0$ % Construction Change Orders: 0%PTSID: 0071Q Design as percent of Construction: NAType: Traffic Other as percent of Construction: 67%
Bridge End Treatments ‐ HSIPBudget Spent Schedule
Initial Projected Difference To Date Status Advertise NTP Site Active CompleteDesign ‐$ 0.2$ NA 0.1$ In Design May‐16 Aug‐16 NA Dec‐17Construction ‐$ 1.5$ NA ‐$ PerformanceOther ‐$ 0.6$ NA 0.0$ Anticipated Completion at NTP Dec‐17Contingency ‐$ 0.2$ NA ‐$ # of Months Late 0 mo.Total NA 2.4$ ‐$ 0.1$ % Construction Change Orders: 0%PTSID: 0153P Design as percent of Construction: NAType: Traffic Other as percent of Construction: 39%
A‐16

FFY 2016 PROJECTS
Coronado Road Pedestrian EnhancementsBudget Spent Schedule
Initial Projected Difference To Date Status Advertise NTP Site Active CompleteDesign ‐$ 0.1$ NA ‐$ Advertised Jan‐16 May‐16 NA May‐17Construction ‐$ 2.0$ NA ‐$ PerformanceOther ‐$ 1.6$ NA 0.1$ Anticipated Completion at NTP May‐17Contingency ‐$ 0.2$ NA ‐$ # of Months Late 0 mo.Total NA 3.8$ ‐$ 0.1$ % Construction Change Orders: 0%PTSID: 0091K Design as percent of Construction: NAType: Traffic Other as percent of Construction: 80%
East Bay/South, C‐6 ‐ STCBudget Spent Schedule
Initial Projected Difference To Date Status Advertise NTP Site Active CompleteDesign ‐$ 0.1$ NA 0.1$ Advertised Jan‐16 May‐16 NA May‐17Construction ‐$ 0.9$ NA ‐$ PerformanceOther ‐$ 0.6$ NA 0.1$ Anticipated Completion at NTP May‐17Contingency ‐$ 0.1$ NA ‐$ # of Months Late 0 mo.Total NA 1.7$ ‐$ 0.1$ % Construction Change Orders: 0%PTSID: 0102J Design as percent of Construction: NAType: Traffic Other as percent of Construction: 65%
Memorial Blvd. & Francis Street ImprovementsBudget Spent Schedule
Initial Projected Difference To Date Status Advertise NTP Site Active CompleteDesign 0.0$ 0.0$ ‐$ ‐$ In Construction Dec‐15 Mar‐16 NA May‐17Construction 1.8$ 1.6$ (0.2)$ ‐$ PerformanceOther 0.7$ 0.7$ ‐$ 0.1$ Anticipated Completion at NTP May‐17Contingency 0.2$ 0.2$ ‐$ ‐$ # of Months Late 0 mo.Total 2.7$ 2.5$ (0.2)$ 0.1$ % Construction Change Orders: 0%PTSID: 0153R Design as percent of Construction: NAType: Traffic Other as percent of Construction: 43%
Mineral Spring Avenue HSIPBudget Spent Schedule
Initial Projected Difference To Date Status Advertise NTP Site Active CompleteDesign 0.0$ 0.0$ ‐$ ‐$ In Construction Jan‐16 Feb‐16 NA Jan‐19Construction 1.4$ 1.4$ ‐$ ‐$ PerformanceOther 0.8$ 0.8$ ‐$ 0.1$ Anticipated Completion at NTP Jan‐19Contingency 0.1$ 0.1$ ‐$ ‐$ # of Months Late 0 mo.Total 2.3$ 2.3$ ‐$ 0.1$ % Construction Change Orders: 0%PTSID: 0071V Design as percent of Construction: NAType: Traffic Other as percent of Construction: 59%
Pedestrian and Intersection Safety Improvements ‐ STCBudget Spent Schedule
Initial Projected Difference To Date Status Advertise NTP Site Active CompleteDesign ‐$ 0.2$ NA 0.0$ In Design Aug‐16 Nov‐16 NA Dec‐17Construction ‐$ 1.0$ NA ‐$ PerformanceOther ‐$ 0.5$ NA 0.0$ Anticipated Completion at NTP Dec‐17Contingency ‐$ 0.2$ NA ‐$ # of Months Late 0 mo.Total NA 1.9$ ‐$ 0.1$ % Construction Change Orders: 0%PTSID: 0080D Design as percent of Construction: NAType: Traffic Other as percent of Construction: 50%
A‐17

FFY 2016 PROJECTS
Route 102 & Route 117 Improvements ‐ RoundaboutBudget Spent Schedule
Initial Projected Difference To Date Status Advertise NTP Site Active CompleteDesign ‐$ 0.2$ NA 0.1$ In Design Sep‐16 Jan‐17 NA Oct‐18Construction ‐$ 2.1$ NA ‐$ PerformanceOther ‐$ 0.8$ NA 0.0$ Anticipated Completion at NTP Oct‐18Contingency ‐$ 0.2$ NA ‐$ # of Months Late 0 mo.Total NA 3.3$ ‐$ 0.1$ % Construction Change Orders: 0%PTSID: 0153N Design as percent of Construction: NAType: Traffic Other as percent of Construction: 38%
Traffic Signal Optimization, C‐2Budget Spent Schedule
Initial Projected Difference To Date Status Advertise NTP Site Active CompleteDesign ‐$ 0.1$ NA 0.0$ Advertised Mar‐16 Jun‐16 NA Sep‐17Construction ‐$ 1.3$ NA ‐$ PerformanceOther ‐$ 0.7$ NA 0.0$ Anticipated Completion at NTP Sep‐17Contingency ‐$ 0.1$ NA ‐$ # of Months Late 0 mo.Total NA 2.3$ ‐$ 0.1$ % Construction Change Orders: 0%PTSID: 0072K Design as percent of Construction: NAType: Traffic Other as percent of Construction: 53%
Warwick ‐ HSIPBudget Spent Schedule
Initial Projected Difference To Date Status Advertise NTP Site Active CompleteDesign ‐$ 0.3$ NA 0.1$ In Design May‐16 Aug‐16 NA Jul‐18Construction ‐$ 0.4$ NA ‐$ PerformanceOther ‐$ 0.4$ NA 0.0$ Anticipated Completion at NTP Jul‐18Contingency ‐$ 0.0$ NA ‐$ # of Months Late 0 mo.Total NA 1.1$ ‐$ 0.1$ % Construction Change Orders: 0%PTSID: 0071T Design as percent of Construction: NAType: Traffic Other as percent of Construction: 100%
TAP/OTHER PROJECTSBlackstone River Bikeway ‐ Segment 1A
Budget Spent ScheduleInitial Projected Difference To Date Status Advertise NTP Site Active Complete
Design ‐$ 0.1$ NA ‐$ In Design Apr‐16 Jul‐16 NA Sep‐17Construction ‐$ 1.3$ NA ‐$ PerformanceOther ‐$ 1.0$ NA 0.3$ Anticipated Completion at NTP Sep‐17Contingency ‐$ 0.1$ NA ‐$ # of Months Late 0 mo.Total NA 2.5$ ‐$ 0.3$ % Construction Change Orders: 0%PTSID: 0021R Design as percent of Construction: NAType: TAP/Other Other as percent of Construction: 77%
Old Stone Bridge TivertonBudget Spent Schedule
Initial Projected Difference To Date Status Advertise NTP Site Active CompleteDesign ‐$ 0.1$ NA ‐$ In Design Sep‐16 Dec‐16 NA Nov‐17Construction ‐$ 1.6$ NA ‐$ PerformanceOther ‐$ 4.2$ NA 0.4$ Anticipated Completion at NTP Nov‐17Contingency ‐$ 0.2$ NA ‐$ # of Months Late 0 mo.Total NA 6.1$ ‐$ 0.4$ % Construction Change Orders: 0%PTSID: 9005J Design as percent of Construction: 5%Type: TAP/Other Other as percent of Construction: 263%
A‐18

FFY 2016 PROJECTS
Portsmouth Maintenance FacilityBudget Spent Schedule
Initial Projected Difference To Date Status Advertise NTP Site Active CompleteDesign 0.1$ 0.1$ ‐$ ‐$ In Construction Nov‐15 Mar‐16 NA Sep‐17Construction 6.0$ 6.0$ ‐$ ‐$ PerformanceOther 0.9$ 0.9$ ‐$ ‐$ Anticipated Completion at NTP Sep‐17Contingency 0.4$ 0.4$ ‐$ ‐$ # of Months Late 0 mo.Total 7.4$ 7.4$ ‐$ ‐$ % Construction Change Orders: 0%PTSID: 0132G Design as percent of Construction: NAType: TAP/Other Other as percent of Construction: 15%
MAINTENANCE & OPERATIONS PROJECTSCrack Sealing ‐ North & East, 2016
Budget Spent ScheduleInitial Projected Difference To Date Status Advertise NTP Site Active Complete
Design ‐$ ‐$ NA ‐$ Advertised Mar‐16 Jun‐16 NA Oct‐16Construction ‐$ 0.3$ NA ‐$ PerformanceOther ‐$ 0.3$ NA 0.0$ Anticipated Completion at NTP Oct‐16Contingency ‐$ 0.0$ NA ‐$ # of Months Late 0 mo.Total NA 0.6$ ‐$ 0.0$ % Construction Change Orders: 0%PTSID: 0084Z Design as percent of Construction: 0%Type: Operating Other as percent of Construction: 101%
Crack Sealing ‐ South & Central, 2016Budget Spent Schedule
Initial Projected Difference To Date Status Advertise NTP Site Active CompleteDesign ‐$ ‐$ NA ‐$ Advertised Mar‐16 Jun‐16 NA Oct‐16Construction ‐$ 0.3$ NA ‐$ PerformanceOther ‐$ 0.2$ NA 0.0$ Anticipated Completion at NTP Oct‐16Contingency ‐$ 0.0$ NA ‐$ # of Months Late 0 mo.Total NA 0.5$ ‐$ 0.0$ % Construction Change Orders: 0%PTSID: 0084Y Design as percent of Construction: 0%Type: Operating Other as percent of Construction: 67%
Paver Placed Elastomeric Surface Treatment 2016Budget Spent Schedule
Initial Projected Difference To Date Status Advertise NTP Site Active CompleteDesign ‐$ ‐$ NA ‐$ Advertised Mar‐16 Jun‐16 NA Oct‐16Construction ‐$ 1.0$ NA ‐$ PerformanceOther ‐$ 0.4$ NA 0.0$ Anticipated Completion at NTP Oct‐16Contingency ‐$ 0.1$ NA ‐$ # of Months Late 0 mo.Total NA 1.5$ ‐$ 0.0$ % Construction Change Orders: 0%PTSID: 0084H Design as percent of Construction: 0%Type: Operating Other as percent of Construction: 39%
Rubberized Asphalt Chip Seal 2016Budget Spent Schedule
Initial Projected Difference To Date Status Advertise NTP Site Active CompleteDesign ‐$ ‐$ NA ‐$ Advertised Mar‐16 Jun‐16 NA May‐17Construction ‐$ 1.1$ NA ‐$ PerformanceOther ‐$ 0.4$ NA 0.0$ Anticipated Completion at NTP May‐17Contingency ‐$ 0.1$ NA ‐$ # of Months Late 0 mo.Total NA 1.6$ ‐$ 0.0$ % Construction Change Orders: 0%PTSID: 0084G Design as percent of Construction: 0%Type: Operating Other as percent of Construction: 36%
A‐19
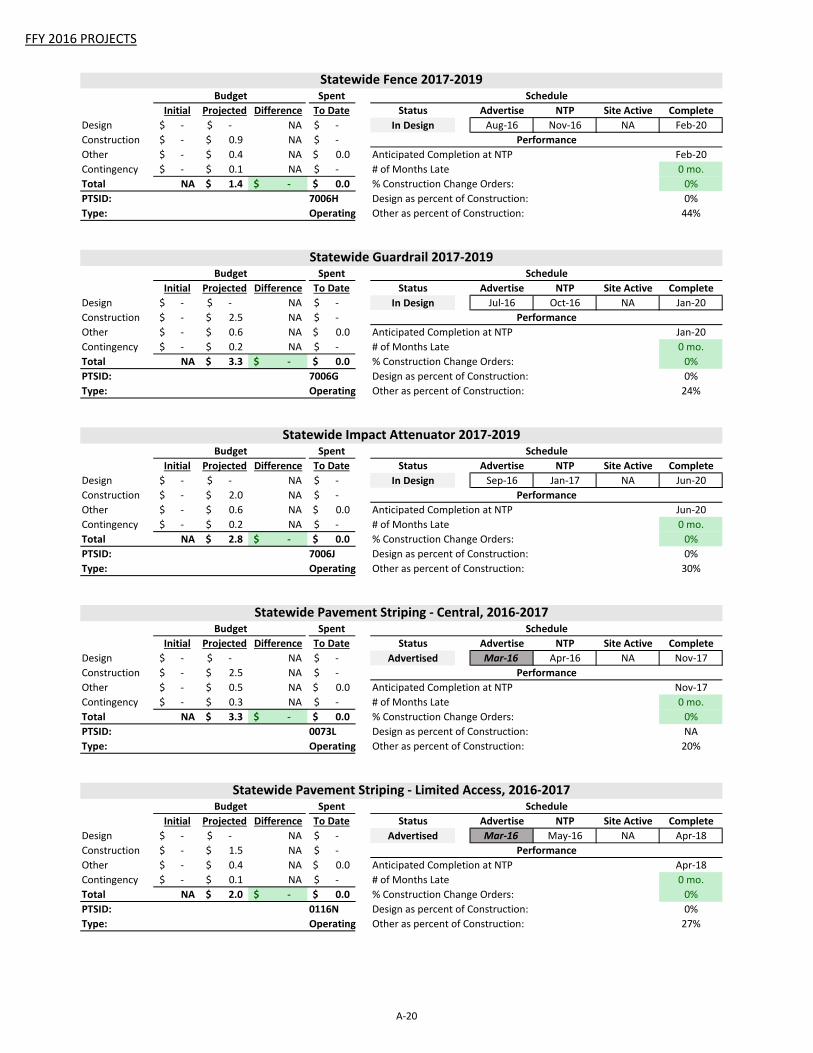
FFY 2016 PROJECTS
Statewide Fence 2017‐2019Budget Spent Schedule
Initial Projected Difference To Date Status Advertise NTP Site Active CompleteDesign ‐$ ‐$ NA ‐$ In Design Aug‐16 Nov‐16 NA Feb‐20Construction ‐$ 0.9$ NA ‐$ PerformanceOther ‐$ 0.4$ NA 0.0$ Anticipated Completion at NTP Feb‐20Contingency ‐$ 0.1$ NA ‐$ # of Months Late 0 mo.Total NA 1.4$ ‐$ 0.0$ % Construction Change Orders: 0%PTSID: 7006H Design as percent of Construction: 0%Type: Operating Other as percent of Construction: 44%
Statewide Guardrail 2017‐2019Budget Spent Schedule
Initial Projected Difference To Date Status Advertise NTP Site Active CompleteDesign ‐$ ‐$ NA ‐$ In Design Jul‐16 Oct‐16 NA Jan‐20Construction ‐$ 2.5$ NA ‐$ PerformanceOther ‐$ 0.6$ NA 0.0$ Anticipated Completion at NTP Jan‐20Contingency ‐$ 0.2$ NA ‐$ # of Months Late 0 mo.Total NA 3.3$ ‐$ 0.0$ % Construction Change Orders: 0%PTSID: 7006G Design as percent of Construction: 0%Type: Operating Other as percent of Construction: 24%
Statewide Impact Attenuator 2017‐2019Budget Spent Schedule
Initial Projected Difference To Date Status Advertise NTP Site Active CompleteDesign ‐$ ‐$ NA ‐$ In Design Sep‐16 Jan‐17 NA Jun‐20Construction ‐$ 2.0$ NA ‐$ PerformanceOther ‐$ 0.6$ NA 0.0$ Anticipated Completion at NTP Jun‐20Contingency ‐$ 0.2$ NA ‐$ # of Months Late 0 mo.Total NA 2.8$ ‐$ 0.0$ % Construction Change Orders: 0%PTSID: 7006J Design as percent of Construction: 0%Type: Operating Other as percent of Construction: 30%
Statewide Pavement Striping ‐ Central, 2016‐2017Budget Spent Schedule
Initial Projected Difference To Date Status Advertise NTP Site Active CompleteDesign ‐$ ‐$ NA ‐$ Advertised Mar‐16 Apr‐16 NA Nov‐17Construction ‐$ 2.5$ NA ‐$ PerformanceOther ‐$ 0.5$ NA 0.0$ Anticipated Completion at NTP Nov‐17Contingency ‐$ 0.3$ NA ‐$ # of Months Late 0 mo.Total NA 3.3$ ‐$ 0.0$ % Construction Change Orders: 0%PTSID: 0073L Design as percent of Construction: NAType: Operating Other as percent of Construction: 20%
Statewide Pavement Striping ‐ Limited Access, 2016‐2017Budget Spent Schedule
Initial Projected Difference To Date Status Advertise NTP Site Active CompleteDesign ‐$ ‐$ NA ‐$ Advertised Mar‐16 May‐16 NA Apr‐18Construction ‐$ 1.5$ NA ‐$ PerformanceOther ‐$ 0.4$ NA 0.0$ Anticipated Completion at NTP Apr‐18Contingency ‐$ 0.1$ NA ‐$ # of Months Late 0 mo.Total NA 2.0$ ‐$ 0.0$ % Construction Change Orders: 0%PTSID: 0116N Design as percent of Construction: 0%Type: Operating Other as percent of Construction: 27%
A‐20

FFY 2016 PROJECTS
Statewide Pavement Striping ‐ South, 2016‐2017Budget Spent Schedule
Initial Projected Difference To Date Status Advertise NTP Site Active CompleteDesign ‐$ ‐$ NA ‐$ Advertised Mar‐16 Jun‐16 NA Dec‐17Construction ‐$ 2.5$ NA ‐$ PerformanceOther ‐$ 0.6$ NA 0.0$ Anticipated Completion at NTP Dec‐17Contingency ‐$ 0.2$ NA ‐$ # of Months Late 0 mo.Total NA 3.3$ ‐$ 0.0$ % Construction Change Orders: 0%PTSID: 0073K Design as percent of Construction: NAType: Operating Other as percent of Construction: 24%
A‐21


FFY 2017 PROJECTS Appendix A

FFY 2017 PROJECTS
BRIDGE PROJECTSBig River Bridge No. 34 (57K)
Budget ScheduleInitial Projected Difference To Date Status Advertise NTP Site Active Complete
BDesign ‐$ 0.1$ NA 0.0$ In Design Oct‐16 Feb‐17 NA Sep‐19B Construction ‐$ 1.5$ NA ‐$ PerformanceBOther ‐$ 0.6$ NA 0.0$ Anticipated Completion at NTP Sep‐19B Contingency ‐$ 0.2$ NA ‐$ # of Months Late 0 mo.Total NA 2.3$ ‐$ 0.0$ % Construction Change Orders: 0%PTSID: 0143A Design as percent of Construction: NAType: Bridge Other as percent of Construction: 40%
Browning Mill Bridge No. 38 (57J) Budget Schedule
Initial Projected Difference To Date Status Advertise NTP Site Active CompleteBDesign ‐$ 0.4$ NA 0.0$ In Design Jul‐17 Oct‐17 NA Oct‐19B Construction ‐$ 0.9$ NA ‐$ PerformanceBOther ‐$ 0.6$ NA 0.0$ Anticipated Completion at NTP Oct‐19B Contingency ‐$ 0.1$ NA ‐$ # of Months Late 0 mo.Total NA 2.0$ ‐$ 0.0$ % Construction Change Orders: 0%PTSID: 0201L Design as percent of Construction: NAType: Bridge Other as percent of Construction: 66%
Central RI Bridges ‐ Group 12 (32 Bridges) Budget Schedule
Initial Projected Difference To Date Status Advertise NTP Site Active CompleteC Design ‐$ 0.8$ NA ‐$ In Design Jan‐17 May‐17 NA Jul‐19C Construction ‐$ 14.5$ NA ‐$ PerformanceC Other ‐$ 3.9$ NA ‐$ Anticipated Completion at NTP Jul‐19C Contingency ‐$ 2.2$ NA ‐$ # of Months Late 0 mo.Total NA 21.3$ ‐$ ‐$ % Construction Change Orders: 0%PTSID: 0114L Design as percent of Construction: 5%Type: Bridge Other as percent of Construction: 27%
Cumberland I‐295 Corridor Bridges (37T ‐ I) Budget Schedule
Initial Projected Difference To Date Status Advertise NTP Site Active CompleteC Design ‐$ 0.5$ NA ‐$ In Design Dec‐16 Apr‐17 NA May‐20C Construction ‐$ 6.0$ NA ‐$ PerformanceC Other ‐$ 1.6$ NA ‐$ Anticipated Completion at NTP May‐20C Contingency ‐$ 0.7$ NA ‐$ # of Months Late 0 mo.Total NA 8.8$ ‐$ ‐$ % Construction Change Orders: 0%PTSID: 0114S Design as percent of Construction: 8%Type: Bridge Other as percent of Construction: 27%
Division Street Bridge No. 760 (58A) Budget Schedule
Initial Projected Difference To Date Status Advertise NTP Site Active CompleteDDesign ‐$ 0.7$ NA 0.3$ In Design Jan‐17 Apr‐17 NA May‐19DConstruction ‐$ 5.0$ NA ‐$ PerformanceDOther ‐$ 1.6$ NA 0.0$ Anticipated Completion at NTP May‐19DContingency ‐$ 0.6$ NA ‐$ # of Months Late 0 mo.Total NA 7.9$ ‐$ 0.3$ % Construction Change Orders: 0%PTSID: 0156D Design as percent of Construction: NAType: Bridge Other as percent of Construction: 32%
A‐22

FFY 2017 PROJECTS
Farnum Pike Bridges Nos. 44101, 44121 (38T ‐ L)
Budget ScheduleInitial Projected Difference To Date Status Advertise NTP Site Active Complete
F Design ‐$ 0.3$ NA ‐$ In Design Aug‐17 Jan‐18 NA Aug‐19F Construction ‐$ 9.0$ NA ‐$ PerformanceF Other ‐$ 3.0$ NA ‐$ Anticipated Completion at NTP Aug‐19F Contingency ‐$ 1.4$ NA ‐$ # of Months Late 0 mo.Total NA 13.7$ ‐$ ‐$ % Construction Change Orders: 0%PTSID: 0114J Design as percent of Construction: 3%Type: Bridge Other as percent of Construction: 33%
Gorton RR Bridge No. 841 (57L) Budget Schedule
Initial Projected Difference To Date Status Advertise NTP Site Active CompleteGDesign ‐$ 0.1$ NA ‐$ In Design Dec‐16 Apr‐17 NA Oct‐19GConstruction ‐$ 1.5$ NA ‐$ PerformanceGOther ‐$ 0.7$ NA ‐$ Anticipated Completion at NTP Oct‐19GContingency ‐$ 0.2$ NA ‐$ # of Months Late 0 mo.Total NA 2.5$ ‐$ ‐$ % Construction Change Orders: 0%PTSID: 0114B Design as percent of Construction: 8%Type: Bridge Other as percent of Construction: 47%
Hope Valley Bridges (69D) Budget Schedule
Initial Projected Difference To Date Status Advertise NTP Site Active CompleteHDesign ‐$ 0.6$ NA ‐$ In Design May‐17 Sep‐17 NA Sep‐20HConstruction ‐$ 4.0$ NA ‐$ PerformanceHOther ‐$ 2.0$ NA ‐$ Anticipated Completion at NTP Sep‐20HContingency ‐$ 0.6$ NA ‐$ # of Months Late 0 mo.Total NA 7.2$ ‐$ ‐$ % Construction Change Orders: 0%PTSID: 0168H Design as percent of Construction: 15%Type: Bridge Other as percent of Construction: 50%
Horton Farm Bridge No. 472 (57M) Budget Schedule
Initial Projected Difference To Date Status Advertise NTP Site Active CompleteHDesign ‐$ 1.5$ NA ‐$ In Design Apr‐17 Jul‐17 NA Nov‐19HConstruction ‐$ 10.5$ NA ‐$ PerformanceHOther ‐$ 3.1$ NA ‐$ Anticipated Completion at NTP Nov‐19HContingency ‐$ 1.5$ NA ‐$ # of Months Late 0 mo.Total NA 16.6$ ‐$ ‐$ % Construction Change Orders: 0%PTSID: 0143W Design as percent of Construction: NAType: Bridge Other as percent of Construction: 30%
I‐195 Corridor Bridges (77) Budget Schedule
Initial Projected Difference To Date Status Advertise NTP Site Active CompleteI‐Design ‐$ 0.8$ NA ‐$ In Design Sep‐17 Dec‐17 NA Jul‐20I‐Construction ‐$ 10.8$ NA ‐$ PerformanceI‐Other ‐$ 3.6$ NA ‐$ Anticipated Completion at NTP Jul‐20I‐Contingency ‐$ 1.6$ NA ‐$ # of Months Late 0 mo.Total NA 16.8$ ‐$ ‐$ % Construction Change Orders: 0%PTSID: 0013M Design as percent of Construction: 7%Type: Bridge Other as percent of Construction: 33%
A‐23

FFY 2017 PROJECTS
I‐295 & Route 6 Bridges Nos. 730, 732, 736, 737, 757 (9T ‐ G, H) Budget Schedule
Initial Projected Difference To Date Status Advertise NTP Site Active CompleteI‐Design ‐$ 1.0$ NA ‐$ In Design Sep‐17 Dec‐17 NA May‐20I‐Construction ‐$ 25.0$ NA ‐$ PerformanceI‐Other ‐$ 6.3$ NA ‐$ Anticipated Completion at NTP May‐20I‐Contingency ‐$ 5.2$ NA ‐$ # of Months Late 0 mo.Total NA 37.5$ ‐$ ‐$ % Construction Change Orders: 0%PTSID: 0114Q Design as percent of Construction: 4%Type: Bridge Other as percent of Construction: 25%
I‐295 North at Route 6 Bridge. 737 (69T ‐ H) Budget Schedule
Initial Projected Difference To Date Status Advertise NTP Site Active CompleteI‐Design ‐$ 0.6$ NA ‐$ In Design Sep‐17 Dec‐17 NA Dec‐19I‐Construction ‐$ 7.0$ NA ‐$ PerformanceI‐Other ‐$ 1.8$ NA ‐$ Anticipated Completion at NTP Dec‐19I‐Contingency ‐$ 1.1$ NA ‐$ # of Months Late 0 mo.Total NA 10.5$ ‐$ ‐$ % Construction Change Orders: 0%PTSID: 0114G Design as percent of Construction: 9%Type: Bridge Other as percent of Construction: 26%
I‐95 Corridor Bridge Nos. 56101, 56102, 56201, 56221 (3T ‐ F) Budget Schedule
Initial Projected Difference To Date Status Advertise NTP Site Active CompleteI‐Design ‐$ 0.2$ NA ‐$ In Design Sep‐17 Jan‐18 NA Apr‐20I‐Construction ‐$ 7.0$ NA ‐$ PerformanceI‐Other ‐$ 1.9$ NA ‐$ Anticipated Completion at NTP Apr‐20I‐Contingency ‐$ 1.1$ NA ‐$ # of Months Late 0 mo.Total NA 10.1$ ‐$ ‐$ % Construction Change Orders: 0%PTSID: 0114R Design as percent of Construction: 2%Type: Bridge Other as percent of Construction: 27%
I‐95 North & South Bridges at Toll Gate Road Nos. 683, 684 (5T ‐ B2, C) Budget Schedule
Initial Projected Difference To Date Status Advertise NTP Site Active CompleteI‐Design ‐$ 1.0$ NA ‐$ In Design Aug‐17 Nov‐17 NA Dec‐19I‐Construction ‐$ 15.0$ NA ‐$ PerformanceI‐Other ‐$ 3.5$ NA ‐$ Anticipated Completion at NTP Dec‐19I‐Contingency ‐$ 1.5$ NA ‐$ # of Months Late 0 mo.Total NA 21.0$ ‐$ ‐$ % Construction Change Orders: 0%PTSID: 0114P Design as percent of Construction: 7%Type: Bridge Other as percent of Construction: 23%
Louisquisset Pike North Bridge, I‐295 SB Over Route 5 (35T ‐ H) Budget Schedule
Initial Projected Difference To Date Status Advertise NTP Site Active CompleteLoDesign ‐$ 0.1$ NA ‐$ In Design Dec‐16 Mar‐17 NA Dec‐19LoConstruction ‐$ 3.0$ NA ‐$ PerformanceLoOther ‐$ 1.1$ NA ‐$ Anticipated Completion at NTP Dec‐19LoContingency ‐$ 0.5$ NA ‐$ # of Months Late 0 mo.Total NA 4.7$ ‐$ ‐$ % Construction Change Orders: 0%PTSID: 0114H Design as percent of Construction: 4%Type: Bridge Other as percent of Construction: 37%
A‐24

FFY 2017 PROJECTS
Oxford Street Bridge No. 653 (2T) Budget Schedule
Initial Projected Difference To Date Status Advertise NTP Site Active CompleteODesign ‐$ 0.3$ NA ‐$ In Design Dec‐16 Mar‐17 NA Dec‐18OConstruction ‐$ 4.0$ NA ‐$ PerformanceOOther ‐$ 0.9$ NA ‐$ Anticipated Completion at NTP Dec‐18OContingency ‐$ 0.5$ NA ‐$ # of Months Late 0 mo.Total NA 5.7$ ‐$ ‐$ % Construction Change Orders: 0%PTSID: 0114N Design as percent of Construction: 8%Type: Bridge Other as percent of Construction: 23%
Park Avenue RR Bridge No. 922 (59A) Budget Schedule
Initial Projected Difference To Date Status Advertise NTP Site Active CompleteP Design ‐$ 0.2$ NA 0.0$ In Design Jan‐17 May‐17 NA Jul‐18P Construction ‐$ 2.0$ NA ‐$ PerformanceP Other ‐$ 0.6$ NA 0.0$ Anticipated Completion at NTP Jul‐18P Contingency ‐$ 0.3$ NA ‐$ # of Months Late 0 mo.Total NA 3.0$ ‐$ 0.1$ % Construction Change Orders: 0%PTSID: 0194C Design as percent of Construction: 10%Type: Bridge Other as percent of Construction: 30%
Pine Street Bridge No. 548 (31) Budget Schedule
Initial Projected Difference To Date Status Advertise NTP Site Active CompleteP Design ‐$ 0.4$ NA ‐$ In Design Aug‐17 Dec‐17 NA Dec‐19P Construction ‐$ 4.8$ NA ‐$ PerformanceP Other ‐$ 1.6$ NA ‐$ Anticipated Completion at NTP Dec‐19P Contingency ‐$ 0.7$ NA ‐$ # of Months Late 0 mo.Total NA 7.4$ ‐$ ‐$ % Construction Change Orders: 0%PTSID: 0016J Design as percent of Construction: 7%Type: Bridge Other as percent of Construction: 34%
Route 146 Corridor Bridges (38) Budget Schedule
Initial Projected Difference To Date Status Advertise NTP Site Active CompleteRDesign ‐$ 0.6$ NA ‐$ In Design Sep‐17 Jan‐18 NA Jun‐20R Construction ‐$ 9.4$ NA ‐$ PerformanceROther ‐$ 5.5$ NA ‐$ Anticipated Completion at NTP Jun‐20R Contingency ‐$ 1.4$ NA ‐$ # of Months Late 0 mo.Total NA 16.9$ ‐$ ‐$ % Construction Change Orders: 0%PTSID: 0013L Design as percent of Construction: 6%Type: Bridge Other as percent of Construction: 59%
Simmonsville Bridge No. 326 (57C) Budget Schedule
Initial Projected Difference To Date Status Advertise NTP Site Active CompleteS Design ‐$ 0.1$ NA ‐$ In Design Jun‐17 Sep‐17 NA Dec‐18S Construction ‐$ 0.5$ NA ‐$ PerformanceS Other ‐$ 0.8$ NA ‐$ Anticipated Completion at NTP Dec‐18S Contingency ‐$ 0.1$ NA ‐$ # of Months Late 0 mo.Total NA 1.5$ ‐$ ‐$ % Construction Change Orders: 0%PTSID: 0014F Design as percent of Construction: NAType: Bridge Other as percent of Construction: 160%
A‐25

FFY 2017 PROJECTS
Victory Highway Bridge No. 589 (71) Budget Schedule
Initial Projected Difference To Date Status Advertise NTP Site Active CompleteVDesign ‐$ 0.4$ NA ‐$ In Design Feb‐17 May‐17 NA Jun‐20VConstruction ‐$ 7.5$ NA ‐$ PerformanceVOther ‐$ 2.5$ NA 0.0$ Anticipated Completion at NTP Jun‐20VContingency ‐$ 1.3$ NA ‐$ # of Months Late 0 mo.Total NA 11.6$ ‐$ 0.0$ % Construction Change Orders: 0%PTSID: 0168G Design as percent of Construction: NAType: Bridge Other as percent of Construction: 33%
Wood River Valley Bridge No. 404, I‐95 North & South (7T ‐ A) Budget Schedule
Initial Projected Difference To Date Status Advertise NTP Site Active CompleteWDesign ‐$ 0.2$ NA ‐$ In Design Dec‐16 Apr‐17 NA Dec‐18WConstruction ‐$ 6.8$ NA ‐$ PerformanceWOther ‐$ 1.1$ NA ‐$ Anticipated Completion at NTP Dec‐18WContingency ‐$ 1.0$ NA ‐$ # of Months Late 0 mo.Total NA 9.1$ ‐$ ‐$ % Construction Change Orders: 0%PTSID: 0114K Design as percent of Construction: 3%Type: Bridge Other as percent of Construction: 16%
PAVEMENT PROJECTSEast Main Road 1R Improvements
Budget ScheduleInitial Projected Difference To Date Status Advertise NTP Site Active Complete
E Design ‐$ 0.5$ NA ‐$ In Design Dec‐16 Apr‐17 NA Nov‐18E Construction ‐$ 5.4$ NA ‐$ PerformanceE Other ‐$ 2.1$ NA 0.0$ Anticipated Completion at NTP Nov‐18E Contingency ‐$ 0.8$ NA ‐$ # of Months Late 0 mo.Total NA 8.8$ ‐$ 0.0$ % Construction Change Orders: 0%PTSID: 0007C Design as percent of Construction: NAType: Pavement Other as percent of Construction: 39%
I‐95 Resurfacing (Elmwood Avenue to Eddy St) Budget Schedule
Initial Projected Difference To Date Status Advertise NTP Site Active CompleteI‐Design ‐$ 0.3$ NA ‐$ In Design Nov‐16 Mar‐17 NA May‐18I‐Construction ‐$ 8.0$ NA ‐$ PerformanceI‐Other ‐$ 2.5$ NA ‐$ Anticipated Completion at NTP May‐18I‐Contingency ‐$ 1.2$ NA ‐$ # of Months Late 0 mo.Total NA 12.0$ ‐$ ‐$ % Construction Change Orders: 0%PTSID: 0079G Design as percent of Construction: NAType: Pavement Other as percent of Construction: 31%
I‐95 Resurfacing, C‐2 (Pawtucket) Budget Schedule
Initial Projected Difference To Date Status Advertise NTP Site Active CompleteI‐Design ‐$ 0.4$ NA ‐$ In Design Jul‐17 Oct‐17 NA Nov‐18I‐Construction ‐$ 3.0$ NA ‐$ PerformanceI‐Other ‐$ 1.3$ NA 0.0$ Anticipated Completion at NTP Nov‐18I‐Contingency ‐$ 0.4$ NA ‐$ # of Months Late 0 mo.Total NA 5.0$ ‐$ 0.0$ % Construction Change Orders: 0%PTSID: 0082C Design as percent of Construction: NAType: Pavement Other as percent of Construction: 43%
A‐26

FFY 2017 PROJECTS
Route 146 Improvements Budget Schedule
Initial Projected Difference To Date Status Advertise NTP Site Active CompleteRDesign ‐$ 0.7$ NA 0.1$ In Design Mar‐17 Jun‐17 NA Sep‐18R Construction ‐$ 10.0$ NA ‐$ PerformanceROther ‐$ 2.7$ NA 0.0$ Anticipated Completion at NTP Sep‐18R Contingency ‐$ 1.3$ NA ‐$ # of Months Late 0 mo.Total NA 14.7$ ‐$ 0.1$ % Construction Change Orders: 0%PTSID: 0081W Design as percent of Construction: NAType: Pavement Other as percent of Construction: 27%
Route 24 Improvements Budget Schedule
Initial Projected Difference To Date Status Advertise NTP Site Active CompleteRDesign ‐$ 0.3$ NA 0.1$ In Design Jun‐17 Sep‐17 NA Sep‐18R Construction ‐$ 6.0$ NA ‐$ PerformanceROther ‐$ 2.3$ NA 0.0$ Anticipated Completion at NTP Sep‐18R Contingency ‐$ 0.6$ NA ‐$ # of Months Late 0 mo.Total NA 9.2$ ‐$ 0.1$ % Construction Change Orders: 0%PTSID: 0081R Design as percent of Construction: NAType: Pavement Other as percent of Construction: 38%
Route 4 Improvements, C‐2 Budget Schedule
Initial Projected Difference To Date Status Advertise NTP Site Active CompleteRDesign ‐$ 0.1$ NA 0.0$ In Design Nov‐16 Mar‐17 NA Aug‐18R Construction ‐$ 5.5$ NA ‐$ PerformanceROther ‐$ 1.9$ NA 0.0$ Anticipated Completion at NTP Aug‐18R Contingency ‐$ 0.7$ NA ‐$ # of Months Late 0 mo.Total NA 8.2$ ‐$ 0.0$ % Construction Change Orders: 0%PTSID: 0166H Design as percent of Construction: NAType: Pavement Other as percent of Construction: 35%
Snell Road Improvements Budget Schedule
Initial Projected Difference To Date Status Advertise NTP Site Active CompleteS Design ‐$ 0.1$ NA ‐$ In Design Jul‐17 Oct‐17 NA Dec‐18S Construction ‐$ 0.8$ NA ‐$ PerformanceS Other ‐$ 0.5$ NA ‐$ Anticipated Completion at NTP Dec‐18S Contingency ‐$ 0.1$ NA ‐$ # of Months Late 0 mo.Total NA 1.5$ ‐$ ‐$ % Construction Change Orders: 0%PTSID: 0173S Design as percent of Construction: NAType: Pavement Other as percent of Construction: 63%
Statewide Resurfacing C‐2, 2017 Budget Schedule
Initial Projected Difference To Date Status Advertise NTP Site Active CompleteStDesign ‐$ 0.1$ NA ‐$ In Design Nov‐16 Feb‐17 NA Nov‐17StConstruction ‐$ 2.0$ NA ‐$ PerformanceStOther ‐$ 1.1$ NA 0.0$ Anticipated Completion at NTP Nov‐17StContingency ‐$ 0.3$ NA ‐$ # of Months Late 0 mo.Total NA 3.5$ ‐$ 0.0$ % Construction Change Orders: 0%PTSID: 0055K Design as percent of Construction: NAType: Pavement Other as percent of Construction: 55%
A‐27
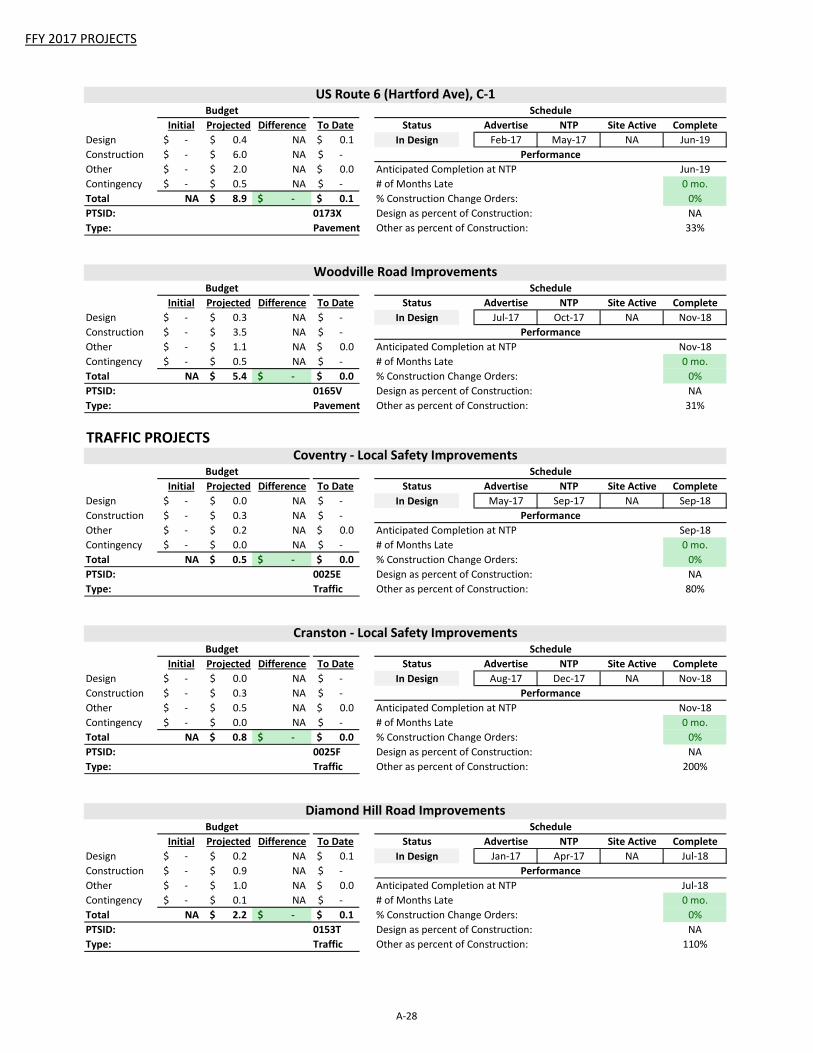
FFY 2017 PROJECTS
US Route 6 (Hartford Ave), C‐1 Budget Schedule
Initial Projected Difference To Date Status Advertise NTP Site Active CompleteUDesign ‐$ 0.4$ NA 0.1$ In Design Feb‐17 May‐17 NA Jun‐19UConstruction ‐$ 6.0$ NA ‐$ PerformanceUOther ‐$ 2.0$ NA 0.0$ Anticipated Completion at NTP Jun‐19UContingency ‐$ 0.5$ NA ‐$ # of Months Late 0 mo.Total NA 8.9$ ‐$ 0.1$ % Construction Change Orders: 0%PTSID: 0173X Design as percent of Construction: NAType: Pavement Other as percent of Construction: 33%
Woodville Road Improvements Budget Schedule
Initial Projected Difference To Date Status Advertise NTP Site Active CompleteWDesign ‐$ 0.3$ NA ‐$ In Design Jul‐17 Oct‐17 NA Nov‐18WConstruction ‐$ 3.5$ NA ‐$ PerformanceWOther ‐$ 1.1$ NA 0.0$ Anticipated Completion at NTP Nov‐18WContingency ‐$ 0.5$ NA ‐$ # of Months Late 0 mo.Total NA 5.4$ ‐$ 0.0$ % Construction Change Orders: 0%PTSID: 0165V Design as percent of Construction: NAType: Pavement Other as percent of Construction: 31%
TRAFFIC PROJECTSCoventry ‐ Local Safety Improvements
Budget ScheduleInitial Projected Difference To Date Status Advertise NTP Site Active Complete
C Design ‐$ 0.0$ NA ‐$ In Design May‐17 Sep‐17 NA Sep‐18C Construction ‐$ 0.3$ NA ‐$ PerformanceC Other ‐$ 0.2$ NA 0.0$ Anticipated Completion at NTP Sep‐18C Contingency ‐$ 0.0$ NA ‐$ # of Months Late 0 mo.Total NA 0.5$ ‐$ 0.0$ % Construction Change Orders: 0%PTSID: 0025E Design as percent of Construction: NAType: Traffic Other as percent of Construction: 80%
Cranston ‐ Local Safety Improvements Budget Schedule
Initial Projected Difference To Date Status Advertise NTP Site Active CompleteC Design ‐$ 0.0$ NA ‐$ In Design Aug‐17 Dec‐17 NA Nov‐18C Construction ‐$ 0.3$ NA ‐$ PerformanceC Other ‐$ 0.5$ NA 0.0$ Anticipated Completion at NTP Nov‐18C Contingency ‐$ 0.0$ NA ‐$ # of Months Late 0 mo.Total NA 0.8$ ‐$ 0.0$ % Construction Change Orders: 0%PTSID: 0025F Design as percent of Construction: NAType: Traffic Other as percent of Construction: 200%
Diamond Hill Road Improvements Budget Schedule
Initial Projected Difference To Date Status Advertise NTP Site Active CompleteDDesign ‐$ 0.2$ NA 0.1$ In Design Jan‐17 Apr‐17 NA Jul‐18DConstruction ‐$ 0.9$ NA ‐$ PerformanceDOther ‐$ 1.0$ NA 0.0$ Anticipated Completion at NTP Jul‐18DContingency ‐$ 0.1$ NA ‐$ # of Months Late 0 mo.Total NA 2.2$ ‐$ 0.1$ % Construction Change Orders: 0%PTSID: 0153T Design as percent of Construction: NAType: Traffic Other as percent of Construction: 110%
A‐28

FFY 2017 PROJECTS
High Friction Surface Treatments 2016 Budget Schedule
Initial Projected Difference To Date Status Advertise NTP Site Active CompleteHDesign ‐$ 0.1$ NA 0.0$ In Design Jan‐17 Apr‐17 NA Jan‐18HConstruction ‐$ 0.8$ NA ‐$ PerformanceHOther ‐$ 0.4$ NA 0.0$ Anticipated Completion at NTP Jan‐18HContingency ‐$ 0.1$ NA ‐$ # of Months Late 0 mo.Total NA 1.3$ ‐$ 0.0$ % Construction Change Orders: 0%PTSID: 0025J Design as percent of Construction: NAType: Traffic Other as percent of Construction: 53%
Metacom Avenue ‐ HSIP Budget Schedule
Initial Projected Difference To Date Status Advertise NTP Site Active CompleteMDesign ‐$ 0.1$ NA ‐$ In Design Oct‐16 Jan‐17 NA Nov‐18MConstruction ‐$ 2.7$ NA ‐$ PerformanceMOther ‐$ 1.8$ NA 0.0$ Anticipated Completion at NTP Nov‐18MContingency ‐$ 0.3$ NA ‐$ # of Months Late 0 mo.Total NA 4.9$ ‐$ 0.0$ % Construction Change Orders: 0%PTSID: 0071P Design as percent of Construction: NAType: Traffic Other as percent of Construction: 66%
North ‐ Johnston, C‐3 ‐ HSIP Budget Schedule
Initial Projected Difference To Date Status Advertise NTP Site Active CompleteNDesign ‐$ 0.2$ NA 0.1$ In Design Oct‐16 Feb‐17 NA Dec‐17NConstruction ‐$ 0.7$ NA ‐$ PerformanceNOther ‐$ 0.5$ NA 0.0$ Anticipated Completion at NTP Dec‐17NContingency ‐$ 0.1$ NA ‐$ # of Months Late 0 mo.Total NA 1.5$ ‐$ 0.1$ % Construction Change Orders: 0%PTSID: 0072S Design as percent of Construction: NAType: Traffic Other as percent of Construction: 71%
South (Route 2 and Route 102 Roundabout) ‐ HSIP Budget Schedule
Initial Projected Difference To Date Status Advertise NTP Site Active CompleteS Design ‐$ 0.3$ NA ‐$ In Design Mar‐17 Jun‐17 NA Sep‐18S Construction ‐$ 2.5$ NA ‐$ PerformanceS Other ‐$ 1.1$ NA 0.0$ Anticipated Completion at NTP Sep‐18S Contingency ‐$ 0.3$ NA ‐$ # of Months Late 0 mo.Total NA 4.1$ ‐$ 0.0$ % Construction Change Orders: 0%PTSID: 0071U Design as percent of Construction: NAType: Traffic Other as percent of Construction: 44%
Traffic Signal Optimization, C‐3, 2016 Budget Schedule
Initial Projected Difference To Date Status Advertise NTP Site Active CompleteT Design ‐$ 0.2$ NA 0.0$ In Design Jan‐17 Apr‐17 NA Nov‐18T Construction ‐$ 1.0$ NA ‐$ PerformanceT Other ‐$ 0.5$ NA 0.0$ Anticipated Completion at NTP Nov‐18T Contingency ‐$ 0.1$ NA ‐$ # of Months Late 0 mo.Total NA 1.8$ ‐$ 0.0$ % Construction Change Orders: 0%PTSID: 0072J Design as percent of Construction: NAType: Traffic Other as percent of Construction: 50%
A‐29

FFY 2017 PROJECTS
STORMWATER PROJECTSHigh Street/Kingstown Road Stormwater Mitigation
Budget ScheduleInitial Projected Difference To Date Status Advertise NTP Site Active Complete
HDesign ‐$ 0.1$ NA ‐$ In Design Jun‐17 Oct‐17 NA Apr‐19HConstruction ‐$ 0.4$ NA ‐$ PerformanceHOther ‐$ 0.5$ NA ‐$ Anticipated Completion at NTP Apr‐19HContingency ‐$ 0.1$ NA ‐$ # of Months Late 0 mo.Total NA 1.0$ ‐$ ‐$ % Construction Change Orders: 0%PTSID: 0166M Design as percent of Construction: 29%Type: Stormwater Other as percent of Construction: 143%
A‐30

Project Summary Lists Appendix A

LEGACY PROGRAMPTSID Project Name Locations Type Appendix Schedule Construction
Pg # Advertise Date NTP Date Est. Complete Date BudgetBRIDGE PROJECTS
1 9500A Arcadia Management Area Bridge Replacement RIC HOP COV Bridge A‐1 Prior to 2015 Prior to 2015 Dec‐16 $0.52 0163J Atwells Ave Bridge No. 975 Replacement PVD Bridge A‐1 Prior to 2015 Prior to 2015 Jul‐16 $2.8
3 0153CCentral Bridge No. 018201 & Access Improvements to Route 114
BAR Bridge A‐1 Prior to 2015 Prior to 2015 May‐17 $15.5
4 0144B Great Island Bridge #499 NAR Bridge A‐1 Prior to 2015 Prior to 2015 May‐17 $8.75 0049M Jamestown‐Verrazzano Bridge No. 800 & Cove Bridge No. 495 JAM POR Bridge A‐1 Prior to 2015 Prior to 2015 Dec‐15 $4.86 0018A New Providence Viaduct Southbound Bridge No. 578 PVD Bridge A‐2 Prior to 2015 Prior to 2015 May‐17 $74.4
PAVEMENT PROJECTS7 0185A Apponaug Circulator By‐Pass WAR Pavement A‐2 Prior to 2015 Prior to 2015 Nov‐17 $29.88 0012E I‐195 Relocation ‐ Landscape Contract C PVD EPR Pavement A‐2 Prior to 2015 Prior to 2015 Nov‐16 $0.8
TRAFFIC PROJECTS9 0115Z I‐95 Highway LED Lighting ‐ Exits 1, 2, 4, 5 and Weigh Stations WES HOP WGR Traffic A‐2 Prior to 2015 Prior to 2015 Feb‐16 $2.6
RIC10 0058L I‐95 Sustainability – Phase I PVD Traffic A‐2 Prior to 2015 Prior to 2015 Nov‐16 $0.6
MAINTENANCE & OPERATIONS PROJECTS11 7006F Guardrail Repair and Replacement 2014‐2016 Statewide Operating A‐3 Prior to 2015 Prior to 2015 Jun‐16 $2.212 7005F Impact Attenuator Repair and Replacement 2014‐2016 Statewide Operating A‐3 Prior to 2015 Prior to 2015 Sep‐16 $1.6
TOTALS $144.3
A‐31
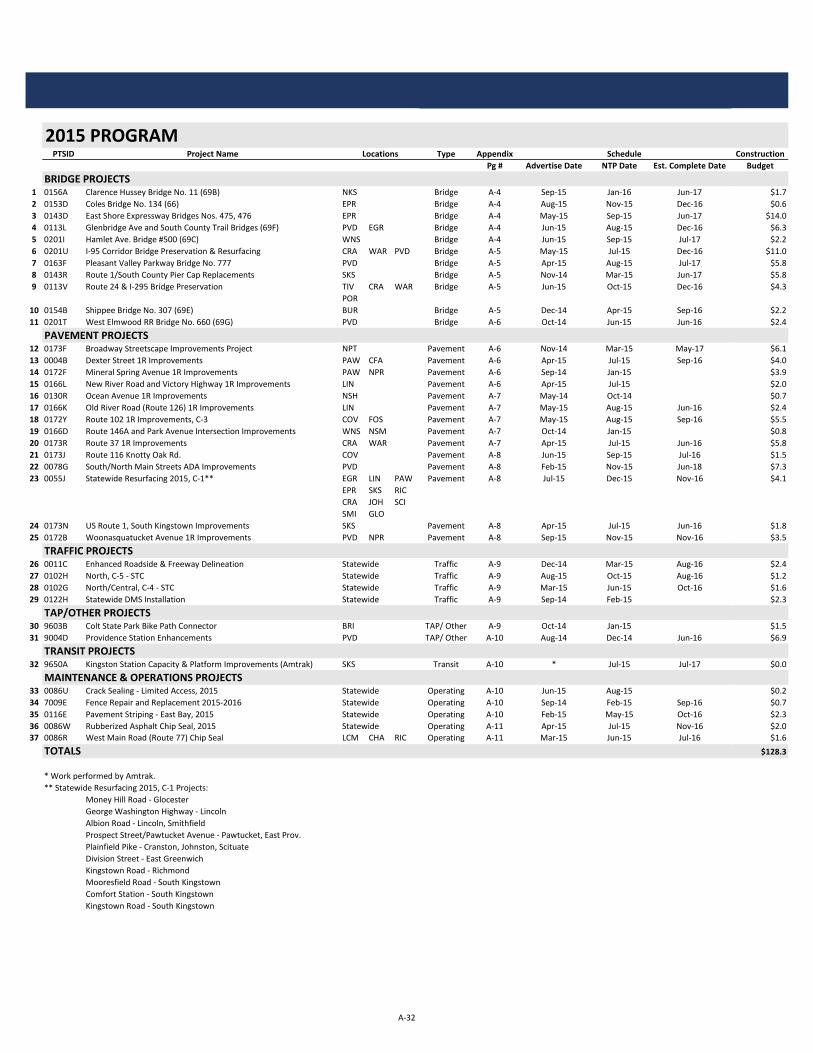
2015 PROGRAMPTSID Project Name Locations Type Appendix Schedule Construction
Pg # Advertise Date NTP Date Est. Complete Date BudgetBRIDGE PROJECTS
1 0156A Clarence Hussey Bridge No. 11 (69B) NKS Bridge A‐4 Sep‐15 Jan‐16 Jun‐17 $1.72 0153D Coles Bridge No. 134 (66) EPR Bridge A‐4 Aug‐15 Nov‐15 Dec‐16 $0.63 0143D East Shore Expressway Bridges Nos. 475, 476 EPR Bridge A‐4 May‐15 Sep‐15 Jun‐17 $14.04 0113L Glenbridge Ave and South County Trail Bridges (69F) PVD EGR Bridge A‐4 Jun‐15 Aug‐15 Dec‐16 $6.35 0201I Hamlet Ave. Bridge #500 (69C) WNS Bridge A‐4 Jun‐15 Sep‐15 Jul‐17 $2.26 0201U I‐95 Corridor Bridge Preservation & Resurfacing CRA WAR PVD Bridge A‐5 May‐15 Jul‐15 Dec‐16 $11.07 0163F Pleasant Valley Parkway Bridge No. 777 PVD Bridge A‐5 Apr‐15 Aug‐15 Jul‐17 $5.88 0143R Route 1/South County Pier Cap Replacements SKS Bridge A‐5 Nov‐14 Mar‐15 Jun‐17 $5.89 0113V Route 24 & I‐295 Bridge Preservation TIV CRA WAR Bridge A‐5 Jun‐15 Oct‐15 Dec‐16 $4.3
POR10 0154B Shippee Bridge No. 307 (69E) BUR Bridge A‐5 Dec‐14 Apr‐15 Sep‐16 $2.211 0201T West Elmwood RR Bridge No. 660 (69G) PVD Bridge A‐6 Oct‐14 Jun‐15 Jun‐16 $2.4
PAVEMENT PROJECTS12 0173F Broadway Streetscape Improvements Project NPT Pavement A‐6 Nov‐14 Mar‐15 May‐17 $6.113 0004B Dexter Street 1R Improvements PAW CFA Pavement A‐6 Apr‐15 Jul‐15 Sep‐16 $4.014 0172F Mineral Spring Avenue 1R Improvements PAW NPR Pavement A‐6 Sep‐14 Jan‐15 Nov‐15 $3.915 0166L New River Road and Victory Highway 1R Improvements LIN Pavement A‐6 Apr‐15 Jul‐15 Nov‐15 $2.016 0130R Ocean Avenue 1R Improvements NSH Pavement A‐7 May‐14 Oct‐14 Oct‐15 $0.717 0166K Old River Road (Route 126) 1R Improvements LIN Pavement A‐7 May‐15 Aug‐15 Jun‐16 $2.418 0172Y Route 102 1R Improvements, C‐3 COV FOS Pavement A‐7 May‐15 Aug‐15 Sep‐16 $5.519 0166D Route 146A and Park Avenue Intersection Improvements WNS NSM Pavement A‐7 Oct‐14 Jan‐15 Oct‐15 $0.820 0173R Route 37 1R Improvements CRA WAR Pavement A‐7 Apr‐15 Jul‐15 Jun‐16 $5.821 0173J Route 116 Knotty Oak Rd. COV Pavement A‐8 Jun‐15 Sep‐15 Jul‐16 $1.522 0078G South/North Main Streets ADA Improvements PVD Pavement A‐8 Feb‐15 Nov‐15 Jun‐18 $7.323 0055J Statewide Resurfacing 2015, C‐1** EGR LIN PAW Pavement A‐8 Jul‐15 Dec‐15 Nov‐16 $4.1
EPR SKS RICCRA JOH SCISMI GLO
24 0173N US Route 1, South Kingstown Improvements SKS Pavement A‐8 Apr‐15 Jul‐15 Jun‐16 $1.825 0172B Woonasquatucket Avenue 1R Improvements PVD NPR Pavement A‐8 Sep‐15 Nov‐15 Nov‐16 $3.5
TRAFFIC PROJECTS26 0011C Enhanced Roadside & Freeway Delineation Statewide Traffic A‐9 Dec‐14 Mar‐15 Aug‐16 $2.427 0102H North, C‐5 ‐ STC Statewide Traffic A‐9 Aug‐15 Oct‐15 Aug‐16 $1.228 0102G North/Central, C‐4 ‐ STC Statewide Traffic A‐9 Mar‐15 Jun‐15 Oct‐16 $1.629 0122H Statewide DMS Installation Statewide Traffic A‐9 Sep‐14 Feb‐15 Jan‐16 $2.3
TAP/OTHER PROJECTS30 9603B Colt State Park Bike Path Connector BRI TAP/ Other A‐9 Oct‐14 Jan‐15 Oct‐15 $1.531 9004D Providence Station Enhancements PVD TAP/ Other A‐10 Aug‐14 Dec‐14 Jun‐16 $6.9
TRANSIT PROJECTS32 9650A Kingston Station Capacity & Platform Improvements (Amtrak) SKS Transit A‐10 * Jul‐15 Jul‐17 $0.0
MAINTENANCE & OPERATIONS PROJECTS33 0086U Crack Sealing ‐ Limited Access, 2015 Statewide Operating A‐10 Jun‐15 Aug‐15 Sep‐15 $0.234 7009E Fence Repair and Replacement 2015‐2016 Statewide Operating A‐10 Sep‐14 Feb‐15 Sep‐16 $0.735 0116E Pavement Striping ‐ East Bay, 2015 Statewide Operating A‐10 Feb‐15 May‐15 Oct‐16 $2.336 0086W Rubberized Asphalt Chip Seal, 2015 Statewide Operating A‐11 Apr‐15 Jul‐15 Nov‐16 $2.037 0086R West Main Road (Route 77) Chip Seal LCM CHA RIC Operating A‐11 Mar‐15 Jun‐15 Jul‐16 $1.6
TOTALS $128.3
* Work performed by Amtrak.** Statewide Resurfacing 2015, C‐1 Projects:
Money Hill Road ‐ GlocesterGeorge Washington Highway ‐ LincolnAlbion Road ‐ Lincoln, SmithfieldProspect Street/Pawtucket Avenue ‐ Pawtucket, East Prov.Plainfield Pike ‐ Cranston, Johnston, ScituateDivision Street ‐ East GreenwichKingstown Road ‐ RichmondMooresfield Road ‐ South KingstownComfort Station ‐ South KingstownKingstown Road ‐ South Kingstown
A‐32

2016 PROGRAMPTSID Project Name Locations Type Appendix Bridges Schedule Construction
Pg # P R Advertise Date NTP Date Est. Complete Date BudgetBRIDGE PROJECTS
1 0113U Airport Connector & Route 2 Bridges (53C & 81B) WAR Bridge A‐12 2 Dec‐15 Mar‐16 Jun‐19 $5.52 0153E Capron Road Bridge No. 792 (70A) SMI Bridge A‐12 1 Jun‐16 Oct‐16 Oct‐18 $3.03 0145B Carolina Bridges (57F) RIC Bridge A‐12 3 Aug‐16 Nov‐16 Jun‐19 $3.94 0183B Central Street Bridge No. 449 (70B) NSM Bridge A‐12 1 Sep‐16 Dec‐16 Oct‐18 $6.35 0144E Harbor Junction Bridge No. 131 (57E) PVD Bridge A‐12 1 Jan‐16 Apr‐16 Oct‐18 $3.86 0166J Mussey Brook Bridge No. 380 (56C) LIN Bridge A‐13 1 Jun‐16 Sep‐16 May‐18 $0.67 0171B Newman Avenue Bridge No. 224 (57D) EPR Bridge A‐13 1 Sep‐16 Jan‐17 Jul‐19 $3.08 0031N Old Sakonnet River Bridge Demolition POR Bridge A‐13 1 Sep‐16 Dec‐16 Nov‐19 $15.89 0143U Pawtucket Area Bridges (53B) PAW Bridge A‐13 3 Jun‐16 Oct‐16 Oct‐18 $4.210 0143K Pawtucket Avenue Bridge No. 471 (57B) EPR Bridge A‐13 1 Mar‐16 Jun‐16 Aug‐18 $6.811 0012L Providence Area Bridges Nos. 1080, 1082 (56B) PVD Bridge A‐14 2 Sep‐16 Jan‐17 Jun‐18 $1.312 0012R Providence River Pedestrian Bridge PVD Bridge A‐14 1 Jul‐16 Oct‐16 Oct‐18 $10.013 0012N Ramp EI Bridge No. 1083 (56A) PVD Bridge A‐14 1 Jul‐16 Oct‐16 Dec‐17 $0.414 0118A Slatersville Stone Arch Bridge No. 273 (70C) NSM Bridge A‐14 1 Sep‐16 Jan‐17 Sep‐19 $5.015 0156C South County Freeway Bridge No. 686 (52A) WAR Bridge A‐14 1 Aug‐16 Nov‐16 Aug‐18 $1.216 0168E Tefft Hill Trail Bridge No. 592 (67T ‐ B) EXE Bridge A‐15 2 Mar‐16 Jun‐16 Sep‐18 $5.817 0009N Washington Bridge North No. 700 (57A T ‐ J) PVD EPR Bridge A‐15 1 Sep‐16 Jan‐17 Sep‐19 $10.018 0154A Wood River & Holburton Bridges Nos. 261, 262 (58D) HOP Bridge A‐15 2 Aug‐16 Dec‐16 Dec‐18 $2.4
PAVEMENT PROJECTS19 0165X High Street & Kingstown Road Improvements SKS Pavement A‐15 Mar‐16 Jul‐16 Aug‐18 $4.620 0078U Providence ‐ Downtown Improvements, C‐3 PVD Pavement A‐15 Mar‐16 Jun‐16 May‐17 $2.021 0074O RI‐LEAP Westerly (Federal) ‐ Improvements to Cross St. WES Pavement A‐16 Jun‐16 Sep‐16 Jul‐17 $0.522 0076N Route 107 1R Improvements BUR Pavement A‐16 Oct‐15 Mar‐16 Apr‐17 $2.623 0007F Two Mile Corner Reconstruction MID Pavement A‐16 Jan‐16 Apr‐16 Dec‐17 $7.2
TRAFFIC PROJECTS24 0071Q Aquidneck Avenue Improvements ‐ Middletown & Tiverton MID TIV Traffic A‐16 Aug‐16 Nov‐16 May‐18 $0.925 0153P Bridge End Treatments ‐ HSIP Statewide Traffic A‐16 May‐16 Aug‐16 Dec‐17 $1.526 0091K Coronado Road Pedestrian Enhancements WAR Traffic A‐17 Jan‐16 May‐16 May‐17 $2.027 0102J East Bay/South, C‐6 ‐ STC Statewide Traffic A‐17 Jan‐16 May‐16 May‐17 $0.928 0153R Memorial Blvd. & Francis Street Improvements PVD Traffic A‐17 Dec‐15 Mar‐16 May‐17 $1.629 0071V Mineral Spring Avenue HSIP NPR Traffic A‐17 Jan‐16 Feb‐16 Jan‐19 $1.430 0080D Pedestrian and Intersection Safety Improvements ‐ STC Statewide Traffic A‐17 Aug‐16 Nov‐16 Dec‐17 $1.031 0153N Route 102 & Route 117 Improvements ‐ Roundabout COV SKS WGR Traffic A‐18 Sep‐16 Jan‐17 Oct‐18 $2.132 0072K Traffic Signal Optimization, C‐2 Statewide Traffic A‐18 Mar‐16 Jun‐16 Sep‐17 $1.333 0071T Warwick ‐ HSIP WAR Traffic A‐18 May‐16 Aug‐16 Jul‐18 $0.4
TAP/OTHER PROJECTS34 0021R Blackstone River Bikeway ‐ Segment 1A PVD TAP/Other A‐18 Apr‐16 Jul‐16 Sep‐17 $1.335 9005J Old Stone Bridge Tiverton TIV TAP/Other A‐18 Sep‐16 Dec‐16 Nov‐17 $1.636 0132G Portsmouth Maintenance Facility POR TAP/Other A‐19 Nov‐15 Mar‐16 Sep‐17 $6.0
MAINTENANCE & OPERATIONS PROJECTS37 0084Z Crack Sealing ‐ North & East, 2016 Statewide Operating A‐19 Mar‐16 Jun‐16 Oct‐16 $0.338 0084Y Crack Sealing ‐ South & Central, 2016 Statewide Operating A‐19 Mar‐16 Jun‐16 Oct‐16 $0.339 0084H Paver Placed Elastomeric Surface Treatment 2016 FOS RIC Operating A‐19 Mar‐16 Jun‐16 Oct‐16 $1.040 0084G Rubberized Asphalt Chip Seal 2016** GLO CMB HOP Operating A‐19 Mar‐16 Jun‐16 May‐17 $1.141 7006H Statewide Fence 2017‐2019 Statewide Operating A‐20 Aug‐16 Nov‐16 Feb‐20 $0.942 7006G Statewide Guardrail 2017‐2019 Statewide Operating A‐20 Jul‐16 Oct‐16 Jan‐20 $2.543 7006J Statewide Impact Attenuator 2017‐2019 Statewide Operating A‐20 Sep‐16 Jan‐17 Jun‐20 $2.044 0073L Statewide Pavement Striping ‐ Central, 2016‐2017 Statewide Operating A‐20 Mar‐16 Apr‐16 Nov‐17 $2.545 0116N Statewide Pavement Striping ‐ Limited Access, 2016‐2017 Statewide Operating A‐20 Mar‐16 May‐16 Apr‐18 $1.546 0073K Statewide Pavement Striping ‐ South, 2016‐2017 Statewide Operating A‐21 Mar‐16 Jun‐16 Dec‐17 $2.5
TOTALS 2 24 $142.5
*Bridges: P = Preservation, R = Repair/Replace**Rubberized Asphalt Chip Seal 2016
Putnam Pike ‐ GlocesterPine Swamp Road ‐ CumberlandAlton Bradford Road ‐ Hopkinton
A‐33

2017 PROGRAMPTSID Project Name Locations Type Appendix Bridges Schedule Construction
Pg # P R Advertise Date NTP Date Est. Complete Date BudgetBRIDGE PROJECTS
1 0143A Big River Bridge No. 34 (57K) WGR Bridge A‐22 1 Oct‐16 Feb‐17 Sep‐19 $1.52 0201L Browning Mill Bridge No. 38 (57J) EXE Bridge A‐22 1 Jul‐17 Oct‐17 Oct‐19 $0.93 0114L Central RI Bridges ‐ Group 12 (32 Bridges) CRA WAR WWA Bridge A‐22 32 Jan‐17 May‐17 Jul‐19 $14.5
HOP EGR RICCOV WGR CHAWES
4 0114S Cumberland I‐295 Corridor Bridges (37T ‐ I) CMB Bridge A‐22 4 Dec‐16 Apr‐17 May‐20 $6.05 0156D Division Street Bridge No. 760 (58A) EGR Bridge A‐22 2 Jan‐17 Apr‐17 May‐19 $5.06 0114J Farnum Pike Bridges Nos. 44101, 44121 (38T ‐ L) NSM Bridge A‐23 2 Aug‐17 Jan‐18 Aug‐19 $9.07 0114B Gorton RR Bridge No. 841 (57L) WAR Bridge A‐23 1 Dec‐16 Apr‐17 Oct‐19 $1.58 0168H Hope Valley Bridges (69D) RIC HOP COV Bridge A‐23 6 May‐17 Sep‐17 Sep‐20 $4.0
EPR FOS9 0143W Horton Farm Bridge No. 472 (57M) EPR Bridge A‐23 1 Apr‐17 Jul‐17 Nov‐19 $10.510 0013M I‐195 Corridor Bridges (77) EPR Bridge A‐23 4 Sep‐17 Dec‐17 Jul‐20 $10.8
11 0114Q I‐295 & Route 6 Bridges Nos. 730, 732, 736, 737, 757 (9T ‐ G, H) CRA JOH Bridge A‐24 10 Sep‐17 Dec‐17 May‐20 $25.0
12 0114G I‐295 North at Route 6 Bridge. 737 (69T ‐ H) JOH Bridge A‐24 1 Sep‐17 Dec‐17 Dec‐19 $7.0
13 0114R I‐95 Corridor Bridge Nos. 56101, 56102, 56201, 56221 (3T ‐ F) PAW Bridge A‐24 4 Sep‐17 Jan‐18 Apr‐20 $7.0
14 0114PI‐95 North & South Bridges at Toll Gate Road Nos. 683, 684 (5T ‐ B2, C) RIC WAR Bridge A‐24 3 Aug‐17 Nov‐17 Dec‐19 $15.0
15 0114H Louisquisset Pike North Bridge, I‐295 SB Over Route 5 (35T ‐ H) JOH Bridge A‐24 1 Dec‐16 Mar‐17 Dec‐19 $3.0
16 0114N Oxford Street Bridge No. 653 (2T) PVD Bridge A‐25 1 Dec‐16 Mar‐17 Dec‐18 $4.017 0194C Park Avenue RR Bridge No. 922 (59A) CRA Bridge A‐25 1 Jan‐17 May‐17 Jul‐18 $2.018 0016J Pine Street Bridge No. 548 (31) PAW Bridge A‐25 1 Aug‐17 Dec‐17 Dec‐19 $4.819 0013L Route 146 Corridor Bridges (38) NSM EXE PVD Bridge A‐25 6 Sep‐17 Jan‐18 Jun‐20 $9.420 0014F Simmonsville Bridge No. 326 (57C) JOH Bridge A‐25 1 Jun‐17 Sep‐17 Dec‐18 $0.521 0168G Victory Highway Bridge No. 589 (71) WGR Bridge A‐26 1 Feb‐17 May‐17 Jun‐20 $7.5
22 0114K Wood River Valley Bridge No. 404, I‐95 North & South (7T ‐ A) HOP Bridge A‐26 1 Dec‐16 Apr‐17 Dec‐18 $6.8
PAVEMENT PROJECTS23 0007C East Main Road 1R Improvements POR Pavement A‐26 Dec‐16 Apr‐17 Nov‐18 $5.424 0079G I‐95 Resurfacing (Elmwood Avenue to Eddy St) PVD Pavement A‐26 Nov‐16 Mar‐17 May‐18 $8.025 0082C I‐95 Resurfacing, C‐2 (Pawtucket) PAW Pavement A‐26 Jul‐17 Oct‐17 Nov‐18 $3.026 0081W Route 146 Improvements PVD NPR LIN Pavement A‐27 Mar‐17 Jun‐17 Sep‐18 $10.027 0081R Route 24 Improvements POR Pavement A‐27 Jun‐17 Sep‐17 Sep‐18 $6.028 0166H Route 4 Improvements, C‐2 EGR NKS WAR Pavement A‐27 Nov‐16 Mar‐17 Aug‐18 $5.529 0173S Snell Road Improvements LCM Pavement A‐27 Jul‐17 Oct‐17 Dec‐18 $0.830 0055K Statewide Resurfacing C‐2, 2017** WAR CRA NSM Pavement A‐27 Nov‐16 Feb‐17 Nov‐17 $2.0
HOP POR31 0173X US Route 6 (Hartford Ave), C‐1 SCI JOH Pavement A‐28 Feb‐17 May‐17 Jun‐19 $6.032 0165V Woodville Road Improvements HOP RIC Pavement A‐28 Jul‐17 Oct‐17 Nov‐18 $3.5
TRAFFIC PROJECTS33 0025E Coventry ‐ Local Safety Improvements COV Traffic A‐28 May‐17 Sep‐17 Sep‐18 $0.334 0025F Cranston ‐ Local Safety Improvements CRA Traffic A‐28 Aug‐17 Dec‐17 Nov‐18 $0.335 0153T Diamond Hill Road Improvements WNS Traffic A‐28 Jan‐17 Apr‐17 Jul‐18 $0.936 0025J High Friction Surface Treatments 2016 Statewide Traffic A‐29 Jan‐17 Apr‐17 Jan‐18 $0.837 0071P Metacom Avenue ‐ HSIP BRI WRN Traffic A‐29 Oct‐16 Jan‐17 Nov‐18 $2.738 0072S North ‐ Johnston, C‐3 ‐ HSIP JOH Traffic A‐29 Oct‐16 Feb‐17 Dec‐17 $0.739 0071U South (Route 2 and Route 102 Roundabout) ‐ HSIP NKS SKS Traffic A‐29 Mar‐17 Jun‐17 Sep‐18 $2.540 0072J Traffic Signal Optimization, C‐3, 2016 Statewide Traffic A‐29 Jan‐17 Apr‐17 Nov‐18 $1.0
STORMWATER PROJECTS41 0166M High Street/Kingstown Road Stormwater Mitigation SKS Stormwater A‐30 Jun‐17 Oct‐17 Apr‐19 $0.4
MAINTENANCE & OPERATIONS PROJECTS42 0201V I‐95 Corridor ‐ Bridge Maintenance (58C) WAR CRA PVD Operating Oct‐16 Jan‐17 Dec‐17 $3.4
TOTALS 32 53 $218.6
*Bridges: P = Preservation, R = Repair/Replace** Statewide Resurfacing C‐2, 2017 Projects:
Bald Hill Road (Rt. 2) ‐ Warwick & CranstonGreenville Road (Rt. 5/104) ‐ North SmithfieldWoodville‐Alton Road ‐ HopkintonMechanic Street ‐ HopkintonMiddle Road ‐ Portsmouth
A‐34


Index of Projects by Municipality Appendix A

Index of Projects by MunicipalityPTSID Project Name Type Appendix Bridges Construction
Pg # P R Advertise Date NTP Date Est. Complete Date Budget
BARRINGTON0153C Central Bridge No. 018201 & Access Improvements to Route 114 Bridge A‐1 Prior to 2015 Prior to 2015 May‐17 $15.5
BRISTOL9603B Colt State Park Bike Path Connector TAP/ Other A‐9 Oct‐14 Jan‐15 Oct‐15 $1.50071P Metacom Avenue ‐ HSIP Traffic A‐29 Oct‐16 Jan‐17 Nov‐18 $2.7
BURRILLVILLE0154B Shippee Bridge No. 307 (69E) Bridge A‐5 Dec‐14 Apr‐15 Sep‐16 $2.20076N Route 107 1R Improvements Pavement A‐16 Oct‐15 Mar‐16 Apr‐17 $2.6
CENTRAL FALLS0004B Dexter Street 1R Improvements Pavement A‐6 Apr‐15 Jul‐15 Sep‐16 $4.0
CHARLESTOWN0086R West Main Road (Route 77) Chip Seal Operating A‐11 Mar‐15 Jun‐15 Jul‐16 $1.60114L Central RI Bridges ‐ Group 12 (32 Bridges) Bridge A‐22 32 Jan‐17 May‐17 Jul‐19 $14.5
COVENTRY9500A Arcadia Management Area Bridge Replacement Bridge A‐1 Prior to 2015 Prior to 2015 Dec‐16 $0.50172Y Route 102 1R Improvements, C‐3 Pavement A‐7 May‐15 Aug‐15 Sep‐16 $5.50173J Route 116 Knotty Oak Rd. Pavement A‐8 Jun‐15 Sep‐15 Jul‐16 $1.50153N Route 102 & Route 117 Improvements ‐ Roundabout Traffic A‐18 Sep‐16 Jan‐17 Oct‐18 $2.10114L Central RI Bridges ‐ Group 12 (32 Bridges) Bridge A‐22 32 Jan‐17 May‐17 Jul‐19 $14.50168H Hope Valley Bridges (69D) Bridge A‐23 6 May‐17 Sep‐17 Sep‐20 $4.00025E Coventry ‐ Local Safety Improvements Traffic A‐28 May‐17 Sep‐17 Sep‐18 $0.3
CRANSTON0201U I‐95 Corridor Bridge Preservation & Resurfacing Bridge A‐5 May‐15 Jul‐15 Dec‐16 $11.00113V Route 24 & I‐295 Bridge Preservation Bridge A‐5 Jun‐15 Oct‐15 Dec‐16 $4.30173R Route 37 1R Improvements Pavement A‐7 Apr‐15 Jul‐15 Jun‐16 $5.80055J Statewide Resurfacing 2015, C‐1** (See A‐39) Pavement A‐8 Jul‐15 Dec‐15 Nov‐16 $4.10114L Central RI Bridges ‐ Group 12 (32 Bridges) Bridge A‐22 32 Jan‐17 May‐17 Jul‐19 $14.50114Q I‐295 & Route 6 Bridges Nos. 730, 732, 736, 737, 757 (9T ‐ G, H) Bridge A‐24 10 Sep‐17 Dec‐17 May‐20 $25.00194C Park Avenue RR Bridge No. 922 (59A) Bridge A‐25 1 Jan‐17 May‐17 Jul‐18 $2.00055K Statewide Resurfacing C‐2, 2017**** (See A‐39) Pavement A‐27 Nov‐16 Feb‐17 Nov‐17 $2.00025F Cranston ‐ Local Safety Improvements Traffic A‐28 Aug‐17 Dec‐17 Nov‐18 $0.30201V I‐95 Corridor ‐ Bridge Maintenance (58C) Operating Oct‐16 Jan‐17 Dec‐17 $3.4
CUMBERLAND0084G Rubberized Asphalt Chip Seal 2016*** (See A‐39) Operating A‐19 Mar‐16 Jun‐16 May‐17 $1.10114S Cumberland I‐295 Corridor Bridges (37T ‐ I) Bridge A‐22 4 Dec‐16 Apr‐17 May‐20 $6.0
EAST GREENWICH0113L Glenbridge Ave and South County Trail Bridges (69F) Bridge A‐4 Jun‐15 Aug‐15 Dec‐16 $6.30055J Statewide Resurfacing 2015, C‐1** (See A‐39) Pavement A‐8 Jul‐15 Dec‐15 Nov‐16 $4.10114L Central RI Bridges ‐ Group 12 (32 Bridges) Bridge A‐22 32 Jan‐17 May‐17 Jul‐19 $14.50156D Division Street Bridge No. 760 (58A) Bridge A‐22 2 Jan‐17 Apr‐17 May‐19 $5.00166H Route 4 Improvements, C‐2 Pavement A‐27 Nov‐16 Mar‐17 Aug‐18 $5.5
EAST PROVIDENCE0012E I‐195 Relocation ‐ Landscape Contract C Pavement A‐2 Prior to 2015 Prior to 2015 Nov‐16 $0.80153D Coles Bridge No. 134 (66) Bridge A‐4 Aug‐15 Nov‐15 Dec‐16 $0.60143D East Shore Expressway Bridges Nos. 475, 476 Bridge A‐4 May‐15 Sep‐15 Jun‐17 $14.00055J Statewide Resurfacing 2015, C‐1** (See A‐39) Pavement A‐8 Jul‐15 Dec‐15 Nov‐16 $4.10171B Newman Avenue Bridge No. 224 (57D) Bridge A‐13 1 Sep‐16 Jan‐17 Jul‐19 $3.00143K Pawtucket Avenue Bridge No. 471 (57B) Bridge A‐13 1 Mar‐16 Jun‐16 Aug‐18 $6.80009N Washington Bridge North No. 700 (57A T ‐ J) Bridge A‐15 1 Sep‐16 Jan‐17 Sep‐19 $10.00168H Hope Valley Bridges (69D) Bridge A‐23 6 May‐17 Sep‐17 Sep‐20 $4.00143W Horton Farm Bridge No. 472 (57M) Bridge A‐23 1 Apr‐17 Jul‐17 Nov‐19 $10.50013M I‐195 Corridor Bridges (77) Bridge A‐23 4 Sep‐17 Dec‐17 Jul‐20 $10.8
Bridges: P = Preservation, R = Repair/Replace A‐35

PTSID Project Name Type Appendix Bridges ConstructionPg # P R Advertise Date NTP Date Est. Complete Date Budget
EXETER0168E Tefft Hill Trail Bridge No. 592 (67T ‐ B) Bridge A‐15 2 Mar‐16 Jun‐16 Sep‐18 $5.80201L Browning Mill Bridge No. 38 (57J) Bridge A‐22 1 Jul‐17 Oct‐17 Oct‐19 $0.90013L Route 146 Corridor Bridges (38) Bridge A‐25 6 Sep‐17 Jan‐18 Jun‐20 $9.4
FOSTER0172Y Route 102 1R Improvements, C‐3 Pavement A‐7 May‐15 Aug‐15 Sep‐16 $5.50084H Paver Placed Elastomeric Surface Treatment 2016 Operating A‐19 Mar‐16 Jun‐16 Oct‐16 $1.00168H Hope Valley Bridges (69D) Bridge A‐23 6 May‐17 Sep‐17 Sep‐20 $4.0
GLOCESTER0055J Statewide Resurfacing 2015, C‐1** (See A‐39) Pavement A‐8 Jul‐15 Dec‐15 Nov‐16 $4.10084G Rubberized Asphalt Chip Seal 2016*** (See A‐39) Operating A‐19 Mar‐16 Jun‐16 May‐17 $1.1
HOPKINTON9500A Arcadia Management Area Bridge Replacement Bridge A‐1 Prior to 2015 Prior to 2015 Dec‐16 $0.50115Z I‐95 Highway LED Lighting ‐ Exits 1, 2, 4, 5 and Weigh Stations Traffic A‐2 Prior to 2015 Prior to 2015 Feb‐16 $2.60154A Wood River & Holburton Bridges Nos. 261, 262 (58D) Bridge A‐15 2 Aug‐16 Dec‐16 Dec‐18 $2.40084G Rubberized Asphalt Chip Seal 2016*** (See A‐39) Operating A‐19 Mar‐16 Jun‐16 May‐17 $1.10114L Central RI Bridges ‐ Group 12 (32 Bridges) Bridge A‐22 32 Jan‐17 May‐17 Jul‐19 $14.50168H Hope Valley Bridges (69D) Bridge A‐23 6 May‐17 Sep‐17 Sep‐20 $4.00114K Wood River Valley Bridge No. 404, I‐95 North & South (7T ‐ A) Bridge A‐26 1 Dec‐16 Apr‐17 Dec‐18 $6.80055K Statewide Resurfacing C‐2, 2017**** (See A‐39) Pavement A‐27 Nov‐16 Feb‐17 Nov‐17 $2.00165V Woodville Road Improvements Pavement A‐28 Jul‐17 Oct‐17 Nov‐18 $3.5
JAMESTOWN0049M Jamestown‐Verrazzano Bridge No. 800 & Cove Bridge No. 495 Bridge A‐1 Prior to 2015 Prior to 2015 Dec‐15 $4.8
JOHNSTON0055J Statewide Resurfacing 2015, C‐1** (See A‐39) Pavement A‐8 Jul‐15 Dec‐15 Nov‐16 $4.10114Q I‐295 & Route 6 Bridges Nos. 730, 732, 736, 737, 757 (9T ‐ G, H) Bridge A‐24 10 Sep‐17 Dec‐17 May‐20 $25.00114G I‐295 North at Route 6 Bridge. 737 (69T ‐ H) Bridge A‐24 1 Sep‐17 Dec‐17 Dec‐19 $7.00114H Louisquisset Pike North Bridge, I‐295 SB Over Route 5 (35T ‐ H) Bridge A‐24 1 Dec‐16 Mar‐17 Dec‐19 $3.00014F Simmonsville Bridge No. 326 (57C) Bridge A‐25 1 Jun‐17 Sep‐17 Dec‐18 $0.50173X US Route 6 (Hartford Ave), C‐1 Pavement A‐28 Feb‐17 May‐17 Jun‐19 $6.00072S North ‐ Johnston, C‐3 ‐ HSIP Traffic A‐29 Oct‐16 Feb‐17 Dec‐17 $0.7
LINCOLN0166L New River Road and Victory Highway 1R Improvements Pavement A‐6 Apr‐15 Jul‐15 Nov‐15 $2.00166K Old River Road (Route 126) 1R Improvements Pavement A‐7 May‐15 Aug‐15 Jun‐16 $2.40055J Statewide Resurfacing 2015, C‐1** (See A‐39) Pavement A‐8 Jul‐15 Dec‐15 Nov‐16 $4.10166J Mussey Brook Bridge No. 380 (56C) Bridge A‐13 1 Jun‐16 Sep‐16 May‐18 $0.60081W Route 146 Improvements Pavement A‐27 Mar‐17 Jun‐17 Sep‐18 $10.0
LITTLE COMPTON0086R West Main Road (Route 77) Chip Seal Operating A‐11 Mar‐15 Jun‐15 Jul‐16 $1.60173S Snell Road Improvements Pavement A‐27 Jul‐17 Oct‐17 Dec‐18 $0.8
MIDDLETOWN0007F Two Mile Corner Reconstruction Pavement A‐16 Jan‐16 Apr‐16 Dec‐17 $7.20071Q Aquidneck Avenue Improvements ‐ Middletown & Tiverton Traffic A‐16 Aug‐16 Nov‐16 May‐18 $0.9
NARRAGANSETT0144B Great Island Bridge #499 Bridge A‐1 Prior to 2015 Prior to 2015 May‐17 $8.7
NEWPORT0173F Broadway Streetscape Improvements Project Pavement A‐6 Nov‐14 Mar‐15 May‐17 $6.1
NEW SHOREHAM0130R Ocean Avenue 1R Improvements Pavement A‐7 May‐14 Oct‐14 Oct‐15 $0.7
Bridges: P = Preservation, R = Repair/Replace A‐36
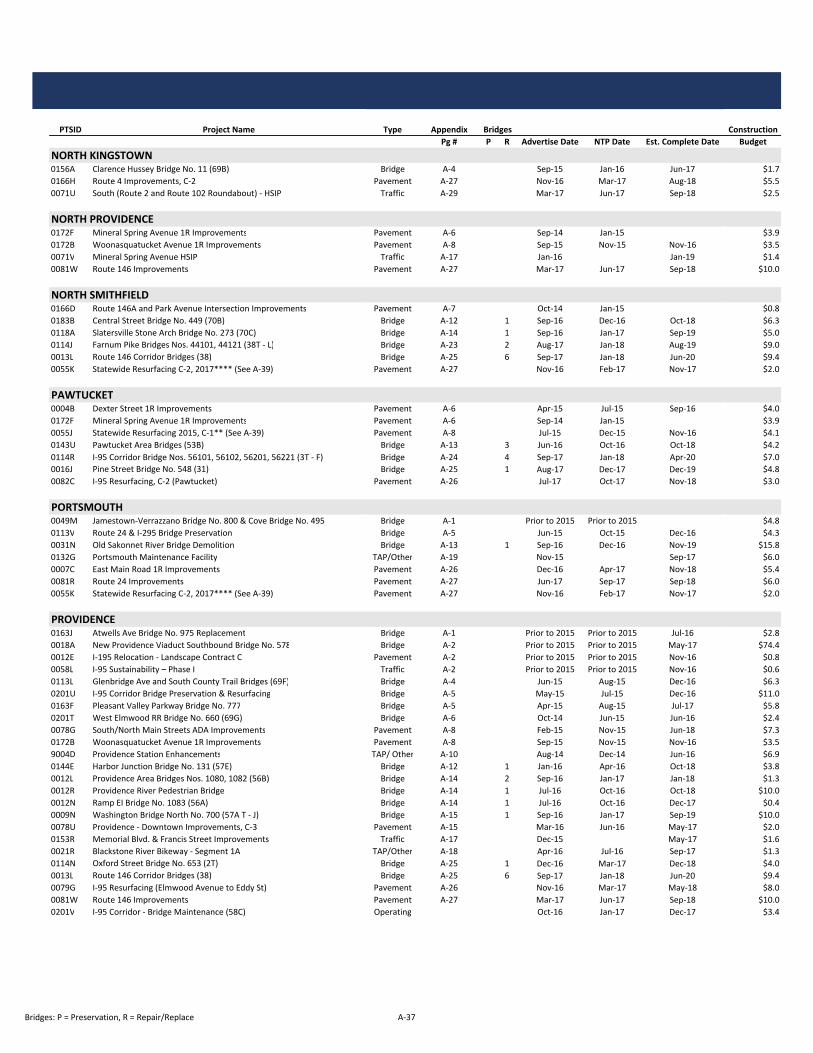
PTSID Project Name Type Appendix Bridges ConstructionPg # P R Advertise Date NTP Date Est. Complete Date Budget
NORTH KINGSTOWN0156A Clarence Hussey Bridge No. 11 (69B) Bridge A‐4 Sep‐15 Jan‐16 Jun‐17 $1.70166H Route 4 Improvements, C‐2 Pavement A‐27 Nov‐16 Mar‐17 Aug‐18 $5.50071U South (Route 2 and Route 102 Roundabout) ‐ HSIP Traffic A‐29 Mar‐17 Jun‐17 Sep‐18 $2.5
NORTH PROVIDENCE0172F Mineral Spring Avenue 1R Improvements Pavement A‐6 Sep‐14 Jan‐15 Nov‐15 $3.90172B Woonasquatucket Avenue 1R Improvements Pavement A‐8 Sep‐15 Nov‐15 Nov‐16 $3.50071V Mineral Spring Avenue HSIP Traffic A‐17 Jan‐16 Feb‐16 Jan‐19 $1.40081W Route 146 Improvements Pavement A‐27 Mar‐17 Jun‐17 Sep‐18 $10.0
NORTH SMITHFIELD0166D Route 146A and Park Avenue Intersection Improvements Pavement A‐7 Oct‐14 Jan‐15 Oct‐15 $0.80183B Central Street Bridge No. 449 (70B) Bridge A‐12 1 Sep‐16 Dec‐16 Oct‐18 $6.30118A Slatersville Stone Arch Bridge No. 273 (70C) Bridge A‐14 1 Sep‐16 Jan‐17 Sep‐19 $5.00114J Farnum Pike Bridges Nos. 44101, 44121 (38T ‐ L) Bridge A‐23 2 Aug‐17 Jan‐18 Aug‐19 $9.00013L Route 146 Corridor Bridges (38) Bridge A‐25 6 Sep‐17 Jan‐18 Jun‐20 $9.40055K Statewide Resurfacing C‐2, 2017**** (See A‐39) Pavement A‐27 Nov‐16 Feb‐17 Nov‐17 $2.0
PAWTUCKET0004B Dexter Street 1R Improvements Pavement A‐6 Apr‐15 Jul‐15 Sep‐16 $4.00172F Mineral Spring Avenue 1R Improvements Pavement A‐6 Sep‐14 Jan‐15 Nov‐15 $3.90055J Statewide Resurfacing 2015, C‐1** (See A‐39) Pavement A‐8 Jul‐15 Dec‐15 Nov‐16 $4.10143U Pawtucket Area Bridges (53B) Bridge A‐13 3 Jun‐16 Oct‐16 Oct‐18 $4.20114R I‐95 Corridor Bridge Nos. 56101, 56102, 56201, 56221 (3T ‐ F) Bridge A‐24 4 Sep‐17 Jan‐18 Apr‐20 $7.00016J Pine Street Bridge No. 548 (31) Bridge A‐25 1 Aug‐17 Dec‐17 Dec‐19 $4.80082C I‐95 Resurfacing, C‐2 (Pawtucket) Pavement A‐26 Jul‐17 Oct‐17 Nov‐18 $3.0
PORTSMOUTH0049M Jamestown‐Verrazzano Bridge No. 800 & Cove Bridge No. 495 Bridge A‐1 Prior to 2015 Prior to 2015 Dec‐15 $4.80113V Route 24 & I‐295 Bridge Preservation Bridge A‐5 Jun‐15 Oct‐15 Dec‐16 $4.30031N Old Sakonnet River Bridge Demolition Bridge A‐13 1 Sep‐16 Dec‐16 Nov‐19 $15.80132G Portsmouth Maintenance Facility TAP/Other A‐19 Nov‐15 Mar‐16 Sep‐17 $6.00007C East Main Road 1R Improvements Pavement A‐26 Dec‐16 Apr‐17 Nov‐18 $5.40081R Route 24 Improvements Pavement A‐27 Jun‐17 Sep‐17 Sep‐18 $6.00055K Statewide Resurfacing C‐2, 2017**** (See A‐39) Pavement A‐27 Nov‐16 Feb‐17 Nov‐17 $2.0
PROVIDENCE0163J Atwells Ave Bridge No. 975 Replacement Bridge A‐1 Prior to 2015 Prior to 2015 Jul‐16 $2.80018A New Providence Viaduct Southbound Bridge No. 578 Bridge A‐2 Prior to 2015 Prior to 2015 May‐17 $74.40012E I‐195 Relocation ‐ Landscape Contract C Pavement A‐2 Prior to 2015 Prior to 2015 Nov‐16 $0.80058L I‐95 Sustainability – Phase I Traffic A‐2 Prior to 2015 Prior to 2015 Nov‐16 $0.60113L Glenbridge Ave and South County Trail Bridges (69F) Bridge A‐4 Jun‐15 Aug‐15 Dec‐16 $6.30201U I‐95 Corridor Bridge Preservation & Resurfacing Bridge A‐5 May‐15 Jul‐15 Dec‐16 $11.00163F Pleasant Valley Parkway Bridge No. 777 Bridge A‐5 Apr‐15 Aug‐15 Jul‐17 $5.80201T West Elmwood RR Bridge No. 660 (69G) Bridge A‐6 Oct‐14 Jun‐15 Jun‐16 $2.40078G South/North Main Streets ADA Improvements Pavement A‐8 Feb‐15 Nov‐15 Jun‐18 $7.30172B Woonasquatucket Avenue 1R Improvements Pavement A‐8 Sep‐15 Nov‐15 Nov‐16 $3.59004D Providence Station Enhancements TAP/ Other A‐10 Aug‐14 Dec‐14 Jun‐16 $6.90144E Harbor Junction Bridge No. 131 (57E) Bridge A‐12 1 Jan‐16 Apr‐16 Oct‐18 $3.80012L Providence Area Bridges Nos. 1080, 1082 (56B) Bridge A‐14 2 Sep‐16 Jan‐17 Jan‐18 $1.30012R Providence River Pedestrian Bridge Bridge A‐14 1 Jul‐16 Oct‐16 Oct‐18 $10.00012N Ramp EI Bridge No. 1083 (56A) Bridge A‐14 1 Jul‐16 Oct‐16 Dec‐17 $0.40009N Washington Bridge North No. 700 (57A T ‐ J) Bridge A‐15 1 Sep‐16 Jan‐17 Sep‐19 $10.00078U Providence ‐ Downtown Improvements, C‐3 Pavement A‐15 Mar‐16 Jun‐16 May‐17 $2.00153R Memorial Blvd. & Francis Street Improvements Traffic A‐17 Dec‐15 Mar‐16 May‐17 $1.60021R Blackstone River Bikeway ‐ Segment 1A TAP/Other A‐18 Apr‐16 Jul‐16 Sep‐17 $1.30114N Oxford Street Bridge No. 653 (2T) Bridge A‐25 1 Dec‐16 Mar‐17 Dec‐18 $4.00013L Route 146 Corridor Bridges (38) Bridge A‐25 6 Sep‐17 Jan‐18 Jun‐20 $9.40079G I‐95 Resurfacing (Elmwood Avenue to Eddy St) Pavement A‐26 Nov‐16 Mar‐17 May‐18 $8.00081W Route 146 Improvements Pavement A‐27 Mar‐17 Jun‐17 Sep‐18 $10.00201V I‐95 Corridor ‐ Bridge Maintenance (58C) Operating Oct‐16 Jan‐17 Dec‐17 $3.4
Bridges: P = Preservation, R = Repair/Replace A‐37

PTSID Project Name Type Appendix Bridges ConstructionPg # P R Advertise Date NTP Date Est. Complete Date Budget
RICHMOND9500A Arcadia Management Area Bridge Replacement Bridge A‐1 Prior to 2015 Prior to 2015 Dec‐16 $0.50115Z I‐95 Highway LED Lighting ‐ Exits 1, 2, 4, 5 and Weigh Stations Traffic A‐2 Prior to 2015 Prior to 2015 Feb‐16 $2.60055J Statewide Resurfacing 2015, C‐1** (See A‐39) Pavement A‐8 Jul‐15 Dec‐15 Nov‐16 $4.10086R West Main Road (Route 77) Chip Seal Operating A‐11 Mar‐15 Jun‐15 Jul‐16 $1.60145B Carolina Bridges (57F) Bridge A‐12 3 Aug‐16 Nov‐16 Jun‐19 $3.90084H Paver Placed Elastomeric Surface Treatment 2016 Operating A‐19 Mar‐16 Jun‐16 Oct‐16 $1.00114L Central RI Bridges ‐ Group 12 (32 Bridges) Bridge A‐22 32 Jan‐17 May‐17 Jul‐19 $14.50168H Hope Valley Bridges (69D) Bridge A‐23 6 May‐17 Sep‐17 Sep‐20 $4.00114P I‐95 North & South Bridges at Toll Gate Road Nos. 683, 684 (5T ‐ B2, C) Bridge A‐24 3 Aug‐17 Nov‐17 Dec‐19 $15.00165V Woodville Road Improvements Pavement A‐28 Jul‐17 Oct‐17 Nov‐18 $3.5
SCITUATE0055J Statewide Resurfacing 2015, C‐1** (See Below) Pavement A‐8 Jul‐15 Dec‐15 Nov‐16 $4.10173X US Route 6 (Hartford Ave), C‐1 Pavement A‐28 Feb‐17 May‐17 Jun‐19 $6.0
SMITHFIELD0055J Statewide Resurfacing 2015, C‐1** (See Below) Pavement A‐8 Jul‐15 Dec‐15 Nov‐16 $4.10153E Capron Road Bridge No. 792 (70A) Bridge A‐12 1 Jun‐16 Oct‐16 Oct‐18 $3.0
SOUTH KINGSTOWN0143R Route 1/South County Pier Cap Replacements Bridge A‐5 Nov‐14 Mar‐15 Jun‐17 $5.80055J Statewide Resurfacing 2015, C‐1** (See Below) Pavement A‐8 Jul‐15 Dec‐15 Nov‐16 $4.10173N US Route 1, South Kingstown Improvements Pavement A‐8 Apr‐15 Jul‐15 Jun‐16 $1.89650A Kingston Station Capacity & Platform Improvements (Amtrak) Transit A‐10 * Jul‐15 Jul‐17 $0.00165X High Street & Kingstown Road Improvements Pavement A‐15 Mar‐16 Jul‐16 Aug‐18 $4.60153N Route 102 & Route 117 Improvements ‐ Roundabout Traffic A‐18 Sep‐16 Jan‐17 Oct‐18 $2.10071U South (Route 2 and Route 102 Roundabout) ‐ HSIP Traffic A‐29 Mar‐17 Jun‐17 Sep‐18 $2.50166M High Street/Kingstown Road Stormwater Mitigation Stormwater A‐30 Jun‐17 Oct‐17 Apr‐19 $0.4
TIVERTON0113V Route 24 & I‐295 Bridge Preservation Bridge A‐5 Jun‐15 Oct‐15 Dec‐16 $4.30071Q Aquidneck Avenue Improvements ‐ Middletown & Tiverton Traffic A‐16 Aug‐16 Nov‐16 May‐18 $0.99005J Old Stone Bridge Tiverton TAP/Other A‐18 Sep‐16 Dec‐16 Nov‐17 $1.6
WARREN0071P Metacom Avenue ‐ HSIP Traffic A‐29 Oct‐16 Jan‐17 Nov‐18 $2.7
WARWICK0185A Apponaug Circulator By‐Pass Pavement A‐2 Prior to 2015 Prior to 2015 Nov‐17 $29.80201U I‐95 Corridor Bridge Preservation & Resurfacing Bridge A‐5 May‐15 Jul‐15 Dec‐16 $11.00113V Route 24 & I‐295 Bridge Preservation Bridge A‐5 Jun‐15 Oct‐15 Dec‐16 $4.30173R Route 37 1R Improvements Pavement A‐7 Apr‐15 Jul‐15 Jun‐16 $5.80113U Airport Connector & Route 2 Bridges (53C & 81B) Bridge A‐12 2 Dec‐15 Mar‐16 Jun‐19 $5.50156C South County Freeway Bridge No. 686 (52A) Bridge A‐14 1 Aug‐16 Nov‐16 Aug‐18 $1.20091K Coronado Road Pedestrian Enhancements Traffic A‐17 Jan‐16 May‐16 May‐17 $2.00071T Warwick ‐ HSIP Traffic A‐18 May‐16 Aug‐16 Jul‐18 $0.40114L Central RI Bridges ‐ Group 12 (32 Bridges) Bridge A‐22 32 Jan‐17 May‐17 Jul‐19 $14.50114B Gorton RR Bridge No. 841 (57L) Bridge A‐23 1 Dec‐16 Apr‐17 Oct‐19 $1.50114P I‐95 North & South Bridges at Toll Gate Road Nos. 683, 684 (5T ‐ B2, C) Bridge A‐24 3 Aug‐17 Nov‐17 Dec‐19 $15.00166H Route 4 Improvements, C‐2 Pavement A‐27 Nov‐16 Mar‐17 Aug‐18 $5.50055K Statewide Resurfacing C‐2, 2017**** (See A‐39) Pavement A‐27 Nov‐16 Feb‐17 Nov‐17 $2.00201V I‐95 Corridor ‐ Bridge Maintenance (58C) Operating Oct‐16 Jan‐17 Dec‐17 $3.4
WEST GREENWICH0115Z I‐95 Highway LED Lighting ‐ Exits 1, 2, 4, 5 and Weigh Stations Traffic A‐2 Prior to 2015 Prior to 2015 Feb‐16 $2.60153N Route 102 & Route 117 Improvements ‐ Roundabout Traffic A‐18 Sep‐16 Jan‐17 Oct‐18 $2.10143A Big River Bridge No. 34 (57K) Bridge A‐22 1 Oct‐16 Feb‐17 Sep‐19 $1.50114L Central RI Bridges ‐ Group 12 (32 Bridges) Bridge A‐22 32 Jan‐17 May‐17 Jul‐19 $14.50168G Victory Highway Bridge No. 589 (71) Bridge A‐26 1 Feb‐17 May‐17 Jun‐20 $7.5
Bridges: P = Preservation, R = Repair/Replace A‐38

PTSID Project Name Type Appendix Bridges ConstructionPg # P R Advertise Date NTP Date Est. Complete Date Budget
WESTERLY0115Z I‐95 Highway LED Lighting ‐ Exits 1, 2, 4, 5 and Weigh Stations Traffic A‐2 Prior to 2015 Prior to 2015 Feb‐16 $2.60074O RI‐LEAP Westerly (Federal) ‐ Improvements to Cross St. Pavement A‐16 Jun‐16 Sep‐16 Jul‐17 $0.50114L Central RI Bridges ‐ Group 12 (32 Bridges) Bridge A‐22 32 Jan‐17 May‐17 Jul‐19 $14.5
WOONSOCKET0201I Hamlet Ave. Bridge #500 (69C) Bridge A‐4 Jun‐15 Sep‐15 Jul‐17 $2.20166D Route 146A and Park Avenue Intersection Improvements Pavement A‐7 Oct‐14 Jan‐15 Oct‐15 $0.80153T Diamond Hill Road Improvements Traffic A‐28 Jan‐17 Apr‐17 Jul‐18 $0.9
WEST WARWICK0114L Central RI Bridges ‐ Group 12 (32 Bridges) Bridge A‐22 32 Jan‐17 May‐17 Jul‐19 $14.5
STATEWIDE7006F Guardrail Repair and Replacement 2014‐2016 Operating A‐3 Prior to 2015 Prior to 2015 Jun‐16 $2.27005F Impact Attenuator Repair and Replacement 2014‐2016 Operating A‐3 Prior to 2015 Prior to 2015 Sep‐16 $1.60011C Enhanced Roadside & Freeway Delineation Traffic A‐9 Dec‐14 Mar‐15 Aug‐16 $2.40102H North, C‐5 ‐ STC Traffic A‐9 Aug‐15 Oct‐15 Aug‐16 $1.20102G North/Central, C‐4 ‐ STC Traffic A‐9 Mar‐15 Jun‐15 Oct‐16 $1.60122H Statewide DMS Installation Traffic A‐9 Sep‐14 Feb‐15 Sep‐15 $2.30086U Crack Sealing ‐ Limited Access, 2015 Operating A‐10 Jun‐15 Aug‐15 Sep‐16 $0.27009E Fence Repair and Replacement 2015‐2016 Operating A‐10 Sep‐14 Feb‐15 Oct‐16 $0.70116E Pavement Striping ‐ East Bay, 2015 Operating A‐10 Feb‐15 May‐15 Nov‐16 $2.30086W Rubberized Asphalt Chip Seal, 2015 Operating A‐11 Apr‐15 Jul‐15 $2.00153P Bridge End Treatments ‐ HSIP Traffic A‐16 May‐16 Aug‐16 Dec‐17 $1.50102J East Bay/South, C‐6 ‐ STC Traffic A‐17 Jan‐16 May‐16 May‐17 $0.90080D Pedestrian and Intersection Safety Improvements ‐ STC Traffic A‐17 Aug‐16 Nov‐16 Dec‐17 $1.00072K Traffic Signal Optimization, C‐2 Traffic A‐18 Mar‐16 Jun‐16 Sep‐17 $1.30084Z Crack Sealing ‐ North & East, 2016 Operating A‐19 Mar‐16 Jun‐16 Oct‐16 $0.30084Y Crack Sealing ‐ South & Central, 2016 Operating A‐19 Mar‐16 Jun‐16 Oct‐16 $0.37006H Statewide Fence 2017‐2019 Operating A‐20 Aug‐16 Nov‐16 Feb‐20 $0.97006G Statewide Guardrail 2017‐2019 Operating A‐20 Jul‐16 Oct‐16 Jan‐20 $2.57006J Statewide Impact Attenuator 2017‐2019 Operating A‐20 Sep‐16 Jan‐17 Jun‐20 $2.00073L Statewide Pavement Striping ‐ Central, 2016‐2017 Operating A‐20 Mar‐16 Apr‐16 Nov‐17 $2.50116N Statewide Pavement Striping ‐ Limited Access, 2016‐2017 Operating A‐20 Mar‐16 May‐16 Apr‐18 $1.50073K Statewide Pavement Striping ‐ South, 2016‐2017 Operating A‐21 Mar‐16 Jun‐16 Dec‐17 $2.50025J High Friction Surface Treatments 2016 Traffic A‐29 Jan‐17 Apr‐17 Jan‐18 $0.80072J Traffic Signal Optimization, C‐3, 2016 Traffic A‐29 Jan‐17 Apr‐17 Nov‐18 $1.0
* Work performed by Amtrak.
** Statewide Resurfacing 2015, C‐1 Projects: ***Rubberized Asphalt Chip Seal 2016Money Hill Road ‐ Glocester Putnam Pike ‐ GlocesterGeorge Washington Highway ‐ Lincoln Pine Swamp Road ‐ CumberlandAlbion Road ‐ Lincoln, Smithfield Alton Bradford Road ‐ HopkintonProspect Street/Pawtucket Avenue ‐ Pawtucket, East Prov.Plainfield Pike ‐ Cranston, Johnston, Scituate **** Statewide Resurfacing C‐2, 2017 Projects:Division Street ‐ East Greenwich Bald Hill Road (Rt. 2) ‐ Warwick & CranstonKingstown Road ‐ Richmond Greenville Road (Rt. 5/104) ‐ North SmithfieldMooresfield Road ‐ South Kingstown Woodville‐Alton Road ‐ HopkintonComfort Station ‐ South Kingstown Mechanic Street ‐ HopkintonKingstown Road ‐ South Kingstown Middle Road ‐ Portsmouth
Bridges: P = Preservation, R = Repair/Replace A‐39


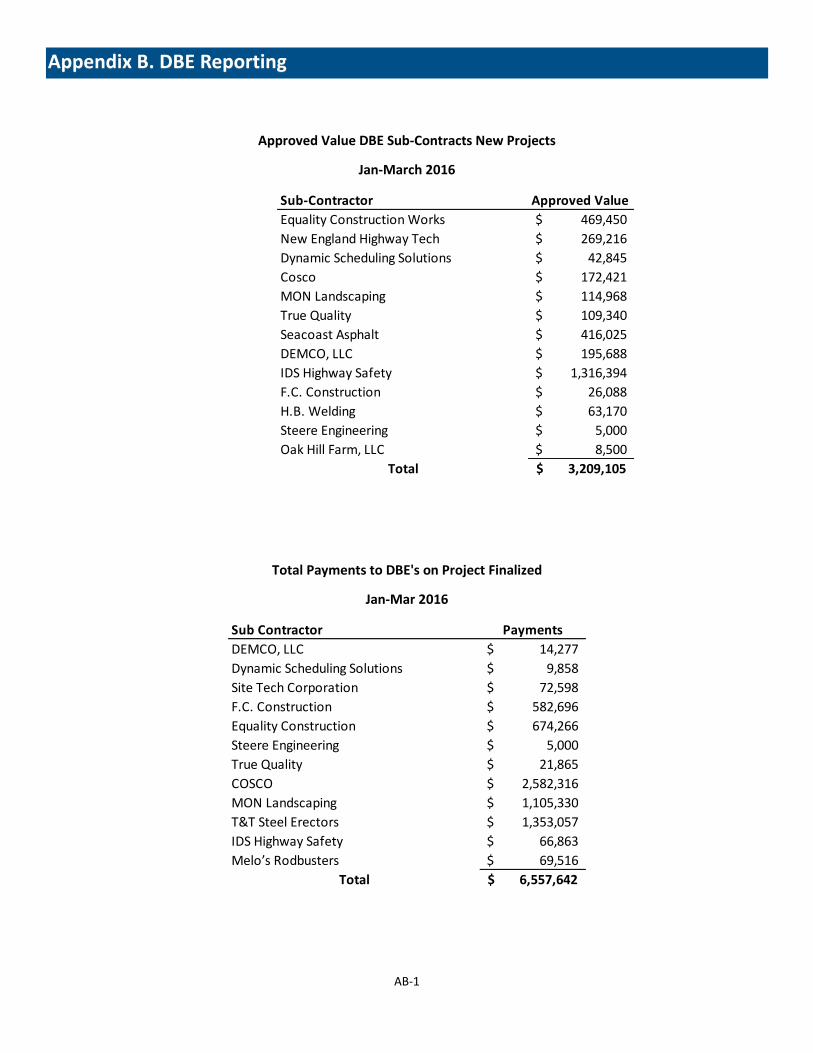
AB-1
Appendix B. DBE Reporting
Approved Value DBE Sub-Contracts New Projects
Jan-March 2016
Total Payments to DBE's on Project Finalized
Jan-Mar 2016
Sub Contractor Payments
DEMCO, LLC 14,277$
Dynamic Scheduling Solutions 9,858$
Site Tech Corporation 72,598$
F.C. Construction 582,696$
Equality Construction 674,266$
Steere Engineering 5,000$
True Quality 21,865$
COSCO 2,582,316$
MON Landscaping 1,105,330$
T&T Steel Erectors 1,353,057$
IDS Highway Safety 66,863$
Melo’s Rodbusters 69,516$
Total 6,557,642$
Sub-Contractor Approved Value
Equality Construction Works 469,450$
New England Highway Tech 269,216$
Dynamic Scheduling Solutions 42,845$
Cosco 172,421$
MON Landscaping 114,968$
True Quality 109,340$
Seacoast Asphalt 416,025$
DEMCO, LLC 195,688$
IDS Highway Safety 1,316,394$
F.C. Construction 26,088$
H.B. Welding 63,170$
Steere Engineering 5,000$
Oak Hill Farm, LLC 8,500$
Total 3,209,105$

AB-2
Appendix B. Rhode Island Construction Sector Employment
23,200
21,300
19,000
16,300
15,800
16,100 16,100
16,000
16,600
18,400
18,000
18,80018,700
15,000
16,000
17,000
18,000
19,000
20,000
21,000
22,000
23,000
24,000
2006 2007 2008 2009 2010 2011 2012 2013 2014 2015 Jan-2016 Feb-2016 Mar-2016
Source: RIDLT/LMI Current Employment Statistics (CES) Seasonally Adjusted Estimates
Rhode Island Construction Sector Employment

AB-3
Appendix C. Glossary
AC-1
Date Conventions:
CY: Calendar Year (January 1 – December 31)
FFY: Federal Fiscal Year (October 1 – September 30)
SFY: State Fiscal Year (July 1 – June 30)
Safety Information is collected and reported on a calendar year basis (CY)
Financial Information is reported on a State Fiscal Year (SFY Basis)
All other information is reported on a Federal Fiscal Year basis (FFY)
Technical Definitions:
Emergency Awards: The Department occasionally faces the need for urgent response to certain situations. As defined
by State Purchasing Regulations (9.6.2), an emergency is defined as follows: “An emergency shall mean a situation to
which an urgent response is required. Immediate dangers to health and safety, threats to property and necessary
functions, and failures of critical equipment constitute emergencies”
Advertise: The date of the public notice of the invitation for bids or request for proposals, typically posted on the
State Purchasing’s website
At NTP: Notice to Proceed occurs when a Purchase Order is provided by the Owner to the Contractor authorizing
work to begin
Substantial Completion: Substantial completion is reached when the work is completed so it can be safely and
effectively used by the public. This may include the entire Project or a unit, or portion of the work such as a structure,
an interchange, or section of road or pavement
Final Completion: Final completion is reached when all contract work is completed, including punchlist work, and all
certifications have been received by the Department
LTD: Life to Date
Change Orders: A written order to the Contractor covering contingencies, extra work, increases or decreases in
contract quantities, and additions or alterations to the plans or specifications within the scope of the contract, and
estblishing the basis of payment and time adjustments for the work affected by said change
Industry Definitions:
NHTSA: National Highway Traffic and Safety Administration
OHS: Office of Higway Safety
FARS: The Fatality Analysis Reporting System is a nationwide census providing NHTSA, Congress and the American
public yearly data regarding fatal injuries suffered in motor vehicle traffic crashes
Pass throughs: Capital pass through expenditures are costs that are not directly related to capital projects but instead
passed on to other entities such as other state agencies or local cities and towns for capital related costs
CMAQ: Congestion Mitigation and Air Quality

AB-4
RIDOT System Quick Facts
More than
2,900
Lane miles of road
1,173
Bridges (5+ feet) as of 3/31/2016
104,000
Traffic devices*
25,000
Catch basins (approximate)
5 rail stations
18 park and rides
630
Total employees
(as of 3/31/16)
* Current estimate of assets maintained by RIDOT only. Does not account for all traffic devices and equipment constructed by RIDOT on an annual basis.