Embed Size (px)
DESCRIPTION
RF ALU Troubleshooting Guide
Citation preview
LUCENT TECHNOLOGIES PROPRIETARY
C D M A
R F P E R F O R M A N C E A N A LY S I S &
T R O U B L E S H O O T I N G G U I D E
REV 18.0
RF PERFORMANCE ANALYSIS AND TOOLS GROUP
Lucent TechnologiesLucent TechnologiesBell Labs InnovationsBell Labs Innovations
CDMA RF PERFORMANCE ANALYSIS & TROUBLESHOOTING GUIDE
LUCENT TECHNOLOGIES PROPRIETARY
TA B L E O F C O N T E N T S
1. INTRODUCTION................................................................................................................................... 8
2. USING THIS GUIDE ............................................................................................................................. 9 2.1 USING THE GUIDE FOR SYSTEM-LEVEL TROUBLESHOOTING AND ANALYSIS..............10 2.2 USING THE GUIDE FOR TROUBLESHOOTING SPECIFIC CDMA PERFORMANCE
PROBLEMS ................................................................................................................................11 2.3 USING THE GUIDE AS A REFERENCE FOR PRINCIPLES OF KPI PERFORMANCE
MANAGEMENT AND TROUBLESHOOTING...........................................................................12 3. VOICE AND DATA KPI OPTIMIZATION AND TROUBLESHOOTING .................................. 13
3.1 ESTABLISHED CALL RATE ....................................................................................................14 3.1.1 RF Access Failure (TCCF) Analysis........................................................................... 15
3.1.1.1 Concepts and Optimization Techniques........................................................................ 15 3.1.1.1.1 Initial Cell Selection by Mobile in Idle Mode............................................................ 17 3.1.1.1.2 Access Probe Sequence ............................................................................................. 18 3.1.1.1.3 Channel Assignment Message on Paging Channel ................................................... 18 3.1.1.1.4 Traffic Channel Acquisition by Mobile and Cell ....................................................... 22 3.1.1.1.5 Final Handshake to Confirm Service Option and Service Connection...................... 24
3.1.1.2 Silent Reoriginations..................................................................................................... 24 3.1.1.3 Recent IS95B Enhancements ........................................................................................ 25
3.1.1.3.1 Access Entry Handoff (AEHO) Feature .................................................................... 26 3.1.1.3.2 Access Handoff (AHO) Feature ................................................................................ 26 3.1.1.3.3 Channel Assignment into Soft Handoff (CAMSHO) Feature..................................... 26
3.1.1.4 TCCF Causes and Associated Fixes ............................................................................. 27 3.1.1.4.1 High Traffic Areas..................................................................................................... 27 3.1.1.4.2 Cross-Carrier TCCFs ............................................................................................... 29 3.1.1.4.3 Poorly Defined Neighbor Lists.................................................................................. 34 3.1.1.4.4 Excessive Soft-Handoff Zones ................................................................................... 36 3.1.1.4.5 Lack of RF Coverage ................................................................................................ 37 3.1.1.4.6 Search Window Problems ......................................................................................... 38 3.1.1.4.7 External Interference ................................................................................................ 39 3.1.1.4.8 Co-PN Interference ................................................................................................... 40 3.1.1.4.9 Hardware Goes Into Bad State ................................................................................. 41 3.1.1.4.10 Intermittent Hardware Problems .............................................................................. 42 3.1.1.4.11 CRTU/CTRM TCCFs ................................................................................................ 42
3.1.2 Call Setup Failure Analysis ........................................................................................ 43 3.1.2.1 Concepts and Optimization Techniques........................................................................ 43 3.1.2.2 Commonly Encountered Types of Call Setup Failures ................................................. 44
3.1.2.2.1 Call Shutdown Type 43 (CS-[43])............................................................................. 44 3.1.2.2.2 Call Shutdown Type 10 (CS-[10])............................................................................. 44 3.1.2.2.3 Speech Handler Failures........................................................................................... 45
3.1.3 CE/PP Resource Blocking Analysis ............................................................................ 46 3.1.3.1 Concepts and Optimization Techniques........................................................................ 46
3.1.3.1.1 Conceptual Overview for 2G Cells............................................................................ 46 3.1.3.1.2 3G1X Enhancements & Concepts ............................................................................. 48 3.1.3.1.3 CE/PP Blocking Definition ....................................................................................... 50
CDMA RF PERFORMANCE ANALYSIS & TROUBLESHOOTING GUIDE
LUCENT TECHNOLOGIES PROPRIETARY 2
3.1.3.1.4 CE/PP Resource Blocking Management Techniques ................................................ 50 3.1.3.2 CE/PP Resource Blocking Causes and Associated Fixes.............................................. 51
3.1.3.2.1 Cell Resource Capacity Reached .............................................................................. 51 3.1.3.2.2 Hardware Outages .................................................................................................... 53 3.1.3.2.3 Intermittent Hardware Problems .............................................................................. 53
3.1.4 Forward Power Resource Blocking Analysis.............................................................. 54 3.1.4.1 Concepts and Optimization Techniques........................................................................ 54
3.1.4.1.1 Conceptual Overview ................................................................................................ 54 3.1.4.1.2 Important Lucent Features and Translations ............................................................ 58 3.1.4.1.3 Forward Power Resource Blocking Management Techniques.................................. 59
3.1.4.2 Forward Power Resource Blocking Causes and Associated Fixes................................ 60 3.1.4.2.1 Sector has reached Capacity Limit............................................................................ 60 3.1.4.2.2 Excessive Soft-Handoff Zones ................................................................................... 61 3.1.4.2.3 Incorrect Setting of VAF Causes Early Overload ..................................................... 62 3.1.4.2.4 Overload Not Detected on All Carriers of Multi-Carrier Sector............................... 63
3.1.5 Reverse RF Loading Resource Blocking Analysis ...................................................... 66 3.1.5.1 Concepts and Optimization Techniques........................................................................ 66
3.1.5.1.1 Conceptual Overview ................................................................................................ 66 3.1.5.1.2 Reverse RF Loading Blocking Management Techniques .......................................... 68
3.1.5.2 Reverse RF Loading Resource Blocking Causes and Associated Fixes ....................... 70 3.1.5.2.1 Sector has reached Capacity Limit............................................................................ 70 3.1.5.2.2 Excessive Soft-Handoff Zones ................................................................................... 70 3.1.5.2.3 Overload Not Detected on All Carriers of Multi-Carrier Sector............................... 71 3.1.5.2.4 External Interference ................................................................................................ 74
3.1.6 Termination Failures Related to Call Delivery Type.................................................. 75 3.1.7 Termination Failures due to Registration Problems and Paging Strategies .............. 76
3.1.7.1.1 Conceptual Overview ................................................................................................ 76 3.1.7.1.2 Registration and Paging Strategy Recommendations ............................................... 79
3.2 DROP CALL RATE ...................................................................................................................80 3.2.1 Lost Calls .................................................................................................................... 80
3.2.1.1 Concepts and Optimization Techniques........................................................................ 80 Conceptual Overview ................................................................................................................... 80 Optimization Steps for Reducing Lost Calls................................................................................. 81
3.2.1.2 Lost Call Causes and Associated Fixes......................................................................... 83 3.2.1.2.1 Poorly Defined Neighbor Lists.................................................................................. 83 3.2.1.2.2 High Traffic Areas..................................................................................................... 85 3.2.1.2.3 Significant Areas of Poor Coverage.......................................................................... 86 3.2.1.2.4 Island-Mode Cell....................................................................................................... 87 3.2.1.2.5 Handoff Cell is Blocking on All Carriers .................................................................. 88 3.2.1.2.6 Pilot Polluted Areas .................................................................................................. 89 3.2.1.2.7 Search Window Problems ......................................................................................... 89 3.2.1.2.8 External Interference ................................................................................................ 90 3.2.1.2.9 Co-PN Interference ................................................................................................... 91 3.2.1.2.10 Hardware Outages and/or Intermittent Hardware Problems ................................... 93 3.2.1.2.11 Incorrectly Optimized New Cell ................................................................................ 93 3.2.1.2.12 Inadvertent Change of Translations.......................................................................... 94
3.2.2 CP Fail Drops............................................................................................................. 95 3.2.2.1 Concepts and Optimization Techniques........................................................................ 95
3.2.2.1.1 General Description.................................................................................................. 95 3.2.2.1.2 Inter-Frequency Semi-Soft Handoff Concepts........................................................... 96 3.2.2.1.3 Optimization Steps for Reducing CP Fail Drops ...................................................... 99
3.2.2.2 CP Fail Causes and Associated Fixes ......................................................................... 100 3.2.2.2.1 Poorly Optimized Border Sectors............................................................................ 100 3.2.2.2.2 Incorrect Management of Cross-Carrier Assignments on Border Sectors .............. 101 3.2.2.2.3 Drops due to Undesired Hard-Handovers .............................................................. 102
CDMA RF PERFORMANCE ANALYSIS & TROUBLESHOOTING GUIDE
LUCENT TECHNOLOGIES PROPRIETARY 3
3.3 FCH FRAME ERROR RATE..................................................................................................103 3.3.1 Concepts and Optimization Techniques.................................................................... 103
3.3.1.1 Forward Frame Error Rate (FFER) ............................................................................. 104 3.3.1.1.1 2G and 3G Radio Configurations............................................................................ 104 3.3.1.1.2 FFER Calculation for 2G RS2 ................................................................................ 104 3.3.1.1.3 FFER Calculation Using PMRM ............................................................................ 106 3.3.1.1.4 Optimization Steps for FFER .................................................................................. 106
3.3.1.2 Reverse Frame Error Rate (RFER) ............................................................................. 107 3.3.1.2.1 RFER Calculation ................................................................................................... 107 3.3.1.2.2 Optimization Steps for RFER .................................................................................. 108 3.3.1.2.3 Other Poor RFER Causes and Associated Fixes..................................................... 108
4. HIGH SPEED PACKET DATA (HSPD) - SPECIFIC KPI OPTIMIZATION AND TROUBLESHOOTING ..................................................................................................................... 110 4.1 SUPPLEMENTAL CHANNEL BLOCKING / RATE REDUCTION .........................................114
4.1.1 Blocking / Rate Reduction Due to RF Capacity........................................................ 115 4.1.1.1 Concepts and Optimization Techniques...................................................................... 115
4.1.1.1.1 Overview of SARA................................................................................................... 115 4.1.1.1.2 Forward Link Optimization Techniques.................................................................. 116 4.1.1.1.3 Reverse Link Optimization Techniques ................................................................... 117
4.1.1.2 RF Capacity Related Failure Causes and Suggested Fixes ......................................... 119 4.1.1.2.1 Excessive Areas Lacking Pilot Dominance ............................................................. 119 4.1.1.2.2 Excessive Pathloss .................................................................................................. 119 4.1.1.2.3 Neighbor List Problems .......................................................................................... 120 4.1.1.2.4 Candidate Sector Resource Blocking ...................................................................... 122
4.1.2 Blocking / Rate Reduction Due to Packet Pipes ....................................................... 123 4.1.2.1 Concepts and Optimization Techniques...................................................................... 123
4.1.2.1.1 Conceptual Overview .............................................................................................. 123 4.1.2.1.2 Important Lucent Features...................................................................................... 124 4.1.2.1.3 Packet Pipe Provisioning Strategies ....................................................................... 124
4.1.2.2 PP Blocking / Rate Reduction Causes and Associated Fixes...................................... 126 4.1.2.2.1 Blocking / Rate Reduction due to Insufficient PP Provisioning .............................. 126 4.1.2.2.2 Blocking / Rate Reduction due to Span Outage....................................................... 126
4.1.3 Blocking / Rate Reduction Due to Channel Fragments ............................................ 127 4.1.3.1 Concepts and Optimization Techniques...................................................................... 127
4.1.3.1.1 Overview of 3G Channel Cards .............................................................................. 127 4.1.3.1.2 CF Provisioning Strategies ..................................................................................... 128 4.1.3.1.3 Assigning Calls to Appropriate Channel Cards by Technology .............................. 129
4.1.3.2 CF Blocking / Rate Reduction Failure Causes and Fixes............................................ 131 4.1.3.2.1 Blocking / Rate Reduction because no FCH available............................................ 131 4.1.3.2.2 Blocking / Rate Reduction because no SCH available ............................................ 132
4.1.4 Blocking / Rate Reduction Due to Walsh Codes ....................................................... 132 4.1.4.1 Concepts and Optimization Techniques...................................................................... 132
4.1.4.1.1 Overview of Variable Walsh Spreading Factors ..................................................... 132 4.1.4.1.2 Concept of Walsh Code Blocking............................................................................ 133 4.1.4.1.3 Walsh Code Optimization Techniques..................................................................... 135
4.1.4.2 Walsh Code Blocking / Rate Reduction Failure Causes and Fixes ............................. 135 4.1.4.2.1 Unavailable Walsh Codes due to Excessive High-Speed Connections.................... 135 4.1.4.2.2 Unavailable Walsh Codes due to Excessive Low-Speed Connections..................... 136
4.2 EXCESSIVE ANCHOR TRANSFERS ......................................................................................136 4.2.1 Concepts and Optimization Techniques.................................................................... 136
4.2.1.1 Conceptual Overview.................................................................................................. 136 4.2.1.2 Optimization Techniques ............................................................................................ 137
CDMA RF PERFORMANCE ANALYSIS & TROUBLESHOOTING GUIDE
LUCENT TECHNOLOGIES PROPRIETARY 4
4.3 3G!3G INTER-FREQUENCY HANDOFFS..........................................................................138 4.3.1 Concept / Reasons for Throughput Degradation ...................................................... 138 4.3.2 Symptoms and Identification Techniques.................................................................. 139 4.3.3 Suggested Fixes for Improvement ............................................................................. 139
4.4 3G!NON-3G HANDOFFS....................................................................................................140 4.4.1 Concept / Reasons for Throughput Degradation ...................................................... 140 4.4.2 Symptoms and Identification Techniques.................................................................. 141 4.4.3 Suggested Fixes for Improvement ............................................................................. 141
4.5 OUTAGES AND ERRORS IN THE PACKET NETWORK.........................................................142 APPENDIX A METRIC CROSS-REFERENCE ............................................................................ 143
APPENDIX B OVERVIEW OF SPAT TOOL................................................................................ 145
List of Tables TABLE 3.1 NUMBER OF CALLS SUPPORTED WITH PPOPT .......................................................................... 47 TABLE 3.2 NUMBER OF CALLS PER SERVICE CLASS FOR VARIOUS PACKET PIPE BANDWIDTHS ................ 50 TABLE 3.3 VOICE ACTIVITY FACTOR SETTINGS AND CORRESPONDING SCALING FACTORS......................... 56 TABLE 3.4 TABLE OF TYPICAL PEAK PRIMARY ERLANG VALUES............................................................... 58 TABLE 3.5 TABLE OF TYPICAL PEAK PRIMARY ERLANG VALUES............................................................... 68 TABLE 3.6 2G AND 3G RADIO CONFIGURATIONS..................................................................................... 104 TABLE 4.1 NUMBER OF CALLS PER SERVICE CLASS FOR VARIOUS PACKET PIPE BANDWIDTHS .............. 125
List of Figures
FIGURE 1 IS95A ORIGINATION CALL FLOW...................................................................... 16
FIGURE 2 SEMI-SOFT HANDOFF CALL FLOW................................................................... 96
FIGURE 3 FCH/SCH UTILIZATION FOR TYPICAL WEB BROWSING SESSION ....... 111
FIGURE 4 3G1X HIGH SPEED PACKET DATA NETWORK PROTOCOL STACK....... 114
FIGURE 5 RC3 WALSH CODE TREE..................................................................................... 134
CDMA RF PERFORMANCE ANALYSIS & TROUBLESHOOTING GUIDE
LUCENT TECHNOLOGIES PROPRIETARY 5
List Of Abbreviations AOC Aggregate Overload Control
AR Autonomous Registration
CAM Channel Assignment Message
CCC CDMA Cluster Controller
CCU CDMA Cluster Unit
CDM CDMA Digital Module
CDMA Code Division Multiple Access
CDN Call processing Database Node
CE Channel Element
CMPIFHO CDMA Multiple Pilots Inter-Frequency Handoff
CN Cellular Networking
CTA Customer Technical Advocate
DCS Digital Cellular Switch
ECAM Extended Channel Assignment Message
ECP Executive Cellular Processor
ECU Enhanced Channel Unit
FCH Fundamental Channel
FFER Forward Frame Error Rate
HSPD High Speed Packet Data
IFHOTI Inter-Frequency Handoff Trigger Improvement
IROC Improved Reverse link Overload Control
ISPAGE Intersystem Paging
KPI Key Performance Indicator
LDAT Lucent Data Analysis Tool
MSC Mobile Switching Center
OMP Operation and Management Platform
PN Pseudorandom Noise
PP Packet Pipe
PSMM Pilot Strength Measurement Message
RFER Reverse Frame Error Rate
ROC Reverse link Overload Control
CDMA RF PERFORMANCE ANALYSIS & TROUBLESHOOTING GUIDE
LUCENT TECHNOLOGIES PROPRIETARY 6
List Of Abbreviations (Con’t) ROP Read-Only Printer
TCCF Traffic Channel Confirmation Failure
TLDN Temporary Location Directory Number
SCN Special Cellular Networking
SCH Supplemental Channel
SCCM Service Connect Complete Message
SH Speech Handler
SPAT System Performance Analysis Tool
UNL Undeclared Neighbor List
VLR Visitor Location Register
CDMA RF PERFORMANCE ANALYSIS & TROUBLESHOOTING GUIDE
LUCENT TECHNOLOGIES PROPRIETARY 7
References [1] 401-610-009 System Capacity Monitoring & Engineering (SCME) Guide
[2] CDMA RF Translation Application Notes – Introduction
[3] CDMA RF Translation Application Note #1 – Forward Link Transmit Path
[4] CDMA RF Translation Application Note #2 – Forward and Reverse Overload Control and Supplemental Air Resource Allocation
[5] CDMA RF Translation Application Note #3V – Voice Power Control
[6] CDMA RF Translation Application Note #4 – Handoff
[7] CDMA RF Translation Application Note #4D – 3G1X Data Handoff
[8] CDMA RF Translation Application Note #7 – Timing, Delay and Access Parameters
[9] 401-612-221 CDMA Packet Pipe Optimization and Packet Pipe 16
[10] 401-612-429 Backhaul Engineering Enhancement
[11] SRD-1536 CDMA Performance and Capacity Metrics – R18, Issue 7.0
[12] Experiences with SS7 Message Reduction, Registration Control and Paging Version 2.0, M. Dal Pan, J.D. Newell, December 21, 2000.
[13] CDMA 3G Packet Data – 3G Overview, David A. Welsh, Wireless Development – CDMA/3G Packet Data, February 2002
[14] Troubleshooting guide for Packet Data
[15] 3G1X RF Optimization Guidelines, http://rfec.wh.lucent.com/html/cdma/rf_amp_docs.htm
[16] Multi-Carrier Optimization Guidelines for PCS and Cellular CDMA Systems, http://rfec.wh.lucent.com/html/cdma/rf_amp_docs.htm
CDMA RF PERFORMANCE ANALYSIS & TROUBLESHOOTING GUIDE
LUCENT TECHNOLOGIES PROPRIETARY 8
1. INTRODUCTION
The CDMA Performance Analysis Guide has been put together to facilitate the system performance maintenance, analysis and troubleshooting of IS95A/B and IS2000 CDMA networks. The purpose of this guide is to not only provide information on the various CDMA performance degradation causes and troubleshooting techniques, but also to provide a conceptual overview of all the key performance metrics and their associated optimization guidelines. This guide is primarily intended for Customer Technical Advocates (CTAs) and RF Performance Engineers.
One of the most important points to realize is that there are a vast number of diverse reasons why CDMA systems may exhibit problems. For example, parts of the system may not operate optimally for any combination of the following reasons:
• Base station hardware failures (including intermittent problems)
• Poor RF environment
• Sub-optimal cell site location / antenna placement
• Translations entry errors or accidental changes
• Translations requiring optimization
• Core network problems (capacity overflows, hardware failures, incorrect provisioning etc.)
• Incorrect antenna assembly
• Cell site capacity limitations
• Improper RF optimization
While this list is not exhaustive, it demonstrates clearly the breadth of issues that could affect CDMA systems. It is therefore imperative that the CDMA engineer follows a disciplined process of proactive maintenance and reacts efficiently and effectively to real-time system performance degradations.
In order to do this, the engineer must first have a fundamental understanding of all the Key Performance Indicators (KPIs) that will best characterize the performance of the network. Upon understanding these KPIs, the engineer must know the key proactive optimization steps to take to maximize their performance. Finally, the engineer should be aware of potential causes of degradation in the performance of these KPIs and know the solutions to improve or fix these problems.
This Guide addresses all of these aspects in detail. Section 2 on Using This Guide provides a series of strategies on how to best use this Guide to tackle a variety of CDMA performance management and troubleshooting scenarios. It is strongly recommended that this section be read before attempting to use this document.
CDMA RF PERFORMANCE ANALYSIS & TROUBLESHOOTING GUIDE
LUCENT TECHNOLOGIES PROPRIETARY 9
2. USING THIS GUIDE
This Guide was written to provide the engineers with effective documentation that will complement various performance analysis tools (such as SPAT, Watchmark Prospect etc.) by providing the necessary structure and details to troubleshoot and resolve CDMA network problems.
To that effect, this Guide may be used for any combination of the following:
• To perform system-wide CDMA network performance management where a large selection of cells are collectively optimized for various key performance indicators.
Such type of performance management may typically be required for activities such as system audits or to baseline the performance of markets upon initial entry by Lucent.
• To perform troubleshooting, analysis and resolution of specific CDMA network performance problems, as indicated through service measurements and other switch-based features and reports.
These specific problem analysis requirements may typically result from open customer tickets or ARs or if Lucent support is called in (contracted) to resolve specific customer issues.
• To act as a reference guide for the various principles and theory associated with the performance of the various Key Performance Indicators (KPI’s).
The details on how this Guide may be used to address each of these requirements are described in the sections below.
CDMA RF PERFORMANCE ANALYSIS & TROUBLESHOOTING GUIDE
LUCENT TECHNOLOGIES PROPRIETARY 10
2.1 Using the Guide for System-Level Troubleshooting and Analysis
As described above, this type of system-wide troubleshooting and analysis is typically done during system audits (either periodic or one-time) or when engineers who are new to their markets need to establish a baseline by “cleaning up” the performance.
The approach adopted in this Guide is to first characterize the system performance as being comprised of a series of Key Performance Indicators (KPI’s). Section 3 lists all the KPI’s that are common to Voice and Data services, while Section 4 lists the additional KPI’s that are specific only to Data performance. Given the relatively recent release of support for packet data services through the IS2000 standard, a brief overview of Lucent’s implementation of High Speed Packet Data (HSPD) is also provided in Section 4. This overview will provide the necessary background to understand the rest of the detailed discussions on Data-specific KPI’s listed in this section.
With these KPI’s defined, the strategy to perform system-level troubleshooting and analysis then is as follows:
1) Know the list of all possible failure components that could result in degradations in the performance of these KPI’s.
This is listed in Sections 3 and 4 under each of the KPI sections.
2) Understand the fundamental concepts behind why each of these failure components may occur and proactive optimization strategies to ensure optimal performance is attained for each of these components.
These concepts and proactive optimization steps are described in Sections 3 and 4 under each of the failure components of each KPI.
3) Understand all of the possible failure causes for each of these KPI failure components, the concepts and reasons for these failures, symptoms and identification techniques to isolate these failure causes, and suggestions for resolving these failures.
Each of these failure causes must then be tested to see whether they are occurring on any of the cells in the system using the appropriate identification techniques, and subsequently should be resolved by employing the suggested fixes.
These detailed discussions on the failure causes for each of the KPI failure components are also discussed in Sections 3 and 4.
Note that, when performing such system-level audits or performance management, it is recommended that this effort be preceded by a translations scrub to check every important RF translation parameter against Lucent recommendations. Any deviations from these recommendations must either be corrected or documented if such deviations were intentionally set.
This Guide will not delve into a detailed discussion on translations and their associated recommended values because this topic is already discussed very effectively and in great detail in [2], with cross-references to other translation application notes that describe related concepts to each of these translations.
CDMA RF PERFORMANCE ANALYSIS & TROUBLESHOOTING GUIDE
LUCENT TECHNOLOGIES PROPRIETARY 11
2.2 Using the Guide for Troubleshooting Specific CDMA Performance Problems
This section describes how this Guide may be used to resolve a very specific performance issue in a CDMA network. This may typically occur in response to customer trouble tickets, or when Lucent has been contracted by the customer to tackle a particular issue.
The steps needed to efficiently and effectively handle such performance problems are listed below. The method in which this Guide may be used to complement this process is also detailed in these steps.
1) Clearly define the problem. Often, the true problem is not characterized accurately because of possible misrepresentations as this problem is communicated through multiple people. Alternatively, this could also result because of a lack of detailed analysis of the problem due to insufficient information or know-how.
This Guide does not delve into the subject of problem characterization. However, it is necessary that the problem is ultimately narrowed down to one or more failing performance metrics in order to effectively use this document to resolve the problem at hand.
The SPAT tool defines metrics as per Lucent Systems Engineering requirements, and will therefore be used as a reference for all the RF performance metrics. This tool is described in Appendix B while a list of SPAT metrics is provided in Appendix A.
2) List all of the possible failure root causes that could result in the problem currently being investigated.
This is achieved in the Guide through the cross-reference provided in Appendix A. This appendix lists all of the sections that are related to each SPAT metric. This list will therefore serve as a cross-reference for all possible root causes for these metrics.
3) Isolate the root cause of the problem by understanding all of the symptoms associated with each of the possible causes, and testing them against the current problem under investigation.
Each of the sections in the Guide that correspond to the possible causes for the degraded KPI performance will have in them a description of the symptoms of that particular cause, along with identification techniques to isolate that cause. These identification techniques need to be employed for each of the sections listed in the cross-reference in Appendix A to narrow down to the root cause of the problem.
4) Fix the problem once the root cause is determined. Note that it may not always be possible to implement the fix immediately. For instance, the root cause might require an additional site as the appropriate fix, which could take several months.
Again, each of the sections in the Guide that correspond to possible root causes for the degraded KPI performance will have in them a discussion on suggested fixes for that particular root cause.
CDMA RF PERFORMANCE ANALYSIS & TROUBLESHOOTING GUIDE
LUCENT TECHNOLOGIES PROPRIETARY 12
2.3 Using the Guide as a Reference for Principles of KPI Performance Management and Troubleshooting
This Guide may also be used as educational material, without the need to resolve any actual performance issue. This is because a significant portion of the material is dedicated to explaining the concepts behind the various Key Performance Indicators (KPI’s). In addition, the Guide discusses in detail the description, identification and resolution of root causes of problems that could result in KPI performance degradations.
Section 3 lists all the Key Performance Indicators (KPI’s) that are common to Voice and Data, while Section 4 lists the additional KPI’s that are specific only to Data performance. Included in Section 4 is some necessary background concepts required to understand the Data-specific KPI’s listed in this section. A list of possible failure components that constitute failures in KPI performance are also listed in these sections.
Sections 3 and 4 go on to discuss each of the KPI failure components in detail. First, the concept behind these failure components is discussed. Subsequently, proactive optimization steps are listed to ensure optimal performance of these components. Finally, these sections describes all of the possible failure causes that could result in performance degradation in each of the failure components, along with identification techniques and suggestions for fixes.
CDMA RF PERFORMANCE ANALYSIS & TROUBLESHOOTING GUIDE
LUCENT TECHNOLOGIES PROPRIETARY 13
3. VOICE AND DATA KPI OPTIMIZATION AND TROUBLESHOOTING
Voice Key Performance Indicators (KPI’s) refer to a small collection of metrics that best represent the entire user experience with the quality of a cellular voice network. In essence, the customer perception of this network will be driven by the following factors:
1) How easy and fast is it to access the network and make a call? Similarly, how reliably and promptly is the customer able to receive calls?
2) How good is the quality of the call during the call?
3) How often are the calling parties able to gracefully end the call themselves, as opposed to the network “dropping” their call prematurely?
These three factors lead to three Key Performance Indicators (KPI’s), as will be elaborated upon in this section. These three KPI’s are:
1) Established Call Rate
2) Frame Error Rate
3) Drop Call Rate
With Data calls, as explained in Section 4, a Fundamental Channel (FCH) is established and maintained throughout the duration of the call. This FCH is set up and torn down in exactly the same way as the Traffic Channel (TCH) during a Voice call. Also, the Data FCH can be torn down (dropped) for all the same reasons as why Voice calls on an FCH can be dropped.
Therefore, all of the principles discussed with these three KPI’s will apply equally to the “quality” of the Data connection. Of course, with Data, any degradation in this quality will just translate to throughput problems, due to delays in channel establishment, undue frame errors during data transfer and undesired periods of zero transfer resulting from dropped calls.
In addition to the FCH, the Data call may also establish an additional channel called the Supplemental Channel (SCH) to provide the necessary bandwidth for high speed data transfers. The KPI’s related to the performance of the network through these SCHs (which only pertain to Data calls) are discussed in Section 4.
This section provides a detailed conceptual overview of each of these Voice and Data KPIs, as well as optimization techniques and guidelines to maximize their performance. It goes on to discuss potential causes for failures in these KPIs along with suggestions for improvements and fixes. Finally, where applicable, new upcoming features that will help in improving the KPI performance are discussed.
CDMA RF PERFORMANCE ANALYSIS & TROUBLESHOOTING GUIDE
LUCENT TECHNOLOGIES PROPRIETARY 14
3.1 Established Call Rate
This performance indicator measures the percentage of originating and terminating call attempts that are successfully established. This is one of the most critical performance indicators as it is the best measure of customer-perceived call blocking.
The high-level equation for established call rate may be represented as follows:
100% x Seiz.Term. Seiz.Orig.
Failures) Term. Seiz.(Term. Failures) Orig. Seiz.(Orig. Rate Call dEstablishe+
−+−=
SRD-1536 [11] provides a detailed description of the peg counts and equations used to determine this KPI.
There are several categories of failures that contribute to degradations in the established call rate metric, namely:
• RF Access Failures (TCCFs)
• Call Setup Failures
• CE/PP Resource Blocking
• Forward Power Resource Blocking
• Reverse RF Loading Resource Blocking
• Call Delivery Type Related Termination Failures
• Registration Related Termination Failures
• Other Miscellaneous Failures Component
The following sections examine failure causes and fixes/improvements for each of these categories in detail.
The only category that will not be discussed in detail in this document is the last category – Other Miscellaneous Failures Component. These encompass several other failures that typically occur much less frequently in CDMA networks. An example would be failures due to no Speech Handler (SH) assignment received at the cell. While these failures will not be discussed in great detail in this document, the Lucent support center should be contacted if these failures become a significant contributor to established call failures.
CDMA RF PERFORMANCE ANALYSIS & TROUBLESHOOTING GUIDE
LUCENT TECHNOLOGIES PROPRIETARY 15
3.1.1 RF Access Failure (TCCF) Analysis
3.1.1.1 Concepts and Optimization Techniques
A Traffic Channel Confirmation Failure (TCCF) is generated when a cell site fails to receive the Service Connect Complete Message (SCCM) upon issuing a Channel Assignment Message (CAM) or Extended Channel Assignment Message (ECAM). A TCCF may occur either on a mobile-originated attempt or a termination attempt, whereby the mobile receives a call.
It is important to note that this type of failure can only happen after channel assignment implying that the base station had the hardware resources to support the call.
The failures may be further broken down into Origination Traffic Channel Confirmation Failures (O-TCCFs), for mobile-originating calls, Termination Traffic Channel Confirmation Failures (T-TCCFs), for mobile-terminating calls, and Alert Confirmation Failures, also for mobile-terminating calls.
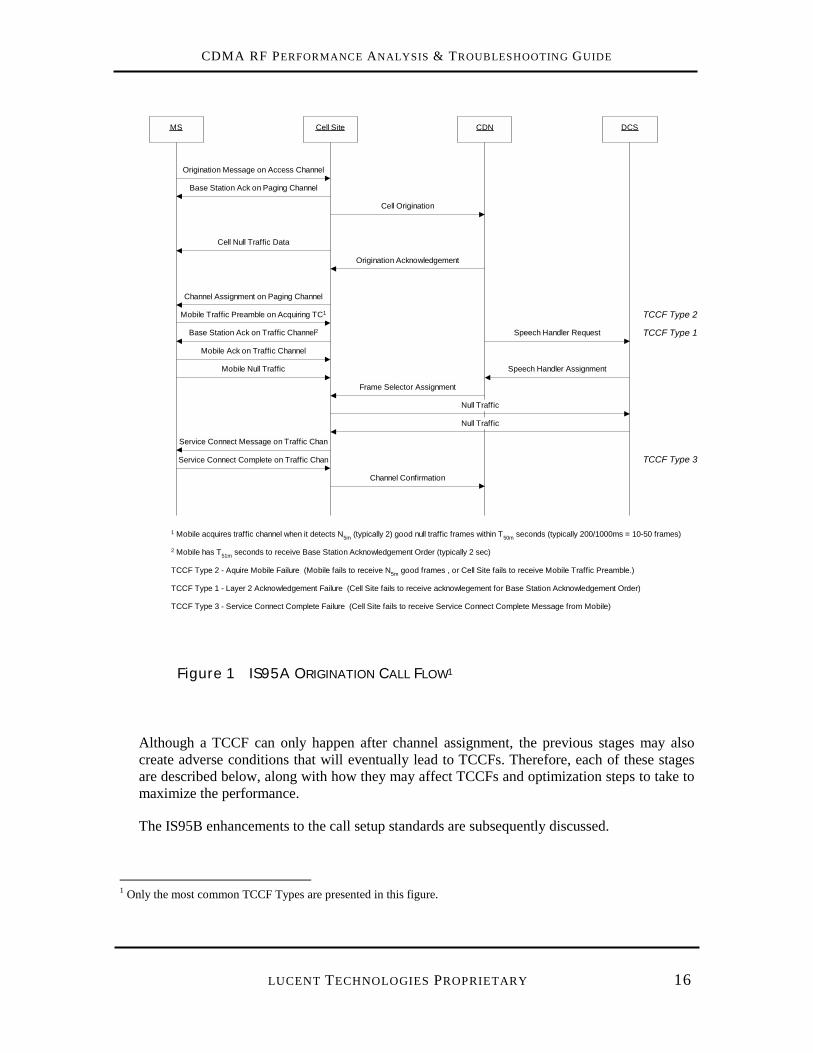
During the call setup process, there is a sequence of messages that are communicated between the cell and the mobile. Depending on which point during this message transfer the failure occurs, a different type of TCCF will be recorded on the ROP (see Figure 1). However, all these failures are bundled under a single TCCF counter in service measurements.
TCCFs are normally associated with poor RF conditions, thus, the TCCF rate is also commonly referred to as the RF Access Failure Rate. However, as will be seen in this section, there may be other hardware-related failures that may also result in TCCFs.
The call setup process for IS95A systems may be categorized into the following stages:
1. Initial Cell Selection by Mobile in Idle Mode
2. Access Probe Sequence on Access Channel
3. Acknowledgement by Cell on Paging Channel
4. Channel Assignment Message on Paging Channel
5. Traffic Channel Acquisition by Mobile and Cell
6. Final Handshake to Confirm Service Option and Service Connection
An example call flow is presented in the following figure that describes the call processing that occurs for a mobile-origination. The stages at which the various common ROP TCCF messages are generated are also indicated in this figure.
CDMA RF PERFORMANCE ANALYSIS & TROUBLESHOOTING GUIDE
LUCENT TECHNOLOGIES PROPRIETARY 16
MS Cell Site CDN DCS
Origination Message on Access Channel
Base Station Ack on Paging Channel
Cell Origination
Cell Null Traffic Data
Origination Acknowledgement
Channel Assignment on Paging Channel
Mobile Traffic Preamble on Acquiring TC1
Base Station Ack on Traffic Channel2 Speech Handler Request
Speech Handler Assignment
Frame Selector Assignment
Null Traffic
Null Traffic
Service Connect Message on Traffic Chan
Service Connect Complete on Traffic Chan
Channel Confirmation
1 Mobile acquires traffic channel when it detects N5m (typically 2) good null traffic frames within T50m seconds (typically 200/1000ms = 10-50 frames)
Mobile Ack on Traffic Channel
2 Mobile has T51m seconds to receive Base Station Acknowledgement Order (typically 2 sec)
Mobile Null Traffic
TCCF Type 1
TCCF Type 2
TCCF Type 3
TCCF Type 2 - Aquire Mobile Failure (Mobile fails to receive N5m good frames , or Cell Site fails to receive Mobile Traffic Preamble.)
TCCF Type 1 - Layer 2 Acknowledgement Failure (Cell Site fails to receive acknowlegement for Base Station Acknowledgement Order)
TCCF Type 3 - Service Connect Complete Failure (Cell Site fails to receive Service Connect Complete Message from Mobile)
Figure 1 IS95A ORIGINATION CALL FLOW1
Although a TCCF can only happen after channel assignment, the previous stages may also create adverse conditions that will eventually lead to TCCFs. Therefore, each of these stages are described below, along with how they may affect TCCFs and optimization steps to take to maximize the performance.
The IS95B enhancements to the call setup standards are subsequently discussed.
1 Only the most common TCCF Types are presented in this figure.
CDMA RF PERFORMANCE ANALYSIS & TROUBLESHOOTING GUIDE
LUCENT TECHNOLOGIES PROPRIETARY 17
3.1.1.1.1 Initial Cell Selection by Mobile in Idle Mode
General Description
When in the idle mode, the mobile constantly monitors the paging channel on the pilot that it is camped on. In addition, it compares the strength of the current pilot with all other available pilots. When the mobile finds another PN of sufficiently greater strength, it will perform an idle-mode handoff2. Subsequently, it will start monitoring this new paging channel and the process repeats.
The mobile follows a particular sequence when searching for other pilots, which is determined by the neighbor list sent to it on the paging channel of the sector that it is currently on. The mobile will scan the pilots on the neighbor list with much greater frequency than the rest of the pilots, which belong to the Remaining Set.
Therefore, in order to ensure that the mobile is always camped on the most ideal pilot for an area, it is imperative that the neighbor list provided to the mobile is accurate and complete. This is because, in IS95A systems, once the setup process has begun, the mobile will remain on the same pilot in simplex mode for the duration of the call setup process.
Optimization Steps for Initial Cell Selection Stage
• Ensure that the Paging Channel Neighbor List Selection (pgcl_nlsel) translation parameter in the ecp/ceqface database form is set to 20. Prior to Release 14.0, only 12 neighbors could be sent to the mobile in idle mode even though 20 neighbors could be entered for that sector to be used during calls. With Release 14.0 and greater, the limit for number of neighbors in the idle mode was extended to 20, but the default translation will still be 12 unless explicitly changed.
• Ensure neighbor lists are accurate and complete. Some of the important characteristics of a good neighbor list are:
• They should satisfy reciprocity. That is, if sector A is in sector B’s neighbor list, then sector B should also be in sector A’s neighbor list. It is very rare that non-reciprocity can be justified in CDMA systems because of the fact that all cells are transmitting at the same frequency. Therefore, if one sector is strong enough to be neighbored with another, then the converse, by definition, will also be true. The FCIAlert tool will help verify reciprocity (Appendix B).
• The neighbor lists should capture all potential valid neighbors and be prioritized correctly. The Handoff (HO) Matrix and Undeclared Neighbor List (UNL) tools will help greatly in ensuring that this is achieved (Appendix B), assuming there is sufficient call volume to make these tools statistically valid.
2 The IS98 standard only mandates that this idle-handoff be performed at least when the candidate pilot is 3 dB stronger than the current active one. The actual algorithm and thresholds used to perform these idle-handoffs are left up to the equipment vendor, as long as these minimum requirements are met.
CDMA RF PERFORMANCE ANALYSIS & TROUBLESHOOTING GUIDE
LUCENT TECHNOLOGIES PROPRIETARY 18
The HO Matrix tool logs all handoff activity that actually took place in the network and is a useful tool to prioritize neighbors and delete unused neighbors. The UNL3 tool may be used to add missing neighbors as it captures strong pilots that could not be added to the Active Set because they were not part of the neighbor list. Though these pilots are captured in the call state, the neighbor list additions will apply to the idle state also.
When using the UNL feature, it is often more effective to first use service measurements to narrow down and focus on the sectors exhibiting the most severe UNL problems (as a proportion of their total traffic). Tools such as SPAT (Appendix B) may be used to easily arrive at this list of affected sectors.
• There should be no PN ambiguities in the neighbor list. The FCIAlert tool can be used to check for this (see Appendix B for details on the tool and this condition).
3.1.1.1.2 Access Probe Sequence
The mobile goes into the access probe sequence stage either when it receives a page from the base station, for terminating calls, or when the user hits the Send button, for originating calls.
The mobile selects an initial power to transmit the first probe based on the received signal strength and some adjustment factors. The mobile subsequently ramps up the power on successive probe attempts for every unacknowledged probe.
The purpose of the access probe parameters is to minimize the power transmitted, while maximizing the access success rate and minimizing the access delay. The access probe parameters should be set according to Lucent recommended values (as listed in [2]).
3.1.1.1.3 Channel Assignment Message on Paging Channel
General Description
Assuming the cell has hardware and power resources to support the access attempt, it will send out a Channel Assignment Message (CAM) on the paging channel. Otherwise, it will send a re-order and a TCCF will not result. The channel assignment message will tell the mobile to use a particular Walsh code and it may direct the mobile to another 1.25 MHz carrier.
A cross-carrier assignment results when the mobile is assigned to a carrier other than that which it was idle on. Otherwise, the assignment is known as a same-carrier assignment. It is
3 Several steps must be followed to enable UNL: 1) The FAF feature 547 must be activated. 2) The Undeclared Neighbor List (unl) translation must be set to y on all sectors of interest on the ceqface form, or switch-wide on the ecp form. 3) The Search Window Size: Remaining Set (srchwinr) translation in the ceqface form must be changed from its recommended value of zero to 7 or greater (preferably at least 9 to ensure all distant interferers are captured).
CDMA RF PERFORMANCE ANALYSIS & TROUBLESHOOTING GUIDE
LUCENT TECHNOLOGIES PROPRIETARY 19
important to distinguish between the two cases because cross-carrier TCCFs normally result when there is a mismatch in coverage between the carrier the mobile was idle on and the carrier the mobile was assigned to. The concepts behind channel assignments are discussed in detail below.
Channel Assignment Concepts
All mobiles execute a hashing algorithm to select the frequency to camp on, an algorithm that is understood by the network. This algorithm uses the mobile IMSI to hash onto one of the frequencies listed in the Channel List Message (CLM) that is sent by the base stations over the Paging channel to all idle mobiles on their sectors. When the mobile needs to make a call attempt, all communication over the Access and Paging channels will be on this hashed frequency.
When it comes time for the channel assignment by the network, the network first examines the Carrier Assignment Algorithm (tca_alg) in the ecp/ceqface database forms of the sector serving the call setup. There are three possible choices for the algorithm:
1) Originating Carrier (oc) which always attempts to assign the channel on the hashed frequency, regardless of the traffic distribution across the carriers of that sector. Note that cross-carrier assignments may still occur with this oc algorithm if the hashed carrier does not have the resources to serve the call.
2) RF Loading (rf) which attempts to distribute the traffic evenly across carriers, permitting some amount of imbalance to favor same-carrier assignments. The preference is to assign the call to the hashed frequency but the call will be assigned to any other frequency that is experiencing traffic loads that are less than RF Loading Weight Factor percentage of its own traffic load, RF Loading Weight Factor (tca_weight) being a translatable parameter in the ecp/ceqface database form.
3) CCC Loading (cc) which distributes the traffic according to the percentage of CCC utilization across the various carriers. As with rf loading, all calls are given preference to remain on the carrier that they hashed on, but in the case of cc loading, calls may be assigned to another carrier that has a lower CCC utilization. This option is rarely used.
There is a special modification to the hashing algorithm when the mobile is camped on a border sector. In this case, the mobile is instructed to hash only onto one of the common carriers. This is achieved by the border sectors removing the border carriers from the CLM, thus forcing the mobiles to hash only onto the common carriers. This feature is known as the Omit Border Carrier from Channel List Message feature. This feature is automatically activated without any additional translations if the internal border carrier is configured for directed inter-frequency CDMA-to-CDMA handoff.
There is an important reason for having this feature. Border sectors will typically have much larger coverage footprints on their border carriers because of the reduced interference on these carriers. Therefore, if the mobiles do hash onto and set up calls on these carriers, then there is a high chance of dropped calls when handdowns are triggered onto its common carriers that do not have coverage in these border carrier overshoot areas. There is also a high probability of a
CDMA RF PERFORMANCE ANALYSIS & TROUBLESHOOTING GUIDE
LUCENT TECHNOLOGIES PROPRIETARY 20
failed origination or termination attempt due to high pathloss (that is, the mobile locks onto a PN at the cell/sector edge).
There are two important algorithms introduced with 3G services that could also result in cross-carrier assignments. They are the Allow Sharing 3G1X Carrier (share_3g1x) translation in the ceqface3g database form and the 2G/3G Load Preference Deltas (ld_prf_dlta_2g/3g1x) in the ceqface3g database form. The former affects the frequency list used by the mobiles to hash over, and the latter is a modification to the carrier assignment algorithm used by the network to ultimately assign a frequency to a call.
3G mobiles will only hash onto 3G carriers and 2G/3G1X mixed carriers (see Section 4.1.3.1 for descriptions on how these carriers are defined). Similarly, 2G mobiles will only hash onto 2G and 2G/3G1X carriers. However, if the Allow Sharing 3G1X Carrier is enabled on a 3G carrier, then 2G mobiles are also allowed to hash onto the 3G carrier.
The reason for having this translation is to allow the flexibility to either segregate 2G and 3G calls entirely onto their own carriers, or to allow at least the 2G mobiles to hash across all carriers, regardless of technology. The latter is the preferred approach with early 3G deployments, since it is unlikely that there will be enough 3G traffic to require dedicating an entire carrier to 3G calls, even if this carrier is populated completely with 3G cards.
In such a scenario, if the Allow Sharing 3G1X Carrier is not enabled, then 2G mobiles will never hash onto these 3G carriers, but will likely have many assignments to these carriers if rf load balancing is turned on (since there will be typically lower traffic on these carriers due to lack of 3G traffic). Therefore, there will be an undue number of cross-carrier assignments (depending on 2G/3G load preference delta settings), greatly increasing the risk of cross-carrier TCCFs. Additionally, if an existing 2G carrier was converted to support 3G without enabling this sharing, then this will increase the loading on the 2G Paging/Access channels as fewer carriers are now accommodating 2G load.
The 2G Load Preference Delta (ld_prf_dlta_2g) and 3G Load Preference Delta (ld_prf_dlta_3g1x) translations serve to bias the RF Loading Weight Factor (tca_weight in the ecp/ceqface forms) in such a way that it favors the 2G calls to get assigned to 2G carriers, and 3G calls to 3G carriers. If a 3G mobile hashes onto a 2G carrier, then the loading on all other 3G carriers on that sector are lowered by the 3G Load Preference Delta in order to make them more attractive for assignment to this 3G call. If that 3G call hashes onto a 3G carrier, then this 3G Load Preference Delta gets applied to itself, making it more attractive for the 3G call to stay on that same 3G carrier4. The same logic applies to the 2G Load Preference Deltas.
This concept is best explained with an example. Say that a cell is configured with two carriers, the first (F1) being a 2G/3G1X mixed carrier with current RF loading at 50%, and the second (F2) being a 3G-only carrier with current RF loading at 25%. Also assume that the RF Loading Weight Factor is set to 20%, 2G Load Preference Delta is set to 30%, 3G Load Preference Delta is set to 40% and Allow Sharing 3G1X Carrier is set to y on all carriers.
4 Note that if there is more than one 3G carrier on that sector, then the 3G Load Preference Delta gets equally applied to all of these 3G carriers, making it still possible for cross-carrier assignments to occur.
CDMA RF PERFORMANCE ANALYSIS & TROUBLESHOOTING GUIDE
LUCENT TECHNOLOGIES PROPRIETARY 21
Based on this configuration, the following scenarios describe various examples of how these translations get applied to determine the assigned carrier.
Scenario 1: 2G mobile originates on F1
In this case, for the purposes of the carrier assignment algorithm, F1 Loading = 50-20-30 = 0 (20% RF Loading Weight Factor since this is the originating carrier, and 30% 2G Load Preference Delta since this carrier has 2G) and F2 Loading = 25 (2G Load Preference Delta will not get applied for this carrier since it is 3G-only). Therefore, the call will be assigned to F1, even though it is carrying significantly more traffic.
Scenario 2: 2G mobile originates on F2
In this case, F1 Loading = 50-30 = 20 and F2 Loading = 25-20 = 5. Therefore, the call will be assigned to F2. Here, the 2G delta is not large enough to overcome the load factor and the fact that F2 is carrying much less traffic.
Scenario 3: 3G mobile originates on F1
In this case, F1 Loading = 50-20-40 = -10 and F2 Loading = 25-40=-15. Therefore, the call will be assigned to F2. Note that the 3G deltas cancel out since both carriers support 3G, leaving only the load factor to decide the outcome.
It can be seen therefore that there can be significant cross-carrier assignments if these translations are not populated correctly. The current recommendation is that the Allow Sharing 3G1X Carrier is enabled on all carriers, regardless of technology. Furthermore, the 2G Load Preference Deltas should be set to zero, and the 3G Load Preference Deltas should be set to a high value, for example, 40. These recommendations are consistent with the expectation that the overwhelming percentage of mobiles currently in the market are 2G mobiles. These recommendations must be revisited as the 3G penetration increases.
The assignment algorithms may be configured for all the cells in the system via the ecp form and overridden on a sector-by-sector basis on the ceqface/ceqface3g form. A detailed explanation of this topic is in [5]. This reference should be required reading before making any decisions and optimization based on these algorithms.
Optimization Steps for Channel Assignment on Paging Channel Stage
The primary optimization step in this stage is to take appropriate steps to minimize cross-carrier TCCFs. This can be done in one of two ways:
- Configure the various parameters discussed in the previous section to minimize cross-carrier assignments to begin with. Without cross-carrier assignments, there will be no chance for cross-carrier TCCFs.
- If cross-carrier assignments do occur, then minimize the failures that result from these assignments.
The topic of cross-carrier TCCFs is discussed in detail in Section 3.1.1.4.2.
CDMA RF PERFORMANCE ANALYSIS & TROUBLESHOOTING GUIDE
LUCENT TECHNOLOGIES PROPRIETARY 22
3.1.1.1.4 Traffic Channel Acquisition by Mobile and Cell
General Description
It is at this stage that the bulk of the TCCFs will occur. After the mobile receives the channel assignment message, it is instructed to tune to that traffic channel5 and acquire the null traffic data that is sent by the cell. Upon successful acquisition6, the mobile sends a Traffic Channel Preamble, which must be acknowledged by the cell to complete this stage.
Any failure in this cycle will result in a TCCF (which is represented as either a TCCF Type 2 or Type 1 in the ROP – see Figure 1). Typically, 80% of the TCCFs are of Type 2. Given below are some possible failure scenarios:
1) The base station transmits the null traffic on the traffic channel with a predefined power level, Nominal Traffic Channel Gain (nom_gain), which is entered in translations. If the power is not sufficient to overcome the RF interference levels at that moment, then the mobile will fail to acquire the traffic channel with sufficient quality and a TCCF will result. The nom_gain translation can be set ecp-wide on the ecp form and overridden on a sector-by-sector basis on the ceqface form.
2) The pilot that the mobile initially started the call setup process on is no longer the dominant pilot in the area. However, the IS95A standard mandates that this pilot be maintained for the duration of the setup. Therefore, the strong interference created by the unused pilot could cause TCCFs. Note that a pilot could lose dominance for any of the following reasons:
• It was never the ideal pilot to begin with (neighbor list problems). • The mobile is in a soft-handoff area with two or more pilots ‘ping-ponging’ in their
dominance. • Distant interferers are overshooting into the area inconsistently.
3) High traffic loads and/or pilot pollution in the area causes the interference levels to be too high. This results in the inability of the traffic and/or paging channels to overcome this interference level, causing a communication breakdown on either or both links, resulting in a TCCF.
4) High pathloss causes the pilot, and correspondingly the traffic, paging and access channels, to be too weak to support the call. This could be inside buildings or in areas not well covered through the RF design for that market.
5 In CDMA systems, a traffic channel is a combination of a carrier frequency and Walsh Code.
6 Mobile acquires traffic channel when it detects N5m (typically 2) good null traffic frames within T50m seconds (typically 200ms/1000ms, that is, 10/50 frames).
CDMA RF PERFORMANCE ANALYSIS & TROUBLESHOOTING GUIDE
LUCENT TECHNOLOGIES PROPRIETARY 23
Optimization Steps for Traffic Channel Acquisition Stage
• The setting for the nom_gain parameter is key for TCCF performance. If it is set too low, the mobile will have trouble acquiring the traffic channel and abort the access attempt. If it is set too high, it will have a negative impact on the capacity of the sector and the system in general because of the unnecessary rise in interference caused. The Lucent recommendations should be entered for this parameter and only optimized as needed on a sector-by-sector basis. The SPAT tool provides tools to audit all the cell translations (Appendix B).
• Reduce excessive soft-handoff zones in the system. This is generally not an easy task because the balance has to be drawn between having sufficient soft-handoff zones for seamless handoffs and not having too much, as this will affect TCCF performance and system capacity.
The only options for reducing the soft-handoff zones will be through antenna configuration modifications (model, tilt, azimuth etc.) and/or through attenuation (BCR/CBR) changes. Note that changing t_add and t_drop is not an option for idle mode and call setup performance because these parameters are not used at this stage.
• There must be a general discipline to reduce overshooting sectors throughout the network. They have a profound effect, not just on TCCFs, but also on drop call and FER performance.
For mature systems, the UNL7 feature is a good place to start to get a list of overshooting sectors. The HO Matrix tool will also provide insights to the sector coverage. Alternatively, the footprint of the sectors may be mapped out based on drive test data, though this is usually a more costly and time-consuming exercise.
The techniques to fix or manage these overshooting sectors are the same as those used for reducing soft-handoff zones, namely, through physical antenna and attenuation changes.
• Highly loaded sectors should be brought under control, especially if significant TCCF performance degradations are observed during the busy hours when the erlang utilizations are high. The techniques to manage overloaded sectors are discussed in Section 3.1.4.1.
• Pilot polluted areas should be identified and eliminated (as much as possible), especially if it is observed that there are performance degradations in these areas. The only way to identify pilot polluted areas is through drive tests, either with a scanner or with a mobile phone. The techniques used to reduce these pilot polluted areas will be the same as those used to reduce soft-handoff zones, namely, through physical antenna and attenuation changes.
7 Several steps must be followed to enable UNL: 1) The FAF feature 547 must be activated. 2) The Undeclared Neighbor List (unl) translation must be set to y on all sectors of interest on the ceqface form, or switch-wide on the ecp form. 3) The Search Window Size: Remaining Set (srchwinr) translation in the ceqface form must be changed from its recommended value of zero to 7 or greater (preferably at least 9 to ensure all distant interferers are captured).
CDMA RF PERFORMANCE ANALYSIS & TROUBLESHOOTING GUIDE
LUCENT TECHNOLOGIES PROPRIETARY 24
3.1.1.1.5 Final Handshake to Confirm Service Option and Service Connection
General Description
TCCFs may result because of a failure during final service negotiation. If the mobile is directed to a service option that it does not support, a TCCF Type 7 (Service Negotiation Failure) will be logged in the ROP (Figure 1).
TCCFs may also result anytime during this entire stage before the Service Connect Complete Message (SCCM) is received by the cell because of RF link problems (TCCF Type 3 on the ROP). However, the number of TCCFs at this stage should be significantly less than that for the Traffic Channel Acquisition Stage above. This is because the fact that the traffic channel was successfully acquired would already have minimized the likelihood of, or even eliminated, many of the key TCCF reasons, and that call is allowed to enter into SHO before SCM/SCCM exchange.
Optimization Steps for Final Handshake Stage
The main optimization step is to confirm that there are no problems with service option negotiations by verifying that excessive number of Type 7 TCCFs are not occurring on the ROP using filtering tools such as SPAT (Appendix B). If there is a large number of this type of TCCF, then this normally implies an error in how the service options were configured at the switch. Contact Lucent or the Service Provider’s Operations team to resolve this issue.
As far as TCCFs of Type 3 are concerned, all of the suggestions listed for the Traffic Channel Acquisition Stage will also help reduce TCCFs at this stage. There are no special optimization steps for this type of TCCF.
3.1.1.2 Silent Reoriginations
Silent reoriginations was a concept introduced in the mobiles to help reduce the high customer-perceived access failure rates that was typical with IS95A networks. The mobiles will autonomously reoriginate calls that failed in their access attempt without user intervention. This is akin to an automatic redial on failures.
It is important to note that no intervention is required from the network end to activate this feature. This is an inherent feature in the mobile phones. There are however service measurements to track occurrences of these silent reoriginations. This is done through inference. An origination attempt is deemed to be a “silent reorigination” if exactly the same number is dialed by the same calling party within a pre-defined period of time that is set in translations.
The feature to track these silent reoriginations needs to be turned on in translations by setting the CDMA Silent Reorigination Feature Enabled (sro_enabled) in the ecp form to y. The
CDMA RF PERFORMANCE ANALYSIS & TROUBLESHOOTING GUIDE
LUCENT TECHNOLOGIES PROPRIETARY 25
associated timer may also be set in the ecp form by setting the CDMA Silent Reorigination Time Difference Value (sro_time_diff). This setting is usually set to 10 seconds.
These silent reorigination counts must subsequently be discounted from the origination seizures, since otherwise, there will be multiple seizures pegged for the same origination attempt, driving the access failure rate artificially higher.
It is also possible for the assignments and TCCFs to be inflated through similar double counting, though there is currently no way to track these occurrences.
3.1.1.3 Recent IS95B Enhancements
The most significant recent advancement that will have a tremendous impact on TCCF performance is the IS95B standard. The standards body has recognized the limitations of the IS95A standard and has incorporated several changes that will improve the performance at almost every stage of the call setup process discussed above.
In particular, the IS95B has tackled the two most significant problems with the IS95A procedures, namely:
1) The entire call setup is performed on the initial pilot that was identified as being the best at the beginning of the process. This pilot may lose dominance during the course of the call setup process.
2) The entire call setup is performed in the simplex mode on a single PN, with soft-handoff only activated at the beginning of the actual call. Mobiles in high-interference, soft-handoff areas may not be able to sustain the quality on a single pilot, even if this pilot maintains its dominance in the area.
To alleviate these problems, the IS95B has introduced several new features. These features are discussed in the following sections. Note that an obvious, but sometimes overlooked point, is that only IS95B or IS2000 capable mobiles will be able to take advantage of these enhancements.
For the purposes of the feature descriptions below, the primary sector refers to the sector that “owns” the call setup for an originating or terminating mobile. This primary sector will be in charge of all communication of control information with the mobile, and will also be responsible for setting up the various resources within the network to handle the call. The primary sector is usually, but not necessarily, the sector that the mobile idled and initiated the call on.
The secondary sectors are the sectors that are brought in by the primary sector to aid in the call setup process, in accordance with the various IS95B features. The list of secondary sectors is primarily driven by measurements made at the mobile, as will be described in the sections below.
CDMA RF PERFORMANCE ANALYSIS & TROUBLESHOOTING GUIDE
LUCENT TECHNOLOGIES PROPRIETARY 26
3.1.1.3.1 Access Entry Handoff (AEHO) Feature
This feature only affects termination (page) response performance. It allows for mobiles to send a Page Response Message on a different (stronger) sector that the one that page was originally received on. This new, stronger pilot will assume the role as the primary sector for the call setup.
The Access Entry Handoff Enable (aeho_enable) translation field in the ecp database form needs to be enabled to activate this feature. Each neighbor of each sector can be individually set to be AEHO-allowed through the fci form. Inter-MSC neighbors are not permitted to be AEHO-allowed.
3.1.1.3.2 Access Handoff (AHO) Feature
With this feature, mobiles are allowed to listen to another (stronger) sector, other than the primary sector, for the Extended Channel Assignment Message from the cell site (Figure 1 illustrates at which point of the call flow this message is generated). This provides another opportunity for the mobile to use a stronger pilot during the call setup process.
The mobiles will report the Access Handoff List on the Page Response Message or the Origination Message listing all the strong pilots it measured. This list of pilots forms the secondary pilots. The cell site will subsequently transmit the Channel Assignment Message over the primary sector as well as on all the secondary sectors.
Note that the list of pilots that constitute the Access Handoff List must be a subset of the list of AHO enabled neighbor sectors of the original primary sector (in the fci form). The CDMA Access Handoff (aho_enable) translation field in the ecp/ceqface database form needs to be enabled to activate this feature. Inter-MSC and IS95A8 neighbors are not permitted to be AHO-allowed.
3.1.1.3.3 Channel Assignment into Soft Handoff (CAMSHO) Feature
This feature allows the mobile to enter directly into soft-handoff when the channel assignment is made. This is achieved using the Extended Channel Assignment Message. The mobile may be assigned up to 6 traffic channels in soft/softer handoff, and will attempt to acquire the traffic channel using all these pilots (see Figure 1 to view stage at which traffic channel acquisition occurs).
Only neighbor sectors of the original primary sector that are CAMSHO-enabled will be allowed to participate in this feature (in the fci form). Of these sectors, the actual list of sectors chosen for soft-handoff will only be the strong pilots that are reported by the mobile in the Page Response Message or the Origination Message.
8 An IS95A neighbor is any sector that is configured purely as a 2G cell with p_rev less than 5.
CDMA RF PERFORMANCE ANALYSIS & TROUBLESHOOTING GUIDE
LUCENT TECHNOLOGIES PROPRIETARY 27
This feature will likely have the strongest positive impact on TCCF performance because the TCCF Type 2 messages (Acquire Mobile Failure - see Figure 1) are typically the most dominant type of failure that results in TCCFs. The Channel Assignment into Soft Handoff (camsho_enable) translation field in the ecp/ceqface database form needs to be enabled to activate this feature. Inter-MSC and IS95A neighbors are not permitted to be AHO-allowed.
3.1.1.4 TCCF Causes and Associated Fixes
Given below are some common causes and conditions that will result in TCCFs along with their associated fixes / suggestions for improvements. Note that some of these failures may be avoided if the optimization steps in Section 3.1.1.1 are followed.
3.1.1.4.1 High Traffic Areas
Concept / Reason for Failure
Areas of high traffic volume can experience an increase in TCCF rates. This is because several high-traffic sectors in an area raises the interference levels significantly, making it difficult for the paging and access channels to overcome this interference. It will also increase the chances that the traffic channel is not acquired successfully for the same reasons.
Failure Symptoms and Identification Techniques
High traffic levels may be identified by examining the traffic erlangs carried by the sectors exhibiting high TCCF rates. Note that, if this is indeed the root cause for the TCCFs, then there must be several sectors covering the same area with very high traffic levels. A single sector with high traffic will not justify that sector experiencing high TCCFs because its own sector traffic is mutually orthogonal and should not affect the performance much.
Another important indication is that there should be a clear correlation between the TCCF performance and traffic levels. It should be observed that the TCCF performance gets sharply worse as the traffic picks up beyond a certain point. If the TCCF performance is consistently poor during all hours of the day, then it is unlikely that high traffic levels are the root cause.
Suggested Fixes for Improvement
If the TCCF performance is deemed to be poor because of high traffic levels, then the only real solutions available are to either add a carrier to the sectors in the area to relieve traffic, or to add cell splits to offload the traffic to new cells.
Performing optimization to offload sectors is usually a difficult exercise if there are more than a couple of sectors in an area experiencing high traffic, since there will be limited sectors to offload this traffic to. Adjusting translation parameters to increase the traffic carried by sectors will only make matters worse because it will add to the excessive interference that was the root cause of the problem to begin with.
CDMA RF PERFORMANCE ANALYSIS & TROUBLESHOOTING GUIDE
LUCENT TECHNOLOGIES PROPRIETARY 28
One possible alternative solution, though sometimes difficult to achieve, is to reduce the amount of overall soft-handoff percentage in the affected area. Reducing soft-handoff has many positive aspects in relation to TCCF performance. In addition to reducing the interference levels, it will also reduce the areas with pilot dominance problems.
There are however several dangers with reducing soft-handoff zones, especially if this is not properly executed. Given the nature of CDMA systems where the coverage shrinks with traffic loading, it is quite possible that areas of weak to no coverage can be created during peak hours if the soft-handoff reductions are too aggressive.
Also, it is always wise to manage soft-handoff zones by performing physical antenna optimization, if possible, as opposed to changes in translations such as BCR/CBR attenuation. Changing attenuation values to manage coverage has several drawbacks.
• Typically, it is recommended that the BBA Max. Power (max_power) translation (set in the ceqcom2/crceqp/cdmeqp/bbueqp forms based on cell type) is reduced proportionately when attenuation is increased at a sector. While in theory, the average power allocated to each user should also go down (thus maintaining the same traffic capacity at the sector), this may not hold true in soft-handoff areas where the average power allocated to the users may remain constant. If this were to happen, then the sectors will actually go into forward power overload even sooner. While this may or may not affect TCCF performance directly, it will have several other negative impacts on the performance of call establishments and dropped calls.
• The alternate solution is to leave the max_power unchanged despite increasing attenuation, which will also potentially have negative impacts. Fully loaded sectors will deteriorate the ability of the overhead channels to overcome the increased interference, since these overhead channels are actually transmitting at a lower power due to the attenuation introduced. This will potentially result in more areas of weak coverage, which in turn will affect TCCF performance.
Antenna adjustments do not suffer any of the drawbacks discussed above. The coverage problems are solved fundamentally, without introducing any of the capacity and/or interference issues due to max_power and BCR/CBR mismatches as discussed above. Of course, there isn’t always the option to perform such physical antenna optimization, especially in the cases when these antennas are shared among multiple technologies (overlay systems). In these circumstances, there may be no choice but to perform parameter adjustments to control coverage.
CDMA RF PERFORMANCE ANALYSIS & TROUBLESHOOTING GUIDE
LUCENT TECHNOLOGIES PROPRIETARY 29
3.1.1.4.2 Cross-Carrier TCCFs
Concept / Reason for Failure
Generally, cross-carrier assignments should be avoided unless deemed absolutely necessary. When a mobile re-tunes to another frequency as a result of a cross-carrier assignment, there is an increased chance that the mobile will fail the call setup attempt, due to differing levels of interference on the two carriers and/or mismatches in coverage.
Coverage mismatch between carriers can result from a faulty antenna or cable, incorrect power output on a specific carrier due to drift or miscalibration, inconsistent antenna configuration such as azimuth, downtilt, or antenna model, or inconsistent BCR/CBR attenuation settings for the different carriers within a given sector. Note that such coverage mismatches should be accompanied by an observed difference in traffic carried by the different carriers of the sector in question.
In order to understand how to minimize cross-carrier assignments, it is first important to understand how mobiles select the frequency to initiate call setup, and subsequently how the network selects the frequency to ultimately assign the call request to (which may not necessarily be the same frequency as the one on which the entire call setup process was executed on). This topic is discussed in detail in Section 3.1.1.1.3.
Failure Symptoms and Identification Techniques
Detecting the existence of cross-carrier TCCFs is not straightforward. Given below are some possible methods of detection.
• Use ROP messages to determine the assigned versus idle frequency. The assigned frequency may be inferred from the TCCF ROP message if the mapping between the CCC/CDMs and the associated carrier frequency is known. The idle (hashed) frequency may be determined by applying the mobile hashing algorithm on the IMSI reported in the TCCF message.
There is an important source of inaccuracy with this approach. The ROP message gives no indication of the frequencies sent in the Channel List Message, nor does it give any indication of the order of the frequencies in the list. Therefore, this algorithm may only be applied if the engineer has explicit knowledge of how the channel lists are constructed in the market being analyzed. Note that the channel list may be modified for border sectors as well as for sectors with 3G cards, as previously discussed.
• Detect occurrences of cross-carrier assignments. Though this does not necessarily imply that cross-carrier TCCFs are occurring, it is still not advisable to create conditions that will result in cross-carrier assignments (other than on border sectors). Effort should therefore be taken to identify such sectors and reduce or eliminate cross-carrier assignments, if possible.
Cross-carrier assignments may be detected by examining the number of seizures versus assignments on each carrier of a sector. It is usually a good sign on cross-carrier assignments if the total number of seizures and assignments summed across all carriers are
CDMA RF PERFORMANCE ANALYSIS & TROUBLESHOOTING GUIDE
LUCENT TECHNOLOGIES PROPRIETARY 30
approximately equal, but there are great disparities in their proportions on a carrier-by-carrier basis.
A simple example will illustrate this point. Say a particular sector has two carriers. Carrier 1 has 100 origination seizures and 10 assignments. Carrier 2 has 0 origination seizures and 90 assignments. There are a total of 100 origination seizures and 100 origination assignments on this sector, but clearly a large percentage of Carrier 1’s originations are being cross-assigned to Carrier 2.
Note that the example described above is common with border sectors. Border carriers will never have any seizures given the Omit Border Carrier from Channel List Message feature (which is automatically activated on all handdown border sectors without requiring any translation entries). However, if rf loading is used (see Section 3.1.1.1.3), then there will likely be several assignments on that border carrier, even without having any seizures.
Suggested Fixes for Improvement
There are two strategies to solve cross-carrier TCCF problems.
• Avoid cross-carrier assignments altogether. As discussed above, cross-carrier assignments can occur for any one or more of the following reasons:
• The choice of carrier assignment algorithm coupled with the traffic distribution across carriers results in cross-carrier assignments.
• The choice of how carriers are configured (2G, 3G, 2G/3G1X mixed) coupled with the carrier assignment algorithm used along with new translations that bias mobiles to stick with carriers of their own technology.
Important: If all carriers are configured as 2G/3G1X mixed carriers, then all of the new translations (Allow Sharing 3G1X Carrier, 2G/3G Load Preference Delta) have no effect on assignments because they cancel each other out.
Cross-carrier assignments due to choice of assignment algorithm may be avoided by selecting the oc assignment algorithm (see Section 3.1.1.1.3). There are however some important drawbacks to using this algorithm. They are:
• If the sector needs the capacity relief on the common carriers, then setting oc will not work, since calls are not allowed to leave those common carriers.
• With data users, the links can be heavily loaded (RF power utilization-wise) with relatively few data users, increasing the case for rf load balancing.
If any of the above drawbacks are of concern for the sector in question, then it is important to keep the rf load balancing but take steps to minimize traffic imbalances between carriers of that sector.
While this may be difficult to do for border sectors by virtue of their function, non-border sectors should always be carrying approximately equal traffic on all carriers. If they are not, then the reason for this imbalance must be investigated and corrected.
CDMA RF PERFORMANCE ANALYSIS & TROUBLESHOOTING GUIDE
LUCENT TECHNOLOGIES PROPRIETARY 31
Note that cross-carrier assignments on border carriers usually will not pose a problem with cross-carrier TCCFs because the border carriers typically have larger coverage footprints than their common carrier counterparts due to the reduced interference on the border carriers. This may not necessarily be true however, especially if there are problems with the border carrier antenna, or if the BCR/CBR attenuation settings are set differently on the border carrier.
Important: If border sectors are set up to use the rf carrier assignment algorithm, then it is imperative that these border sectors use the IFHOTI triggering mechanism to ensure that the assigned calls to the border carriers remain on these carriers long enough to provide the necessary capacity relief. Also, the CMPIFHO feature must be activated to ensure reliable handdowns. See Section 3.2.1 for more information on these inter-frequency handoff features.
The other reason when cross-carrier assignments may occur is due to resource blocking on one or more, but not all the carriers of a particular cell. In this case, an escalation process is followed whereby the call is assigned to the least loaded non-blocking carrier of that same sector.
This type of problem may be resolved by understanding the reason for this blocking and taking the appropriate actions to alleviate the problem.
• Ensure successful call establishment even in the face of cross-carrier assignments. Listed below are several possible reasons that could result in cross-carrier TCCFs, techniques to identify whether these reasons are the root cause of the problem, and suggested fixes.
Differences in Coverage Footprints
There are differences in coverage footprints between the various carriers of the sector due to inconsistent physical antenna configurations on-site. This results in the different carriers carrying different loads, thus, potentially causing differences in observed overloads.
These antenna configurations come in the form of antenna models, installed elevation, azimuth and downtilt. Note that, depending on the implementation, it is possible that multiple carriers may share the same antenna. If this is the case, then this cause may be ruled out as being the root of the problem.
The solution to this problem is to perform an on-site audit of the differences in antenna configuration between antennas of the same sector, and correct the problem. Note that it is also possible that the antennas may not be equally affected by physical obstructions. If this the case, it may be necessary to relocate all the antennas, if adjusting their elevations and/or azimuths will not clear these barriers.
CDMA RF PERFORMANCE ANALYSIS & TROUBLESHOOTING GUIDE
LUCENT TECHNOLOGIES PROPRIETARY 32
Faulty Antenna or Cable Assembly
A faulty antenna or cable assembly on one of the carriers of the problematic sector may cause that carrier to have a much smaller footprint, resulting in it carrying a much lighter load. Therefore, this will result in unequal load balancing and consequently, unequal observed power overloads.
The solution to this problem is to perform a sweep test on the antenna assembly of the affected sector. This will allow for isolating the problem between the cable assembly and the antenna itself. Sweep tests are also capable of isolating the problem down to the precise components that are failing (connectors, jumpers etc.).
Output Power Drifts or Miscalibration
The output power being transmitted out of the problematic carrier of the sector may be miscalibrated or drifting. This could be due to a problem with the amplifier, lack of sufficient preventive maintenance calibrations or because the power was never calibrated correctly to begin with.
This problem could be detected in a number of ways. If the CDMA Radio Test Units (CRTU/CTRMs) are operational at the cell, then a Pilot Level (PL) functional test (FT) may be performed to check the output power. This test will indicate problems with the output power, assuming the CRTU/CTRM is properly calibrated.
Alternatively, the output power may be verified on-site using a power meter. Note that the technician must have explicit knowledge of the calibration option selected for that carrier because the output power varies according to the option selected (see [3] for a list of available calibration options).
Power drifts are not as easy to capture. One method is to run periodic CRTU/CTRM PL FT’s and examine the measured output power in the ROP. A drifting power amplifier will manifest itself in a large variance in measured pilot power over time. Alternatively, the actual output power may be measured over a long period of time on-site. This option is however highly undesirable because the sector will be out of service on that carrier during this entire test.
Miscalibrated powers may be easily rectified by performing the calibrations according to the Methods and Procedures guidelines for the appropriate calibration option. Reference [3] goes into great detail on these options.
Power drift problems are usually resolved through hardware replacements.
Cell Resource Differences between Carriers
There will be a difference in carried traffic between carriers if all the carriers of a site are not equally distributed with traffic-equipped Channel Elements (CEs). Section 3.1.3.1 provides a detailed definition of traffic-equipped CEs, along with hardware resource allocation management techniques.
CDMA RF PERFORMANCE ANALYSIS & TROUBLESHOOTING GUIDE
LUCENT TECHNOLOGIES PROPRIETARY 33
Note that, in order for this cause to be determined as the root cause for the observed differences in carried traffic, it must be true that the carrier with the lower number of traffic-equipped CEs is pegging handoff overflows. If this is not the case, then this implies that the lower number of traffic-equipped CEs is sufficient to handle the call volume for that carrier, and therefore, will not be the cause for differences in carried traffic between the carriers.
Hardware Outages
Outages on any call processing related hardware on a particular carrier of a cell could cause a temporary reduction in traffic carried by that carrier. Examples of such hardware components include CCCs/CDMs, channel cards (ECU/CCU-20), Packet Pipes (PPs), T1 spans, etc.
Problems related to this cause will result in a sudden performance degradation the moment the hardware goes out of service. In general, this problem will manifest itself in service measurements in a very similar manner to when the cell is authentically out of traffic-equipped CEs without any hardware troubles. The only way to distinguish between the two based on service measurements would be to examine the peak channel elements used (CS4). The peak channel elements used during the hours of blocking will be significantly lower than the number of traffic-equipped CEs at the cell in cases when the blocking is due to hardware outages.
The obvious solution to this problem is to fix the failing hardware components, or make arrangements for alternatives, to relieve its performance impact.
Inconsistent Attenuation Settings across Carriers
Attenuation settings (BCR/CBR) can be set independently for each carrier of a sector. Therefore, a mismatch in carried traffic could be observed between the carriers of a sector if they are configured with different attenuation settings, either intentionally or inadvertently. This would result in greater power overloads observed on the carriers with less attenuation, since they will carry more traffic.
Note that sometimes specific carriers are configured with greater attenuation on border sectors, but are later not changed to be consistent with the rest of the carriers as the system grows and that sector becomes full-traffic.
The solution to this problem is to conduct regular translation audits to verify that all carriers of all sectors in the system are configured with the same attenuation values, unless there are good, documented reasons why they should be otherwise.
Unbalanced Traffic on Border Cells
With border sectors, it is conceivable that the overloads are only limited to the common carriers since the border carriers are actively attempting to direct the calls to these carriers. If this is the case, then the following suggestions may be followed to fix the problem:
CDMA RF PERFORMANCE ANALYSIS & TROUBLESHOOTING GUIDE
LUCENT TECHNOLOGIES PROPRIETARY 34
If the IFHOTI algorithm is not used on the border sector, then implement this feature so as to carry more traffic on the border carrier. Section 3.2.2.1.2 discusses this algorithm in more detail. Reference [5] is also required reading before any attempt is made to implement and optimize this feature.
If IFHOTI is already employed, then optimize the trigger parameters to get more traffic to stay on the border carrier, while maintaining the inter-frequency handdown performance at acceptable levels.
If neither of the above suggestions are effective or appropriate, then consider adding carriers to the adjacent cells and make this border carrier carry full traffic. This is of course a medium-term to long-term solution because of the costs and justifications required to make this happen.
3.1.1.4.3 Poorly Defined Neighbor Lists
Concept / Reason / Effect of Failure
A poorly defined neighbor list may result in the mobile idling on a sub-optimal pilot for the duration of the call setup, increasing the chances of a call setup failure. This topic is discussed in detail in the conceptual overview presented in Section 3.1.1.1.
Poor neighbor lists may also result in sub-optimal performance of the CAMSHO feature because the set of pilots selected for soft-handoff must be a subset of the neighbor list.
Failure Symptoms and Identification Techniques
Several switch features exist that will easily trap neighbor list problems. Specifically, both the Handoff Matrix (HOMAX) and the Undeclared Neighbor List (UNL9) features have been very effective in identifying missing neighbor list entries and erroneous priority assignments.
When using the UNL feature, it is often more effective to first use service measurements to narrow down and focus on the sectors exhibiting the most severe UNL problems (as a proportion of their total traffic). Tools such as SPAT (Appendix B) may be used to easily arrive at this list of affected sectors.
Problems with the neighbor lists may also be captured through integrity and consistency testing of the neighbor list using tools such as FCIAlert. This tool captures a variety of problems such as non-reciprocal neighbors and PN ambiguities within the neighbor list.
9 Several steps must be followed to enable UNL: 1) The FAF feature 547 must be activated. 2) The Undeclared Neighbor List (unl) translation must be set to y on all sectors of interest on the ceqface form, or switch-wide on the ecp form. 3) The Search Window Size: Remaining Set (srchwinr) translation in the ceqface form must be changed from its recommended value of zero to 7 or greater (preferably at least 9 to ensure all distant interferers are captured).
CDMA RF PERFORMANCE ANALYSIS & TROUBLESHOOTING GUIDE
LUCENT TECHNOLOGIES PROPRIETARY 35
The SPAT tool explained in Appendix B may be used to quickly identify sectors exhibiting this problem.
Alternatively, neighbor list problems may also be identified through drive tests. This method however is generally more expensive and less reliable, since it will be difficult to drive all areas of typical usage to capture all neighbor list problems. However, there is little choice but to use drive tests for greenfield (new) deployments, since switch-based neighbor list management tools lack the traffic to make them statistically reliable.
Suggested Fixes for Improvement
The suggested fix is to modify the neighbor list in accordance with the problem detected.
• If the problem is with missing neighbor list entries, then these neighbors should be added, with care to make sure the reciprocal neighbors are also added.
Note that there must be discipline exercised when adding neighbors, since sectors with excessively large neighbor lists could perform poorly due to the increased processing requirements. Additionally, given the fact that neighbor lists of sectors in soft-handoff are concatenated, large neighbor lists increases the chances that some neighbors will be dropped in this concatenated list.
The solution in this case will be to perform physical and/or parameter optimization to eliminate the need for the neighbor list entry [15]. This would entail removing that sector from the area through antenna downtilts, azimuth changes, antenna model changes and/or BCR/CBR attenuation changes [15].
• If the problem is with the integrity of the neighbor list, then the appropriate fix should be applied. The FCIAlert tool will perform all of the following integrity checks and more, but the most important ones are listed below.
Reciprocity
Reciprocity refers to making sure that if sector A is added to sector B’s neighbor list, then sector B is also in sector A’s neighbor list. With CDMA networks, there is rarely any justification for not satisfying reciprocity rules when populating neighbor lists because all sectors are transmitting on the same frequency.
PN Ambiguity Issues
PN ambiguities may come in many forms. No two neighbors on the same neighbor list can have the same PN assignment because this will confuse the network should this PN be reported as a Candidate pilot. A less obvious problem will be when two neighbors share the same PN as a result of neighbor list concatenation. This is commonly referred to as two-way PN ambiguity problems (for any combination of two neighbor lists) up to n-way neighbor list problems (n up to 6). Typically, only two-way PN ambiguity checks are performed.
CDMA RF PERFORMANCE ANALYSIS & TROUBLESHOOTING GUIDE
LUCENT TECHNOLOGIES PROPRIETARY 36
Cross-Face Neighbors
At a minimum, each sector must have all other sectors in the same cell as neighbors.
3.1.1.4.4 Excessive Soft-Handoff Zones
Concept / Reason for Failure
As discussed in Section 3.1.1.1, TCCFs are prone to occur in areas of excessive soft-handoff with the IS95A call setup algorithm because the entire call setup is attempted over a single pilot. If this pilot loses its dominance or becomes too weak even while it is the dominant pilot, then there is a high likelihood for a TCCF. The pilot could lose dominance for the following reasons:
• Two or more pilots in soft-handoff are ‘ping-ponging’ in their dominance. • Distant interferes are overshooting into the area inconsistently.
One reason a pilot can become too weak even while remaining dominant is if there are an excessive number of reasonably strong pilots in the area causing the interference levels to be too high for the dominant pilot to overcome.
Failure Symptoms and Identification Techniques
• Isolate sectors exhibiting high soft-handoff percentage through service measurements. This is done by examining the primary and secondary CE usage on these sectors. The ratio of secondary CE usage to total (primary + secondary) usage gives the soft-handoff percentage. Percentages much larger than 50% should be flagged for examination and possible optimization. Note that there may be several sectors exhibiting such problems, especially in dense urban environments. It is always prudent to examine the RF performance of these high soft-handoff sectors, and only focus optimization activity on those exhibiting the most serious performance problems.
• Use Handoff Matrix and UNL10 to isolate overshooting sectors. Both these features can be used very effectively to capture sectors covering beyond their intended coverage areas as well as distant interferers from several tiers of cells away. Overshooting sectors have noticeable impact on the RF performance of the network, and serious effort must be undertaken to control these sectors.
10 Several steps must be followed to enable UNL: 1) The FAF feature 547 must be activated. 2) The Undeclared Neighbor List (unl) translation must be set to y on all sectors of interest on the ceqface form, or switch-wide on the ecp form. 3) The Search Window Size: Remaining Set (srchwinr) translation in the ceqface form must be changed from its recommended value of zero to 7 or greater (preferably at least 9 to ensure all distant interferers are captured).
CDMA RF PERFORMANCE ANALYSIS & TROUBLESHOOTING GUIDE
LUCENT TECHNOLOGIES PROPRIETARY 37
Suggested Fixes for Improvement
The following two approaches should be followed if it is suspected that excessive soft-handoff zones are causing a rise in TCCFs.
• Turn on IS95B features on that sector and configure the neighbor lists appropriately. This should already be done system-wide as a default, as suggested in Section 3.1.1.3.
It is very important to note that even if these features are activated, only IS95B and IS2000 mobiles will be able to take advantage of these enhancements. Therefore, in markets where the penetration of such mobiles are low when compared to IS95A mobiles, turning on these features will have negligible impact on TCCF performance. The features should be activated regardless since the penetration of these IS95B and IS2000 mobiles will inevitably increase.
• Reduce the soft-handoff zones to improve the pilot quality of the primary sector handling the call setup. This can be done through physical optimization (changes in antenna orientation, downtilt, model etc.) and/or BCR/CBR attenuation changes. Note that manipulating t_add, t_drop and other handoff parameters will not help TCCF performance because all of these parameters are only applied to calls in the traffic state, not during call setups.
3.1.1.4.5 Lack of RF Coverage
Concept / Reason for Failure
TCCFs could be generated in areas of weak coverage whereby even the dominant pilot is unable to overcome the noise floor. Areas of weak coverage could be a result of being inside buildings, areas shadowed by obstacles such as hills, trees etc. or due to poor RF design of the cell sites.
Failure Symptoms and Identification Techniques
It is difficult to determine poor RF coverage through service measurements or any other switch-based tools. Typically, the drop call performance will also be poor, but this is inconclusive because there are several other root causes that will result in degradations in both drop call as well as TCCF performance.
The best way to confirm suspected weak coverage areas is through conducting drive tests. Areas of very weak receive power, is an indication of weak coverage. Note that sufficient margin must be added to account for in-building penetration losses in urban areas.
CDMA RF PERFORMANCE ANALYSIS & TROUBLESHOOTING GUIDE
LUCENT TECHNOLOGIES PROPRIETARY 38
Suggested Fixes for Improvement
There are several choices for improving such coverage problems. They are:
• Perform physical optimization and/or parameter optimization to improve coverage [15]. Physical optimization entails modifications of the antenna azimuths, downtilts and/or antenna models. Parameter optimization is primarily through the manipulation of BCR/CBR attenuation values and/or dgu settings. There may not always be an option to implement this solution since the antennas may already have been configured for optimal coverage and the attenuation values are at their minimum.
• Add cell site to improve coverage. This would require even more justification that the previous suggestion because of the vastly higher costs associated with this solution. However, if there is a capacity constraint in the area, then it might typically be easier to justify these cell splits.
3.1.1.4.6 Search Window Problems
Concept / Reasons for Failure
In IS95A/B systems, mobiles have five rake receivers, commonly referred to as ‘fingers’. Four of these fingers are used to demodulate up to four best multipaths from the sectors in the Active Set. The fifth rake receiver is known as the Searcher Finger and its primary job is to scan all possible pilots and compare their strengths to the pilots in the Active Set. This information is then reported back to the cell through the Pilot Strength Measurement Message (PSMM), which will then evaluate these results and reconfigure the pilots to be used in the Active Set, if deemed necessary to improve the performance.
Due to the large number of possible pilots (512 / PILOT_INC), each with a spacing of (64 x PILOT_INC) chips11, it will take the Searcher Finger too long to scan through this entire space. Therefore, the searcher is restricted to searching only over a ‘window’ of chips around each pilot, known as the Search Window. This Search Window may be set differently for pilots in the various sets (Active/Candidate, Neighbor and Remaining Sets).
It is intuitively obvious from the above discussions that if a pilot arrives outside of the Search Window, then this pilot will not be captured and reported by the Searcher, and will therefore never be a candidate to be used in the Active Set. In CDMA systems, due to the fact that all pilots are transmitting over the same frequency, this missed pilot will immediately become a strong interferer. The performance in these locations will degrade significantly and TCCFs and dropped calls may result because of this strong interference.
11 The definition and use of PILOT_INC is discussed under Co-PN Interference later in this section.
CDMA RF PERFORMANCE ANALYSIS & TROUBLESHOOTING GUIDE
LUCENT TECHNOLOGIES PROPRIETARY 39
Failure Symptoms and Identification Techniques
Search window problems may be best captured using drive test data, either by using a pilot scanner or by using the data logged off a mobile. With the pilot scanner, the delays of all the arriving pilots may be directly viewed and analyzed. With the mobile-logged data, the delays of all strong pilots may be extracted from Layer 3 messaging. Note that the mobile-logged data will only give insights to pilots that are approaching the edge of their search windows. If the pilot is completely outside of the search window, then the scanner will be the only way to capture this problem.
Suggested Fixes for Improvement
These window problems may either be resolved by increasing the window sizes or by removing the delayed pilot from the area through optimization. Note that areas of hilly terrain will generally require larger search windows while smaller search windows may be used in dense urban environments.
Reference [5] delves into the details of search windows and should be read before attempting to optimize these windows.
3.1.1.4.7 External Interference
Concept / Reason for Failure
External interference in either the forward or reverse links will cause degradations in TCCF and drop call performance on the carrier that it is on. This is because this interference raises the noise floor of the system, requiring the forward or reverse link traffic signals to increase their transmit powers to overcome it. If the interference is significant enough, then the base station or mobile will run out of power and, as a consequence, the performance will degrade.
Failure Symptoms and Identification Techniques
It is usually difficult to establish that external interference is the root cause of observed performance degradations but sometimes service measurements will provide some clues to aid in its discovery.
For example, strong reverse link interference could exhibit high RSSI rise and could even peg significant counts of reverse power overload even though the carried traffic on the reverse link does not justify such high reverse loading.
Another indicator of reverse link external interference could be an abnormally high Reverse Frame Error Rate (RFER), even though the Forward Frame Error Rate (FFER) is within normal ranges. Any true RF or optimization problems in the area should affect RFER and FFER equally.
CDMA RF PERFORMANCE ANALYSIS & TROUBLESHOOTING GUIDE
LUCENT TECHNOLOGIES PROPRIETARY 40
Suggested Fixes for Improvement
External interference may be verified by using a spectrum analyzer to scan the affected CDMA carrier. Typical interference will appear as spikes caused by inter-modulation products as well as spurious signals. The source of the interference may be identified by driving around the area and looking for the areas of concentration in the observed interference.
3.1.1.4.8 Co-PN Interference
Concept / Reason for Failure
In CDMA systems, pilots are differentiated by their PN offsets, which are really just time-shifted versions of the same signal. There are 512 possible PN offsets, each being shifted in time by 64 chips (which correspond to approximately 10 miles). The important point to understand about PN offsets is that, since they are just time shifted versions of each other, it is possible for a pilot to appear like it has a different PN offset if it is able to travel far enough and still have sufficient signal strength to be received by the mobiles. If two pilots in an area appear to have the same PN offset with similar signal strengths, then the mobiles will not be able to resolve the two signals.
The process of PN planning is to avoid the potential problems listed above by intelligent assignment of PN offsets to each sector in the system. To further reduce the chances for PN assignment problems, only PN offsets in steps of PILOT_INC are assigned to these sectors, PILOT_INC being a ecp-wide translation parameter. The larger the value of PILOT_INC, the lower the chances that a PN offset will be associated with the wrong sector, since the pilot will have to travel (PILOT_INC * 10 miles) and still be received with sufficient strength to be mistaken for another PN offset.
Co-PN interference could result due to poor PN planning, improper choice of PILOT_INC or inadvertent entry of incorrect PN offsets to sectors in translations. Interference may occur either because the same PN offset was assigned to two sectors that “see” each other in the RF sense, or if a sector assigned to a different PN offset traveled far enough with sufficiently low attenuation to appear mistakenly as the same PN as another sector in the area. An example of a common oversight is the inappropriate assignments of PN Offsets along water bodies. RF signals are able to travel great distances with relatively low pathloss over water, and therefore, great care must be taken when allocating PN Offsets to all cells that share common water bodies.
Failure Symptoms and Identification Techniques
Identifying the root cause of a problem to be because of Co-PN interference is not straightforward.
One method of identifying Co-PN interference problems is through the examination of the delay spread of the suspected pilot using a pilot scanner. Co-PN interference can be suspected
CDMA RF PERFORMANCE ANALYSIS & TROUBLESHOOTING GUIDE
LUCENT TECHNOLOGIES PROPRIETARY 41
if the delay spread appears too large for the morphology, since this delay spread could actually be a result of two separate sectors transmitting the same PN from very different distances.
Another indicator of Co-PN interference is if the Ec/Io and Receive Power in an area are very good but the FFER performance is extremely poor. These results may be obtained through mobile-logged drive test data. The reason for this is because there is no demodulation performed when measuring Ec/Io, just raw power measurements. This will result in a good Ec/Io and Receive Power being reported. The call however will not be able to be demodulated correctly because of the direct co-PN signal interference, resulting in the poor FFER performance.
Note that neither of these indicators are definite proofs of Co-PN interference. However, they provide good starting points in uncovering this problem.
Suggestions for Improvement
If Co-PN interference is identified, then the solution would either be to reassign the PN offset values of the offending sectors, or to remove the offending sectors from the affected areas through some combination of physical and parameter optimization [15].
3.1.1.4.9 Hardware Goes Into Bad State
Concept / Reason for Failure
Certain hardware elements in the cell sometimes (rarely) go into a bad state whereby they generate a disproportionate number of TCCFs compared to other similar elements in the cell. This can be identified from the ROP using ROP-filtering tools such as SPAT (Appendix B) that will categorize TCCFs by hardware component in each cell.
Failure Symptoms and Identification Techniques
A typical example of this would be when a single CCC exhibits a much larger number of TCCFs than all other CCCs in that carrier. Note that this assumes that all the CCCs within the carrier have equal number of traffic-equipped channel elements (see Section 3.1.3.1 for the definition of these channel elements). Otherwise, the TCCFs on each CCC should be distributed roughly according to the number of equipped CEs in each CCC. The reason for this is because of channel pooling resulting in all CEs being used equally by all sectors within the same carrier.
It is interesting to note that, with this example of CCCs causing TCCFs, the described problem does not affect the drop call performance in any way on that carrier. Therefore, a clear way of identifying this particular CCC problem is if a sudden, severe degradation in TCCF performance is observed, but the drop call performance is maintained as per its typical values on that carrier. Also, none of the surrounding cells will notice any degradations in both TCCFs and dropped calls.
CDMA RF PERFORMANCE ANALYSIS & TROUBLESHOOTING GUIDE
LUCENT TECHNOLOGIES PROPRIETARY 42
Suggested Fixes for Improvement
Typically, the problem may be cleared by restoring the affected hardware elements from the switch. If this fails to clear the problem, then on-site diagnostics and possible hardware replacements might be necessary.
3.1.1.4.10 Intermittent Hardware Problems
Concept / Reason for Failure
Sometimes, certain hardware elements in a cell go in and out of service, potentially causing service-affecting problems such as TCCFs. An example of this would be Packet Pipes (PPs) that go in and out of service, which typically might happen if there are problems with the associated T1 line.
Failure Symptoms and Identification Techniques
These types of intermittent hardware problems are characterized by a sudden degradation in the performance of the KPIs the moment the problem starts happening.
The best way to capture such problems is through using ROP scripts that will be able to log and report all hardware elements that go in and out of service. There are several tools that perform such analysis, one of them being the SPAT tool (Appendix B) which will report all hardware failures that occur throughout the day on a cell-by-cell basis.
Suggested Fixes for Improvement
The fix required will depend on the particular element exhibiting the problem. It is recommended that the customer Operations team is notified of the problem.
3.1.1.4.11 CRTU/CTRM TCCFs
Concept / Reason for Failure
A CDMA Radio Test Unit (CRTU/CTRM) is a unit placed in every base station and its purpose is to run a sequence of call processing tests on the cell for diagnostic purposes.
It is possible for these CRTU/CTRMs to generate TCCFs which will get captured in the TCCF service measurement counters as well as on the ROP. This problem is not service-affecting but is important to capture and fix anyway because of the extra burden placed on the network to capture and log these events.
CDMA RF PERFORMANCE ANALYSIS & TROUBLESHOOTING GUIDE
LUCENT TECHNOLOGIES PROPRIETARY 43
Additionally, these CRTU/CTRMs will not be able to conduct their diagnostic tests if they are generating these TCCFs, since the test calls never get established. It is therefore important to identify and clear this problem.
Failure Symptoms and Identification Techniques
It will usually be easy to distinguish CRTU/CTRM TCCFs on the ROP because CRTU/CTRM phone numbers follow a well-defined pattern as per the local market’s convention. For example, the number might be (973) 004-0001 which may refer to the CRTU/CTRM in cell 1 on ECP 4. Tools exist such as SPAT (Appendix B) that provide per-cell mobile-high-runner reports that make these ROP trends easy to capture.
The CRTU/CTRM TCCFs are captured as a separate peg count in service measurements and must be discounted from the total Originations TCCF count to ensure accuracy in the calculated KPI. Viewing these peg counts separately can immediately alert to this problem, if it is occurring.
Suggested Fixes for Improvement
Typically, the reason for CRTU/CTRM TCCFs is because the CRTU/CTRM mobile is not correctly identified in translations at the switch on the sub form. Therefore, the network does not recognize the mobile during service negotiation and rejects it, causing a TCCF. The fix is to make an entry for this CRTU/CTRM in the sub form and configure it correctly to reflect that the number is associated with a CRTU/CTRM.
3.1.2 Call Setup Failure Analysis
3.1.2.1 Concepts and Optimization Techniques
Call setup failures are a catch-all failure type that captures all access failures that are not explicitly captured by other service measurements. These types of failures may also be categorized into origination and termination setup failures, and are usually either DCS related failures or software processing failures.
Service measurements will capture these catch-all failures as call setup failures. On the ROP, they will be captured as Call Shutdowns in the Unanswered Origination or Termination state.
These call setup failures should be a rare occurrence in a normally operating system. Therefore, the only optimization step that is required is to ensure that a process is in place to track the appropriate call setup failure service measurements on a regular basis.
Should any alarming flares be observed in call setup failures on any particular sector, then the means should also be in place to isolate the type of Call Shutdown appearing on the ROP and react appropriately.
CDMA RF PERFORMANCE ANALYSIS & TROUBLESHOOTING GUIDE
LUCENT TECHNOLOGIES PROPRIETARY 44
The SPAT tool will provide both the means to view the appropriate metrics based on service measurements on a sector-by-sector basis, as well as the ability to summarize the ROP output for each of these sectors. Appendix B provides an overview of this tool.
3.1.2.2 Commonly Encountered Types of Call Setup Failures
Given below are the commonly encountered types of Call Shutdowns that result in call setup failures being pegged in service measurements.
3.1.2.2.1 Call Shutdown Type 43 (CS-[43])
Concept / Reason for Failure
Occasionally, CCCs will go into a bad state and start generating a significant number of CS-[43]’s which will get translated into call setup failures in service measurements.
Failure Symptoms and Identification Techniques
Since the problem is associated with a single CCC, the problem will manifest itself as a significant rise in call setup failures on all sectors of a single carrier.
The reason for this is because of channel pooling, resulting in the CEs in one CCC being shared by all sectors of the cell. This channel pooling does not extend across carriers of a cell, thus limiting the manifestation of the problem to the specific carrier associated with the problematic CCC.
Suggested Fixes for Improvement
Typically, the problem may be cleared by restoring the affected CCC from the switch. If this fails to clear the problem, then on-site diagnostics and possible hardware replacements might be necessary.
3.1.2.2.2 Call Shutdown Type 10 (CS-[10])
Concept / Reason for Failure
Failed handoffs in the Unanswered state will result in CS-[10]’s which will get translated into call setup failures in service measurements.
CDMA RF PERFORMANCE ANALYSIS & TROUBLESHOOTING GUIDE
LUCENT TECHNOLOGIES PROPRIETARY 45
Failure Symptoms and Identification Techniques
In addition to appearing as call setup failures in service measurements, these failures are also recorded in the ROP as Call Shutdown Type 10 messages in the Unanswered Origination or Termination states.
Suggested Fixes for Improvement
Most CS-[10]’s actually occur in the Answered state and manifest themselves as CP Fail Drops. All of the improvement techniques to solve these types of CP Fail Drops will apply equally to improving Call Setup failures of this nature. This topic is very involved in its own right, and is discussed in detail in Section 3.2.2 under CP Fail Drops.
3.1.2.2.3 Speech Handler Failures
Concept / Reason for Failure
During the call setup process, a speech handler is requested and assigned by the MSC. However, if the speech handler assignment is lost or the speech handler protocol results in a failure, then the call setup process is declared to have failed.
Failure Symptoms and Identification Techniques
Speech handler failures are recorded as a DCS-level peg count in service measurements.
Suggested Fixes for Improvements
Checking for the stability of speech handlers and/or software anomalies usually resolved speech handler failure issues.
CDMA RF PERFORMANCE ANALYSIS & TROUBLESHOOTING GUIDE
LUCENT TECHNOLOGIES PROPRIETARY 46
3.1.3 CE/PP Resource Blocking Analysis
3.1.3.1 Concepts and Optimization Techniques
These failures happen when the cell processing the mobile call request does not have the hardware resources to support the call, namely traffic-equipped channel elements (CEs). CEs are deemed to be traffic-equipped if they are provisioned with sufficient packet pipe (PP) bandwidth to support them.
Note that if the PPs go down on a cell for any reason, then this will the render the associated CEs unusable, thus potentially resulting in this blocking condition.
The following sections detail various concepts and features related to CEs and PPs, as well as optimization techniques to proactively prevent or manage this blocking condition.
3.1.3.1.1 Conceptual Overview for 2G Cells
Channel Elements (CEs) and Packet Pipes (PPs) are two hardware resources required at the cell to support calls. Each 2G voice call being supported by the system requires a single CE at the base station while the PPs provide the backhaul to transfer the call information back and forth from the base station to the switch.
CEs come in sets of ten (ECU cards) or twenty (CCU-20 cards), depending on whether the Autoplex or Flexent series of CDMA equipment is being used respectively.
In the case of Autoplex Series II CDMA Minicells, these ECU cards are each housed in a CDMA Cluster Units (CCU). Each set of 4 CCUs is controlled by a CDMA Cluster Controller (CCC). Each of these CCCs are in turn associated with a single sector on one carrier. Therefore, there will be three CCCs per carrier in a three-sectored site.
With Flexent CDMA Modcells, up to six CCU-20 cards may be inserted into a single CDMA Digital Module (CDM). There is one CDM per carrier in a cell site.
A bank of PPs will be associated with each CCC/CDM. The total bandwidth offered by these PPs may be collectively used by all CEs associated with that CCC/CDM but may not be accessed by CEs from any other CCC/CDM. There is a pre-defined relationship between the total number of CEs in a CCC/CDM and the number of PPs needed to provide sufficient backhaul bandwidth for these CEs. This relationship depends on whether two important FAF features are activated for all sites in the ECP, namely, the Packet Pipe Optimization (PPOPT) and Packet Pipe 16 (PP16) features (see [9]).
The relationship between PPs and CEs is provided in [9] for both without the PPOPT feature activated and with this feature activated. For convenience, the relationship with PPOPT activated is extracted from this documentation in Table 3.1 below. Note that it is strongly recommended that this PPOPT feature be enabled on all cells on the cell2 form, as there is no disadvantage to doing so.
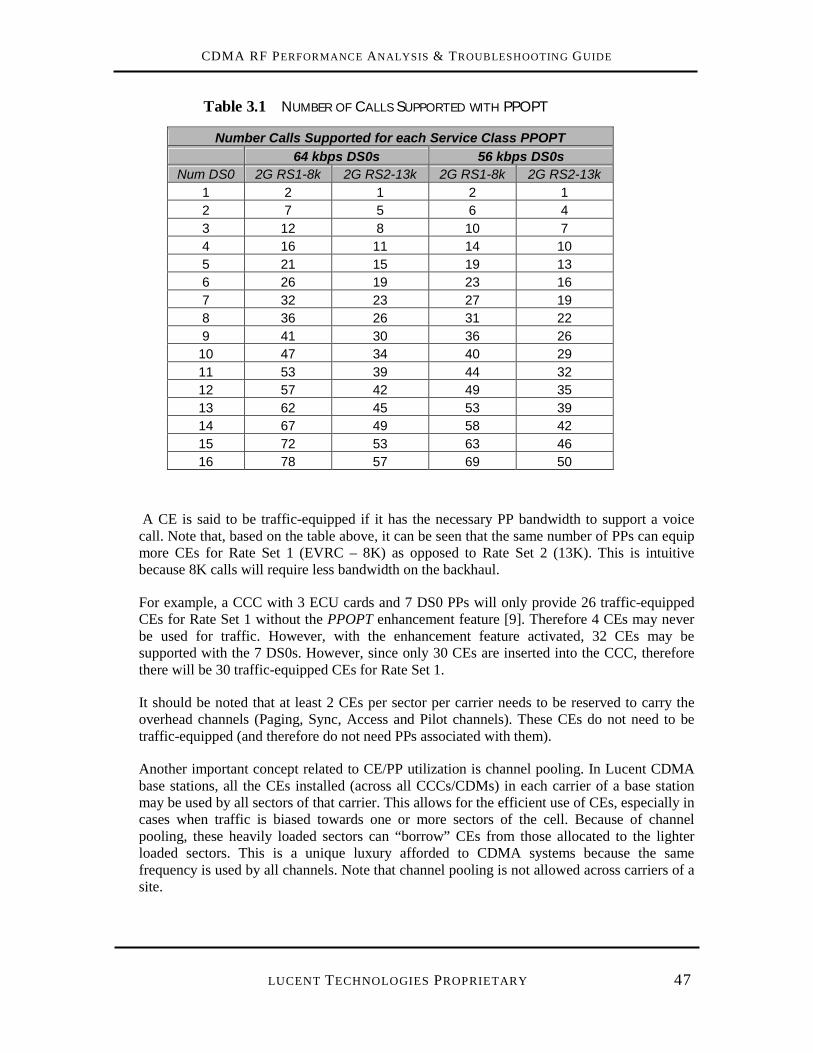
CDMA RF PERFORMANCE ANALYSIS & TROUBLESHOOTING GUIDE
LUCENT TECHNOLOGIES PROPRIETARY 47
Table 3.1 NUMBER OF CALLS SUPPORTED WITH PPOPT
Number Calls Supported for each Service Class PPOPT 64 kbps DS0s 56 kbps DS0s
Num DS0 2G RS1-8k 2G RS2-13k 2G RS1-8k 2G RS2-13k 1 2 1 2 1 2 7 5 6 4 3 12 8 10 7 4 16 11 14 10 5 21 15 19 13 6 26 19 23 16 7 32 23 27 19 8 36 26 31 22 9 41 30 36 26 10 47 34 40 29 11 53 39 44 32 12 57 42 49 35 13 62 45 53 39 14 67 49 58 42 15 72 53 63 46 16 78 57 69 50
A CE is said to be traffic-equipped if it has the necessary PP bandwidth to support a voice call. Note that, based on the table above, it can be seen that the same number of PPs can equip more CEs for Rate Set 1 (EVRC – 8K) as opposed to Rate Set 2 (13K). This is intuitive because 8K calls will require less bandwidth on the backhaul.
For example, a CCC with 3 ECU cards and 7 DS0 PPs will only provide 26 traffic-equipped CEs for Rate Set 1 without the PPOPT enhancement feature [9]. Therefore 4 CEs may never be used for traffic. However, with the enhancement feature activated, 32 CEs may be supported with the 7 DS0s. However, since only 30 CEs are inserted into the CCC, therefore there will be 30 traffic-equipped CEs for Rate Set 1.
It should be noted that at least 2 CEs per sector per carrier needs to be reserved to carry the overhead channels (Paging, Sync, Access and Pilot channels). These CEs do not need to be traffic-equipped (and therefore do not need PPs associated with them).
Another important concept related to CE/PP utilization is channel pooling. In Lucent CDMA base stations, all the CEs installed (across all CCCs/CDMs) in each carrier of a base station may be used by all sectors of that carrier. This allows for the efficient use of CEs, especially in cases when traffic is biased towards one or more sectors of the cell. Because of channel pooling, these heavily loaded sectors can “borrow” CEs from those allocated to the lighter loaded sectors. This is a unique luxury afforded to CDMA systems because the same frequency is used by all channels. Note that channel pooling is not allowed across carriers of a site.
CDMA RF PERFORMANCE ANALYSIS & TROUBLESHOOTING GUIDE
LUCENT TECHNOLOGIES PROPRIETARY 48
In addition, a call in softer handoff with two sectors of the same cell can share one CE. However, a mobile in softer handoff with all three sectors of the cell will require two CEs to support the call.
3.1.3.1.2 3G1X Enhancements & Concepts
With the advent of 3G, new channel cards have been introduced to handle the variety of service classes that can be supported on Lucent systems. These new channel cards for 3G1X comes in two forms:
• ECU-32 cards – for Series II cells.
• CCU-32 cards – for Flexent cells.
These cards no longer carry physical channel elements, but rather are comprised of logical channel elements called Channel Fragments (CFs). Each ECU/CCU-32 supports the following CFs:
- 32 Forward FCH CFs (Supports F-FCH, Paging, Quick Paging and Pilot channels).
- 3212 Forward SCH CFs (Supports F-SCH and Sync channels).
- 32 Reverse FCH/SCH CFs (Supports R-FCH, R-SCH and Access channels).
Each of the FCH CFs can support any one of the following service classes:
- Forward / Reverse 13 kbps voice
- Forward / Reverse EVRC (8 kbps) voice
- Forward / Reverse 2G Circuit Data at 9.6 kbps
- Forward / Reverse 3G Circuit Data at 9.6 kbps
- Forward / Reverse 3G Packet Data at 9.6 kbps
Each Forward SCH (F-SCH) supports forward supplemental channel data at 9.6 kbps (16 CFs needed to support 16X rate of 153.6 kbps). Each Reverse SCH (R-SCH) supports reverse supplemental data at 19.2 kbps (8 CFs required to support 16X rate of 153.6 kbps).
Any single carrier may have a mix of 2G and 3G1X cards installed. The only restriction is that, for Series II cells, a single CCC may not contain a mix of these cards, but different CCCs on the same carrier may carry any combination of 2G and 3G1X cards. A carrier with only 2G cards installed is commonly referred to as a 2G carrier, and likewise for 3G carriers that are only installed with 3G cards. Any carrier with a mix of 2G and 3G1X cards installed is commonly referred to as a 2G/3G1X mixed carrier.
A minimum of 5 overhead CFs are reserved per sector per carrier (15 in total for a 3-sectored cell per carrier) – 4 forward overhead CFs for pilot, sync, paging and quick paging, 1 reverse
12 Typical maximum supported SCH CFs are 32 with Release 18. Larger number of FCH and SCH CFs will be supported with the CCU-64 cards that will be available with Release 19.
CDMA RF PERFORMANCE ANALYSIS & TROUBLESHOOTING GUIDE
LUCENT TECHNOLOGIES PROPRIETARY 49
overhead CF for access. This is in contrast to only 2 overhead channel elements reserved for overheads in 2G systems – 1 for pilot, sync and access, 1 for paging. For 2G/3G1X mixed carriers, all overhead channels are assigned to the 3G1X CFs.
The provisioning of Packet Pipes (PPs) has become a fairly complex task given the number of different service classes supported by Lucent cell sites with 3G1X. The complication arises from the fact that each of these service classes require a different amount of PP backhaul bandwidth for a single call. Thus, it becomes important to know the expected mix of usage among the various service classes in order to correctly provision the cell site backhaul bandwidth.
There are two important variables in PP provisioning that must first be understood before being able to allocate the appropriate bandwidth. They are the Packet Pipe Capacity Unit (PPCU) and the Packet Pipe Loading Coefficient (PPLC).
One PPCU is defined as the PP capacity required to service one 2G Rate Set 1 (8 kbps or EVRC) call. In other words, if 1 DS0 were to have a capacity of 3 PPCU, this is the same as saying that single DS0 will be able to support 3 2G Rate Set 1 calls.
The PPLC defines the number of PPCUs required to support a single call of any other service class.
As an example, a 2G Rate Set 2 (13 kbps) voice call has PPLC = 1.35 for a cell site provisioned with 8 DS0s, and that 8 DS0s have a joint capacity of 42 PPCU (see Table 3.2 below). This means that this cell can either support a total of 42 Rate Set 1 calls or 31 Rate Set 2 calls (42/1.35=31), or some combination in between that adds up to no more that 42 PPCU.
To illustrate the last point, say there are 30 Rate Set 1 calls and 8 Rate Set 2 calls requesting service at that site. The 30 Rate Set 1 calls will require a capacity of 30 PPCU. The 8 Rate Set 2 calls will require a capacity of (1.35 × 8 = 10.8) PPCU. This gives a total of 40.8 PPCU, which will be supported by the 8 DS0s above. The 9th Rate Set 2 call requesting service will require an additional 1.35 PPCU, which will bring the total PPCU requirement to (40.8+1.35=42.15) PPCU. This is greater than the 42 PPCU limit of the cell, and therefore the cell will deny access to this 9th Rate Set 2 call.
There will be efficiencies gained when supporting multiple calls. Therefore, the PPLCs for the various service classes are a function of the total DS0s being provisioned at the cell. Given below is a table providing an example of the capacity for the various service classes given that the PP16, PPOPT and Backhaul Engineering Enhancement features are activated.

CDMA RF PERFORMANCE ANALYSIS & TROUBLESHOOTING GUIDE
LUCENT TECHNOLOGIES PROPRIETARY 50
Table 3.2 NUMBER OF CALLS PER SERVICE CLASS FOR VARIOUS PACKET
PIPE BANDWIDTHS
3.1.3.1.3 CE/PP Blocking Definition
An incoming call or soft handoff request is blocked at the cell if it does not have any traffic-equipped CEs available across all carriers to support the request. That is, if a call is blocked on the carrier it is on, then the blocking base station will first attempt to provide resources to this call on any of the other carriers on that cell, with preference to the least loaded carrier. The call is only completely blocked if every carrier in that cell does not have any resources to spare.
Blocking on only some, but not all, of the carriers will be discussed under CP Fail Drops in Section 3.2.2.2.
3.1.3.1.4 CE/PP Resource Blocking Management Techniques
With the above discussions in mind, there are some fundamental practices that should be followed to ensure that a well-structured CE and PP management process is in place.
• Ensure that the PPOPT, Backhaul Engineering Enhancement and PP16 features are enabled in all cells. This will ensure that the packet pipes are used optimally to maximize the number of traffic-equipped CEs on-site.
• Ensure that all carriers in a cell are equally distributed with traffic-equipped CEs. The carrier hashing algorithm built into phones will statistically distribute the calls evenly among all the carriers of a sector. However, if the CEs are not balanced between the carriers, then this will result in the call assignments being cross-assigned to other carriers, introducing the possibility for cross-carrier TCCFs (Section 3.1.1.4.2) and CP Fail Drops
Num DS0 Max PPCU 2G RS1-8k V 2G RS2-13k V 2G RS1-8k D 2G RS2-13k D 3G RS1-8k V 3G FCH Data 3G SCH Data1 3 3 2 3 1 3 2 52 8 8 5 6 4 7 5 103 14 14 10 11 7 12 9 154 19 19 14 13 9 17 13 195 25 25 18 17 12 23 17 256 31 31 22 22 16 28 21 317 37 37 27 26 19 34 26 378 42 42 31 30 21 38 29 429 48 48 35 34 24 44 33 4810 54 54 40 38 27 50 38 5411 60 60 44 43 31 55 42 6012 66 66 48 47 34 61 46 6613 72 72 53 51 37 66 50 7214 78 78 57 56 40 72 54 7815 84 84 62 60 43 77 59 8416 90 90 66 64 46 83 63 90
Number Calls Supported for each Service Class per Number 64 kbps DS0s with PPOPT & 3G1X Backhaul Enhancement
CDMA RF PERFORMANCE ANALYSIS & TROUBLESHOOTING GUIDE
LUCENT TECHNOLOGIES PROPRIETARY 51
(Section 3.2.2.2). While this suggestion doesn’t specifically affect CE/PP resource blocking, it is stated here as a general guideline for good CE/PP management.
The exception to this rule is when one or more of the carriers of a sector are configured as border carriers (handdown or pilot-only carriers). In this case, the border carriers may be configures with less CEs because their primary role is to transfer the calls to the common carriers. However, care should be taken to revisit such sites and add the appropriate CEs should they be made full traffic cells in the future.
It is good practice to maintain clear documentation of the total number of installed CEs, the number of PPs, and, as a result, the number of traffic-equipped CEs for each service class in every carrier of every site. This will make for timely problem analysis and will also aid in the decisions to add CEs and/or PPs on a cell with hardware resource problems.
• Regularly monitor the peak number of channel elements used in a cell and take proactive steps to prevent blocking by ensuring that the peak usage does not cross a pre-defined percentage of total number of traffic-equipped CEs at the cell.
Alternatively, some service providers will allow for marginal, controlled resource blocking. If this is the case, then monitor the blocking percentage at each cell and add resources when the appropriate levels are reached.
Note that, when adding CEs to a cell, it is important to evaluate the PP bandwidth allocated and increase this allocation as per the tables in [9]and [10].
3.1.3.2 CE/PP Resource Blocking Causes and Associated Fixes
CE/PP resource blocking may still occur even if all the suggested optimization steps in the previous section are followed. Given below are some common conditions that will result in such CE/PP resource blocking and their associated fixes / suggestions for improvements.
3.1.3.2.1 Cell Resource Capacity Reached
Concept / Reason for Failure
Calls will be blocked from originating or terminating on a cell when there are no traffic-equipped channel elements across all carriers of that cell to service these calls. That is, if a call is blocked on the carrier it is on, then the blocking base station will first attempt to provide resources to this call on any of the other carriers on that cell, with preference to the least loaded carrier. The call is only completely blocked if every carrier in that cell does not have any resources to spare.
CDMA RF PERFORMANCE ANALYSIS & TROUBLESHOOTING GUIDE
LUCENT TECHNOLOGIES PROPRIETARY 52
Failure Symptoms and Identification Techniques
• Service measurement peg counts indicate presence of CE/PP blocking. The root cause may be further narrowed by examining service measurements that are able to isolate just the PP blocking. The presence (or lack thereof) of these PP blocking counts will determine whether the CE/PP blocking observed because of lack of PPs or CEs.
• Peak CE usage indicates that resource blocking is due to authentic resource capacity constraints. The reason for checking this is because there could also be resource blocking because of span outages and/or outages of channel element cards, CCCs, etc. Problems due to these hardware outages are discussed in detail in Section 3.1.3.2.2 below.
With 3G networks, determining whether cell sites have reached their full capacity of traffic-equipped channel elements is not straightforward because the amount of packet pipes consumed is dependent on the particular mix of service classes supported by that cell (see Section 3.1.3.1.2 on 3G1X Enhancements & Concepts).
One method to do this is to examine the service class that will yield the minimum number of total channel fragments used for the number of packet pipes provisioned at the cell. If the actual peak channel elements that were used during the hours of resource blocking were even lower that this minimum value, then it is quite likely that the problem is not with authentic lack of resource capacity provisioned at the cell, but rather some other hardware problem.
For example, looking at Table 3.2, if the cell site is provisioned with 16 DS0s, and the service classes being serviced are primarily 2G and 3G voice, then that cell site should at least be able to support 66 channel fragments (corresponding to 2G Rate Set 2 - 13 kbps voice calls). Therefore, the peak channel elements in use should at least be 66 in order to even consider that the cell site has reached its provisioned resource limits.
Alternatively, the ROP may be examined to check whether there were any hardware failures during the hours of resource blocking. An important caveat to this approach is that hardware outages are only logged in the ROP the moment they occur. Therefore, it is possible that hardware elements may be out of service but still not register on the ROP during the hours of resource blocking because these outages actually occurred earlier.
Suggested Fixes for Improvement
Once it is determined that the problem is truly due to an authentic shortage of equipped resources, channel elements and/or packet pipes may be added to resolve the problem. Care should be taken to add these resources equally on all carriers, and to document the additions for proper cell resource management.
An alternate solution would be to offload traffic from the blocking sector as per the suggestions in Section 3.1.3.1.4 on CE/PP Resource Blocking Management Techniques.
Note that some service providers may desire to maintain some marginal level of cell resource blocking so that cell sites are not over-engineered to cater to peak traffic utilizations. The market guidelines should be followed in requesting these cell resource additions.
CDMA RF PERFORMANCE ANALYSIS & TROUBLESHOOTING GUIDE
LUCENT TECHNOLOGIES PROPRIETARY 53
3.1.3.2.2 Hardware Outages
Concept / Reason for Failure
Any CCCs/CDMs, CCUs or PPs that are down in a cell will reduce the number of traffic-equipped CEs available to support calls, resulting in premature call blocking.
Failure Symptoms and Identification Techniques
It is therefore very important to always compare the peak number of channel elements used during the hours of blocking against the expected number of traffic-equipped CEs on the site. This will ensure that CEs and/or PPs are not inadvertently being added to the site because of an incorrect analysis of the problem. See the previous Section 3.1.3.2.1 for details on how to do this.
Hardware outages may be viewed on the ECP Control & Display page (commonly referred to as the ‘cartoon’ page) and may also be captured in the ROP as HEH messages. Due to the magnitude of ROP file sizes, they are best analyzed using filtering scripts. Many such scripts exist, an example being the SPAT tool which has a component to perform such analysis (Appendix B provides an overview of this tool).
Suggested Fixes for Improvement
As this is a cell hardware issue, it is recommended that the customer Operations team is notified of the problem.
3.1.3.2.3 Intermittent Hardware Problems
Concept / Reason for Failure
Occasionally, hardware components enter into an intermittent state whereby they go in and out of service. These types of problems are usually difficult to capture because they may not exist when the technicians look at the ECP Control & Display page. CCCs/CDMs, CCUs and PPs are all possible candidates for this type of problem.
Failure Symptoms and Identification Techniques
Again, the key indicator that this is not an authentic problem of insufficient cell resources is the peak number of channel elements used during the hours of blocking, which would not be equal to the expected number of traffic-equipped CEs on the cell in question.
CDMA RF PERFORMANCE ANALYSIS & TROUBLESHOOTING GUIDE
LUCENT TECHNOLOGIES PROPRIETARY 54
This root cause is best identified by looking in the ROP for intermittent problems with these key hardware components. The use of scripts to capture all failures on a cell or sector basis is key in identifying problems such as these since it will be very difficult to extract trends from merely viewing the raw ROP output. The SPAT tool (Appendix B) will perform such an analysis and quickly point out hardware problems with all service-affecting cell hardware components.
Suggested Fixes for Improvement
As this is a cell hardware issue, it is recommended that the customer Operations team is notified of the problem.
3.1.4 Forward Power Resource Blocking Analysis
3.1.4.1 Concepts and Optimization Techniques
3.1.4.1.1 Conceptual Overview
These failures happen when the sector processing the mobile call request does not have sufficient forward power resources to support the call, a condition known as forward power overload.
With the older algorithms, this occurs when the power being utilized by that cell exceeds the Lower Threshold which is a percentage of Max Power, both of these being parameters that may be set in translations. This is known as the Gain Clipping (GC) algorithm.
Recently, improved algorithms were introduced to better trigger and manage this overload condition. This algorithm is known as the Aggregate Overload Control (AOC) [4].
The following sections discuss the various details related to both of these overload algorithms.
Forward Link Overload Thresholds
As mentioned above, there are two distinct algorithms used to implement the forward link overload mechanism, namely, the Gain Clipping (GC) algorithm for pre-Release 16.0 cells and the Aggregate Overload Control (AOC) for Release 16.0 and greater. Note that with Release 16.0 and greater, the choice is given to implement either algorithm on a per-cell basis. The GC algorithm was decommissioned starting with Release 17.03, and will no longer be an option for overload control after this release.
With the GC method, two thresholds are set on both the forward and reverse links to manage the power utilization, namely the Lower Power Threshold (lower_pwr_thresh) and the Upper Power Threshold (upper_pwr_thresh), both set in the ecp/ceqface database forms. All new calls are blocked when the power utilization crosses the lower threshold. All handoffs are also
CDMA RF PERFORMANCE ANALYSIS & TROUBLESHOOTING GUIDE
LUCENT TECHNOLOGIES PROPRIETARY 55
restricted, in addition to new calls, when the power utilization crosses the upper threshold. Typical values for these thresholds on the forward link are 85% and 90% of the BBA Max. Power (max_power) translation, which is set in the ceqcom2/crceqp/cdmeqp/bbueqp forms based on cell type.
With Release 16.0, the AOC method for downlink overload control was introduced. With AOC, two new thresholds were introduced to replace the lower and upper thresholds described above. The new thresholds are the Scaling Power Threshold (aoc_pwr_thresh) and the Call Blocking Power Threshold (block_pwr_thres), both set in the ecp/ceqface database forms.
When the short-term power utilization exceeds the scaling power threshold, the entire output power is reduced. That is to say, every user in the system now is offered a slightly lower power, in addition to lowered powers on the overhead channels (pilot, page, sync and access). This allows for a graceful, temporary degradation in performance across all users until the short-term power surge dissipates.
When the long-term power utilization exceeds the new call blocking power threshold, all new (non-emergency) calls are blocked, but handoffs are still permitted. This blocking will occur until the long-term power utilization falls back below the threshold by a certain amount (as defined by other hysteresis settings).
Note that handoffs are never blocked with the AOC algorithm, in contrast to the GC algorithm. The only exception to this is when the amplifier enters the AOC cool-down state, which is an additional safeguard built in to the AOC algorithm to prevent over-driving the amplifier. Handoffs will be rejected when the amplifier is in this state.
A more detailed presentation on this topic is presented in [4].
Capacity Enhancement Feature
Another important concept to understand is the application of scaling factors to scale up the downlink overload thresholds, which in turn will allow more power to be utilized on the downlink. These scaling factors may be applied to both the GC and AOC thresholds. This is known as the Capacity Enhancement Feature.
The motivation for having these scaling factors is a result of the observation that the ratio of peak energy to average energy utilized in the downlink was high. This means that bursts of high peak energy frequently triggered the overload thresholds even though the average energy transmitted by the amplifier was comfortably below its specifications.
Therefore, scaling factors were applied to increase the threshold levels at which overload will occur beyond the specifications of the transmitter with the goal of achieving an average power transmission that is more in line with these specifications. The net effect of doing this is to increase the traffic load that can be carried on the downlink before triggering the overload thresholds.
The translation used to perform this scaling is the Traffic Channel Voice Activity Factor (tcvact_fact) in the ceqface form, which was previously an unused translation in the database.
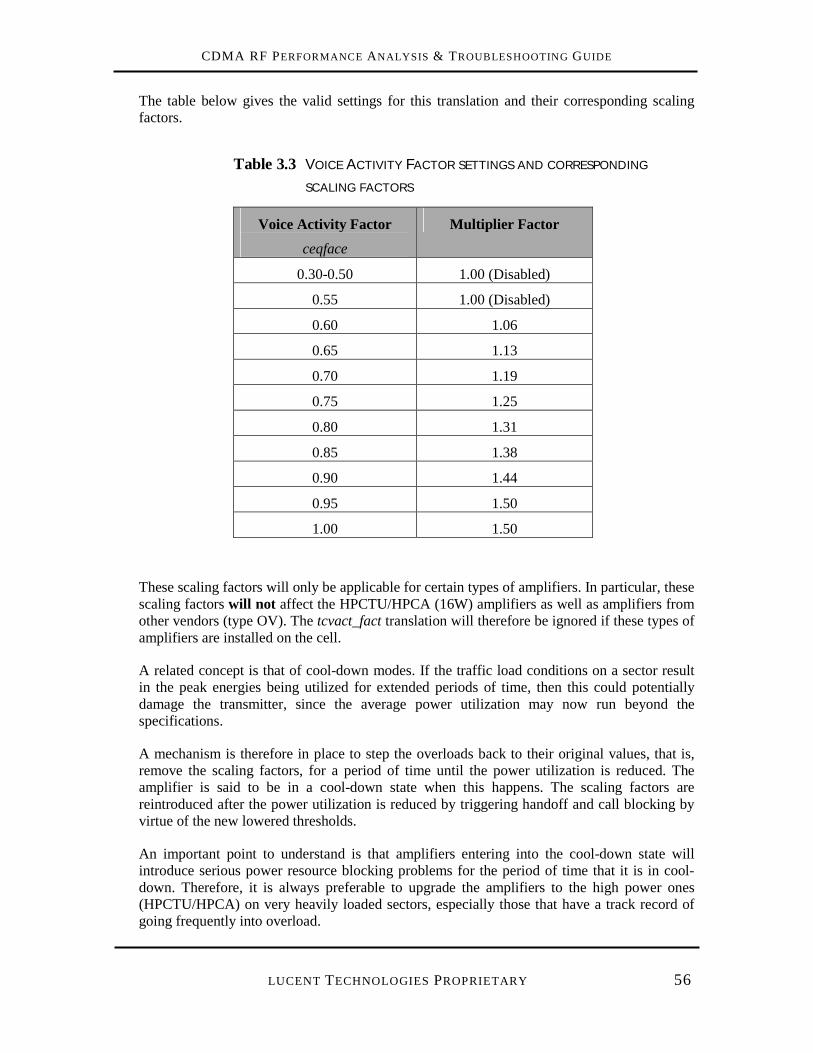
CDMA RF PERFORMANCE ANALYSIS & TROUBLESHOOTING GUIDE
LUCENT TECHNOLOGIES PROPRIETARY 56
The table below gives the valid settings for this translation and their corresponding scaling factors.
Table 3.3 VOICE ACTIVITY FACTOR SETTINGS AND CORRESPONDING SCALING FACTORS
Voice Activity Factor ceqface
Multiplier Factor
0.30-0.50 1.00 (Disabled)
0.55 1.00 (Disabled)
0.60 1.06
0.65 1.13
0.70 1.19
0.75 1.25
0.80 1.31
0.85 1.38
0.90 1.44
0.95 1.50
1.00 1.50
These scaling factors will only be applicable for certain types of amplifiers. In particular, these scaling factors will not affect the HPCTU/HPCA (16W) amplifiers as well as amplifiers from other vendors (type OV). The tcvact_fact translation will therefore be ignored if these types of amplifiers are installed on the cell.
A related concept is that of cool-down modes. If the traffic load conditions on a sector result in the peak energies being utilized for extended periods of time, then this could potentially damage the transmitter, since the average power utilization may now run beyond the specifications.
A mechanism is therefore in place to step the overloads back to their original values, that is, remove the scaling factors, for a period of time until the power utilization is reduced. The amplifier is said to be in a cool-down state when this happens. The scaling factors are reintroduced after the power utilization is reduced by triggering handoff and call blocking by virtue of the new lowered thresholds.
An important point to understand is that amplifiers entering into the cool-down state will introduce serious power resource blocking problems for the period of time that it is in cool-down. Therefore, it is always preferable to upgrade the amplifiers to the high power ones (HPCTU/HPCA) on very heavily loaded sectors, especially those that have a track record of going frequently into overload.
CDMA RF PERFORMANCE ANALYSIS & TROUBLESHOOTING GUIDE
LUCENT TECHNOLOGIES PROPRIETARY 57
Special Limitation on ModCells – Potential for Early Overload
The current versions of Flexent Modcells have an additional limitation whereby the long term average of the sum of the squared digital gain units13 (dgu’s) should not exceed 77760, times a multiplicative factor based on the voice activity factor translation (capacity enhancement feature, discussed above).
If this limit is exceeded, then the forward power overload counters and algorithm will be triggered, even if the actual lower threshold in power consumption is not reached. This scenario is possible under certain combinations of amplifier type and power calibration option selected.
The solution to this problem is to ‘fool’ the base station by reducing the dgu values used while maintaining the actual transmitted power. This can be achieved by reducing the Pilot, Page, Sync, Nominal Traffic, Minimum Traffic and Maximum Traffic dgu translations by 1dB, while also reducing the CBR attenuation by 1 dB. All of these settings may be set globally in the ecp form, and overrriden on a sector-by-sector basis in the ceqface form. This ensures that the output power remains the same, but changes the relationship between dgu’s and actual output power to reduce the dgu values used.
Multi-Carrier Considerations
It should be noted that if a sector has multiple carriers configured on it, then each of these carriers will have its own power amplifier (PA). This implies that each carrier of each sector can independently go into power overload on either link.
Therefore, when troubleshooting forward power overload problems, it is important to examine the carried traffic and overload on each carrier of the problematic sector.
Because of the efficiency of the carrier assignment algorithms (when configured correctly – see Section 3.1.1.1.3), calls should be very evenly distributed across carriers on a particular sector under normal operating conditions.
If a significant mismatch in carried traffic is observed resulting in the bulk of overload problems occurring only on a single carrier, then this would imply that some other problem exists on the carrier carrying less traffic, as opposed to a fundamental problem with overloaded capacity on that sector.
The exception to the statement above is if one or more of the carriers are configured as border sectors (handdown or pilot-only). Border sectors will, by definition, carry less traffic because they are constantly attempting to transfer the calls to the common carriers.
13 Digital gain units (dgu’s) are a measure of per-channel output power from the base stations. Dgu’s have a square relationship to the output power (Watts). The actual conversion from dgu’s to output power in Watts is established during power calibration. The overhead and traffic channels are set to pre-defined dgu values and the combined output power from these channels are subsequently tuned to the desired total power as per the selected calibration option.
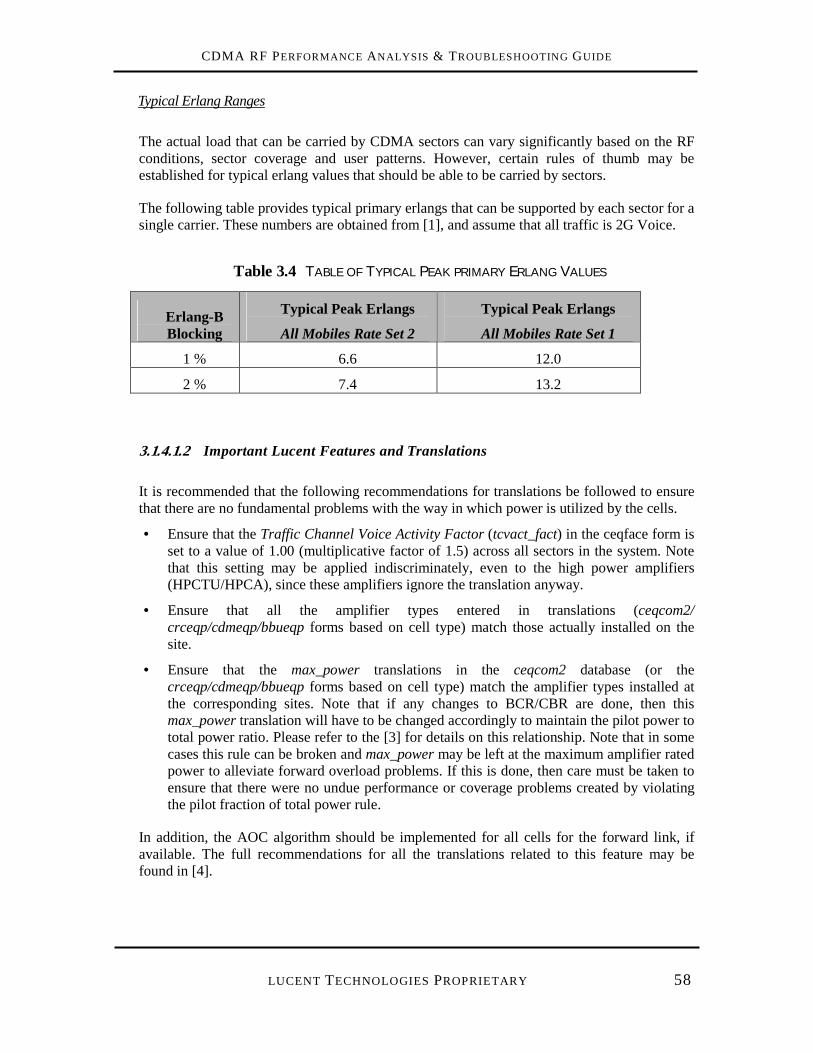
CDMA RF PERFORMANCE ANALYSIS & TROUBLESHOOTING GUIDE
LUCENT TECHNOLOGIES PROPRIETARY 58
Typical Erlang Ranges
The actual load that can be carried by CDMA sectors can vary significantly based on the RF conditions, sector coverage and user patterns. However, certain rules of thumb may be established for typical erlang values that should be able to be carried by sectors.
The following table provides typical primary erlangs that can be supported by each sector for a single carrier. These numbers are obtained from [1], and assume that all traffic is 2G Voice.
Table 3.4 TABLE OF TYPICAL PEAK PRIMARY ERLANG VALUES
Erlang-B Blocking
Typical Peak Erlangs
All Mobiles Rate Set 2
Typical Peak Erlangs
All Mobiles Rate Set 1
1 % 6.6 12.0
2 % 7.4 13.2
3.1.4.1.2 Important Lucent Features and Translations
It is recommended that the following recommendations for translations be followed to ensure that there are no fundamental problems with the way in which power is utilized by the cells.
• Ensure that the Traffic Channel Voice Activity Factor (tcvact_fact) in the ceqface form is set to a value of 1.00 (multiplicative factor of 1.5) across all sectors in the system. Note that this setting may be applied indiscriminately, even to the high power amplifiers (HPCTU/HPCA), since these amplifiers ignore the translation anyway.
• Ensure that all the amplifier types entered in translations (ceqcom2/ crceqp/cdmeqp/bbueqp forms based on cell type) match those actually installed on the site.
• Ensure that the max_power translations in the ceqcom2 database (or the crceqp/cdmeqp/bbueqp forms based on cell type) match the amplifier types installed at the corresponding sites. Note that if any changes to BCR/CBR are done, then this max_power translation will have to be changed accordingly to maintain the pilot power to total power ratio. Please refer to the [3] for details on this relationship. Note that in some cases this rule can be broken and max_power may be left at the maximum amplifier rated power to alleviate forward overload problems. If this is done, then care must be taken to ensure that there were no undue performance or coverage problems created by violating the pilot fraction of total power rule.
In addition, the AOC algorithm should be implemented for all cells for the forward link, if available. The full recommendations for all the translations related to this feature may be found in [4].
CDMA RF PERFORMANCE ANALYSIS & TROUBLESHOOTING GUIDE
LUCENT TECHNOLOGIES PROPRIETARY 59
3.1.4.1.3 Forward Power Resource Blocking Management Techniques
The suggestions below describe how to manage forward power resource blocking, either proactively before they occur or reactively once they already exist on one or more sectors. The assumption in this section is that the cell is operating normally with traffic balanced across all carriers (assuming it’s not a border sector), and the Voice Activity Factor settings are set appropriately for the amplifier types to maximize the power utilization on the amplifiers. The next section deals with situations when this is not the case.
It is important to note that the performance of sectors typically start to degrade even before power overload conditions occur. It is therefore important to have a process in place to extrapolate sector traffic loads on a regular basis and proactively apply the measures listed below before power overloads even surface.
Short-Term Solutions to Fixing Forward Power Overload Problems
Given below are some suggestions to fixing power overload problems for the short-term until other medium and long-term solutions can be put in place, if deemed necessary.
1) Offload the heavily loaded sectors using any combination of physical antenna changes (reorientations, downtilts, antenna model changes etc.) and/or parameter changes (attenuation, handoff parameters etc.). If attenuations are being changed, then the BBA Max. Power (max_power) translation (set in the ceqcom2/crceqp/cdmeqp/bbueqp forms based on cell type) must be changed accordingly to preserve the quality of the calls (see [3] for details on this mapping).
2) While not recommended unless as a last resort, the overload thresholds may be increased to delay when the cells go into overload. It is very important to refer to [4] when attempting to do this because there may be other translations that also have to be changed in conjunction with these overload thresholds.
The reason why this solution is not recommended is that it does not help fix the problem fundamentally, but rather just delays its impact. Therefore, it will be highly likely, in a growing system, that the overloads will surface soon anyway. The other problem with raising the thresholds is that it places a heavier burden on the already overloaded amplifiers, increasing the chances of damaging it permanently.
Medium-Term Solutions to Fixing Forward Power Overload Solutions
The medium-term solution to fixing power overloads is to add additional carriers to the affected sectors, and possibly some surrounding sectors for performance reasons. Typically, there will be justifications required and significant costs involved with this option. This coupled with the construction and equipment delivery time will typically only make this solution available a few months later, thus will not be an effective short-term solution.
CDMA RF PERFORMANCE ANALYSIS & TROUBLESHOOTING GUIDE
LUCENT TECHNOLOGIES PROPRIETARY 60
Of course, if a good practice of regularly projecting traffic erlangs is in place, then markets can anticipate the need for these additional carriers and have them installed in a timely manner, just in time when they are really needed.
Long-Term Solutions to Fixing Forward Power Overload Solutions
In CDMA systems, extremely loaded areas will begin to potentially lose coverage due to the high level of interference resulting in none of the pilots being dominant enough to overcome it. Therefore, if coverage improvement is also a criteria, then the long-term solution would be to add additional cells in the heart of the high capacity areas. This is obviously a long-term solution because the cycle of design, cell selection, construction and optimization has to be performed. Typically, this solution will be in the order of several months.
3.1.4.2 Forward Power Resource Blocking Causes and Associated Fixes
3.1.4.2.1 Sector has reached Capacity Limit
Concept / Reason for Failure
Sectors that have utilized all of their available forward power on all carriers on the forward link will start blocking new calls, and possibly handoffs as well.
Failure Symptoms and Identification Techniques
A sector may be deemed to have truly reached its capacity limitations if all carriers of the sector are carrying high erlangs that are approximately evenly distributed across these carriers. The latter should result in approximately equal power overload durations on all sectors.
A second factor is that this sector should meet acceptable standards for soft/softer handoff percentage. Otherwise, though this sector has reached its capacity limitations from a power budget point of view, some of this power could potentially be shed if the soft handoff percentages are brought back in line. Section 3.1.4.2.2 delves into this topic in detail.
Similarly, sectors in which the high traffic utilization and/or power overloads are biased only towards a subset of the carriers is not an indication of true power capacity problems, but rather is indicative of some other problem with the cell site configuration and/or hardware. This type of problem is discussed in detail in Section 3.1.4.2.4.
CDMA RF PERFORMANCE ANALYSIS & TROUBLESHOOTING GUIDE
LUCENT TECHNOLOGIES PROPRIETARY 61
Suggested Fixes for Improvement
If the affected sectors are deemed to have truly reached their capacity limitations, then the short, medium and long-term suggestions in Section 3.1.4.1.3 should be followed to alleviate the problem.
3.1.4.2.2 Excessive Soft-Handoff Zones
Concept / Reason for Failure
As discussed in Section 3.1.4.2.1 above, sectors could be running out of power budget because of excessive soft handoff activity that would result in unnecessary power being utilized.
A disciplined approach to reducing these percentages to acceptable levels could result in improved performance at many levels. There will be less interference in the network, which will likely improve the performance of all the calls in the area. Also, reducing soft handoff percentages will translate to reduced cell hardware resource utilization, which would translate to significant cost savings for the operator in terms of channel element cards and packet pipes.
Failure Symptoms and Identification Techniques
• Isolate sectors exhibiting high soft-handoff percentage through service measurements. This is done by examining the primary and secondary usage on these sectors. The ratio of secondary usage to total (primary + secondary) usage gives the soft-handoff percentage. Percentages much larger than 50% should be flagged for examination and possible optimization. Note that there may be several sectors exhibiting such problems, especially in dense urban environments. It is always prudent to examine the RF performance of these high soft-handoff sectors, and only focus optimization activity on those exhibiting the most serious performance problems.
• Use Handoff Matrix and UNL14 to isolate overshooting sectors. Both these features can be used very effectively to capture sectors covering beyond their intended coverage areas as well as distant interferers from several tiers of cells away. Overshooting sectors have noticeable impact on the RF performance of the network, and serious effort must be undertaken to control these sectors.
14 Several steps must be followed to enable UNL: 1) The FAF feature 547 must be activated. 2) The Undeclared Neighbor List (unl) translation must be set to y on all sectors of interest on the ceqface form, or switch-wide on the ecp form. 3) The Search Window Size: Remaining Set (srchwinr) translation in the ceqface form must be changed from its recommended value of zero to 7 or greater (preferably at least 9 to ensure all distant interferers are captured).
CDMA RF PERFORMANCE ANALYSIS & TROUBLESHOOTING GUIDE
LUCENT TECHNOLOGIES PROPRIETARY 62
Suggested Fixes for Improvement
The following two approaches should be followed if it is suspected that excessive soft-handoff zones are causing a rise in TCCFs.
• Reduce the soft-handoff zones through optimization to improve the pilot quality of the primary sector handling the call setup. Optimization may come in the form of physical optimization (changes in antenna orientation, downtilt, model etc.) and/or BCR/CBR attenuation changes.
• Turn on and optimize IS95B handoff algorithm parameters on that sector. The IS95B standard introduced several enhancements to the method in which sectors are selected to be in the Active Set of a CDMA call, with the intention of limiting this selection to only sectors that are most likely to have a meaningful contribution to the quality of the call. These algorithms were subsequently adopted by the IS2000 standard as well.
It is very important to note that even if these features are activated, only IS95B and IS2000 mobiles will be able to take advantage of these enhancements. Therefore, in markets where the penetration of such mobiles are low when compared to IS95A mobiles, turning on these features will have negligible impact on the soft-handoff percentage.
3.1.4.2.3 Incorrect Setting of VAF Causes Early Overload
Concept / Reason for Failure
As described in Section 3.1.4.1.1, it is recommended that all amplifiers maximize the overload threshold scaling whenever possible, by setting the tcvact_fact translation to 1.00. Failure to do this will cause sectors to go into overload early on the forward link with only modest traffic loads.
Failure Symptoms and Identifying Techniques
• Perform translations audit. The easiest way to detect this problem is by doing a system audit on this setting on all cells in the system. The SPAT tool (Appendix B) performs such an audit.
• Examine peak power utilized per sector-carrier through service measurements. If the tcvact_fact setting is set incorrectly, then it will be observed that the sector will be going into overload with power levels that are well below the maximum that should have been capable if the maximum multiplicative factor had been correctly applied to the sector (see Table 3.3).
• Examine peak erlang utilization at sector-carrier. Alternatively, this problem may also be captured if it is noticed that sectors are not achieving peak erlang values anywhere close to those specified in Table 3.4. A caveat to this method of detection is that the actual maximum traffic that can be carried by any individual sector is highly dependent on several factors such as the RF environment, interference levels and user patterns. Therefore, it is
CDMA RF PERFORMANCE ANALYSIS & TROUBLESHOOTING GUIDE
LUCENT TECHNOLOGIES PROPRIETARY 63
conceivable that some sectors may authentically only be able to support much lower erlangs despite the fact that the overload scalars are maximized.
Suggested Fixes for Improvement
If not done so already, the tcvact_fact translation setting in the ceqface form should be set to 1.00 (multiplicative factor of 1.5) across all sectors in the system. Note that this setting may be applied indiscriminately, even to the high power amplifiers (HPCTU/HPCA), since these amplifiers ignore the translation anyway.
3.1.4.2.4 Overload Not Detected on All Carriers of Multi-Carrier Sector
With non-border sectors, all situations when overloads are not detected roughly equally on all carriers of a multi-carrier sector indicated a problem with one or more carriers of that site.
Given below are some common reasons why this may occur, identifying techniques and suggested fixes.
Differences in Coverage Footprints
There are differences in coverage footprints between the various carriers of the sector due to inconsistent physical antenna configurations on-site. This results in the different carriers carrying different loads, thus, potentially causing differences in observed overloads.
These antenna configurations come in the form of antenna models, installed elevation, azimuth and downtilt. Note that, depending on the implementation, it is possible that multiple carriers may share the same transmit antenna. If this is the case, then this cause may be ruled out as being the root of the problem.
The solution to this problem is to perform an on-site audit of the differences in antenna configuration between antennas of the same sector, and correct the problem. Note that it is also possible that the antennas may not be equally affected by physical obstructions on-site. If this the case, it may be necessary to relocate all the antennas, if adjusting their elevations and/or azimuths will not clear these barriers.
Faulty Antenna or Cable Assembly
A faulty antenna or cable assembly on one of the carriers of the problematic sector may cause that carrier to have a much smaller footprint, resulting in it carrying a much lighter load. Therefore, this will result in unequal load balancing and consequently, unequal observed power overload durations.
The solution to this problem is to perform a sweep test on the antenna assembly of the affected sector. This will allow for isolating the problem between the cable assembly and the antenna itself. Sweep tests are also capable of isolating the problem down to the precise components that are failing (connectors, jumpers etc.).
CDMA RF PERFORMANCE ANALYSIS & TROUBLESHOOTING GUIDE
LUCENT TECHNOLOGIES PROPRIETARY 64
Unbalanced Traffic on Border Cells
With border sectors, it is conceivable that the overloads are only limited to the common carriers since the border carriers are actively attempting to direct the calls to these carriers. If this is the case, then the following suggestions may be followed to fix the problem:
If the IFHOTI algorithm is not used on the border sector, then implement this feature so as to carry more traffic on the border carrier. Section 3.1.1.1.3 discusses this algorithm in more detail. Reference [5] is also required reading before any attempt is made to implement and optimize this feature.
If IFHOTI is already employed, then optimize the trigger parameters to get more traffic to stay on the border carrier, while maintaining the inter-frequency handdown performance at acceptable levels. Alternatively, this border sector could converted to a full-traffic sector, if possible15.
If neither of the above suggestions are effective or appropriate, then consider adding carriers to the adjacent cells and make this border carrier now carry full traffic. This is of course a medium-term to long-term solution because of the costs and justifications required to make this happen.
Output Power Drifts or Miscalibration
The output power being transmitted out of the problematic carrier of the sector may be miscalibrated or drifting. This could be because of a problem with the amplifier, lack of sufficient preventive maintenance calibrations or because the power was never calibrated correctly to begin with.
This problem could be detected in a number of ways. If the CDMA Radio Test Units (CRTU/CTRMs) are operational at the cell, then a Pilot Level (PL) functional test (FT) may be performance to check the output power. This test will indicate problems with the output power, assuming the CRTU/CTRM is properly calibrated.
Alternatively, the output power may be verified on-site using a power meter. Note that the testing technician must have explicit knowledge of the calibration option selected for that carrier because the output power varies according to the option selected.
Power drifts are not as easy to capture. One method is to run periodic CRTU/CTRM PL FT’s and examine the measured output power in the ROP. A drifting power amplifier will manifest itself in a large variance in measured pilot power over time. Alternatively, the actual output power may be measured over a long period of time on-site. This option is however highly undesirable because the sector will be out of service on that carrier during this entire test.
15 Sometimes the initial design of border sectors is conservative, and it is possible to convert some of these border sectors to full-traffic sectors through more careful multi-carrier optimization (see [16] for detailed procedures on such optimization).
CDMA RF PERFORMANCE ANALYSIS & TROUBLESHOOTING GUIDE
LUCENT TECHNOLOGIES PROPRIETARY 65
Miscalibrated powers may be easily rectified by performing the calibrations according to the Methods and Procedures guidelines for the appropriate calibration option. Reference [3] goes into great detail on these options.
Power drift problems may usually be resolved only through hardware replacements.
Cell Resource Differences between Carriers
There will be a difference in carried traffic between carriers if all the carriers of a site are not equally distributed with traffic-equipped Channel Elements (CEs). Section 3.1.3.1 provides a detailed definition of traffic-equipped CEs, along with hardware resource allocation management techniques.
Note that, in order for this cause to be determined as the root cause for the differences in carried traffic observed, it must be true that the carrier with the lower number of traffic-equipped CEs is in forward overload. If this is not the case, then this implies that even the lower number of traffic-equipped CEs is sufficient to handle the call volume for that carrier, and therefore, will not be the cause for differences in carried traffic between the carriers.
Hardware Outages
Outages on any call processing related hardware on a particular carrier of a cell could cause a temporary reduction in traffic carried by that carrier. Examples of such hardware components include CCCs/CDMs, channel cards (ECU/CCU-20, ECU/CCU-32), Packet Pipes (PPs), T1 spans, etc.
Problems related to this cause will result in a sudden performance degradation the moment the hardware goes out of service. In general, this problem will manifest itself in service measurements in a very similar manner to when the cell is authentically out of traffic-equipped CEs without any hardware troubles. The only way to distinguish between the two based on service measurements would be to examine the peak channel elements used. The peak channel elements used during the hours of blocking will be significantly lower than the number of traffic-equipped CEs at the cell in cases when the blocking is due to hardware outages.
The obvious solution to this problem is to fix the failing hardware components, or make arrangements for alternatives, to relieve its performance impact.
Inconsistent Attenuation Settings across Carriers
Attenuation settings (BCR/CBR) can be set independently for each carrier of a sector. Therefore, a mismatch in carried traffic could be observed between the carriers of a sector if they are configured with different attenuation settings, either intentionally or inadvertently. This would result in greater power overloads observed on the carriers with less attenuation, since they will carry more traffic.
CDMA RF PERFORMANCE ANALYSIS & TROUBLESHOOTING GUIDE
LUCENT TECHNOLOGIES PROPRIETARY 66
Note that sometimes specific carriers are configured with greater attenuation on border sectors, but are later not changed to be consistent with the rest of the carriers as the system grows and that sector becomes full-traffic.
The solution to this problem is to conduct regular translation audits to verify that all carriers of all sectors in the system are configured with the same attenuation values, unless there are good, documented reasons why they should be otherwise.
Improper Setting of Carrier Assignment Algorithm
This is especially pertinent with 2G/3G1X mixed systems. Improper setting of 2G and 3G Load Preference Deltas can potentially cause big differences in carried traffic amongst carriers of the same sector. This is especially true if the 2G/3G Load Preference Delta settings are not aligned with the actual 2G/3G1X traffic distribution. A detailed description of these settings is presented in Section 3.1.1.1.3.
3.1.5 Reverse RF Loading Resource Blocking Analysis
3.1.5.1 Concepts and Optimization Techniques
3.1.5.1.1 Conceptual Overview
These failures happen when a sector rejects new mobile calls or handoff requests because it is experiencing high reverse link loading, a condition known as reverse power overload. This mechanism is required to preserve the integrity of the reverse link, which could otherwise go into an unstable state if the reverse loading becomes too high.
There are also two algorithms for reverse link overloads, namely the Reverse link Overload Control (ROC) and Improved Reverse link Overload Control (IROC) algorithms. IROC was introduced with Release 16.1 to address some of the shortcomings of the older ROC algorithm.
The following sections discuss both of these overload algorithms.
Reverse link Overload Control (ROC) Algorithm
The ROC algorithm uses only the Received Signal Strength Indicator (RSSI) rise over Noise Floor to determine the extent of the reverse link loading.
The overload mechanism is administered by setting two thresholds, namely the R.L. Overload Control Lower Power Threshold (lower_rev_load) and the R.L. Overload Control Upper Power Threshold (upper_rev_load) in the ecp/ceqface forms. All new calls are blocked when the power utilization crosses the lower threshold. All handoffs are also restricted, in addition
CDMA RF PERFORMANCE ANALYSIS & TROUBLESHOOTING GUIDE
LUCENT TECHNOLOGIES PROPRIETARY 67
to new calls, when the power utilization crosses the upper threshold. Typical values for the reverse link are 75% and 100% of pole capacity16.
Note that before IROC, it was recommended that the reverse RF loading resource blocking algorithm be turned off. This is because the algorithm could not estimate the noise floor accurately enough resulting in false triggers of reverse power blocking. The reverse algorithm may be turned off by setting the upper_rev_load to 100% in the ecp/ceqface database forms. The lower threshold may still be set to any desired level, which in turn will still trigger (non service-affecting) reverse power overload counts in service measurements.
Improved Reverse link Overload Control (IROC) Algorithm
IROC improves on the ROC algorithm by using more inputs to arrive at a more accurate picture of the true reverse link loading present at the sector. Specifically, the algorithm correlates the RSSI rise over Noise Floor to two other inputs, namely the number of users (Walsh Codes) and the Reverse Frame Error Rate (RFER).
It is deemed that there is truly high reverse link loading when all three of these indicators point to a high loading condition. That is, there is a high RSSI rise over Noise Floor, high RFER and a large number of users. If there are fewer number of users, and/or if the RFER is low, then a greater RSSI rise over Noise Floor is allowed before any blocking conditions are implemented.
Unlike ROC, it is recommended that IROC be enabled on all sectors, especially in the presence of HSPD calls. This is because these IROC thresholds are also used to manage the packet data call admission. For 2G cells however, the upper limit may be set at 60 dB and the RFER Threshold set at 20%. This effectively disables the reverse link overload algorithm for 2G calls, but enables monitoring of the reverse loading levels. A full discussion on IROC, as well as all related recommended translations, is presented in [4].
Multi-Carrier Considerations
It should be noted that if a sector has multiple carriers configured on it, then each of these carriers will have its own receiver. This implies that each carrier of each sector can independently go into reverse overload. Therefore, when troubleshooting reverse overload problems, it is important to examine the carried traffic and overload on each carrier of the problematic sector.
Because of the efficiency of the carrier assignment algorithms (when configured correctly – see Section 3.1.1.1.3), calls should be very evenly distributed across carriers on a particular sector under normal operating conditions.
If a significant mismatch in carried traffic is observed resulting in the bulk of overload problems occurring only on a single carrier, then this would imply that some other problem
16 The % of pole capacity is translated to RSSI rise over Noise Floor based on standard theoretical calculations. It is this dB rise over noise that is monitored by the cell site to trigger the appropriate actions based on the ROC algorithm.
CDMA RF PERFORMANCE ANALYSIS & TROUBLESHOOTING GUIDE
LUCENT TECHNOLOGIES PROPRIETARY 68
exists on the carrier carrying less traffic, as opposed to a fundamental problem with overloaded capacity on that sector.
The exception to the statement above is if one or more of the carriers are configured as border sectors (handdown or pilot-only). Border sectors will, by definition, carry less traffic because they are constantly attempting to transfer the calls to the common carriers.
Typical Erlang Ranges
The actual load that can be carried by CDMA sectors can vary significantly based on the RF conditions, sector coverage and user patterns. However, certain rules of thumb may be established for typical erlang values that should be able to be carried by sectors.
The following table provides typical primary erlangs that can be supported by each sector for a single carrier. These numbers are obtained from [1], and assume that all traffic is 2G Voice.
Table 3.5 TABLE OF TYPICAL PEAK PRIMARY ERLANG VALUES
Erlang-B Blocking
Typical Peak Erlangs
All Mobiles Rate Set 2
Typical Peak Erlangs
All Mobiles Rate Set 1
1 % 6.6 12.0
2 % 7.4 13.2
3.1.5.1.2 Reverse RF Loading Blocking Management Techniques
The suggestions below describe how to manage RF loading resource blocking, either proactively before they occur or reactively once they already exist on one or more sectors. The assumption in this section is that the cell is operating normally with traffic balanced across all carriers (assuming it’s not a border sector). The next section deals with situations when this is not the case.
It is important to note that the performance of sectors typically start to degrade even before overload conditions occur. It is therefore important to have a process in place to extrapolate sector traffic loads on a regular basis and proactively apply the measures listed below before power overloads even surface.
CDMA RF PERFORMANCE ANALYSIS & TROUBLESHOOTING GUIDE
LUCENT TECHNOLOGIES PROPRIETARY 69
Short-Term Solutions to Fixing Power Overload Problems
Given below are some suggestions to fixing overload problems for the short-term until other medium and long-term solutions can be put in place, if deemed necessary.
3) Offload the heavily loaded sectors using any combination of physical antenna changes (reorientations, downtilts, antenna model changes etc.) and/or parameter changes (attenuation, handoff parameters etc.). If attenuations are being changed, then the BBA Max. Power (max_power) translation (set in the ceqcom2/crceqp/cdmeqp/bbueqp forms based on cell type) must be changed accordingly to preserve the quality of the calls (see [3] for details on this mapping).
1) While not recommended unless as a last resort, the overload thresholds may be increased to delay when the cells go into overload.
The reason why this solution is not recommended is that it does not help fix the problem fundamentally, but rather just delays its impact. Therefore, it will be highly likely, in a growing system, that the overloads will surface soon anyway.
Medium-Term Solutions to Fixing Overload Solutions
The medium-term solution to fixing overloads is to add additional carriers to the affected sectors, and possibly some surrounding sectors for performance reasons. Typically, there will be justifications required and significant costs involved with this option. This coupled with the construction and equipment delivery time will typically only make this solution available a few months later, thus will not be an effective short-term solution.
Of course, if a good practice of regularly projecting traffic erlangs is in place, then markets can anticipate the need for these additional carriers and have them installed in a timely manner, just in time when they are really needed.
Long-Term Solutions to Fixing Overload Solutions
In CDMA systems, extremely loaded areas will begin to potentially lose coverage due to the high level of interference resulting in none of the pilots being dominant enough to overcome it. Therefore, if coverage improvement is also a criteria, then the long-term solution would be to add additional cells in the heart of the high capacity areas. This is obviously a long-term solution because the cycle of design, cell selection, construction and optimization has to be performed. Typically, this solution will be in the order of several months.

CDMA RF PERFORMANCE ANALYSIS & TROUBLESHOOTING GUIDE
LUCENT TECHNOLOGIES PROPRIETARY 70
3.1.5.2 Reverse RF Loading Resource Blocking Causes and Associated Fixes
3.1.5.2.1 Sector has reached Capacity Limit
Concept / Reason for Failure
Sectors that have reached maximum prescribed loading levels on all carriers on the reverse link will start blocking new calls, and possibly handoffs as well.
Failure Symptoms and Identification Techniques
A sector may be deemed to have truly reached its capacity limitations if all carriers of the sector are carrying high erlangs that are approximately evenly distributed across these carriers. The latter should result in approximately equal power overloads on all sectors.
A second factor is that this sector should meet acceptable standards for soft/softer handoff percentage. Otherwise, though this sector has reached its capacity limitations from a reverse loading point of view, some of this power could potentially be shed if the soft handoff percentages are brought back in line. Section 3.1.5.2.2 delves into this topic in detail.
Similarly, sectors in which the high traffic utilization and/or power overloads are biased only towards a subset of the carriers is not an indication of true power capacity problems, but rather is indicative of some other problem with the cell site configuration and/or hardware. This type of problem is discussed in detail in Section 3.1.5.2.3.
Suggested Fixes for Improvement
If the affected sectors are deemed to have truly reached their capacity limitations, then the short, medium and long-term suggestions in Section 3.1.5.1.2 should be followed to alleviate the problem.
3.1.5.2.2 Excessive Soft-Handoff Zones
Concept / Reason for Failure
As discussed in Section 3.1.5.2.1 above, sectors could be running into reverse overload because of excessive soft handoff activity that would result in unnecessary interference on the reverse link.
A disciplined approach to reducing these percentages to acceptable levels could result in improved performance at many levels. There will be less interference in the network, which will likely improve the performance of all the calls in the area. Also, reducing soft handoff percentages will translate to reduced cell hardware resource utilization, which would translate to significant cost savings for the operator in terms of channel element cards and packet pipes.
CDMA RF PERFORMANCE ANALYSIS & TROUBLESHOOTING GUIDE
LUCENT TECHNOLOGIES PROPRIETARY 71
Failure Symptoms and Identification Techniques
• Isolate sectors exhibiting high soft-handoff percentage through service measurements. This is done by examining the primary and secondary usage on these sectors. The ratio of secondary usage to total (primary + secondary) usage gives the soft-handoff percentage. Percentages much larger than 50% should be flagged for examination and possible optimization. Note that there may be several sectors exhibiting such problems, especially in dense urban environments. It is always prudent to examine the RF performance of these high soft-handoff sectors, and only focus optimization activity on those exhibiting the most serious performance problems.
• Use Handoff Matrix and UNL17 to isolate overshooting sectors. Both these features can be used very effectively to capture sectors covering beyond their intended coverage areas as well as distant interferers from several tiers of cells away. Overshooting sectors have noticeable impact on the RF performance of the network, and serious effort must be undertaken to control these sectors.
Suggested Fixes for Improvement
If it is suspected that excessive soft-handoff zones are causing a rise in TCCFs, then reduce the soft-handoff zones through optimization to improve the pilot quality of the primary sector handling the call setup. Optimization may come in the form of physical optimization (changes in antenna orientation, downtilt, model etc.).
Note that BCR/CBR changes, as well as other parameter optimization such as manipulating IS95B handoff algorithm parameters will not help reduce reverse link interference because this interference will still be present at the receivers regardless of these settings.
3.1.5.2.3 Overload Not Detected on All Carriers of Multi-Carrier Sector
With non-border sectors, all situations when overloads are not detected roughly equally on all carriers of a multi-carrier sector indicated a problem with one or more carriers of that site.
Given below are some common reasons why this may occur, identifying techniques and suggested fixes.
17 Several steps must be followed to enable UNL: 1) The FAF feature 547 must be activated. 2) The Undeclared Neighbor List (unl) translation must be set to y on all sectors of interest on the ceqface form, or switch-wide on the ecp form. 3) The Search Window Size: Remaining Set (srchwinr) translation in the ceqface form must be changed from its recommended value of zero to 7 or greater (preferably at least 9 to ensure all distant interferers are captured).
CDMA RF PERFORMANCE ANALYSIS & TROUBLESHOOTING GUIDE
LUCENT TECHNOLOGIES PROPRIETARY 72
Differences in Coverage Footprints
There are differences in coverage footprints between the various carriers of the sector due to inconsistent physical antenna configurations on-site. This results in the different carriers carrying different loads, thus, potentially causing differences in observed overload durations.
These antenna configurations come in the form of antenna models, installed elevation, azimuth and downtilt. Note that, depending on the implementation, it is possible that multiple carriers may share the same antenna. If this is the case, then this cause may be ruled out as being the root of the problem.
The solution to this problem is to perform an on-site audit of the differences in antenna configuration between antennas of the same sector, and correct the problem. Note that it is also possible that the antennas may not be equally affected by physical obstructions on-site. If this the case, it may be necessary to relocate all the antennas, if adjusting their elevations and/or azimuths will not clear these barriers.
Faulty Antenna or Cable Assembly
A faulty antenna or cable assembly on one of the carriers of the problematic sector may cause that carrier to have a much smaller footprint, resulting in it carrying a much lighter load. Therefore, this will result in unequal load balancing and consequently, unequal observed reverse overload durations.
The solution to this problem is to perform a sweep test on the antenna assembly of the affected sector. This will allow for isolating the problem between the cable assembly and the antenna itself. Sweep tests are also capable of isolating the problem down to the precise components
Cell Resource Differences between Carriers
There will be a difference in carried traffic between carriers if all the carriers of a site are not equally distributed with traffic-equipped Channel Elements (CEs). Section 3.1.3.1 provides a detailed definition of traffic-equipped CEs, along with hardware resource allocation management techniques.
Note that, in order for this cause to be determined as the root cause for the differences in carried traffic observed, it must be true that the carrier with the lower number of traffic-equipped CEs is pegging handoff overflows. If this is not the case, then this implies that even the lower number of traffic-equipped CEs is sufficient to handle the call volume for that carrier, and therefore, will not be the cause for differences in carried traffic between the carriers.
Hardware Outages
Outages on any call processing related hardware on a particular carrier of a cell could cause a temporary reduction in traffic carried by that carrier. Examples of such hardware components include CCCs/CDMs, channel cards (ECU/CCU-20, ECU/CCU-32), Packet Pipes (PPs), T1 spans, etc.
CDMA RF PERFORMANCE ANALYSIS & TROUBLESHOOTING GUIDE
LUCENT TECHNOLOGIES PROPRIETARY 73
Problems related to this cause will result in a sudden performance degradation the moment the hardware goes out of service. In general, this problem will manifest itself in service measurements in a very similar manner to when the cell is authentically out of traffic-equipped CEs without any hardware troubles. The only way to distinguish between the two based on service measurements would be to examine the peak channel elements used. The peak channel elements used during the hours of blocking will be significantly lower than the number of traffic-equipped CEs at the cell in cases when the blocking is due to hardware outages.
The obvious solution to this problem is to fix the failing hardware components, or make arrangements for alternatives, to relieve its performance impact.
Improper Setting of Carrier Assignment Algorithm
This is especially pertinent with 2G/3G1X mixed systems. Improper setting of 2G and 3G Load Preference Deltas can potentially cause big differences in carried traffic amongst carriers of the same sector. This is especially true if the 2G/3G Load Preference Delta settings are not aligned with the actual 2G/3G1X traffic distribution. A detailed description of these settings is presented in Section 3.1.1.1.3.
Unbalanced Traffic on Border Cells
With border sectors, it is conceivable that the overloads are only limited to the common carriers since the border carriers are actively attempting to direct the calls to these carriers. If this is the case, then the following suggestions may be followed to fix the problem:
If the IFHOTI algorithm is not used on the border sector, then implement this feature so as to carry more traffic on the border carrier. Section 3.1.1.1.3 discusses this algorithm in more detail. Reference [5] is also required reading before any attempt is made to implement and optimize this feature.
If IFHOTI is already employed, then optimize the trigger parameters to get more traffic to stay on the border carrier, while maintaining the inter-frequency handdown performance at acceptable levels. Alternatively, theis border sector could be converted to a full-traffic sector, if possible18.
If neither of the above suggestions are effective or appropriate, then consider adding carriers to the adjacent cells and make this border carrier now carry full traffic. This is of course a medium-term to long-term solution because of the costs and justifications required to make this happen.
18 Sometimes the initial design of border sectors is conservative, and it is possible to convert some of these border sectors to full-traffic sectors through more careful multi-carrier optimization (see [16] for detailed procedures on such optimization).
CDMA RF PERFORMANCE ANALYSIS & TROUBLESHOOTING GUIDE
LUCENT TECHNOLOGIES PROPRIETARY 74
3.1.5.2.4 External Interference
Concept / Reason for Failure
Significant external interference on the reverse link could drive the sector into reverse overload even though the carried traffic does not warrant such a high RSSI rise. The IROC algorithm will have some ability to account for these interference spikes because it attempts to correlate this RSSI rise with the number of users and measured RFER. Still, the reverse overload conditions could be triggered if the interference causes enough of an RSSI rise over Noise Floor.
Failure Symptoms and Identification Techniques
Though there is no absolute method of detecting external interference through service measurements, this problem may be suspected if a very high RSSI rise on a sector is detected even though the carried traffic on the reverse link does not justify such high reverse loading.
Another indicator of reverse link external interference could be an abnormally high Reverse Frame Error Rate (RFER), even though the Forward Frame Error Rate (FFER) is within normal ranges. Any true RF or optimization problems in the area should affect RFER and FFER equally.
External interference may be verified by using a spectrum analyzer to scan the affected CDMA carrier. Typical interference will appear as spikes caused by inter-modulation products as well as spurious signals. The source of the interference may be identified by driving around the area and looking for the areas of concentration in the observed interference. Triangulation methods may also be used with multiple analyzers or scanners to track the interference source.
Suggested Fixes for Improvement
The fix would be to remove the stop the source of interference, once identified. Sometimes this would entail contacting the offending party to terminate the transmissions. The biggest challenge is usually to identify the interference source to begin with.
The IROC algorithm may need to be disabled or adjusted to prevent unwarranted call blocking until this interference is eliminated.
CDMA RF PERFORMANCE ANALYSIS & TROUBLESHOOTING GUIDE
LUCENT TECHNOLOGIES PROPRIETARY 75
3.1.6 Termination Failures Related to Call Delivery Type
There are two common methods of delivering incoming calls when the mobile is not at its home MSC. They are the Cellular Networking (CN) method and the Special Cellular Networking (SCN) method. The primary difference between the two is that the CN delivery method uses inter-MSC trunks to deliver the calls between Mobile Switching Centers (MSCs), while the SCN method used the PSTN for such delivery.
If the CN delivery type is used in a market, then all TCCFs that occur whenever this delivery mechanism is utilized are captured as CN Termination TCCFs. This counter will be zero if the SCN delivery method is used, and all TCCFs will be captured in the traditional TCCF peg counts.
The reason why these CN TCCFs occur are just the same as those discussed in Section 3.1.1. The only difference is that the events are captured by a different counter at a system level, as opposed to the cell level, whenever the CN delivery type is employed to set up a call. The steps required to optimize these types of TCCFs will be the same as those discussed in Section 3.1.1, and will not be reiterated here.
It is also possible under special circumstances where there will be additional termination failures when the SCN delivery method is used. In particular, the SCN delivery method will not allow for more than one Temporary Location Directory Number (TLDN) to be associated with the same mobile. A TLDN is assigned to a mobile whenever a call needs to be routed to a Mobile Switching Center (MSC) other than its Home MSC.
A situation may arise whereby the mobile is physically located in the Home MSC, but still has an entry in another MSC’s Visitor Location Register (VLR), usually due to registration delays or configuration errors. When this happens, calls to this mobile will be routed from the Home MSC (H-MSC) to the Visited MSC (V-MSC) which in turn needs to assign a second TLDN and route these calls back to the Home MSC. This is sometimes referred to as a “double hop”.
The CN delivery method supports such a scenario, allowing the call setup to proceed. The SCN delivery method, however, does not allow for such a scenario, resulting in a termination failure.
How the service measurements capture this situation depends on whether flood paging is turned on or not. Since the network believes that the mobile is in the V-MSC, the mobile will only be paged eventually in the H-MSC if flood paging is turned on. In this case, a page response seizure is captured in service measurements, but if SCN delivery is used, a subsequent assignment will not be pegged because of the problem stated above.
On the other hand, if flood paging is not turned on, then the mobile will never be paged on the H-MSC. Therefore, no page responses will be captured, effectively resulting in this problem being missed by service measurements. These types of problems may however be captured by internal Lucent OMP scripts such as pfpgstats (that is able to monitor all paging activity to arrive at the true termination failure rates).
If this problem is found to be happening, then the solution will be to migrate the market to CN delivery type.
CDMA RF PERFORMANCE ANALYSIS & TROUBLESHOOTING GUIDE
LUCENT TECHNOLOGIES PROPRIETARY 76
3.1.7 Termination Failures due to Registration Problems and Paging Strategies
3.1.7.1.1 Conceptual Overview
Registration is the process by which the mobiles inform the network of their location, allowing the network to efficiently locate these mobiles to deliver incoming calls. Intimately tied to registration are paging strategies. Paging strategies determine when and which cells should page the mobiles for incoming calls.
Depending on how the registration and paging strategies are set up in a market, it is conceivable that mobiles are sometimes paged incorrectly, resulting in these mobiles never having the opportunity to receive these pages and respond accordingly. These missed incoming calls subsequently (usually) get routed directly to voice mail.
It is important to note that this component of the termination failures will not be captured by service measurements. This is because all termination statistics with service measurements start with Termination Seizures which are logged when the cell site successfully receives a page response from the mobile, which will not happen in this case19.
These types of problems may however be captured by internal Lucent switch-based scripts such as pfpgstats that are able to monitor all paging activity to arrive at the true termination failure rates. Alternatively, these failures can be determined from the field by conducting terminations tests along switch boundaries, where registration and paging problems are most likely resulting in termination failures.
Because of the strong relationship between the two, registration and paging strategies must always be considered together to arrive at an efficient configuration. The ideal configuration is dependent on many factors such as the size of the market, the number of switches, mobility patterns of users, user density, road patterns, available paging and registration-related equipment (for instance, type of Home Location Register – HLR), etc. Therefore, every market may have a different combination of the two strategies based on its particular requirements.
There are two main types of paging strategies, namely, flood paging and smart (directed) paging.
Flood paging refers to the case when all the MSCs in a market are paged for every incoming call. It is intuitively obvious that this type of paging will maximize the chances that mobiles receives the page, but at the expense of a high overhead on the paging channels due to a lot of unnecessary paging on MSCs that the mobiles never even visited.
The alternative is smart paging where only the MSCs that were most recently visited by the mobiles are paged. While this is a lot more efficient in terms of paging overhead, it introduces
19 Service measurement counters will also miss failures where the mobiles receive the page, but their response was not successfully received by the network, usually because of RF-related problems.
CDMA RF PERFORMANCE ANALYSIS & TROUBLESHOOTING GUIDE
LUCENT TECHNOLOGIES PROPRIETARY 77
the need for Autonomous Registrations (ARs) by the mobiles to constantly keep the network updated of their whereabouts. This also introduces the possibility of missed pages if the network does not have the most updated location of these mobiles at the instant when calls need to be delivered to them.
A combination of these two schemes is also allowed whereby the network makes directed attempts on the most recently visited MSC initially, and if it still fails to get a page response, then the flood page is done. This is normally the recommended mode.
Note that an alternative to flood paging is the Intersystem Paging (ISPAGE) feature. ISPAGE has the same net effect as flood paging, but is implemented differently to support certain switch hardware configurations that are incapable of implementing flood paging. The Flexent/Autoplex Wireless Networks Optional Feature Document 401-612-346 contains details on this feature. [12] also provides an in-depth study and recommendations on this topic.
The topic on ARs is a detailed one and a good reference on this topic can be found in the Flexent/Autoplex Wireless Networks Optional Feature Document 401-612-009. A summary of the important points are discussed below.
There are four main situations that could generate ARs, namely:
1) Timer-based Registrations
2) Registrations during Mobile Power Up/Down
3) Zone-based Registrations
4) Registrations during Parameter Change (examples of parameters - slotted vs. non-slotted mode, slot cycle etc.)
All four of these types of ARs should be employed in a market with the correct settings to achieve the optimal balance between registration activity and termination success rate. The AR mechanisms that would need the most optimization would be the timer-based and zone-based registrations. Therefore, the rest of this section will be devoted to the concepts associated with these two types of registrations.
Timer-based registrations instruct the mobiles to register with the network periodically over fixed time intervals. This interval period is defined in translations as the field CDMA Time-Based Registraion Period (regprd_c) on the cell2 form and also on a switch-wide basis on the cgsa form.
Important: There is an exponential relationship between the regprd_c setting and the time interval. For example, the value 58 for this field corresponds to an interval of 30 minutes, while the value 29 corresponds to only 12 seconds! Therefore, great care must be taken in ensuring that the correct value is populated in this field, else there will be an exponential increase in unnecessary registration activity. The complete mapping for this translation can be found on Table cell2-4 in the Flexent/Autoplex Wireless Networks Optional Feature Document 401-610-036.
CDMA RF PERFORMANCE ANALYSIS & TROUBLESHOOTING GUIDE
LUCENT TECHNOLOGIES PROPRIETARY 78
Zone-based registrations instruct the mobile to register every time they cross a zone, a zone being a collection of cells that are specified in translations to be part of the same location area. Typically, each MSC is specified to be a single zone. Zone-based registrations are event-based and may occur as many times as there are zone-boundary crossings. They may coexist with timer-based registrations.
A potential problem with zone-based registration is if the mobiles are rapidly switching back-and-forth between zones, causing a tremendous increase in registration activity on these zone-boundary cells. These registration activities could deplete access channel resources for valid call attempts and may also dramatically increase the call processing loads on the cells as well as the Call processing Database Node (CDN) at the switch.
There are therefore two translation parameters that, if configured correctly, can dramatically reduce the number of zone-based registrations while still maintaining acceptable termination success rates. These translations are the Location Areq/Zone ID Registration – CDMA (totzones) and CDMA Zone Registration Timer (zone_tmr) parameters that may be set on the cell2 form on a cell-by-cell basis. These parameters also may be set switch-wide on the cgsa form.
These parameters allow a method for the mobile to maintain a history of recently visited zones (up to totzones), and prevent re-registering on these zones, with the expectation that the mobile might revert back to the original zone that it was on. The mobile will only register onto this new zone if it did not revert back to its original zone within the interval zone_tmr.
The feature is best understood with an example. Say totzones is set to 2 and zone_tmr is set to 1 minute. A mobile initially registers with MSC A in Zone A. There is no timer associated with this registration since it is the first zone seen by the mobile. The mobile then moves to MSC B in Zone B. At this point, the mobile registers with MSC B since there is no current timer preventing it from doing so. Zone A is added to a ZONE_LIST, which is maintained by the mobile, and a timer is started. If the mobile moves back to Zone A before the timer expires, then no registration is done. If now the mobile remains on Zone A until the timer expires after 1 minute, then the mobile re-registers with Zone A. If however, the mobile reverted back to Zone B before the timer expired, then no registrations are performed and the network still has the information that the mobile is in Zone B, which in this case is accurate. In this last scenario, after Zone A’s timer expires, it will be removed from the mobile’s ZONE_LIST.
There is an important drawback to this algorithm, which may be explained using the example above. It can be seen in one of the scenarios above that there is a period of time, which could be up to a maximum of zone_tmr minutes, when the mobile is in Zone A but it is registered as being in Zone B. During this period, the smart paging strategy will fail because the wrong MSC (MSC B) will page the mobile. If flood paging is not turned on, then MSC A will never page this mobile, causing the entire termination attempt to fail. Even if flood paging is turned on, this will result in a delayed response to the termination attempt because the system first tries to page MSC B.
On the other hand, having too many ARs due to over-aggressive registration strategies, while possibly improving the termination success rate marginally, could have many other detrimental effects on the system. Some examples of these effects are:
CDMA RF PERFORMANCE ANALYSIS & TROUBLESHOOTING GUIDE
LUCENT TECHNOLOGIES PROPRIETARY 79
1) Increase in Access Channel and Paging Channel occupancy, potentially increasing the number of access probes required to make a successful attempt. This will increase the setup delays for new calls, causing a customer-perceived service degradation.
2) Increase in processor occupancy on all hardware elements involved with registrations. This includes cell processors, Cell Site Node (CSN) processors, Call processing Database Node (CDN) processors, Data Link Node (DLN) processors and SS7 node processors. There will also be an increase in SS7 link occupancy.
3) A reduction in battery life on the mobiles because of the increased transmissions required to communicate these ARs.
3.1.7.1.2 Registration and Paging Strategy Recommendations
Based on the above discussions, given below are some recommendations on how the registration and paging strategies should be applied for optimal performance. Note that these suggestions may not apply to all markets, as some of these markets may have unique requirements.
• Turn on a combination of smart paging and flood paging on all MSCs. This ensures that mobiles will eventually get their pages even if the registrations fail to identify the correct MSC that these mobiles are on. If flood paging cannot be implemented in the market, then activate the ISPAGE feature instead.
• Use CN call delivery type whenever possible. This will eliminate one source of termination failures associated with multiple TLDNs as explained in Section 3.1.5.
• Activate timer-based registrations on all cells in the system and ensure that the registration interval is no less than 30 minutes.
• Activate zone-based registration on all cells in the system and set the totzones to as many MSCs that could interact with mobiles on the inter-MSC borders. Note that it is okay to enable zone-based registrations on all cells in the system since this setting will have no impact on registration rates on cells that do not interact with an MSC border.
The setting of zone_tmr is market-specific. As mentioned previously in the Conceptual Overview, a balance must be drawn between the number of registrations and the termination success rate performance when selecting the value to set. This balance will be different for different markets but the range of this setting is typically between 1 to 2 minutes.
There are also several other parameters that must be set in order to properly configure this feature, such as the CDMA Registration Zone ID that must be uniquely assigned to each MSC or set of cells to identify them as separate zones. The Flexent/Autoplex Wireless Networks Optional Feature Document 401-612-009 contains the necessary details and must be read thoroughly before attempting to change the market’s registration configuration. [12] also provides an in-depth study and recommendations on this topic.
CDMA RF PERFORMANCE ANALYSIS & TROUBLESHOOTING GUIDE
LUCENT TECHNOLOGIES PROPRIETARY 80
3.2 Drop Call Rate
This is also one of the most critical performance indicators as it is a key measure of the quality of the call. Dropped calls are generally regarded as one the most frustrating experiences for customers and therefore much of the optimization efforts are geared towards improving this metric. The Drop Call Rate is a measure of the ratio of the number of dropped calls to the total number of established calls.
The high-level equation for drop call rate may be represented as follows:
100% x CallsdEstablishe TotalDrops Fail CP Calls Lost Rate Call Drop +=
SRD-1536 [11] provides a detailed description of the peg counts and equations used to determine this KPI.
In the above definition, the Total Established Calls is just the numerator of the equation specified for the Established Call Rate KPI described in Section 3.1.
The two Major Failure Categories that constitute Dropped Calls are CP Fail Drops and Lost Calls.
Lost Calls typically account for approximately 70% of all dropped calls. CP Fail Drops is a catch-all counter that captures the remaining 30% of drops that are not accounted for in Lost Calls, usually because these drops occur under special circumstances that are best captured by the call processing nodes in the ECP complex.
While conditions that will cause CP Fail Drops may also result in Lost Calls and vice versa, each condition will usually bias the failures to one or another. Therefore, each of these categories are discussed separately in this section, with the understanding that each concept discussed under either category may also marginally apply to the other.
3.2.1 Lost Calls
3.2.1.1 Concepts and Optimization Techniques
Conceptual Overview
A Lost Call occurs when a cell is no longer able to detect the reverse link with sufficient quality for the duration of the Traffic Channel Supervision Interval which is a translatable parameter (tcsupervsn on the ecp/cell2 database forms). When this loss is detected, the cell will attempt to audit the mobile up to nine times. If it still does not receive any acknowledgement from the mobile, it will tear down (drop) the call, resulting in the Lost Call
CDMA RF PERFORMANCE ANALYSIS & TROUBLESHOOTING GUIDE
LUCENT TECHNOLOGIES PROPRIETARY 81
service measurement counter to be pegged. This event will also be logged in the ROP as a Lost Call message.
The most commonly encountered reasons for Lost Calls are listed below. As mentioned in the beginning of this section, these reasons may also result in an appreciable rise in CP Fail Drops, though not as significant as Lost Calls.
1) Incorrectly populated neighbor lists preventing strong pilots from being added to the Active Set. These strong pilots eventually cause so much interference that the call drops. In these cases, the mobile will typically synchronize to the strong pilot immediately after dropping the call, offering a method to capture this type of problem with drive test data. Such problems may also be captured at the switch using the Undeclared Neighbor List (UNL) tool, as described in Appendix B.
2) A poor RF environment will cause drops because it will increase the chances for the loss of signal on either or both the links. A poor RF environment can be caused either because of excessive pathloss (due to foliage, dense buildings etc.), highly varying terrain or excessive interference.
3) A poor RF design and/or initial optimization will also set the stage for many dropped calls. Poor RF design can come in the form of sub-optimal cell locations, heights, antenna azimuths, link budget errors, etc. Poor RF optimization can come in the form of improperly populated neighbor lists, improper use and audits of RF translation parameters, poorly optimized antenna configurations, etc.
4) Performance degradations may occur as a result of heavy traffic loads, potentially leading to dropped calls. This is because the heavily loaded sectors raise the interference level to a point that makes it difficult for the mobiles and the cells to overcome it on the reverse and forward links respectively.
5) Pilot-polluted areas could result in the lack of a dominant server in an area, even though there is ample total received power, leading to dropped calls. Pilot-pollution typically occurs in areas that are visible (from an RF-sense) from many areas of the network. Examples of this include bridges, elevated highways and roadways along water bodies. Pilot-pollution may also occur due to improper selection of cell sites, resulting in these cell sites causing excessive interference in areas beyond their targeted coverage areas. Finally, pilot-pollution may result due to a sub-optimal antenna azimuth strategy that fails to take advantage of the antenna patterns to reduce interference.
Optimization Steps for Reducing Lost Calls
The suggestions below address the common causes for dropped calls listed above.
• Ensure neighbor lists are accurate and complete. Some of the important characteristics of a good neighbor list are:
• They should satisfy reciprocity. That is, if sector A is in sector B’s neighbor list, then sector B should also be in sector A’s neighbor list. It is very rare that non-reciprocity can be justified in CDMA systems because of the fact that all cells are transmitting at the same frequency. Therefore, if one sector is strong enough to be neighbored with
CDMA RF PERFORMANCE ANALYSIS & TROUBLESHOOTING GUIDE
LUCENT TECHNOLOGIES PROPRIETARY 82
another, then the converse, by definition, will also be true. The FCIAlert tool will help verify reciprocity (Appendix B).
• The neighbor lists should capture all potential valid neighbors and be prioritized correctly. The Handoff (HO) Matrix and Undeclared Neighbor List (UNL) tools will help greatly in ensuring that this is achieved (Appendix B).
The HO Matrix tool logs all handoff activity that actually took place in the network and is a useful tool to prioritize neighbors and delete unused neighbors. The UNL20 tool may be used to add missing neighbors as it captures strong pilots that could not be added to the Active Set because they were not part of the neighbor list. Though these pilots are captured in the call state, the neighbor list additions will apply to the idle state also.
When using the UNL feature, it is often more effective to first use service measurements to narrow down and focus on the sectors exhibiting the most severe UNL problems (as a proportion of their total traffic). Tools such as SPAT (Appendix B) may be used to easily arrive at this list of affected sectors.
• There should be no PN ambiguities in the neighbor list. The FCIAlert tool can be used to check for this (see Appendix B for details on the tool and this condition).
• Perform periodic system-wide drive tests of all major roadways and high-traffic areas. Optimize the coverage and manage the interference levels using techniques such as physical antenna configuration changes and parameter optimization [15]. These drives may also be used as an opportunity to identify and resolve certain types of problems that may be best identified with drive tests. Examples of this are search window problems and co-PN interference. There are many commercial tools to perform such drive test analysis. There also exists Lucent internal tools such as the Lucent Data Analysis Tool (LDAT) to perform CDMA drive test post-processing.
• Identify all heavily loaded sectors (that is, sectors whose total carried erlangs are approaching the values in Table 3.4) and implement capacity reduction techniques as per the suggestions in Section 3.1.4.1 under the topic on Forward Power Resource Blocking Management Techniques. This is especially important if noticeable degradations in drop call performance is noticed during the busy hours only on these sectors. Note that, if the load is not evenly distributed among the carriers of these sectors, then this might be indicative of some other problem. These cases are dealt with in Section 3.1.4.2 under the topic on Overload Not Detected on All Carriers of Multi-Carrier Sector.
• There must be a general discipline to reduce overshooting sectors throughout the network. These overshooting sectors will result in unpredictable behavior and drops in the system since they will appear in unexpected areas. These sectors will also draw more capacity than they were intended for.
20 Several steps must be followed to enable UNL: 1) The FAF feature 547 must be activated. 2) The Undeclared Neighbor List (unl) translation must be set to y on all sectors of interest on the ceqface form, or switch-wide on the ecp form. 3) The Search Window Size: Remaining Set (srchwinr) translation in the ceqface form must be changed from its recommended value of zero to 7 or greater (preferably at least 9 to ensure all distant interferers are captured).
CDMA RF PERFORMANCE ANALYSIS & TROUBLESHOOTING GUIDE
LUCENT TECHNOLOGIES PROPRIETARY 83
For mature systems, the UNL21 feature is a good place to start to get a list of overshooting sectors. The HO Matrix tool will also provide insights into the sector coverage. Alternatively, the footprint of the sectors may be mapped out based on drive test data, though this is usually a more costly and time-consuming exercise.
The techniques to fix or manage these overshooting sectors is through physical antenna and attenuation changes.
• Pilot polluted areas should be identified and eliminated (as much as possible), especially if it observed that there are performance degradations observed in these areas. The only way to identify pilot polluted areas is through drive tests, either with a scanner or with a mobile phone. The techniques used to reduce these pilot polluted areas will be the same as those used to reduce overshooting sectors above, namely, through physical antenna and attenuation changes.
3.2.1.2 Lost Call Causes and Associated Fixes
3.2.1.2.1 Poorly Defined Neighbor Lists
Concept / Reason / Effect of Failure
A poorly defined neighbor list will result in potentially strong Candidate pilots being rejected from entering the Active Set and participating in the call. Instead, these Candidate pilots will act as pure interference to the call. If this interference is sufficiently strong, the mobile will drop the call, resulting in a lost call.
Failure Symptoms and Identification Techniques
Several switch features exist that will easily trap neighbor list problems. Specifically, both the Handoff Matrix (HOMAX) and the Undeclared Neighbor List (UNL) features have been very effective in identifying missing neighbor list entries and erroneous priority assignments.
Problems with the neighbor lists may also be captured through integrity and consistency testing of the neighbor list using tools such as FCIAlert. This tool captures a variety of problems such as non-reciprocal neighbors and PN ambiguities within the neighbor list.
The SPAT tool explained in Appendix B may be used to quickly identify sectors exhibiting this problem.
21 Several steps must be followed to enable UNL: 1) The FAF feature 547 must be activated. 2) The Undeclared Neighbor List (unl) translation must be set to y on all sectors of interest on the ceqface form, or switch-wide on the ecp form. 3) The Search Window Size: Remaining Set (srchwinr) translation in the ceqface form must be changed from its recommended value of zero to 7 or greater (preferably at least 9 to ensure all distant interferers are captured).
CDMA RF PERFORMANCE ANALYSIS & TROUBLESHOOTING GUIDE
LUCENT TECHNOLOGIES PROPRIETARY 84
Alternatively, neighbor list problems may also be identified through drive tests. This method however is generally more expensive and less reliable, since it will be difficult to drive all areas of typical usage to capture all neighbor list problems. However, there is little choice but to use drive tests for greenfield (new) deployments, since switch-based neighbor list management tools lack the traffic to make them statistically reliable.
Suggested Fixes for Improvement
The suggested fix is to modify the neighbor list in accordance with the problem detected.
• If the problem is with missing neighbor list entries, then these neighbors should be added, with care to make sure the reciprocal neighbors are also added.
Note that there must be discipline exercised when adding neighbors, since sectors with excessively large neighbor lists could perform poorly due to the increased processing requirements. Additionally, given the fact that neighbor lists of sectors in soft-handoff are concatenated, large neighbor lists increases the chances that some neighbors will be dropped in this concatenated list.
The solution in this case will be to perform physical and/or parameter optimization to eliminate the need for the neighbor list entry [15]. This would entail removing that sector from the area through antenna downtilts, azimuth changes, antenna model changes and/or BCR/CBR attenuation changes.
• If the problem is with the integrity of the neighbor list, then the appropriate fix should be applied. Given below are important integrity checks that must be performed on neighbor lists. The FCIAlert tool will perform all of the following integrity checks and more, but the most important ones are listed below.
Reciprocity
Reciprocity refers to making sure that if sector A is added to sector B’s neighbor list, then sector B is also in sector A’s neighbor list. With CDMA networks, there is rarely any justification for not satisfying reciprocity rules when populating neighbor lists because all sectors are transmitting on the same frequency.
PN Ambiguity Issues
PN ambiguities may come in many forms. No two neighbors on the same neighbor list can have the same PN assignment because this will confuse the network should this PN be reported as a Candidate pilot. A less obvious problem will be when two neighbors share the same PN as a result of neighbor list concatenation. This is commonly referred to as two-way PN ambiguity problems (for any combination of two neighbor lists) up to n-way neighbor list problems (n up to 6). Typically, only two-way PN ambiguity checks are performed.
CDMA RF PERFORMANCE ANALYSIS & TROUBLESHOOTING GUIDE
LUCENT TECHNOLOGIES PROPRIETARY 85
Cross-Face Neighbors
At a minimum, each sector must have all other sectors in the same cell as neighbors.
3.2.1.2.2 High Traffic Areas
Concept / Reason for Failure
Areas of high traffic can cause an increase in lost calls. This is because several high-traffic sectors in an area raises the interference levels significantly, making it difficult for the traffic channel to overcome this interference.
Failure Symptoms and Identification Techniques
High traffic levels may be determined by examining the traffic erlangs carried by the sectors exhibiting poor lost call performance. Note that, if this is indeed the root cause for the lost calls, then there must be several sectors covering the same area with very high traffic levels. A single sector with high traffic will not justify that sector experiencing high lost calls because its own sector traffic are mutually orthogonal and should not affect the performance much.
Another important trend to look for to isolate this root cause is that there should be a clear correlation between the lost call performance and traffic levels. It should be observed that the lost call performance gets sharply worse as the traffic picks up beyond a certain point. If the lost call performance is consistently poor during all hours of the day, then it is unlikely that high traffic levels are the root cause.
Suggested Fixes for Improvement
If the lost call performance is deemed to be poor because of high traffic levels, then the only real solutions available is to either add a carrier to the sectors in the area to relieve traffic, or to add cell splits to offload the traffic to new cells.
Performing optimization to offload sectors is usually a difficult exercise if there are more than a couple of sectors in an area experiencing high traffic, since there will be limited sectors to offload this traffic to. Playing with translation parameters to increase the traffic carried by sectors will only make matters worse because it will add to the excessive interference that was the root cause of the problem to begin with.
One possible alternative solution, though sometimes difficult to achieve, is to reduce the amount of overall soft-handoff percentage in the affected area.
There are however several dangers with reducing soft-handoff zones, especially if this is not executed properly. Given the nature of CDMA systems where the coverage shrinks with traffic loading, it is quite possible that areas of weak to no coverage can be created during peak hours if the soft-handoff reductions are too aggressive.
CDMA RF PERFORMANCE ANALYSIS & TROUBLESHOOTING GUIDE
LUCENT TECHNOLOGIES PROPRIETARY 86
Also, it is always wise to manage soft-handoff zones by performing physical antenna optimization, if possible, as opposed to changes in translations such as BCR/CBR attenuation. Changing attenuation values to manage coverage has several drawbacks.
• Typically, it is recommended that the BBA Max. Power (max_power) translation (set in the ceqcom2/crceqp/cdmeqp/bbueqp forms based on cell type) is reduced proportionately when attenuation is increased at a sector. While in theory, the average power allocated to each user should also go down (thus maintaining the same traffic capacity at the sector), this may not hold true in soft-handoff areas where the average power allocated to the users may remain constant. If this were to happen, then the sectors will actually go into forward power overload even sooner. This may have negative impacts on the performance of call establishments and dropped calls.
• The alternate solution to leave the max_power unchanged despite increasing attenuation will also potentially have negative impacts. These fully loaded sectors may deteriorate the ability of the traffic channels to overcome the increased interference, since these traffic channels are actually transmitting at a lower power due to the attenuation introduced. This will potentially result in more areas of weak coverage, which in turn will affect lost call performance.
Antenna adjustments do not suffer any of the drawbacks discussed above. The coverage problems are solved fundamentally, without introducing any of the capacity and/or interference issues due to max_power and BCR/CBR mismatches as discussed above. Of course, there isn’t always the option to perform such physical antenna optimization, especially in the cases when these antennas are shared among multiple technologies (overlay systems). In these circumstances, there may be no choice but to perform parameter adjustments to control coverage.
3.2.1.2.3 Significant Areas of Poor Coverage
Concept / Reason for Failure
Lost calls could be generated in areas of weak coverage whereby even the dominant pilot is unable to overcome the noise floor. Areas of weak coverage could be a result of being inside buildings, areas shadowed by obstacles such as hills, trees etc. or due to poor RF design of the cell sites.
Failure Symptoms and Identification Techniques
It is difficult to determine poor RF coverage through service measurements or any other switch-based tools. Typically, the drop call performance will also be poor, but this is inconclusive because there are several other root causes that will result in degradations in both drop call as well as TCCF performance.
The best way to confirm suspected weak coverage areas is through conducting drive tests. Areas of very weak receive power, is an indication of weak coverage. Note that sufficient margin must be added to account for in-building penetration losses in urban areas.
CDMA RF PERFORMANCE ANALYSIS & TROUBLESHOOTING GUIDE
LUCENT TECHNOLOGIES PROPRIETARY 87
Suggested Fixes for Improvement
There are several choices for improving such coverage problems. They are:
• Perform physical optimization and/or parameter optimization to improve coverage [15]. Physical optimization entails modifications of the antenna azimuths, downtilts and/or antenna models. Parameter optimization is primarily through the manipulation of BCR/CBR attenuation values. There may not always be an option to implement this solution since the antennas may already have been configured for optimal coverage and the attenuation values are at their minimum.
• Add cell site to improve coverage. This would require even more justification that the previous suggestion because of the vastly higher costs associated with this solution. However, if there is a capacity constraint in the area, then it might typically be easier to justify these cell splits.
3.2.1.2.4 Island-Mode Cell
Concept / Reason for Failure
On rare occasions, a cell will go out of synchronization with the network, causing it to be in an ‘island-mode’ whereby it is not able to handoff to any surrounding cell and vice versa. This happens when the RFTG does not reestablish correct timing after experiencing flywheeling due to temporary loss of line-of-sight with the GPS satellites or hardware failures.
Failure Symptoms and Identification Techniques
A cell in island-mode is usually clearly recognizable from service measurements. The most important sign is a severe drop in soft-handoff activity on the affected cell, since this cell will no longer have any soft-handoff with its neighboring cells. Note that there will still be some marginal soft-handoff activity when the cell is in three-way softer handoff. Soft-handoff percentage may be determined through examining the ratio of secondary to total (primary + secondary) CE usage at the cell. Normal cells (that have surrounding cells that are operational) will typically achieve at least 30% soft-handoff activity.
Other signs of island-mode cells include the following:
• All carriers of all sectors of the affected cell will experience high drop call percentage as mobiles drive out of the cell coverage area and drop their calls, since they are not able to handoff to another site. Note that these drops will manifest themselves only as Lost Calls, not CP Fail Drops. This is because the mobile will never be directed to handoff in the first place, eliminating the possibility for Handoff (HO) Timeouts.
• All carriers of all sectors pointing towards the affected cells will also experience very high drop percentage.
• Examination of the ROP will show RFTG flywheeling activity on the cell. Note however that this in itself is not an indication that the cell is in island-mode. This is because
CDMA RF PERFORMANCE ANALYSIS & TROUBLESHOOTING GUIDE
LUCENT TECHNOLOGIES PROPRIETARY 88
flywheeling is a very common occurrence in IS95 systems and the base stations are able to operate for several hours with accurate timing, with the aid of a rubidium clock, until timing is reestablished with the GPS satellites. This however may serve as a good check if all the above symptoms are observed.
The best way to verify that the cell is in island-mode is to test the ability of the cell to handoff in the field. Freshly collected handoff matrix data may also be used to confirm the lack of soft-handoff activity with any surrounding cell site.
Suggested Fixes for Improvement
If a cell is determined to be in island-mode, then the instructions presented in Fax Flash #98-269 must be followed to clear the problem. Fax Flash #99-023 also presents some alarms that are indicative of this problem which manifest themselves as HEH messages on the ROP.
3.2.1.2.5 Handoff Cell is Blocking on All Carriers
Concept / Reason for Failure
Calls could drop because the mobiles are not able to handoff to a sector that is blocking on all carriers due to resource constraints. Note that it is conceivable that the call is maintained even under this scenario as long as the serving sectors in the Active Set are still able to collectively overcome the interference caused by this blocking sector. However, if the blocking sector’s pilot becomes the dominant one, then the probability that the call will drop is very high.
It should also be noted that, in Lucent systems, if a soft-handoff request is blocked on one carrier, then the network will first attempt to move the entire call to another carrier that is not blocking, a process referred to as handoff escalation. The handoff request is only completely blocked if the sector is blocking on all carries.
Failure Symptoms and Identification Techniques
If this problem is significant enough to result in lost calls, then the affected cell site should also be generating resource blocking counts in service measurements. Also, the sectors with poor lost call performance pointing towards the blocking cell should show a marked increase in dropped calls during these hours of cell resource blocking.
Suggested Fixes for Improvement
The solution to this problem is to solve the cell resource blocking problem. Cell resource blocking can come either in the form of hardware resource blocking or RF resource blocking. Understanding and resolving cell resource blocking is an involved topic in its own right, and is discussed in detail in Sections 3.1.3, 3.1.4 and 3.1.5.
CDMA RF PERFORMANCE ANALYSIS & TROUBLESHOOTING GUIDE
LUCENT TECHNOLOGIES PROPRIETARY 89
3.2.1.2.6 Pilot Polluted Areas
Concept / Reason for Failure
An area is considered “pilot polluted” if the aggregate Active pilot Ec/Io is weak because of significant pilot energy outside of the Active Set because of too many other pilots. Note that the pilot energy outside of the Active Set may also result from a single strong interferer. This is not pilot pollution, but rather some other problem such as neighbor list problems (discussed in Section 3.2.1.2.1) or hardware blocking (Section 3.2.1.2.5).
Failure Symptoms and Identification Techniques
It is difficult to identify pilot polluted areas through service measurements. The mere existence of excessive soft-handoff zones is not necessarily an indication of pilot pollution since these handoff zones could predominantly be comprised of pilots that are all able to participate in the Active Set.
Drive tests would be the most effective ways to identify pilot polluted areas. Some drive test analysis tools such as the Lucent Data Analysis Tool (LDAT3G) have specialized metrics that explicitly indicate pilot polluted areas along the drive route.
Suggested Fixes for Improvement
Once identified, pilot polluted areas may be reduced or eliminated through physical optimization (changes in antenna orientation, downtilt, model etc.) and/or BCR/CBR attenuation changes. Manipulating t_add, t_drop and other handoff parameters may also help marginally resolve pilot pollution by allowing more of these “polluting” pilots to enter into the Active Set. However, it is recommended that the problem is solved at its root through RF optimization, if possible.
3.2.1.2.7 Search Window Problems
Concept / Reason for Failure
In IS95A/B systems, mobiles have five rake receivers, commonly referred to as ‘fingers’. Four of these fingers are used to demodulate up to four best multipaths from the sectors in the Active Set. The fifth rake receiver is known as the Searcher Finger and its primary job is to scan all possible pilots and compare their strengths to the pilots in the Active Set. This information is then reported back to the cell through the Pilot Strength Measurement Message (PSMM), which will then evaluate these results and reconfigure the pilots to be used in the Active Set, if deemed necessary to improve the performance.
CDMA RF PERFORMANCE ANALYSIS & TROUBLESHOOTING GUIDE
LUCENT TECHNOLOGIES PROPRIETARY 90
Due to the vast number of possible pilots (512 / PILOT_INC), each with a spacing of (64 x PILOT_INC) chips22, it will take the Searcher Finger too long to scan through this entire space. Therefore, the searcher is restricted to searching only over a ‘window’ of chips around each pilot, known as the Search Window. This Search Window may be set differentially for pilots in the various sets (Active/Candidate, Neighbor and Remaining Sets).
It is intuitively obvious from the above discussions that if the pilot arrives outside of the Search Window, then this pilot will not be captured and reported by the Searcher, and will therefore never be a candidate to be used in the Active Set. In CDMA systems, due to the fact that all pilots are transmitting over the same frequency, this missed pilot will immediately become a strong interferer. The performance in these locations will degrade significantly and dropped calls may result because of this strong interference.
Failure Symptoms and Identification Techniques
Search window problems may be best captured using drive test data, either by using a pilot scanner or by using the data logged off a mobile. With the pilot scanner, the delays of all the arriving pilots may be directly viewed and analyzed. With the mobile-logged data, the delays of all strong pilots may be extracted from Layer 3 messaging. Note that the mobile-logged data will only give insights to pilots that are approaching the edge of their search windows. If the pilot is completely outside of the search window, then the scanner will be the only way to capture this problem.
Suggested Fixes for Improvement
These window problems may either be resolved by increasing the window sizes or by removing the delayed pilot from the area through optimization. Note that areas of hilly terrain will generally require larger search windows while lower search windows may be used in dense urban environments.
Reference [5] delves into the details of search windows and should be read before attempting to optimize these windows.
3.2.1.2.8 External Interference
Concept / Reason for Failure
External interference in either the forward or reverse links will cause degradations in drop call performance on the carrier that this interference is on. This is because this interference raises the noise floor of the system, requiring the forward or reverse link traffic signals to increase their transmit powers to overcome it. If the interference is significant enough, then the base station or mobile will run out of power and, as a consequence, the performance will degrade.
22 The definition and use of PILOT_INC is discussed under Co-PN Interference later in this section.
CDMA RF PERFORMANCE ANALYSIS & TROUBLESHOOTING GUIDE
LUCENT TECHNOLOGIES PROPRIETARY 91
Failure Symptoms and Identification Techniques
It is usually difficult to establish that external interference is the root cause of observed performance degradations but sometimes service measurements will provide some clues to aid in its discovery.
For example, strong reverse link interference could exhibit high RSSI rise and could even peg significant counts of reverse power overload even though the carried traffic on the reverse link does not justify such high reverse loading.
Another indicator of reverse link external interference could be an abnormally high Reverse Frame Error Rate (RFER), even though the Forward Frame Error Rate (FFER) is within normal ranges. Any true RF or optimization problems in the area should affect RFER and FFER equally.
External interference may be verified by using a spectrum analyzer to scan the affected CDMA carrier. Typical interference will appear as spikes caused by inter-modulation products as well as spurious signals. The source of the interference may be identified by driving around the area and looking for the areas of concentration in the observed interference. Triangulation methods may also be used with multiple analyzers or scanners to track the interference source.
Suggested Fixes for Improvement
The fix would be to remove the stop the source of interference, once identified. Sometimes this would entail contacting the offending party to terminate the transmissions. The biggest challenge is usually to identify the interference source to begin with.
3.2.1.2.9 Co-PN Interference
Concept / Reason for Failure
In CDMA systems, pilots are differentiated by their PN offsets, which are really just time-shifted versions of the same signal. There are 512 possible PN offsets, each being shifted in time by 64 chips (which correspond to approximately 10 miles). The important point to understand about PN offsets is that, since they are just time shifted versions of each other, it is possible for a pilot to appear like it has a different PN offset if it is able to travel far enough and still have sufficient signal strength to be received by the mobiles. If two pilots in an area appear to have the same PN offset with similar signal strengths, then the mobiles will not be able to resolve the two signals.
The process of PN planning is to avoid the potential problems listed above by intelligent assignment of PN offsets to each sector in the system. To further reduce the chances for PN assignment problems, only PN offsets in steps of PILOT_INC are assigned to these sectors, PILOT_INC being a ecp-wide translation parameter. The larger the value of PILOT_INC, the lower the chances that a PN offset will be associated with the wrong sector, since the pilot will
CDMA RF PERFORMANCE ANALYSIS & TROUBLESHOOTING GUIDE
LUCENT TECHNOLOGIES PROPRIETARY 92
have to travel (PILOT_INC * 10 miles) and still be received with sufficient strength to be mistaken for another PN offset.
Co-PN interference could result due to poor PN planning, improper choice of PILOT_INC or inadvertent entry of incorrect PN offsets to sectors in translations. Interference may occur either because the same PN offset was assigned to two sectors that “see” each other in the RF sense, or if a sector assigned to a different PN offset traveled far enough with sufficiently low attenuation to appear mistakenly as the same PN as another sector in the area.
An example of a common oversight is the inappropriate assignments of PN Offsets along water bodies. RF signals are able to travel great distances with relatively low pathloss over water, and therefore, great care must be taken when allocating PN Offsets to all cells that share common water bodies.
Failure Symptoms and Identification Techniques
Identifying the root cause of a problem to be because of Co-PN interference is not straightforward.
One method of identifying Co-PN interference problems is through the examination of the delay spread of the suspected pilot using a pilot scanner. Co-PN interference can be suspected if the delay spread appears too large for the morphology, since this delay spread could actually be a result of two separate sectors transmitting the same PN from very different distances.
Another indicator of Co-PN interference is if the Ec/Io and Receive Power in an area are very good but the FFER performance is extremely poor. These results may be obtained through mobile-logged drive test data. The reason for this is because there is no demodulation performed when measuring Ec/Io, just raw power measurements. This will result in a good Ec/Io and Receive Power being reported. The call however will not be able to be demodulated correctly because of the direct co-PN signal interference, resulting in the poor FFER performance.
Note that neither of these indicators are definite proofs of Co-PN interference. However, they provide good starting points in uncovering this problem.
Suggested Fixes for Improvement
If Co-PN interference is identified, then the solution would either be to reassign the PN offset values of the offending sectors, or to remove the offending sectors from the affected areas through some combination of physical and parameter optimization [15].
CDMA RF PERFORMANCE ANALYSIS & TROUBLESHOOTING GUIDE
LUCENT TECHNOLOGIES PROPRIETARY 93
3.2.1.2.10 Hardware Outages and/or Intermittent Hardware Problems
Concept / Reason for Failure
Sometimes, certain hardware elements in a cell go in and out of service, or remain out of service, potentially causing service-affecting problems such as dropped calls. An example of this would be Packet Pipes (PPs) that go in and out of service, which typically might happen if there are problems with the associated T1 line.
Failure Symptoms and Identification Techniques
These types of intermittent hardware problems are characterized by a sudden degradation in the performance of the KPIs the moment the problem starts happening.
The best way to capture such problems is through using ROP scripts that will be able to log and report all hardware elements that go in and out of service. There are several tools that perform such analysis, one of them being the SPAT tool (Appendix B) which will report all hardware failures that occur throughout the day on a cell-by-cell basis.
Suggested Fixes for Improvement
As this is a cell hardware issue, it is recommended that the customer Operations team is notified of the problem.
3.2.1.2.11 Incorrectly Optimized New Cell
Concept / Reason for Failure
A poorly optimized or malfunctioning new cell that is turned on in an area could also affect the drop call performance in all areas that interact (RF-wise) with this new cell.
Failure Symptoms and Identification Techniques
The clearest sign that the new cell is the cause of the problems is to determine whether the problems suddenly started happening the moment the new cell was turned on.
Note that new cells are typically turned on several times prior to being ‘officially’ turned on by the operator. The cells are turned on for cell integration and usually for optimization as well. Therefore, it is important to have complete information on all of the activity on the new cell to be able to draw clear correlations to the network performance.
This root cause may be confirmed through analysis of drive tests conducted in the area after the new cell site is turned on, and through looking at service measurements for this cell and its neighbors.
CDMA RF PERFORMANCE ANALYSIS & TROUBLESHOOTING GUIDE
LUCENT TECHNOLOGIES PROPRIETARY 94
Suggested Fixes for Improvement
Once it is determined that the new cell has caused the performance degradations, the next step is to isolate the problem with the new cell and fix it. There is a wide variety of problems that could occur, many of them already discussed in the various sections of this document. These problems could be any one of, but not limited to, the following:
• Hardware outages and/or intermittent problems (includes span/PP issues)
• Neighbor list entry problems
• Error in translation parameter entries (PN assignment, etc.)
• Power calibration errors
• Antenna configuration errors or requires optimization
The range of possible problems with new cell sites are too diverse and detailed to discuss in this section. There are however several other sections within this document that deals with each of these potential problems. In particular, the following sections may be referenced:
• Section 3.2.1.2.1 (Poorly Defined Neighbor Lists)
• Section 3.2.1.2.10 (Hardware Outages and/or Intermittent Hardware Problems)
• Section 3.2.1.2.12 (Inadvertent Change of Translations)
3.2.1.2.12 Inadvertent Change of Translations
Concept / Reason for Failure
Sometimes, an accidental change of translations at the switch can have a dramatic negative impact on the performance of sectors/cells in the network. Certainly, some translation parameters have much more of a dramatic effect on performance than others. For example, small changes to t_add and t_drop may only have a moderate effect on drop call performance. On the other hand, if a PN Offset is advertently changes on a sector to be the same as the PN Offset of a neighboring sector, then the performance of the entire area will be drastically worse.
Failure Symptoms and Identification Techniques
These accidental translations changes, if they are serious ones, will typically result in a sudden, severe performance degradation starting the instant the change was made effective at the switch.
Capturing these changes is not always easy because of the sheer number of RF translations that exist. However, efforts should be focused on regularly auditing those translations that are likely to have dramatic performance impacts, such as the PN Offset. It is also effective to use tools that provide quick and convenient reports of all translations that have deviated from
CDMA RF PERFORMANCE ANALYSIS & TROUBLESHOOTING GUIDE
LUCENT TECHNOLOGIES PROPRIETARY 95
Lucent recommendations. The SPAT tool (Appendix B) provides for such a feature. Finally, it should be noted that all changes to translations are captured on a daily basis by the switch and saved in files in the OMP. The login userids are also tagged with these changes. Lucent support center or the Service Provider’s Operations team should be contacted if these files need to be viewed.
Suggested Fixes for Improvement
Once identified, the solution will be to reverse the translation error. Proper documentation should always be maintained for all translation changes to help track root causes of performance problems.
3.2.2 CP Fail Drops
3.2.2.1 Concepts and Optimization Techniques
3.2.2.1.1 General Description
Typically, the largest component of CP Fail Drops are Handoff (HO) Complete Timeouts which refer to calls that are dropped during the process of a handoff.
Important: HO Complete Timeouts occur when a Handoff Direction Message is sent to the mobile directing it to perform a soft or semi-soft handoff but the system does not get a Handoff Completion response from the mobile within a predefined period of time. Thus, by definition, HO Complete Timeouts can only occur after the handoff is accepted by the system. Therefore, situations in which handoffs will not be approved due to lack of resources (CE blocking, power blocking etc.) will not result on HO Complete Timeouts but rather will result in Lost Calls.
In the ROP, CP Fail Drops correspond to all Call Shutdown messages in the Answered Origination and Terminations state. Handoff Complete Timeouts in particular are captured in the ROP as Call Shutdown Type 10 (commonly referred to as CS-[10]). There are also specific peg counts in service measurements that will capture these timeout events.
Most of the Lost Call reasons discussed in Section 3.2.1.1 will also result in CP Fail Drops. However, there are certain conditions that will almost exclusively result in CP Fail Drops, without a corresponding rise in Lost Calls. These special conditions will be the focus of this section.
The most significant of these conditions is the performance of hard and semi-soft handoffs. Both hard and semi-soft handoffs are “break-before-make” handoffs, and will result in handoff complete timeouts if the call fails to successfully execute these handoffs.
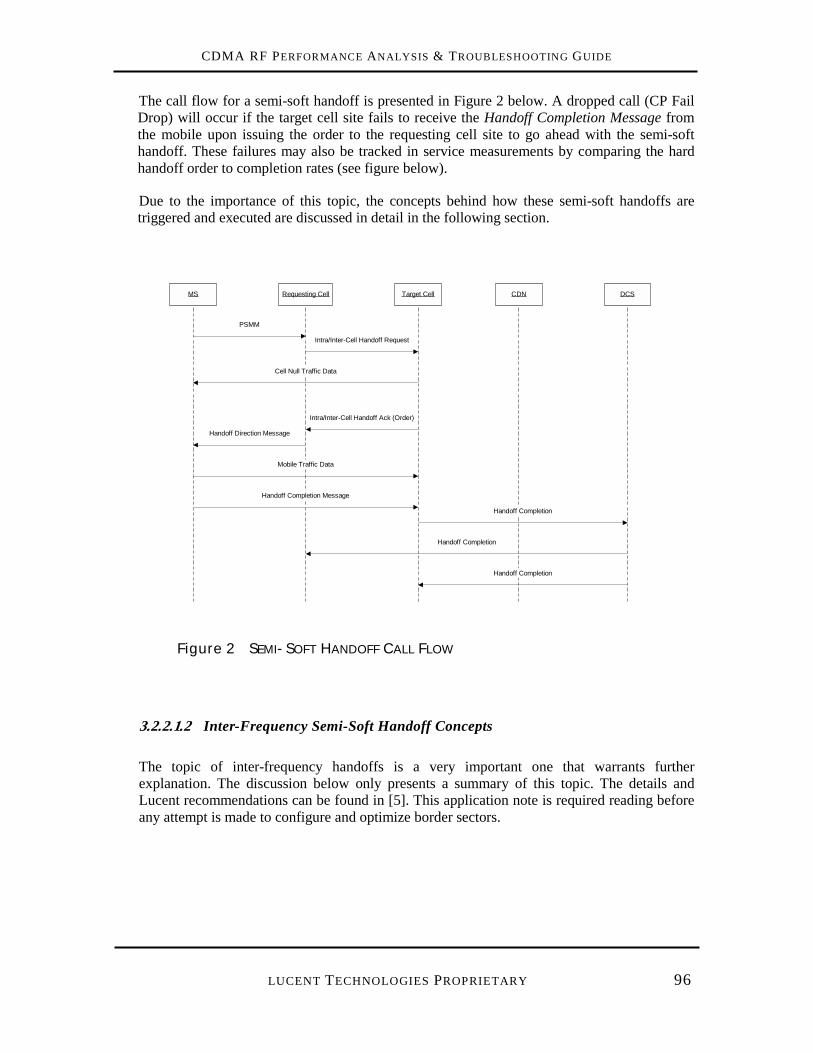
CDMA RF PERFORMANCE ANALYSIS & TROUBLESHOOTING GUIDE
LUCENT TECHNOLOGIES PROPRIETARY 96
The call flow for a semi-soft handoff is presented in Figure 2 below. A dropped call (CP Fail Drop) will occur if the target cell site fails to receive the Handoff Completion Message from the mobile upon issuing the order to the requesting cell site to go ahead with the semi-soft handoff. These failures may also be tracked in service measurements by comparing the hard handoff order to completion rates (see figure below).
Due to the importance of this topic, the concepts behind how these semi-soft handoffs are triggered and executed are discussed in detail in the following section.
Figure 2 SEMI-SOFT HANDOFF CALL FLOW
3.2.2.1.2 Inter-Frequency Semi-Soft Handoff Concepts
The topic of inter-frequency handoffs is a very important one that warrants further explanation. The discussion below only presents a summary of this topic. The details and Lucent recommendations can be found in [5]. This application note is required reading before any attempt is made to configure and optimize border sectors.
MS Requesting Cell
PSMM
Target Cell
Intra/Inter-Cell Handoff Request
Cell Null Traffic Data
Intra/Inter-Cell Handoff Ack (Order)
Handoff Direction Message
Mobile Traffic Data
Handoff Completion Message
CDN DCS
Handoff Completion
Handoff Completion
Handoff Completion
CDMA RF PERFORMANCE ANALYSIS & TROUBLESHOOTING GUIDE
LUCENT TECHNOLOGIES PROPRIETARY 97
There are two distinct phases that relate to inter-frequency handoffs:
1) The first phase triggers the inter-frequency semi-soft handoff using the selected triggering algorithm.
2) Upon receiving a valid trigger, the next phase redirects the mobile to the new carrier, either in simplex mode or in soft-handoff, depending on the option selected. This phase will also determine the choice of pilots to go into simplex or soft-handoff on the new frequency, which must be specified in translations.
For the first phase, there are two forms of triggers for inter-frequency handoffs; directed handoffs (commonly referred to as handdowns) and pilot-assisted handoffs (commonly referred to as handovers).
There are two methods to trigger directed inter-frequency handoffs, namely, the Tr_CHo algorithm and the IFHOTI algorithm. The IFHOTI is an improved mechanism that was introduced in Release 12.0, but the choice is given to use either algorithm.
With the Tr_CHo algorithm, an inter-frequency handoff is directed on a border sector if the following criteria are all met:
1) All the Active Set pilots are border sectors.
2) The call is in either simplex or two-way soft/softer handoff. (Note that the handdown will not take place if the call is in three-way handoff or greater).
3) The Ec/Io of the strongest Active Set pilot is below the CDMA-CDMA Handoff Threshold (c_c_ho_th) threshold that is set in the ecp/ceqface database form.
While this algorithm works pretty well, there are some drawbacks. It is possible for calls to get dragged without handing down because conditions (1) and (2) above are not met. The call may then eventually handdown much later but may then drop the call, since the coverage of border carriers typically extend well beyond their corresponding common carriers’ coverage. Alternatively, the calls may handdown very quickly if the mobile is close to the border carrier, since conditions (1) and (2) are easily met, and condition (3) is also met since the Tr_CHo threshold is typically set to a very high value (default is –4 dB).
IFHOTI improves on the previous algorithm by allowing the mobiles to stay on the border carrier for much longer while maintaining, or even improving, on the handdown reliability. This is achieved through two new triggers called the Border Pilot versus Interior Pilot (BPIP) Threshold (bpinp_comp) and the Border Sector Loss Threshold for Inter-frequency Handoff (Ifho_blos_th) in the ecp/ceqface database form.
The first trigger condition must be met before the second trigger is considered. The first trigger is met when the strongest border pilot is stronger than the strongest interior pilot by the defined threshold. This ensures that the border pilot is the strongest serving sector in the area, thus setting the stage for a reliable handdown. Note that condition (1) in the old algorithm is no longer imposed.
CDMA RF PERFORMANCE ANALYSIS & TROUBLESHOOTING GUIDE
LUCENT TECHNOLOGIES PROPRIETARY 98
When the first trigger is met, the Ec/Io Loss Metric is compared against the Border Sector Loss Threshold for Inter-frequency Handoff trigger. The creation of the Ec/Io Loss Metric was motivated by the fact that handing down on an absolute Ec/Io threshold will make the handdown location dependent on the loading on the network. This is because the Ec/Io experienced at any location is a function of Io which varies with loading even though received Ec remains constant. The Ec/Io Loss Metric comparison will take this loading into effect, thus allowing for the Border Sector Loss Threshold for Inter-frequency Handoff threshold to determine the location of the handdown, rather than this handdown be based off the absolute Ec/Io value. For calls that are in simplex mode just before the handoffs, only the Border Sector Loss Threshold comparison to the Ec/Io Loss Metric is made.
The net effect of using the IFHOTI triggering mechanism is that the border carriers will carry significantly more traffic while maintaining or improving the handdown performance, assuming the triggers are optimized correctly.
The IFHOTI algorithm may be activated on a cell-by-cell basis on the cell2 form. There is a restriction on this algorithm in that the inter-frequency semi-soft handoff will only be directed if the total number of channel elements (CEs) used in the Active Set is less than or equal to 3.
There are also two forms of pilot-assisted inter-frequency handoffs, namely, the T_Comp method (Pilot_Only_T_Comp) and the T_Add method (Pilot_Only_T_Add). The T_Comp method triggers a handover when the border pilot exceeds the strongest Active Set pilot by t_comp (a translatable parameter). With the T_Add method, the handover is triggered when the border pilot crosses an absolute threshold, t_add. The t_add and t_comp parameters are set in the ceqface database form.
It is generally recommended that the directed inter-frequency algorithms be used for all border sectors, and not the pilot-assisted method. The reason for this is that, with the pilot-assisted method, the border pilots will be a major source of interference until the handover actually takes place. This is because the border sectors are transmitting only their pilots on their border carriers, and may only participate in the call upon handing over to the common carriers. This increases the probability that the call will drop even before the inter-frequency handoff has a chance to take place.
Once the inter-frequency handoff is triggered, the next phase involves the network determining the common carrier to go to and the pilots that will serve the call in the Active Set. This is based on the translation entries in two forms, namely, the cdhfl and cdhnl forms.
In addition to other parameters, the cdhnl form contains a neighbor list for every border sector to be used exclusively when performing inter-frequency handoffs. How these entries get used depends on whether the CMPIFHO feature is activated. This feature is commonly referred to as the ‘shotgun’ feature and may also be enabled on a cell-by-cell basis on the cell2 form.
The shotgun feature allows the mobile to enter directly into soft-handoff upon tuning to the new common frequency.
When directed inter-frequency handoffs are used in conjunction with the shotgun feature, up to six of the original border sector’s cdhnl neighbor list entries will be selected as the pilots to be in soft-handoff. If there is more than one border sector in the Active Set, then a neighbor list concatenation algorithm is employed to select the soft-handoff pilots based on the cdhnl
CDMA RF PERFORMANCE ANALYSIS & TROUBLESHOOTING GUIDE
LUCENT TECHNOLOGIES PROPRIETARY 99
neighbor list entries of all the border sectors. The actual number of pilots that can be in soft-handoff is (7 – Total number of CEs utilized in the call prior to semi-soft handoff). The reason for this is because the same speech handler is used before and after the handoff, and the limit on the maximum number of CEs that each speech handler can support is 7. Incidentally, these types of handoffs are called semi-soft handoffs for this very reason, namely, because the inter-frequency handoff uses the same speech handler.
With the pilot-assisted inter-frequency handovers, all the serving pilots in the Active Set as well as all pilots of sufficient strength that are in the Candidate Set will become part of the Active Set in the common carrier after handover, restricted of course to a maximum of 6-way soft/softer-handoff. Note that the call could potentially go into 6-way handoffs with all inter-frequency handoffs regardless of the Maximum Number of Active Set Pilots (maxlegs) translation parameter setting in the ceqface database form.
A very significant point to understand about the pilot-assisted inter-frequency handoffs is that such handovers may happen even on interior sectors that are out of resources to support the call on the carrier it is on, a process referred to as handoff escalation. Therefore, turning on the shotgun feature will improve handover performance of the entire system, especially when capacity and/or hardware problems cause many of these handovers to occur.
A key point about using the shotgun feature is that this feature will only be utilized if every sector that is a candidate to be in soft-handoff has this feature activated in the cell2 form for its associated cell. It is therefore advised to turn on this feature on every cell in the system, as there is every advantage and no disadvantage to having this feature activated.
If the shotgun feature is not activated in a cell, then the call goes into simplex mode on a single pilot in the Active Set upon inter-frequency handoff.
With directed handoffs, the pilot selected to be in simplex mode is the first entry in the cdhnl neighbor list of the strongest border sector when the handoff was triggered. It is therefore usually imperative that the first entry of the cdhnl neighbor list be its own sector to ensure reliable handdowns.
With pilot-assisted handoffs, the pilot selected will be the border pilot itself in the case of the Pilot_Only_T_Comp method and the strongest pilot in the Active Set for the Pilot_Only_T_Add method.
3.2.2.1.3 Optimization Steps for Reducing CP Fail Drops
The suggestions below address the common causes for dropped calls listed above.
• It is very important to manage the inter-frequency handdown and handover performance in the network. To that effect, it is recommended that the following be done:
• In all cases when the rf algorithm is used on border sectors, it is imperative that the IFHOTI algorithm is also employed on those sectors. Section 3.1.1.1.3 describes the carrier assignment algorithms in detail, while the topic on Inter-Frequency Semi-Soft Handoff Concepts in this section discusses the IFHOTI algorithm. Note however that
CDMA RF PERFORMANCE ANALYSIS & TROUBLESHOOTING GUIDE
LUCENT TECHNOLOGIES PROPRIETARY 100
IFHOTI (in conjunction with the shotgun feature) is only effective if properly optimized. Therefore, great care must be taken to populate the cdhnl neighbor list entries, keeping in mind the potential neighbor list concatenations that may occur. Detailed multi-carrier optimization procedures are presented in [16].
Important: Note that a limitation of the IFHOTI algorithm is that, even after all the triggers are met, the semi-soft handoff will finally only be directed if the call is using a maximum of three CEs. Therefore, all border sectors using this algorithm as well as all interior sectors that interact with it must have their maxlegs parameter set to 3, to ensure that the call can at most go into 3-way soft handoff in the border areas.
• All cells should turn on the shotgun feature. There is no disadvantage to turning on this feature and the potential benefits are significant, especially in cases where several unexpected inter-frequency handovers are occurring in the system. The shotgun feature is discussed under the topic on Inter-Frequency Semi-Soft Handoff Concepts earlier in this section (Section 3.2.2.1.2).
• Ensure that the first entry in all cdhnl forms is its own sector. This is especially important when the Tr_Cho algorithm is used for handdowns, as the call will almost certainly drop if this is not the case. The topic on Inter-Frequency Semi-Soft Handoff Concepts previously in this section discusses why this will be the case.
3.2.2.2 CP Fail Causes and Associated Fixes
3.2.2.2.1 Poorly Optimized Border Sectors
Concept / Reason for Failure
As discussed in Section 3.2.2.1, poorly optimized border sectors will result in an increase in CP Fail Drops because of Handoff Completion Timeouts during inter-frequency semi-soft handoffs.
Failure Symptoms and Identification Techniques
If poorly optimized border sectors are truly the root cause of the high CP Fail Drops, then both of the following conditions must be satisfied.
• All sectors exhibiting high CP Fail Drops are also border (handdown) sectors. Border sectors may be easily determined by looking for the existence of the cdhnl and cdhfl entries for these sectors.
• All sectors exhibiting high CP Fail Drops are also exhibiting poor hard handoff order to completion success rates. Figure 2 illustrates how this failure condition results in CP Fail Drops.
CDMA RF PERFORMANCE ANALYSIS & TROUBLESHOOTING GUIDE
LUCENT TECHNOLOGIES PROPRIETARY 101
Suggested Fixes for Improvement
Given below are various suggestions that will help alleviate border sector performance problems.
• Employ IFHOTI to trigger handdowns. The IFHOTI triggers ensure that the handdowns are occurring at predictable locations, increasing the consistency of the handdown performance. The IFHOTI mechanism is discussed in detail in Section 3.2.2.1.2 earlier in this chapter.
• Optimize cdhnl entries. The proper population of these cdhnl entries will require knowledge of the locations of the handdowns as triggered by the IFHOTI mechanism discussed above. This topic is also discussed in Section 3.2.2.1.2, and in [16].
• Eliminate unnecessary border sectors and make them full-traffic. This is especially true with systems that have border sectors that were originally configured using the older Tr_Cho handdown triggering mechanism (see Section 3.2.2.1.2). With this older mechanism, a fairly thick border area needed to be configured because handdowns will only occur when all pilots in the Active Set are border sectors. With the newer IFHOTI algorithm, such a limitation is removed, allowing for a much smaller border area, with almost all interior cells having the ability to be configured as full-traffic sectors.
3.2.2.2.2 Incorrect Management of Cross-Carrier Assignments on Border Sectors
Concept / Reason for Failure
If a border sector is configured to use the rf carrier assignment algorithm, then the IFHOTI algorithm as well as the shotgun feature must accompany it in order to maintain acceptable drop call performance and achieve the desired capacity relief.
If the rf algorithm is used with the older Tr_CHo algorithm, then calls will get assigned to the border carrier. Subsequently, these calls will typically almost immediately hand back down to the common carriers. All inter-frequency handdowns will introduce the possibility of drops, especially if features such as the shotgun feature are not activated.
This is because, without the shotgun feature, calls will start on the new frequency in simplex mode. If that area happens to be a soft-handoff zone, then the possibility exists that the call will drop, due to the high levels of interference, before it had a chance to add these soft-handoff members into the Active Set.
Section 3.1.1.1.3 discusses the carrier assignment algorithms in detail.
CDMA RF PERFORMANCE ANALYSIS & TROUBLESHOOTING GUIDE
LUCENT TECHNOLOGIES PROPRIETARY 102
Failure Symptoms and Identification Techniques
If the incorrect management of cross-carrier assignments is truly the root cause of the high CP Fail Drops, then both of the following conditions must be satisfied.
• All sectors exhibiting high CP Fail Drops are also border (handdown) sectors. Border sectors may be easily determined by looking for the existence of the cdhnl and cdhfl entries for these sectors.
• All sectors exhibiting high CP Fail Drops are also showing cross-carrier assignments. Cross-carrier assignments may be determined to be occurring if these border carriers are displaying call assignments in service measurements. Note that there will be no seizures on these border carriers given the Omit Border Carrier from Channel List Message feature (which is automatically activated on all handdown border sectors without requiring any translation entries). This means that if the border sectors are showing assignments, then this implies that cross-carrier assignments have occurred.
Suggested Fixes for Improvement
The suggested fix is to maximize the semi-soft handoff success rate. Specifically, the following suggestions may be followed.
• Employ IFHOTI to trigger handdowns. The IFHOTI triggers ensure that the handdowns are occurring at predictable locations, increasing the consistency of the handdown performance. The IFHOTI mechanism is discussed in detail in Section 3.2.2.1.2 earlier in this chapter.
• Optimize cdhnl entries. The proper population of these cdhnl entries will require knowledge of the locations of the handdowns as triggered by the IFHOTI mechanism discussed above. This topic is also discussed in Section 3.2.2.1.2.
• Eliminate unnecessary border sectors and make them full-traffic. This is especially true with systems that have border sectors that were originally configured using the older Tr_Cho handdown triggering mechanism (see Section 3.2.2.1.2). With this older mechanism, a fairly thick border area needed to be configured because handdowns will only occur when all pilots in the Active Set are border sectors. With the newer IFHOTI algorithm, such a limitation is removed, allowing for a much smaller border area, with almost all interior cells having the ability to be configured as full-traffic sectors.
3.2.2.2.3 Drops due to Undesired Hard-Handovers
Concept / Reason for Failure
Undesired hard-handovers may result due to sector resource blocking on one carrier, causing all incoming calls to be redirected to another non-blocking carrier on the same sector, a process referred to as handoff escalation. There will always be a risk of drops with any inter-frequency handoff due to potential differences in sector coverage and/or interference levels between the carriers.
CDMA RF PERFORMANCE ANALYSIS & TROUBLESHOOTING GUIDE
LUCENT TECHNOLOGIES PROPRIETARY 103
These handovers may be considered as undesirable because these sectors were never intended to perform such inter-frequency handovers, and therefore were not designed and optimized for this purpose.
Failure Symptoms and Identification Techniques
This root cause may be suspected if high drop call percentages are observed on all sectors that are pointing towards a sector experiencing cell resource blocking on one or more carriers. It can be inferred that inter-frequency handoffs were being attempted if the blocking sectors are pegging handoff overflow counts and/or power overload handoff block counts on one or more, but not all, carriers.
Suggested Fixes for Improvement
The solution to this problem is to solve the cell resource blocking problem. Understanding and resolving cell resource blocking is an involved topic in its own right, and is discussed in detail in Sections 3.1.3, 3.1.4 and 3.1.5.
Note that, in addition to solving the cell resource blocking problem, the shotgun feature should be enabled on every cell in the system. This way, even if these undesired hard handovers happen, the semi-soft handover success rate will be greatly improved. The topic on Inter-Frequency Semi-Soft Handoff Concepts earlier in this section (Section 3.2.2.1.2) discusses the shotgun feature in detail.
3.3 FCH Frame Error Rate
3.3.1 Concepts and Optimization Techniques
As discussed in Section 3, there are three main components to a wireless voice system that will make the customers perceive it to be of high quality, namely, the ability to easily get onto the system to make calls, maintain good voice quality for the duration of the call, and gracefully end the call when done with the conversation.
The previous two KPIs address two of these components, namely, the access to the network and the drop call rate. This current KPI addresses the third component, which is the voice quality during the call.
The frame error rate is defined as the ratio of the number of bad frames received over a period of time to the total number of frames received in that same duration. It is generally accepted that the FER is a good indicator of voice quality in digital wireless systems.
This rate may be measured on both the forward and reverse links as Forward Frame Error Rate (FFER) and Reverse Frame Error Rate (RFER) respectively. Each of these are discussed in detail below.
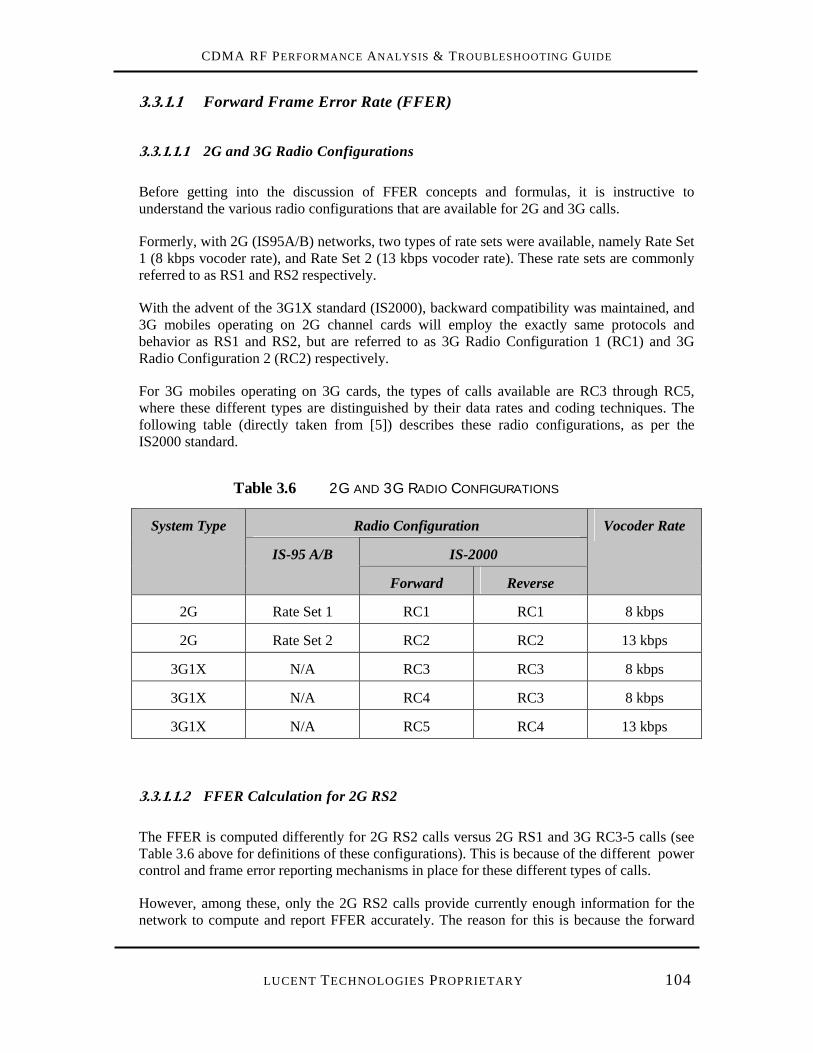
CDMA RF PERFORMANCE ANALYSIS & TROUBLESHOOTING GUIDE
LUCENT TECHNOLOGIES PROPRIETARY 104
3.3.1.1 Forward Frame Error Rate (FFER)
3.3.1.1.1 2G and 3G Radio Configurations
Before getting into the discussion of FFER concepts and formulas, it is instructive to understand the various radio configurations that are available for 2G and 3G calls.
Formerly, with 2G (IS95A/B) networks, two types of rate sets were available, namely Rate Set 1 (8 kbps vocoder rate), and Rate Set 2 (13 kbps vocoder rate). These rate sets are commonly referred to as RS1 and RS2 respectively.
With the advent of the 3G1X standard (IS2000), backward compatibility was maintained, and 3G mobiles operating on 2G channel cards will employ the exactly same protocols and behavior as RS1 and RS2, but are referred to as 3G Radio Configuration 1 (RC1) and 3G Radio Configuration 2 (RC2) respectively.
For 3G mobiles operating on 3G cards, the types of calls available are RC3 through RC5, where these different types are distinguished by their data rates and coding techniques. The following table (directly taken from [5]) describes these radio configurations, as per the IS2000 standard.
Table 3.6 2G AND 3G RADIO CONFIGURATIONS
Radio Configuration
IS-2000
System Type
IS-95 A/B
Forward Reverse
Vocoder Rate
2G Rate Set 1 RC1 RC1 8 kbps
2G Rate Set 2 RC2 RC2 13 kbps
3G1X N/A RC3 RC3 8 kbps
3G1X N/A RC4 RC3 8 kbps
3G1X N/A RC5 RC4 13 kbps
3.3.1.1.2 FFER Calculation for 2G RS2
The FFER is computed differently for 2G RS2 calls versus 2G RS1 and 3G RC3-5 calls (see Table 3.6 above for definitions of these configurations). This is because of the different power control and frame error reporting mechanisms in place for these different types of calls.
However, among these, only the 2G RS2 calls provide currently enough information for the network to compute and report FFER accurately. The reason for this is because the forward
CDMA RF PERFORMANCE ANALYSIS & TROUBLESHOOTING GUIDE
LUCENT TECHNOLOGIES PROPRIETARY 105
power control algorithm employed by 2G RS2 (and equivalently, 3G RC2) calls provides the network with enough information to calculate the FFER precisely. An indicator (called the Erasure Indicator Bit – EIB) is sent with each frame that is sent on the reverse link with information on whether the forward channel frame received two frames back was in error or not. These erasure counts may be summed to provide an exact calculation of the frame error rate in service measurements, since the network will also have precise knowledge of the total number of frames transmitted to all the mobiles.
The RS2 FFER may be therefore be calculated as follows:
100% x dTransmitte Frames FL RS of Number Total
Erasures Frame FL RS of Number FFERRS2
22 =
where FL = Forward Link
SRD-1536 [11] provides a detailed description of the peg counts and equations used to determine this KPI.
In addition, There is sufficient granularity in the returned information from the mobile to also determine the FFER for only full-rate frames. This is important because services such as voice carry all useful information over full-rate frames only and use lower rate frames for quality-insensitive data such as simulated background noise.
The RS2 Full-Rate FFER may therefore be calculated as follows:
100% x dTransmitte Frames FL FullRate RS of Number Total
Erasures Frame FL FullRate RS of Number FFER FullRate RS2
22 =
where FL = Forward Link
With 2G RS1 (and equivalently, 3G RC1) calls however, the forward power control algorithm calls for the mobiles to report frame errors on the forward link using the Layer 3 message Power Measurement Report Message (PMRM). The algorithm used to determine when and what to send on this message is as follows.
The mobile counts the number of forward link frames in error over a predefined number of frames, which may be entered in the translation field Power Control Reporting Frames (pwrrptframes; default = 56 frames or 1.12 seconds). If the number of errors exceed a specific number of frames which is also a translatable parameter Power Report Delay (pwrrptdelay; default = 2 frames), then a PMRM is sent by the mobile to the serving sector with information on the measurement interval and number of frames in error.
Upon sending the PMRM, the mobile waits for a certain number of frames before starting its measurements again. This waiting period is translatable and usually defaulted to 20 frames. Note that there will be no frame error checking by the mobile during this waiting period.
If the number of errors detected during a measurement interval do not exceed the predefined threshold, then the counter and measurement period resets and the process is repeated.
CDMA RF PERFORMANCE ANALYSIS & TROUBLESHOOTING GUIDE
LUCENT TECHNOLOGIES PROPRIETARY 106
The important point to note is that, given this algorithm, it will not be possible for service measurements to calculate the FFER accurately for these calls. This is because forward frame errors that occur during the waiting periods, after PMRM generation, will not get captured and reported back to the base station by the mobile.
Even if this waiting periods are disabled (set to zero), the service measurements are currently not set up to read the exact number of errors reported in these PMRM messages to arrive at an accurate FFER reading.
3.3.1.1.3 FFER Calculation Using PMRM
It is expected that, in future releases, the mechanisms will be in place to generate accurate FFER service measurement peg counts based on these PMRM messages. There will be separate settings for how these messages are generated (waiting period, etc.) for 2G RS1 calls versus calls on other 3G RCs. This is because the 2G RS1 forward power control mechanism is intimately tied to the PMRM mechanism, and so the settings must be handled with care for these types of calls and may need to be set differently from the rest.
Note that 3G calls (RC3 – 5) employ a completely different mechanism for forward power control that relies neither on frame-by-frame indicator bits nor on the PMRM mechanism. They rely instead on a very fast power control mechanism (400-800 Hz, which translates to up to 16 times a frame), where the burden of evaluating the downlink performance and subsequent issuance of forward power adjustment commands are shifted to the mobile. The PMRM mechanism may however always be turned on for these calls in order to facilitate the FFER service measurement counters described above.
3.3.1.1.4 Optimization Steps for FFER
The optimization steps suggested for FFER will be identical to those recommended to manage drop calls (Section 3.2.1). This is because typically most drop calls will be preceded by a period of high FFER. The converse is also true, that is, an area with high FFER will also be an area with a high likelihood for drops.
Therefore, Section 3.2.1 may be referenced for details on optimization recommendations.
CDMA RF PERFORMANCE ANALYSIS & TROUBLESHOOTING GUIDE
LUCENT TECHNOLOGIES PROPRIETARY 107
3.3.1.2 Reverse Frame Error Rate (RFER)
3.3.1.2.1 RFER Calculation
The RFER may always be computed precisely by the network because the information is captured right at the network. All the frames sent by the mobile are captured by the network, which subsequently evaluates whether these frames are received in error or not. The RFER may then be computed.
The RFER may be computed precisely for all rate sets, and may be calculated as follows:
100% x VO Vocoder of Received Frames RL of Number Total
VO Vocoder of Erasures Frame RL of Number RFERVO =
where RL = Reverse Link
VO = Vocoder (13K/8K/EVRC)
Note that it is not possible with the currently available service measurement peg counts to distinguish the frame error rate on just the full-rate frames on the reverse link. This is a significant point for the reverse link for pre-Release 18.0 cells because the different frame rates on the uplink are power controlled to different quality levels, with the full-rate frames being afforded the best quality.
Because of this, the Aggregate RFER on pre-Release 18.0 cells will typically always be worse than the FFER, be it Full-Rate FFER or Aggregate FFER. Aggregate RFER values would be in the order of twice as bad as the Aggregate FFER. The reason for this is explained in greater detail below.
All base stations that are in soft-handoff will receive identical frames from the mobile at any instant in time. Therefore, the network will have to evaluate these frames and select what it perceives to be the best one. This is achieved through a process known as frame selection that is done at the MSC level. The frame selector will select any frame that is received without error, and will only declare the entire frame an erasure if all the frames from the base stations in soft-handoff fail their CRC checks.
Intimately tied to this process is the reverse link power algorithm. There are two main components to this algorithm, namely the open-loop and close-loop algorithm. The open-loop algorithm sets the coarse mobile transmit power purely based on the receive power and some adjustment factors. The closed-loop algorithm further fine-tunes this transmit power based on the real-time reverse Eb/No requirements.
The closed-loop algorithm also consists of two components, namely, the inner-loop and outer-loop algorithms. The inner-loop is between the mobile and each base station involved in soft-handoff. Each base station requests the mobile to either increase or decrease its transmit power based on the desired Eb/No target value, which is called the Eb/No Setpoint. The outer-loop is at the MSC level. This algorithm uses the quality of the link based on after-frame-selection
CDMA RF PERFORMANCE ANALYSIS & TROUBLESHOOTING GUIDE
LUCENT TECHNOLOGIES PROPRIETARY 108
performance to fine-tune the Eb/No Setpoint to be used by all the base stations in the inner-loop.
Important: Another important factor used by the outer-loop in determining the Eb/No Setpoint is the state of the call which is based off the frame rate (full-rate, half-rate, etc.). Full-rate frames on pre-Release 18.0 cells are afforded the highest quality and will therefore warrant the highest Eb/No Setpoint.
This is a very important point to understand when interpreting service measurement counts for RFER. As mentioned above, the reverse link frame error and total counts in service measurements do not differentiate between the rate of the frames. Therefore, the calculated RFER will be an aggregate FER over all rates. This will result in the RFER always looking significantly worse than the Full-Rate FFER values because the forward link power control algorithm has no component to adjust the transmit power uniquely for different forward link frame rates.
Starting with Release 18.0, all reverse link rates are afforded the same quality. Therefore, the Aggregate RFER values will no longer be inflated, and instead should be in-line with the target RFER setting in translations.
3.3.1.2.2 Optimization Steps for RFER
As with FFER, all of the recommendations for optimizing drop call performance (Section 3.2.1) also apply to managing RFER performance. This is because a failure on either the forward or reverse link will result in a dropped call, making all issues pertaining to drop calls relevant to both FFER and RFER.
In addition, there may be failures unique to the reverse link that could result in performance degradations only in that link. These failures are less common and therefore are not addressed in the drop call section but rather will be discussed in the following section.
3.3.1.2.3 Other Poor RFER Causes and Associated Fixes
The following discussion is limited to cases when the RFER is high but the corresponding FFER is within normal ranges. As discussed above, if RFER and FFER have both degraded, then most of the potential causes for dropped calls discussed in Section 3.2 will also apply in this case.
External Interference on Reverse Link Carrier Only
External interference raises the noise floor of the system, requiring the mobiles to increase their transmit powers on the reverse link to overcome it. If the interference is significant enough, then the mobile will run out of power and, as a consequence, the RFER performance will degrade.
CDMA RF PERFORMANCE ANALYSIS & TROUBLESHOOTING GUIDE
LUCENT TECHNOLOGIES PROPRIETARY 109
In addition to high observed RFER, a strong reverse link interference could exhibit high RSSI rise and could even peg significant counts of reverse power overload even though the carried traffic on the reverse link does not justify such high reverse loading.
External interference may be verified by using a spectrum analyzer to scan the affected CDMA uplink carrier. Typical interference will appear as spikes caused by inter-modulation products as well as spurious signals. The source of the interference may be identified by driving around the area and looking for the areas of concentration in the observed interference.
Loss of Reverse Link Diversity
Reverse link diversity gain is a critical component in ensuring good quality on the uplink. A significant hit may be observed in received Eb/No should this gain be diminished, causing the RFER to rise.
The reverse link diversity may be lost either because of antenna assembly problems on one of the receive antennas, or because of faulty hardware related to the diversity branch.
Antenna assembly problems may be especially difficult to identify in cell sites that have an exclusive antenna for receive diversity, as opposed to all antennas being duplexed to transmit additional carriers. The ROP may be used to capture such problems through the DIVIMB error under the REPT:CELL HEH message block.
CDMA RF PERFORMANCE ANALYSIS & TROUBLESHOOTING GUIDE
LUCENT TECHNOLOGIES PROPRIETARY 110
4. HIGH SPEED PACKET DATA (HSPD) - SPECIFIC KPI OPTIMIZATION AND TROUBLESHOOTING
Conceptual Overview of Lucent Implementation of HSPD
With IS2000, two types of channels have been introduced to handle data traffic, namely the Fundamental Channel (FCH) and Supplemental Channel (SCH).
The following section describes key performance indicators that are particular only to data calls. These indicators are all related to the Supplemental Channel (SCH), which are employed exclusively to provide high data rates for packet data calls.
The data call is initially established on the FCH, just like voice. Upon call establishment, data transfers are initially over the FCH at a maximum rate of 9.6 kbps. If the call moves into soft-handoff, then the data is transmitted over all soft-handoff legs on both the forward and reverse links.
If sufficient backlogged data exists, then a SCH is set up to transfer the data at higher rates. One of four possible discrete rates may be assigned. These rates are represented as multiples of 9.6 kbps as follows:
• 2X (19.2 kbps) • 4X (38.4 kbps) • 8X (76.8 kbps) • 16X (153.6 kbps)
The figure below shows how the SCH and FCH channels are utilized for a typical web browsing session. For the forward link, depending on the amount of backlog, measured in bytes at the 5E, and depending on the resources available at the cell, a SCH is set up for a given rate and for a given duration. For the current release, the FCH or the SCH may transmit data on the forward link, but not both simultaneously. To conserve resources and minimize interference, the FCH is torn down after a period of inactivity (e.g. 15 seconds). However, the PPP connection between the mobile and the client (e.g. a laptop with a wireless modem card or data-capable mobile attached to it) and the IWF or PCF/PDSN is maintained.
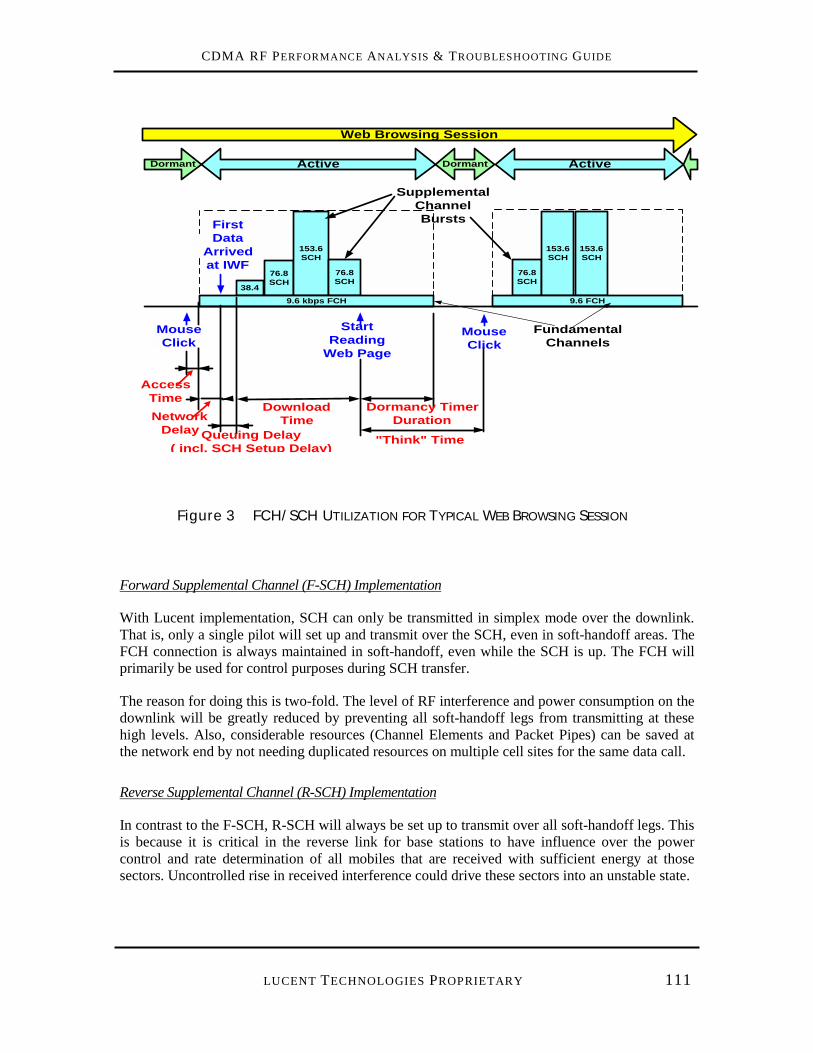
CDMA RF PERFORMANCE ANALYSIS & TROUBLESHOOTING GUIDE
LUCENT TECHNOLOGIES PROPRIETARY 111
Figure 3 FCH/SCH UTILIZATION FOR TYPICAL WEB BROWSING SESSION
Forward Supplemental Channel (F-SCH) Implementation
With Lucent implementation, SCH can only be transmitted in simplex mode over the downlink. That is, only a single pilot will set up and transmit over the SCH, even in soft-handoff areas. The FCH connection is always maintained in soft-handoff, even while the SCH is up. The FCH will primarily be used for control purposes during SCH transfer.
The reason for doing this is two-fold. The level of RF interference and power consumption on the downlink will be greatly reduced by preventing all soft-handoff legs from transmitting at these high levels. Also, considerable resources (Channel Elements and Packet Pipes) can be saved at the network end by not needing duplicated resources on multiple cell sites for the same data call.
Reverse Supplemental Channel (R-SCH) Implementation
In contrast to the F-SCH, R-SCH will always be set up to transmit over all soft-handoff legs. This is because it is critical in the reverse link for base stations to have influence over the power control and rate determination of all mobiles that are received with sufficient energy at those sectors. Uncontrolled rise in received interference could drive these sectors into an unstable state.
38.4
76.8SCH
153.6SCH
SupplementalChannelBursts
AccessTime
76.8SCH
9.6 kbps FCH
76.8SCH
153.6SCH
153.6SCH
9.6 FCH
Web Browsing Session
Active Dormant Active
MouseClick
MouseClick
NetworkDelay Queuing Delay
( incl. SCH Setup Delay)
FirstData
Arrivedat IWF
"Think" Time
Dormancy TimerDuration
DownloadTime
FundamentalChannels
Dormant
StartReading
Web Page
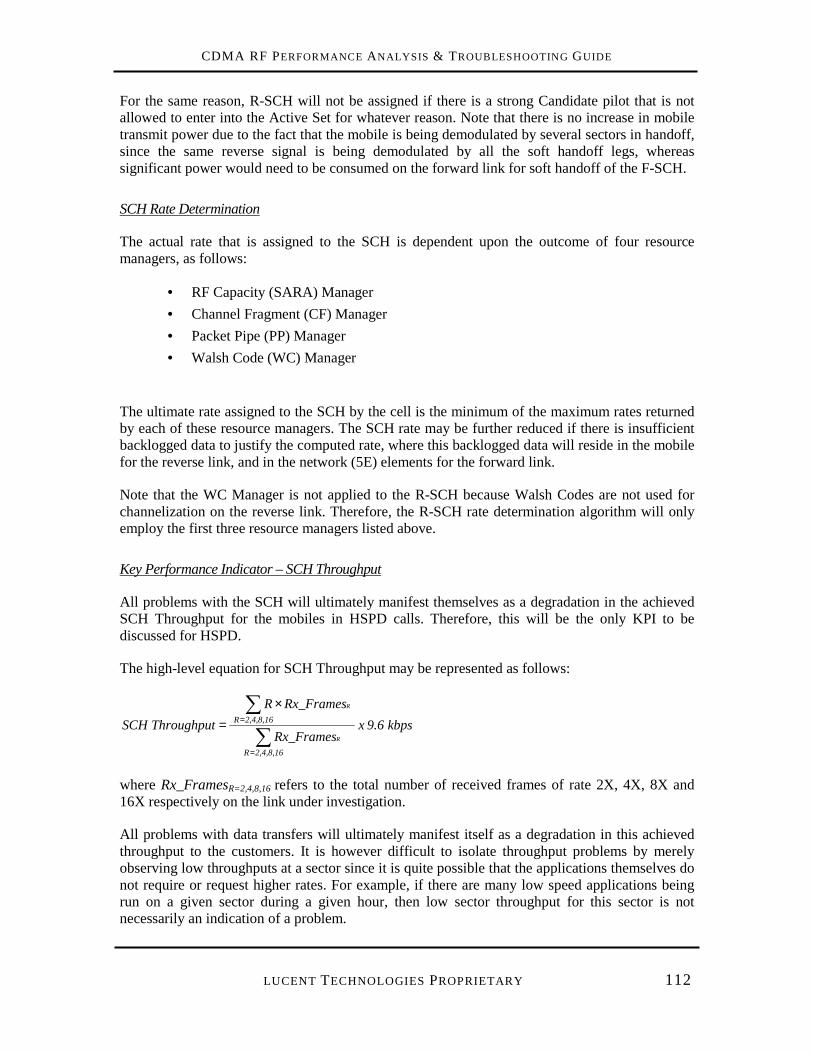
CDMA RF PERFORMANCE ANALYSIS & TROUBLESHOOTING GUIDE
LUCENT TECHNOLOGIES PROPRIETARY 112
For the same reason, R-SCH will not be assigned if there is a strong Candidate pilot that is not allowed to enter into the Active Set for whatever reason. Note that there is no increase in mobile transmit power due to the fact that the mobile is being demodulated by several sectors in handoff, since the same reverse signal is being demodulated by all the soft handoff legs, whereas significant power would need to be consumed on the forward link for soft handoff of the F-SCH.
SCH Rate Determination
The actual rate that is assigned to the SCH is dependent upon the outcome of four resource managers, as follows:
• RF Capacity (SARA) Manager • Channel Fragment (CF) Manager • Packet Pipe (PP) Manager • Walsh Code (WC) Manager
The ultimate rate assigned to the SCH by the cell is the minimum of the maximum rates returned by each of these resource managers. The SCH rate may be further reduced if there is insufficient backlogged data to justify the computed rate, where this backlogged data will reside in the mobile for the reverse link, and in the network (5E) elements for the forward link.
Note that the WC Manager is not applied to the R-SCH because Walsh Codes are not used for channelization on the reverse link. Therefore, the R-SCH rate determination algorithm will only employ the first three resource managers listed above.
Key Performance Indicator – SCH Throughput
All problems with the SCH will ultimately manifest themselves as a degradation in the achieved SCH Throughput for the mobiles in HSPD calls. Therefore, this will be the only KPI to be discussed for HSPD.
The high-level equation for SCH Throughput may be represented as follows:
kbps 9.6 x Rx_Frames
Rx_Frames R Throughput SCH
2,4,8,16R
2,4,8,16R
R
R
∑∑
=
=
×=
where Rx_FramesR=2,4,8,16 refers to the total number of received frames of rate 2X, 4X, 8X and 16X respectively on the link under investigation.
All problems with data transfers will ultimately manifest itself as a degradation in this achieved throughput to the customers. It is however difficult to isolate throughput problems by merely observing low throughputs at a sector since it is quite possible that the applications themselves do not require or request higher rates. For example, if there are many low speed applications being run on a given sector during a given hour, then low sector throughput for this sector is not necessarily an indication of a problem.
CDMA RF PERFORMANCE ANALYSIS & TROUBLESHOOTING GUIDE
LUCENT TECHNOLOGIES PROPRIETARY 113
There may also be other customer-perceived throughput problems that will never get captured through service measurements to begin with. For example, mechanisms that interrupt the SCH high-speed data transfer such as Anchor Transfers and inter-frequency handoffs will not get reflected in the SCH Throughput metric described above.
However, given that there is sufficient backlogged data to send, SCH throughput will deteriorate when either the assigned SCH rate is less than the maximum possible (16X), or when the SCH is not transmitted altogether. Therefore, throughput problems are best tackled by knowing and detecting the existence of all possible failure causes that are known to directly reduce throughput to levels lower than that requested by the applications concerned.
The existence and extent of SCH throughput problems (from an end-use perspective) may therefore be inferred from the presence and magnitude of one or more of the following possible failure causes:
• Supplemental Channel Blocking / Rate Reduction
• Blocking / Rate Reduction due to RF Capacity
• Blocking / Rate Reduction due to Packet Pipe
• Blocking / Rate Reduction due to Channel Fragments
• Blocking / Rate Reduction due to Walsh Codes
• Excessive Anchor Transfers
• 3G!3G Inter-Frequency Handoffs
• 3G!non-3G Handoffs
• Outages and Errors in the Packet Network
Each of these failure causes is discussed in detail in the following sections.
It should be noted that most of the necessary service measurements required to isolate these failures will not be available until Release 19. The topics are still discussed since these problems could still be occurring, even if the service measurements do not exist to capture them.
In this document we concern ourselves mostly with the throughput measured at the RLP (radio link protocol) layer and the IS2000 physical layer, shown in the figure below.
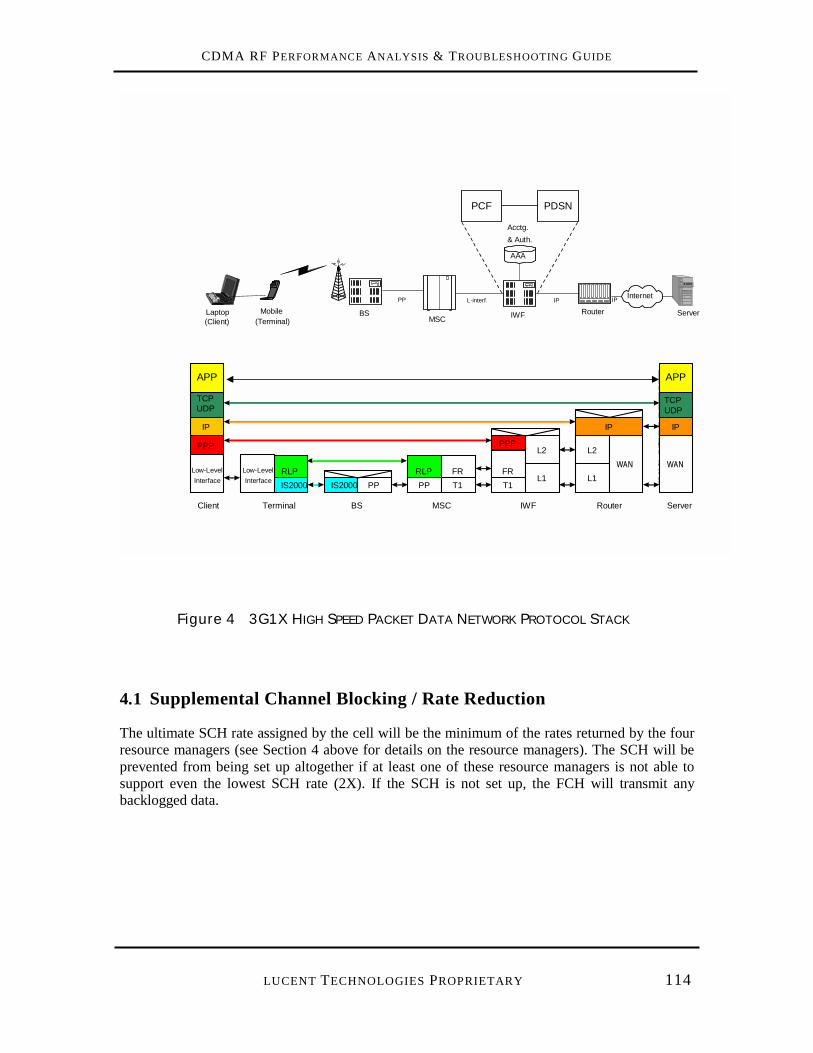
CDMA RF PERFORMANCE ANALYSIS & TROUBLESHOOTING GUIDE
LUCENT TECHNOLOGIES PROPRIETARY 114
Internet
MSCBS IWF RouterLaptop
(Client)
PP L-interf. IP IP
AAA
Acctg.& Auth.
Server
Low-LevelInterface
PPP
IP
TCPUDP
IS2000RLP
PPP
IP
IS2000 PP PPRLP
T1FR
Client Terminal BS MSC
T1FR
L1
L2
IWF
L1
L2WAN
Router
IP
TCPUDP
Server
WAN
Mobile(Terminal)
Low-LevelInterface
APP APP
PCF PDSN
Figure 4 3G1X HIGH SPEED PACKET DATA NETWORK PROTOCOL STACK
4.1 Supplemental Channel Blocking / Rate Reduction
The ultimate SCH rate assigned by the cell will be the minimum of the rates returned by the four resource managers (see Section 4 above for details on the resource managers). The SCH will be prevented from being set up altogether if at least one of these resource managers is not able to support even the lowest SCH rate (2X). If the SCH is not set up, the FCH will transmit any backlogged data.
CDMA RF PERFORMANCE ANALYSIS & TROUBLESHOOTING GUIDE
LUCENT TECHNOLOGIES PROPRIETARY 115
There will therefore be four possible failure categories corresponding to each of these four resource managers, namely:
• Blocking / Rate Reduction due to RF Capacity
• Blocking / Rate Reduction due to PP Blocking
• Blocking / Rate Reduction due to Channel Fragments
• Blocking / Rate Reduction due to Walsh Codes
The following sections examine failure causes and fixes/improvements for each of these categories in detail.
4.1.1 Blocking / Rate Reduction Due to RF Capacity
4.1.1.1 Concepts and Optimization Techniques
This blocking / rate reduction occurs when the RF link is not able to support the requested SCH rate. The primary sector associated with the data call will perform this determination by employing the Supplemental Air Resource Allocation (SARA) algorithm. SARA is operated independently for the forward and reverse links, and will be employed for the setup of each data call on both these links.
4.1.1.1.1 Overview of SARA
The evaluation of the RF link and subsequent rate allocation is administered by the Supplemental Air Resource Allocation (SARA) algorithm. This algorithm is invoked for each data call, and is operated independently for the forward and reverse links.
The Forward SARA (F-SARA) algorithm is applied by the Anchor Sector and primarily uses the following inputs to determine its maximum supportable rate on the forward link:
• Pilot measurements reported on all pilots seen by the mobile using the Pilot Strength Measurement Message (PSMM).
• Available transmit power at the Anchor Sector servicing the data call.
The Reverse SARA (R-SARA) algorithm uses the following inputs:
• RSSI rise on each soft-handoff leg.
• Average reverse pilot Ec/Io of all data calls on each soft-handoff leg (used to determine current loading).
CDMA RF PERFORMANCE ANALYSIS & TROUBLESHOOTING GUIDE
LUCENT TECHNOLOGIES PROPRIETARY 116
For R-SARA, the algorithm is applied on all soft-handoff legs, and the minimum of the maximum rates returned by each of these legs is selected as the final maximum supportable rate on the reverse link.
A detailed discussion of the SARA algorithm is beyond the scope of this document, but in-depth descriptions of this algorithm may be found in [4].
4.1.1.1.2 Forward Link Optimization Techniques
It has been found through optimization trials that the following conditions (in order of priority) most often result in poor maximum rate assignments by F-SARA:
1) Lack of a clear dominant pilot in an area – that is, two or more pilots of approximately equal strength (similar Ec/Io’s).
2) Excessive pathloss.
Therefore, forward-link optimization for F-SARA would involve making sure the above two conditions are minimized, especially in areas of expected significant high-speed traffic. The suggested optimization techniques for each of the two conditions are discussed below.
Creating Pilot Dominance
Creating pilot dominance entails ensuring that a single pilot has sufficiently higher pilot receive power (as measured through Ec/Io measurements) as compared to all other pilots in the area. This can be best achieved through a combination of physical optimization (changes in antenna orientation, downtilt, model etc.) and/or BCR/CBR attenuation changes.
Note that manipulating t_add, t_drop and other handoff parameters will not help create pilot dominance because these parameters only control which pilots are allowed to enter into the Active Set, but do nothing to change the fundamental pilot dominance, or lack thereof.
Minimizing Pathloss
There are several choices for minimizing pathloss by improving coverage problems. They are:
• Perform physical optimization and/or parameter optimization to improve coverage [15]. Physical optimization entails modifications of the antenna azimuths, downtilts and/or antenna models. Parameter optimization is primarily through the manipulation of BCR/CBR attenuation values. There may not always be an option to implement this solution since the antennas may already have been configured for optimal coverage and the attenuation values are at their minimum.
• Add cell site to improve coverage. This would require even more justification that the previous suggestion because of the vastly higher costs associated with this solution. However, if there is a capacity constraint in the area, then it might typically be easier to justify these cell splits.
CDMA RF PERFORMANCE ANALYSIS & TROUBLESHOOTING GUIDE
LUCENT TECHNOLOGIES PROPRIETARY 117
4.1.1.1.3 Reverse Link Optimization Techniques
For the reverse link, the primary conditions that often result in poor rate assignments were found to be the following:
1) Strong Candidate pilot not allowed to enter into the Active Set.
2) Excessive pathloss.
Therefore, reverse-link optimization for R-SARA would similarly involve making sure the above two conditions are minimized. The suggested optimization techniques for each of the two conditions are discussed below.
Ensuring no Strong Candidate Set Pilots Blocked from Entering Active Set
There are two conditions which will result in strong Candidate Set pilots being rejected from entering into the Active Set. These conditions, along with suggestions for fixes, are presented below.
• Neighbor List problems. The network will reject allowing any sector to enter into the Active Set if it does not belong in the neighbor list of at least one of the sectors currently in the Active Set.
The suggested fix is to modify the neighbor list in accordance with the problem detected.
If the problem is with missing neighbor list entries, then these neighbors should be added, with care to make sure the reciprocal neighbors are also added.
Note that there must be discipline exercised when adding neighbors, since sectors with excessively large neighbor lists could perform poorly due to the increased processing requirements. Additionally, given the fact that neighbor lists of sectors in soft-handoff are concatenated, large neighbor lists increases the chances that some neighbors will be dropped in this concatenated list.
The solution in this case will be to perform physical and/or parameter optimization to eliminate the need for the neighbor list entry [15]. This would entail removing that sector from the area through antenna downtilts, azimuth changes, antenna model changes and/or BCR/CBR attenuation changes.
If the problem is with the integrity of the neighbor list, then the appropriate fix should be applied. Given below are important integrity checks that must be performed on neighbor lists. The FCIAlert tool will perform all of the following integrity checks and more, but the most important ones are listed below.
Reciprocity
Reciprocity refers to making sure that if sector A is added to sector B’s neighbor list, then sector B is also in sector A’s neighbor list. With CDMA networks, there is rarely any justification for not satisfying reciprocity rules when populating neighbor lists because all sectors are transmitting on the same frequency.
CDMA RF PERFORMANCE ANALYSIS & TROUBLESHOOTING GUIDE
LUCENT TECHNOLOGIES PROPRIETARY 118
PN Ambiguity Issues
PN ambiguities may come in many forms. No two neighbors on the same neighbor list can have the same PN assignment because this will confuse the network should this PN be reported as a Candidate pilot. A less obvious problem will be when two neighbors share the same PN as a result of neighbor list concatenation. This is commonly referred to as two-way PN ambiguity problems (for any combination of two neighbor lists) up to n-way neighbor list problems (n up to 6). Typically, only two-way PN ambiguity checks are performed.
Cross-Face Neighbors
At a minimum, each sector must have all other sectors in the same cell as neighbors.
• Handoff sector is resource blocking on all carriers. If this is the case, then the Candidate sector will be rejected from entering into the Active Set since that sector will not have any resources to support the traffic channel.
The solution to this problem is to solve the cell resource blocking problem. Cell resource blocking can come either in the form of hardware resource blocking or power resource blocking. Understanding and resolving cell resource blocking is an involved topic in its own right, and is discussed in detail in Sections 3.1.3, 3.1.4 and 3.1.5.
Minimizing Pathloss
There are several choices for minimizing pathloss by improving coverage problems. They are:
• Perform physical optimization and/or parameter optimization to improve coverage [15]. Physical optimization entails modifications of the antenna azimuths, downtilts and/or antenna models. Parameter optimization is primarily through the manipulation of BCR/CBR attenuation values. There may not always be an option to implement this solution since the antennas may already have been configured for optimal coverage and the attenuation values are at their minimum.
• Add cell site to improve coverage. This would require even more justification that the previous suggestion because of the vastly higher costs associated with this solution. However, if there is a capacity constraint in the area, then it might typically be easier to justify these cell splits.
CDMA RF PERFORMANCE ANALYSIS & TROUBLESHOOTING GUIDE
LUCENT TECHNOLOGIES PROPRIETARY 119
4.1.1.2 RF Capacity Related Failure Causes and Suggested Fixes
4.1.1.2.1 Excessive Areas Lacking Pilot Dominance
Concept / Reason for Failure
It has been found that there is a strong correlation between pilot dominance and assigned data rates on the SCH. Poor rates will be assigned when there is a lack of a clear dominant pilot in an area, that is, there are two or more pilots of approximately equal strength (similar Ec/Io’s).
Failure Symptoms and Identification Techniques
Identifying areas lacking pilot dominance is difficult to do with service measurements. However, the Anchor Transfer rate metric could be used to estimate the problem (available with R19). These areas are best captured with drive tests. An area can be considered to lack pilot dominance if there are extended stretches where one or more pilots are very close in Ec/Io to the strongest (dominant) Active Set pilot.
Suggested Fixes for Improvement
The suggested fix is ensure that pilot dominance is achieved in the affected areas. This can be best achieved through a combination of physical optimization (changes in antenna orientation, downtilt, model etc.) and/or BCR/CBR attenuation changes.
Note that manipulating t_add, t_drop and other handoff parameters will not help create pilot dominance because these parameters only control which pilots are allowed to enter into the Active Set, but do nothing to change the fundamental pilot dominance, or lack thereof.
4.1.1.2.2 Excessive Pathloss
Concept / Reason for Failure
Cell sites and/or mobiles will lack the necessary transmit power to achieve the desirable Eb/No at the receiving end should the pathloss be too excessive. Data calls will be even more sensitive to this since these calls will require much higher transmit powers when compared to voice transmissions (proportional to the ratio of the high-speed data rate to the data rate for voice).
Failure Symptoms and Identification Techniques
It is difficult to determine poor RF coverage through service measurements or any other switch-based tools. Typically, the drop call performance will also be poor, but this is
CDMA RF PERFORMANCE ANALYSIS & TROUBLESHOOTING GUIDE
LUCENT TECHNOLOGIES PROPRIETARY 120
inconclusive because there are several other root causes that will result in degradations in both drop call as well as TCCF performance.
The best way to confirm suspected weak coverage areas is through conducting drive tests. Areas of very weak receive power, is an indication of weak coverage. Note that sufficient margin must be added to account for in-building penetration losses in urban areas.
Suggested Fixes for Improvement
There are several choices for minimizing pathloss by improving coverage problems. They are:
• Perform physical optimization and/or parameter optimization to improve coverage [15]. Physical optimization entails modifications of the antenna azimuths, downtilts and/or antenna models. Parameter optimization is primarily through the manipulation of BCR/CBR attenuation values. There may not always be an option to implement this solution since the antennas may already have been configured for optimal coverage and the attenuation values are at their minimum.
• Add cell site to improve coverage. This would require even more justification that the previous suggestion because of the vastly higher costs associated with this solution. However, if there is a capacity constraint in the area, then it might typically be easier to justify these cell splits.
4.1.1.2.3 Neighbor List Problems
Concept / Reason for Failure
On the reverse link, SCH bursts are rejected altogether if there exists a strong Candidate sector that is not allowed to enter into the Active Set. One way in which this can happen is if these Candidate sectors are missing from the neighbor lists of all currently active pilots in the Active Set.
On the forward link, strong Candidate sectors that are not added to the Active Set will result in poor pilot dominance, which, as explained in Section 4.1.1.2.1 above, will result in poor rate assignments.
Failure Symptoms and Identification Techniques
Several switch features exist that will easily trap neighbor list problems. Specifically, both the Handoff Matrix (HOMAX) and the Undeclared Neighbor List (UNL23) features have been very effective in identifying missing neighbor list entries and erroneous priority assignments.
23 Several steps must be followed to enable UNL: 1) The FAF feature 547 must be activated. 2) The Undeclared Neighbor List (unl) translation must be set to y on all sectors of interest on the ceqface form, or switch-wide on the ecp form. 3) The Search Window Size: Remaining Set (srchwinr) translation in the ceqface form must be changed from its recommended value of zero to 7 or greater (preferably at least 9 to ensure all distant interferers are captured).
CDMA RF PERFORMANCE ANALYSIS & TROUBLESHOOTING GUIDE
LUCENT TECHNOLOGIES PROPRIETARY 121
Problems with the neighbor lists may also be captured through integrity and consistency testing of the neighbor list using tools such as FCIAlert. This tool captures a variety of problems such as non-reciprocal neighbors and PN ambiguities within the neighbor list.
The SPAT tool explained in Appendix B may be used to quickly identify sectors exhibiting this problem.
Alternatively, neighbor list problems may also be identified through drive tests. This method however is generally more expensive and less reliable, since it will be difficult to drive all areas of typical usage to capture all neighbor list problems. However, there is little choice but to use drive tests for greenfield (new) deployments, since switch-based neighbor list management tools lack the traffic to make them statistically reliable.
Suggested Fixes for Improvement
The suggested fix is to modify the neighbor list in accordance with the problem detected.
• If the problem is with missing neighbor list entries, then these neighbors should be added, with care to make sure the reciprocal neighbors are also added.
Note that there must be discipline exercised when adding neighbors, since sectors with excessively large neighbor lists could perform poorly due to the increased processing requirements. Additionally, given the fact that neighbor lists of sectors in soft-handoff are concatenated, large neighbor lists increases the chances that some neighbors will be dropped in this concatenated list.
The solution in this case will be to perform physical and/or parameter optimization to eliminate the need for the neighbor list entry [15]. This would entail removing that sector from the area through antenna downtilts, azimuth changes, antenna model changes and/or BCR/CBR attenuation changes.
• If the problem is with the integrity of the neighbor list, then the appropriate fix should be applied. Given below are important integrity checks that must be performed on neighbor lists. The FCIAlert tool will perform all of the following integrity checks and more, but the most important ones are listed below.
Reciprocity
Reciprocity refers to making sure that if sector A is added to sector B’s neighbor list, then sector B is also in sector A’s neighbor list. With CDMA networks, there is rarely any justification for not satisfying reciprocity rules when populating neighbor lists because all sectors are transmitting on the same frequency.
PN Ambiguity Issues
PN ambiguities may come in many forms. No two neighbors on the same neighbor list can have the same PN assignment because this will confuse the network should this PN be reported as a Candidate pilot. A less obvious problem will be when two neighbors share the same PN as a result of neighbor list concatenation. This is commonly referred to as two-way PN ambiguity problems (for any combination of two neighbor lists) up to n-way
CDMA RF PERFORMANCE ANALYSIS & TROUBLESHOOTING GUIDE
LUCENT TECHNOLOGIES PROPRIETARY 122
neighbor list problems (n up to 6). Typically, only two-way PN ambiguity checks are performed.
Cross-Face Neighbors
At a minimum, each sector must have all other sectors in the same cell as neighbors.
4.1.1.2.4 Candidate Sector Resource Blocking
Concept / Reason for Failure
On the reverse link, SCH bursts are rejected altogether if there exists a strong Candidate sector that is not allowed to enter into the Active Set. One way in which this can happen is if these Candidate sectors are missing from the neighbor lists of all currently active pilots in the Active Set, as discussed in Section 4.1.1.2.3 above.
Another way in which this can occur is if the Candidate sector is experiencing resource blocking on all carriers, resulting in the Candidate sector being rejecting from participating in the call since that sector will not have any resources to support the traffic channel.
On the forward link, strong Candidate sectors will result in poor pilot dominance, which, as explained in Section 4.1.1.2.1 above, will result in poor rate assignments.
Failure Symptoms and Identification Techniques
The affected cell site should be generating resource blocking counts in service measurements.
Suggested Fixes for Improvement
The solution to this problem is to solve the cell resource blocking problem. Cell resource blocking can come either in the form of hardware resource blocking or power resource blocking. Understanding and resolving cell resource blocking is an involved topic in its own right, and is discussed in detail in Sections 3.1.3, 3.1.4 and 3.1.5.
CDMA RF PERFORMANCE ANALYSIS & TROUBLESHOOTING GUIDE
LUCENT TECHNOLOGIES PROPRIETARY 123
4.1.2 Blocking / Rate Reduction Due to Packet Pipes
4.1.2.1 Concepts and Optimization Techniques
4.1.2.1.1 Conceptual Overview
Packet Pipes (PPs) refer to the backhaul from the cell sites to the core network (MSC). Usually, these PPs are in the form of DS0 channels in a T1 or E1 line. Each DS0 channel has a bandwidth of either 64 kbps or 56 kbps.
The SCH rate could be reduced or blocked due to lack of packet pipe bandwidth at the cell to backhaul the data back to the MSC. The task of packet pipe provisioning is complicated by the fact that every service class of calls requires a different amount of packet pipe bandwidth to support it. Examples of service classes include 2G EVRC Voice, 2G 13k Voice, 3G EVRC Voice, 3G 13k Voice, 2G Circuit Data, 3G Packet Data, etc.
Therefore, packet pipes need to be provisioned based on some expected distribution of these service classes, and blocking may occur if the cell ends up supporting more high-bandwidth services than originally anticipated.
There are two important variables in PP provisioning that must first be understood before being able to allocate the appropriate bandwidth. They are the Packet Pipe Capacity Unit (PPCU) and the Packet Pipe Loading Coefficient (PPLC).
One PPCU is defined as the PP capacity required to service one 2G Rate Set 1 (8 kbps or EVRC) call. In other words, if 1 DS0 were to have a capacity of 3 PPCU, this is the same as saying that single DS0 will be able to support 3 2G Rate Set 1 calls.
The PPLC defines the number of PPCUs required to support a single call of any other service class.
As an example, a 2G Rate Set 2 (13 kbps) voice call has PPLC = 1.35 for a cell site provisioned with 8 DS0s, and that 8 DS0s have a joint capacity of 42 PPCU (see Table 4.1 below). This means that this cell can either support a total of 42 Rate Set 1 calls or 31 Rate Set 2 calls (42/1.35=31), or some combination in between that adds up to no more that 42 PPCU.
To illustrate the last point, say there are 30 Rate Set 1 calls and 8 Rate Set 2 calls requesting service at that site. The 30 Rate Set 1 calls will require a capacity of 30 PPCU. The 8 Rate Set 2 calls will require a capacity of (1.35 × 8 = 10.8) PPCU. This gives a total of 40.8 PPCU, which will be supported by the 8 DS0s above. The 9th Rate Set 2 call requesting service will require an additional 1.35 PPCU, which will bring the total PPCU requirement to (40.8+1.35=42.15) PPCU. This is greater than the 42 PPCU limit of the cell, and therefore the cell will deny access to this 9th Rate Set 2 call. There will be efficiencies gained when supporting multiple calls. Therefore, the PPLCs for the various service classes are a function of the total DS0s being provisioned at the cell.
CDMA RF PERFORMANCE ANALYSIS & TROUBLESHOOTING GUIDE
LUCENT TECHNOLOGIES PROPRIETARY 124
4.1.2.1.2 Important Lucent Features
There are a couple of Lucent FAF features that will enable better utilization of the packet pipes. In other words, these FAF features increase the PPCU capacity per DS0. The two features are:
1) Packet Pipe Optimization (PPOPT) [9].
2) Backhaul Engineering Enhancement [10].
Once the FAF features are loaded, these two features must be activated at a cell level on the cell2 form. There is every advantage, and no disadvantage, to turning on these features, so this must be done on every cell site. Note that these FAF features also affect the PPLC values.
Another feature that should be activated on every cell is the PP16 feature. This feature allows for finer granularity in DS0 assignments to cell sites, and also increases the total number of DS0s that can be allocated to a CCC or CDM.
All of these features in combination will reduce the total number of T1s required for the backhaul, which is usually of critical importance to the customers because these backhaul costs are recurring costs that constitute a significant portion of the network maintenance expenses.
4.1.2.1.3 Packet Pipe Provisioning Strategies
The first step in determining the PP bandwidth to allocate to a cell is to first understand the capacity offered for the various service classes based on the number of DS0s provided. As discussed in Section 4.1.2.1.1 above, this may be computed by knowing the PPLC values for each of the service classes, coupled with the PPCU capacity of the PPs. As discussed, this PPCU capacity is a function of the activated FAF features discussed in Section 4.1.2.1.2.
Table 4.1 below presents an example of the capacity for the various service classes given that the PP16, PPOPT and Backhaul Engineering Enhancement features are activated.
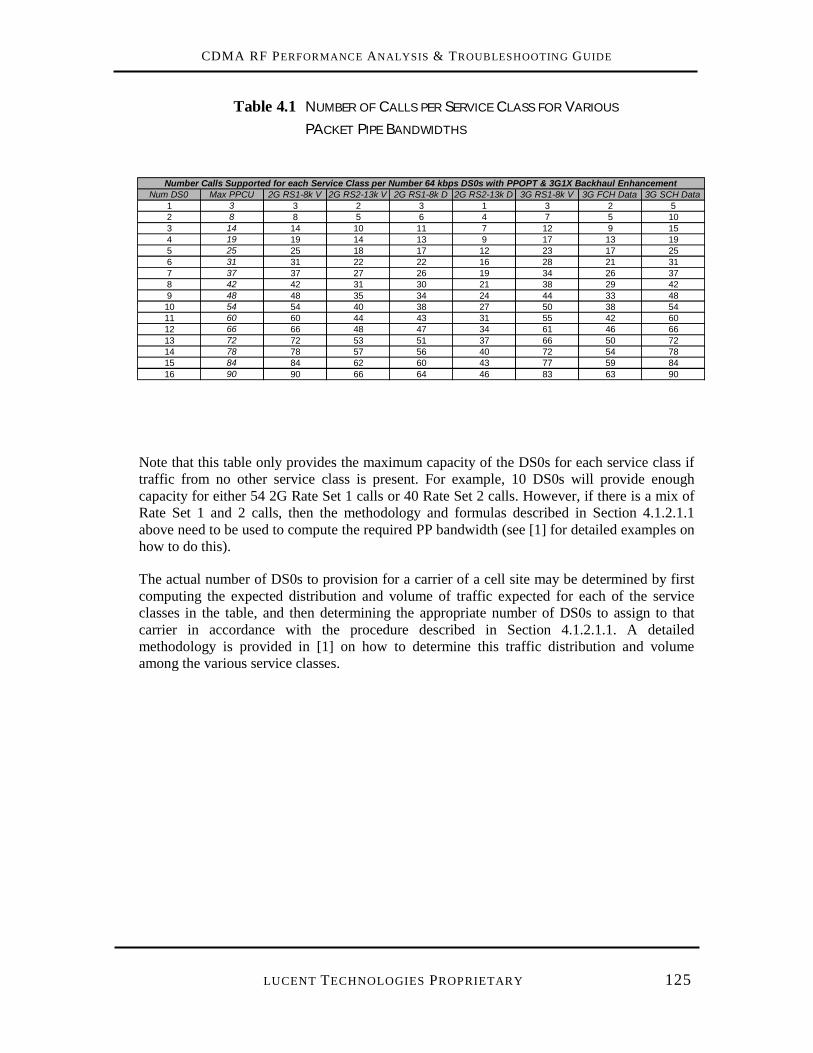
CDMA RF PERFORMANCE ANALYSIS & TROUBLESHOOTING GUIDE
LUCENT TECHNOLOGIES PROPRIETARY 125
Table 4.1 NUMBER OF CALLS PER SERVICE CLASS FOR VARIOUS PACKET PIPE BANDWIDTHS
Note that this table only provides the maximum capacity of the DS0s for each service class if traffic from no other service class is present. For example, 10 DS0s will provide enough capacity for either 54 2G Rate Set 1 calls or 40 Rate Set 2 calls. However, if there is a mix of Rate Set 1 and 2 calls, then the methodology and formulas described in Section 4.1.2.1.1 above need to be used to compute the required PP bandwidth (see [1] for detailed examples on how to do this).
The actual number of DS0s to provision for a carrier of a cell site may be determined by first computing the expected distribution and volume of traffic expected for each of the service classes in the table, and then determining the appropriate number of DS0s to assign to that carrier in accordance with the procedure described in Section 4.1.2.1.1. A detailed methodology is provided in [1] on how to determine this traffic distribution and volume among the various service classes.
Num DS0 Max PPCU 2G RS1-8k V 2G RS2-13k V 2G RS1-8k D 2G RS2-13k D 3G RS1-8k V 3G FCH Data 3G SCH Data1 3 3 2 3 1 3 2 52 8 8 5 6 4 7 5 103 14 14 10 11 7 12 9 154 19 19 14 13 9 17 13 195 25 25 18 17 12 23 17 256 31 31 22 22 16 28 21 317 37 37 27 26 19 34 26 378 42 42 31 30 21 38 29 429 48 48 35 34 24 44 33 4810 54 54 40 38 27 50 38 5411 60 60 44 43 31 55 42 6012 66 66 48 47 34 61 46 6613 72 72 53 51 37 66 50 7214 78 78 57 56 40 72 54 7815 84 84 62 60 43 77 59 8416 90 90 66 64 46 83 63 90
Number Calls Supported for each Service Class per Number 64 kbps DS0s with PPOPT & 3G1X Backhaul Enhancement
CDMA RF PERFORMANCE ANALYSIS & TROUBLESHOOTING GUIDE
LUCENT TECHNOLOGIES PROPRIETARY 126
4.1.2.2 PP Blocking / Rate Reduction Causes and Associated Fixes
4.1.2.2.1 Blocking / Rate Reduction due to Insufficient PP Provisioning
Concept / Reason for Failure
A cell site will reject SCH assignments if it is out of Packet Pipe bandwidth to support the backhaul of traffic for these data calls.
Failure Symptoms and Identification Techniques
• Service measurement peg counts indicate presence of PP blocking/rate reduction on SCH (only available with Release 19).
• ROP indicates no hardware outages during hours of blocking / rate reduction. An important caveat to this approach is that hardware outages are only logged in the ROP the moment they occur. Therefore, it is possible that hardware elements may be out of service but still not register on the ROP during the hours of resource blocking because these outages actually occurred earlier.
Suggested Fixes for Improvement
Once it is determined that the problem is truly due to an authentic shortage of equipped resources, packet pipes may be added to resolve the problem. Care should be taken to add these resources equally on all carriers, and to document the additions for proper cell resource management.
An alternate solution would be to offload traffic from the blocking sector as per the suggestions in Section 3.1.3.1.4 on CE/PP Resource Blocking Management Techniques.
Note that some service providers may desire to maintain some marginal level of cell resource blocking so that cell sites are not over-engineered to cater to peak traffic utilizations. The market guidelines should be followed in requesting these cell resource additions.
4.1.2.2.2 Blocking / Rate Reduction due to Span Outage
Concept / Reason for Failure
A cell site will reject SCH assignments if it is out of Packet Pipe bandwidth to support the backhaul of traffic for these data calls. This can occur when either the cell is authentically out of packet pipe resources (Section 4.1.2.2.1 above), or if span outages at the cell render several packet pipes out of service.
CDMA RF PERFORMANCE ANALYSIS & TROUBLESHOOTING GUIDE
LUCENT TECHNOLOGIES PROPRIETARY 127
Failure Symptoms and Identification Techniques
Hardware outages may be viewed on the ECP Control & Display page (commonly referred to as the ‘cartoon’ page) and may also be captured in the ROP as HEH messages. Due to the magnitude of ROP file sizes, they are best analyzed using filtering scripts. Many such scripts exist, an example being the SPAT tool which has a component to perform such analysis (Appendix B provides an overview of this tool).
Suggested Fixes for Improvement
As this is a cell hardware issue, it is recommended that the customer Operations team is notified of the problem.
4.1.3 Blocking / Rate Reduction Due to Channel Fragments
4.1.3.1 Concepts and Optimization Techniques
The SCH rate could be reduced or blocked because of insufficient SCH Channel Fragments available to support the requested rate. With 3G, new channel cards are introduced that have logical channel elements called channel fragments (CFs). One block of CFs are allocated to the SCH alone, and may not be used by calls requiring FCH CFs, and vice versa.
CF provisioning requires the correct allocation of FCH and SCH CFs to each carrier to support the anticipated traffic for both types of channels. Note that even if the CFs are installed at the cell, they can only be used to support actual traffic if they also have the necessary packet pipe bandwidth required to support the service class of the call that they are servicing. Therefore, the process of CF provisioning is intimately tied to the process of Packet Pipe provisioning discussed above.
4.1.3.1.1 Overview of 3G Channel Cards
With the advent of 3G, new channel cards have been introduced to handle the variety of service classes that can be supported on Lucent systems. These new channel cards for 3G1X comes in two forms:
• ECU-32 cards – for Series II cells.
• CCU-32 cards – for Flexent cells.
As mentioned above, these cards no longer carry physical channel elements, but rather are comprised of logical channel elements called Channel Fragments (CFs). Each ECU/CCU-32 supports the following CFs:
CDMA RF PERFORMANCE ANALYSIS & TROUBLESHOOTING GUIDE
LUCENT TECHNOLOGIES PROPRIETARY 128
- 32 Forward FCH CFs (Supports F-FCH, Paging, Quick Paging and Pilot channels).
- 3224 Forward SCH CFs (Supports F-SCH and Sync channels).
- 32 Reverse FCH/SCH CFs (Supports R-FCH, R-SCH and Access channels).
Each of the FCH CFs can support any one of the following service classes:
- Forward / Reverse 13 kbps voice
- Forward / Reverse EVRC (8 kbps) voice
- Forward / Reverse 2G Circuit Data at 9.6 kbps
- Forward / Reverse 3G Packet Data at 9.6 kbps
Each Forward SCH (F-SCH) CF supports forward supplemental channel data at 9.6 kbps (16 CFs needed to support 16X rate of 153.6 kbps). Each Reverse SCH (R-SCH) supports reverse supplemental data at 19.2 kbps (8 CFs required to support 16X rate of 153.6 kbps).
Any single carrier may have a mix of 2G and 3G1X cards installed. The only restriction is that, for Series II cells, a single CCC may not contain a mix of these cards, but different CCCs on the same carrier may carry any combination of 2G and 3G1X cards. A carrier with only 2G cards installed is commonly referred to as a 2G carrier, and likewise for 3G carriers that are only installed with 3G cards. Any carrier with a mix of 2G and 3G1X cards installed is commonly referred to as a 2G/3G1X mixed carrier.
A minimum of 5 overhead CFs are reserved per sector per carrier (15 in total for a 3-sectored cell per carrier) – 4 forward overhead CFs for pilot, sync, paging and quick paging, 1 reverse overhead CF for access. This is in contrast to only 2 overhead channel elements reserved for overheads in 2G systems – 1 for pilot, sync and access, 1 for paging. For 2G/3G1X mixed carriers, all overhead channels are assigned to the 3G1X CFs.
4.1.3.1.2 CF Provisioning Strategies
The introduction of 3G services adds several complexities to the process of CF provisioning at cell sites. In particular, the following factors should be considered in the decision process:
• The distribution of 2G versus 3G channel cards at a cell site should match the expected traffic distribution of the respective services.
• The channel cards should be allocated between carriers in accordance to the chosen strategy for the market – either all carriers are configured as 2G/3G1X mixed carriers, or selected carriers are chosen for 2G versus 3G.
• Care should be taken to ensure sufficient SCH CFs are installed to support the expected high-speed data traffic. While voice services of any rate (8k/13k etc.) will only take a single forward and reverse FCH CF, high-speed data services would take multiple SCH
24 Typical maximum supported SCH CFs are 32 with Release 18. Larger number of FCH and SCH CFs will be supported with the CCU-64 cards that will be available with Release 19.
CDMA RF PERFORMANCE ANALYSIS & TROUBLESHOOTING GUIDE
LUCENT TECHNOLOGIES PROPRIETARY 129
CFs per call. Also, for the reverse link, 32 CFs are shared among both FCH and SCH. Therefore, this should be carefully accounted for when provisioning the CFs.
With the early stages of 3G deployment, it is not anticipated that there will be significant 3G traffic due to the low penetration of 3G mobiles as compared to 2G mobiles. Therefore, it is recommended that only minimal 3G channel cards are deployed on most cells, and that all carriers should be configured as mixed carriers. This is because it is unlikely that there will be sufficient 3G traffic to justify a dedicated carrier for 3G.
As 3G penetration increases, there will come a time when it will be justified to configure entire carriers as 3G-only to maximize the carried capacity based on 3G enhancements, as well as to provide maximum capacity to support high-speed data calls.
When selected carriers are configured as 3G-only, and others as 2G-only or 2G/3G1X mixed carriers, it will become important to ensure that all 3G calls are placed on 3G cards, if possible, and similarly, all 2G calls on 2G cards. This is to ensure that the potential 3G capacity improvements are not wasted because 2G calls are placed on these 3G cards, resulting in those calls operating in 2G mode.
There are two important concepts related to ensuring that the above appropriate allocation of calls by technology are performed, namely, the Allow Sharing 3G1X Carrier and 2G/3G Load Preference Deltas features. These concepts are discussed in the next section below.
4.1.3.1.3 Assigning Calls to Appropriate Channel Cards by Technology
As discussed in the previous section, there are two important concepts that work hand-in-hand to ensure that incoming 2G and 3G calls are assigned to their respective channel cards respectively to ensure that the 3G cards are used to their full potential. These two features are the Allow Sharing 3G1X Carrier and 2G/3G Load Preference Deltas features.
3G mobiles will only hash onto 3G carriers and 2G/3G1X mixed carriers25 (see Section 4.1.3.1 for descriptions on how these carriers are defined). Similarly, 2G mobiles will only hash onto 2G and 2G/3G1X carriers. However, if the Allow Sharing 3G1X Carrier is enabled on a 3G carrier, then 2G mobiles are also allowed to hash onto the 3G carrier.
The reason for having this translation is to allow the flexibility to either segregate 2G and 3G calls entirely onto their own carriers, or to allow at least the 2G mobiles to hash across all carriers, regardless of technology. The latter is the preferred approach with early 3G deployments, since it is unlikely that there will be enough 3G traffic dedicating an entire carrier to 3G calls, even if this carrier is populated completely with 3G cards.
In such a scenario, if the Allow Sharing 3G1X Carrier (share_3g1x in the ceqface3g form) is not enabled, then 2G mobiles will never hash onto these 3G carriers, but will likely have many
25 The exception to this rule is if all of the carriers in the cell site are 2G carriers. In this case, 3G mobiles will hash onto one of these 2G carriers.
CDMA RF PERFORMANCE ANALYSIS & TROUBLESHOOTING GUIDE
LUCENT TECHNOLOGIES PROPRIETARY 130
assignments to these carriers if rf load balancing is turned on (since there will be typically lower traffic on these carriers due to lack of 3G traffic). Therefore, there will be an undue number of cross-carrier assignments, greatly increasing the risk of cross-carrier TCCFs.
The 2G Load Preference Delta (ld_prf_dlta_2g in the ceqface3g form) and 3G Load Preference Delta (ld_prf_dlta_3g1x in the ceqface3g form) translations serve to bias the RF Loading Weight Factor (tca_weight in the ecp/ceqface form) in such a way that it favors the 2G calls to get assigned to 2G carriers, and 3G calls to 3G carriers. If a 3G call hashes onto a 2G carrier, then the loading on all other 3G carriers on that sector are lowered by the 3G Load Preference Delta in order to make them more attractive for assignment to this 3G call. If that 3G call hashes onto a 3G carrier, then this 3G Load Preference Delta gets applied to itself, making it more attractive for the 3G call to stay on that same 3G carrier. The same logic applies to the 2G Load Preference Deltas.
This concept is best explained with an example. Say that a cell is configured with two carriers, the first (F1) being a 2G/3G1X mixed carrier with current RF loading at 50%, and the second (F2) being a 3G-only carrier with current RF loading at 25%. Also assume that the RF Loading Weight Factor is set to 20%, 2G Load Preference Delta is set to 30%, 3G Load Preference Delta is set to 40% and Allow Sharing 3G1X Carrier is set to y on all carriers.
Based on this configuration, the following scenarios describe various examples of how these translations get applied to determine the assigned carrier.
Scenario 1: 2G mobile originates on F1
In this case, for the purposes of the carrier assignment algorithm, F1 Loading = 50-20-30 = 0 (20% RF Loading Weight Factor since this is the originating carrier, and 30% 2G Load Preference Delta since this carrier has 2G) and F2 Loading = 25 (2G Load Preference Delta will not get applied for this carrier since it is 3G-only). Therefore, the call will be assigned to F1, even though it is carrying significantly more traffic.
Scenario 2: 2G mobile originates on F2
In this case, F1 Loading = 50-30 = 20 and F2 Loading = 25-20 = 5. Therefore, the call will be assigned to F2. Here, the 2G delta is not large enough to overcome the load factor and the fact that F2 is carrying much less traffic.
Scenario 3: 3G mobile originates on F1
In this case, F1 Loading = 50-20-40 = -10 and F2 Loading = 25-40=-15. Therefore, the call will be assigned to F2. Note that the 3G deltas cancel out since both carriers support 3G, leaving only the load factor to decide the outcome.
CDMA RF PERFORMANCE ANALYSIS & TROUBLESHOOTING GUIDE
LUCENT TECHNOLOGIES PROPRIETARY 131
4.1.3.2 CF Blocking / Rate Reduction Failure Causes and Fixes
4.1.3.2.1 Blocking / Rate Reduction because no FCH available
Concept / Reason for Failure
There are two possible scenarios under which such a failure can happen:
1) There are no FCHs available when all assigned calls on them are 3G calls.
2) There are no FCHs available, but some of the existing calls on these 3G FCHs are actually 2G calls.
Both of these scenarios will be discussed below.
Failure Symptoms and Identification Techniques
For both cases, the cell site will peg CF/PP blocking, without corresponding PP blocking counts (meaning that the blocking on the FCH was due to lack of Channel Fragments).
However, there are no direct peg counts available or planned that will be able to isolate clearly which of the two scenarios is actually happening. There are peg counts that will count occurrences of technology cross-assignments, that is, 2G calls assigned to 3G cards and vice versa. There are also peg counts available that capture the peak CF usage. In some cases, these two sets of peg counts may be correlated to arrive at which of the above scenarios is actually occurring.
Suggested Fixes for Improvement
If the 3G data calls are being blocked because 2G calls are being assigned on 3G cards, then the load preference deltas (as discussed in Section 4.1.3.1.1 above) must be revisited and modified to ensure that the 3G cards are reserved for 3G calls.
If all calls on the 3G cards are 3G calls, then more 3G cards need to be added to the cell, with the appropriate additions to the Packet Pipe bandwidth (Section 4.1.2.1).
CDMA RF PERFORMANCE ANALYSIS & TROUBLESHOOTING GUIDE
LUCENT TECHNOLOGIES PROPRIETARY 132
4.1.3.2.2 Blocking / Rate Reduction because no SCH available
Concept / Reason for Failure
Data rates will be reduced, or blocked entirely, if no SCHs are available to handle the requested data rates.
Failure Symptoms and Identification Techniques
The occurrences of this failure type may be directly pegged with Release 19 peg counts. Until then, there will be no effective way to capture these events.
Suggested Fixes for Improvement
The fix would be to either add SCH channel fragments to the cell site, or offload traffic to neighboring sectors to reduce the consumed channel fragments, if possible. Note that SCH channel fragments cannot be added independently, and must instead be added through adding ECU/CCU-32 cards.
4.1.4 Blocking / Rate Reduction Due to Walsh Codes
4.1.4.1 Concepts and Optimization Techniques
The SCH rate could be reduced or blocked if there are insufficient Walsh Codes at the sector to allocate to the call. While Walsh Code shortage was rarely an issue in the past with purely voice services, it may be of significant concern as the volume of data calls increases on each sector.
This is because higher data rates will require Walsh Codes of shorter lengths, which will automatically discount several other Walsh Codes of larger lengths that are associated with those shorter length Walsh Codes. This concept is described in more detail below.
4.1.4.1.1 Overview of Variable Walsh Spreading Factors
In CDMA systems, a set of orthogonal Walsh Codes are used to channelize the forward link traffic channels. Walsh Codes are represented by their length (number of bits comprising the code) and their function (which refers to a specific code or row among the various possible codes). The nomenclature used is Wn
l. For example, W3264 refers to the 32nd function (that is,
the 32nd code or row) of the set of 64-length Walsh codes.
The IS95 (2G) standard employed Walsh Codes of length 64, with pre-defined functions used for overhead channels. For example, the Pilot channel is always allocated W0
64 and the Sync channel is always allocated W32
64.
CDMA RF PERFORMANCE ANALYSIS & TROUBLESHOOTING GUIDE
LUCENT TECHNOLOGIES PROPRIETARY 133
With 3G, the concept of Variable Walsh Spreading Factors (VWSF) is introduced to support high-speed data transmissions. The reason for introducing this may be understood by examining the following relationship:
Chip Rate = Baseband Symbol Rate × Walsh Code Length
Therefore, given that the chip rate is maintained at 1.2288 Mchips/sec for all baseband rates, therefore the Walsh Code lengths must therefore be modified in inverse proportion to these baseband data rates.
4.1.4.1.2 Concept of Walsh Code Blocking
Walsh Code blocking occurs when the sector runs out of Walsh Codes to assign to a mobile for a forward link data transfer or voice call.
With 2G systems, this simply meant that there are no more functions (or codes) available for traffic from the 64-length Walsh Codes. This was a fairly unlikely scenario in 2G networks because the RF link usually will run out of capacity before this Walsh Code limitation26 is reached. Therefore, this category of blocking was largely overlooked in 2G networks.
With 3G networks however, the assignment of variable length Walsh Codes significantly increases the chances that the sector will run out of Walsh Codes if there are even a few high-speed data calls in session.
The following figure illustrates the concept of this blocking when RC3 is used..
26 The maximum number of Walsh codes in 2G networks is 55 = 64-7 (reserved for paging) –1 (reserved for sync) – 1 (reserved for pilot).
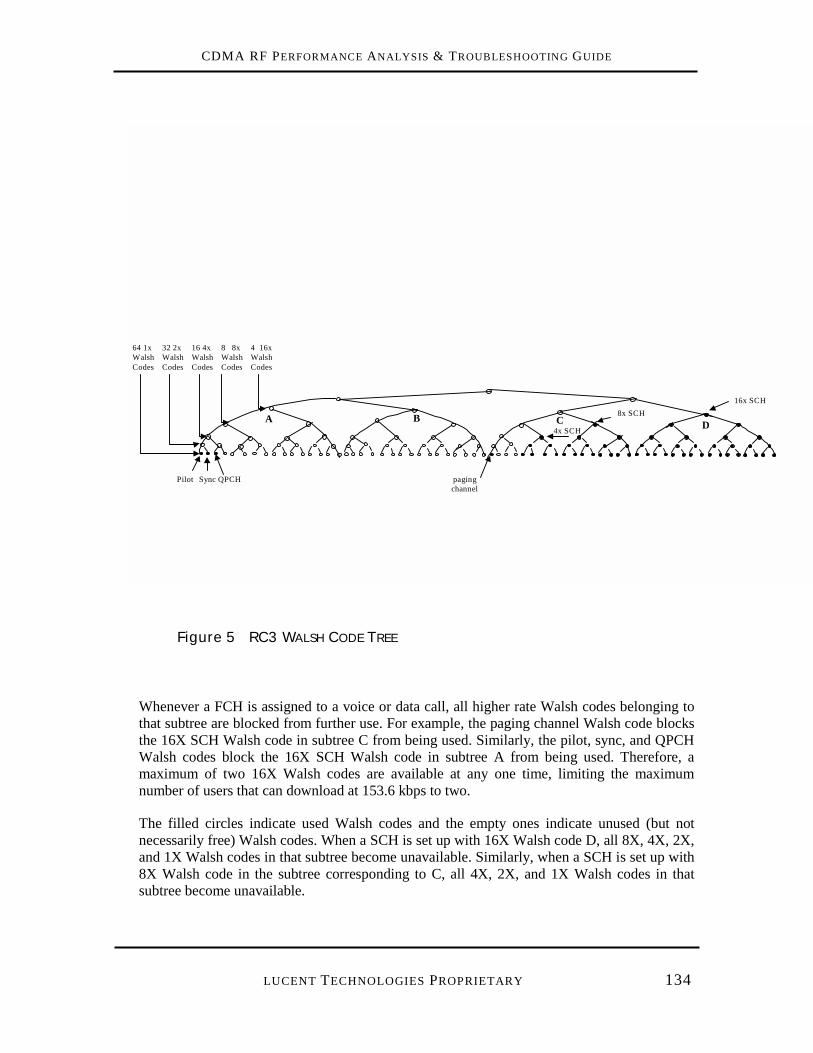
CDMA RF PERFORMANCE ANALYSIS & TROUBLESHOOTING GUIDE
LUCENT TECHNOLOGIES PROPRIETARY 134
64 1x Walsh Codes
8 8x WalshCodes
Pilot Sync QPCH paging channel
A B C D8x SCH
16x SCH
4x SCH
4 16x Walsh Codes
32 2x Walsh Codes
16 4x Walsh Codes
Figure 5 RC3 WALSH CODE TREE
Whenever a FCH is assigned to a voice or data call, all higher rate Walsh codes belonging to that subtree are blocked from further use. For example, the paging channel Walsh code blocks the 16X SCH Walsh code in subtree C from being used. Similarly, the pilot, sync, and QPCH Walsh codes block the 16X SCH Walsh code in subtree A from being used. Therefore, a maximum of two 16X Walsh codes are available at any one time, limiting the maximum number of users that can download at 153.6 kbps to two.
The filled circles indicate used Walsh codes and the empty ones indicate unused (but not necessarily free) Walsh codes. When a SCH is set up with 16X Walsh code D, all 8X, 4X, 2X, and 1X Walsh codes in that subtree become unavailable. Similarly, when a SCH is set up with 8X Walsh code in the subtree corresponding to C, all 4X, 2X, and 1X Walsh codes in that subtree become unavailable.
CDMA RF PERFORMANCE ANALYSIS & TROUBLESHOOTING GUIDE
LUCENT TECHNOLOGIES PROPRIETARY 135
4.1.4.1.3 Walsh Code Optimization Techniques
The allocation of Walsh Codes are inherently performed by call processing within the Lucent cells, and may not be manipulated. The basic strategy is to leave all branches related to particular root codes exclusively for FCH (voice and low-speed data), and only open up selected root codes for high-speed data. This ensures that there is a minimum capacity allocated to voice calls, which are still expected to form a significant portion of the total traffic in these early stages of 3G rollout.
The Walsh functions are also assigned in a manner that minimizes the number of additional functions blocked. If there are no smaller-length codes available for a high-speed data call on the SCH, then the rate will be stepped down and a higher-length code will be assigned to the call.
4.1.4.2 Walsh Code Blocking / Rate Reduction Failure Causes and Fixes
4.1.4.2.1 Unavailable Walsh Codes due to Excessive High-Speed Connections
Concept / Reason for Failure
This type of blocking will occur if too many lower length Walsh codes are used for high-speed data calls, discounting all related higher length codes for other lower-speed calls (see Section 4.1.4.1.2).
Failure Symptoms and Identification Techniques
There will be direct peg counts with Release 19 that indicates blocking due to lack of Walsh Codes. The distribution of rate assignments may also be determined through Release 17 counts.
Suggested Fixes for Improvement
There is no control over how the cell sites assign Walsh Codes to calls. However, if such blocking is occurring, then one possibility is to offload traffic to neighboring sectors, if possible. Other traffic offloading techniques discussed in Section 3.1.4.1.3 may also be applied.
Alternatively, translations may be set to limit the maximum rate assigned on these blocking sectors to ensure that too many lower length codes are not assigned. Reference [4] discusses this in more detail.
CDMA RF PERFORMANCE ANALYSIS & TROUBLESHOOTING GUIDE
LUCENT TECHNOLOGIES PROPRIETARY 136
4.1.4.2.2 Unavailable Walsh Codes due to Excessive Low-Speed Connections
Concept / Reason for Failure
This type of blocking will occur if too many higher length Walsh codes are used for low-speed data and/or voice calls, discounting all related lower length codes for other high-speed calls (see Section 4.1.4.1.2).
Failure Symptoms and Identification Techniques
There will be direct peg counts with Release 19 that indicates blocking due to lack of Walsh Codes. The distribution of rate assignments may also be determined through Release 17 counts.
Suggested Fixes for Improvement
There is no control over how the cell sites assign Walsh Codes to calls. However, if such blocking is occurring, then one possibility is to offload traffic to neighboring sectors, if possible. Other traffic offloading techniques discussed in Section 3.1.4.1.3 may also be applied.
Note that limiting the maximum assigned rate will not help in this case because the fundamental problem is with too many lower rate assignments.
4.2 Excessive Anchor Transfers
4.2.1 Concepts and Optimization Techniques
4.2.1.1 Conceptual Overview
Any instance when the SCH is inactive even while there is backlogged data to send may be construed as a throughput hit. Such a condition will arise during Anchor Transfers, whereby the data call is transferred from one Anchor sector to another.
Anchor Transfers is exclusively a forward-link concept27. Only a single sector carries the Supplemental Channel (SCH) on the forward link, even in areas of soft-handoff. This sector is designated as the Anchor Sector.
27 The concept of Anchors do not exist on the reverse link because the R-SCH is combined by all soft-handoff legs of the call.
CDMA RF PERFORMANCE ANALYSIS & TROUBLESHOOTING GUIDE
LUCENT TECHNOLOGIES PROPRIETARY 137
As RF conditions vary and another pilot assumes dominance, the Anchor designation is transferred to this stronger pilot when certain hysteresis threshold criteria are met. When this event occurs, the prior Anchor Sector tears down its SCH, and subsequently the new Anchor Sector establishes a new SCH with the mobile and resumes the high-speed transfer. This process is known as the Anchor Transfer process. The hysteresis threshold may be set in translations.
Of note in this procedure is the fact that there will be a brief period where the SCH is inactive during this process, even in the presence of backlogged data that requires this high-speed transfer. These periods of SCH outages will result in a modest hit to the throughput. The extent of the effect of these Anchor Transfers is directly proportional to the number of Anchor Transfers that occur.
4.2.1.2 Optimization Techniques
The primary cause of Anchor Transfers is due to shifting dominant pilots. Areas of rapidly varying dominant pilots will be particularly prone to these transfers, possibly resulting in noticeable throughput degradations. Given below are some optimization techniques.
• Minimize areas of varying dominant pilots. Typically, this problem is most severe in soft-handoff zones. Therefore, minimizing excessive soft-handoff zones will typically help reduce unnecessary Anchor Transfers. Areas of excessive soft-handoffs may be determined using the following techniques.
- Isolate sectors exhibiting high soft-handoff percentage through service measurements. This is done by examining the primary and secondary usage on these sectors. The ratio of secondary usage to total (primary + secondary) usage gives the soft-handoff percentage. Percentages much larger than 50% should be flagged for examination and possible optimization. Note that there may be several sectors exhibiting such problems, especially in dense urban environments. It is always prudent to examine the RF performance of these high soft-handoff sectors, and only focus optimization activity on those exhibiting the most serious performance problems.
- Use Handoff Matrix and UNL28 to isolate overshooting sectors. Both these features can be used very effectively to capture sectors covering beyond their intended coverage areas as well as distant interferers from several tiers of cells away. Overshooting sectors have noticeable impact on the RF performance of the network, and serious effort must be undertaken to control these sectors.
28 Several steps must be followed to enable UNL: 1) The FAF feature 547 must be activated. 2) The Undeclared Neighbor List (unl) translation must be set to y on all sectors of interest on the ceqface form, or switch-wide on the ecp form. 3) The Search Window Size: Remaining Set (srchwinr) translation in the ceqface form must be changed from its recommended value of zero to 7 or greater (preferably at least 9 to ensure all distant interferers are captured).
CDMA RF PERFORMANCE ANALYSIS & TROUBLESHOOTING GUIDE
LUCENT TECHNOLOGIES PROPRIETARY 138
These excessive soft-handoff zones may be rduced through a combination of physical optimization (changes in antenna orientation, downtilt, model etc.) and/or BCR/CBR attenuation changes.
Manipulating t_add, t_drop and other handoff parameters will typically not help resolve this particular type of problem because Anchor Transfers usually occur amongst the strongest pilots seen in an area, while these handoff parameters affect the entry and removal of the weaker pilots.
• Increase Anchor Hysteresis Threshold. While this may limit the number of Anchor Transfers, it may also result in poorer performance because the data call will be carried more often pilots that are not dominant. Therefore, it is preferred to solve the problem in its roots through RF optimization discussed above.
4.3 3G!!!!3G Inter-Frequency Handoffs
4.3.1 Concept / Reasons for Throughput Degradation
A 3G HSPD call may be instructed to perform an inter-frequency handoff to another 3G carrier on the same and/or other sectors for a variety of reasons. When this happens, the SCH is torn down, and would need to be reestablished on the new carrier. This period of SCH inactivity will directly translate to a reduction in the achieved end-user throughput.
Given below is a list of possible reasons why such an inter-frequency handoff may be triggered:
• The call is on a border sector, and the triggers for an inter-frequency handoff have been met.
• A strong candidate is unable to support 3G soft-handoff, but has 3G resources to support the HSPD call on another carrier. The original carrier could have rejected the 3G soft handoff for any of the following reasons:
1) All of the 3G resources on that carrier were utilized, resulting in handoff escalation to another carrier.
2) The original carrier was never provisioned with 3G resources to begin with.
CDMA RF PERFORMANCE ANALYSIS & TROUBLESHOOTING GUIDE
LUCENT TECHNOLOGIES PROPRIETARY 139
4.3.2 Symptoms and Identification Techniques
Currently, there is no direct method to detect the occurrence of these handoffs because of insufficient granularity with existing service measurement peg counts. However, these handoffs may be inferred as occurring if any of the following conditions are met:
• A multi-carrier network is known to be configured with 3G!!!!3G borders and these border sectors show inter-frequency (that is, semi-soft) handoff activity in service measurements.
• Known 3G multi-carrier cell(s) are experiencing handoff overflow counts and/or overload handoff blocking counts on one or more, but not all, carriers. This implies that inter-frequency handoffs will be attempted to move the HSPD call to the non-blocking carriers. This can be confirmed by the existence of inter-frequency (that is, semi-soft) handoff activity, even if none of the sectors in these cells are border sectors.
4.3.3 Suggested Fixes for Improvement
If these handoffs are occurring on authentically configured border sectors, then the problem may be minimized or eliminated using the following techniques (where applicable):
1) Use the IFHOTI algorithm to trigger the inter-frequency handoffs (if not already). If IFHOTI is already being used, then perform multi-carrier optimization to extend the coverage of the border carrier, if possible (see [16] for detailed procedures on how to do this). Note that the cdhnl forms must be well optimized to preserve the handdown success rate. These concepts are discussed in detail in Section 3.2.2.1.2.
2) Convert the affected border sector to a full-traffic sector, if possible. Sometimes, the border regions are configured conservatively, and can in fact be extended out with proper optimization of the handdown triggers and neighbor lists. If this is not possible, then one or more neighboring sectors need to be installed with the additional carrier and be configured as border sectors to allow the affected sector to become full-traffic. This solution is of course a much more expensive option, and will usually require justification and time to implement.
If the inter-frequency handoffs are occurring on otherwise full-traffic sectors, and handoff overflows are also detected on these cells, then this implies a cell resource blocking problem. The obvious solution to this problem would be to resolve this resource blocking at the affected cells.
Understanding and resolving cell resource blocking is an involved topic in its own right, and is discussed in detail in Sections 3.1.3, 3.1.4 and 3.1.5.
CDMA RF PERFORMANCE ANALYSIS & TROUBLESHOOTING GUIDE
LUCENT TECHNOLOGIES PROPRIETARY 140
4.4 3G!!!!non-3G Handoffs
4.4.1 Concept / Reasons for Throughput Degradation
All 3G to non-3G handoffs will result in the HSPD call being released altogether. Such handoffs may occur under any one of the following circumstances:
• A 3G!2G handoff is triggered. This may occur under any one of the following conditions:
1) A strong 2G-only candidate sector forces the entire call to be transferred to 2G.
2) A strong candidate sector has 3G resources available, but is not enabled to support HSPD calls (FID-3833 is not enabled at the cell).
3) A strong candidate sector is 3G HSPD capable, but all 3G resources on all carriers are already being utilized.
4) An inter-frequency handdown is triggered on a 3G border sector, and all of the common carriers only support 2G.
In scenarios 1-3 above, the criteria used to trigger the 3G!2G handoff will be as explained in [5], namely:
• The combined pilot strength of the Active Set pilots is less than –10dB.
AND/OR
• The candidate pilot strength is stronger than the strongest Active Set pilot.
• A hard-handoff is triggered to another vendor / system through IS-41. The criteria used to trigger such handoffs are also described in [5].
If the HSPD call goes to 2G and there is still data to transmit, then another data call may be set up in 2G-mode if 2G-IP service is enabled and supported by the mobile, but will most likely achieve lower throughputs because the SCH will not be available.
If the HSPD call goes to another vendor’s network, or to another system, then it will depend of the technology supported with this new network. If 3G HSPD is supported, then another HSPD call may then be set up at that point to continue the data session.
CDMA RF PERFORMANCE ANALYSIS & TROUBLESHOOTING GUIDE
LUCENT TECHNOLOGIES PROPRIETARY 141
4.4.2 Symptoms and Identification Techniques
3G!2G handoffs may be identified through service measurements. It is instructive to view these handoffs as a percentage of the total number of established calls on each sector to get an appreciation of the magnitude of the problem. This may be readily viewed using tools such as SPAT (Appendix B).
There are no direct peg counts to capture the number of 3G HSPD calls that are released due to hard handoffs. However, this may be inferred to be happening on 3G cells that are also reporting hard handoff activity, though the magnitude of the problem cannot be determined.
4.4.3 Suggested Fixes for Improvement
Since such throughput degradations due to hard handoffs are difficult to identify and characterize, this section will focus on suggestions to reduce the 3G!2G handoffs on sectors that require good HSPD throughputs.
The following steps may be taken to optimize such handoffs:
• A translations scrub must be performed to ensure that the HSPD feature (FID-3833) is enabled on all 3G cells, unless there is an explicit directive to disable this feature on selected 3G cells.
• If the problem is that distant 2G sectors are overshooting into a 3G-designated area, then the solution will be to limit the coverage of these 2G sectors through a combination of physical (antenna azimuths, downtilts, models, etc.) and/or parameter (BCR/CBR attenuation, etc.) optimization.
• If the 3G calls are being released to neighboring 2G sectors, as per design, then the solution will be to extend the number of 3G-enabled cells in order to expand the 3G footprint. Of course, such a measure will require time to implement, and will require justification of the HSPD throughput requirements for the affected sectors.
• If it is found that 3G calls are being released to 2G on 2G/3G mixed cells, then this implies that there were no 3G resources available to support the 3G HSPD call. This could be because of two reasons, namely:
1) The load preference deltas and 3G1X sharing translations were not optimally configured, resulting in 2G calls consuming 3G resources. This topic is dealt in detail in Section 4.1.3.1.3, including identification techniques and suggestions for fixes.
2) The 3G resources were consumed totally by 3G calls, but there was insufficient such resources allocated to these 2G/3G mixed cells. The solution then would be to increase the allocation of 3G resources to these cells.
CDMA RF PERFORMANCE ANALYSIS & TROUBLESHOOTING GUIDE
LUCENT TECHNOLOGIES PROPRIETARY 142
4.5 Outages and Errors in the Packet Network
The implementation of HSPD services in 3G networks require several addition network elements to complement the existing network infrastructure for voice services. Specifically, data packets traversing to and from external internet or other packet data networks are required to be routed through a Packet Data Serving Node (PDSN), which will then communicate to the 5E DCS via the Packet Control Function (PCF) [13].
Any hardware outages, protocol errors or hung queues on any of these network elements will result in the customers experiencing reduced throughputs, even under good RF conditions and ample cell resource availability.
A detailed discussion on all the possible types of problems and their corresponding identification and resolution techniques is beyond the scope of this guide. However, reference [14] offers an excellent troubleshooting manual to identify and resolve end-to-end HSPD problems, with a focus on fixed network element failures.
Another important source of information will be the Lucent Alerts that catalog all problems that have been uncovered, and will also document the resolution steps, if available.
As an example, a prominent alert (02-264) was released in May, 2002 that described a software deficiency in the PHV4’s that resulted in its high-speed data burst queues being improperly exhausted. This will then restrict data calls to a maximum of 9.6 kbps over the FCH, and will not allow the SCH to be set up for any of the calls. This Lucent Alert provides details on a BWM load to be installed, and other related procedures to be executed, to fix the problem.
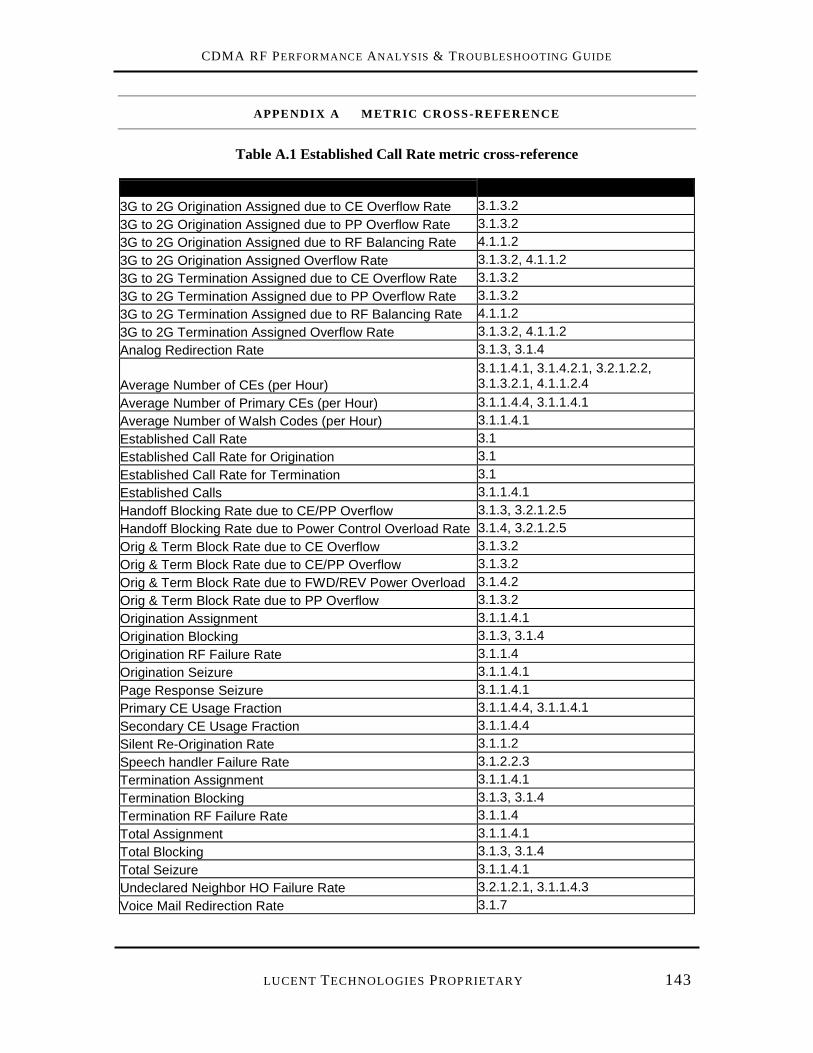
CDMA RF PERFORMANCE ANALYSIS & TROUBLESHOOTING GUIDE
LUCENT TECHNOLOGIES PROPRIETARY 143
APPENDIX A METRIC CROSS-REFERENCE
Table A.1 Established Call Rate metric cross-reference
Metric_Name Reference Sections 3G to 2G Origination Assigned due to CE Overflow Rate 3.1.3.2 3G to 2G Origination Assigned due to PP Overflow Rate 3.1.3.2 3G to 2G Origination Assigned due to RF Balancing Rate 4.1.1.2 3G to 2G Origination Assigned Overflow Rate 3.1.3.2, 4.1.1.2 3G to 2G Termination Assigned due to CE Overflow Rate 3.1.3.2 3G to 2G Termination Assigned due to PP Overflow Rate 3.1.3.2 3G to 2G Termination Assigned due to RF Balancing Rate 4.1.1.2 3G to 2G Termination Assigned Overflow Rate 3.1.3.2, 4.1.1.2 Analog Redirection Rate 3.1.3, 3.1.4
Average Number of CEs (per Hour) 3.1.1.4.1, 3.1.4.2.1, 3.2.1.2.2, 3.1.3.2.1, 4.1.1.2.4
Average Number of Primary CEs (per Hour) 3.1.1.4.4, 3.1.1.4.1 Average Number of Walsh Codes (per Hour) 3.1.1.4.1 Established Call Rate 3.1 Established Call Rate for Origination 3.1 Established Call Rate for Termination 3.1 Established Calls 3.1.1.4.1 Handoff Blocking Rate due to CE/PP Overflow 3.1.3, 3.2.1.2.5 Handoff Blocking Rate due to Power Control Overload Rate 3.1.4, 3.2.1.2.5 Orig & Term Block Rate due to CE Overflow 3.1.3.2 Orig & Term Block Rate due to CE/PP Overflow 3.1.3.2 Orig & Term Block Rate due to FWD/REV Power Overload 3.1.4.2 Orig & Term Block Rate due to PP Overflow 3.1.3.2 Origination Assignment 3.1.1.4.1 Origination Blocking 3.1.3, 3.1.4 Origination RF Failure Rate 3.1.1.4 Origination Seizure 3.1.1.4.1 Page Response Seizure 3.1.1.4.1 Primary CE Usage Fraction 3.1.1.4.4, 3.1.1.4.1 Secondary CE Usage Fraction 3.1.1.4.4 Silent Re-Origination Rate 3.1.1.2 Speech handler Failure Rate 3.1.2.2.3 Termination Assignment 3.1.1.4.1 Termination Blocking 3.1.3, 3.1.4 Termination RF Failure Rate 3.1.1.4 Total Assignment 3.1.1.4.1 Total Blocking 3.1.3, 3.1.4 Total Seizure 3.1.1.4.1 Undeclared Neighbor HO Failure Rate 3.2.1.2.1, 3.1.1.4.3 Voice Mail Redirection Rate 3.1.7
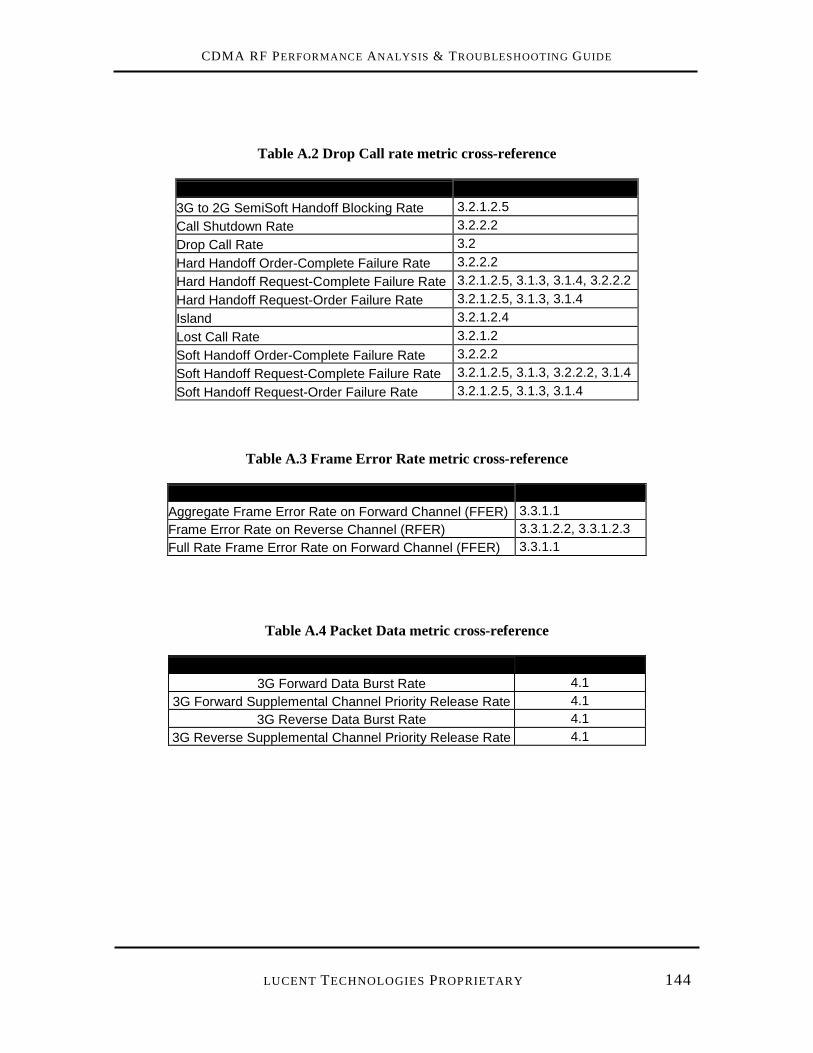
CDMA RF PERFORMANCE ANALYSIS & TROUBLESHOOTING GUIDE
LUCENT TECHNOLOGIES PROPRIETARY 144
Table A.2 Drop Call rate metric cross-reference
Metric_Name Reference Sections 3G to 2G SemiSoft Handoff Blocking Rate 3.2.1.2.5 Call Shutdown Rate 3.2.2.2 Drop Call Rate 3.2 Hard Handoff Order-Complete Failure Rate 3.2.2.2 Hard Handoff Request-Complete Failure Rate 3.2.1.2.5, 3.1.3, 3.1.4, 3.2.2.2 Hard Handoff Request-Order Failure Rate 3.2.1.2.5, 3.1.3, 3.1.4 Island 3.2.1.2.4 Lost Call Rate 3.2.1.2 Soft Handoff Order-Complete Failure Rate 3.2.2.2 Soft Handoff Request-Complete Failure Rate 3.2.1.2.5, 3.1.3, 3.2.2.2, 3.1.4 Soft Handoff Request-Order Failure Rate 3.2.1.2.5, 3.1.3, 3.1.4
Table A.3 Frame Error Rate metric cross-reference
Metric_Name Reference Sections Aggregate Frame Error Rate on Forward Channel (FFER) 3.3.1.1 Frame Error Rate on Reverse Channel (RFER) 3.3.1.2.2, 3.3.1.2.3 Full Rate Frame Error Rate on Forward Channel (FFER) 3.3.1.1
Table A.4 Packet Data metric cross-reference
Metric_Name Reference Sections 3G Forward Data Burst Rate 4.1
3G Forward Supplemental Channel Priority Release Rate 4.1 3G Reverse Data Burst Rate 4.1
3G Reverse Supplemental Channel Priority Release Rate 4.1
CDMA RF PERFORMANCE ANALYSIS & TROUBLESHOOTING GUIDE
LUCENT TECHNOLOGIES PROPRIETARY 145
APPENDIX B OVERVIEW OF SPAT TOOL
System Performance Analysis Tool 3G (SPAT3G) is a PC-based tool that is designed for rapid troubleshooting, system performance analysis and RF optimization. SPAT3G has the ability to analyze Service Measurements (SM), ROP, Translations, Neighbor list and Handoff Matrix (HOM) data simultaneously. SPAT3G supports ECP release 18 and beyond. For markets with ECP release 17 or lower, SPATv17 should be used.
SPAT3G structure
There are two components in SPAT3G – the OMP scripts and the PC GUI tool. The OMP scripts have to be installed on the OMP to collect SM, ROP, Translations and HOM data on a daily basis. A cron job can be set up on the OMP to run these scripts a few minutes past midnight every day to collect the relevant data. At the completion of the cron job, a single zipped file is generated that is an archive of the SM, ROP, Translations and HOM data that was collected for that day. The naming convention used for the zipped file is ECP-Number_yyyymmdd.sp (e.g. 1_20020715.sp).
The sp file needs to be downloaded to the PC from the OMP everyday for further analysis. The PC portion of the SPAT3G tool processed the sp file(s) along with the cells information (e.g. cells.txt or cells.mdb from LCAT) and Street maps and creates a SPAT3G database. This database is used in displaying the SM performance metrics, ROP analysis, Translations summary, FCIAlert analysis and Handoff Matrix analysis. The cells information and street maps can be combined into a “GeoScheme” in SPAT3G which can be re-used to create multiple SPAT databases for the same market (e.g. one database for each month of the year). The next few sections explain the different types of analyses that are available with SPAT3G once the data has been processed.
Service Measurements analysis
The sp files contain raw service measurement peg counts that are used within the PC portion of SPAT3G to compute performance metrics based on hard-coded equations (e.g. Drop Call rate, RF Access Failure rate, etc.). These performance metrics are available on a per system, per cell, per sector and per carrier levels depending on the peg counts used for calculations. 2G and 3G performance metrics are available for Voice and Data separately.
Figure B1 shows the executive summary of SPAT3G. The executive summary shows key performance metrics on a per system level for the whole day (24-hour) and/or for the busy hour for each day for which SM data is available. Each metric is color-coded red when it exceeds a certain threshold. This enables the user to rapidly identify which metric is under-performing in a system. All the performance metrics are classified under multiple categories available as individual tabs in SPAT3G. For example, Lost Call rate and Call Shutdown rate metrics are available under the Drop Call tab in SPAT3G.
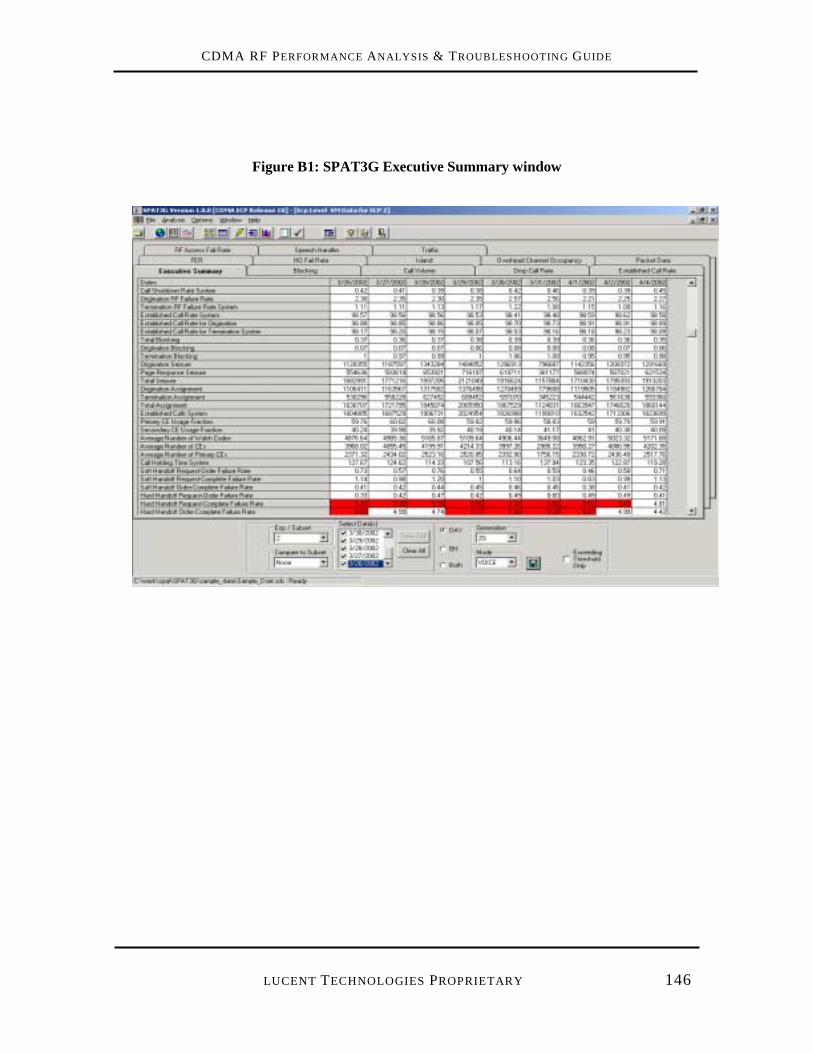
CDMA RF PERFORMANCE ANALYSIS & TROUBLESHOOTING GUIDE
LUCENT TECHNOLOGIES PROPRIETARY 146
Figure B1: SPAT3G Executive Summary window
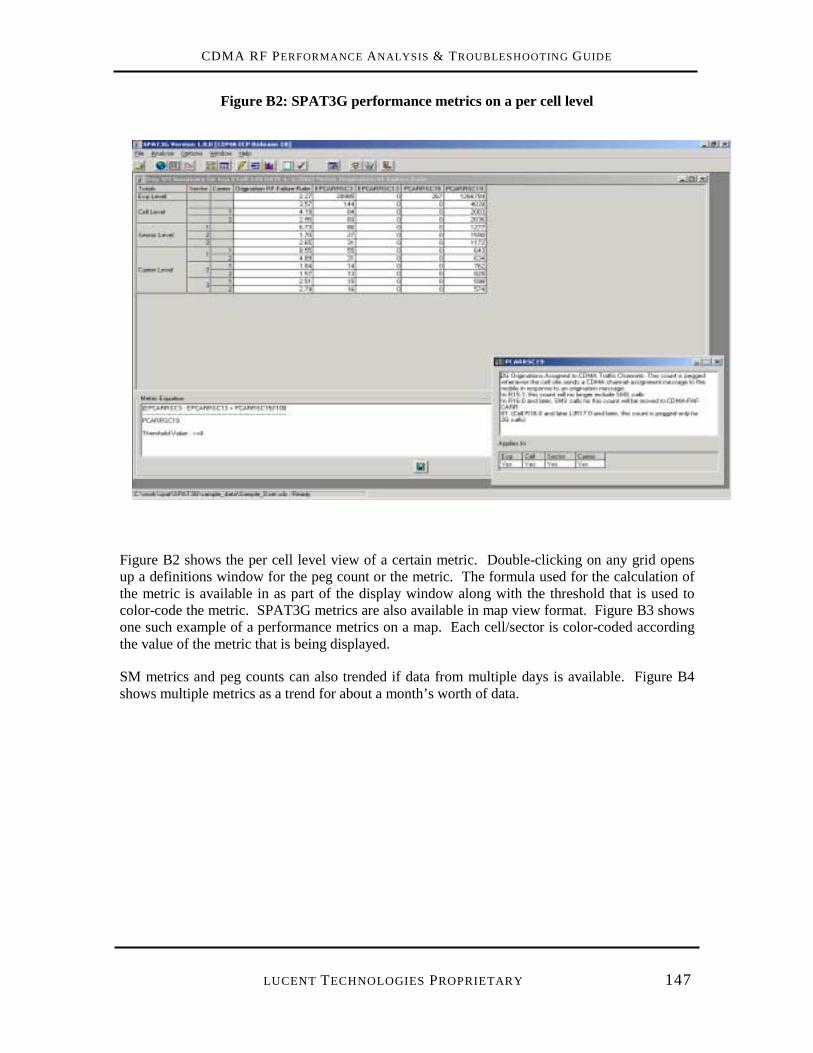
CDMA RF PERFORMANCE ANALYSIS & TROUBLESHOOTING GUIDE
LUCENT TECHNOLOGIES PROPRIETARY 147
Figure B2: SPAT3G performance metrics on a per cell level
Figure B2 shows the per cell level view of a certain metric. Double-clicking on any grid opens up a definitions window for the peg count or the metric. The formula used for the calculation of the metric is available in as part of the display window along with the threshold that is used to color-code the metric. SPAT3G metrics are also available in map view format. Figure B3 shows one such example of a performance metrics on a map. Each cell/sector is color-coded according the value of the metric that is being displayed.
SM metrics and peg counts can also trended if data from multiple days is available. Figure B4 shows multiple metrics as a trend for about a month’s worth of data.
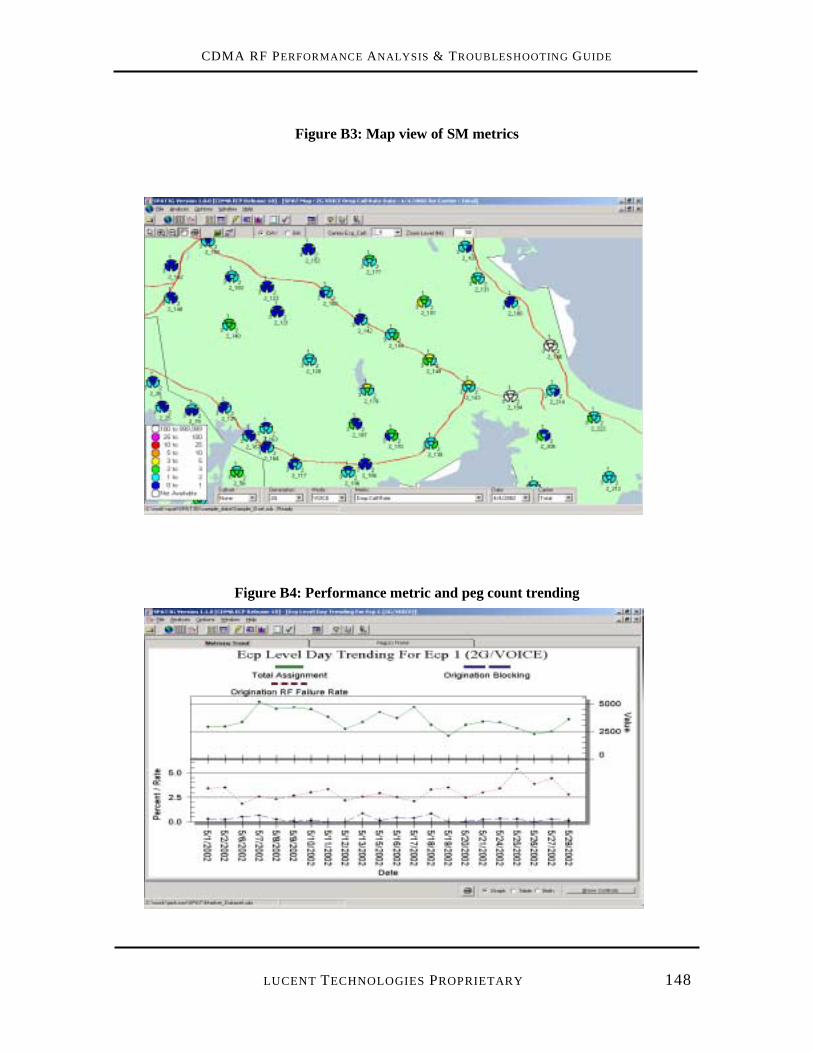
CDMA RF PERFORMANCE ANALYSIS & TROUBLESHOOTING GUIDE
LUCENT TECHNOLOGIES PROPRIETARY 148
Figure B3: Map view of SM metrics
Figure B4: Performance metric and peg count trending

CDMA RF PERFORMANCE ANALYSIS & TROUBLESHOOTING GUIDE
LUCENT TECHNOLOGIES PROPRIETARY 149
ROP Analysis
SPAT3G analysis of ROP data is done on a per system and per cell level. Several different categories of ROP analysis are available – Call Processing Failures, Hardware Error Handlers, Asserts, Restorals, PP/DS1 HEH’s, etc. Wherever it is relevant the failing hardware board is also specified in the analysis. For example, Call Processing failure analysis is available at a per system, per cell, per sector, per CCC/CDM and per CCU levels.
Figure B5 shows the system level view of Call Processing Failures.
Figure B5: ROP analysis display in SPAT3G
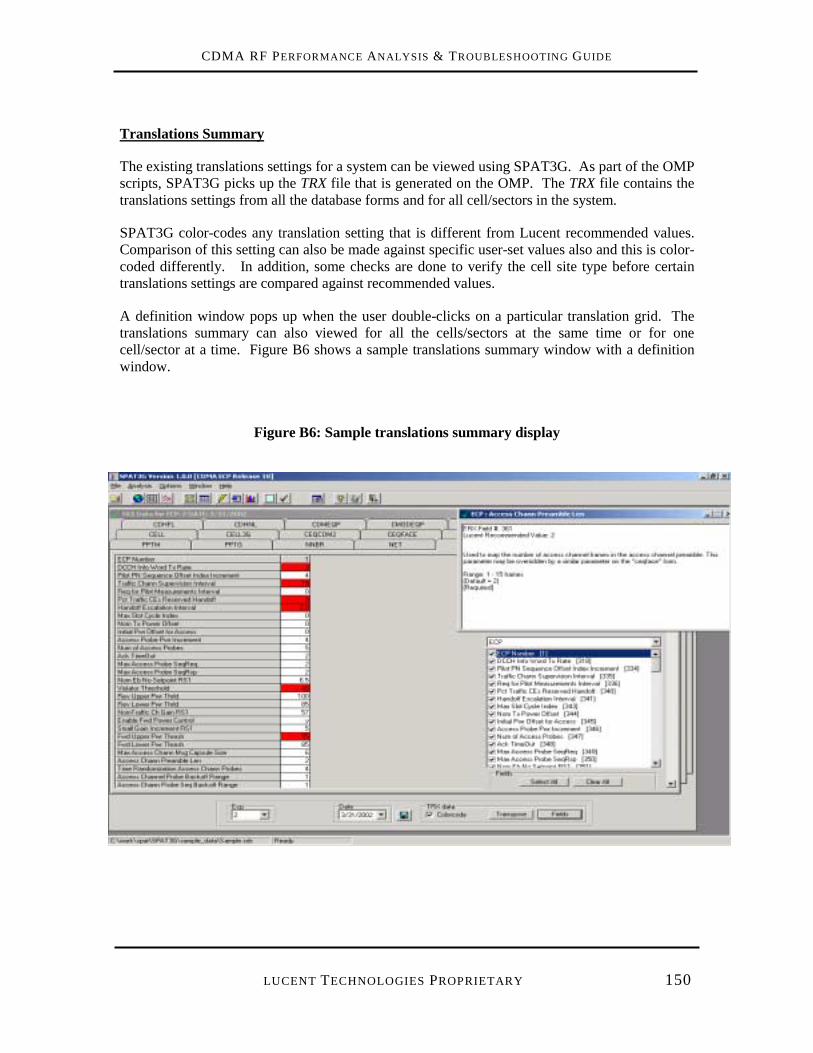
CDMA RF PERFORMANCE ANALYSIS & TROUBLESHOOTING GUIDE
LUCENT TECHNOLOGIES PROPRIETARY 150
Translations Summary
The existing translations settings for a system can be viewed using SPAT3G. As part of the OMP scripts, SPAT3G picks up the TRX file that is generated on the OMP. The TRX file contains the translations settings from all the database forms and for all cell/sectors in the system.
SPAT3G color-codes any translation setting that is different from Lucent recommended values. Comparison of this setting can also be made against specific user-set values also and this is color-coded differently. In addition, some checks are done to verify the cell site type before certain translations settings are compared against recommended values.
A definition window pops up when the user double-clicks on a particular translation grid. The translations summary can also viewed for all the cells/sectors at the same time or for one cell/sector at a time. Figure B6 shows a sample translations summary window with a definition window.
Figure B6: Sample translations summary display
CDMA RF PERFORMANCE ANALYSIS & TROUBLESHOOTING GUIDE
LUCENT TECHNOLOGIES PROPRIETARY 151
FCIAlert Analysis
FCIAlert tool is now available from within SPAT3G. The fci database information from the TRX file is used to perform the FCIAlert analysis. The need for running the dbsurvey scripts to extract neighbor list information from the OMP has now been eliminated. The different types of warnings that are generated include Reciprocity alert, and one-way and two-way PN ambiguity alerts.
In addition, the FCIAlert tabular report, a map view is available for the current neighbor list (with priority groups marked in different colors) and for all the individual alerts. This enables the user to visualize where the neighbor list problem is located.
Handoff Matrix Analysis
Analysis of Handoff Matrix data is also possible with SPAT3G. Handoff Matrix data (study types 1008 and 1009) from multiple days and multiple ECPs can be analyzed together. A Handoff Summary output and an Add/Delete neighbor list suggestion output are displayed. Map view of these two output types is also available.
Other features in SPAT3G
There are other features in SPAT3G that have not been described in detail in the previous sections that are useful for performance analysis. One such key feature is the ability to create a subset. A subset could be created as a collection of a few cells (e.g. cells within a cluster). The subset’s performance can be compared against the performance of the system as a whole. Another example of using subset analysis would be to compare performance across multiple carriers.
Even in the absence of SM and/or ROP files, SPAT3G can also be used to view translations summary and perform FCIAlert and Handoff Matrix analysis.
Any table that is displayed in SPAT3G can also be exported as a comma-delimited file. This file can then be used for further analysis if the need exists. SPAT3G also has the mechanism to report bugs or feature requests. This can be done from the “Help” menu option and an email from the user’s computer is sent automatically to the SPAT team.
User preferences can be set from the “Preferences” menu option. Some examples of preferences are setting working directory, custom ranges for maps, adding new translations field for display, and setting handoff matrix threshold.
A detailed SPAT3G presentation is available as a course (LTW453Y) from the Wireless University website (http://wirelessu.lucent.com).


