Embed Size (px)
Citation preview

By: Ashley Reeves

PEST AND INDUSTRY ANALYSIS

HISTORY Founded in 1932 by Charles and Joseph Revson, along with chemist
Charles Lachman
Products: Global color cosmetics, hair color, beauty tools, fragrances, skincare, anti-perspirant/deodorants and beauty care tools
Net Sales 2010= $1.32 Billion U.S.= 55% International= 45%
Vision: “Glamour, excitement, and innovation through high-quality products at affordable prices.”
Target market = women of all ages worldwide
Brands: Revlon Almay Age Defying ColorStay

HISTORY CONTINUED
Headquartered in New York, NY
CEO Alan Ennis as of May 2009
4,900 employees
17 manufacturing locations worldwide U.S., Canada, Europe, Latin America, and Asia
Pacific

EXTERNAL MACRO-ENVIRONMENT FACTORS

POLITICAL FACTORS
Strict FDA regulations in the U.S. and other countries
ECONOMIC FACTORS
Currency exchange rates Revlon would benefit from a weak U.S. dollar
relative to the currencies of other countries.
Growth in emerging markets Sales have grown immensely in the Asia Pacific
region.
Global economic conditions Higher unemployment levels Decreased consumer spending

SOCIAL FACTORS
Changes in consumer purchasing habits
Increased customer awareness of permanent make-up options

TECHNOLOGICAL FACTORS
E-Commerce
Use of social media

PEST ANALYSIS
Factor Trend Evaluation Impact(1=low,5=high)
Rank
PoliticalStrict FDA
regulations in the U.S. and other
countries
threat 2 4
Economic
currency exchange rates
growth in emerging markets
Global economic conditions
opportunity/threat
opportunity/threat
opportunity/threat
4
5
2
1
Social
changes in consumer
purchasing habits
Increased customer awareness of
permanent make-up options
threat
threat
3
1
2
Technological
E-Commerce
Use of social media
opportunity
opportunity
2
13

INDUSTRY ANALYSIS
Porter’s Five Forces Model

PERSONAL PRODUCTS INDUSTRY
Buyers SuppliersLarge mass volume
retailersRaw materials
Chain drug and food stores Packaging
Department and specialty stores
Competitors SubstitutesEstee Lauder Companies
Inc.Other cosmetic products
not intended for the same use
L'Oreal Permanent make-up
Procter & Gamble Co. Deciding not to purchase

THREAT OF NEW ENTRANTS Barriers to entry
Nature of Barrier Extent of Barrier
Supply-side economies of scale
High
Demand-side benefits of scale
High
Capital Requirements High
Incumbency advantages independent of size
High
Customer-switching costs Low
Unequal access to distribution channels
High
Restrictive Government Policy
Medium

POWER OF SUPPLIERS
Power Degree of Power Bargaining Power is strong if:
Switching costs Low High
Suppliers offer differentiated
products
Low High
Number of substitutes available
High Low

POWER OF BUYERS
Powers Degree of Power Bargaining Power is strong when:
Number of Buyers High High
Purchases volume Low High
Product Differentiation
High Low
Vendor Switching Costs
Low Low
Degree of backward integration
Low High

POWER OF SUBSTITUTES
Powers Degree of Power Threat is strong if:
Substitute offers attractive price-
performance trade-off
Low High
Switching Costs Low Low

INTENSITY OF RIVALRY
Power Degree of Power Rivalry is strong if:
Number of competitors
High High
Industry Growth High Low
Exit Barriers High High

NATURE OF THE FORCES
Factor Evaluation
Intensity of Rivalry Strong : several major players with similar product offerings.
Consumer Buyer Power Moderate: purchases volume, differentiation, and backward integration do not coincide with strong buyer power.
Supplier Power Benign: other supplier options are available if needed.
Threat of Substitute Products
Benign: many customers are loyal to their personal product items.
Threat of New Entrants Benign: barriers to entry are high with patents, research and development, and pricing strategies.

SUGGESTIONS FOR ADDRESSING KEY FORCES
Intensity of Rivalry Continue producing quality products, anticipating
and responding to changes in consumer demands, and educating product benefits.

PEST & INDUSTRY ANALYSIS CONCLUSIONS

Economic and social factors have the greatest affect on Revlon.
Intensity of rivalry is the greatest force for Revlon.
It is important for companies in the personal products industry to stay on top of changing consumer preferences and needs in order to stand out among the competition.
Although the cosmetics and personal products industries have fierce competition, by continuing to spend more time on research and development to create differentiated and quality products, Revlon can increase their position in the personal products industry.

COMPETITOR AND MARKET ANALYSIS
KEY COMPETITORS
"Bringing the Best to Everyone We Touch and Being the Best in Everything We Do."
“To help men and women around the world aspire to beauty and express their individual personalities to the full.”
“We will provide branded products and services of superior quality and value that improve the lives of the world’s consumers, now and for generations to come.”

Revlon L’Oreal Estee Lauder
Procter & Gamble
Net Sales(2010)
$1.32 Billion
€19.5 Billion($26
Billion)
$7.8 Billion $19.5 Billion(beauty & grooming)
Net Income $327.3 M
$3.13 B $616.4 M $12.7 B
Employees 4,900 64,600 31,000 127,000
Geographic Scope (countries)
100 130 150 180
Brands 8 23 28 32(beauty & grooming)
R&D % of Sales
1.8 3.4 1.1 2.5
Headquarters
U.S. France U.S. U.S.
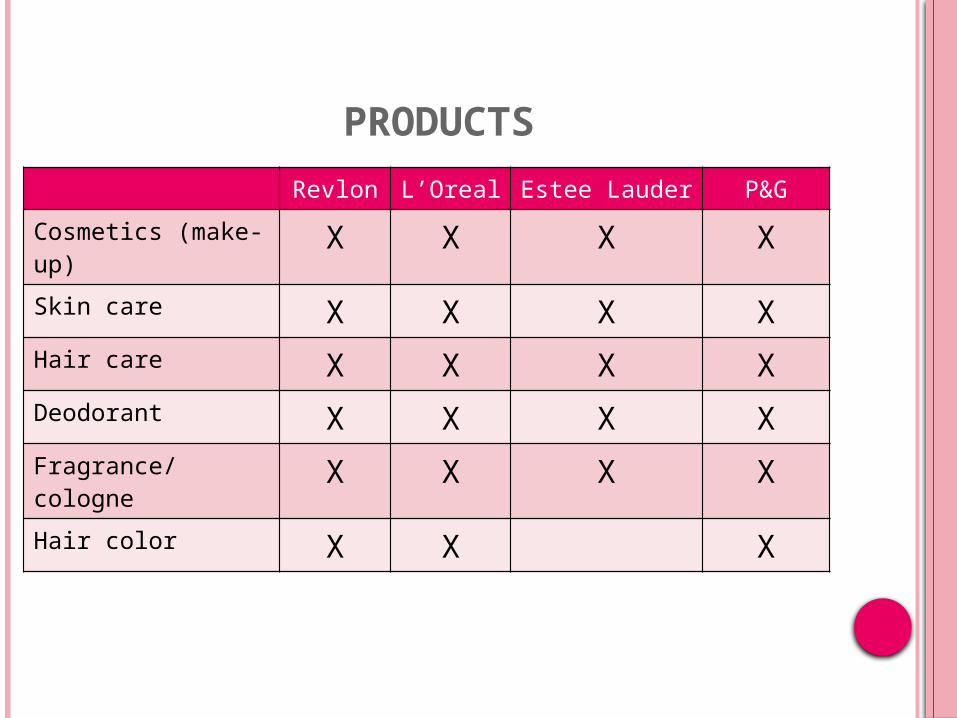
PRODUCTS
Revlon L’Oreal Estee Lauder P&G
Cosmetics (make-up)
Х Х Х Х
Skin care Х Х Х ХHair care Х Х Х ХDeodorant Х Х Х ХFragrance/cologne Х Х Х ХHair color Х Х Х

SALES BY REGION
RevlonU.S. 57%
Asia/Pacific/ 18%Africa
Europe/Canada 15%
Latin America 10%
L’OrealWestern Europe 43%
North America 23%
Asia 13%
Eastern Europe 8%
Latin America 7%
Africa/Orient/Pacific 6%
Estee Lauder
Americas 44%
Europe/Middle 37%East/Africa
Asia/Pacific 19%
Procter & GambleNorth America 42%
Western Europe 21%
Asia 15%
Central & EasternEurope, Middle East, 13%Africa
Latin America 9%

RevlonColor Cosmetics 64%
Women’s Hair Color 11%
AP/DEO 8%
Other Personal Care 7%
Fragrances 6%
Beauty Tools 4%
SALES BY SEGMENT
L’OrealSkin Care 27%
Hair Care 23%
Make-up 21%
Hair Color 15%
Perfumes 11%
Other 3%
Estee LauderSkin Care 42%
Make Up 21%
Fragrance 16%
Hair Care 5%
Procter & Gamble
Household Care 48%
Beauty 34%
Health + Well-Being 18%

TRENDS & FORCES
*Lack of research and development due to a history of losses caused by increased competition and decrease in sale of color cosmetics.*Large dependency on Wal-Mart for sales (23%)*Revlon is a lot smaller than its competition but has a more focused product offering.
*Approximately 34% of sales came from emerging markets in 2009. This presents an opportunity to increase revenues from rising income growths in those markets.
*Diverse brand names target different market niches. *Large presence in global market exposes currency fluctuation risks. More than half of their sales come from outside the U.S.
*Different product price points provide some insulation against recession. *Rises in powerful low-priced retailers negatively affect consumer product companies.* Looking to expand presence in emerging markets. They have created products designed specifically to target developing nations.

Revlon•Build their strong brands•Develop their organizational capability•Drive their company to act globally•Increase operating profits and cash flow•Improve capital structure
L’Oreal•Continue to improve products
•Find ways to promote business affordably
•Make products irresistible for distributors
•Take position early on evolving trends•Take advantage of events
•Develop the ability to continue to create innovative products
Estee Lauder•Commitment to excellent personalized service and education•Using diversified staff to create innovative products•Philanthropy•Minimize impact of products and operations on the environment•Use the latest technological advancements to develop cosmetics that provide superior aesthetics
Procter & Gamble
•Delight customers with sustainable innovations that improve the environmental profile of their products•Improve the environmental profile of their own operations•Improve children’s lives through social responsibility programs•Engage and equip employees to build sustainability thinking and practices in their work•Work with stakeholders to enable continued freedom to innovate in a responsible way
Business Strategie
s

COSMETIC INDUSTRY BCG MATRIX
Stars Question Marks
Cash Cows Dogs
Relative Market Share Position
High
Hig
h
Low
Low
Mark
et
Gro
wth
R
ate

COMPETITOR AND MARKET ANALYSIS
CONCLUSIONS

Revlon has a vast amount of competition in the personal products industry.
Being a lot smaller than the competition has caused them to fall behind in revenues and the amount of money they are able to spend on research and development.
By continuing to develop unique products and investing more money in R&D, Revlon can work their way to becoming as big as the competition.

INTERNAL AND SWOT ANALYSIS
GENERIC AND GRAND STRATEGIES

BUSINESS MODEL
Sell to a large mass-market
Cost Saving
Brand Building
Corporate Social Responsibility
Developing Organizational Capability
Increase operating profit and cash flow
Improve capital structure
Anticipating and responding to changing consumer demands
PERFORMANCE
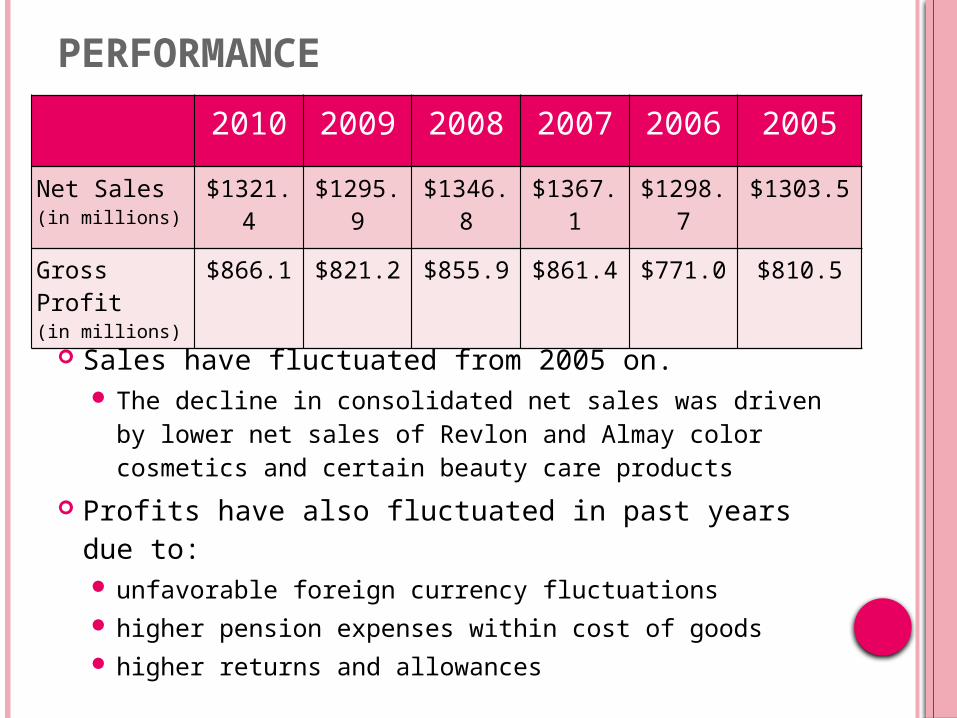
2010 2009 2008 2007 2006 2005
Net Sales(in millions)
$1321.4 $1295.9 $1346.8 $1367.1 $1298.7 $1303.5
Gross Profit(in millions)
$866.1 $821.2 $855.9 $861.4 $771.0 $810.5
Sales have fluctuated from 2005 on. The decline in consolidated net sales was driven
by lower net sales of Revlon and Almay color cosmetics and certain beauty care products
Profits have also fluctuated in past years due to: unfavorable foreign currency fluctuations higher pension expenses within cost of goods higher returns and allowances

CHANGE IN SALES BY REGION
2009 2008 2007United States $747.9 $782.6 $804.2
Asia Pacific $266.7 $265.0 $255.6
Europe $172.4 $200.8 $211.1
Latin America $108.9 $98.4 $96.2
U.S. and Europe have observed a steady decrease in sales over the past few years while Asia Pacific and Latin America have experienced a steady increase in sales. While sales have increased in Asia Pacific and
Latin America, they are not increasing at the rate in which they should, based on the growth rate of cosmetics in those regions.

CHANGE IN SALES BY REGION (CONTINUED)
• U.S. • lower net sales of Revlon and Almay color
cosmetics and Mitchum anti-perspirant deodorant.
• Europe• lower shipments of Revlon and Almay color
cosmetics in Canada• higher allowances for Revlon color cosmetics in
the U.K.• lower shipments of certain beauty care products
in France.
Sales in the U.S. and Europe have decreased due to:
• Asia Pacific• higher shipments of Revlon color cosmetics in Australia
and China and of beauty care products in South Africa.• Latin America• the impact of inflation on selling prices in Venezuela. • higher shipments of Revlon ColorSilk hair color in
Venezuela, Argentina and certain distributor markets
Sales in Asia Pacific and Latin
America have increased due
to:

U.S. SHARE % BY BRAND/PRODUCT
2009 2008
Revlon Color Cosmetics 12.7 12.7
Almay 5.4 5.9
Revlon ColorSilk Hair Color
9.7 8.3
Mitchum AP/DEO 4.6 5.0
Revlon Beauty Tools 21.0 18.8

RESOURCES
Raw materials and components used to create their products.
Most of their products are created at the company’s manufacturing facilities located around the world.

KEY ASSETS
Cash & cash
equivalents
Trade receivables
Inventories
Prepaid expenses
Property, plant, and equipment
Goodwill

BCG MATRIX
Cash Cows
Question MarksStars
Dogs
Relative Market Share Position
Market
Growth
Rate
Hig
hLo
w
High Low
*Market Share: Increase in competition causes a decrease in market share for Revlon
*Market Growth: A high growth rate is possible in global countries.

*Revlon works to expand their current products into new emerging markets where cosmetics sales are increasing.

VALUE CHAIN
Primary Activities:Inbound logistics Storing inventory and scheduling
transportation of products for distribution.
Operations Packaging and assembling products for distribution.
Outbound logistics
Distribution of products through selected channels to customers.
Marketing & Sales
Advertising and promotion of products using print, television, and internet.
Service Tips and services on company website

VALUE CHAIN (CONTINUED)
Support Activities:
Human resource management Look for energetic, success-oriented people who thrive in a dynamic environment.
Technology development Global cross-functional product development process.
Procurement Receiving raw materials from vendors.

Overall Cost Leadership Differentiation
Cost Focus Differentiation Focus
Bro
ad
Narr
ow
Differentiation
Low Cost
Competitive Advantage
Com
peti
tive
Sco
pe
GENERIC STRATEGY
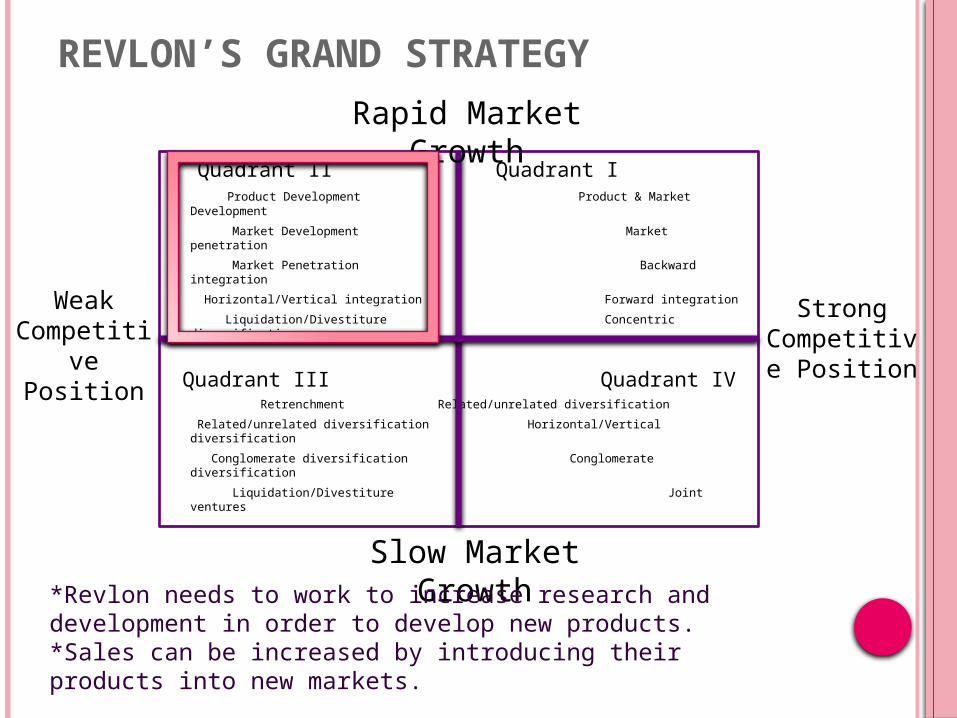
REVLON’S GRAND STRATEGY
Quadrant II Quadrant I Product Development Product & Market Development
Market Development Market penetration
Market Penetration Backward integration
Horizontal/Vertical integration Forward integration
Liquidation/Divestiture Concentric diversification
Quadrant III Quadrant IV Retrenchment Related/unrelated diversification
Related/unrelated diversification Horizontal/Vertical diversification
Conglomerate diversification Conglomerate diversification
Liquidation/Divestiture Joint ventures
Rapid Market Growth
Strong Competitive
Position
Weak Competitive Position
Slow Market Growth*Revlon needs to work to increase research and development in order to develop new products.*Sales can be increased by introducing their products into new markets.
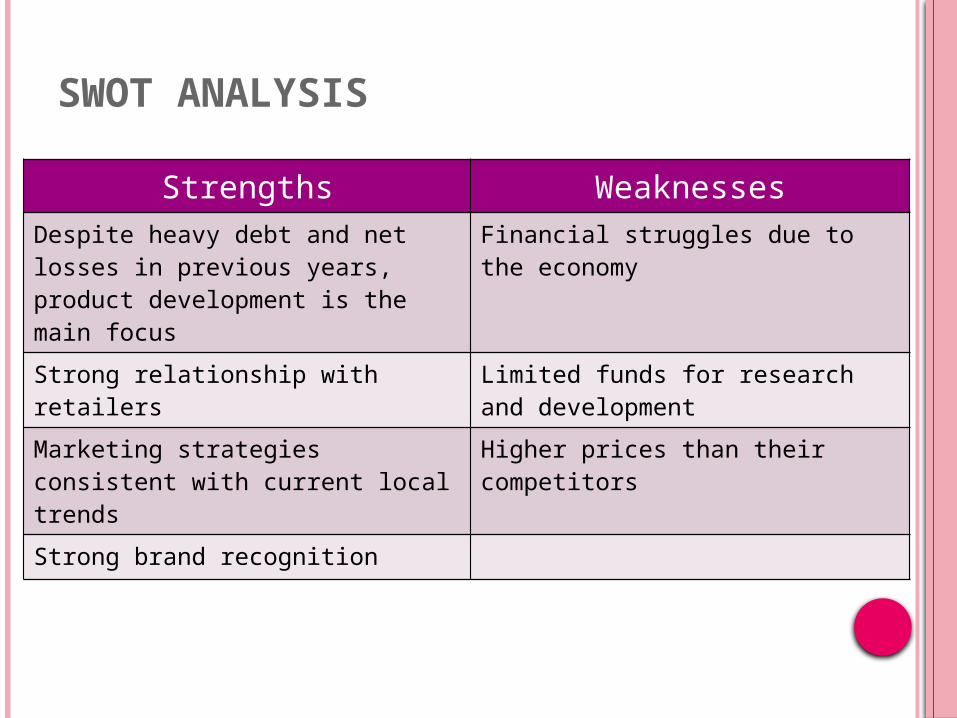
SWOT ANALYSIS
Strengths WeaknessesDespite heavy debt and net losses in previous years, product development is the main focus
Financial struggles due to the economy
Strong relationship with retailers Limited funds for research and development
Marketing strategies consistent with current local trends
Higher prices than their competitors
Strong brand recognition

SWOT ANALYSIS CONTINUED
Opportunities ThreatsE-commerce and use of social media
Changes in consumer purchasing habits
Growth in emerging markets Strict regulations in U.S. and other countries
Increase distribution Permanent make-up options

INTERNAL AND SWOT ANALYSIS
GENERIC AND GRAND STRATEGIES
CONCLUSIONS

Revlon’s sales and profits have fluctuated in the past 5 years.
Increase in consumer spending from Asia Pacific and Latin America has presented Revlon with an opportunity to expand their product market.
Increased spending on R&D will help Revlon to create better products and increase their market share against competitors.
Revlon needs to focus on market development in emerging markets to help increase sales.

![Revlon Media Kit Final[1] - Society for Women's Health ... · Revlon’“LoveIs’On”’Campaign ... Women!become!dependent!on!prescription!pain!relievers!more!quickly!than!men.!Learn!more](https://img.dokumen.tips/doc/110x75/5b408ad97f8b9a91078d5be4/revlon-media-kit-final1-society-for-womens-health-revlonloveisoncampaign.jpg)