Embed Size (px)
Citation preview

W O R K I N G P A P E R
Reversing NAFTA: A Supply Chain Perspective
March 2017


Reversing NAFTA: A Supply Chain Perspective
Authors: Terrie Walmsley1 and Peter Minor2
1 Terrie Walmsley, Managing Director, ImpactECON, LLC. 2 Peter Minor, Managing Director of Trade Policy, ImpactECON, LLC.


I
Contents
Contents i
Table of Tables ii
Table of Figures iii
Acronyms v
Abstract 1
1 Introduction 2
2 Methodology 4
2.1 The IESC model and database 4
2.2 Experiment and closure 6
3 Analysis 8
3.1 Macroeconomic impacts 8
3.1.1 Macroeconomic impacts on US economy 8
3.1.2 Macroeconomic impacts on Canada and Mexico 13
3.2 Sectoral impacts 16
3.2.1 Sectoral impacts for US economy 16
3.2.2 Sectoral impacts of Canada and Mexico 18
3.2.3 Three examples 20
3.2.4 Vertical specialization 23
3.3 Employment impacts 24
4 Conclusions 26
Bibliography 28
Appendix I Aggregation 29

II
Table of Tables
Table 1: MFN tariffs on motor vehicles imported from Mexico by the US 7
Table 2: US tariffs on Canadian and Mexican imports (preferential and MFN) 9
Table 3: Canadian and Mexican tariffs on US imports (preferential and MFN) 10
Table 4: Macroeconomic impact of US reversing NAFTA on US (percent change unless
otherwise noted) 11
Table 5: Macroeconomic impact of reversing NAFTA on Canada (percent change unless
otherwise noted) 14
Table 6: Macroeconomic impact of reversing NAFTA on Mexico (percent change unless
otherwise noted) 15
Table 7: Vertical specialization between US (producer of intermediates) and Mexico (producer
of final goods) (percent) 24
Table A1- 1: Sectoral aggregation 29
Table A1- 2: Regional aggregation 30

III
Table of Figures
Figure 1: Armington structure of the GTAP and IESC Models 5
Figure 2: Impact of reversing NAFTA on US production (percent changes) 17
Figure 3: Impact of reversing NAFTA on Canadian production (percent changes) 19
Figure 4: Impact of reversing NAFTA on Mexican production (percent changes) 19
Figure 5: Impact on employment of US reversing NAFTA (number of workers) 25
Figure 6: Impact on employment of US reversing NAFTA (number of workers) under
alternative unemployment assumptions 26


V
Acronyms
BEC Broad Economic Classification
CPI consumer price index
GDP real gross domestic product (nominal only when indicated)
GTAP Global Trade Analysis Project
IESC ImpactECON Global Supply Chain
MFN most favored nation
NAFTA North American Free Trade Agreement
ROW rest of world
US United States
WTO World Trade Organization


1
Abstract
Since the North-American Free Trade Agreement (NAFTA) entered into force in 1994,
production within the three NAFTA countries has become more specialized as foreign direct
investment and trade have been allowed to thrive and firms have taken advantage of economies
of scale and lower wages in Mexico. Extensive regional supply chains for producing motor
vehicles, chemicals, wearing apparel, among other commodities have emerged. Using a global
trade model tailored to include supply chains, we examine the impact of the United States (US)
extricating itself from the NAFTA. US tariffs on imports of goods from Canada and Mexico,
currently covered under the NAFTA, are assumed to rise to US most favored nation (MFN)
rates, compelling Canada and Mexico to reciprocate under World Trade Organisation (WTO)
rules. Overall, the results show that the US’s reversal of NAFTA leads to a decline in real GDP,
trade and investment in the US, Canada and Mexico, with most of the losses resulting from
Canada and Mexico’s reciprocation. The losses in low skilled employment are most significant,
with employment declining by 256,000, 125,000, and 951,000 in the US, Canada and Mexico
respectively. Production and specialization of production across the NAFTA region declines,
particularly in those sectors with the highest levels of vertical specialization across NAFTA.
The motor vehicles and services sectors in all three NAFTA countries decline, along with
production of US meat, food, and textiles; Canadian chemicals and metals; and Mexican textiles,
wearing apparel, electronics and machinery.

2
1 Introduction
The North-American Free Trade Agreement (NAFTA) between Canada, Mexico, and the
United States (US) entered into force in January 1994. NAFTA eliminated almost all tariffs
between the three countries, except for limited tariff rate quotas on sugar, meat, and food
products. Since the signing of the agreement, trade between the three NAFTA parties has
increased dramatically, from US$ 290 billion in 1993 to over US$ 1.1 trillion in 2013. NAFTA is
also believed to have raised investment and productivity, while increasing the variety and
reducing the price of goods available to consumers.
NAFTA has also been credited with helping US manufacturing become globally competitive,
by encouraging vertical specialization of production, allowing firms to take advantage of
economies of scale and lower wages in Mexico (Villarreal and Fergusson, 2013). Hummels,
Rapport and Yi (1998) measure the degree of vertical specialization in the motor vehicle
industry and show that this has increased substantially since the implementation of NAFTA.
Our own data also shows high vertical specialization in motor vehicles between US, Canada
and Mexico; chemicals and metals between US and Canada; and wearing apparel, electronics
and machinery between US and Mexico (Walmsley and Minor, forthcoming).
Critics on the other hand, blame NAFTA for the loss of US jobs to Mexico, caused by US
companies moving production facilities to Mexico to benefit from lower wages. The Economic
Policy Institute3 estimated that about 700,000 jobs were lost to Mexico between 1997 and 2013;
although Villarreal and Fergusson (2013) argue that technology and automation, rather than
NAFTA, are responsible for most of the job losses over this period. Regardless, the US Chamber
of Commerce4 estimates that about 14 million US jobs depend on trade with Canada and
Mexico, with NAFTA being responsible for a net increase of 5 million jobs.
In January 2016, the US Executive Office announced that renegotiating the NAFTA deal is
a priority, with the aim of increasing employment for all American’s, particularly in the
manufacturing industries.5 With public perception of trade agreements at an all-time low,
we examine the impact of increasing US tariffs on imports of goods from Canada and
Mexico to most favored nation (MFN) rates. The decision to use MFN rates, as opposed to
an arbitrary percent ceiling, reflects the fact that the US is bound to MFN rates under the
World Trade Organisation (WTO) Uruguay Round agreement and any tariff assessment
above WTO rates would be challenged in the WTO with resulting remedies.
3 Economic Policy Institute, (March 3, 2014). “NAFTA, Twenty Years After: A Disaster”, Blog posted by Jeff
Haux in Huffington Post, http://www.huffingtonpost.com/jeff-faux/nafta-twenty-years-after_b_4528140.html
4 https://www.uschamber.com/above-the-fold/the-nafta-the-candidates-haven-t-met 5 https://www.whitehouse.gov/trade-deals-working-all-americans.

3
According to WTO rules, a free trade agreement is required to cover a substantial amount
of trade between the parties—so there is some question over whether Canada and Mexico
could maintain tariff preferences on their imports from the US, while the US raises its
tariffs to Canada and Mexico on a substantial number of products (GATT: Article XXIV).
A legal analysis of the compliance of international trade agreements is beyond the scope
of this paper, which focusses on the economic impacts. To address the possibility that
Canada and Mexico may choose to retaliate or be forced by the WTO to reciprocate against
the US’s reversal of NAFTA, we also examine the impact of a potential rise in tariffs by
Canada and Mexico on US goods.
The paper uses a new global model and database, the ImpactECON Global Supply Chain (IESC)
model and database (Walmsley and Minor, 2016a and 2016b), that takes account of differences
in the sourcing of imports by firms, final consumers and the capital goods sector, as well as the
differential tariff rates paid by these purchasers. It is the first publicly available database of its
kind to take account of differences in tariff rates paid by firms, final consumers and capital
goods.6
Following the introduction, we provide an outline of the methodology used, including an
examination of the model. In section 3, the results are examined, commencing with the impacts
of the US’s reversal of NAFTA, first on the US economy and then on Canada and Mexico. The
results are also separated into those due to the US raising tariffs (no reciprocation) and those
due to Canada and Mexico reciprocating (Canada and Mexico’s reciprocation); the two results
combined are referred to as those due to the reversal of NAFTA (with reciprocation). This is
then followed by an analysis of the employment impacts. Section 4 then summarizes and
presents the conclusions.
Overall, the results show that the US raising tariffs on NAFTA parties (no reciprocation), back
to MFN rates, causes all NAFTA parties to experience declines in real GDP, trade, investment
and employment; with the potential for much greater loses should Canada and Mexico
reciprocate. The reversal of NAFTA (with reciprocation) leads to 256,000 unemployed low
skilled workers in the US in the short to medium run (3-5 years), with thousands more workers
having to relocate to other sectors to find employment. If skilled workers are also assumed
vulnerable to reversing NAFTA, then US unemployment rises by over 1.2 million. The reversal
of NAFTA (with reciprocation) causes US trade with Canada and Mexico to decline
significantly, although trade between Canada and Mexico, and with the rest of the world, rises;
all three NAFTA countries experience an overall decline in trade.
The largest declines for the US from the reversal of NAFTA occur in meat, food, textiles, motor
vehicles and services. There are some small increases in production and employment in selected
heavy manufacturing, namely machinery, electronic equipment, metal and chemicals, however
6 See https://impactecon.com/resources/supply-chains/

4
the small gains in these sectors are more than offset by the loses in the motor vehicles and
services sectors.
For Canada and Mexico, production diminishes in several key sectors because of the reversal
of NAFTA, particularly those sectors where production is highly integrated with the US such
as chemicals, metals, and motor vehicles for Canada and textiles, wearing apparel, electronics,
machinery and motor vehicles for Mexico. Canada and Mexico experience greater declines in
production from raising their own tariffs, suggesting that an optimal trade response for these
parties would be to do nothing in response to the US raising its tariffs, albeit this may not be an
option given WTO rules.7
2 Methodology
2.1 The IESC model and database
The ImpactECON Global Supply Chain (IESC) model (Walmsley and Minor, 2016a) and
database (Walmsley and Minor, 2016b)8 is based on the widely used GTAP model (Hertel and
Tsigas, 1997) and database (Narayanan et al, 2015).
The main addition to the IESC model is the treatment of imports. The GTAP model uses a
nested Armington demand structure (Figure 1) to differentiate between domestic (QFDi,j,r) and
imported (QFMi,j,r) intermediate goods, followed by imports from different source regions
(QXSi,s,r). As can be seen in the shaded area of Figure 1 (panel 1), the imports of firms (QFMi,j,r,
including the capital goods sector), private consumers (QPMi,r) and government (QGMi,r) are
aggregated into total imports (QIMi,r) before being allocated across sources, s (QXSi,s,r). This is
done because data on imports by agents – firms, the capital goods sector, private households
and government – and source are not available in the GTAP Data Base. This lack of supply
chain data on imports also precludes the inclusion of differential tariffs by agent and source.
The IESC model and database are extensions of the GTAP model and database that include the
critical information on supply chains and differential tariffs by agent. The main feature of the
IESC model are that bilateral trade flows and tariffs are distinguished by the agent purchasing
the imported commodity. In Figure 1 (panel 2), this is evidenced by the fact that imports are
not aggregated across all agents, instead imports are distinguished by both source and agent
(QFMSi,j,s,r, firms and investment; QPMSi,s,r, private and QGMSi,s,r, government) – see shaded
area in Figure 1, panel 2.
7 Canada and the US had a free trade agreement before the NAFTA. A possibility has been raised that the
US and Canada could revive this agreement from its current status. A full legal analysis of this possibility is beyond the scope of this paper.
8 The model is solved using Gempack (Harrison and Pearson, 2007).
5
Figure 1: Armington structure of the GTAP and IESC Models
GTAP Model IESC Model
Source: Hertel and Tsigas (1997) Source: Walmsley and Minor (2016b)
Where: QOj,r is output of commodity j in region r; QVAj,r is value added used in production of j; QFi,j,r is intermediate (including capital goods sector) demand for commodity i in production of j (domestic (QFDi,j,r) and imported (QFMi,j,r) intermediate demand); QPMi,r is private consumers demand for imports of commodity i; QGMi,r government demand for imports of commodity i. QIMi,r is aggregate imports of commodity i by all agents; QXSi,s,r is total imports of commodity i by both source and destination; QFMSi,j,r, QPMSi,r and QGMSi,r is imports of commodity i by agent (firms (including capital goods sector)) private consumers and government), source and destination.

6
The ability to capture sourcing of imports and tariffs by agent is possible because of the
underlying supply chain database which uses the Broad Economic Classification (BEC) end-use
categories to estimate the source of imports by firms, final consumers and the capital goods
sector. Further details on the construction of this supply chain database can be obtained in
Walmsley and Minor (2016b) and Walmsley and Minor (forthcoming). The database is then
aggregated into 15 commodities and 9 regions depicted in Tables A1-1 and A1-2 respectively
for this analysis.
2.2 Experiment and closure
The reversal of NAFTA is divided into two parts for the analysis:
US raises tariffs on NAFTA partners (no reciprocation): the impact of the US raising
tariffs on goods from Canada and Mexico to MFN rates; and
Canada and Mexico reciprocate: the impact of Canada and Mexico reciprocating by
raising tariffs on goods from the US to MFN rates.9
Reciprocation by Canada and Mexico could be required by the WTO, since the most favored
nation principals do not permit preferential tariffs outside a fully functioning FTA or the
Generalized System of Preferences (GSP), which are reserved for developed countries
providing preferences to developing countries.
The results are further broken into the implications of raising tariffs on intermediate,
consumption and investment goods to further illustrate the supply chain impacts. Although it
is impossible to know exactly which tariffs would be renegotiated in a re-examination of
NAFTA, we chose to implement MFN rates, since MFN rates represent the maximum legal rates
that can be applied by the US, Canada and Mexico, as WTO signatories—without fear of trade
remedies.10
MFN tariffs by commodity and by BEC end-use category (intermediates, consumption and
investment) for the US, Canada and Mexico are obtained to estimate the MFN tariffs applied to
each agent (firms, investment and final consumers (including government and private
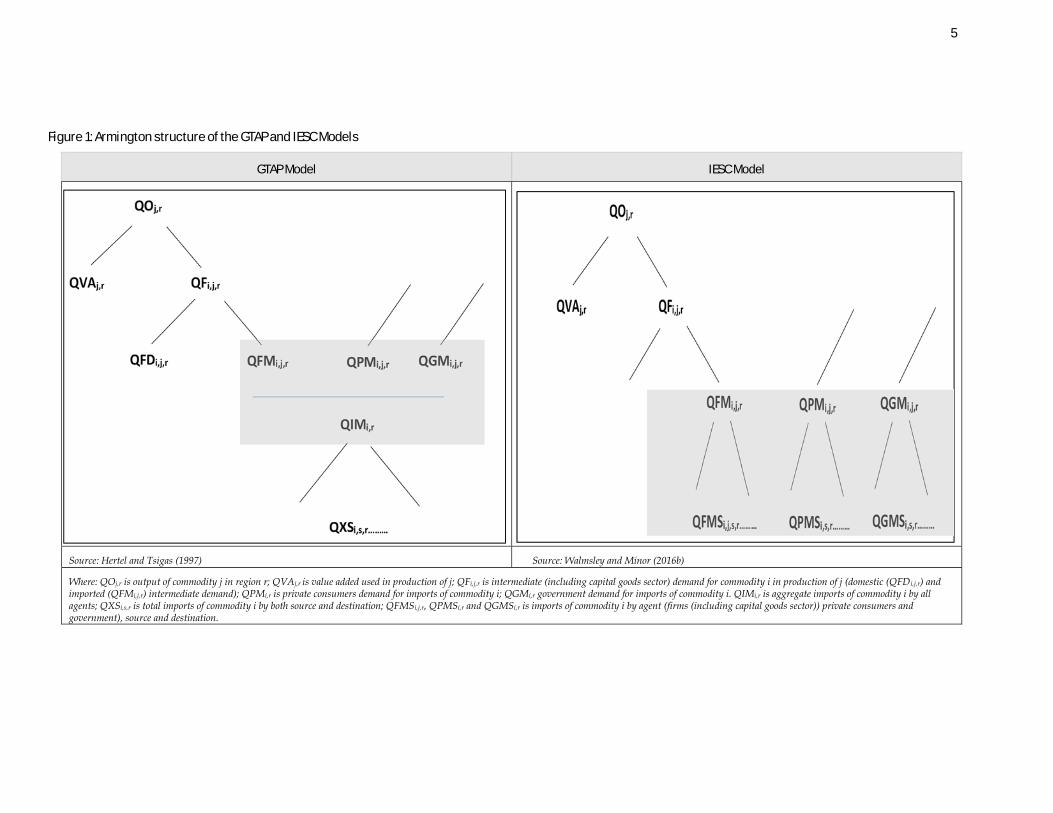
households)). Table 1 illustrates data for motor vehicles. The data for motor vehicles shows
that the US MFN tariff rate on (all) motor vehicles from Mexico is 3.5 percent. This is based on
a share weighted average of a 6.9 percent MFN tariff rate on motor vehicles for investment (e.g.,
cranes, semi-trailers and tractors), a 1 percent MFN tariff on intermediates (primarily auto
parts) and a 1.3 percent MFN tariff on consumption goods (e.g., passenger cars). With
information on imports by agent and source omitted from the GTAP Data Base, the US tariff on
9 We assume Canada and Mexico continue to meet their NAFTA obligations with regards to each other. 10 WTO rules require compliant developed country FTAs to cover substantially all products in an FTA (GATT:
Article XXIV).
7
imported motor vehicles is simply increased from an initial rate of zero to 3.5 percent. In the
supply chain model the rise in tariffs on the capital goods sector can be separately identified
from that applied to firms and to final consumers. By doing this the higher MFN rate on cranes,
semi-trailers and tractors of 6.9 percent is appropriately applied to the capital goods sector.
Rather than changing all motor vehicle tariffs to 3.5 percent, tariffs on capital goods are raised
to 5.7 percent, tariffs on firms to 1 percent and tariffs on final consumers to 1.1 percent (Table
1).
Why is the new tariff on the capital goods sector 5.7 percent rather than 6.9 percent? The reason
is that the BEC end-use categories are different from agents. The capital goods sector purchases
both cranes, semi-trailers and tractors (81%) and auto parts (19%) and hence the average tariff
paid by the capital goods sectors is a weighted average of the two with appropriate weights
(0.81 x 6.9 + 0.19 x 1); where the weights are obtained from a matrix produced as part of the
construction of the IESC database and the reconciliation of the BEC trade data and the GTAP
data (see Walmsley and Minor (forthcoming) for further details).
Another benefit of the supply chain model is that policies targeting tariff rates on motor vehicles
for investment purposes or any other BEC end-use category can be examined separately.11 With
information on imports by agent and source missing from the GTAP Data Base, the only way
to raise the tariffs on cranes, semi-trailers and tractors to 6.9 percent, is to shock the average
tariff on (all) motor vehicles to 2.9 percent (or 0.42 x 6.9, since cranes, semi-trailers and tractors
account for 42% of trade according to BEC trade data, Table 1). In the supply chain model,
however, this can be achieved by targeting the tariff on capital goods to 5.4 percent (or 0.81 x
6.9).
Table 1: MFN tariffs on motor vehicles imported from Mexico by the US
BEC category / agent
MFN Tariff by
BEC category
Trade share by
BEC category
GTAP Model
MFN Tariff by agent in IESC Model
Investment/capital goods sector 6.9% 0.42 2.9% 5.7%
Intermediate/firms 1% 0.45 0.5% 1.0%
Consumption/final consumers 1.3% 0.13 0.2% 1.1%
Average/total 3.5% 1.00 3.5% 3.5%
Source: International Trade Center (2006) and IESC Database (Walmsley and Minor, 2016a)
In the analysis undertaken in this paper the overall results are categorized into the impacts of
raising tariffs on each of the three end-use categories. MFN tariffs by commodity and agent for
the US and for Canada and Mexico are depicted in Table 2 and Table 3 respectively along with
the applied preferential rate in 2011 (the base year of the data). Initially, preferential tariffs
between the NAFTA countries are zero for most commodities, except for sugar, meat and food
11 https://impactecon.com/resources/supply-chains/

8
products. Table 2 and Table 3 also illustrate that MFN tariffs are lower in the US than in Canada
and Mexico, and are also higher on purchases by the capital goods sector and final consumers,
than on purchases by firms.
Another issue of importance in this analysis is the implication of raising tariffs on employment,
particularly in manufacturing where one of the aims of revisiting the NAFTA agreement is the
revival of manufacturing jobs in the US. Real wages of low skilled workers (clerks, service and
shop workers and low skilled workers) are assumed to be fixed in all three NAFTA countries,
causing unemployment. The inclusion of numbers of workers employed by occupation, sector
and region enables detailed analysis of how many jobs are created or lost and in which sectors
– thereby illustrating the flow of workers between sectors and into unemployment. Finally,
combining the quantity (number of workers) and value (input-output) data permits analysis of
the wages, which differ across sectors.
Other than unemployment of low skilled labor, the closure represents the short to medium run
(3-5 years) with labor and capital assumed to be mobile across sectors. US imports of sugar from
non-NAFTA regions are also fixed to reflect quotas. Finally, trade balances are determined
endogenously by the fixed domestic savings rate and investment that responds to rate of return
differentials across regions.
3 Analysis
3.1 Macroeconomic impacts
3.1.1 MACROECONOMIC IMPACTS ON US ECONOMY
As expected US raising tariffs (no reciprocation) on imports from Canada and Mexico to MFN
rates is detrimental to the US economy – real GDP, trade and investment fall (column II, Table
4). The negative impacts of the reciprocation by Canada and Mexico are more detrimental to
the US than the rise in the US tariffs on NAFTA members (compare columns II and III, Table
4). This is not surprising since the US supplies a large share of Canada and Mexico’s imported
intermediates and Canada and Mexico have higher MFN tariffs (Table 2). While the changes in
real GDP are relatively small, the unemployment impacts show that almost 256,000 people
become unemployed because of the US’s reversal of NAFTA, of which 68,000 is due to the US
raising tariffs on Canadian and Mexican goods (column II, Table 4).

9
Table 2: US tariffs on Canadian and Mexican imports (preferential and MFN)
US Tariffs on imports from Canada* US Tariffs on imports from Mexico*
Initial
preferential tariffs
MFN tariffs by agent Initial preferential
tariffs
MFN tariffs by agent
Sector average**
Firms Final
consumer Capital
Sector average**
Firms Final
consumer Capital
I II III IV V VI VII VIII IX X
Crops and Forestry 0.0 2.0 2.1 1.9 2.2 0.0 3.8 3.8 3.9 4.1
Livestock and Fishing 0.0 0.2 0.2 0.2 0.2 0.0 0.6 0.6 0.5 0.5
Sugar 3.8 7.4 7.4 7.4 7.4 0.0 28.9 28.9 28.4 28.4
Extraction 0.0 0.5 0.5 2.1 0.6 0.0 5.6 5.6 6.5 6.7
Meat Products 0.0 5.2 5.1 5.4 5.4 0.0 6.2 6.1 6.2 6.2
Food 1.9 9.2 9.1 9.4 9.4 0.2 8.4 7.9 8.6 8.6
Textiles 0.0 6.6 6.6 6.8 6.8 0.0 7.2 7.1 8.4 8.4
Wearing Apparel and Leather 0.0 12.5 11.3 12.5 12.5 0.0 9.7 8.7 9.9 9.9
Chemicals 0.0 2.2 2.5 0.9 1.2 0.0 2.6 2.9 2.1 2.1
Metals 0.0 1.2 1.2 1.4 1.3 0.0 1.3 1.3 0.9 1.7
Electronic Equipment 0.0 0.3 0.2 1.5 0.1 0.0 0.8 0.2 1.3 0.1
Machinery 0.0 0.9 1.1 1.5 0.7 0.0 1.2 1.3 0.7 1.0
Motor Vehicles 0.0 1.3 1.1 1.2 1.6 0.0 3.5 1.0 1.1 5.6
Other Manufactures 0.0 0.3 0.3 0.8 0.1 0.0 0.9 0.9 1.0 0.4
Services 0.0 0.0 0.0 0.0 0.0 0.0 0.0 0.0 0.0 0.0
Source: GTAP Data Base (Narayanan, Aguiar et al., 2016) and International Trade Center (2006).
*Trade weighted averages of HS6 commodity detail by the share of US imports of the respective party. But for the difference in trade weights, the US MFN rates are the same for all WTO members, including Canada and Mexico.
**The sector average is equal to the trade weighted average of the IESC tariffs by agent (firms, final consumer, capital). This average is also the value which would be applied to all agents equally in the GTAP database and model, since the GTAP framework does not make any distinction of goods by purchasing agent.

10
Table 3: Canadian and Mexican tariffs on US imports (preferential and MFN)
Canadian tariffs on US Imports Mexican tariffs on US Imports
Initial preferential
tariffs
MFN tariffs by agent Initial preferential
tariffs
MFN tariffs by agent
Sector average** Firms Final
consumer Capital
Sector average**
Firms Final
consumer Capital
I II III IV V VI VII VIII IX X
Crops and Forestry 0.0 7.2 7.2 7.2 8.0 0.6 11.6 11.6 12.0 12.3
Livestock and Fishing 6.0 4.8 1.7 14.9 0.1 0.0 7.0 6.9 8.7 6.0
Sugar 0.0 3.7 3.9 0.9 0.9 0.0 43.2 43.2 43.2 43.2
Extraction 0.0 0.4 0.4 0.3 0.4 0.0 4.0 3.6 4.9 4.4
Meat Products 35.7 41.6 40.4 43.9 43.9 0.0 57.8 51.7 63.5 63.5
Food 13.2 64.3 51.2 76.6 76.6 1.4 32.1 45.9 28.3 45.9
Textiles 0.0 7.0 6.1 12.8 12.8 0.2 14.8 14.6 24.8 24.8
Wearing Apparel and Leather 0.0 11.5 9.8 12.1 12.1 0.0 23.7 20.8 26.9 26.9
Chemicals 0.0 2.5 2.4 3.2 3.2 0.1 6.7 6.3 9.7 5.0
Metals 0.0 0.7 0.6 1.8 0.9 0.0 5.9 5.9 9.9 7.3
Electronic Equipment 0.0 0.2 0.1 1.0 0.3 0.0 3.8 3.5 16.7 1.4
Machinery 0.0 0.6 0.4 2.0 0.4 0.1 6.5 5.7 10.0 7.0
Motor Vehicles 0.0 4.5 3.1 4.9 6.0 0.0 12.9 10.1 16.3 28.7
Other Manufactures 0.0 2.4 2.1 3.3 2.1 0.6 8.3 7.7 11.1 9.7
Services 0.0 0.0 0.0 0.0 0.0 0.0 0.7 0.7 0.7 0.0
Source: GTAP Data Base (Narayanan, Aguiar et al., 2016) and International Trade Center (2006).
*Trade weighted averages of HS6 commodity detail by the share of US imports of the respective party. But for the difference in trade weights, the US MFN rates are the same for all WTO members, including Canada and Mexico.
**The sector average is equal to the trade weighted average of the IESC tariffs by agent (firms, final consumer, capital). This average is also the value which would be applied to all agents equally in the GTAP database and model, since the GTAP framework does not make any distinction of goods by purchasing agent.

11
Table 4: Macroeconomic impact of US reversing NAFTA on US (percent change unless otherwise noted)
Total
US raises Tariffs
Reciprocation
Raising Tariffs on:
Intermediate goods Consumption goods Investment goods
US raises Tariffs Reciprocation US raises Tariffs Reciprocation US raises Tariffs Reciprocation
I II III IV V VI VII VIII IX
Real GDP -0.09 -0.03 -0.06 -0.02 -0.03 -0.01 -0.01 0.00 -0.01
Exports -0.92 -0.57 -0.34 -0.34 -0.23 -0.28 -0.12 0.05 0.01
to NAFTA -16.42 -2.29 -14.13 -1.32 -7.54 -0.66 -4.71 -0.31 -1.87
to ROW 3.53 -0.08 3.61 -0.06 1.92 -0.17 1.23 0.15 0.46
Imports -2.18 -0.40 -1.78 -0.19 -0.98 -0.07 -0.61 -0.14 -0.19
from NAFTA -8.03 -3.77 -4.26 -2.24 -2.43 -0.93 -1.73 -0.60 -0.10
from ROW -0.53 0.55 -1.08 0.39 -0.57 0.18 -0.29 -0.01 -0.22
Change in Trade Balance (US$ Millions) 28,366 4,926 23,440 1,469 12,890 -1,504 8,299 4,961 2,251
Investment -0.91 -0.20 -0.72 -0.05 -0.40 0.05 -0.25 -0.19 -0.06
Terms of trade -0.55 0.21 -0.75 0.12 -0.41 0.08 -0.27 0.01 -0.08
Consumer price index (CPI) -0.43 0.07 -0.50 0.02 -0.25 0.06 -0.18 -0.01 -0.07
Employment (number of persons) -255,678 -67,726 -187,952 -42,465 -97,468 -31,949 -53,420 6,689 -37,063
Source: Authors’ calculations.

12
When the US raises tariffs on imports from Canada and Mexico (no reciprocation), US
consumers substitute towards imports from the rest of the world (ROW in Column II, Table 4);
and US exports to both NAFTA and the rest of the world fall, as the rise in tariffs causes the
price of US goods rise (Column II, Table 4). When Canada and Mexico reciprocate, US exports
to the rest of the world increase and imports from the rest of the world fall. Overall, exports fall
less than imports and hence the trade balance rises (i.e., the deficit falls); although this is
fundamentally caused by a fall in investment, as foreigners chose to invest their savings outside
the US.
Prices, wages and the terms of trade fall with the reversal of NAFTA as the depreciation due to
Canada and Mexico’s reciprocation offsets the appreciation experienced when the US raised
tariffs (column II, Table 4). Exports to the rest of the world rise slightly to partly compensate
for the loss of trade with the other NAFTA countries, although overall exports still fall.
The decomposition of the results (Table 4, columns IV-IX) by end-use reveals differences in how
the US economy responds to the higher tariffs on imports from NAFTA parties for intermediate,
consumption and investment goods. For instance, higher US tariffs on investment goods
increases real GDP (0.002), exports (0.05) and employment (6,689) slightly (Column VIII, Table
4) because the US is a large player in global trade, and has a bias towards exporting investment
goods (i.e., there is an optimal tariff). Nevertheless, raising tariffs on investment goods raises
the cost of investment goods, significantly reducing investment and causing long run economic
growth to decline.
Table 4 (columns IV-VII) illustrates that higher tariffs on intermediate and consumption goods
reduce GDP, employment, exports, and imports although the mechanism through which they
impact the economy differs. For instance, when a country raises tariffs on intermediate inputs
this raises the costs of production causing firms to substitute towards domestic goods and final
consumers away from domestic goods (Column IV, Table 4). Raising US tariffs on final
consumption goods causes a real appreciation12; US final consumers substitute Canadian and
Mexican goods with domestically produced goods or imports from the rest of the world
(Column VI, Table 4). In both cases, prices rise and exports fall. Overall US GDP falls, as the
negative impact of raising tariffs on intermediate and consumption goods outweigh the very
small gains from raising tariffs on investment goods.
One notable difference between the intermediate and consumption tariff (Columns IV and VI,
Table 4) results is their respective impacts on investment. The differences stem from how the
rise in tariffs alters the rate of return. Increasing tariffs on intermediate goods raises a firms’
costs, lowering the return to capital and hence the rate of return, causing investment to fall.
When tariffs on consumption goods are raised, there is increased demand for domestic goods,
as consumers substitute towards the domestic good, causing the return on capital and hence
12 Note that the model does not contain a real or nominal exchange rate, however “real appreciation” effects
are apparent in the model and can be seen in the general rise in factor prices.

13
investment to rise. As noted previously, tariffs on investment goods raise the cost of capital
goods, causing the rate of return and investment to decline. When the investment impacts due
to raising tariffs on all three BEC end-use categories are combined, investment is projected to
fall by 0.19 percent; this is largely driven by the higher cost of imported investment goods from
Canada and Mexico reducing rates of return in investment. With savings fixed as a portion of
income, changes in investment subsequently drive the changes seen in the trade balance – hence
the decline in the trade balance when tariffs are raised on consumption goods.
Columns V, VII and IX (Table 4) illustrate that the negative impact on the US economy of
Canada and Mexico reciprocating is mostly due to the raising of tariffs on intermediates goods
by Canada and Mexico, despite MFN tariffs being lower on intermediate goods. This is not
surprising since the US is an important source of imported intermediates, particularly for the
Mexican economy, and Canada and Mexico’s reciprocation raises the costs of their production,
resulting in a more detrimental impact on their production, which in turn reduces their demand
for US intermediates.
3.1.2 MACROECONOMIC IMPACTS ON CANADA AND MEXICO
The impact of reversing NAFTA on Canada and Mexico are displayed in Table 5 and Table 6
respectively. The results show declines in real GDP, investment, trade and employment in both
countries, with exports to NAFTA (most notably the US) declining as Canada and Mexico seek
to export to countries other than the US.
When the US raises its tariffs, there is a decline in demand for Canadian and Mexican goods by
the US, that causes a real depreciation (or a fall in factor returns) in Canada and Mexico that
assists in raising their exports to other countries, including to each other. This real depreciation
can be seen in the decline in the terms of trade (column II of Table 5 and Table 6). Canada and
Mexico’s reciprocation is particularly detrimental (column III of Table 5 and Table 6) due to the
heavy reliance of Canadian and Mexican firms on imported intermediate goods from the US
for production and on US demand for their exports, as well as the higher MFN tariffs levied by
Canada and Mexico. Real GDP falls by a further 0.69 percent in Mexico of which -0.39 percent
is due to raising tariffs on intermediate goods and -0.31 percent from raising tariffs on final
goods. Trade within NAFTA falls and exports to the rest of the world also fall. Prices rise in
Canada and Mexico, although the rise does not fully offset the initial depreciation in the real
exchange rate experienced by Mexico when the US raises its tariffs (column II of Table 6) – terms
of trade rise by 1.11, giving a net fall of 0.52.

14
Table 5: Macroeconomic impact of reversing NAFTA on Canada (percent change unless otherwise noted)
Total
US raises Tariffs
Reciprocation
Raising Tariffs on:
Intermediate goods Consumption goods Investment goods
US raises Tariffs Reciprocation US raises Tariffs Reciprocation US raises Tariffs Reciprocation
I II III IV V VI VII VIII IX
Real GDP -0.48 -0.15 -0.33 -0.09 -0.09 -0.04 -0.23 -0.01 -0.01
Exports -2.37 -0.40 -1.97 -0.27 -0.78 -0.05 -1.25 -0.07 0.06
to NAFTA -4.61 -2.69 -1.92 -1.63 -0.86 -0.83 -1.07 -0.23 0.02
to ROW 1.71 3.85 -2.14 2.24 -0.65 1.38 -1.61 0.23 0.13
Imports -3.00 -0.74 -2.26 -0.19 -0.98 -0.47 -1.03 -0.07 -0.25
from NAFTA -7.58 -1.25 -6.33 -0.82 -1.94 -0.47 -3.70 0.03 -0.69
from ROW 2.34 -1.76 4.10 -1.07 1.14 -0.48 2.64 -0.22 0.33
Change in Trade Balance (US$ Millions) 5,121 2,287 2,834 1,429 740 925 557 -67 1,537
Investment -1.49 -0.76 -0.72 -0.47 -0.17 -0.30 -0.09 0.01 -0.46
Terms of trade 0.06 -0.59 0.65 -0.35 0.28 -0.23 0.35 -0.02 0.01
Consumer price index (CPI) 0.69 -0.20 0.89 0.08 0.17 -0.24 0.71 -0.03 0.01
Employment (number of persons) -125,078 -41,202 -83,875 -25,394 -23,670 -13,328 -56,368 -2,481 -3,838
Source: Authors’ calculations.

15
Table 6: Macroeconomic impact of reversing NAFTA on Mexico (percent change unless otherwise noted)
Total
US raises Tariffs
Reciprocation
Raising Tariffs on:
Intermediate goods Consumption goods Investment goods
US raises Tariffs Reciprocation US raises Tariffs Reciprocation US raises Tariffs Reciprocation
I II III IV V VI VII VIII IX
Real GDP -0.88 -0.19 -0.69 -0.17 -0.39 0.00 -0.31 -0.02 0.01
Exports -6.05 -0.65 -5.39 -0.35 -3.54 -0.08 -1.87 -0.22 0.01
to NAFTA -9.80 -4.23 -5.57 -2.48 -3.66 -0.84 -1.90 -0.91 0.00
to ROW 6.12 10.99 -4.87 6.56 -3.17 2.41 -1.76 2.02 0.06
Imports -8.46 -2.69 -5.77 -1.34 -4.03 -0.65 -1.76 -0.71 0.02
from NAFTA -25.05 -3.05 -22.00 -1.48 -14.08 -0.92 -4.94 -0.65 -2.99
from ROW 14.94 -2.55 17.49 -1.08 11.10 -0.73 3.07 -0.73 3.31
Change in Trade Balance (US$ Millions) 5,565 669 4,897 -145 2,927 435 389 379 1,580
Investment -3.29 -1.05 -2.24 -0.41 -1.28 -0.34 -0.10 -0.30 -0.86
Terms of trade -0.52 -1.62 1.11 -0.94 0.71 -0.39 0.37 -0.29 0.03
Consumer price index (CPI) -0.55 -1.64 1.09 -0.86 0.39 -0.43 0.69 -0.35 0.01
Employment (number of persons) -951,002 -137,587 -813,415 -45,225 -530,634 -42,809 -296,984 -49,553 14,204
Source: Authors’ calculations.

16
Employment falls by almost 1 million jobs in Mexico; most of which occur from raising tariffs
on intermediate goods, despite MFN tariffs being lower on intermediate goods. This is not
surprising since the US is an important source of imported intermediates, particularly for the
Mexican economy, and raising tariffs on intermediates raises the costs of production, resulting
in a more detrimental impact on Mexican production and hence employment. Employment
falls more in Mexico than in the US or Canada due to the higher use of low skilled labor in
production. This reduction in employment undoes one of the original intentions of NAFTA –
to improve employment prospects in Mexico to help reduce migration flows. Reciprocation is
clearly not the preferred option for Canada and Mexico, however, given WTO rules this may
be unavoidable.
3.2 Sectoral impacts
3.2.1 SECTORAL IMPACTS FOR US ECONOMY
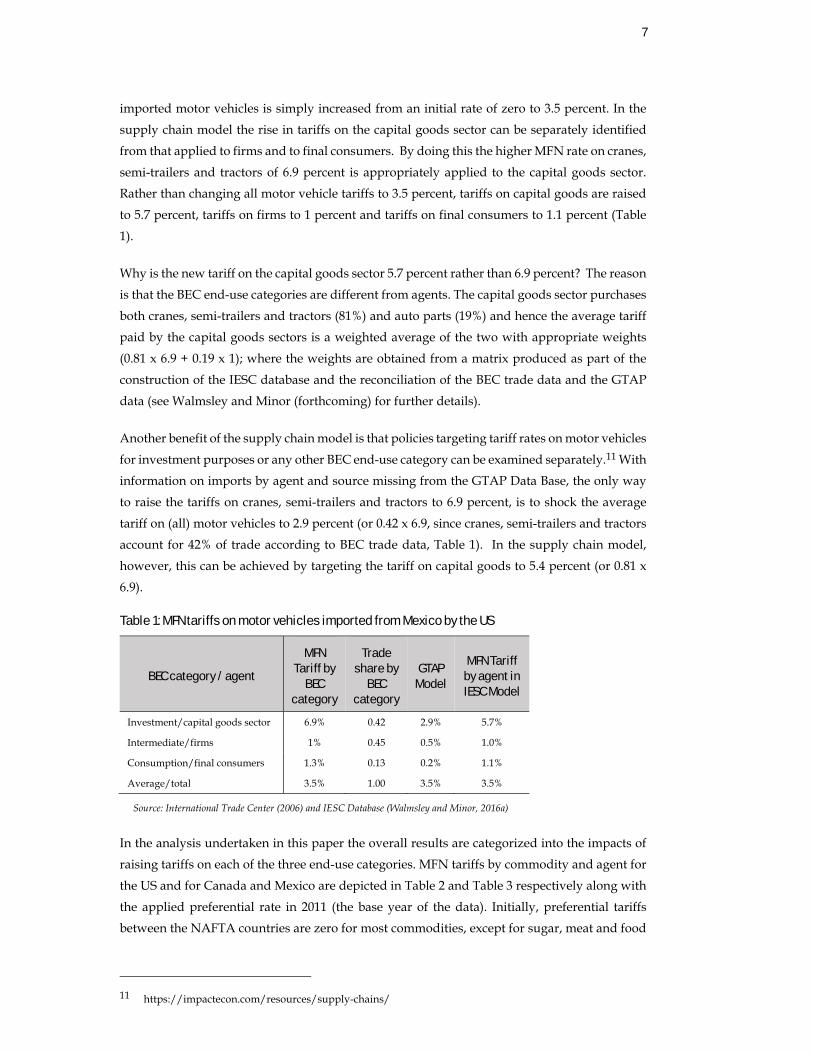
Figure 2 summarizes the sectoral impacts of reversing NAFTA on US production. The figures
apportion the impacts on sectoral production into those due to the US (i.e., US raises tariffs),
and those due to Canada and Mexico (i.e., reciprocation) raising tariffs. Each of these is further
decomposed into those due to increased tariffs on intermediate, consumption and investment
goods, as defined by BEC. The figure shows that the implications for sectoral production differ
depending on whether tariffs are raised on intermediate, consumption or investment goods
and on whether the tariff was raised by the US itself, or its NAFTA partners. As in the
macroeconomic impacts, most of the losses occur from Canada’s and Mexico’s reciprocation
rather than from the initial rise in tariffs by the US.
Several mechanisms are identified to explain the sectoral impacts of reversing NAFTA.
Tariffs on intermediates goods
An increase in own tariffs on intermediates will tend to raise the cost of producing final goods,
causing demand and production to fall. While imports of intermediates declines, imports of
final goods rise, resulting in a potential increase in exports and production for the partner. An
example of this is US production of electronic equipment: an increase in the US’s own tariffs
(Figure 2) raises costs and reduces US production; while reciprocation by Canada and Mexico
(Figure 2), raises Canadian and Mexican costs of production, increasing their imports from the
US (or US exports), raising US production. Other examples where the fall in intermediate
exports from the reciprocation is outweighed by a rise in final exports include other
manufactures, machinery and wearing apparel (Figure 2). Alternatively, the fall in intermediate
exports outweighs the rise in final exports in US motor vehicles and food production (Figure
2).
17
Figure 2: Impact of reversing NAFTA on US production (percent changes)
Source: Authors’ calculations.
If the good is primarily an intermediate input itself then its own costs are less affected by the
increase in tariffs on intermediates, instead there is an increase in demand and hence
production as domestic firms substitute away from intermediate imports towards domestic
intermediate inputs. Examples include sugar, crops and forestry, and textiles where the
impacts of intermediates (Figure 2) are reversed.
Tariffs on Final goods (investment or consumption goods)
An increase in tariffs on final goods may result in a rise or fall of production depending on: a)
the extent to which consumers substitute imports for the domestic good, and b) the importance
of exports. For instance, in the case of wearing apparel, meat and food production the rise in
US tariffs on final consumption goods (orange, Figure 2) causes final consumers to switch from
imports to domestic goods causing production of the domestic good to rise. Exports play a
minor role since the US does not export a lot of these products relative to domestic demand.
The reverse occurs when Canada and Mexico reciprocate (green, Figure 2).
In the case of US heavy manufactures (e.g., chemicals, metals, electronics, machinery, and other
manufacturing) the impact of the rise in tariffs on exports plays a greater role – offsetting any
change in domestic sales. This will depend on the importance of exports and the extent to which
prices adjust. When the US raises tariffs on its NAFTA partners, exports of chemicals, metals,
electronics, machinery, and other manufacturing fall due to the real appreciation, offsetting any
increase in domestic sales (orange, Figure 2). The reverse is true for the reciprocation by Canada
0.04
‐1.16
5.11
0.16
‐1.54
‐1.69
‐0.71
0.52
0.24
0.34
1.03
0.61
‐1.22
0.24
‐0.10
‐4 ‐2 0 2 4 6 8
Crops and Forestry
Livestock and Fishing
Sugar
Extraction
Meat Products
Food
Textiles
Wearing App and Leather
Chemicals
Metals
Electronic Equipment
Machinery
Motor Vehicles
Other Manufactures
Services
USA
Intermediate US raises tariffs Intermediate Reciprocation Consumption US raises tariffs
Consumption Reciprocation Investment US raises tariffs Investment Reciprocation
Net Impact (numbers)

18
and Mexico (green, Figure 2), exports rise with the real depreciation causing production to rise.
Overall production of US heavy manufactures (e.g., chemicals, metals, electronics, machinery,
and other manufacturing) rise slightly as the rise in exports from reciprocation by Canada and
Mexico outweigh the fall in exports from the US raising its own tariffs.
Two additional factors that dampen the final outcome on production: first, the extent to which
domestic sales rise may be reduced if final consumers tend to substitute more towards other
imported sources than towards domestic goods. Second, the extent to which the US supplies
intermediate inputs to its partners (Canada and Mexico) for production (i.e., high vertical
specialization). For instance, the US raising tariffs on final goods reduces Canadian and
Mexican production of motor vehicles, which also reduces demand for US intermediates.
The resulting change in sectoral production depends on the relative importance of each of these
mechanisms. In general, the results show that the US does obtain some small gains in sugar,
wearing apparel, chemicals, metals, electronic equipment and machinery, however the losses
in motor vehicles, textiles, meat, food and services far exceed these small gains. Three examples
– sugar, motor vehicles and wearing apparel – are discussed below to illustrate how these
mechanisms interact; but first, we outline the sectoral impacts on Canada and Mexico.
3.2.2 SECTORAL IMPACTS OF CANADA AND MEXICO
The impact of reversing NAFTA on domestic production in Canada and Mexico is illustrated
in Figure 3 and Figure 4, respectively. As described above, sectoral production of final goods
decline when tariffs on intermediate inputs are raised; while the impact on sectoral production
of a rise in tariffs on final goods (consumption and investment) is mixed, depending on the size
of the tariff change and the importance of trade between Canada and Mexico, and the US.
Overall production in Canada and Mexico tends to increase in agriculture, food production and
textiles, and fall in manufacturing and services.
Canadian and Mexican production tends to rise when the US raises tariffs on intermediate
goods, as US goods get more expensive due to the increased cost of imported Canadian and
Mexican intermediates. While US producers substitute away from intermediate inputs from
Canada and Mexico, final consumers tend to substitute towards imported goods, including
Canadian and Mexican final goods. The real depreciation in Canada and Mexico reinforces
demand for their exports, particularly by non-NAFTA countries, and production rises. This is
the case for most processed manufactured goods in Figure 3 and Figure 4 (blue). When Canada
and Mexico reciprocate by raising tariffs on intermediate imports from the US, their costs also
rise and there is a negative impact on production of manufactures goods.

19
Figure 3: Impact of reversing NAFTA on Canadian production (percent changes)
Source: Authors’ calculations.
Figure 4: Impact of reversing NAFTA on Mexican production (percent changes)
Source: authors’ calculations.
1.12
0.28
0.11
0.41
2.74
0.09
‐5.06
‐4.13
‐2.85
‐0.87
0.36
‐1.06
‐1.57
0.49
‐0.36
‐8 ‐6 ‐4 ‐2 0 2 4 6
Crops and Forestry
Livestock and Fishing
Sugar
Extraction
Meat Products
Food
Textiles
Wearing App and Leather
Chemicals
Metals
Electronic Equipment
Machinery
Motor Vehicles
Other Manufactures
Servicescanada
Intermediate US raises tariffs Intermediate Reciprocation Consumption US raises tariffs
Consumption Reciprocation Investment US raises tariffs Investment Reciprocation
Net Impact (numbers)
0.35
2.81
‐10.70
‐2.77
11.00
0.01
‐10.96
‐11.25
3.48
4.08
4.21
‐1.68
‐3.96
2.20
‐0.82
‐20 ‐15 ‐10 ‐5 0 5 10 15 20
Crops and Forestry
Livestock and Fishing
Sugar
Extraction
Meat Products
Food
Textiles
Wearing App and Leather
Chemicals
Metals
Electronic Equipment
Machinery
Motor Vehicles
Other Manufactures
Services
Mexico
Intermediate US raises tariffs Intermediate Reciprocation Consumption US raises tariffs
Consumption Reciprocation Investment US raises tariffs Investment Reciprocation
Net Impact (numbers)

20
When US tariffs are raised on final goods, US demand and hence production in Canada and
Mexico falls. The extent of this fall depends on the extent to which tariffs are raised (livestock,
electronics, machinery and other manufactures have lower MFN tariffs, Table 2), and the extent
to which the depreciation can offset the rise in the US tariff and raise exports. Overall, Canada
and Mexico increase production of manufactures, while agriculture and textiles decline. Again,
these impacts are reversed when Canada and Mexico reciprocate.
Overall, production declines, particularly in those sectors there is a high level of integration
with US production and trade – textiles, wearing apparel and machinery in Mexico; chemicals
and metals in Canada; and motor vehicles in both Canada and Mexico. Although not shown
here, we find that production is most affected by changes in Canada and Mexico’s own tariffs
and in the US tariffs on their goods. That is, Mexico is most affected by Mexico raising tariffs
on the US and by the US raising tariffs on Mexico. Raising tariffs on Mexican goods often results
in a positive outcome for Canada. For instance, when US tariffs on Mexican motor vehicles for
investment are raised or Mexican sugar – Canada benefits.
3.2.3 THREE EXAMPLES
As mentioned previously, three examples are investigated in greater depth below.
Sugar
In the case of sugar, 40 percent of US imports of sugar come from Mexico and another 6 percent
from Canada. Most of this imported sugar is sold to US firms, namely the sugar, food and
services sectors, where it is processed or packaged and sold to final consumers. Imports of sugar
are governed by a system of tariff rate quotas that are established on an annual basis.13 The US
tariff on imported sugar from the NAFTA countries is raised as part of the experiment, while
imports from other countries are restricted through quotas. This causes final consumers and
the food and services sectors to substitute away from Canadian and Mexican sugar towards
sugar produced domestically. This rise in production occurs regardless of whether tariffs are
imposed on intermediate or final consumption of imported sugar – US production rises by 6.7
percent (Figure 2) and the domestic price of sugar rises by 3.2 percent.
The rise in US production creates around 1,660 new jobs – a small gain when compared to the
68,000 people who become unemployed because of the US’s raising of tariffs. Canadian and
Mexican production of sugar falls, although the reduction in Canadian sugar is substantially
less than the decline in Mexican production, as Canada supplies a smaller share of the US
market and benefits from the US imposing tariffs on Mexico that offset most of the decline
caused by the US raising tariffs on Canadian goods. Canada and Mexico raising tariffs on sugar
13 https://www.fas.usda.gov/programs/sugar-import-program

21
in reciprocation tends to offset the rise in production in the US and the decline in Canadian
production, although has little impact on Mexico’s domestic production.
Motor vehicles
Intra-NAFTA trade of motor vehicles is a significant portion of motor vehicle exports and
imports for all three NAFTA countries. This is in part due to rules of origin which requires a
tariff change in heading and specific value-content requirements for eligible autos, trucks, and
tractors.14 The data indicates that the US supplies primarily auto parts (intermediate goods) to
both Canada and Mexico, which these countries then process and export back to the US in the
form of final goods (investment goods in the case of Mexico). Overall the impact of raising
tariffs between the US, and Canada and Mexico is to raise costs and reverse the benefits of
specialization afforded by the NAFTA; production falls in all three NAFTA countries. To
understand this result we take each of the components illustrated in turn:
- A large rise in the US tariff on motor vehicles for investment purposes (e.g., cranes, semi-trailers and tractors etc.) from Mexico, raises the cost of Mexican cranes, semi-trailers and tractors considerably, causing US consumers to substitute towards domestic cranes, semi-trailers and tractors, as well as those from other countries. US production rises, while Mexican production falls substantially. Canadian production also falls although only slightly. When Canada and Mexico reciprocate by raising tariffs on imported US cranes, semi-trailers and tractors, US production falls and Mexico’s production rises slightly, although it is not sufficient to offset the initial fall. In Canada, the rise from the reciprocation on investment goods is sufficient to offset the slight fall resulting from the US raising tariffs on investment goods and production of motor vehicles rises.
- The increase in US tariffs on intermediate motor vehicle parts from Canada and Mexico, raises the cost of producing motor vehicles in the US, lowering domestic sales of passenger cars, as well as US production and exports to the rest of the world. Mexican exports (US imports) and Mexican production of motor vehicles rises as Mexican cranes, semi-trailers and tractors (investment goods) and passenger cars (consumption goods) become relatively less expensive than the US variety. Canadian production on the other hand falls slightly as the rise in demand for its passenger cars fails to outweigh the decline in demand for its intermediate auto parts by the US. Canada and Mexico’s reciprocation raises costs in the region even further reducing production in Canada and Mexico. As a major supplier of intermediate auto parts to Canada and Mexico, production in the US also falls.
- Finally, the increase in US tariffs on passenger cars (consumption) lowers US production of motor vehicles as the fall in US exports outweigh any rise in domestic sales. US exports fall due to the real appreciation of the exchange rate. The rise in
14 The NAFTA rules of origin in the motor vehicles category have varied over time and are complex. At the
entry into force, the value-content requirements were 50 percent of the products cost. That value was raised to over 60 percent in approximately eight years (2002). See https://www.cbp.gov/trade/nafta/guide-customs-procedures/provisions-specific-sectors/automotive-products

22
domestic sales is also subdued as US consumers substitute away from Canadian and Mexican final passenger cars towards those produced in the rest of the world, rather than buying the more expensive domestic passenger cars. Moreover, while Canada and Mexico export less passenger cars, exports of intermediates and investment goods rise. US imports of Canadian and Mexican motor vehicles therefore rise. Mexican exports and production also rise because of the increase in exports of intermediates and investment motor vehicles. When Canada and Mexico reciprocate trade and production fall across all three countries. In Mexico, the fall due to the reciprocation on consumption goods is not sufficient to offset the rise resulting from the US raising tariffs; and production rises, but only slightly.
The impact of reversing NAFTA on the US motor vehicles sector is therefore likely to be
nuanced. Any potential benefits from specialization of production across NAFTA are reversed.
Overall production of motor vehicles falls in all three NAFTA countries as costs rise, exports
fall and the benefits of vertical specialization disappear.
Wearing apparel and textiles
The US is an important market for Mexican wearing apparel, purchasing 90 percent of Mexico’s
exports of these goods. The market is also highly integrated with the US supplying textiles and
intermediate wearing apparel to Mexican firms. Rules of origin require eligible apparel from
NAFTA members to contain NAFTA yarn forward and is a contributor to the high levels of
textile and apparel integration between the regions. From the US’s perspective, most wearing
apparel supplied by the domestic market or imported from the rest of the world; US imports of
Mexican wearing apparel and US exports are small.
Considering the US raising tariffs on Canada and Mexico (no reciprocation), the increase in
tariffs on US imports of intermediate wearing apparel and textiles from Mexico causes US
domestic production of wearing apparel to fall, as the US costs of production rise. Canadian
and Mexican production of wearing apparel rise as US consumers substitute towards the
cheaper imported final goods. As an intermediate input into US and Mexican wearing apparel,
US production of intermediate wearing apparel and textiles rises as the US wearing apparel
sector substitutes toward domestic intermediates and as the Mexican wearing apparel sector
expands its demand for intermediate inputs. Despite the increase in demand for intermediate
wearing apparel, US production of wearing apparel falls as the negative implications on
demand from the rise in the costs of production outweigh the increased demand for wearing
apparel intermediates by Mexico and the US. Production of US textiles, on the other hand, rises
as the intermediate impacts dominate.
When Canada and Mexico reciprocate by raising tariffs on intermediates, production in Canada
and Mexico declines with increasing costs, while production in the US rises as there is less
substitution by US consumers towards cheaper foreign goods.The rise in tariffs on final
consumption (and investment) wearing apparel from Mexico, and to a lesser extent Canada,
raises US production as US consumers’ preferences for Canadian and Mexican final wearing
apparel decrease and move towards domestic and imported final wearing apparel from the rest

23
of the world. Mexican production of final wearing apparel also falls, as demand by the US falls.
Since exports are relatively small, the decline in US exports caused by the decline in exports of
intermediate inputs to Mexico and the real appreciation, do not outweigh the increase in
domestic sales for final wearing apparel and US production rises. When Canada and Mexico
reciprocate by raising tariffs on final goods, production falls in all three NAFTA countries as
demand for Mexican final goods and US intermediates falls and consumers purchase more
wearing apparel from the rest of the world.
3.2.4 VERTICAL SPECIALIZATION
To examine the extent to which vertical specialization amongst North American firms has
changed we calculate Hummels, Rapoport and Yi’s (1998) vertical specialization indexes for
US-Mexico trade before and after the reversal of NAFTA:
, ,
,
,. "int", , , .
, ,. 100 (2)
Where: , , is the portion of region s’s trade in commodity i with region r that is
imported from region r, processed and re-exported (as a final consumer good, capital
good or as intermediate);
"int", , , are imports of intermediate goods from region r, used in the production of
commodity i in region s; and
, are the total costs of producing commodity i in region s.
,
, is therefore the share of output that is exported, making ,
,. "int", , , , the value of imports
from region r that are processed and re-exported, back to region r or on to another country.15
If a country (s) imports a large share of intermediates from region r as a share of their total
production costs, which it then exports – vertical specialization is high. This value is calculated
relative to total trade (exports plus imports) of the commodity to provide the portion of trade
that relates to vertical specialization.16
Table 7 provides the results for the Hummels et al.’s (1998) vertical specialization measure
before and after the reversal of NAFTA assuming the US is the exporter of intermediates and
Mexico processes and exports the final commodity. In the case of motor vehicles, the initial level
of vertical specialization is 21.1 percent, meaning that 21.1 percent of Mexico’s trade were
imported intermediates from the US that were processed and exported. All the values in this
table are considerably higher than the level of vertical specialization between other countries
15 Note that this is slightly different from the analysis undertaken in the agent RCA index, in that case we were
looking at exports back to the US. 16 This also explains why the numerator is multiplied by two, since these trade flows are both imports and
exports.

24
and in the other direction. Table 7 shows that the US’s reversal of NAFTA reduces the extent of
vertical specialization between the US and Mexico in all commodities by between 59 percent
(wearing apparel) and 14 percent (chemicals).
Table 7: Vertical specialization between US (producer of intermediates) and Mexico (producer of final goods) (percent)
Initial After reversal of NAFTA
Crops and Forestry 4.2 3.5
Livestock and Fishing 11.6 9.6
Sugar 6.1 3.8
Extraction 8.3 6.9
Meat Products 4.1 1.9
Food 8.6 6.7
Textiles 11.5 7.1
Wearing App and Leather 14.6 6.0
Chemicals 7.9 6.8
Metals 8.6 7.2
Electronic Equipment 11.4 9.8
Machinery 14.0 11.7
Motor Vehicles 21.1 17.3
Other Manufactures 10.0 8.3
Direction of the vertical specialization is that US produces the intermediates, while Mexico process and export the final commodity.
Source: Authors’ calculations using IESC Database (Walmsley and Minor, 2016a).
3.3 Employment impacts
Changes in the distribution of employment across sectors decomposed into the two parts, US
raising tariffs on NAFTA partners and Canada and Mexico reciprocate, are provided in Figure
5. The impact of the US raising tariffs is a decline in employment in heavy manufacturing,
extraction and services. In those sectors where employment declines 80,000 jobs are lost and
12,000 new jobs are created in the crops, sugar, food, textiles, wearing apparel and motor
vehicles (primarily cranes, semi-trailers and tractors) sectors. Hence there is a movement of
12,000 workers from heavy manufacturing and services into crops, sugar, food, textiles,
wearing apparel and motor vehicles (primarily cranes, semi-trailers and tractors). Based on data
on the wages paid by sectors, these 12,000 displaced workers are moving from sectors with high
wages (heavy manufactures and services) to sectors with lower wages (crops, sugar, food,
textiles, wearing apparel), thereby reducing their average wage. The remaining 68,000 people
become unemployed.
When Canada and Mexico reciprocate, US heavy manufacturing (chemicals, metals, electronic
equipment, machinery and other manufactures) employment is expected to rise (with
production), more than offsetting the fall in employment in heavy manufacturing due to the US
raising tariffs. 95,000 new positions are created in those heavy manufacturing and extraction

25
sectors where employment rises. Overall, however, the expansion in jobs is not sufficient to
offset the loss of 270,000 jobs in services, crops and livestock, meat, food and textiles.
Employment falls by another 188,000 people, leading to a total loss in employment of 256,000
jobs from the US’s reversal of NAFTA and Canada and Mexico’s reciprocation. For those 95,000
able to find employment other sectors, the average wage rises as the heavy manufacturing
sectors generally pay higher wages than the services and agricultural sectors, where they were
originally employed.
Figure 5: Impact on employment of US reversing NAFTA (number of workers)
The impact on employment in services from US reversal of NAFTA and Canada and Mexico’s reciprocation are not included, due to their larger size. Employment in services fall by 45,000 and 241,000, respectively.
Net impact of US’s reversal of NAFTA with reciprocation is the sum of the two parts.
Source: Authors’ calculations.
In terms of the composition of the 68,000 people that become unemployed from the US raising
its tariffs on its NAFTA partners, 31,000 are low skilled workers. Service and sales workers,
and clerks experience decreases in employment of 21,000 and 15,000 people respectively. The
high proportion of low skilled workers reflects the fact that these workers account for more
than 50 percent of workers in the manufacturing sectors. The composition of the 256,000
unemployed from the US’s reversal of NAFTA with reciprocation, includes 89,000 low skilled
workers, 97,000 service and sales workers and 70,000 clerks. The rise in importance of sales and
service workers in the unemployment figures when Canada and Mexico reciprocates
(compared to the US raising tariffs (no reciprocation) case), reflects their relatively high level of
employment in the contracting services sector.
‐40,000
‐30,000
‐20,000
‐10,000
0
10,000
20,000
30,000
40,000
US Reverses NAFTA (no reciprocation) Canada and Mexico Reciprocate

26
While skilled workers are generally considered to be more mobile and resilient to trade shocks,
we also consider the possibility that skilled workers may also become unemployed with the
reversal of NAFTA. Figure 6 illustrates that if the wages of both skilled and unskilled workers
do not fall in response to the reversal of NAFTA then real GDP declines considerably and the
change in unemployment rises by a factor of almost 5 from 255K to 1.2 million in the US. The
potential loss of skilled jobs in the US economy from the reversal of NAFTA is substantial,
reflecting the specialization of production across NAFTA that has led the US to produce skill-
intensive products, while Mexico produces low skill-intensive products. The additional loss of
skilled jobs, namely of managers and other professionals, also raises unemployment of low
skilled workers, particularly other low skilled workers. As in the original unemployment of
unskilled workers only (closure), the loss of US jobs is greatest in the services sectors. Even if
these skilled workers are more resilient and do not become unemployed, their real wages will
decline because of the reversal of NAFTA.
Canada also experiences a substantial decrease in employment and real GDP when the
possibility of unemployment of skilled workers is taken into account (Figure 6), while Mexico’s
unemployment rises by a relatively smaller amount due to the greater importance of low skilled
workers in production and NAFTA trade.
Figure 6: Impact on employment of US reversing NAFTA (number of workers) under alternative unemployment assumptions
Unskilled
unemployment only
Skilled and unskilled
unemployment
US Real GDP -0.08 -0.64
Employment -255,678 -1,245,324
Canada Real GDP -0.48 -1.81
Employment -125,078 -462,967
Mexico Real GDP -0.87 -1.48
Employment -951,002 -1,228,830
Source: Authors’ calculations.
4 Conclusions
The results show that the reversal of NAFTA leads to a decline in real GDP, trade, investment
and employment in the US, Canada and Mexico, with most of the losses arising from Canada
and Mexico’s reciprocation, required under the WTO. To say this another way, the US, Canada
and Mexico have more to lose from Canada and Mexico reciprocating than from the US raising
its own tariffs. 256,000 low skilled workers in the US become unemployed due to the reversal
of NAFTA, with 95,000 workers having to relocate to other sectors and possibly other locations
within the US to find employment. If we allow for the possibility of unemployment of skilled
27
workers, then employment falls by over 1.2 million, mostly skilled workers. Canadian and
Mexican employment of low skilled workers also decline by 125,000 and 951,000 respectively.
US trade with Canada and Mexico declines significantly, although trade between Canada and
Mexico, and with the rest of the world, rises. Overall all three NAFTA countries experience a
decline in trade, with imports by final consumer in the US and Mexico experiencing the largest
decline.
In terms of sectoral production, US agriculture, food processing, motor vehicle and services
decline, while there are small increases in production of other manufactures. Production in
Canada and Mexico falls most in those sectors where there is a high level of integration with
US production and trade – textiles, wearing apparel and machinery in Mexico; chemicals and
metals in Canada; and motor vehicles in both Canada and Mexico. While the results show that
the US does obtain some small gains in manufacturing production and employment in the
chemicals, metals, electronic equipment and machinery sectors, the losses in their motor
vehicles, textiles, meat, food and services sectors far exceed these small gains leading to less
jobs for Americans overall. Mexicans and Canadian. The overall fall in production and rise in
costs is also accompanied by a decline in vertical specialization across NAFTA in all
commodities.
The IESC database and model’s ability to differentiate tariffs between intermediate,
consumption and investment goods improved analysis of the mechanisms through which the
tariffs acted, as well as the supply chain interactions (changes in demand by agent). The motor
vehicles and wearing apparel supply chains were examined in detail to provide a clearer picture
of the likely outcomes of reversing NAFTA on production. The analysis found that there is
some potential for growth in production of cranes, semi-trailers and tractors (motor vehicles
purchased for investment), as domestic production replaces Mexican imports of these goods
when the US raises tariffs, however, this outcome is reversed if Canada and Mexico reciprocate.
Overall, motor vehicle production (passenger cars, auto parts and cranes, semi-trailers and
tractors) fall throughout NAFTA as the benefits of vertical specialization are reversed.
Considering the data, the potential loss of 256,000 low-skill jobs in the US suggests that the US’s
withdrawal from NAFTA will not achieve the stated policy goal of increasing employment in
the US. With Canada and Mexico’s reciprocation causing most of the fall in employment,
reciprocation is clearly not the preferred option for Canada and Mexico, although given the
WTO rules this may be unavoidable.

28
Bibliography
Harrison, W. J. and K. R. Pearson (2007). GEMPACK User Documentation Release 8.0.
Melbourne, Australia, Centre of Policy Studies and Impact Project, Monash University.
Hertel, T. and M. Tsigas (1997). Structure of GTAP. Global Trade Analysis Modeling and
Applications. T. Hertel, Cambridge University Press: 13-73.
Hummels, D. L., Rapport, D. and Yi, K. M. (1998), “Vertical Specialization and the Changing
Nature of World Trade”, Economic Policy Review, Federal Reserve Bank of New York, Iss. June, pp.
79–99.
International Trade Center (2006). User Guide - Market Access Map: Making Tariffs and Market
Access Barriers Transparent. Geneva, Market Analysis Section, Division of Product and Market
Development, International Trade Center.
Narayanan, G. B., et al. (2015). Global Trade, Assistance, and Production: The GTAP 9 Data
Base. West Lafayette, Indiana, Center for Global Trade Analysis, Purdue University.
The New York Times, January 24, 2017, “Mexico’s Potential Weapons if Trump Declares War
on NAFTA”, https://www.nytimes.com/2017/01/24/business/economy/nafta-mexico-free-
trade.html?_r=0
Villareal, M. A. & Fergusson, I. F. (2013). NAFTA at 20: Overview and trade effects.
Washington, DC: Congressional Research Service
Walmsley T. L., and P. Minor, (2016a). “ImpactECON Global Supply Chain Database:
Documentation of data sources and the construction process of IE-SC_v2.0”, Data and Model
documentation—002 REV-2, ImpactECON: Boulder, CO, USA
Walmsley T. L., and P. Minor, (2016b). “ImpactECON Global Supply Chain Model:
Documentation of Model Changes”, ImpactECON Working Paper No. 06, ImpactECON:
Boulder, CO, USA
Walmsley T. L., and P. Minor, (forthcoming). “Do Supply Chains Matter? Illustrative results for
the reversal of NAFTA”, ImpactECON: Boulder, CO, USA
29
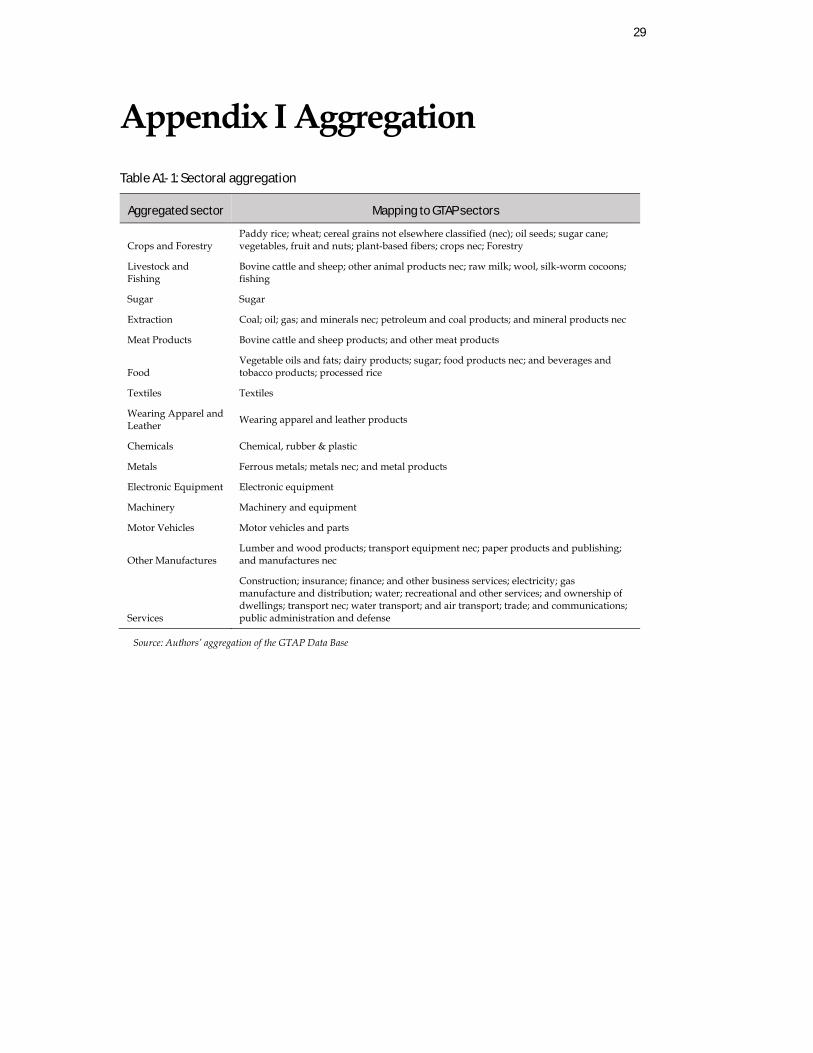
Appendix I Aggregation
Table A1- 1: Sectoral aggregation
Aggregated sector Mapping to GTAP sectors
Crops and Forestry Paddy rice; wheat; cereal grains not elsewhere classified (nec); oil seeds; sugar cane; vegetables, fruit and nuts; plant-based fibers; crops nec; Forestry
Livestock and Fishing
Bovine cattle and sheep; other animal products nec; raw milk; wool, silk-worm cocoons; fishing
Sugar Sugar
Extraction Coal; oil; gas; and minerals nec; petroleum and coal products; and mineral products nec
Meat Products Bovine cattle and sheep products; and other meat products
Food Vegetable oils and fats; dairy products; sugar; food products nec; and beverages and tobacco products; processed rice
Textiles Textiles
Wearing Apparel and Leather
Wearing apparel and leather products
Chemicals Chemical, rubber & plastic
Metals Ferrous metals; metals nec; and metal products
Electronic Equipment Electronic equipment
Machinery Machinery and equipment
Motor Vehicles Motor vehicles and parts
Other Manufactures Lumber and wood products; transport equipment nec; paper products and publishing; and manufactures nec
Services
Construction; insurance; finance; and other business services; electricity; gas manufacture and distribution; water; recreational and other services; and ownership of dwellings; transport nec; water transport; and air transport; trade; and communications; public administration and defense
Source: Authors’ aggregation of the GTAP Data Base

30
Table A1- 2: Regional aggregation
Aggregated regions
Mapping to GTAP Regions Allocation to World Bank
categories
USA USA High income economies
Canada Canada High income economies
Mexico Mexico Upper-middle incomes economies
China China Upper-middle incomes economies
Europe
Europe: Austria, Belgium, Cyprus, Czech Republic, Denmark, Estonia, Finland, France, Germany, Greece, Hungary, Ireland, Italy, Latvia, Lithuania, Luxembourg, Malta, Netherlands, Poland, Portugal, Slovakia, Slovenia, Spain, Sweden, United Kingdom, Switzerland, Norway, Rest of EFTA
High income economies
Rest High Income Economies
Australia, New Zealand, Hong Kong, Japan, Korea, Taiwan, Singapore, Chile, Russia, Rest of North America, Uruguay, Croatia, Rest of Europe, Bahrain, Israel, Kuwait, Oman, Qatar, Saudi Arabia, United Arab Emirates, Rest of the World
High income economies
Rest upper-middle incomes economies
Malaysia, Thailand, Peru, Argentina, Brazil, Colombia, Ecuador, Venezuela, Costa Rica, Panama, Rest of Central America, Caribbean, Albania, Bulgaria, Belarus, Romania, Kazakhstan, Azerbaijan, Iran Islamic Republic of, Turkey, Tunisia, Rest of North Africa, Mauritius, Botswana, Namibia, South Africa
Upper-middle incomes economies
Rest low-middle income economies
Vietnam, Indonesia, Philippines, India, Rest of Oceania, Mongolia, Pakistan, Sri Lanka, Bolivia, Paraguay, Rest of South America, Guatemala, Honduras, Nicaragua, El Salvador, Ukraine, Rest of Eastern Europe, Kyrgyzstan, Rest of Former Soviet Union, Armenia, Georgia, Rest of Western Asia, Egypt, Morocco, Cameroon, Cote d'Ivoire, Ghana, Nigeria, Senegal, Zambia, Rest of Eastern Africa, Rest of South African Customs
Low-middle income economies
Rest lower income economies
Cambodia, Lao People's Democratic Republic, Rest of Southeast Asia, Rest of East Asia, Bangladesh, Nepal, Rest of South Asia, Benin, Burkina Faso, Guinea, Togo, Rest of Western Africa, Central Africa, South Central Africa, Ethiopia, Kenya, Madagascar, Malawi, Mozambique, Rwanda, Tanzania, Uganda, Zimbabwe
Lower income economies
Source: Authors’ aggregation of the GTAP Data Base


![Reversing and Malware Analysis Training Articles [2012] . cracking/Reversing... · Reversing and Malware Analysis Training Articles ... Step 1: Start with what you ... Reversing and](https://img.dokumen.tips/doc/110x75/5ab905fd7f8b9ac10d8db0ab/reversing-and-malware-analysis-training-articles-2012-crackingreversingreversing.jpg)


![[Terrie Noll] the Joint Book Complete Guide Wood](https://img.dokumen.tips/doc/110x75/56d6bd561a28ab30168d95a3/terrie-noll-the-joint-book-complete-guide-wood.jpg)