Embed Size (px)
Citation preview
Reverse Engineering forMainframe Enterprise Applications
Patterns and Experiences
Reverse engineering voor mainframe enterprise applicatiespatronen en ervaringen
Joris Van Geet
Promotor:Prof. Dr. Serge Demeyer
Proefschrift ingediend tot het behalen van de graad vanDoctor in de wetenschappen

Acknowledgments
Although obtaining a PhD is quite a lonely undertaking, many people deserve some gratitude formaking it possible and/or bearable.
Thank you to my promotor, Serge Demeyer, for giving me the opportunity to use “industry as alab”: I would not have started my PhD without it. Similarly, I must say thanks to Rudi Maelbranckefor inspiring and sponsoring the project and offering me KBC as a lab. I also need to thank HermanVan Durme for co-sponsoring the project and offering me AXA as lab. Since change is inevitable,I also need to thank Jo Uyttenhove (Rudi’s replacement) and Tom Samyn (Jo’s replacement), whoprovided me both with very valuable and helpful KBC guidance. During all this change, Tamarahas always been there to help me out with practical problems at KBC.
Conducting this research in industry would not have been possible without help from “the trenches”.In particular I would like to thank Michel Geers for his wise advice and funny anecdotes; JohanJanssens and his team, who have been helpful beyond measure; Danny Backx, who taught me a lotabout company politics; the TCO, TAX and BOS teams of OSIRIS for all their feedback and theentertaining lunches. Of course, I would also like to thank my colleagues from the “ivory tower”,in particular Kris De Schutter for helping me kickstart my research; and the entire AnSyMoand ex-LORE team for the copious feedback, the interesting lunch breaks and the deliciousbarbecues.
On a more playful note I would like to thank some colleagues at the university for the niceatmosphere. In particular Jeroen V. V., whose love of food has been a b(e)acon in an otherwisehungry world; Juan F. for inspiring calm with his Latin-American view of life; Jeroen A., whosesingle greatest achievement was to bring Murray to life; Gino for the nice times we had organizingscientific parties in childish universities and (nearly) blowing up car transmissions; Wim, whohas been a great partner in “getting things done” and, as a consequence, an even better partner fornot actually getting anything done. I would also like to thank the less known Gulielmus Puer forinspiring countless (office) games, and Michaelus Semita, Hieronymus Serius and Iohannes FiliusPetrae for helping us play them.
Besides my friends at work, I also need to thank Pieter for helping me stay in touch with the realworld and (occasionally) with the gym; and Sven for sharing an apartment (and so much more) inthe first few years: never a dull moment.
On a more familiar note I would like to thank my parents for letting me find (and go) my own way.

Finally, a huge thank you to Liesbeth who, apart from willingly appearing on the cover ofthis book, has given my life some meaning and me some lovely times; and a tiny thank you to Jitte,whose mere presence puts things in (the right) perspective.
Thank you all!1
1Most of you can stop reading now :)
Abstract
The ability to evolve and maintain software reliably is a major challenge for today’s organizations.Reverse engineering can support this challenge by recovering knowledge from existing systems.The reverse engineering community is a vibrant research community which has resulted in manyuseful techniques and research prototypes to recover this knowledge, however, few of them havebeen exploited industrially in significant ways.
To investigate this lacking industrial adoption, this dissertation explores the applicability of existingreverse engineering techniques in practice, more specifically, on mainframe systems in the financialservices industry. We report our experience with applying software views, feature location andredocumentation; and we identify the main cause for the lacking adoption to be the mismatchbetween the characteristics of reverse engineering and the characteristics of the (development)processes in place in the organizations.
To resolve this situation, we recommend organizations to incorporate reverse engineering intotheir processes, urge researchers to apply their techniques not only in the lab but also in realisticcircumstances, and provide practitioners with patterns that will allow them to apply reverseengineering in the mean time.

vi
Publications
The following peer-reviewed papers have been published while working on my PhD research.They have all been incorporated into this dissertation.
— Joris Van Geet and Serge Demeyer. Reverse engineering on the mainframe – lessons learnedfrom “in vivo” research. IEEE Software Special Issue on Software Evolution, July 2010.
— Joris Van Geet and Serge Demeyer. Lightweight visualisations of cobol code for supportingmigration to SOA. Electronic Communications of the EASST, 8, 2007.
— Joris Van Geet and Serge Demeyer. Feature location in cobol mainframe systems: an experiencereport. In IEEE International Conference on Software Maintenance (ICSM), 2009.
— Joris Van Geet, Peter Ebraert, and Serge Demeyer. Redocumentation of a legacy bankingsystem: an experience report. In IWPSE-EVOL 10: Proceedings of the Joint ERCIM Workshopon Software Evolution (EVOL) and International Workshop on Principles of Software Evolution(IWPSE), 2010.

viii
Nederlandstalige samenvatting
De evolutie en het onderhoud van bestaande software systemen is een grote uitdaging voor velebedrijven. Reverse engineering kan hierbij helpen door kennis van bestaande systemen te helpenopbouwen. Omdat reverse engineering een zeer actief onderzoeksgebied is, zijn er reeds veletechnieken en prototypes gebouwd om deze kennis op te bouwen. Spijtig genoeg worden maarweinig van deze technieken ook toegepast in industrie.
Om dit te onderzoeken, bestuderen we in deze thesis de toepasbaarheid van bestaande reverseengineering technieken in de praktijk. Deze praktijk wordt in ons geval ingevuld door mainframesystemen gebruikt in de financiele wereld. We rapporteren onze ervaring met het toepassen vansoftware views, feature lokalisatie en herdocumentatie. Tevens identificeren we de hoofdredenvoor de gebrekkige adoptie van reverse engineering technieken in de praktijk, namelijk de mis-match tussen de inherente eigenschappen van reverse engineering en de eigenschappen van deontwikkelprocessen gebruikt in deze financiele organisaties.
Als oplossing raden we organisaties aan om reverse engineering voorzien in hun processen,vragen we onderzoekers hun technieken niet enkel in het lab testen maar ook in realistischeomstandigheden, en voorzien we een aantal patronen waardoor de mensen op de vloer ondertussenreeds reverse engineering kunnen toepassen.

x
Contents
Acknowledgments iii
Abstract v
Publications vii
Nederlandstalige samenvatting ix
I Setting the Scene 1
1 Introduction 31.1 Software Evolution . . . . . . . . . . . . . . . . . . . . . . . . . . . . . . . 41.2 Reverse Engineering . . . . . . . . . . . . . . . . . . . . . . . . . . . . . . . 41.3 Research Questions . . . . . . . . . . . . . . . . . . . . . . . . . . . . . . . 51.4 Guide to the reader . . . . . . . . . . . . . . . . . . . . . . . . . . . . . . . . 5
2 Reverse Engineering 72.1 Taxonomy . . . . . . . . . . . . . . . . . . . . . . . . . . . . . . . . . . . . 72.2 Incentives . . . . . . . . . . . . . . . . . . . . . . . . . . . . . . . . . . . . 92.3 Software Maintenance and Evolution . . . . . . . . . . . . . . . . . . . . . . 102.4 Activities . . . . . . . . . . . . . . . . . . . . . . . . . . . . . . . . . . . . . 112.5 Comprehension . . . . . . . . . . . . . . . . . . . . . . . . . . . . . . . . . 122.6 Requirements . . . . . . . . . . . . . . . . . . . . . . . . . . . . . . . . . . 132.7 Techniques vs Tools . . . . . . . . . . . . . . . . . . . . . . . . . . . . . . . 132.8 Patterns . . . . . . . . . . . . . . . . . . . . . . . . . . . . . . . . . . . . . . 132.9 Summary . . . . . . . . . . . . . . . . . . . . . . . . . . . . . . . . . . . . . 15
3 Financial Services Industry 173.1 Organizational Culture and Development Processes . . . . . . . . . . . . . . 173.2 IT Structures . . . . . . . . . . . . . . . . . . . . . . . . . . . . . . . . . . . 19
3.2.1 Enterprise-wide Structures . . . . . . . . . . . . . . . . . . . . . . . . . 193.2.2 Business Domains . . . . . . . . . . . . . . . . . . . . . . . . . . . . . 20
3.3 IT Activities . . . . . . . . . . . . . . . . . . . . . . . . . . . . . . . . . . . 213.4 IT Roles . . . . . . . . . . . . . . . . . . . . . . . . . . . . . . . . . . . . . 233.5 Enterprise Applications . . . . . . . . . . . . . . . . . . . . . . . . . . . . . 243.6 Mainframes . . . . . . . . . . . . . . . . . . . . . . . . . . . . . . . . . . . 243.7 Summary . . . . . . . . . . . . . . . . . . . . . . . . . . . . . . . . . . . . . 26
4 Systems under Study 274.1 Document Generation and Management System . . . . . . . . . . . . . . . . 274.2 Portfolio Management System . . . . . . . . . . . . . . . . . . . . . . . . . . 284.3 Custody Services Back-end . . . . . . . . . . . . . . . . . . . . . . . . . . . 30
II Techniques 33
5 Software Views 355.1 Polymetric Views . . . . . . . . . . . . . . . . . . . . . . . . . . . . . . . . 365.2 Polymetric Views for COBOL Mainframe Systems . . . . . . . . . . . . . . . 37
5.2.1 Fact Extraction . . . . . . . . . . . . . . . . . . . . . . . . . . . . . . . 375.2.2 Visualizing Dependencies . . . . . . . . . . . . . . . . . . . . . . . . . 385.2.3 Interpreting Visualizations . . . . . . . . . . . . . . . . . . . . . . . . . 39
5.3 Validation . . . . . . . . . . . . . . . . . . . . . . . . . . . . . . . . . . . . 415.3.1 Observations . . . . . . . . . . . . . . . . . . . . . . . . . . . . . . . . 415.3.2 Validation Setup . . . . . . . . . . . . . . . . . . . . . . . . . . . . . . 455.3.3 Data Results . . . . . . . . . . . . . . . . . . . . . . . . . . . . . . . . 465.3.4 Interpretation . . . . . . . . . . . . . . . . . . . . . . . . . . . . . . . . 48
5.4 Using Software Views . . . . . . . . . . . . . . . . . . . . . . . . . . . . . . 495.4.1 Treemapping as First Contact . . . . . . . . . . . . . . . . . . . . . . . 505.4.2 Polymetric Views for Initial Understanding . . . . . . . . . . . . . . . . 515.4.3 Resolving Issues During View Creation . . . . . . . . . . . . . . . . . . 525.4.4 Clustering for Initial Understanding . . . . . . . . . . . . . . . . . . . . 545.4.5 Studying Exceptional Entities . . . . . . . . . . . . . . . . . . . . . . . 57
5.5 Lessons Learned . . . . . . . . . . . . . . . . . . . . . . . . . . . . . . . . . 585.5.1 The Cost is in the Languages . . . . . . . . . . . . . . . . . . . . . . . 595.5.2 Nothing Works out-of-the-box . . . . . . . . . . . . . . . . . . . . . . . 605.5.3 Dinosaurs Don’t Like Pictures . . . . . . . . . . . . . . . . . . . . . . . 605.5.4 Knowledge is Scattered and Scarce . . . . . . . . . . . . . . . . . . . . 61
5.6 Summary . . . . . . . . . . . . . . . . . . . . . . . . . . . . . . . . . . . . . 61
6 Feature Location 636.1 Replication Experiment . . . . . . . . . . . . . . . . . . . . . . . . . . . . . 64
6.1.1 Technique . . . . . . . . . . . . . . . . . . . . . . . . . . . . . . . . . 646.1.2 Assumptions . . . . . . . . . . . . . . . . . . . . . . . . . . . . . . . . 67
xii
6.1.3 Pilot Study . . . . . . . . . . . . . . . . . . . . . . . . . . . . . . . . . 67
6.1.4 Study Set-up . . . . . . . . . . . . . . . . . . . . . . . . . . . . . . . . 69
6.1.5 Portfolio Management System . . . . . . . . . . . . . . . . . . . . . . 71
6.1.6 Iterations . . . . . . . . . . . . . . . . . . . . . . . . . . . . . . . . . . 73
6.1.7 Informal Validation . . . . . . . . . . . . . . . . . . . . . . . . . . . . 75
6.1.8 Results . . . . . . . . . . . . . . . . . . . . . . . . . . . . . . . . . . . 76
6.2 Lessons Learned . . . . . . . . . . . . . . . . . . . . . . . . . . . . . . . . . 77
6.2.1 The Power of Iteration . . . . . . . . . . . . . . . . . . . . . . . . . . . 77
6.2.2 Scenarios as Sensitivity Point . . . . . . . . . . . . . . . . . . . . . . . 77
6.2.3 Realistic Scenarios versus Flexible Data Collection . . . . . . . . . . . 78
6.2.4 The Problem of Isolation . . . . . . . . . . . . . . . . . . . . . . . . . 78
6.3 Attempted Adjustments . . . . . . . . . . . . . . . . . . . . . . . . . . . . . 79
6.3.1 STROBE as Tracing Facility . . . . . . . . . . . . . . . . . . . . . . . 79
6.3.2 Dynamic Feature Location at Statement Level . . . . . . . . . . . . . . 80
6.3.3 Static Feature Location . . . . . . . . . . . . . . . . . . . . . . . . . . 86
6.4 Summary . . . . . . . . . . . . . . . . . . . . . . . . . . . . . . . . . . . . . 87
7 Redocumentation 897.1 Project Context . . . . . . . . . . . . . . . . . . . . . . . . . . . . . . . . . . 90
7.1.1 Organization . . . . . . . . . . . . . . . . . . . . . . . . . . . . . . . . 90
7.1.2 Documentation Standard . . . . . . . . . . . . . . . . . . . . . . . . . 90
7.1.3 System under Study . . . . . . . . . . . . . . . . . . . . . . . . . . . . 91
7.1.4 Project Goal . . . . . . . . . . . . . . . . . . . . . . . . . . . . . . . . 92
7.1.5 Why not buy a tool? . . . . . . . . . . . . . . . . . . . . . . . . . . . . 92
7.2 Redocumentation Process . . . . . . . . . . . . . . . . . . . . . . . . . . . . 92
7.2.1 Fact Extraction . . . . . . . . . . . . . . . . . . . . . . . . . . . . . . . 93
7.2.2 Fact Representation . . . . . . . . . . . . . . . . . . . . . . . . . . . . 94
7.2.3 Documentation Generation . . . . . . . . . . . . . . . . . . . . . . . . 95
7.3 Lessons Learned . . . . . . . . . . . . . . . . . . . . . . . . . . . . . . . . . 97
7.3.1 Only document relevant parts . . . . . . . . . . . . . . . . . . . . . . . 97
7.3.2 Less is more . . . . . . . . . . . . . . . . . . . . . . . . . . . . . . . . 97
7.3.3 Make documentation usable . . . . . . . . . . . . . . . . . . . . . . . . 98
7.3.4 Do not duplicate documentation . . . . . . . . . . . . . . . . . . . . . . 98
7.3.5 Use a generic meta-model . . . . . . . . . . . . . . . . . . . . . . . . . 99
7.3.6 Query engines are not reporting tools . . . . . . . . . . . . . . . . . . . 100
7.3.7 Be opportunistic when extracting facts . . . . . . . . . . . . . . . . . . 101
7.3.8 Not everything can/should be automated . . . . . . . . . . . . . . . . . 101
7.3.9 Get regular user feedback . . . . . . . . . . . . . . . . . . . . . . . . . 101
7.4 Summary . . . . . . . . . . . . . . . . . . . . . . . . . . . . . . . . . . . . . 102
xiii
III Patterns 105
8 Fact Extraction 1078.1 Gather Available Facts . . . . . . . . . . . . . . . . . . . . . . . . . . . . . . 1108.2 Perform Text-Based Fact Extraction . . . . . . . . . . . . . . . . . . . . . . . 1128.3 Buy a Commercial Fact Extractor . . . . . . . . . . . . . . . . . . . . . . . . 114
9 Trace Capturing 1179.1 (Ab)use a High-Level Monitoring Tool . . . . . . . . . . . . . . . . . . . . . 1209.2 (Ab)use a Debugger . . . . . . . . . . . . . . . . . . . . . . . . . . . . . . . 1229.3 Instrument Source Code . . . . . . . . . . . . . . . . . . . . . . . . . . . . . 124
10 Process Patterns 12710.1 Quick Feasibility Study . . . . . . . . . . . . . . . . . . . . . . . . . . . . . 128
IV Conclusions 131
11 Conclusions and Recommendations 13311.1 Research Questions Revisited . . . . . . . . . . . . . . . . . . . . . . . . . . 13311.2 Recommendations . . . . . . . . . . . . . . . . . . . . . . . . . . . . . . . . 13611.3 Concluding Thoughts . . . . . . . . . . . . . . . . . . . . . . . . . . . . . . 138
V Appendices 139
A Thumbnail Patterns 141A.1 Chat with the Maintainers . . . . . . . . . . . . . . . . . . . . . . . . . . . . 141A.2 Read All the Code in One Hour . . . . . . . . . . . . . . . . . . . . . . . . . 141A.3 Interview During Demo . . . . . . . . . . . . . . . . . . . . . . . . . . . . . 141A.4 Build Prototypes . . . . . . . . . . . . . . . . . . . . . . . . . . . . . . . . . 142
B Pattern Format 143
C Pattern Catalog 145
Bibliography 145
xiv
List of Figures
2.1 Reverse engineering and related processes are transformations between orwithin abstraction levels, represented here in terms of life-cycle phases. Adoptedfrom [Chikofsky and Cross, 1990], c©IEEE. . . . . . . . . . . . . . . . . . . 8
2.2 Staged model for the software life-cycle as described by Bennett and Raj-lich [2000]. . . . . . . . . . . . . . . . . . . . . . . . . . . . . . . . . . . . 10
3.1 Four Tenets from the Manifesto for Agile Software Development. . . . . . . 18
3.2 Separated Business Domains with dedicated Domain Architectures supportedby an Enterprise Architecture. . . . . . . . . . . . . . . . . . . . . . . . . . 20
3.3 The disciplines and phases of the Rational Unified Process [Kruchten, 2003]. 21
3.4 Preparation and execution of work while evolving and servicing a softwaresystem. . . . . . . . . . . . . . . . . . . . . . . . . . . . . . . . . . . . . . 22
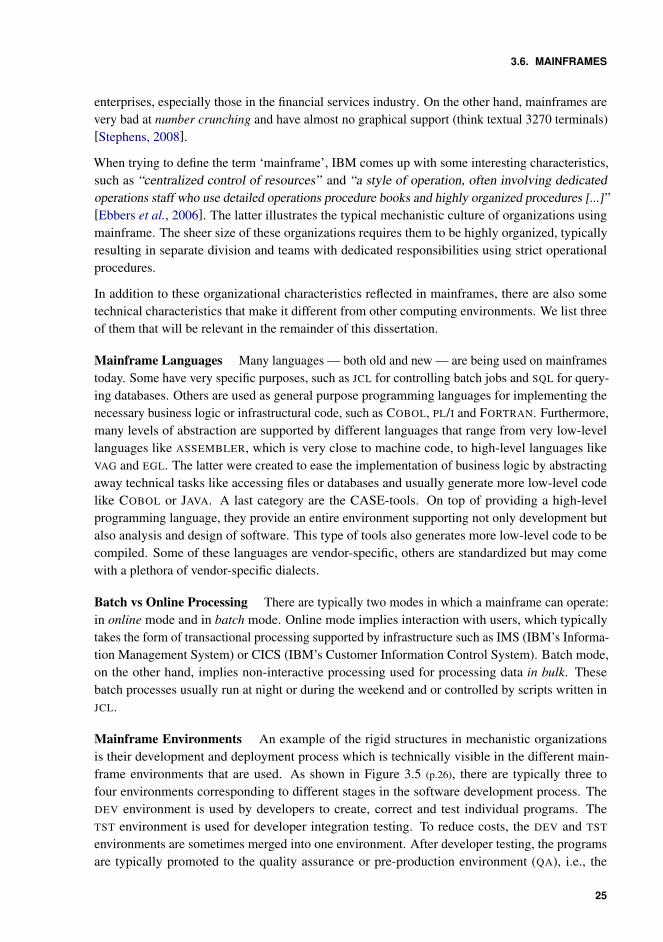
3.5 Typical Mainframe Environments . . . . . . . . . . . . . . . . . . . . . . . 26
5.1 Up to five metrics can be visualized on one node. Image by Lanza andDucasse [2003], c©IEEE, 2003 . . . . . . . . . . . . . . . . . . . . . . . . . 36
5.2 Overall Design Indicators . . . . . . . . . . . . . . . . . . . . . . . . . . . 39
5.3 Exceptional Entities . . . . . . . . . . . . . . . . . . . . . . . . . . . . . . 40
5.4 Data Usage . . . . . . . . . . . . . . . . . . . . . . . . . . . . . . . . . . . 41
5.5 The Functional Dependency View. Height and width of the nodes representFAN-IN and FAN-OUT respectively. Areas of interest are manually annotatedand magnified. . . . . . . . . . . . . . . . . . . . . . . . . . . . . . . . . . 42
5.6 The Data Dependency View. Edges only represent data dependencies. Areasof interest are manually annotated and magnified. . . . . . . . . . . . . . . . 43
5.7 Extracts from the Internal Functional Dependency View . . . . . . . . . . . 44
5.8 Extracts from the Internal Data Dependency View. For image clarity, theinternal copybooks are represented by black dots instead of white one; thereare no missing copybooks in these views. . . . . . . . . . . . . . . . . . . . 44
5.9 Extract from the Mixed Dependency View. Programs are denoted by whiterectangles, the copybook by a white circle. Functional dependencies are blackedges, data dependencies are gray edges. . . . . . . . . . . . . . . . . . . . 45
5.10 Treemap of the Document Generation and Management System’s source code. 51
5.11 Overview of the COBOL files and the Program-IDs they contain. . . . . . . . 535.12 Listing of all the COBOL program names of the Document Generation and
Management System. . . . . . . . . . . . . . . . . . . . . . . . . . . . . . . 545.13 Functional Dependency View of Document Generation and Management
System after clustering based on naming conventions. . . . . . . . . . . . . 555.14 Functional Dependency View of Document Generation and Management Sys-
tem after clustering based on naming conventions and removing all exceptionaldependencies. . . . . . . . . . . . . . . . . . . . . . . . . . . . . . . . . . . 55
5.15 Schematic illustration of possible layering within the Document Generationand Management System. . . . . . . . . . . . . . . . . . . . . . . . . . . . 56
5.16 Functional Dependency View of the Document Generation and ManagementSystem after filtering out the two base layers. . . . . . . . . . . . . . . . . . 56
5.17 Control Flow Visualization of the top program of one of the delegation clusters. 575.18 Control Flow Visualization of the top and bottom program of Consistency
Checking Cluster. . . . . . . . . . . . . . . . . . . . . . . . . . . . . . . . . 58
6.1 Process for feature location as described by Eisenbarth et al. [2003], c©IEEE 656.2 Dynamic analysis step in process for feature location from Eisenbarth et
al. [2003], c©IEEE . . . . . . . . . . . . . . . . . . . . . . . . . . . . . . . 666.3 Interpretation of concept lattice in process for feature location from Eisenbarth
et al. [2003], c©IEEE . . . . . . . . . . . . . . . . . . . . . . . . . . . . . . 666.4 Pilot Concept Lattice . . . . . . . . . . . . . . . . . . . . . . . . . . . . . . 686.5 Concept Lattice 2nd Iteration . . . . . . . . . . . . . . . . . . . . . . . . . . 746.6 Partial Concept Lattice 3rd Iteration . . . . . . . . . . . . . . . . . . . . . . 756.7 Concept lattice representing several scenarios for managing archival settings. 836.8 Highlighting the executed lines when the application is being stopped. . . . . 836.9 Conceptual representation of the Input-Process/Storage-Output Model taken
from Wikipedia. . . . . . . . . . . . . . . . . . . . . . . . . . . . . . . . . 86
7.1 Overview of the redocumentation process . . . . . . . . . . . . . . . . . . . 937.2 Basic RSF meta-model . . . . . . . . . . . . . . . . . . . . . . . . . . . . . 957.3 Different functions within RSF meta-model . . . . . . . . . . . . . . . . . . 957.4 Point-to-point versus indirect transformation for the system under study . . . 997.5 Point-to-point versus indirect transformation within the system under study . 997.6 Point-to-point versus indirect transformation for three systems . . . . . . . . 100
8.1 Overview of the Fact Extraction Patterns. . . . . . . . . . . . . . . . . . . . 109
9.1 Overview of the Trace Capturing Patterns. . . . . . . . . . . . . . . . . . . . 119
xvi
List of Tables
3.1 Characteristics of a mechanistic versus an organic organization as listed byVinekar and Huntley [2010], c©IEEE. . . . . . . . . . . . . . . . . . . . . . 18
4.1 Overview Systems under Study . . . . . . . . . . . . . . . . . . . . . . . . 31
5.1 Key Programs . . . . . . . . . . . . . . . . . . . . . . . . . . . . . . . . . . 475.2 Agreement on Clusters . . . . . . . . . . . . . . . . . . . . . . . . . . . . . 475.3 Fact extraction methods we used. . . . . . . . . . . . . . . . . . . . . . . . 59
6.1 Overview of Assumptions . . . . . . . . . . . . . . . . . . . . . . . . . . . 676.2 Pilot Scenario-Feature Map . . . . . . . . . . . . . . . . . . . . . . . . . . 696.3 Scenario-Feature Map Iteration 1 & 2 . . . . . . . . . . . . . . . . . . . . . 736.4 Candidates After Each Iteration . . . . . . . . . . . . . . . . . . . . . . . . 76

xviii
Part I
Setting the Scene

Chapter 1
Introduction
Living in a vacuum sucks.— Adrienne E. Gusoff
in vitro. Biol. [lit. ‘in glass’.] In a test tube, culture dish, etc.; hence, outside a living body,under artificial conditions; also attrib., performed, obtained, or occurring in vitro.
in vivo. Biol. Within the living organism; also attrib., performed, obtained, or occurring invivo.
[Oxford English Dictionary]
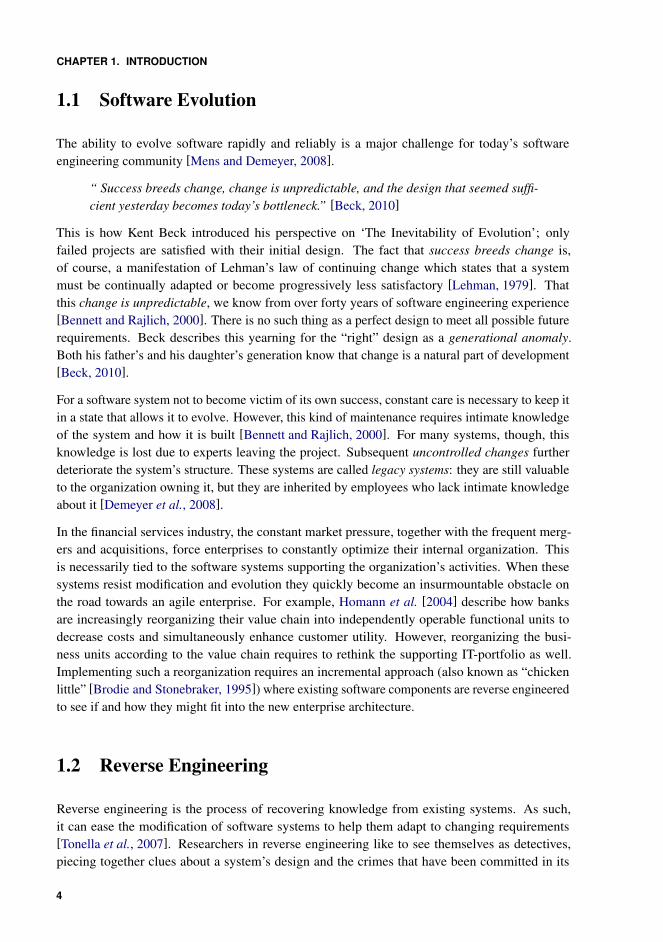
In biology and medicine “in vitro” and “in vivo” are considered two complimentary sides of thesame coin, living in symbiotic relationship with one another for the greater good of the researchdiscipline. In vitro research is necessary, as laboratory conditions allow the investigator to havefull control over the experimental context, necessary to study the causal relationship between thetreatment and the outcome. In vivo research, on the other hand, allows the investigator to studya phenomenon in its real-life context, hence to confirm whether the treatment is applicable inreality.
We argue that software engineering research could benefit from a similar symbiotic relationshipbetween in vitro and in vivo research. Transcribing these terms into a software engineeringvocabulary, in vitro research is then defined as “the manipulation of software artifacts, methods andtechniques in a controlled, artificial environment”, while in vivo research becomes “the analysis ofsoftware artifacts, methods and techniques in uncontrolled, realistic circumstances”. Based onthese definitions, we describe the kind of problems that we experienced while adopting reverseengineering techniques that have proven to be worthwhile in vitro into the in vivo context of largeorganization from the financial services industry.
CHAPTER 1. INTRODUCTION
1.1 Software Evolution
The ability to evolve software rapidly and reliably is a major challenge for today’s softwareengineering community [Mens and Demeyer, 2008].
“ Success breeds change, change is unpredictable, and the design that seemed suffi-cient yesterday becomes today’s bottleneck.” [Beck, 2010]
This is how Kent Beck introduced his perspective on ‘The Inevitability of Evolution’; onlyfailed projects are satisfied with their initial design. The fact that success breeds change is,of course, a manifestation of Lehman’s law of continuing change which states that a systemmust be continually adapted or become progressively less satisfactory [Lehman, 1979]. Thatthis change is unpredictable, we know from over forty years of software engineering experience[Bennett and Rajlich, 2000]. There is no such thing as a perfect design to meet all possible futurerequirements. Beck describes this yearning for the “right” design as a generational anomaly.Both his father’s and his daughter’s generation know that change is a natural part of development[Beck, 2010].
For a software system not to become victim of its own success, constant care is necessary to keep itin a state that allows it to evolve. However, this kind of maintenance requires intimate knowledgeof the system and how it is built [Bennett and Rajlich, 2000]. For many systems, though, thisknowledge is lost due to experts leaving the project. Subsequent uncontrolled changes furtherdeteriorate the system’s structure. These systems are called legacy systems: they are still valuableto the organization owning it, but they are inherited by employees who lack intimate knowledgeabout it [Demeyer et al., 2008].
In the financial services industry, the constant market pressure, together with the frequent merg-ers and acquisitions, force enterprises to constantly optimize their internal organization. Thisis necessarily tied to the software systems supporting the organization’s activities. When thesesystems resist modification and evolution they quickly become an insurmountable obstacle onthe road towards an agile enterprise. For example, Homann et al. [2004] describe how banksare increasingly reorganizing their value chain into independently operable functional units todecrease costs and simultaneously enhance customer utility. However, reorganizing the busi-ness units according to the value chain requires to rethink the supporting IT-portfolio as well.Implementing such a reorganization requires an incremental approach (also known as “chickenlittle” [Brodie and Stonebraker, 1995]) where existing software components are reverse engineeredto see if and how they might fit into the new enterprise architecture.
1.2 Reverse Engineering
Reverse engineering is the process of recovering knowledge from existing systems. As such,it can ease the modification of software systems to help them adapt to changing requirements[Tonella et al., 2007]. Researchers in reverse engineering like to see themselves as detectives,piecing together clues about a system’s design and the crimes that have been committed in its
4
1.3. RESEARCH QUESTIONS
evolution, or as archeologists, reconstructing models of structures buried in the accumulateddeposits of software patches and fixes [Wills and Cross, 1996].
The reverse engineering community is a vibrant research community, resulting in many usefultechniques and research prototypes to recover this knowledge. However, few of them havebeen exploited industrially in significant ways, which is evidenced by the lack of empirical (invivo) research [Tonella et al., 2007] and the lack of a significant tools and service vendor market(enabling in vivo research) [Bennett and Rajlich, 2000].
1.3 Research Questions
This dissertation takes a first step in investigating the lacking industrial adoption of reverseengineering techniques by studying the applicability of existing state-of-the-art reverse engi-neering techniques on mainframes systems in the financial services industry .
While doing so, we try to answer the following questions.
— What is the goal of reverse engineering?
— What are the characteristics of state-of-the-art reverse engineering techniques?
— What are the characteristics of organizations in the financial services industry?
— What are the characteristics of mainframes used in the financial services industry?
— Who can benefit from reverse engineering in the financial services industry?
— Which factors — both technical and organizational — make it difficult to apply reverseengineering in the financial services industry?
After identifying these characteristics and the resulting difficulties, we summarize our experiencesas recommendations by answering the following questions.
— What can organizations do to better support reverse engineering?
— What can the research community do to better support reverse engineering in the financialservices industry?
— What can practitioners do to work around these difficulties while waiting for their organizationand the research community to catch up?
1.4 Guide to the reader
Part I sets the scene. Chapter 2 (p.7) introduces reverse engineering and its different facets. Italso lists the requirements for a good reverse engineering technique. Chapter 3 (p.17) explainsthe peculiarities of the financial services industry. In particular it explains technicalities of themainframe, organizational structures and their impact on IT architecture and development methods.
5
CHAPTER 1. INTRODUCTION
All these characteristics are introduced to explain and understand the feasibility of applying reverseengineering in the financial services industry. Chapter 4 (p.27) lists the systems we have studiedfrom two organizations in the financial services industry.
Part II focusses on three techniques of which we show the technical feasibility by construction.For each technique we argue why it is a good reverse engineering technique worth applying inindustry, how we applied it, which difficulties we had to overcome and what the root causes ofthese difficulties were. We conclude with the lessons we have learned, both for academia andfor industry. Chapter 5 (p.35) explains the application of software views using static informationonly. Chapter 6 (p.63) explains feature location, mainly based on dynamic analysis. Chapter 7 (p.89)
explains the semi-automatic technical redocumentation of a legacy system.
Part III bundles a set of reverse engineering patterns which we discovered while applying thesetechniques in industry. They represent reusable knowledge for practitioners in the field. Thesechapters are meant to be be concise, self-contained and usable in practice. Chapter 8 (p.107)
describes potential approaches to extract static facts from legacy systems. Chapter 9 (p.117)
describes several approaches to extract run-time information from legacy systems. Chapter 10(p.127) contains one pattern on how to study the feasibility of the approaches from the previous twochapters. An overview of the patterns and their intents can be found in Appendix C (p.145).
Part IV wraps up by revisiting our research questions using the lessons we learned and formulatingadvice to academia, the financial services industry and practitioners.
6
Chapter 2
Reverse Engineering
The reverse side also has a reverse side.— Japanese Proverb
In this chapter we introduce the notion of reverse engineering and its main objective: recoveringknowledge. We list some incentives to conduct reverse engineering and position it within softwaremaintenance and evolution. We delve deeper into the three activities that make up reverse engi-neering and uncover some requirements reverse engineering techniques should adhere to in orderto effectively support comprehension. Lastly, we explain the difference between techniques andtools, both harboring explicit knowledge about how to reverse engineer, and we introduce patternsas a way to organize implicit knowledge.
2.1 Taxonomy
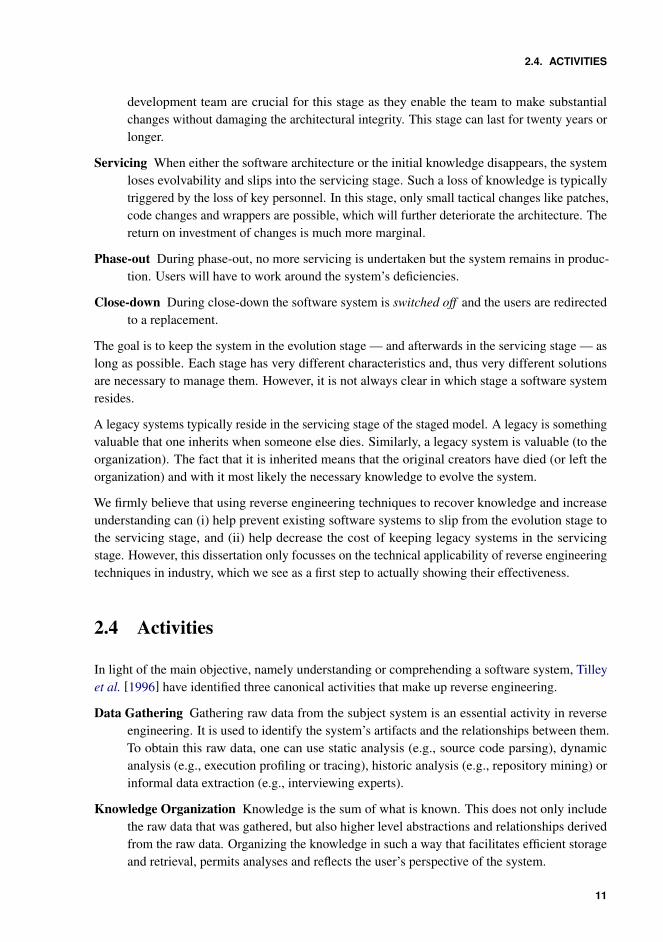
To explain reverse engineering, one must first revisit the notions of forward engineering and thelifecycle of a software system. For simplicity, Figure 2.1 (p.8) shows three lifecycle phases:
(i) requirements as the specification of the problem,(ii) design as the specification of a solution, and
(iii) implementation as a realization of that solution.
Using these phases as illustration, forward engineering is the process of moving from requirements,over design to the physical implementation of a system. This is the typical process followed tocreate a system, where a system can be a code fragment or a complex set of interacting programs.During reverse engineering these phases are visited in the opposite direction. As originally definedby Chikofsky and Cross [1990], reverse engineering is:

CHAPTER 2. REVERSE ENGINEERING
Figure 2.1: Reverse engineering and related processes are transformations between or within abstractionlevels, represented here in terms of life-cycle phases. Adopted from [Chikofsky and Cross, 1990], c©IEEE.
“The process of analyzing a system to identify its components and their interrela-tionships, and creating representations of it in another form or at a higher level ofabstraction.”
Analyzing a system implies that there already is a system. Of course, something must have beenengineered before you can reverse engineer it. Furthermore, reverse engineering is a processof examination, thus no changes are made to the subject system. Identifying components andrelationships boils down to uncovering the structure of the system. Indeed, the main goal ofreverse engineering software systems is to gain a basic understanding of a system and its structure.Creating representations of it in another form means providing an alternative view of the sameinformation within the same abstraction level. For example, one can provide a data flow or controlflow diagram to get a more human-readable and focussed view on a piece of source code. Thisis called redocumentation and can be seen as a transformation within one life-cycle phase inFigure 2.1 (p.8). Creating representations of it at a higher level of abstraction, on the other hand, isa transformation between life-cycle phases. This is called design recovery in which one recreatesdesign abstractions not only from source code, but also from personal experience and generalknowledge about the problem and application domains [Chikofsky and Cross, 1990].
Since the taxonomy was introduced in 1990, reverse engineering has extended well beyondredocumentation and design recovery. Although the intent of their reverse engineering definitionremains intact, it was considered too limiting to characterize the entire field of reverse engineering.Therefore, almost two decades later, Tonella et al. [2007] broadened the definition by characterizingthe reverse engineering discipline as follows.
“Every method aimed at recovering knowledge about an existing software system insupport to the execution of a software engineering task.”
8
2.2. INCENTIVES
Knowledge is still being recovered from existing software systems, but no longer is it limited to“components and their interrelationships”. Furthermore, they emphasize the task-oriented nature ofreverse engineering. One does not just try to understand a system for the fun of it, one is lookingfor very specific knowledge about (a part of) a system in order to, for example, make a modification.Thus, a reverse engineering step typically precedes a forward engineering step in which the newlygained knowledge is exploited to make modifications to the system. The combination of both stepsis called reengineering.
This thesis specifically focusses on the applicability of reverse engineering without taking intoaccount succeeding forward steps. However, bear in mind that reverse engineering is alwaysapplied in the context of facilitating succeeding (forward) software engineering tasks, be it thereally executing those tasks — as the definition of Tonella et al. [2007] suggests — or merelystudying the feasibility or estimating the cost of possible software engineering tasks.
2.2 Incentives
Since reverse engineering is the first step in a reengineering process, the incentives for applyingreverse engineering are similar to those of reengineering. While describing their object orientedreengineering patterns, Demeyer et al. [2008] identified some early signs that warrant reverseengineering or preventive reengineering, including:
• obsolete or no documentation,• departure of original developers,• lack of intimate system and domain knowledge,• limited understanding of the system as a whole.
Furthermore, based on his experience from the field, Dewar [1999] compiled a list of forces thatseems to trigger larger reengineering projects. We distill three categories.
Business Requirements Making data more accessible to the customers or simply offering newproducts or a new combination of existing products can require the modification of exist-ing business processes and their supporting software systems. These changing businessrequirements and the inability of legacy systems to cope with these changes is an incentiveto reengineer.
Corporate Standards Large organizations typically impose standard packages or infrastructurewhich need to be adopted by satellite business units. Depending on the structure of legacysystems, this can be a big challenge.
Technical Platform The hardware or software that legacy systems depend on is no longer beingsupported by the vendor or the organization itself. Or the people within the organization lackthe knowledge to operate and maintain this older technology, which necessitates a migrationto newer, supported technology or a complete rebuild. Either way, the knowledge embeddedin the legacy systems should not be lost.
9
CHAPTER 2. REVERSE ENGINEERING
Initial Development
Evolution
Servicing
Phase-out
Close-down
first running version
loss of evolvability
servicing discontinued
switch-off
evolution changes
servicing patches
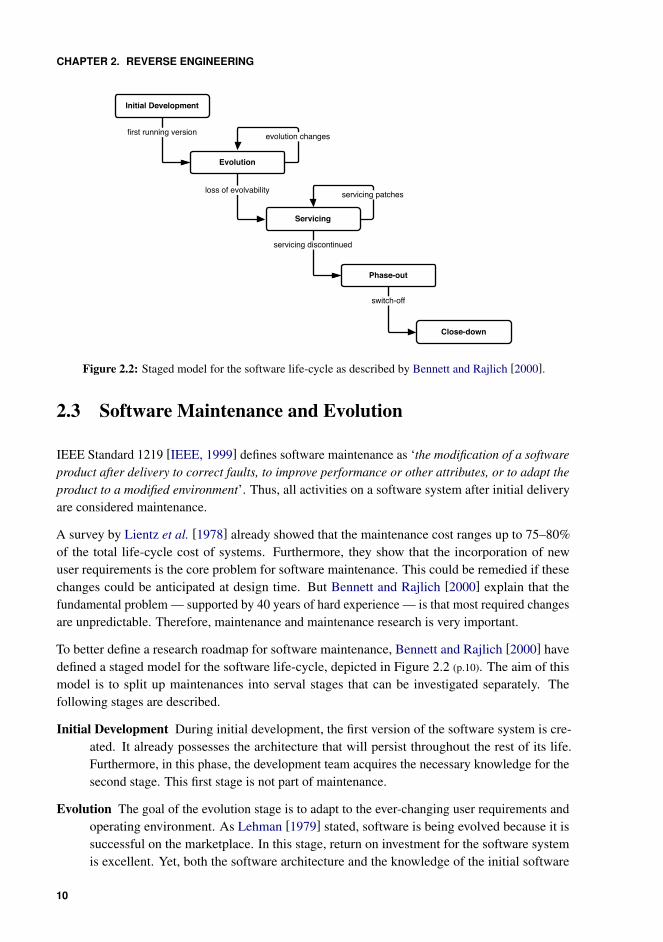
Figure 2.2: Staged model for the software life-cycle as described by Bennett and Rajlich [2000].
2.3 Software Maintenance and Evolution
IEEE Standard 1219 [IEEE, 1999] defines software maintenance as ‘the modification of a softwareproduct after delivery to correct faults, to improve performance or other attributes, or to adapt theproduct to a modified environment’. Thus, all activities on a software system after initial deliveryare considered maintenance.
A survey by Lientz et al. [1978] already showed that the maintenance cost ranges up to 75–80%of the total life-cycle cost of systems. Furthermore, they show that the incorporation of newuser requirements is the core problem for software maintenance. This could be remedied if thesechanges could be anticipated at design time. But Bennett and Rajlich [2000] explain that thefundamental problem — supported by 40 years of hard experience — is that most required changesare unpredictable. Therefore, maintenance and maintenance research is very important.
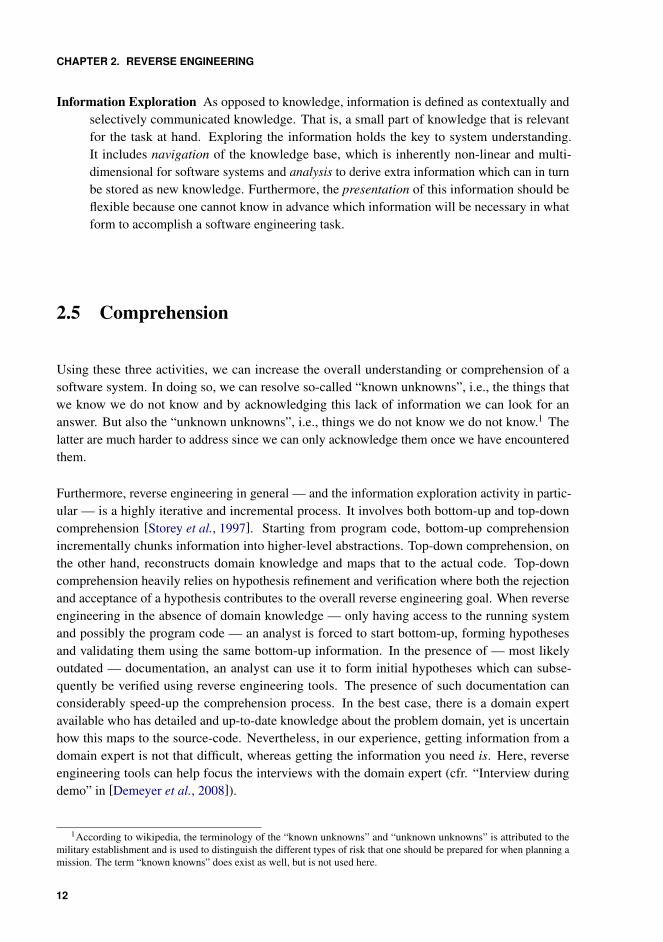
To better define a research roadmap for software maintenance, Bennett and Rajlich [2000] havedefined a staged model for the software life-cycle, depicted in Figure 2.2 (p.10). The aim of thismodel is to split up maintenances into serval stages that can be investigated separately. Thefollowing stages are described.
Initial Development During initial development, the first version of the software system is cre-ated. It already possesses the architecture that will persist throughout the rest of its life.Furthermore, in this phase, the development team acquires the necessary knowledge for thesecond stage. This first stage is not part of maintenance.
Evolution The goal of the evolution stage is to adapt to the ever-changing user requirements andoperating environment. As Lehman [1979] stated, software is being evolved because it issuccessful on the marketplace. In this stage, return on investment for the software systemis excellent. Yet, both the software architecture and the knowledge of the initial software
10
2.4. ACTIVITIES
development team are crucial for this stage as they enable the team to make substantialchanges without damaging the architectural integrity. This stage can last for twenty years orlonger.
Servicing When either the software architecture or the initial knowledge disappears, the systemloses evolvability and slips into the servicing stage. Such a loss of knowledge is typicallytriggered by the loss of key personnel. In this stage, only small tactical changes like patches,code changes and wrappers are possible, which will further deteriorate the architecture. Thereturn on investment of changes is much more marginal.
Phase-out During phase-out, no more servicing is undertaken but the system remains in produc-tion. Users will have to work around the system’s deficiencies.
Close-down During close-down the software system is switched off and the users are redirectedto a replacement.
The goal is to keep the system in the evolution stage — and afterwards in the servicing stage — aslong as possible. Each stage has very different characteristics and, thus very different solutionsare necessary to manage them. However, it is not always clear in which stage a software systemresides.
A legacy systems typically reside in the servicing stage of the staged model. A legacy is somethingvaluable that one inherits when someone else dies. Similarly, a legacy system is valuable (to theorganization). The fact that it is inherited means that the original creators have died (or left theorganization) and with it most likely the necessary knowledge to evolve the system.
We firmly believe that using reverse engineering techniques to recover knowledge and increaseunderstanding can (i) help prevent existing software systems to slip from the evolution stage tothe servicing stage, and (ii) help decrease the cost of keeping legacy systems in the servicingstage. However, this dissertation only focusses on the technical applicability of reverse engineeringtechniques in industry, which we see as a first step to actually showing their effectiveness.
2.4 Activities
In light of the main objective, namely understanding or comprehending a software system, Tilleyet al. [1996] have identified three canonical activities that make up reverse engineering.
Data Gathering Gathering raw data from the subject system is an essential activity in reverseengineering. It is used to identify the system’s artifacts and the relationships between them.To obtain this raw data, one can use static analysis (e.g., source code parsing), dynamicanalysis (e.g., execution profiling or tracing), historic analysis (e.g., repository mining) orinformal data extraction (e.g., interviewing experts).
Knowledge Organization Knowledge is the sum of what is known. This does not only includethe raw data that was gathered, but also higher level abstractions and relationships derivedfrom the raw data. Organizing the knowledge in such a way that facilitates efficient storageand retrieval, permits analyses and reflects the user’s perspective of the system.
11
CHAPTER 2. REVERSE ENGINEERING
Information Exploration As opposed to knowledge, information is defined as contextually andselectively communicated knowledge. That is, a small part of knowledge that is relevantfor the task at hand. Exploring the information holds the key to system understanding.It includes navigation of the knowledge base, which is inherently non-linear and multi-dimensional for software systems and analysis to derive extra information which can in turnbe stored as new knowledge. Furthermore, the presentation of this information should beflexible because one cannot know in advance which information will be necessary in whatform to accomplish a software engineering task.
2.5 Comprehension
Using these three activities, we can increase the overall understanding or comprehension of asoftware system. In doing so, we can resolve so-called “known unknowns”, i.e., the things thatwe know we do not know and by acknowledging this lack of information we can look for ananswer. But also the “unknown unknowns”, i.e., things we do not know we do not know.1 Thelatter are much harder to address since we can only acknowledge them once we have encounteredthem.
Furthermore, reverse engineering in general — and the information exploration activity in partic-ular — is a highly iterative and incremental process. It involves both bottom-up and top-downcomprehension [Storey et al., 1997]. Starting from program code, bottom-up comprehensionincrementally chunks information into higher-level abstractions. Top-down comprehension, onthe other hand, reconstructs domain knowledge and maps that to the actual code. Top-downcomprehension heavily relies on hypothesis refinement and verification where both the rejectionand acceptance of a hypothesis contributes to the overall reverse engineering goal. When reverseengineering in the absence of domain knowledge — only having access to the running systemand possibly the program code — an analyst is forced to start bottom-up, forming hypothesesand validating them using the same bottom-up information. In the presence of — most likelyoutdated — documentation, an analyst can use it to form initial hypotheses which can subse-quently be verified using reverse engineering tools. The presence of such documentation canconsiderably speed-up the comprehension process. In the best case, there is a domain expertavailable who has detailed and up-to-date knowledge about the problem domain, yet is uncertainhow this maps to the source-code. Nevertheless, in our experience, getting information from adomain expert is not that difficult, whereas getting the information you need is. Here, reverseengineering tools can help focus the interviews with the domain expert (cfr. “Interview duringdemo” in [Demeyer et al., 2008]).
1According to wikipedia, the terminology of the “known unknowns” and “unknown unknowns” is attributed to themilitary establishment and is used to distinguish the different types of risk that one should be prepared for when planning amission. The term “known knowns” does exist as well, but is not used here.
12
2.6. REQUIREMENTS
2.6 Requirements
Based on these characteristics of comprehension, we state that a reverse engineering techniquethat wants to successfully support comprehension will have to adhere to the following require-ments.
• The technique should serve as a starting point for understanding, even without the pres-ence of domain knowledge or expertise.
• The technique must support rapid incremental and iterative analysis to quickly verify orreject hypotheses.
• The technique must reveal unknowns (both known and unknown) that facilitate the formu-lation of new hypotheses.
We will use these requirements when selecting promising reverse engineering techniques to applyin the financial services industry.
2.7 Techniques vs Tools
As defined by Tonella et al. [2007], a reverse engineering technique is a solution to one or moreknown problems in reverse engineering. A reverse engineering tool, on the other hand, is definedas an application which implements and supports the usage of one or more techniques. Thus, eachtechnique can be implemented or supported in different ways by several tools.
This dissertation focusses on the applicability of reverse engineering techniques, not of specifictools. However, Muller et al. [2000] identified tool adoption as the biggest challenge to increasedeffectiveness of reverse engineering: “tools can’t be effective if they aren’t used, and most softwareengineers have little knowledge of current tools and their capabilities”. This is also our majorconcern: how to implement state-of-the-art reverse engineering techniques on top of state-of-practice tools and processes. Therefore, we will mainly draw conclusions from the (in)ability toimplement a technique in our industrial context.
2.8 Patterns
Patterns have been introduced by Alexander et al. [1977] as a way to ‘organize implicit knowledgeabout how people solve recurring problems when they go about building things’. Patterns are easyto remember and set out as if-then propositions. That is, if you have a problem within a certaincontext, then this solution could be a good way to solve it. If you have the same problem in anothercontext, then another solution might be better. Furthermore, Mens and Demeyer [2008, chapter 5]describe how the problems solved by patterns entail a number of conflicting forces which needto be balanced and the described solution will discuss a number of trade-offs, i.e., the pros andcons of applying that pattern. As such, patterns help to convey the complex decision process thatexperts use to decide whether or not a solution suits a given problem.
13
CHAPTER 2. REVERSE ENGINEERING
Patterns are often seen as recipes, i.e., a step-by-step solution to a given problem. However, it isnot as simple as that. In a light-hearted attempt to expose the difficulties in applying patterns, titled‘Has the Pattern Emperor any Clothes? A Controversy in Three Acts’, d’Adderio et al. [2002]describe five ways patterns are actually used by practitioners.
• Direct Reuse of Knowledge — A solution to a recurring problem has been described andcan be reused by other practitioners to solve a similar problem. The contribution, however,is not a step-by-step solution, but a discussion on conflicting forces and trade-offs.
• Learning Tool — By reading patterns, one can improve its knowledge on a certain topic.This kind of reading is reflective, relating what you read to what you have done. As such,novices and experts will learn different things when reading patterns.
• Teaching Tool — A well-written pattern does a good job explaining the pattern.• Communications Tool — Using pattern names among experts can speed-up discussion of
competing solutions.• Provoke Thought — A pattern is an invitation to perform a thought experiment, it gives a
tentative solution to consider.
Beck and Cunningham [1987] were the first to apply the pattern idea to software, but it has beenpopularized in the software engineering community by Gamma et al. [1995] with their book ondesign patterns. Since then, two categories of patterns have emerged: design oriented patterns andprocess oriented patterns.
Design oriented patterns describe a product, e.g., how a part of the design of a software sys-tem should look like in the end. Gamma et al. [1995] describe solutions for object orienteddesign problems. Fowler [2002] focusses on enterprise application architecture and Hohpe andWoolf [2003] on enterprise integration using messaging solutions. Recently, a number of patternsfor service-oriented design have been described as well [Erl, 2009]. These are excellent sourceswhen creating software systems, be it from scratch or when redesigning existing systems.
As opposed to describing what to produce, process oriented patterns describe how to get from ’here’to ’there’. Such patterns typically describe the situation before and after, along with the steps neededto make the transition. A perfect example is the book ’Refactoring to Patterns’ [Kerievsky, 2004]which explains in pattern form how to spot design problems and how to solve them by applying,e.g., the design patterns from [Gamma et al., 1995]. Other examples include patterns on howto organize software development [Coplien and Harrison, 2005], how to cope with legacy code[Feathers, 2004] and how to reengineer object oriented systems [Demeyer et al., 2008].
Part III of this dissertation includes some process oriented patterns on how to apply reverseengineering, including ways to perform the Data Gathering activity — both for static facts andrun-time information — and one supporting pattern on conducting quick feasibility studies. Theformat of the patterns is explained in Appendix B (p.143). An overview of the patterns and theirintents can be found in Appendix C (p.145).
14

2.9. SUMMARY
2.9 Summary
The goal of reverse engineering is to recover knowledge about an existing software system. Assuch, it can help humans to better understand a system and enable them to execute subsequentsoftware engineering tasks in the evolution and servicing stage of a system. To do so effectively,reverse engineering techniques and tools should reveal unknowns and allow rapid incremental anditerative analyses.
We use these requirements to select promising reverse engineering techniques in Part II andsee whether they hold up in our industrial context. Furthermore, we provide some reverseengineering patterns in Part III which can help practitioners with the data gathering activity ofreverse engineering.
15

CHAPTER 2. REVERSE ENGINEERING
16
Chapter 3
Financial Services Industry
Adventure is just bad planning.— Roald Amundsen
This chapter introduces the industrial context in which we apply reverse engineering techniques.First, we highlight the typical organizational structures in large organizations within the financialservices industry and how they are supported by mainframes. Then we take a look at how ITis typically structured and performed within these organizations. At last, we position reverseengineering within the confines of organization in the financial services industry by identifyingspecific IT activities and roles that we believe can benefit from reverse engineering.
3.1 Organizational Culture and Development Processes
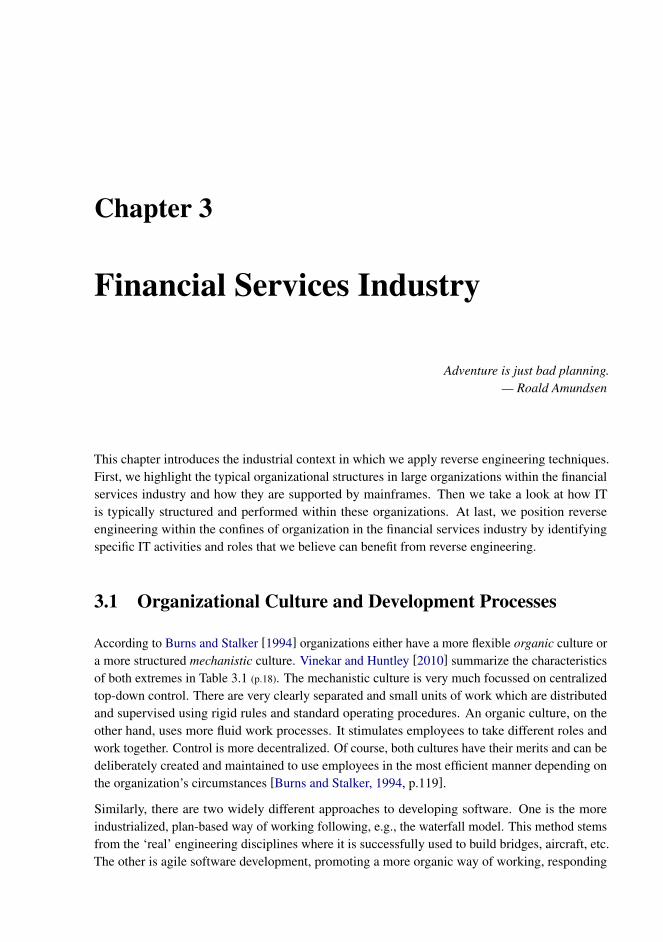
According to Burns and Stalker [1994] organizations either have a more flexible organic culture ora more structured mechanistic culture. Vinekar and Huntley [2010] summarize the characteristicsof both extremes in Table 3.1 (p.18). The mechanistic culture is very much focussed on centralizedtop-down control. There are very clearly separated and small units of work which are distributedand supervised using rigid rules and standard operating procedures. An organic culture, on theother hand, uses more fluid work processes. It stimulates employees to take different roles andwork together. Control is more decentralized. Of course, both cultures have their merits and can bedeliberately created and maintained to use employees in the most efficient manner depending onthe organization’s circumstances [Burns and Stalker, 1994, p.119].
Similarly, there are two widely different approaches to developing software. One is the moreindustrialized, plan-based way of working following, e.g., the waterfall model. This method stemsfrom the ‘real’ engineering disciplines where it is successfully used to build bridges, aircraft, etc.The other is agile software development, promoting a more organic way of working, responding
CHAPTER 3. FINANCIAL SERVICES INDUSTRY
Organic MechanisticEmployees take different roles Labor specialization
Network of teams Hierarchy of authorityLateral communication Vertical communication
Consulting, not command Superiors and subordinatesInformation and advice Instructions and decisions
Commitment to the goal Loyalty and obedienceEmployees work together Employees work separately
Decentralization CentralizationFluid work processes Rules and standard operating procedures
Verbal communication Written communication
Table 3.1: Characteristics of a mechanistic versus an organic organization as listed by Vinekar and Hunt-ley [2010], c©IEEE.
Individuals and Interactions over Processes and ToolsWorking Software over Comprehensive Documentation
Customer Collaboration over Contract NegotiationResponding to Change over Following a Plan
Figure 3.1: Four Tenets from the Manifesto for Agile Software Development.
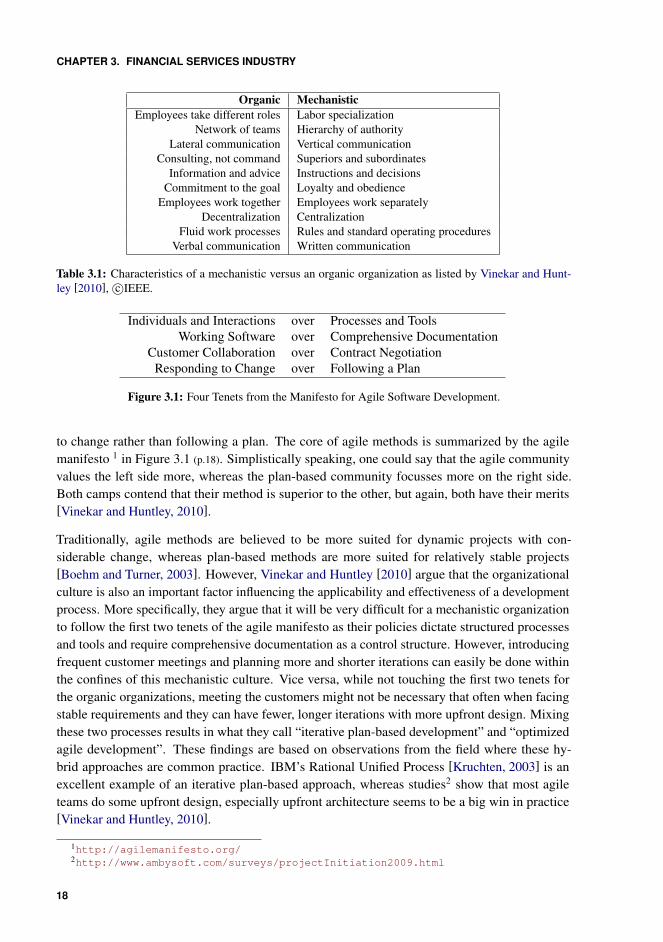
to change rather than following a plan. The core of agile methods is summarized by the agilemanifesto 1 in Figure 3.1 (p.18). Simplistically speaking, one could say that the agile communityvalues the left side more, whereas the plan-based community focusses more on the right side.Both camps contend that their method is superior to the other, but again, both have their merits[Vinekar and Huntley, 2010].
Traditionally, agile methods are believed to be more suited for dynamic projects with con-siderable change, whereas plan-based methods are more suited for relatively stable projects[Boehm and Turner, 2003]. However, Vinekar and Huntley [2010] argue that the organizationalculture is also an important factor influencing the applicability and effectiveness of a developmentprocess. More specifically, they argue that it will be very difficult for a mechanistic organizationto follow the first two tenets of the agile manifesto as their policies dictate structured processesand tools and require comprehensive documentation as a control structure. However, introducingfrequent customer meetings and planning more and shorter iterations can easily be done withinthe confines of this mechanistic culture. Vice versa, while not touching the first two tenets forthe organic organizations, meeting the customers might not be necessary that often when facingstable requirements and they can have fewer, longer iterations with more upfront design. Mixingthese two processes results in what they call “iterative plan-based development” and “optimizedagile development”. These findings are based on observations from the field where these hy-brid approaches are common practice. IBM’s Rational Unified Process [Kruchten, 2003] is anexcellent example of an iterative plan-based approach, whereas studies2 show that most agileteams do some upfront design, especially upfront architecture seems to be a big win in practice[Vinekar and Huntley, 2010].
1http://agilemanifesto.org/2http://www.ambysoft.com/surveys/projectInitiation2009.html
18
3.2. IT STRUCTURES
That the culture and structure of an organization has an influence on software development is nosurprise. In 2002, Xia and Lee [2004] conducted an empirical study on 541 information systemdevelopment projects of North American organizations. In this study, they relate technological andorganizational complexity to project performance metrics such as delivery time, cost, functionalityand user satisfaction. Their main findings are that the technological aspects of a developmentproject are perceived as ‘most complex’, but the numbers show that the organizational aspectshave a more significant impact on the actual performance and outcome of the project. Clearly,organizational culture and structures play an important role when developing and maintainingsoftware.
Organizations in the financial services industry — and specifically the two where we conductedour research — have a mechanistic culture. Hence, they promote labor specialization and try tomaintain centralized control. Therefore, they rely on rigorous processes and standardized toolsresulting in an iterative plan-based development process.
3.2 IT Structures
Julius Caesar knew the power of Divide and Conquer long before the introduction of IT. Whensomething is too big to manage as a whole, break it up into manageable parts. The idea is applicableto all kinds of systems ranging from software systems to societies to entire eco-systems. Whetherit is a hierarchical structure imposed from the top down (such as in governments) or an organicstructure emerging from the bottom up (such as in ant colonies), structure is necessary to sustain asystem. And the bigger the system, the more structure is needed.
Large banking and insurance organizations are typically divided into departments related to thekind of products they offer. Each department is responsible for one core business activity ofthe organization. Of course, other, more supporting departments will be necessary as well, suchas Human Resources (HR). These are no core activities, but nonetheless necessary to make theorganization function as a whole.
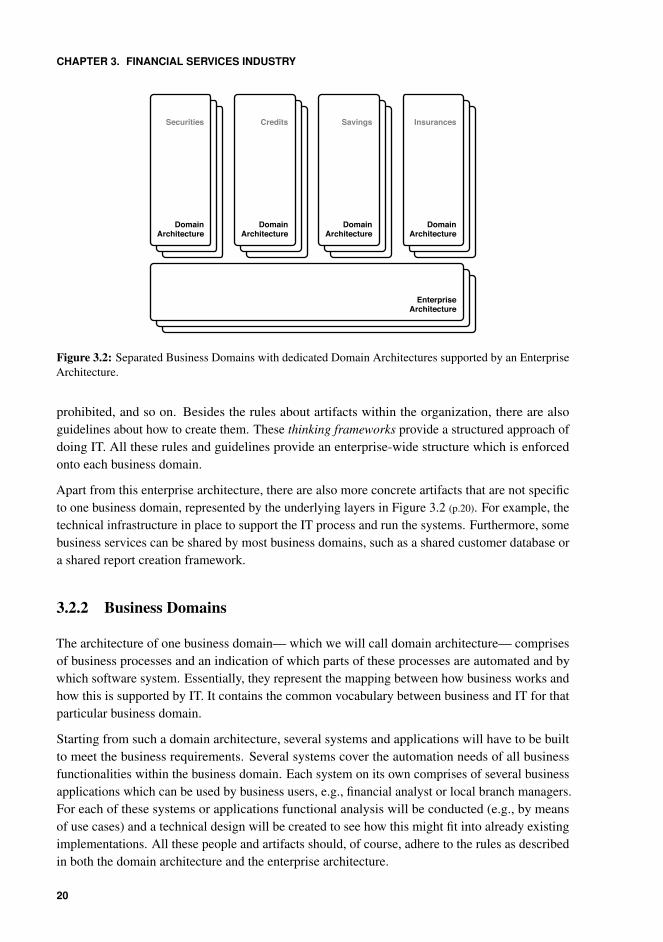
Unsurprisingly, the IT to support all these activities is structured in the same way. Figure 3.2 (p.20)
shows an example of such a structure. You see several clearly separated business domains withinwhich activities relating to a certain type of product are performed. Each business domain has itsown architecture and software systems. However, to preserve coherence, all these domains aregoverned by one enterprise architecture.
3.2.1 Enterprise-wide Structures
On an architectural level, these enterprise-wide structures contain rules on what kind of interactionsare possible within and between business domains. For example, how can data flow within abusiness domain, how can data be exposed to other business domains, when is synchronouscommunication allowed, when is asynchronous communication desired, and so on. Furthermore,some technological limitations can be imposed, such as which tools are mandatory to use, whichsoftware packages are supported by the organization, what kind of technology is absolutely
19
CHAPTER 3. FINANCIAL SERVICES INDUSTRY
EnterpriseArchitecture
EnterpriseArchitecture
Domain Architecture
Domain ArchitectureDomain
Architecture
Domain ArchitectureDomain
Architecture
Domain ArchitectureDomain
Architecture
Domain Architecture
EnterpriseArchitecture
Securities
Domain Architecture
Credits
Domain Architecture
Savings
Domain Architecture
Insurances
Domain Architecture
Figure 3.2: Separated Business Domains with dedicated Domain Architectures supported by an EnterpriseArchitecture.
prohibited, and so on. Besides the rules about artifacts within the organization, there are alsoguidelines about how to create them. These thinking frameworks provide a structured approach ofdoing IT. All these rules and guidelines provide an enterprise-wide structure which is enforcedonto each business domain.
Apart from this enterprise architecture, there are also more concrete artifacts that are not specificto one business domain, represented by the underlying layers in Figure 3.2 (p.20). For example, thetechnical infrastructure in place to support the IT process and run the systems. Furthermore, somebusiness services can be shared by most business domains, such as a shared customer database ora shared report creation framework.
3.2.2 Business Domains
The architecture of one business domain— which we will call domain architecture— comprisesof business processes and an indication of which parts of these processes are automated and bywhich software system. Essentially, they represent the mapping between how business works andhow this is supported by IT. It contains the common vocabulary between business and IT for thatparticular business domain.
Starting from such a domain architecture, several systems and applications will have to be builtto meet the business requirements. Several systems cover the automation needs of all businessfunctionalities within the business domain. Each system on its own comprises of several businessapplications which can be used by business users, e.g., financial analyst or local branch managers.For each of these systems or applications functional analysis will be conducted (e.g., by meansof use cases) and a technical design will be created to see how this might fit into already existingimplementations. All these people and artifacts should, of course, adhere to the rules as describedin both the domain architecture and the enterprise architecture.
20
3.3. IT ACTIVITIES
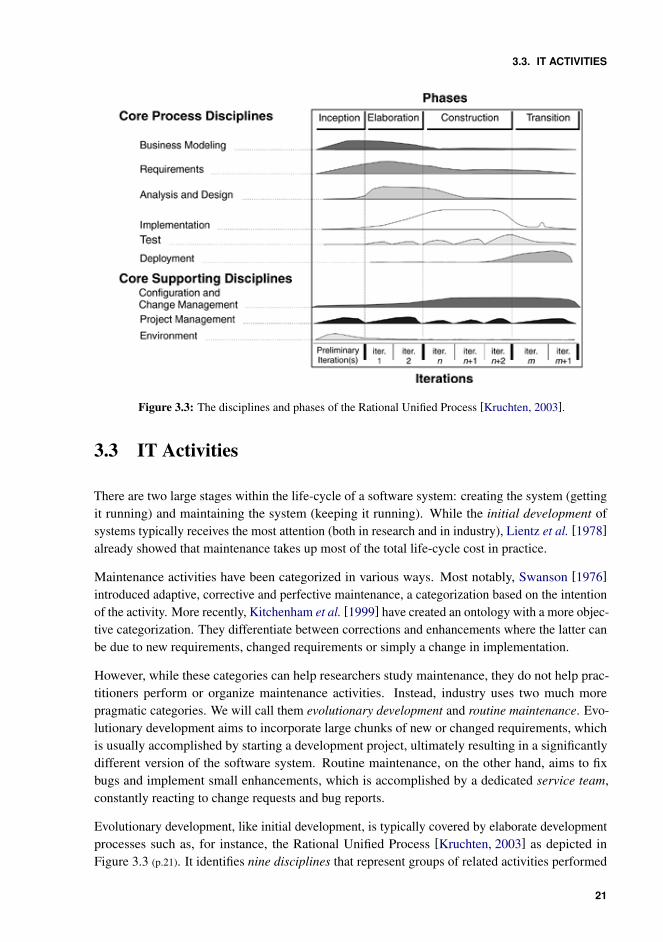
Figure 3.3: The disciplines and phases of the Rational Unified Process [Kruchten, 2003].
3.3 IT Activities
There are two large stages within the life-cycle of a software system: creating the system (gettingit running) and maintaining the system (keeping it running). While the initial development ofsystems typically receives the most attention (both in research and in industry), Lientz et al. [1978]already showed that maintenance takes up most of the total life-cycle cost in practice.
Maintenance activities have been categorized in various ways. Most notably, Swanson [1976]introduced adaptive, corrective and perfective maintenance, a categorization based on the intentionof the activity. More recently, Kitchenham et al. [1999] have created an ontology with a more objec-tive categorization. They differentiate between corrections and enhancements where the latter canbe due to new requirements, changed requirements or simply a change in implementation.
However, while these categories can help researchers study maintenance, they do not help prac-titioners perform or organize maintenance activities. Instead, industry uses two much morepragmatic categories. We will call them evolutionary development and routine maintenance. Evo-lutionary development aims to incorporate large chunks of new or changed requirements, whichis usually accomplished by starting a development project, ultimately resulting in a significantlydifferent version of the software system. Routine maintenance, on the other hand, aims to fixbugs and implement small enhancements, which is accomplished by a dedicated service team,constantly reacting to change requests and bug reports.
Evolutionary development, like initial development, is typically covered by elaborate developmentprocesses such as, for instance, the Rational Unified Process [Kruchten, 2003] as depicted inFigure 3.3 (p.21). It identifies nine disciplines that represent groups of related activities performed
21
CHAPTER 3. FINANCIAL SERVICES INDUSTRY
prestudy
project bug fixessmall enhancements
estimate impact
Routine Maintenance
EvolutionaryDevelopment
WorkPreparation
WorkExecution
high
low
unclear
reliable cost estimate
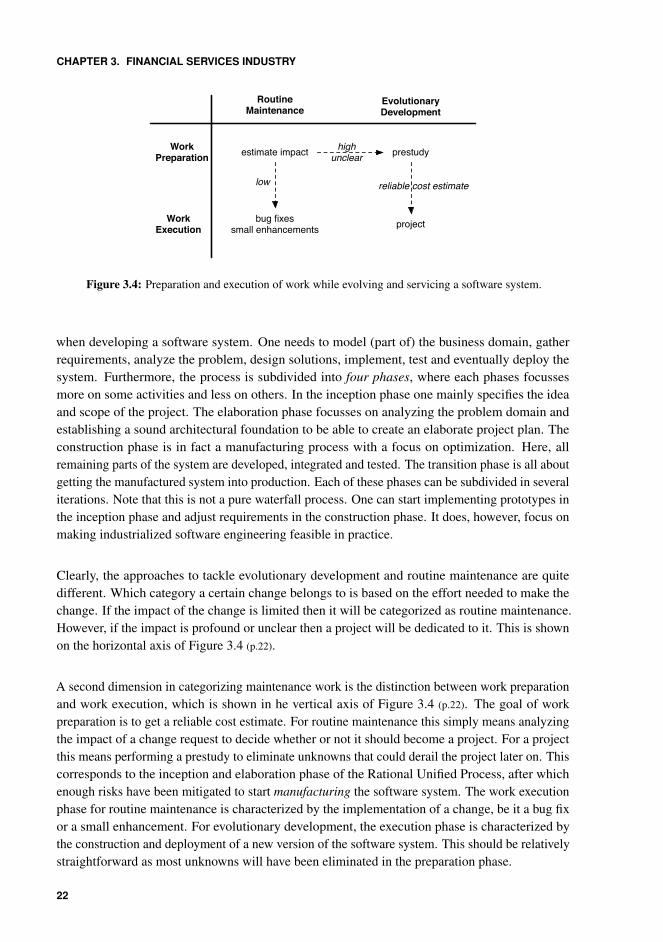
Figure 3.4: Preparation and execution of work while evolving and servicing a software system.
when developing a software system. One needs to model (part of) the business domain, gatherrequirements, analyze the problem, design solutions, implement, test and eventually deploy thesystem. Furthermore, the process is subdivided into four phases, where each phases focussesmore on some activities and less on others. In the inception phase one mainly specifies the ideaand scope of the project. The elaboration phase focusses on analyzing the problem domain andestablishing a sound architectural foundation to be able to create an elaborate project plan. Theconstruction phase is in fact a manufacturing process with a focus on optimization. Here, allremaining parts of the system are developed, integrated and tested. The transition phase is all aboutgetting the manufactured system into production. Each of these phases can be subdivided in severaliterations. Note that this is not a pure waterfall process. One can start implementing prototypes inthe inception phase and adjust requirements in the construction phase. It does, however, focus onmaking industrialized software engineering feasible in practice.
Clearly, the approaches to tackle evolutionary development and routine maintenance are quitedifferent. Which category a certain change belongs to is based on the effort needed to make thechange. If the impact of the change is limited then it will be categorized as routine maintenance.However, if the impact is profound or unclear then a project will be dedicated to it. This is shownon the horizontal axis of Figure 3.4 (p.22).
A second dimension in categorizing maintenance work is the distinction between work preparationand work execution, which is shown in he vertical axis of Figure 3.4 (p.22). The goal of workpreparation is to get a reliable cost estimate. For routine maintenance this simply means analyzingthe impact of a change request to decide whether or not it should become a project. For a projectthis means performing a prestudy to eliminate unknowns that could derail the project later on. Thiscorresponds to the inception and elaboration phase of the Rational Unified Process, after whichenough risks have been mitigated to start manufacturing the software system. The work executionphase for routine maintenance is characterized by the implementation of a change, be it a bug fixor a small enhancement. For evolutionary development, the execution phase is characterized bythe construction and deployment of a new version of the software system. This should be relativelystraightforward as most unknowns will have been eliminated in the preparation phase.
22
3.4. IT ROLES
3.4 IT Roles
We now have an idea about what kind of activities are performed, but not about who performs them.The Rational Unified Process relates several roles to each discipline. A role defines the behavior (aspecific activity) and the responsibility (usually a resulting artifact) of an individual. The basicRational Unified Process [Kruchten, 2003] defines up to 30 roles. The Enterprise Unified Process[Ambler et al., 2005], an extension to the Rational Unified Process including, e.g., enterprisearchitecture, defines 25 more roles.
For example, there is no such thing as an architect. There are enterprise and technology architectsoverseeing enterprise-structures and decisions. There are domain architects ensuring consistencywithin their business domain. Furthermore, there are usually architects on project and applicationlevel as well. The same holds for analysts, where there are business analysts gathering and analyz-ing the requirements of one business domain and functional analysts analyzing the requirements ofone software system. Furthermore, there are technical designers mapping functional solution ontotechnical structures, developers implementing software systems, maintainers making changes toexisting systems. Testers exist on the IT side for developer and integration testing, but also on thebusiness side for more functional and acceptance testing.
These are just some roles from the core process disciplines, which are the first six disciplinesdepicted in Figure 3.3 (p.21). There are also many roles for the core supporting disciplines, thelast three disciplines depicted in Figure 3.3 (p.21). The latter include all kinds of managers, butalso dedicated operational groups to keep the supporting infrastructure running. For example,database management, transaction management, change management, configuration management,managing the development infrastructure, etc.
Although Rational Unified Process encourages organizations to make employees take up severalroles, the mechanistic culture typically forces employees to only take one or two roles.
This dissertation will focus on the following roles.
Prestudy Leader The role of prestudy leader will either be taken up by a business analyst, as theideal liaison between business and IT, or by a project architect, overseeing all parts of theproject. A prestudy leader is responsible for making a reliable cost estimate for a subsequentdevelopment project. As such, he has the means to initiate certain analyses to identify andresolve unknowns that pose a risk.
Technical Designer The role of technical designer will usually be taken up by an expert of thesoftware system in question. He is responsible for assessing the impact of proposed changesto the current technical structure of the system. These proposed changes can be articulatedby, for example, a prestudy leader looking for more expertise.
Maintainer The role of maintainer embodies interpretation of bug reports and enhancementrequest, locating code fragments that need modification and implementation and testing ofthese changes. He is in charge of performing routine maintenance on an existing softwaresystem. As such, she will incrementally gain intimate knowledge about the inner workingsof the system, but only of those parts she has to modify.
23
CHAPTER 3. FINANCIAL SERVICES INDUSTRY
When discussing the techniques in the remainder of this dissertation, we will use the term analystas a general term to denote anyone using reverse engineering to analyze a system, regardless ofthe three specific roles above. These are also the kind of people we refer to as practitioners whenformulating advice in our conclusion.
Furthermore, the following supporting role will be used in this dissertation.
Technical Operator We use the term technical operator to denote any person performing atechnical role within the supporting departments. That is, the people responsible for theenterprise-wide technical infrastructure enabling developers, designers, analysts and archi-tects to do their job.
3.5 Enterprise Applications
There are many different kinds of software. The software necessary in the telecom industry,for example, is widely different from the software used in the financial services industry. Thelatter is usually categorized under the term enterprise applications, also known as informationsystems.
Fowler [2002] has a very pragmatic take on the notion of enterprise applications. Although unableto give a precise definition, he gives some characterizing indications. Enterprise applicationsusually involve a lot of persistent data which is accessed concurrently by many people. A lot ofdata accessible to many different kinds of people means even more user interface screens to handleit. Since enterprise applications rarely live on an island, there is also a need to integrate withother applications scattered around the enterprise, built with different technologies and used withindifferent business units as part of different business processes. Lastly, these enterprise applicationscontain business logic that implement business rules which are not under the control of softwareengineers. Dealing with these strange rules that often interact in surprising ways, and dealingwith the thousands of one-off special cases that will have to be incorporated in the rules, leads tocomplex business “illogic”. In short, enterprise applications use business logic to process data ona large scale, which is also called commercial data processing.
3.6 Mainframes
While the mainframe is regarded by many as the dinosaur of computing, there is no denyingits dominance over the landscape of large-scale enterprise computing over the last five decades.Although other infrastructure is used as well, they are still indispensable in many — if not all —of today’s enterprise systems, because they are very well suited for commercial data processing.The reliability of the hardware, the security of the operating system and the integrity of the dataare unmatched by any other technology. Furthermore, the mainframe is known for its enormoustransaction processing capabilities and for supporting thousands of users and application programsconcurrently accessing numerous resources and managing terabytes of data. Lastly, the mainframeprovides several facilities for ensuring accountability (who did what and when), a must for all large
24
3.6. MAINFRAMES
enterprises, especially those in the financial services industry. On the other hand, mainframes arevery bad at number crunching and have almost no graphical support (think textual 3270 terminals)[Stephens, 2008].
When trying to define the term ‘mainframe’, IBM comes up with some interesting characteristics,such as “centralized control of resources” and “a style of operation, often involving dedicatedoperations staff who use detailed operations procedure books and highly organized procedures [...]”[Ebbers et al., 2006]. The latter illustrates the typical mechanistic culture of organizations usingmainframe. The sheer size of these organizations requires them to be highly organized, typicallyresulting in separate division and teams with dedicated responsibilities using strict operationalprocedures.
In addition to these organizational characteristics reflected in mainframes, there are also sometechnical characteristics that make it different from other computing environments. We list threeof them that will be relevant in the remainder of this dissertation.
Mainframe Languages Many languages — both old and new — are being used on mainframestoday. Some have very specific purposes, such as JCL for controlling batch jobs and SQL for query-ing databases. Others are used as general purpose programming languages for implementing thenecessary business logic or infrastructural code, such as COBOL, PL/I and FORTRAN. Furthermore,many levels of abstraction are supported by different languages that range from very low-levellanguages like ASSEMBLER, which is very close to machine code, to high-level languages likeVAG and EGL. The latter were created to ease the implementation of business logic by abstractingaway technical tasks like accessing files or databases and usually generate more low-level codelike COBOL or JAVA. A last category are the CASE-tools. On top of providing a high-levelprogramming language, they provide an entire environment supporting not only development butalso analysis and design of software. This type of tools also generates more low-level code to becompiled. Some of these languages are vendor-specific, others are standardized but may comewith a plethora of vendor-specific dialects.
Batch vs Online Processing There are typically two modes in which a mainframe can operate:in online mode and in batch mode. Online mode implies interaction with users, which typicallytakes the form of transactional processing supported by infrastructure such as IMS (IBM’s Informa-tion Management System) or CICS (IBM’s Customer Information Control System). Batch mode,on the other hand, implies non-interactive processing used for processing data in bulk. Thesebatch processes usually run at night or during the weekend and or controlled by scripts written inJCL.
Mainframe Environments An example of the rigid structures in mechanistic organizationsis their development and deployment process which is technically visible in the different main-frame environments that are used. As shown in Figure 3.5 (p.26), there are typically three tofour environments corresponding to different stages in the software development process. TheDEV environment is used by developers to create, correct and test individual programs. TheTST environment is used for developer integration testing. To reduce costs, the DEV and TST
environments are sometimes merged into one environment. After developer testing, the programsare typically promoted to the quality assurance or pre-production environment (QA), i.e., the
25
CHAPTER 3. FINANCIAL SERVICES INDUSTRY
TST - Testing
DEV - Development
PRD - Production
QA - Quality Assurance
prom
otio
n
Figure 3.5: Typical Mainframe Environments
environment used for acceptance testing by business. This environment usually contains a mirrorof the next production release which will run on the production environment (PRD) used by theend-users. As such, both environments are alive using real data and communicating with allthird-party systems. All significant changes pass through these three (or four) stages, no stage isskipped. The entire deployment process is driven by a very strict release cycle, with typically fourreleases per year.
In conclusion, while mainframes will not win you over for their good looks and are very bad atnumber crunching and graphics, they are currently unmatched for commercial data processing.Nevertheless, in order to survive, they too must adapt to changing requirements, which will becomeincreasingly more difficult as knowledge disappears with people leaving or retiring. Hence, thevital importance of reverse engineering on the mainframe in years to come.
3.7 Summary
Organizations in the financial services industry have a mechanistic culture favoring plan-baseddevelopment processes. As such they promote labor specialization resulting in clearly delineatedtasks and impose rigorous processes supported by standardized tools to maintain centralizedcontrol.
Mainframes provide the perfect infrastructure to support commercial data processing in thismechanistic culture. They clearly implement the organizational structures and rigorous processes,allowing for little flexibility. Several mainframe environment with different characteristics areset up to support the typical plan-based development process. Furthermore, because of their age,mainframes also come with various languages and dialects.
We have identified two areas in which we believe these organizations can benefit from reverseengineering techniques: during prestudies for evolutionary development and during routine main-tenance. As such, the following roles can benefit the most from reverse engineering: (i) prestudyleaders when studying the feasibility or estimating the cost of a proposed project, (ii) technicaldesigners when confronted with technical questions from a prestudy leader or when decidingwhether a change request is to be considered routine maintenance, (iii) maintainers when asked toimplement a change to a part of the system they do not know very well.
26
Chapter 4
Systems under Study
To err is human – and to blame it on a computer is even more so.— Robert Orben
This chapter gives an overview of the three systems from two different organizations we havestudied in the context of this dissertation. For each system we will briefly discuss its purposeand list some technical characteristics. Additionally, we will position each system within thesoftware life-cycle stages as presented in Section 2.3 (p.10) and discuss whether the system is stillundergoing evolutionary development or only routine maintenance. Lastly, we will relate someincentives to perform reverse engineering to each system, based on the incentives as provided inSection 2.2 (p.9). An overview and comparison of the three systems under study is provided inTable 4.3 (p.31).
4.1 Document Generation and Management System
Purpose Courier is a Document Generation and Management System that enables an insuranceorganization to (i) define, check and manage different types of documents which are to be sent insome way to their customers, and (ii) gather and sort these documents so that they can be printedand sent as efficiently as possible. The focus of Courier is on the documents that make up most ofthe organization’s mail-flux and is not intended for the use of very specialized, one-time documents.To accomplish the above requirements, Courier can be used interactively via mainframe terminalsand through batch jobs for bulk processing. Furthermore, domain-specific applications can be builtfor other systems to make use of Courier. As such, it is set up as a general purpose tool, i.e., itdoes not care about the kinds of documents it processes, nor what they contain. It achieves this byletting the documents be defined through parameters in a database, describing everything from thehigh-level specification to the low level details (including text, required inputs, etc.).
CHAPTER 4. SYSTEMS UNDER STUDY
Technical Courier is a Cobol application with small parts in assembler and glued together withJCL scripts for batch processing. It consists of 200k lines of COBOL code with embedded SQL
(including whitespaces and comments), divided over 401 COBOL programs and 336 COBOL
copybooks, and 38k lines of JCL. It runs on an IBM z/OS mainframe using IMS for transactionprocessing and DB2 as database management system. ASF is used for typesetting, which canonly compose documents in batch. The maintainers use PVCS and Mainframe Express for theirroutine maintenance tasks. It provides source management, version management and locking offiles. Compiling takes place on the maintainers’ machine, after which the binary is placed onto themainframe
Software Life-Cycle Stage The system is almost 20 years old and has survived more than onemerger and acquisition by the organization. There is one very experienced maintainer, the originaldeveloper, who practically knows the system by heart, but who is about to retire. He has threeother people in his team that are less experienced and have been working for ± 5 years on Courier.A lot of documentation is available, though not in a standardized format, without clear categoriesand most of it out of date. Although the original developer is still actively involved, the system is astereotypical example of a system in the servicing stage. The code has become difficult to evolveand the technology is too outdated to support new business requirements. As such, current changesare limited to routine maintenance in the form of bug fixes and patches.
Incentive Business wants to integrate a live preview functionality into Courier, but maintainersresist because the application was built for bulk-processing. More importantly, the use of AFS astypesetting facility prohibits the live preview because AFS only supports composing documentsin batch. As such, the entire Document Generation and Management System will be rewritten inJAVA, enabling the integration of a live preview and, at the same time, dividing their applicationinto components which can potentially be outsourced afterwards. The migration to this new systemwill be gradual in the sense that Courier will be phased out and run in parallel with the new system.Other systems can choose to use the new system or continue using the old, but no new featureswill be added to Courier anymore. Nonetheless, knowledge about Courier will be important tobuild the new system, and in the meantime, Courier still needs to be maintained.
4.2 Portfolio Management System
Purpose The Portfolio Management System is part of a large Belgian bank and provides theback-end for keeping track of all financial possessions of a client (e.g., securities and savings)in a so called portfolio. As such, the Portfolio Management System collects information froma lot of other systems within the organization. The goal is to assist clients in managing theirportfolios, which it does based on the client’s profile. Clients can create, inspect, modify andregroup their own portfolios and even simulate buy and sell actions to see the effect on a certainportfolio. Important back-end features include calculating the real value of possessions (i.e., howmuch are my shares worth at this moment) and calculating how certain possessions are spread overa portfolio (e.g., to perform some risk analyses).
28
4.2. PORTFOLIO MANAGEMENT SYSTEM
Technical The system is coded in two different 3GL languages, namely APS and VAG, fromwhich COBOL code is generated that runs on an IBM z/OS mainframe. APS has a very COBOL
like syntax but abstracts away implementation details thereby focussing on the business functions.VAG doesn’t resemble COBOL as much as APS, it has a more functional syntax but still mapseasily onto COBOL. Past development has always been in APS, while all the new development is inVAG, i.e., all subsystems are a mixture of both APS and VAG. This is technically possible becauseboth languages invoke programs by their COBOL name, which is the same in both languages. Thedependencies between those programs are automatically kept up to date and stored in databasetables that can be accessed through a tool called CROSSREF or queried directly using SQL.
The system consists of more than 1.8M lines of VAG code and more than 1.2M lines of APScode, distributed over 2343 executable COBOL modules of which 1230 are interacting with othermodules in the system. The other 1113 are stand-alone modules such as isolated maintenancemodules (used once to fix something in a release) and stand-alone batch programs.
The change and release management is tracked by Changeman, transaction processing is providedby IMS and the database management system is DB2. Furthermore, a tool called XPEDITER isused for analyzing, testing and debugging mainframe application. It provides standard debuggingfunctionality like setting breakpoints and watching variables.
Software Life-Cycle Stage The Portfolio Management System is clearly in the evolution stage,it is a very important and profitable system for the organization. As such, about ten people areperforming routine maintenance and over 30 are actively developing new features. There are twovery experienced people within the maintenance team: one is an analyst within the maintenanceteam with a developer background, as such he has both a functional and a technical perspectiveon the system, the other one is the lead maintainer, who knows all the technical details of thesystem. At the same time, three domain architects are actively maintaining and evolving thedomain architecture in which the Portfolio Management System plays an important role.
Documentation is provided in the proprietary tool MEGA and theoretically spans from the func-tional level to the executable entities (programs, subprograms, functions). In practice, however,there are gaps. Partial redocumentation efforts have been conducted in the past. Routine mainte-nance and evolutionary development is documented, but there is a historical backlog which is noteasily processed.
Incentives. Because the Portfolio Management System is being actively evolved as one of themost important system within the organization, it regularly introduces new concepts which are laterreused within other system of the organization. In other words, the system introduces new — orchanges existing — corporate standards. As such, some features within the system will eventuallyhave to be extracted into a separate enterprise-wide service reusable within the organization.Furthermore, domain architects are actively exploring ways to expand the scope of their domain.As such, they act as leaders in several prestudies to investigate the feasibility of using this systemin other European countries, whereas now it is only used in Belgium. Currently, they gather theirinformation only from the technical designers. Reverse engineering can be used as an extra sourceof information to take the system it self into account as well.
29
CHAPTER 4. SYSTEMS UNDER STUDY
4.3 Custody Services Back-end
Purpose OSIRIS provides the Custody Services Back-end for a large Belgian Bank. In short,custody is a service consisting in holding and administering securities on behalf of third par-ties [Chan et al., 2007]. The New Oxford American Dictionary defines a security as “a certificateattesting credit, the ownership of stocks or bonds, or the right to ownership connected with tradablederivatives”. In early days, these certificates where papers stored in vaults, nowadays all thisinformation is stored, checked and traded electronically.
Technical OSIRIS is implemented in CA GEN, a Computer Aided Software Engineering (CASE)application development environment marketed by Computer Associates1. CA GEN was originallyknown as the CA GEN CASE TOOL (Information Engineering Facility2). Developers can createentities, procedures, procedure steps and action blocks in the CASE tool using both visual modelsand textual code. As such, not all information is retrievable from plain source code. However, CAGEN stores all its information in a proprietary database format which can be interactively queriedvia the CE-ACCESS tool or directly using SQL queries. From this repository, COBOL code andDB2 database schemas are generated which are compiled and deployed on an IBM mainframerunning z/OS where IMS is used for transaction processing and DB2 as a database managementsystem. Although the bulk of the system is created with CA GEN, some modules are coded in PL/I
to provide communication mechanisms with other systems. Furthermore, JCL is used to control allthe batch processing.
Software Life-Cycle Stage Over the year OSIRIS has reached a stable state, both technicallyand functionally. As such, it is clearly in the servicing stage where the bulk of routine maintenanceis concerned with legal and fiscal adjustments. However, over the years, it has grown to containtoo much functionality and technologically it is drawing its last breath, running on a completelyisolated mainframe environment which constitutes both a high risk and a high cost. Furthermore,documentation is rather limited. There has been an effort to document the current system, but ithas never been a priority. The little documentation that is available is not used and not kept up todate. The maintainers get most of their work done using the CE-ACCESS tool.
Incentives. The system is currently undergoing a technical conversion for two reasons. First,it aims to move away from the CA GEN environment, which will no longer be supported, andreplace it with EGL, a platform-independent, business-oriented language that is being introducedthroughout the entire organization. Second, it aims to move away from an outdated mainframeenvironment which is currently only being supported to run this one system created in CA GEN.On top of that, the current and future maintenance activities are being off-shored to India. As aprerequisite, sufficient documentation needs to be available.
1http://www.ca.com/2http://en.wikipedia.org/wiki/Information_Engineering_Facility
30
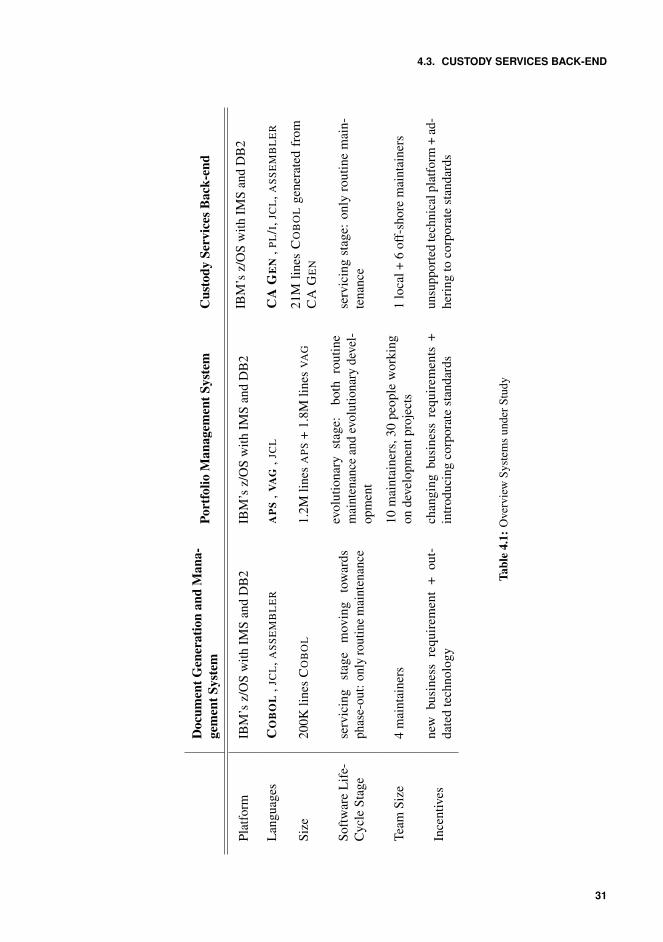
4.3. CUSTODY SERVICES BACK-END
Doc
umen
tGen
erat
ion
and
Man
a-ge
men
tSys
tem
Port
folio
Man
agem
entS
yste
mC
usto
dySe
rvic
esB
ack-
end
Plat
form
IBM
’sz/
OS
with
IMS
and
DB
2IB
M’s
z/O
Sw
ithIM
San
dD
B2
IBM
’sz/
OS
with
IMS
and
DB
2
Lan
guag
esC
OB
OL
,JC
L,A
SS
EM
BL
ER
AP
S,V
AG
,JC
LC
AG
EN
,PL
/I,J
CL
,AS
SE
MB
LE
R
Size
200K
lines
CO
BO
L1.
2Mlin
esA
PS
+1.
8Mlin
esV
AG
21M
lines
CO
BO
Lge
nera
ted
from
CA
GE
N
Soft
war
eL
ife-
Cyc
leSt
age
serv
icin
gst
age
mov
ing
tow
ards
phas
e-ou
t:on
lyro
utin
em
aint
enan
ce
evol
utio
nary
stag
e:bo
thro
utin
em
aint
enan
cean
dev
olut
iona
ryde
vel-
opm
ent
serv
icin
gst
age:
only
rout
ine
mai
n-te
nanc
e
Team
Size
4m
aint
aine
rs10
mai
ntai
ners
,30
peop
lew
orki
ngon
deve
lopm
entp
roje
cts
1lo
cal+
6of
f-sh
ore
mai
ntai
ners
Ince
ntiv
esne
wbu
sine
ssre
quir
emen
t+
out-
date
dte
chno
logy
chan
ging
busi
ness
requ
irem
ents
+in
trod
ucin
gco
rpor
ate
stan
dard
sun
supp
orte
dte
chni
calp
latfo
rm+
ad-
heri
ngto
corp
orat
est
anda
rds
Tabl
e4.
1:O
verv
iew
Syst
ems
unde
rStu
dy
31

CHAPTER 4. SYSTEMS UNDER STUDY
32

Part II
Techniques

Chapter 5
Software Views
Machines take me by surprise with great frequency.— Alan Turing
Software views are seen as an essential tool in an analyst’s toolbox, among others used to assess anarchitecture’s fitness for purpose (i.e., against new or changing requirements) [Clements et al., 2002].Furthermore, visual system representations are particularly well-suited during the so-called FirstContact phase of a reverse engineering project, to complement traditional techniques such ascode reading and interviews [Demeyer et al., 2008, Chapter 3]. Indeed, a visual representation— if done well — provides the ability to comprehend large amounts of data [Ware, 2000]. Aprestudy leader asked to investigate the feasibility of certain changes on a system will first haveto familiarize himself with the system, create an initial understanding of the entire system andinvestigate certain structural properties in detail. This is where well-chosen views on the softwaresystem can be a tremendous aid.
The software views in this dissertation only incorporate the visualization of structural properties,i.e., the static building blocks of the system under study. We will not take into account behavioral(run-time) or historic (version) information.
This chapter has four major components. First, we identify the polymetric views by Lanza andDucasse [2003] as a promising reverse engineering technique by explaining the basic principlesand highlighting its use within different stages of comprehending a software system. Second, wetry to apply this technique in the context of COBOL mainframe systems in Section 5.2 (p.37), andtry to study its usefulness in Section 5.3 (p.41). Thirdly, we identify a number of software viewsuseful in different stages of the comprehension process in Section 5.4 (p.49). By complementingthese views with concrete, anecdotal information, it can be used as inspiration for practitioners.Lastly, we conclude with the lessons we learned by applying software views on various mainframeenterprise applications in Section 5.5 (p.58).
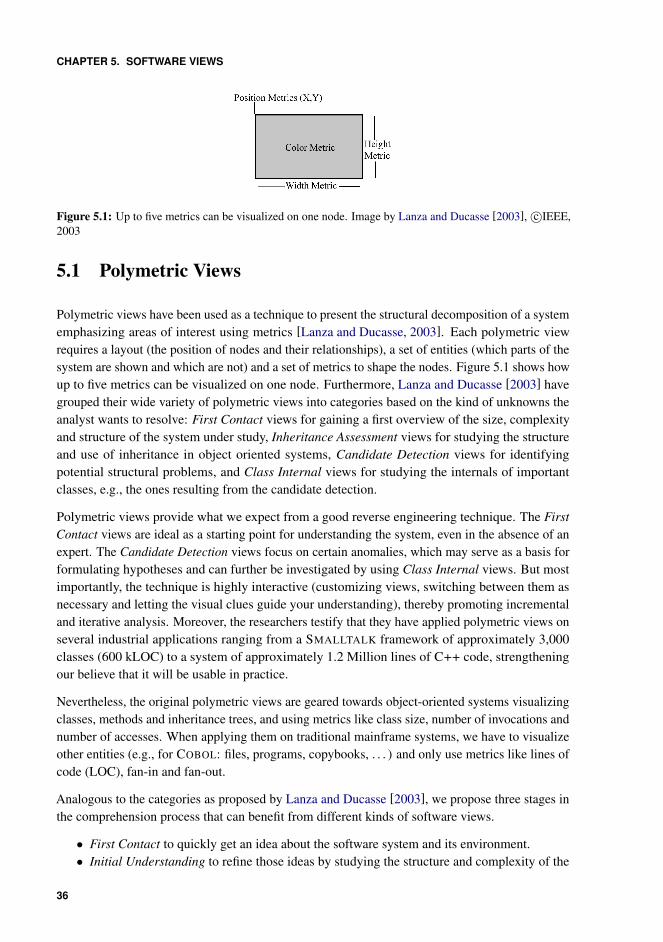
CHAPTER 5. SOFTWARE VIEWS
Figure 5.1: Up to five metrics can be visualized on one node. Image by Lanza and Ducasse [2003], c©IEEE,2003
5.1 Polymetric Views
Polymetric views have been used as a technique to present the structural decomposition of a systememphasizing areas of interest using metrics [Lanza and Ducasse, 2003]. Each polymetric viewrequires a layout (the position of nodes and their relationships), a set of entities (which parts of thesystem are shown and which are not) and a set of metrics to shape the nodes. Figure 5.1 shows howup to five metrics can be visualized on one node. Furthermore, Lanza and Ducasse [2003] havegrouped their wide variety of polymetric views into categories based on the kind of unknowns theanalyst wants to resolve: First Contact views for gaining a first overview of the size, complexityand structure of the system under study, Inheritance Assessment views for studying the structureand use of inheritance in object oriented systems, Candidate Detection views for identifyingpotential structural problems, and Class Internal views for studying the internals of importantclasses, e.g., the ones resulting from the candidate detection.
Polymetric views provide what we expect from a good reverse engineering technique. The FirstContact views are ideal as a starting point for understanding the system, even in the absence of anexpert. The Candidate Detection views focus on certain anomalies, which may serve as a basis forformulating hypotheses and can further be investigated by using Class Internal views. But mostimportantly, the technique is highly interactive (customizing views, switching between them asnecessary and letting the visual clues guide your understanding), thereby promoting incrementaland iterative analysis. Moreover, the researchers testify that they have applied polymetric views onseveral industrial applications ranging from a SMALLTALK framework of approximately 3,000classes (600 kLOC) to a system of approximately 1.2 Million lines of C++ code, strengtheningour believe that it will be usable in practice.
Nevertheless, the original polymetric views are geared towards object-oriented systems visualizingclasses, methods and inheritance trees, and using metrics like class size, number of invocations andnumber of accesses. When applying them on traditional mainframe systems, we have to visualizeother entities (e.g., for COBOL: files, programs, copybooks, . . . ) and only use metrics like lines ofcode (LOC), fan-in and fan-out.
Analogous to the categories as proposed by Lanza and Ducasse [2003], we propose three stages inthe comprehension process that can benefit from different kinds of software views.
• First Contact to quickly get an idea about the software system and its environment.• Initial Understanding to refine those ideas by studying the structure and complexity of the
36

5.2. POLYMETRIC VIEWS FOR COBOL MAINFRAME SYSTEMS
software system and simultaneously identifying exceptional entities.• Study Internals for studying the internals of important modules or functions, e.g., the
exceptional entities identified during initial understanding.
In Section 5.4 (p.49) we will describe software views for each of the three stages, but first wegive a detailed example of the initial understanding stage in Section 5.2 (p.37) and Section 5.3(p.41).
5.2 Polymetric Views for COBOL Mainframe Systems
This section is based on our experience with applying polymetric views to gain an initial under-standing of COBOL code [Van Geet and Demeyer, 2007]. This initial understanding entails aninitial overview of the structure and complexity of the system, and identifying exceptional entitiesfor further investigations. As such, we focus on high-level functional and data dependencies amongCOBOL programs.
In what follows we explain the COBOL artifacts we take into account and how we extract them,the resulting software views and how we visualize them and some pointers on how to interpretthese software views.
5.2.1 Fact Extraction
To characterize functional and data dependencies in COBOL source code, the following artifactsare of interest.
• A program is a functional block of COBOL code uniquely identified by a Program-ID.Programs are the basic building blocks of a COBOL system.
• A copybook is a reusable snippet of COBOL code, contained within one source file, thatusually consists of a data declaration to be shared by different programs.
• A CALL statement is responsible for invoking a program from within another program usingits unique Program-ID. The thread of execution is then passed on to the called programuntil the execution ends and control returns to the calling program.
• A COPY statement is responsible for copying the contents of a copybook directly into theCOBOL source. This construct enables code level reuse of data declarations.
• A missing program or copybook is a program or copybook that is referenced from withinthe system under study but not part of the system itself. They have been identified as IDsused in CALL and COPY statements which we could not map to available source files.
From these source code artifacts we extract the following dependencies.
• A functional dependency is a relationship between two programs which is implemented bya CALL statement in the first program referencing the second program. This dependencyhas a weight associated with it equalling the number of CALL statements from the first tothe second program.
37
CHAPTER 5. SOFTWARE VIEWS
• A data dependency is a relationship between a program and a copybook implemented by aCOPY statement in the program referencing the copybook. This dependency can also occurbetween two copybooks.
Recall that there are two usage modes of mainframe programs, on for online processing andone for batch processing. In online mode, programs typically interact via COBOL calls; inbatch, these programs are usually controlled via JCL scripts (where JCL stands for Job ControlLanguage). We do not take into account the JCL artifacts, thus we are missing some dependencyinformation.
Besides these dependencies, we also define two metrics on a COBOL program.
• The FAN-IN measures the number of incoming calls, i.e., the total number of CALL state-ments within the entire system referencing that program.
• The FAN-OUT measures the number of outgoing calls, i.e., the total number of CALLstatements within that program to any other program.
We study these metrics because they are an indicator for the types of usage of COBOL programs.Programs with a high FAN-IN can be seen as suppliers as they supply a functionality that is popularamong other programs. Programs with a high FAN-OUT, on the other hand, can be seen as clientsas they use a lot of functionality from other programs. The terminology of suppliers and clientshas been adopted from [Mitchell and Mancoridis, 2006].
We extract this information from the COBOL sources using Lexical Fact Extraction (pattern 8.2) only.We have created a PERL script using simple regular expressions implemented in the standard UNIX
tool GREP to extract all source code artifacts. Extraction of the COBOL artifacts and creation of thedata model for the Document Generation and Management System was completed in less than fiveseconds indicating that the approach is very lightweight and likely to scale well on even biggersystems.
5.2.2 Visualizing Dependencies
We have created the following views to represent a part of the software system as a directedgraph:
(i) a Functional Dependency View containing COBOL programs as nodes and the functionaldependencies between them as a directed edge between two nodes,
(ii) a Data Dependency View containing COBOL programs and copybooks as nodes and the datadependencies between them as a directed edge between two nodes, and
(iii) a Mixed Dependency View containing both functional and data dependencies.
We also provide internal variants to the functional and data dependencies, which filter out themissing programs and copybooks, thereby shifting the focus of the view from interaction withother systems to the internal structure of the system under study.
To obtain such visualizations, we export the structural information to GDF (Guess Data Format)after which it can be visualized in GUESS [Adar, 2006], a flexible graph exploration tool. Thisenvironment assists a user in exploring graphs by providing capabilities such as applying graph
38
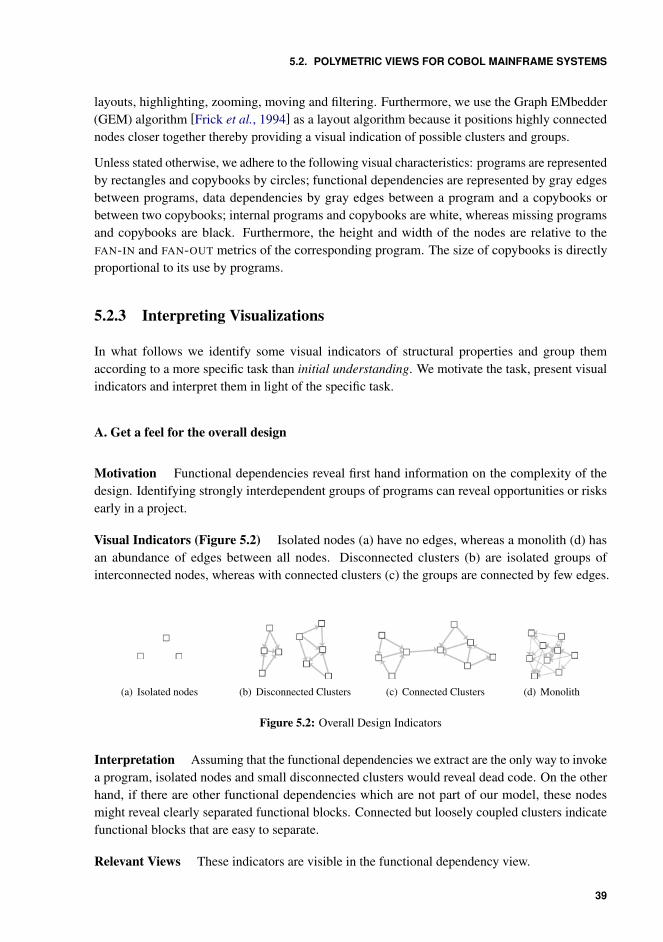
5.2. POLYMETRIC VIEWS FOR COBOL MAINFRAME SYSTEMS
layouts, highlighting, zooming, moving and filtering. Furthermore, we use the Graph EMbedder(GEM) algorithm [Frick et al., 1994] as a layout algorithm because it positions highly connectednodes closer together thereby providing a visual indication of possible clusters and groups.
Unless stated otherwise, we adhere to the following visual characteristics: programs are representedby rectangles and copybooks by circles; functional dependencies are represented by gray edgesbetween programs, data dependencies by gray edges between a program and a copybooks orbetween two copybooks; internal programs and copybooks are white, whereas missing programsand copybooks are black. Furthermore, the height and width of the nodes are relative to theFAN-IN and FAN-OUT metrics of the corresponding program. The size of copybooks is directlyproportional to its use by programs.
5.2.3 Interpreting Visualizations
In what follows we identify some visual indicators of structural properties and group themaccording to a more specific task than initial understanding. We motivate the task, present visualindicators and interpret them in light of the specific task.
A. Get a feel for the overall design
Motivation Functional dependencies reveal first hand information on the complexity of thedesign. Identifying strongly interdependent groups of programs can reveal opportunities or risksearly in a project.
Visual Indicators (Figure 5.2) Isolated nodes (a) have no edges, whereas a monolith (d) hasan abundance of edges between all nodes. Disconnected clusters (b) are isolated groups ofinterconnected nodes, whereas with connected clusters (c) the groups are connected by few edges.
(a) Isolated nodes (b) Disconnected Clusters (c) Connected Clusters (d) Monolith
Figure 5.2: Overall Design Indicators
Interpretation Assuming that the functional dependencies we extract are the only way to invokea program, isolated nodes and small disconnected clusters would reveal dead code. On the otherhand, if there are other functional dependencies which are not part of our model, these nodesmight reveal clearly separated functional blocks. Connected but loosely coupled clusters indicatefunctional blocks that are easy to separate.
Relevant Views These indicators are visible in the functional dependency view.
39
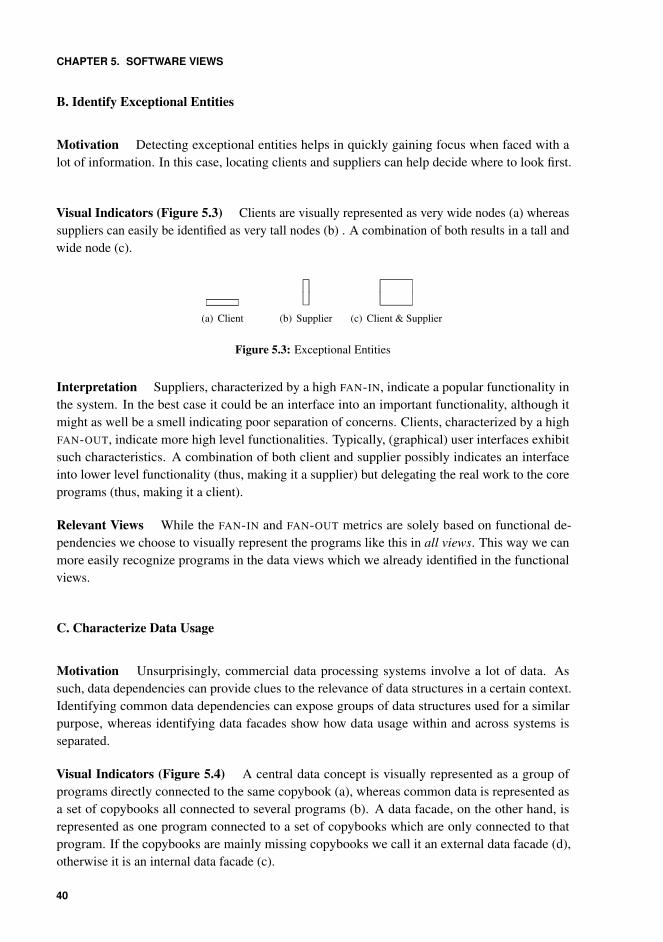
CHAPTER 5. SOFTWARE VIEWS
B. Identify Exceptional Entities
Motivation Detecting exceptional entities helps in quickly gaining focus when faced with alot of information. In this case, locating clients and suppliers can help decide where to look first.
Visual Indicators (Figure 5.3) Clients are visually represented as very wide nodes (a) whereassuppliers can easily be identified as very tall nodes (b) . A combination of both results in a tall andwide node (c).
(a) Client (b) Supplier (c) Client & Supplier
Figure 5.3: Exceptional Entities
Interpretation Suppliers, characterized by a high FAN-IN, indicate a popular functionality inthe system. In the best case it could be an interface into an important functionality, although itmight as well be a smell indicating poor separation of concerns. Clients, characterized by a highFAN-OUT, indicate more high level functionalities. Typically, (graphical) user interfaces exhibitsuch characteristics. A combination of both client and supplier possibly indicates an interfaceinto lower level functionality (thus, making it a supplier) but delegating the real work to the coreprograms (thus, making it a client).
Relevant Views While the FAN-IN and FAN-OUT metrics are solely based on functional de-pendencies we choose to visually represent the programs like this in all views. This way we canmore easily recognize programs in the data views which we already identified in the functionalviews.
C. Characterize Data Usage
Motivation Unsurprisingly, commercial data processing systems involve a lot of data. Assuch, data dependencies can provide clues to the relevance of data structures in a certain context.Identifying common data dependencies can expose groups of data structures used for a similarpurpose, whereas identifying data facades show how data usage within and across systems isseparated.
Visual Indicators (Figure 5.4) A central data concept is visually represented as a group ofprograms directly connected to the same copybook (a), whereas common data is represented asa set of copybooks all connected to several programs (b). A data facade, on the other hand, isrepresented as one program connected to a set of copybooks which are only connected to thatprogram. If the copybooks are mainly missing copybooks we call it an external data facade (d),otherwise it is an internal data facade (c).
40
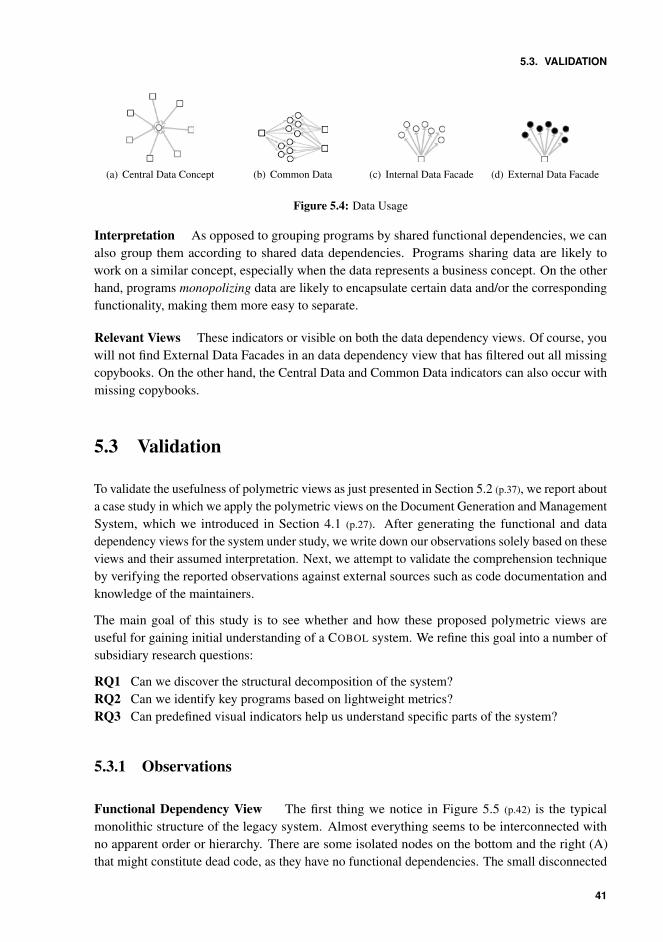
5.3. VALIDATION
(a) Central Data Concept (b) Common Data (c) Internal Data Facade (d) External Data Facade
Figure 5.4: Data Usage
Interpretation As opposed to grouping programs by shared functional dependencies, we canalso group them according to shared data dependencies. Programs sharing data are likely towork on a similar concept, especially when the data represents a business concept. On the otherhand, programs monopolizing data are likely to encapsulate certain data and/or the correspondingfunctionality, making them more easy to separate.
Relevant Views These indicators or visible on both the data dependency views. Of course, youwill not find External Data Facades in an data dependency view that has filtered out all missingcopybooks. On the other hand, the Central Data and Common Data indicators can also occur withmissing copybooks.
5.3 Validation
To validate the usefulness of polymetric views as just presented in Section 5.2 (p.37), we report abouta case study in which we apply the polymetric views on the Document Generation and ManagementSystem, which we introduced in Section 4.1 (p.27). After generating the functional and datadependency views for the system under study, we write down our observations solely based on theseviews and their assumed interpretation. Next, we attempt to validate the comprehension techniqueby verifying the reported observations against external sources such as code documentation andknowledge of the maintainers.
The main goal of this study is to see whether and how these proposed polymetric views areuseful for gaining initial understanding of a COBOL system. We refine this goal into a number ofsubsidiary research questions:
RQ1 Can we discover the structural decomposition of the system?RQ2 Can we identify key programs based on lightweight metrics?RQ3 Can predefined visual indicators help us understand specific parts of the system?
5.3.1 Observations
Functional Dependency View The first thing we notice in Figure 5.5 (p.42) is the typicalmonolithic structure of the legacy system. Almost everything seems to be interconnected withno apparent order or hierarchy. There are some isolated nodes on the bottom and the right (A)that might constitute dead code, as they have no functional dependencies. The small disconnected
41
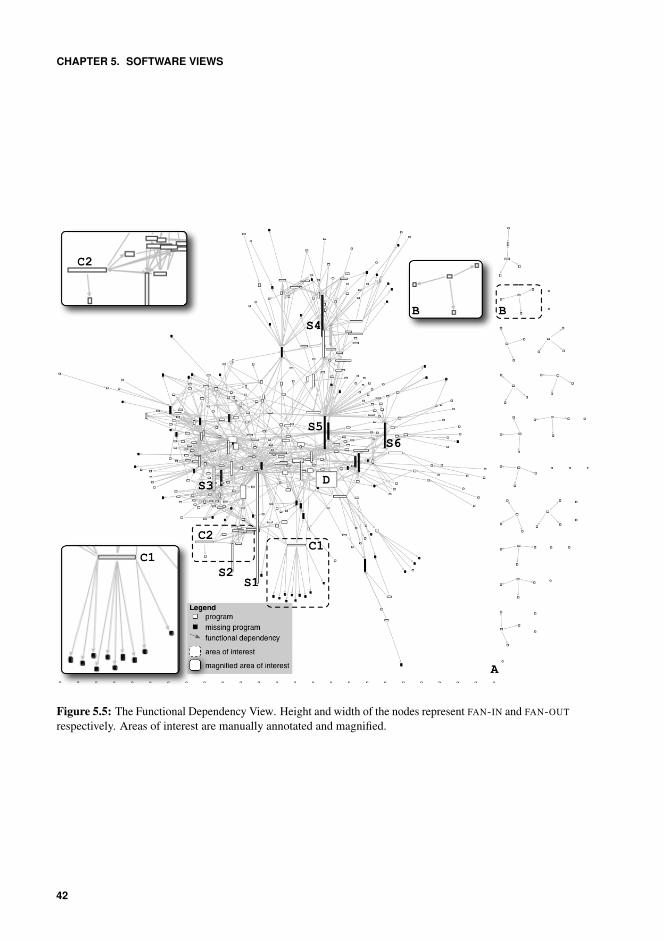
CHAPTER 5. SOFTWARE VIEWS
Figure 5.5: The Functional Dependency View. Height and width of the nodes represent FAN-IN and FAN-OUT
respectively. Areas of interest are manually annotated and magnified.
42
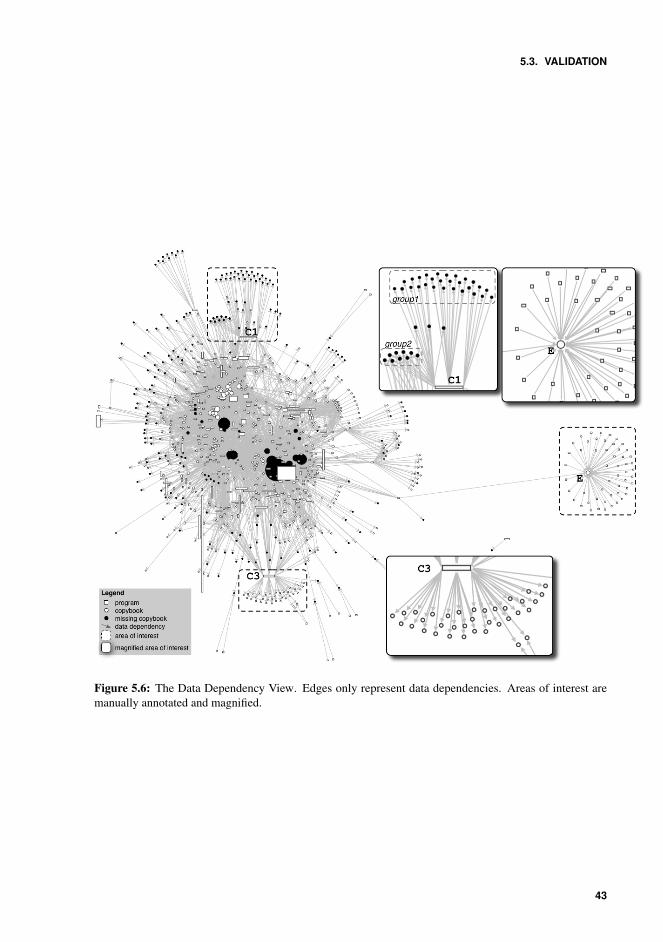
5.3. VALIDATION
Figure 5.6: The Data Dependency View. Edges only represent data dependencies. Areas of interest aremanually annotated and magnified.
43
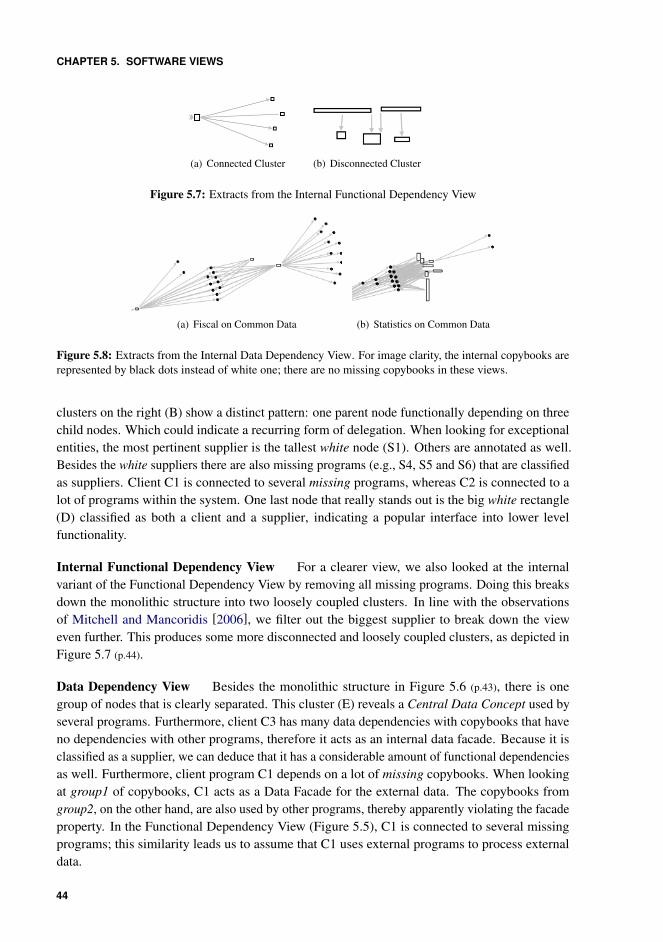
CHAPTER 5. SOFTWARE VIEWS
(a) Connected Cluster (b) Disconnected Cluster
Figure 5.7: Extracts from the Internal Functional Dependency View
(a) Fiscal on Common Data (b) Statistics on Common Data
Figure 5.8: Extracts from the Internal Data Dependency View. For image clarity, the internal copybooks arerepresented by black dots instead of white one; there are no missing copybooks in these views.
clusters on the right (B) show a distinct pattern: one parent node functionally depending on threechild nodes. Which could indicate a recurring form of delegation. When looking for exceptionalentities, the most pertinent supplier is the tallest white node (S1). Others are annotated as well.Besides the white suppliers there are also missing programs (e.g., S4, S5 and S6) that are classifiedas suppliers. Client C1 is connected to several missing programs, whereas C2 is connected to alot of programs within the system. One last node that really stands out is the big white rectangle(D) classified as both a client and a supplier, indicating a popular interface into lower levelfunctionality.
Internal Functional Dependency View For a clearer view, we also looked at the internalvariant of the Functional Dependency View by removing all missing programs. Doing this breaksdown the monolithic structure into two loosely coupled clusters. In line with the observationsof Mitchell and Mancoridis [2006], we filter out the biggest supplier to break down the vieweven further. This produces some more disconnected and loosely coupled clusters, as depicted inFigure 5.7 (p.44).
Data Dependency View Besides the monolithic structure in Figure 5.6 (p.43), there is onegroup of nodes that is clearly separated. This cluster (E) reveals a Central Data Concept used byseveral programs. Furthermore, client C3 has many data dependencies with copybooks that haveno dependencies with other programs, therefore it acts as an internal data facade. Because it isclassified as a supplier, we can deduce that it has a considerable amount of functional dependenciesas well. Furthermore, client program C1 depends on a lot of missing copybooks. When lookingat group1 of copybooks, C1 acts as a Data Facade for the external data. The copybooks fromgroup2, on the other hand, are also used by other programs, thereby apparently violating the facadeproperty. In the Functional Dependency View (Figure 5.5), C1 is connected to several missingprograms; this similarity leads us to assume that C1 uses external programs to process externaldata.
44
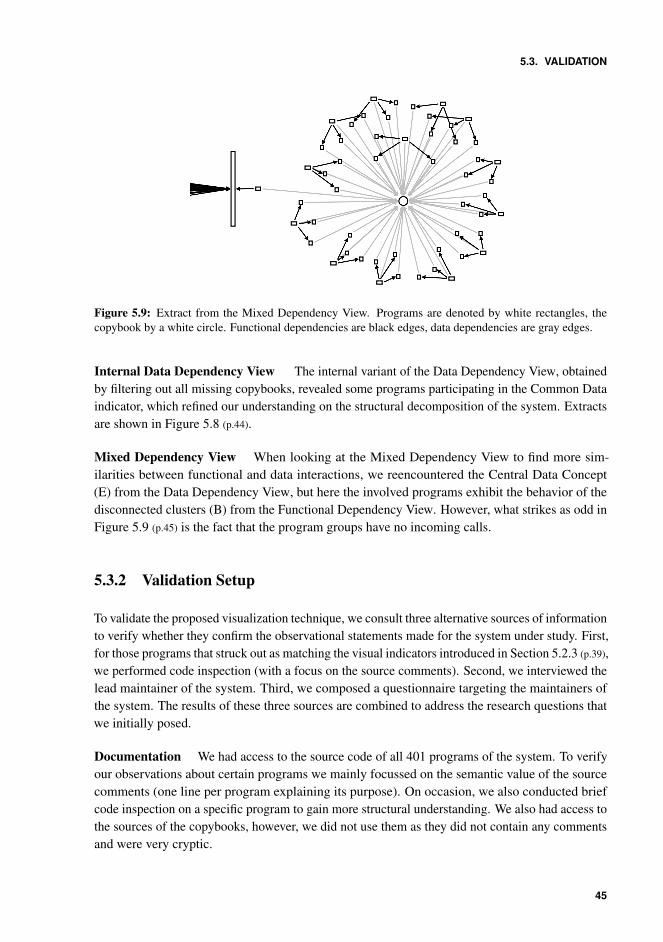
5.3. VALIDATION
Figure 5.9: Extract from the Mixed Dependency View. Programs are denoted by white rectangles, thecopybook by a white circle. Functional dependencies are black edges, data dependencies are gray edges.
Internal Data Dependency View The internal variant of the Data Dependency View, obtainedby filtering out all missing copybooks, revealed some programs participating in the Common Dataindicator, which refined our understanding on the structural decomposition of the system. Extractsare shown in Figure 5.8 (p.44).
Mixed Dependency View When looking at the Mixed Dependency View to find more sim-ilarities between functional and data interactions, we reencountered the Central Data Concept(E) from the Data Dependency View, but here the involved programs exhibit the behavior of thedisconnected clusters (B) from the Functional Dependency View. However, what strikes as odd inFigure 5.9 (p.45) is the fact that the program groups have no incoming calls.
5.3.2 Validation Setup
To validate the proposed visualization technique, we consult three alternative sources of informationto verify whether they confirm the observational statements made for the system under study. First,for those programs that struck out as matching the visual indicators introduced in Section 5.2.3 (p.39),we performed code inspection (with a focus on the source comments). Second, we interviewed thelead maintainer of the system. Third, we composed a questionnaire targeting the maintainers ofthe system. The results of these three sources are combined to address the research questions thatwe initially posed.
Documentation We had access to the source code of all 401 programs of the system. To verifyour observations about certain programs we mainly focussed on the semantic value of the sourcecomments (one line per program explaining its purpose). On occasion, we also conducted briefcode inspection on a specific program to gain more structural understanding. We also had access tothe sources of the copybooks, however, we did not use them as they did not contain any commentsand were very cryptic.
45
CHAPTER 5. SOFTWARE VIEWS
Interview We confronted the lead maintainer with our observations after we verified themusing the documentation. We posed questions such as ‘Are these programs part of the samesubsystem?’ and ‘This looks like an Internal Data Facade but the documentation does not supportthat observation, which is it?’.
Questionnaire The questionnaire consisted of two major parts. In the first part the maintainerswere asked to give their top-10 of key programs in the system. We described ‘key programs’ asthe programs they would explain first to a novice when asked to comprehend the system, e.g., (i)programs fulfilling a crucial functionality, (ii) programs they have to modify often or (iii) programsthey use as entry point when starting a maintenance action. In the second part we confronted themwith five groups of programs which we selected from the internal views (Figures 5.7, 5.8 and 5.9).For each group, they were asked to state whether or not those programs were related, i.e., whetherthey interact to fulfil a particular function within the system or whether they are part of the samesubsystem. If so, we asked them to briefly clarify the particular function or subsystem. Besides thecontent questions, we also asked them to quantify their experience with the system (#years) andwhich parts of the system they are more familiar with than others. The questionnaire was offeredto, and filled in by, all four maintainers of the system.
5.3.3 Data Results
From the documentation we gathered that the programs participating in the Central Data Concept inFigure 5.9 (p.45) and the Common Data indicators in Figure 5.8 (p.44) also match in the comments,with recurring terms in all programs like ‘DLM’, ‘fiscal’ and ‘statistics’. However, the programs inthe clusters from the Internal Functional Dependency View in Figure 5.7 (p.44) did not contain anysimilarities in comments.
Investigating the comments of exceptional entities revealed two big suppliers (S1, S3) as readinterfaces for databases, whereas S2 is responsible for generating anomaly reports for checks on aspecific database. Client C1 is responsible for retrieving data from external databases, C2 checksthe consistency of documents, C3 is responsible for preparing documents for printing/sending.The comments of program D, indicated as both client and supplier, revealed it as the interface intothe entire system under study. This would explain its classification as client since it invokes allfunctionality within the system, but not as supplier.
Code inspection of the programs from the delegation clusters (B) revealed a switch statement in allthe top programs checking the value of a flag in a data record and delegating responsibility to oneof his three child programs. Furthermore, the comments of the child programs show a recurringpattern of the terms ‘insert, delete and modify’.
The interview learned us that each child node in the delegation clusters (B) is responsible for eitherinserting, deleting or modifying data in a specific table of the documents database. And that arow in such a table is uniquely identified by the data in the Central Data Concept (E). This backsup former evidence about the DLM subsystem. Furthermore, the interview revealed that the topprograms in clusters B are called dynamically (via the supplier program in Figure 5.9 (p.45)) basedon information stored in a database, which explains why they have no incoming calls in our views,
46
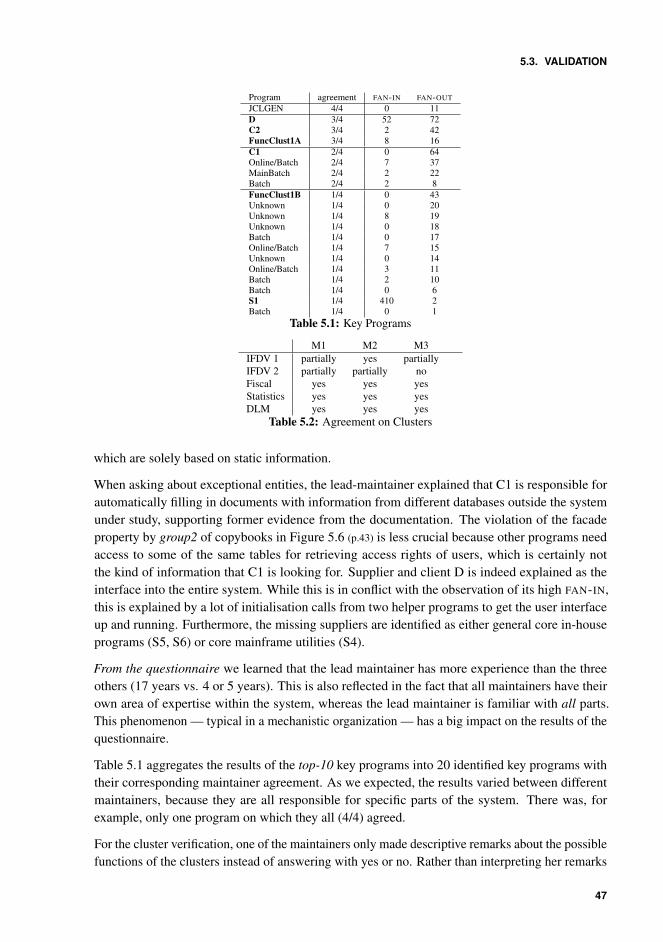
5.3. VALIDATION
Program agreement FAN-IN FAN-OUTJCLGEN 4/4 0 11D 3/4 52 72C2 3/4 2 42FuncClust1A 3/4 8 16C1 2/4 0 64Online/Batch 2/4 7 37MainBatch 2/4 2 22Batch 2/4 2 8FuncClust1B 1/4 0 43Unknown 1/4 0 20Unknown 1/4 8 19Unknown 1/4 0 18Batch 1/4 0 17Online/Batch 1/4 7 15Unknown 1/4 0 14Online/Batch 1/4 3 11Batch 1/4 2 10Batch 1/4 0 6S1 1/4 410 2Batch 1/4 0 1
Table 5.1: Key Programs
M1 M2 M3IFDV 1 partially yes partiallyIFDV 2 partially partially noFiscal yes yes yesStatistics yes yes yesDLM yes yes yes
Table 5.2: Agreement on Clusters
which are solely based on static information.
When asking about exceptional entities, the lead-maintainer explained that C1 is responsible forautomatically filling in documents with information from different databases outside the systemunder study, supporting former evidence from the documentation. The violation of the facadeproperty by group2 of copybooks in Figure 5.6 (p.43) is less crucial because other programs needaccess to some of the same tables for retrieving access rights of users, which is certainly notthe kind of information that C1 is looking for. Supplier and client D is indeed explained as theinterface into the entire system. While this is in conflict with the observation of its high FAN-IN,this is explained by a lot of initialisation calls from two helper programs to get the user interfaceup and running. Furthermore, the missing suppliers are identified as either general core in-houseprograms (S5, S6) or core mainframe utilities (S4).
From the questionnaire we learned that the lead maintainer has more experience than the threeothers (17 years vs. 4 or 5 years). This is also reflected in the fact that all maintainers have theirown area of expertise within the system, whereas the lead maintainer is familiar with all parts.This phenomenon — typical in a mechanistic organization — has a big impact on the results of thequestionnaire.
Table 5.1 aggregates the results of the top-10 key programs into 20 identified key programs withtheir corresponding maintainer agreement. As we expected, the results varied between differentmaintainers, because they are all responsible for specific parts of the system. There was, forexample, only one program on which they all (4/4) agreed.
For the cluster verification, one of the maintainers only made descriptive remarks about the possiblefunctions of the clusters instead of answering with yes or no. Rather than interpreting her remarks
47
CHAPTER 5. SOFTWARE VIEWS
we decided to discard her results. Table 5.2 depicts the maintainer agreement on the five clustersand shows three groups that were unanimously verified as clusters. Two of those three clusters wereclarified as separate subsystems that are only organisationally under the control of the maintenanceteam, whereas the third one was identified as one of the functionalities of the Document Generationand Management System itself. The two first groups, on the other hand, were not verified asclusters. The typical responses were (i) breaking up the group in smaller functional clusters and(ii) indicating programs that were not related.
5.3.4 Interpretation
RQ1 Can we discover the structural decomposition of the system? While both the documentationand the questionnaire agreed on the three clusters that resulted from the Data Views, indicatingthat our technique helps in discovering structural decomposition, they also disagreed on the twoclusters revealed from the Functional Views. This can be explained by the batch nature of thesystem in which each program already has a clearly defined purpose. After that, they are composedin a chain of actions by JCL scripts that are not part of our data model. Furthermore, this systemalso uses a dynamic calling mechanism for increased flexibility. This limits the usefulness of thefunctional dependencies for the case study presented here.
In summary, our technique helped to discover structural decomposition with the added remark that,based on this case study, the Data Dependency Views look more promising than the FunctionalDependency Views. Dependencies from the JCL scripts should be added to make the latter viewsmore useful.
RQ2 Can we identify key concepts based on lightweight metrics? Looking at the metric valuesin table 5.1 we see a lot of variation for the FAN-IN, the maximum value (410) is present butalso several programs with a FAN-IN of 0, indicating that the FAN-IN is a bad indicator for keyprograms. The FAN-OUT, on the other hand, is less variable and has higher values for the keyprograms with higher maintainer agreement, indicating that the FAN-OUT is a better indicator thanthe FAN-IN.
We used these results also for quantifying the precision and recall of our technique. As baselinewe used the key programs on which more than one maintainer agreed (the top 8 from table 5.1).For both FAN-IN and FAN-OUT we generated a list of programs sorted according to their metricvalue. Since we do not want to introduce a fixed threshold on the FAN-IN and FAN-OUT valuesfor determining whether a program is key, we repeatedly calculated the precision and recall ofa growing set of retrieved programs to find the optimal threshold. However, the best result wereceived was a precision of 25% and a recall of 50% when retrieving the top 16 clients, for thesuppliers the precision did not even reach 10%.
As such, the raw metrics are not a clear indicator for detecting key programs. We attribute this tothe fact that the information provided by the metrics is too limited and too low level, revealingtechnical bottlenecks only. Other metrics should be taken into account as well. Still we argue thatthe combination of these metrics with the proposed views are useful. Many of the exceptionalentities we identified in the views — not only by their metric value, but also by their interaction with
48
5.4. USING SOFTWARE VIEWS
other programs — are also identified as key programs by the maintainers (cfr. boldfaced programsin table 5.1). And if not for identifying key programs than for identifying structural bottlenecks inthe visualizations that can be filtered out to result in a more comprehensive view.
RQ3 Can predefined visual indicators help us understand specific parts of the system. As withRQ1 it is clear that the Data Usage visual indicators helped us understand the correspondingsubsystems. While the Overall Design indicators were better suited for interpreting the generalcharacteristics of the system, some indicators have been very useful in gaining better technicalunderstanding of specific parts, for example, the interplay between the delegation clusters (B)in the DLM subsystem. Similarly, the Exceptional Entities were better suited for very technicalunderstanding, especially in combination with the other visual indicators.
Of course, these visual indicators are of limited usefulness in isolation, interaction with domainexperts is necessary to assign the correct interpretation to the indicators. In particular, the levelof interaction between artifacts is near impossible to extract from such abstract visualizationsalone. As such, we can conclude that, for this case study, the predefined visual indicators were— although not sufficient on their own — helpful in understanding parts of the system. This isof course in line with the iterative and incremental nature of reverse engineering in general andcomprehension in particular.
5.4 Using Software Views
Where the previous sections report in detail on the application and usefulness of polymetric viewsfor initial understanding adjusted to our context of mainframe COBOL systems, this section reportsbriefly on applying several software views in various stages of the comprehension process.
The goal of this section is to illustrate the iterative nature of system comprehension, how softwareviews support this iterative nature and how different views are relevant in different stages ofcomprehension. Furthermore, the different experiences described in this section can be used asinspiration by practitioners willing to use software views in practice.
For each experience we do the following.
(i) We state the stage of the comprehension process we are in (first contact, initial understanding,studying internals) and with it the intent of the activity based on the problem at hand.
(ii) We list the facts we extracted and how we extracted them.(iii) We explain the composition of the views and the tools and techniques we used to construct
them.(iv) We argue that it is a good view or technique by showing some anecdotal evidence based on
the Document Generation and Management System.
49
CHAPTER 5. SOFTWARE VIEWS
5.4.1 Treemapping as First Contact
When an outsider is asked to look at a software system, she typically receives a CD/DVD containingsource code, documentation and other related artifacts with little or no explanation. Her first contactwith the system should be brief, yet revealing enough to determine whether something can bedone with it and how to proceed. To assist during this first contact, Demeyer et al. [2008] listsome interesting patterns, such as chatting with the maintainers (pattern A.1) and reading all thecode in one hour (pattern A.2). Of course, reading all the code is impossible; the idea is to get a firstimpression on the quality of the code [Demeyer et al., 2008, chapter 3].
To keep the code reading somewhat coherent and to pinpoint some locations to start reading, avisual perspective on the received code is very helpful. Treemapping can provide such a visualperspective. It is a method for displaying tree-structured data by using nested rectangles.1 Ofcourse, a folder structure on CD is stereotypical example of tree-structured data.
A lot of treemapping software exists2 taking various kinds of inputs ranging from spreadsheetsover databases to xml files. We used the tool TREEMAP3 as it is able to take a folder structure asinput. Furthermore, it provides metadata about the file type, size and age which can be used tointeractively filter and layout the treemap. Hence, it can be used to create a very specific kind ofpolymetric views.
Figure 5.10 (p.51) shows an example treemap that represents the source code — as we receivedit — from the Document Generation and Management System. There are several folders (thebiggest ones being SRC, JCL and CPY) each containing several files all represented as rectangles.Furthermore, the size of the rectangles is proportionate to the file size and the color is mapped tothe file type (based on the extension of the files). The rectangles are spatially sorted according tofile size (top left to bottom right) while still adhering to their containment relationship.
Note that files on mainframe do not have file extensions. Rather, they are categorized in data setsaccording to their file type. The extensions were added to indicate this type when downloadingthe files from mainframe. As a consequence, the resulting folder structure reveals no architecturalinformation, something that is common in languages like JAVA and C++ where the folders mirrorthe package structure. Nonetheless, this visual perspective can guide a first contact.
For example, the smaller folders mostly contain one file type, i.e., the JCL folder contains JCL-files,the CPY folder contains COBOL copybooks, the PROC folder contains PROC-files, etc. The SRCfolder, on the other hand, contains several types of files: COBOL files (.CBL), COBOL files withembedded SQL (.SQB), ASSEMBLER files (.ASS). Furthermore, there are some other files whichare responsible for database, batch and transaction configuration.
In the JCL folder, there are two overly large JCL files. Chatting with the maintainers (pattern A.1)
about this phenomenon triggered an interesting discussion about the difference between online andbatch processing of documents and how this is implemented. Most processing is done in batch,which is executed once or twice a day. Each paper format has a separate JCL script because they
1http://en.wikipedia.org/wiki/Treemapping2A non exhaustive list of treemapping software can be found on wikipedia: http://en.wikipedia.org/wiki/
List_of_Treemapping_Software3http://www.cs.umd.edu/hcil/treemap/
50
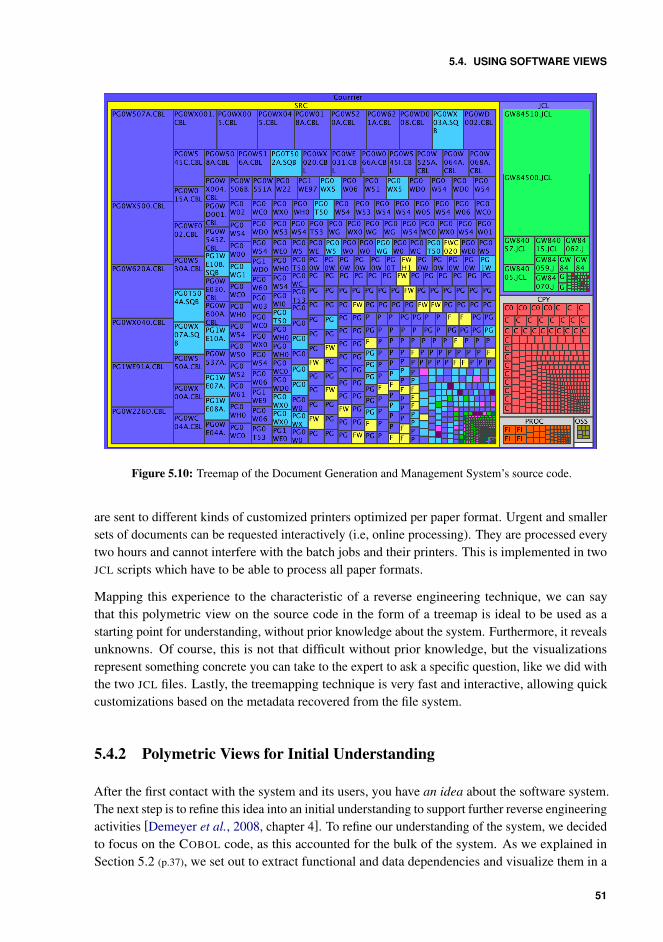
5.4. USING SOFTWARE VIEWS
Figure 5.10: Treemap of the Document Generation and Management System’s source code.
are sent to different kinds of customized printers optimized per paper format. Urgent and smallersets of documents can be requested interactively (i.e, online processing). They are processed everytwo hours and cannot interfere with the batch jobs and their printers. This is implemented in twoJCL scripts which have to be able to process all paper formats.
Mapping this experience to the characteristic of a reverse engineering technique, we can saythat this polymetric view on the source code in the form of a treemap is ideal to be used as astarting point for understanding, without prior knowledge about the system. Furthermore, it revealsunknowns. Of course, this is not that difficult without prior knowledge, but the visualizationsrepresent something concrete you can take to the expert to ask a specific question, like we did withthe two JCL files. Lastly, the treemapping technique is very fast and interactive, allowing quickcustomizations based on the metadata recovered from the file system.
5.4.2 Polymetric Views for Initial Understanding
After the first contact with the system and its users, you have an idea about the software system.The next step is to refine this idea into an initial understanding to support further reverse engineeringactivities [Demeyer et al., 2008, chapter 4]. To refine our understanding of the system, we decidedto focus on the COBOL code, as this accounted for the bulk of the system. As we explained inSection 5.2 (p.37), we set out to extract functional and data dependencies and visualize them in a
51
CHAPTER 5. SOFTWARE VIEWS
meaningful way.
We used Lexical Fact Extraction (pattern 8.2) to extract programs, copybooks, CALL relations andCOPY relations from the COBOL sources, which was a very lightweight approach robust againstvarious dialects and likely to scale well on even bigger systems. Using these facts, we createdseveral views highlighting functional and data dependencies within the system and in interactionwith other systems.
For anecdotal evidence we refer to Section 5.3 (p.41). But again, we experienced the power ofinteractivity: switching between different views, filtering out some unnecessary parts and chattingwith the maintainers for feedback about newly revealed unknowns.
5.4.3 Resolving Issues During View Creation
Before obtaining these polymetric views for initial understanding, we had to overcome severalissues with our data input. One of these issues was a problem with the mapping between COBOL
Program-IDs and COBOL files. We noticed this issue after an interview during demo (pattern A.3).Several COBOL programs that had been mentioned by our interviewee were missing from ourviews. Furthermore, some programs did appear in our views, but we could not find any referenceto them in the source listing.
To identify the problem, we decided to use the same infrastructure to visualize the relationshipbetween the COBOL source files we received and the COBOL Program-IDs they contain. Theblue dots in Figure 5.11 (p.53) represent the source files whereas the orange bars represent theProgram-IDs; the edges represent containment. On the bottom left, there is one source file thatcontains many Program-IDs. This construction adheres to the COBOL standard as one compilationunit can contain several programs. On the bottom right, on the other hand, there are several sourcefiles containing the same Program-ID. This should not be possible because it means that differentprograms are using the same name. Higher in the figure, there are even some examples of sourcefiles sharing several Program-IDs. Clearly something is wrong here.
When confronting the maintainers with these findings, a story emerged about the Great Migration.As a result of a merger and acquisition several years ago, the system had been migrated to adifferent technical platform. This new platform did not use the COBOL Program-ID as identifierfor its programs, instead it used the name as provided to the change management environmentwithout checking consistency with the COBOL Program-ID statements. Of course, developersdid not bother to change the Program-ID anymore when they copied an existing program to starta new one, resulting in several programs with — apparently — the same name. On the otherhand, the COBOL construct of having source files with several Program-IDs wasn’t even in usebefore the migration. That is, either these particular parts of the code were not used anymore, orsome obscure assembler code was used to jump to a specific position in the file, without usingthe Program-ID as a language construct. The conclusion of this exercise was that we should usethe names of the source files (as provided by the change management environment) to identify aCOBOL program instead of the Program-ID as defined in the COBOL standard.
This experience illustrates the benefit of having a visualization environment to rapidly create a
52
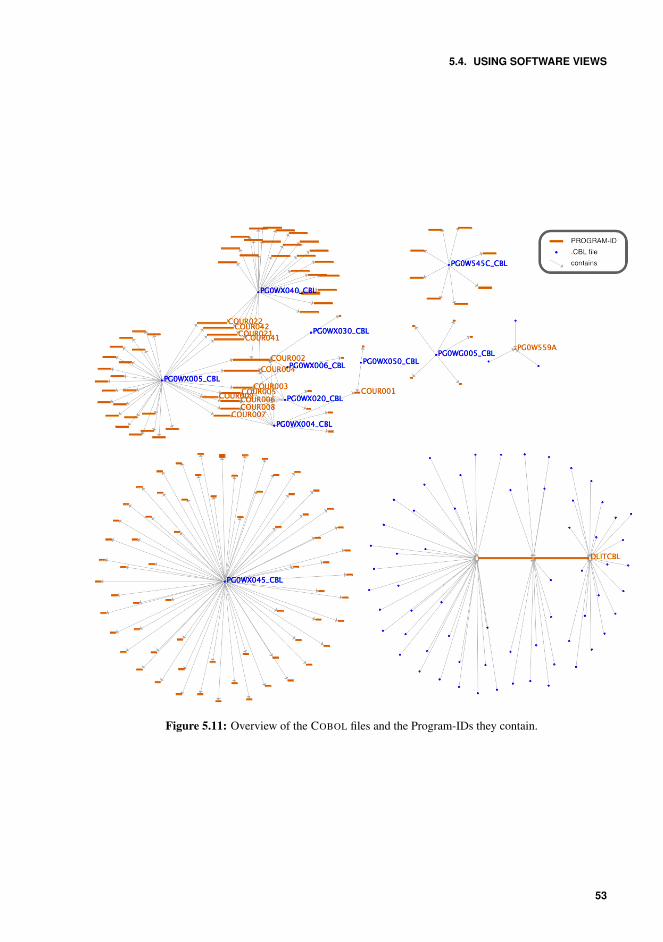
5.4. USING SOFTWARE VIEWS
Figure 5.11: Overview of the COBOL files and the Program-IDs they contain.
53
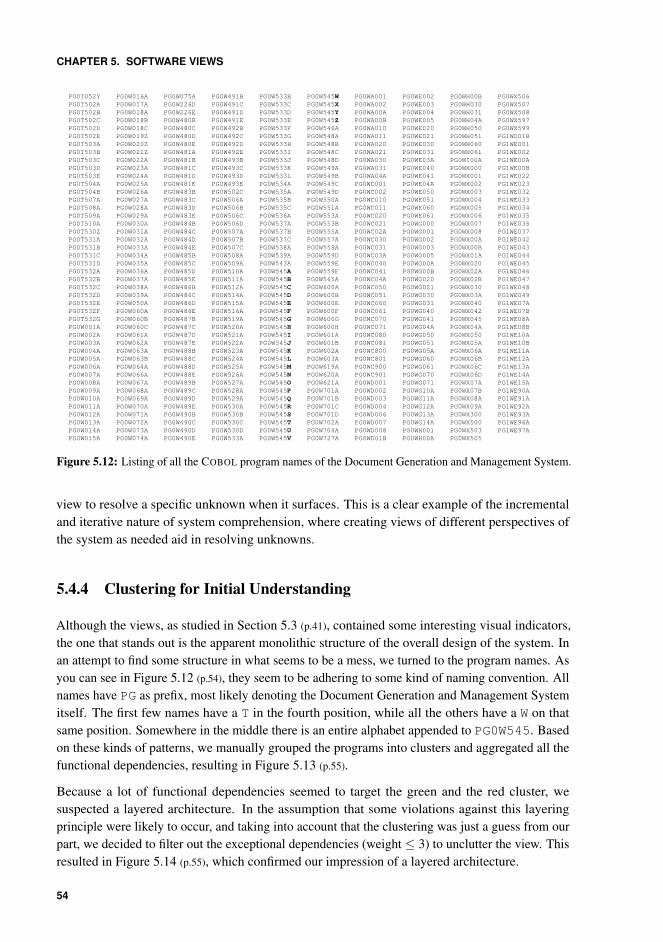
CHAPTER 5. SOFTWARE VIEWS
PG0T052Y PG0W016A PG0W075A PG0W491B PG0W533B PG0W545W PG0WA001 PG0WE002 PG0WH00B PG0WX506PG0T502A PG0W017A PG0W226D PG0W491C PG0W533C PG0W545X PG0WA002 PG0WE003 PG0WH030 PG0WX507PG0T502B PG0W018A PG0W226E PG0W491D PG0W533D PG0W545Y PG0WA00A PG0WE004 PG0WH031 PG0WX508PG0T502C PG0W018B PG0W480B PG0W491E PG0W533E PG0W545Z PG0WA00B PG0WE005 PG0WH04A PG0WX597PG0T502D PG0W018C PG0W480C PG0W492B PG0W533F PG0W546A PG0WA010 PG0WE020 PG0WH050 PG0WX599PG0T502E PG0W019Z PG0W480D PG0W492C PG0W533G PG0W548A PG0WA011 PG0WE021 PG0WH051 PG1WD01BPG0T503A PG0W020Z PG0W480E PG0W492D PG0W533H PG0W548B PG0WA020 PG0WE030 PG0WH060 PG1WE001PG0T503B PG0W021Z PG0W481A PG0W492E PG0W533I PG0W548C PG0WA021 PG0WE031 PG0WH061 PG1WE002PG0T503C PG0W022A PG0W481B PG0W493B PG0W533J PG0W548D PG0WA030 PG0WE03A PG0WI00A PG1WE00APG0T503D PG0W023A PG0W481C PG0W493C PG0W533K PG0W549A PG0WA031 PG0WE040 PG0WX000 PG1WE00BPG0T503E PG0W024A PG0W481D PG0W493D PG0W533L PG0W549B PG0WA04A PG0WE041 PG0WX001 PG1WE022PG0T504A PG0W025A PG0W481E PG0W493E PG0W534A PG0W549C PG0WC001 PG0WE04A PG0WX002 PG1WE023PG0T504B PG0W026A PG0W483B PG0W502C PG0W535A PG0W549D PG0WC002 PG0WE050 PG0WX003 PG1WE032PG0T507A PG0W027A PG0W483C PG0W506A PG0W535B PG0W550A PG0WC010 PG0WE051 PG0WX004 PG1WE033PG0T508A PG0W028A PG0W483D PG0W506B PG0W535C PG0W551A PG0WC011 PG0WE060 PG0WX005 PG1WE034PG0T509A PG0W029A PG0W483E PG0W506C PG0W536A PG0W553A PG0WC020 PG0WE061 PG0WX006 PG1WE035PG0T510A PG0W030A PG0W484B PG0W506D PG0W537A PG0W553B PG0WC021 PG0WG000 PG0WX007 PG1WE036PG0T530Z PG0W031A PG0W484C PG0W507A PG0W537B PG0W555A PG0WC02A PG0WG001 PG0WX008 PG1WE037PG0T531A PG0W032A PG0W484D PG0W507B PG0W537C PG0W557A PG0WC030 PG0WG002 PG0WX00A PG1WE042PG0T531B PG0W033A PG0W484E PG0W507C PG0W538A PG0W559A PG0WC031 PG0WG003 PG0WX00B PG1WE043PG0T531C PG0W034A PG0W485B PG0W508A PG0W539A PG0W559D PG0WC03A PG0WG005 PG0WX01A PG1WE044PG0T531D PG0W035A PG0W485C PG0W509A PG0W543A PG0W559E PG0WC040 PG0WG00A PG0WX020 PG1WE045PG0T532A PG0W036A PG0W485D PG0W510A PG0W545A PG0W559F PG0WC041 PG0WG00B PG0WX02A PG1WE046PG0T532B PG0W037A PG0W485E PG0W511A PG0W545B PG0W565A PG0WC04A PG0WG020 PG0WX02B PG1WE047PG0T532C PG0W038A PG0W486B PG0W512A PG0W545C PG0W600A PG0WC050 PG0WG021 PG0WX030 PG1WE048PG0T532D PG0W039A PG0W486C PG0W514A PG0W545D PG0W600B PG0WC051 PG0WG030 PG0WX03A PG1WE049PG0T532E PG0W050A PG0W486D PG0W515A PG0W545E PG0W600E PG0WC060 PG0WG031 PG0WX040 PG1WE07APG0T532F PG0W060A PG0W486E PG0W516A PG0W545F PG0W600F PG0WC061 PG0WG040 PG0WX042 PG1WE07BPG0T532G PG0W060B PG0W487B PG0W519A PG0W545G PG0W600G PG0WC070 PG0WG041 PG0WX045 PG1WE08APG0W001A PG0W060C PG0W487C PG0W520A PG0W545H PG0W600H PG0WC071 PG0WG04A PG0WX04A PG1WE08BPG0W002A PG0W061A PG0W487D PG0W521A PG0W545I PG0W601A PG0WC080 PG0WG050 PG0WX050 PG1WE10APG0W003A PG0W062A PG0W487E PG0W522A PG0W545J PG0W601B PG0WC081 PG0WG051 PG0WX05A PG1WE10BPG0W004A PG0W063A PG0W488B PG0W523A PG0W545K PG0W602A PG0WC800 PG0WG05A PG0WX06A PG1WE11APG0W005A PG0W063B PG0W488C PG0W524A PG0W545L PG0W603A PG0WC801 PG0WG060 PG0WX06B PG1WE12APG0W006A PG0W064A PG0W488D PG0W525A PG0W545M PG0W619A PG0WC900 PG0WG061 PG0WX06C PG1WE13APG0W007A PG0W066A PG0W488E PG0W526A PG0W545N PG0W620A PG0WC901 PG0WG070 PG0WX06D PG1WE14APG0W008A PG0W067A PG0W489B PG0W527A PG0W545O PG0W621A PG0WD001 PG0WG071 PG0WX07A PG1WE15APG0W009A PG0W068A PG0W489C PG0W528A PG0W545P PG0W701A PG0WD002 PG0WG10A PG0WX07B PG1WE90APG0W010A PG0W069A PG0W489D PG0W529A PG0W545Q PG0W701B PG0WD003 PG0WG11A PG0WX08A PG1WE91APG0W011A PG0W070A PG0W489E PG0W530A PG0W545R PG0W701C PG0WD004 PG0WG12A PG0WX09A PG1WE92APG0W012A PG0W071A PG0W490B PG0W530B PG0W545S PG0W701D PG0WD006 PG0WG13A PG0WX300 PG1WE93APG0W013A PG0W072A PG0W490C PG0W530C PG0W545T PG0W702A PG0WD007 PG0WG14A PG0WX500 PG1WE96APG0W014A PG0W073A PG0W490D PG0W530D PG0W545U PG0W704A PG0WD008 PG0WH001 PG0WX503 PG1WE97APG0W015A PG0W074A PG0W490E PG0W533A PG0W545V PG0W727A PG0WD01B PG0WH00A PG0WX505
Figure 5.12: Listing of all the COBOL program names of the Document Generation and Management System.
view to resolve a specific unknown when it surfaces. This is a clear example of the incrementaland iterative nature of system comprehension, where creating views of different perspectives ofthe system as needed aid in resolving unknowns.
5.4.4 Clustering for Initial Understanding
Although the views, as studied in Section 5.3 (p.41), contained some interesting visual indicators,the one that stands out is the apparent monolithic structure of the overall design of the system. Inan attempt to find some structure in what seems to be a mess, we turned to the program names. Asyou can see in Figure 5.12 (p.54), they seem to be adhering to some kind of naming convention. Allnames have PG as prefix, most likely denoting the Document Generation and Management Systemitself. The first few names have a T in the fourth position, while all the others have a W on thatsame position. Somewhere in the middle there is an entire alphabet appended to PG0W545. Basedon these kinds of patterns, we manually grouped the programs into clusters and aggregated all thefunctional dependencies, resulting in Figure 5.13 (p.55).
Because a lot of functional dependencies seemed to target the green and the red cluster, wesuspected a layered architecture. In the assumption that some violations against this layeringprinciple were likely to occur, and taking into account that the clustering was just a guess from ourpart, we decided to filter out the exceptional dependencies (weight ≤ 3) to unclutter the view. Thisresulted in Figure 5.14 (p.55), which confirmed our impression of a layered architecture.
54
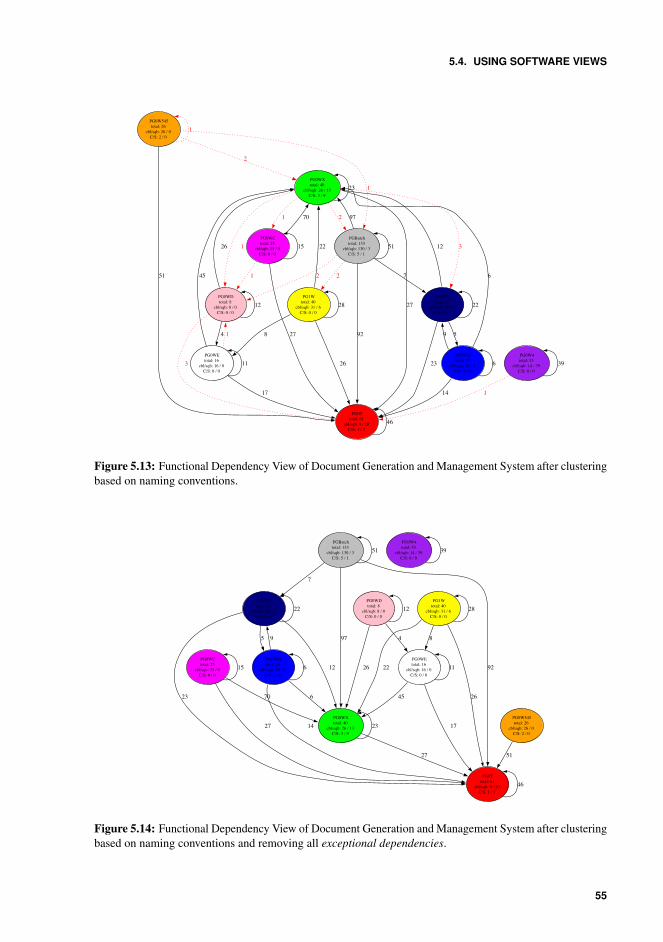
5.4. USING SOFTWARE VIEWS
PG0T total: 61
cbl/sqb: 9 / 20 C/S: 1 / 7
46
PG0WX total: 40
cbl/sqb: 26 / 13 C/S: 3 / 9
27
23
PG0WC total: 25
cbl/sqb: 25 / 0 C/S: 0 / 0
1
PG0WD total: 8
cbl/sqb: 8 / 0 C/S: 0 / 0
1
PG0WG total: 25
cbl/sqb: 20 / 5 C/S: 0 / 1
3 PGBatch total: 133
cbl/sqb: 130 / 3 C/S: 5 / 1
2
27
70
15
1
3
26
12
PG0WE total: 16
cbl/sqb: 16 / 0 C/S: 0 / 0
4
17
45
1
11 23
12
22
PG0WH total: 10
cbl/sqb: 10 / 0 C/S: 0 / 0
5
14
6
9
6 PG0W4 total: 53
cbl/sqb: 14 / 39 C/S: 0 / 0
1
39
PG0W545 total: 26
cbl/sqb: 26 / 0 C/S: 2 / 0
51
2
1
1
PG1W total: 40
cbl/sqb: 31 / 6 C/S: 0 / 0
26
22
8
28
92
97
2 72
51
Figure 5.13: Functional Dependency View of Document Generation and Management System after clusteringbased on naming conventions.
PG0T total: 61
cbl/sqb: 9 / 20 C/S: 1 / 7
46
PG0WX total: 40
cbl/sqb: 26 / 13 C/S: 3 / 9
27
23
PG0WC total: 25
cbl/sqb: 25 / 0 C/S: 0 / 0
27
70
15
PG0WD total: 8
cbl/sqb: 8 / 0 C/S: 0 / 0
26
12
PG0WE total: 16
cbl/sqb: 16 / 0 C/S: 0 / 0
4
17
45
11
PG0WG total: 25
cbl/sqb: 20 / 5 C/S: 0 / 1
23
12
22
PG0WH total: 10
cbl/sqb: 10 / 0 C/S: 0 / 0
5
14
6
9
6
PG0W4 total: 53
cbl/sqb: 14 / 39 C/S: 0 / 0
39
PG0W545 total: 26
cbl/sqb: 26 / 0 C/S: 2 / 0
51
PG1W total: 40
cbl/sqb: 31 / 6 C/S: 0 / 0
26
22
8
28
PGBatch total: 133
cbl/sqb: 130 / 3 C/S: 5 / 1
92
97
7
51
Figure 5.14: Functional Dependency View of Document Generation and Management System after clusteringbased on naming conventions and removing all exceptional dependencies.
55
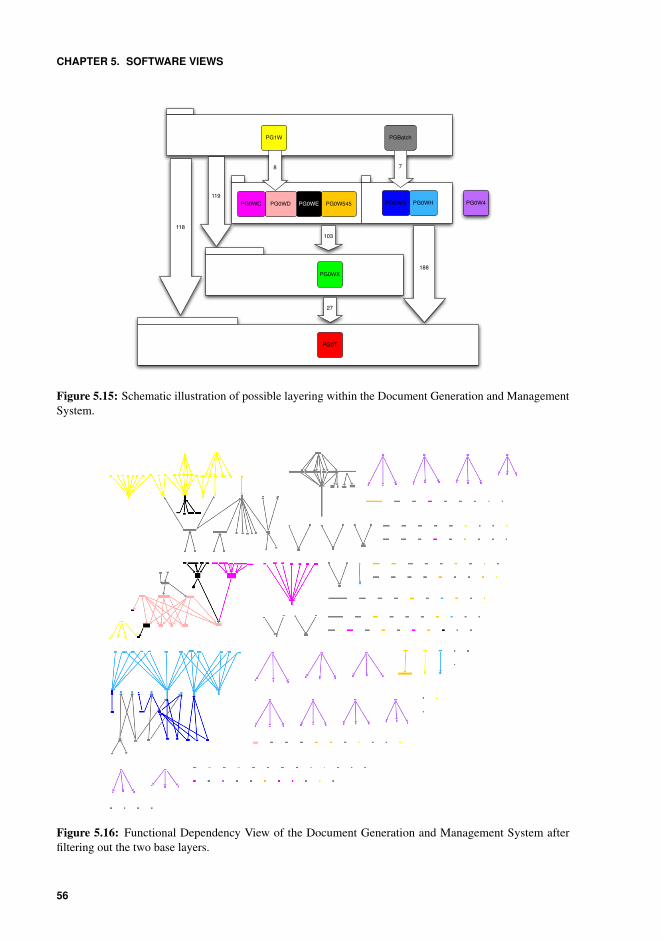
CHAPTER 5. SOFTWARE VIEWS
PG0T
PG0WX
PG0W545PG0WEPG0WDPG0WC PG0W4PG0WHPG0WG
PGBatchPG1W
118
119
27
188
7
103
8
Figure 5.15: Schematic illustration of possible layering within the Document Generation and ManagementSystem.
Figure 5.16: Functional Dependency View of the Document Generation and Management System afterfiltering out the two base layers.
56
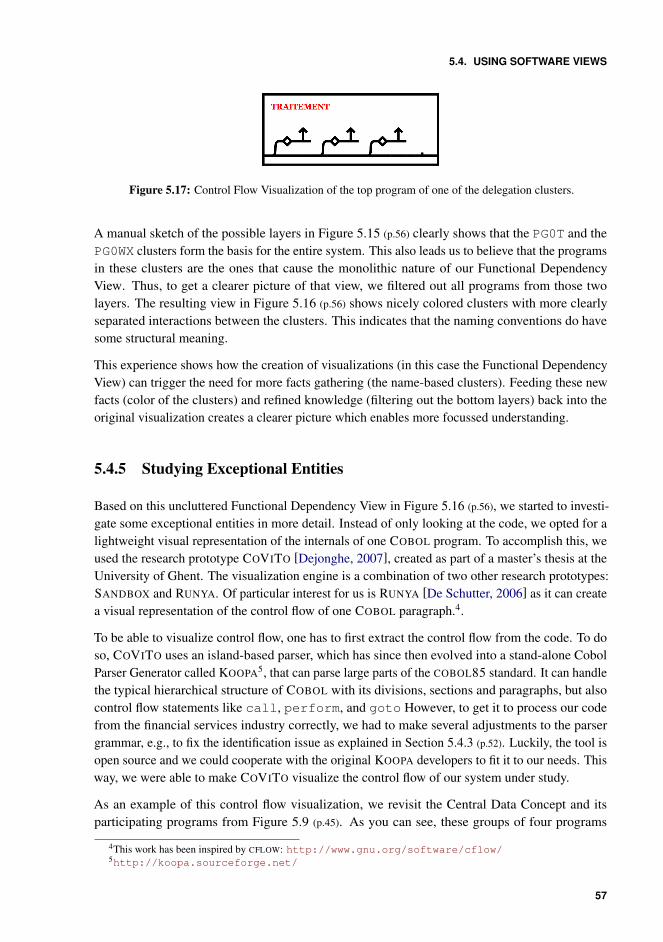
5.4. USING SOFTWARE VIEWS
Figure 5.17: Control Flow Visualization of the top program of one of the delegation clusters.
A manual sketch of the possible layers in Figure 5.15 (p.56) clearly shows that the PG0T and thePG0WX clusters form the basis for the entire system. This also leads us to believe that the programsin these clusters are the ones that cause the monolithic nature of our Functional DependencyView. Thus, to get a clearer picture of that view, we filtered out all programs from those twolayers. The resulting view in Figure 5.16 (p.56) shows nicely colored clusters with more clearlyseparated interactions between the clusters. This indicates that the naming conventions do havesome structural meaning.
This experience shows how the creation of visualizations (in this case the Functional DependencyView) can trigger the need for more facts gathering (the name-based clusters). Feeding these newfacts (color of the clusters) and refined knowledge (filtering out the bottom layers) back into theoriginal visualization creates a clearer picture which enables more focussed understanding.
5.4.5 Studying Exceptional Entities
Based on this uncluttered Functional Dependency View in Figure 5.16 (p.56), we started to investi-gate some exceptional entities in more detail. Instead of only looking at the code, we opted for alightweight visual representation of the internals of one COBOL program. To accomplish this, weused the research prototype COVITO [Dejonghe, 2007], created as part of a master’s thesis at theUniversity of Ghent. The visualization engine is a combination of two other research prototypes:SANDBOX and RUNYA. Of particular interest for us is RUNYA [De Schutter, 2006] as it can createa visual representation of the control flow of one COBOL paragraph.4.
To be able to visualize control flow, one has to first extract the control flow from the code. To doso, COVITO uses an island-based parser, which has since then evolved into a stand-alone CobolParser Generator called KOOPA5, that can parse large parts of the COBOL85 standard. It can handlethe typical hierarchical structure of COBOL with its divisions, sections and paragraphs, but alsocontrol flow statements like call, perform, and goto However, to get it to process our codefrom the financial services industry correctly, we had to make several adjustments to the parsergrammar, e.g., to fix the identification issue as explained in Section 5.4.3 (p.52). Luckily, the tool isopen source and we could cooperate with the original KOOPA developers to fit it to our needs. Thisway, we were able to make COVITO visualize the control flow of our system under study.
As an example of this control flow visualization, we revisit the Central Data Concept and itsparticipating programs from Figure 5.9 (p.45). As you can see, these groups of four programs
4This work has been inspired by CFLOW: http://www.gnu.org/software/cflow/5http://koopa.sourceforge.net/
57
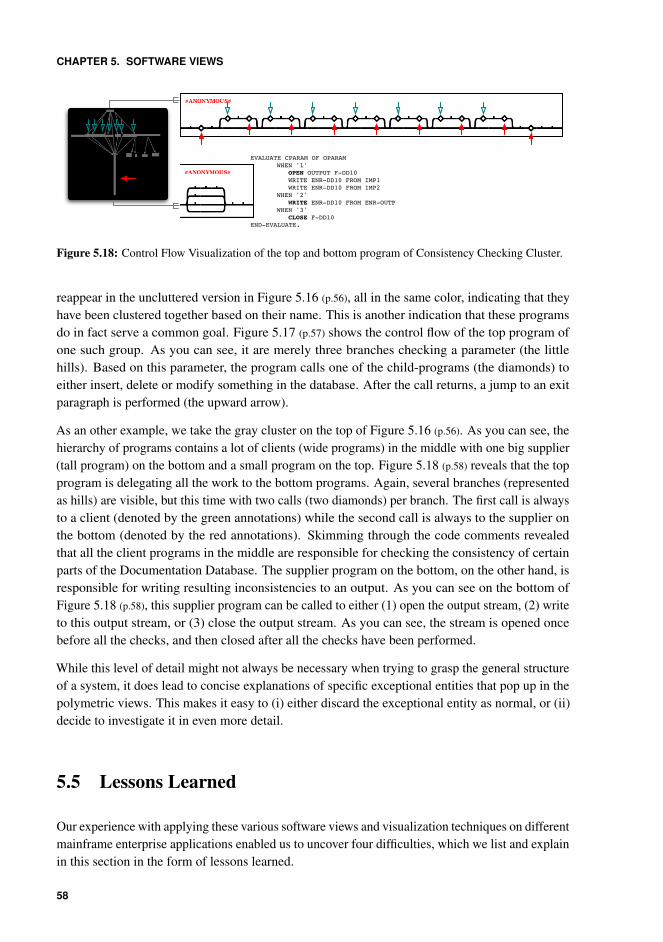
CHAPTER 5. SOFTWARE VIEWS
EVALUATE CPARAM OF OPARAM WHEN '1' OPEN OUTPUT F-DD10 WRITE ENR-DD10 FROM IMP1 WRITE ENR-DD10 FROM IMP2 WHEN '2' WRITE ENR-DD10 FROM ENR-OUTP WHEN '3' CLOSE F-DD10
END-EVALUATE.
Figure 5.18: Control Flow Visualization of the top and bottom program of Consistency Checking Cluster.
reappear in the uncluttered version in Figure 5.16 (p.56), all in the same color, indicating that theyhave been clustered together based on their name. This is another indication that these programsdo in fact serve a common goal. Figure 5.17 (p.57) shows the control flow of the top program ofone such group. As you can see, it are merely three branches checking a parameter (the littlehills). Based on this parameter, the program calls one of the child-programs (the diamonds) toeither insert, delete or modify something in the database. After the call returns, a jump to an exitparagraph is performed (the upward arrow).
As an other example, we take the gray cluster on the top of Figure 5.16 (p.56). As you can see, thehierarchy of programs contains a lot of clients (wide programs) in the middle with one big supplier(tall program) on the bottom and a small program on the top. Figure 5.18 (p.58) reveals that the topprogram is delegating all the work to the bottom programs. Again, several branches (representedas hills) are visible, but this time with two calls (two diamonds) per branch. The first call is alwaysto a client (denoted by the green annotations) while the second call is always to the supplier onthe bottom (denoted by the red annotations). Skimming through the code comments revealedthat all the client programs in the middle are responsible for checking the consistency of certainparts of the Documentation Database. The supplier program on the bottom, on the other hand, isresponsible for writing resulting inconsistencies to an output. As you can see on the bottom ofFigure 5.18 (p.58), this supplier program can be called to either (1) open the output stream, (2) writeto this output stream, or (3) close the output stream. As you can see, the stream is opened oncebefore all the checks, and then closed after all the checks have been performed.
While this level of detail might not always be necessary when trying to grasp the general structureof a system, it does lead to concise explanations of specific exceptional entities that pop up in thepolymetric views. This makes it easy to (i) either discard the exceptional entity as normal, or (ii)decide to investigate it in even more detail.
5.5 Lessons Learned
Our experience with applying these various software views and visualization techniques on differentmainframe enterprise applications enabled us to uncover four difficulties, which we list and explainin this section in the form of lessons learned.
58
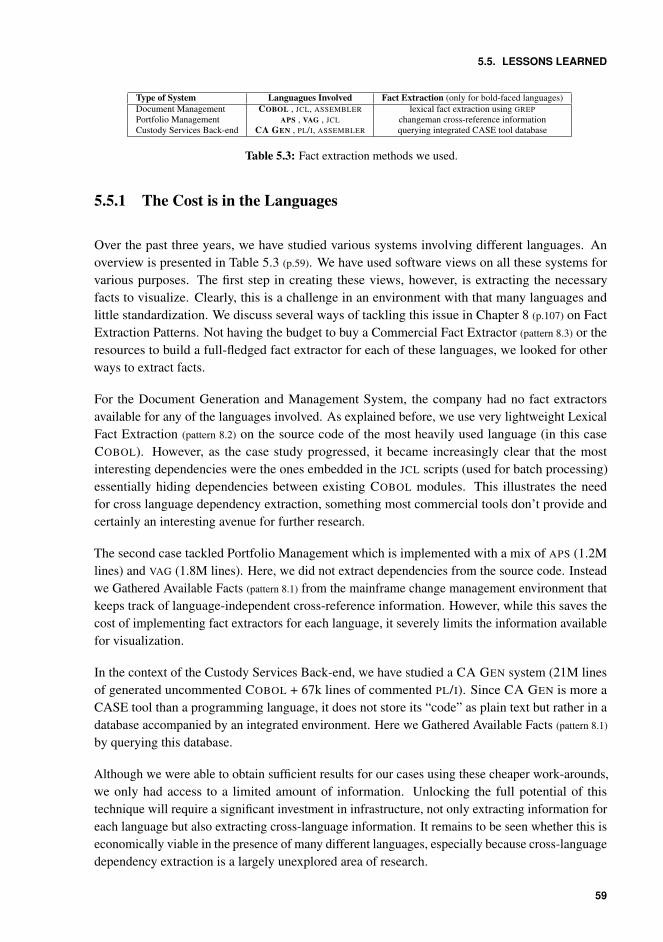
5.5. LESSONS LEARNED
Type of System Languagues Involved Fact Extraction (only for bold-faced languages)Document Management COBOL , JCL, ASSEMBLER lexical fact extraction using GREPPortfolio Management APS , VAG , JCL changeman cross-reference informationCustody Services Back-end CA GEN , PL/I, ASSEMBLER querying integrated CASE tool database
Table 5.3: Fact extraction methods we used.
5.5.1 The Cost is in the Languages
Over the past three years, we have studied various systems involving different languages. Anoverview is presented in Table 5.3 (p.59). We have used software views on all these systems forvarious purposes. The first step in creating these views, however, is extracting the necessaryfacts to visualize. Clearly, this is a challenge in an environment with that many languages andlittle standardization. We discuss several ways of tackling this issue in Chapter 8 (p.107) on FactExtraction Patterns. Not having the budget to buy a Commercial Fact Extractor (pattern 8.3) or theresources to build a full-fledged fact extractor for each of these languages, we looked for otherways to extract facts.
For the Document Generation and Management System, the company had no fact extractorsavailable for any of the languages involved. As explained before, we use very lightweight LexicalFact Extraction (pattern 8.2) on the source code of the most heavily used language (in this caseCOBOL). However, as the case study progressed, it became increasingly clear that the mostinteresting dependencies were the ones embedded in the JCL scripts (used for batch processing)essentially hiding dependencies between existing COBOL modules. This illustrates the needfor cross language dependency extraction, something most commercial tools don’t provide andcertainly an interesting avenue for further research.
The second case tackled Portfolio Management which is implemented with a mix of APS (1.2Mlines) and VAG (1.8M lines). Here, we did not extract dependencies from the source code. Insteadwe Gathered Available Facts (pattern 8.1) from the mainframe change management environment thatkeeps track of language-independent cross-reference information. However, while this saves thecost of implementing fact extractors for each language, it severely limits the information availablefor visualization.
In the context of the Custody Services Back-end, we have studied a CA GEN system (21M linesof generated uncommented COBOL + 67k lines of commented PL/I). Since CA GEN is more aCASE tool than a programming language, it does not store its “code” as plain text but rather in adatabase accompanied by an integrated environment. Here we Gathered Available Facts (pattern 8.1)
by querying this database.
Although we were able to obtain sufficient results for our cases using these cheaper work-arounds,we only had access to a limited amount of information. Unlocking the full potential of thistechnique will require a significant investment in infrastructure, not only extracting information foreach language but also extracting cross-language information. It remains to be seen whether this iseconomically viable in the presence of many different languages, especially because cross-languagedependency extraction is a largely unexplored area of research.
59
CHAPTER 5. SOFTWARE VIEWS
5.5.2 Nothing Works out-of-the-box
An off-the-shelf fact extractor will not work out-of-the-box. Whether it is a commercial or anopen-source fact extractor, there will always be some oddity in your language variant or systemsetup that is different from all others. Ira Baxter, CEO of Semantic Designs inc.6, calls this theBIBSEH phenomenon: ‘Because In Big Systems Everything Happens’. Solving these everythingsrequires ad-hoc work-arounds.
One example involves the DLM subsystem of the Document Generation and Management Systemdiscussed in Section 5.3 (p.41), where the Central Data Concept in Figure 5.9 (p.45) shows severalgroups of programs that are responsible for inserting, deleting or modifying data in a specific tableof the documents database. However, they were classified as dead code because accessing themwas handled by a dynamic call involving a look-up table. Another example is the identificationissue discussed in Section 5.4.3 (p.52) where the standard way of naming COBOL programs isnot adhered to. A last example involves the visualization of COBOL program internals withCOVITO. This tool has a rudimentary COBOL parser built-in to be able to create these internalrepresentations. To get the tool to work, we had to adjust the parsing mechanism to take intoaccount several vendor-specific oddities in the COBOL code. Luckily, we had the source codeavailable for this research prototype so we were able to make the necessary adjustments.
Never assume it will work. On the contrary, always assume it will not. Hence, when preparing theuse of an existing package, make sure you are able and authorized to make the necessary changesas you go.
5.5.3 Dinosaurs Don’t Like Pictures
As we stated before, the mainframe — a.k.a. the dinosaur of computing — is not a visualenvironment. As such, we also had some interesting experiences with the usage and adoption ofthe polymetric views in the context of mainframe organizations.
Lanza and Ducasse [2003] envisioned their polymetric views to show its full potential in anintegrated environment, i.e., being able to easily switch between visual entities and correspondingcode. This way, maintainers would get the most value out of these visualizations. However, in ourexperience, they are not interested in such ‘fanciness’, they would rather compose some textualquery and dive into the code. We believe this lack of interest can be attributed to the limitedgraphical capabilities of the mainframe dinosaur. Therefore, integrating these visualizationswith the development environment will only be possible if development does not take place onthe mainframe itself. Prestudy leaders, on the other hand, are usually not that familiar withthe mainframe and do not require access to the code. They can benefit from these kinds ofvisualizations as objective structural information they can use in addition to interviewing theexperts (pattern A.3).
6http://www.semdesigns.com/
60
5.6. SUMMARY
5.5.4 Knowledge is Scattered and Scarce
Lastly, we noticed that getting empirically sound validations of our findings is extremely difficult“in vivo”, mainly because knowledge about the system is typically either centralized in one personor scattered among different people each with their own expertise. This prohibits cross-validationof opinions as there is usually at most one “expert” per part of the system. For all practical reasons,this stresses the importance of reverse engineering tools that can assist in verifying the knowledgeof experts.
5.6 Summary
In this chapter, we have shown that the polymetric views technique is a good reverse engineeringtechnique. It can support knowledge acquisition in various stages of comprehension. It can beused during first contact to get an idea of the software system, or to refine that idea into an initialunderstanding and even to investigate some parts in more detail by studying the internals. Toenable this, the technique is highly interactive, allowing for customized views and switchingbetween them as necessary to formulate hypotheses and afterwards reject or verify them. This isthe very essence of iterative and incremental exploration.
However, in applying these views on mainframe enterprise applications we have uncovered somedifficulties. The many languages and dialects make it difficult to perform the data gatheringactivity, using off-the-shelf fact extractors — whether they are commercial or open-source — isnot a quick fix to this problem. Furthermore, sound empirical validation of knowledge acquiredthrough visualizations is difficult because knowledge in these mechanistic organizations is scatteredand scarce. However, the biggest issue to the adoption of software views on mainframe systems isthe lack of visual support on the mainframe. As such, maintainers will not be able to benefit fullyfrom these visualizations.
61

CHAPTER 5. SOFTWARE VIEWS
62
Chapter 6
Feature Location
In theory, theory and practice are the same. In practice, they are not.— Laurence Peter “Yogi” Berra
Feature location is the act of mapping features (i.e., functions a system can perform) to piecesof code implementing that feature. It was first introduced by [Wilde and Scully, 1995] and it isnow well-studied in the literature. It helps to resolve so-called “known unknowns”, i.e., the thingsthat we know we don’t know but by acknowledging this lack of information we can look for ananswer. As stated before, an analyst is also interested in identifying and resolving the “unknownunknowns”, i.e., things we do not know we don’t know. These unknowns are much harder toaddress since we can only acknowledge them once we have encountered them and they require amore exploratory analysis of a given system. A feature location technique supported by an iterativeand incremental process is able to address both requirements.
By cooperating with the financial services industry, we have identified several recurring problemsin which such a feature location technique can help.
— Introducing new, enterprise-wide, shared services will replace existing features within currentsoftware systems. Locating their implementation is necessary to be able to disable (or remove)the features. The prestudy leader can use this information to estimate the impact that theintegration of the new service will have on the existing system.
— Documentation about certain (or all) features of legacy system can be lacking. This is a problemwhen trying to maintain a system or when the need arises to rebuild an existing system. Sincecode is the most up-to-date form of documentation, this is what we need to re-document thefeature. Feature location can help look for this feature-specific code.
— A new developer joins a project or service team and needs to familiarize himself with (a partof) the system. Studying the behavior of the system while interacting with it induces a moreprofound comprehension of the system and sheds new light on available documentation.
CHAPTER 6. FEATURE LOCATION
Feature location looks very promising to solve the recurring problems stated above, but of course,we first need to investigate whether such techniques can be applied in our “in vivo” context ofmainframe systems from the financial services industry, which will be the focus of this chapter. InSection 6.1 (p.64) we select a promising feature location technique from the literature and conducta replication experiment in which we apply the technique in our context and try to replicate thefindings of the original authors. In Section 6.2 (p.77), we provide a summary of the lessons welearned from the replication experiment. Taking into account the shortcomings of our setup in thereplication experiment, we list some attempts to use a different setup in Section 6.3 (p.79). All theseattempts failed or were cancelled in the end. Yet, the causes of these failures provide valuableinformation for practitioners interested in setting up a similar experiment.
6.1 Replication Experiment
The industrial context for this replication experiment is a large Belgian bank that needs to analyzetheir systems to identify which parts can be reused in other (European) countries. A prestudy leaderperforming such an analysis is interested to know whether the code implementing a given feature islocated in a few separate modules (in which case reuse becomes feasible) or scattered across manymodules (in which case reuse becomes difficult). Using the survey of Cornelissen et al. [2009], welooked for a feature location technique that was also good for system comprehension and that hadbeen reported to work on an industrial scale. The survey indicated one technique that satisfied allthe criteria, namely the feature location technique described by Eisenbarth et al. [2003], whichuses formal concept analysis to analyze run-time information.
In what follows, we report on an experiment where we try to replicate the findings of Eisenbarthet al.. In Section 6.1.1 (p.64), we describe the principal steps of the technique, we identify its keystrengths and argue why it is a good reverse engineering technique. In Section 6.1.2 (p.67) welist the explicit and implicit assumptions that the technique makes about the system under study.Section 6.1.3 (p.67) reports about a pilot experiment where we verify whether we can replicate thetechnique on a small scale. In addition, the section serves as a clarifying example of the technique.Next, we shortly revisit the industrial context in which we are working, derive the technicalimplications this has on the techniques to capture execution profiles. Capturing these executionprofiles is part of the data gathering activity which is crucial for this feature location technique.After describing the experimental set-up in Section 6.1.4 (p.69), we report on the different iterationswe needed to map the given set of features to a reasonable amount of code modules in Section 6.1.5(p.71). Lastly, we list the aspects of the technique that worked well and the aspects that could beimproved in the “lessons learned” in Section 6.2 (p.77).
6.1.1 Technique
In a nutshell, Eisenbarth et al. [2003] present a semi-automatic technique that combines static anddynamic analyses to rapidly focus on the system’s parts that relate to a specific (set of) feature(s).These system parts are called computational units and are defined as executable parts of a system,
64
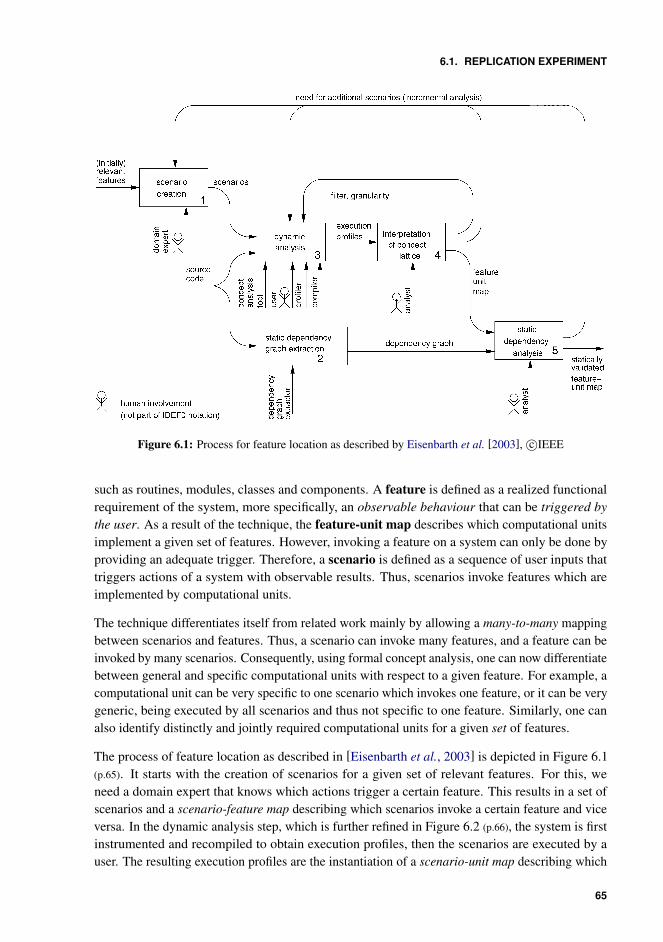
6.1. REPLICATION EXPERIMENT
Figure 6.1: Process for feature location as described by Eisenbarth et al. [2003], c©IEEE
such as routines, modules, classes and components. A feature is defined as a realized functionalrequirement of the system, more specifically, an observable behaviour that can be triggered bythe user. As a result of the technique, the feature-unit map describes which computational unitsimplement a given set of features. However, invoking a feature on a system can only be done byproviding an adequate trigger. Therefore, a scenario is defined as a sequence of user inputs thattriggers actions of a system with observable results. Thus, scenarios invoke features which areimplemented by computational units.
The technique differentiates itself from related work mainly by allowing a many-to-many mappingbetween scenarios and features. Thus, a scenario can invoke many features, and a feature can beinvoked by many scenarios. Consequently, using formal concept analysis, one can now differentiatebetween general and specific computational units with respect to a given feature. For example, acomputational unit can be very specific to one scenario which invokes one feature, or it can be verygeneric, being executed by all scenarios and thus not specific to one feature. Similarly, one canalso identify distinctly and jointly required computational units for a given set of features.
The process of feature location as described in [Eisenbarth et al., 2003] is depicted in Figure 6.1(p.65). It starts with the creation of scenarios for a given set of relevant features. For this, weneed a domain expert that knows which actions trigger a certain feature. This results in a set ofscenarios and a scenario-feature map describing which scenarios invoke a certain feature and viceversa. In the dynamic analysis step, which is further refined in Figure 6.2 (p.66), the system is firstinstrumented and recompiled to obtain execution profiles, then the scenarios are executed by auser. The resulting execution profiles are the instantiation of a scenario-unit map describing which
65
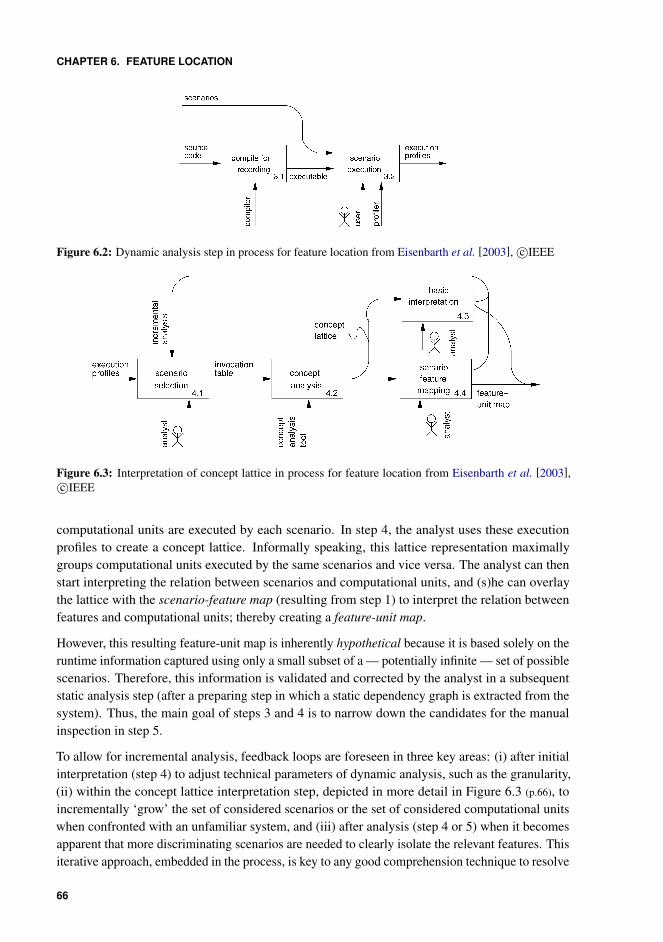
CHAPTER 6. FEATURE LOCATION
Figure 6.2: Dynamic analysis step in process for feature location from Eisenbarth et al. [2003], c©IEEE
Figure 6.3: Interpretation of concept lattice in process for feature location from Eisenbarth et al. [2003],c©IEEE
computational units are executed by each scenario. In step 4, the analyst uses these executionprofiles to create a concept lattice. Informally speaking, this lattice representation maximallygroups computational units executed by the same scenarios and vice versa. The analyst can thenstart interpreting the relation between scenarios and computational units, and (s)he can overlaythe lattice with the scenario-feature map (resulting from step 1) to interpret the relation betweenfeatures and computational units; thereby creating a feature-unit map.
However, this resulting feature-unit map is inherently hypothetical because it is based solely on theruntime information captured using only a small subset of a — potentially infinite — set of possiblescenarios. Therefore, this information is validated and corrected by the analyst in a subsequentstatic analysis step (after a preparing step in which a static dependency graph is extracted from thesystem). Thus, the main goal of steps 3 and 4 is to narrow down the candidates for the manualinspection in step 5.
To allow for incremental analysis, feedback loops are foreseen in three key areas: (i) after initialinterpretation (step 4) to adjust technical parameters of dynamic analysis, such as the granularity,(ii) within the concept lattice interpretation step, depicted in more detail in Figure 6.3 (p.66), toincrementally ‘grow’ the set of considered scenarios or the set of considered computational unitswhen confronted with an unfamiliar system, and (iii) after analysis (step 4 or 5) when it becomesapparent that more discriminating scenarios are needed to clearly isolate the relevant features. Thisiterative approach, embedded in the process, is key to any good comprehension technique to resolve
66
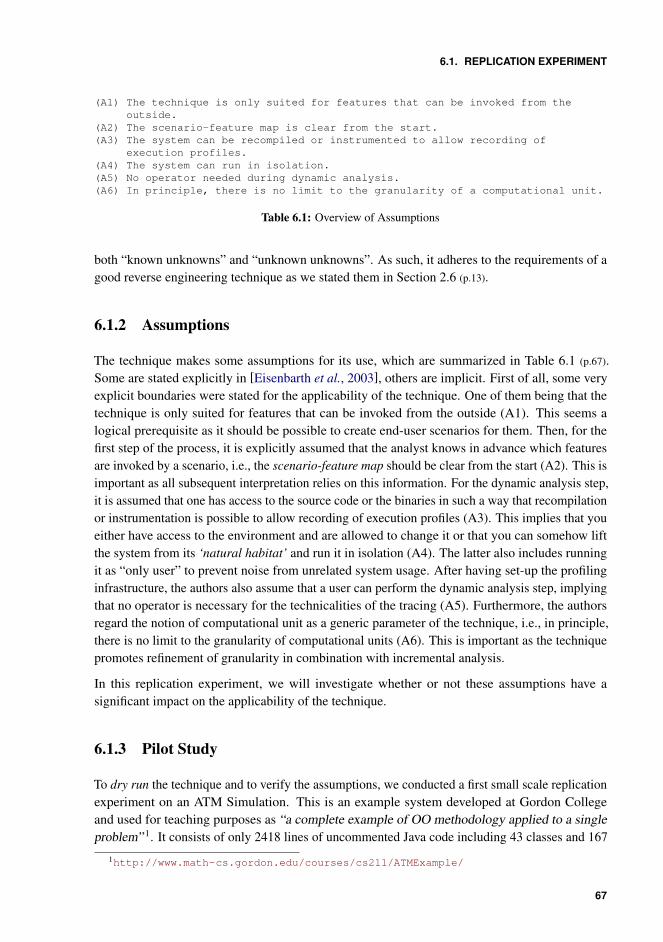
6.1. REPLICATION EXPERIMENT
(A1) The technique is only suited for features that can be invoked from theoutside.
(A2) The scenario-feature map is clear from the start.(A3) The system can be recompiled or instrumented to allow recording of
execution profiles.(A4) The system can run in isolation.(A5) No operator needed during dynamic analysis.(A6) In principle, there is no limit to the granularity of a computational unit.
Table 6.1: Overview of Assumptions
both “known unknowns” and “unknown unknowns”. As such, it adheres to the requirements of agood reverse engineering technique as we stated them in Section 2.6 (p.13).
6.1.2 Assumptions
The technique makes some assumptions for its use, which are summarized in Table 6.1 (p.67).Some are stated explicitly in [Eisenbarth et al., 2003], others are implicit. First of all, some veryexplicit boundaries were stated for the applicability of the technique. One of them being that thetechnique is only suited for features that can be invoked from the outside (A1). This seems alogical prerequisite as it should be possible to create end-user scenarios for them. Then, for thefirst step of the process, it is explicitly assumed that the analyst knows in advance which featuresare invoked by a scenario, i.e., the scenario-feature map should be clear from the start (A2). This isimportant as all subsequent interpretation relies on this information. For the dynamic analysis step,it is assumed that one has access to the source code or the binaries in such a way that recompilationor instrumentation is possible to allow recording of execution profiles (A3). This implies that youeither have access to the environment and are allowed to change it or that you can somehow liftthe system from its ‘natural habitat’ and run it in isolation (A4). The latter also includes runningit as “only user” to prevent noise from unrelated system usage. After having set-up the profilinginfrastructure, the authors also assume that a user can perform the dynamic analysis step, implyingthat no operator is necessary for the technicalities of the tracing (A5). Furthermore, the authorsregard the notion of computational unit as a generic parameter of the technique, i.e., in principle,there is no limit to the granularity of computational units (A6). This is important as the techniquepromotes refinement of granularity in combination with incremental analysis.
In this replication experiment, we will investigate whether or not these assumptions have asignificant impact on the applicability of the technique.
6.1.3 Pilot Study
To dry run the technique and to verify the assumptions, we conducted a first small scale replicationexperiment on an ATM Simulation. This is an example system developed at Gordon Collegeand used for teaching purposes as “a complete example of OO methodology applied to a singleproblem” 1. It consists of only 2418 lines of uncommented Java code including 43 classes and 167
1http://www.math-cs.gordon.edu/courses/cs211/ATMExample/
67
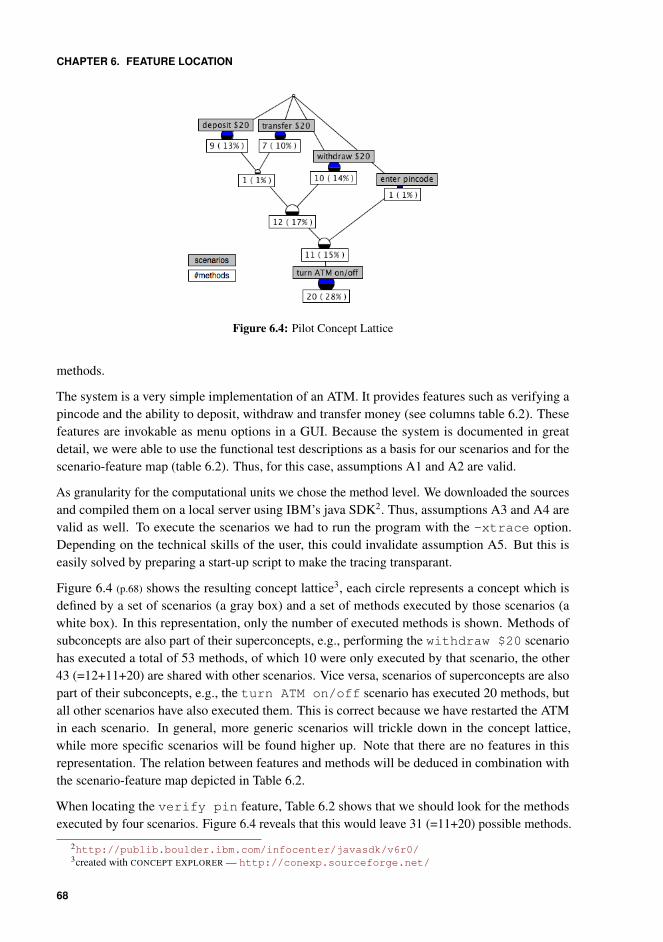
CHAPTER 6. FEATURE LOCATION
Figure 6.4: Pilot Concept Lattice
methods.
The system is a very simple implementation of an ATM. It provides features such as verifying apincode and the ability to deposit, withdraw and transfer money (see columns table 6.2). Thesefeatures are invokable as menu options in a GUI. Because the system is documented in greatdetail, we were able to use the functional test descriptions as a basis for our scenarios and for thescenario-feature map (table 6.2). Thus, for this case, assumptions A1 and A2 are valid.
As granularity for the computational units we chose the method level. We downloaded the sourcesand compiled them on a local server using IBM’s java SDK2. Thus, assumptions A3 and A4 arevalid as well. To execute the scenarios we had to run the program with the -xtrace option.Depending on the technical skills of the user, this could invalidate assumption A5. But this iseasily solved by preparing a start-up script to make the tracing transparant.
Figure 6.4 (p.68) shows the resulting concept lattice3, each circle represents a concept which isdefined by a set of scenarios (a gray box) and a set of methods executed by those scenarios (awhite box). In this representation, only the number of executed methods is shown. Methods ofsubconcepts are also part of their superconcepts, e.g., performing the withdraw $20 scenariohas executed a total of 53 methods, of which 10 were only executed by that scenario, the other43 (=12+11+20) are shared with other scenarios. Vice versa, scenarios of superconcepts are alsopart of their subconcepts, e.g., the turn ATM on/off scenario has executed 20 methods, butall other scenarios have also executed them. This is correct because we have restarted the ATMin each scenario. In general, more generic scenarios will trickle down in the concept lattice,while more specific scenarios will be found higher up. Note that there are no features in thisrepresentation. The relation between features and methods will be deduced in combination withthe scenario-feature map depicted in Table 6.2.
When locating the verify pin feature, Table 6.2 shows that we should look for the methodsexecuted by four scenarios. Figure 6.4 reveals that this would leave 31 (=11+20) possible methods.
2http://publib.boulder.ibm.com/infocenter/javasdk/v6r0/3created with CONCEPT EXPLORER — http://conexp.sourceforge.net/
68
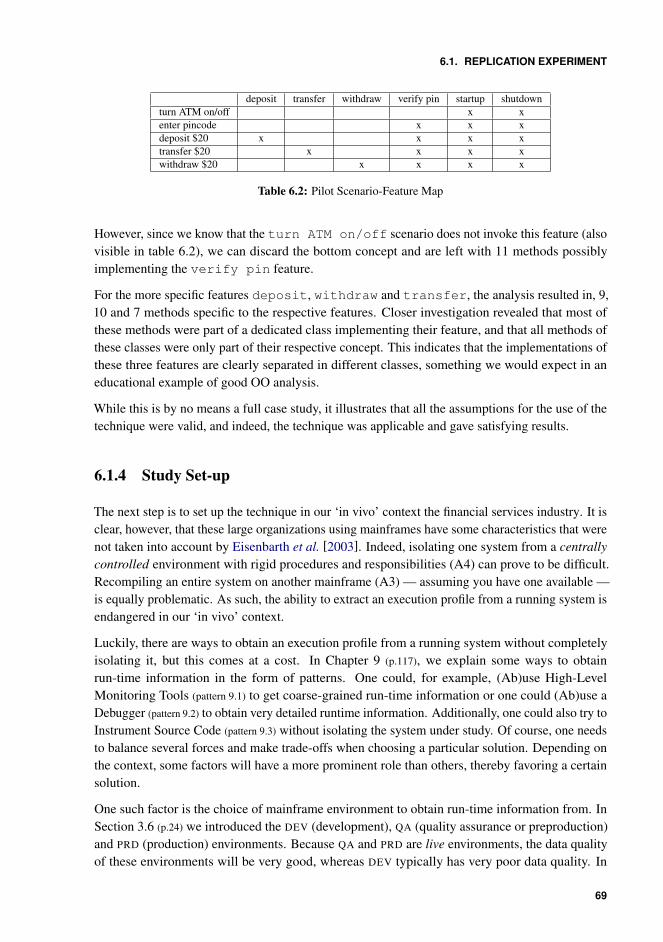
6.1. REPLICATION EXPERIMENT
deposit transfer withdraw verify pin startup shutdownturn ATM on/off x xenter pincode x x xdeposit $20 x x x xtransfer $20 x x x xwithdraw $20 x x x x
Table 6.2: Pilot Scenario-Feature Map
However, since we know that the turn ATM on/off scenario does not invoke this feature (alsovisible in table 6.2), we can discard the bottom concept and are left with 11 methods possiblyimplementing the verify pin feature.
For the more specific features deposit, withdraw and transfer, the analysis resulted in, 9,10 and 7 methods specific to the respective features. Closer investigation revealed that most ofthese methods were part of a dedicated class implementing their feature, and that all methods ofthese classes were only part of their respective concept. This indicates that the implementations ofthese three features are clearly separated in different classes, something we would expect in aneducational example of good OO analysis.
While this is by no means a full case study, it illustrates that all the assumptions for the use of thetechnique were valid, and indeed, the technique was applicable and gave satisfying results.
6.1.4 Study Set-up
The next step is to set up the technique in our ‘in vivo’ context the financial services industry. It isclear, however, that these large organizations using mainframes have some characteristics that werenot taken into account by Eisenbarth et al. [2003]. Indeed, isolating one system from a centrallycontrolled environment with rigid procedures and responsibilities (A4) can prove to be difficult.Recompiling an entire system on another mainframe (A3) — assuming you have one available —is equally problematic. As such, the ability to extract an execution profile from a running system isendangered in our ‘in vivo’ context.
Luckily, there are ways to obtain an execution profile from a running system without completelyisolating it, but this comes at a cost. In Chapter 9 (p.117), we explain some ways to obtainrun-time information in the form of patterns. One could, for example, (Ab)use High-LevelMonitoring Tools (pattern 9.1) to get coarse-grained run-time information or one could (Ab)use aDebugger (pattern 9.2) to obtain very detailed runtime information. Additionally, one could also try toInstrument Source Code (pattern 9.3) without isolating the system under study. Of course, one needsto balance several forces and make trade-offs when choosing a particular solution. Depending onthe context, some factors will have a more prominent role than others, thereby favoring a certainsolution.
One such factor is the choice of mainframe environment to obtain run-time information from. InSection 3.6 (p.24) we introduced the DEV (development), QA (quality assurance or preproduction)and PRD (production) environments. Because QA and PRD are live environments, the data qualityof these environments will be very good, whereas DEV typically has very poor data quality. In
69
CHAPTER 6. FEATURE LOCATION
data processing systems this data quality reflects the quality of the scenarios one can createand, thus, it impacts the quality of the feature location results. On the other hand, the DEV
environment will have more development and maintenance tools that can be abused to obtainrun-time information, whereas QA en PRD have very strict quality of service requirements thatprohibit too much overhead.
With these solutions and factors in mind, we started looking for a profiling infrastructure thatwould fit our needs.
As a first step, we created an inventory of existing debugging, profiling and tracing infrastructureavailable on mainframe (built-in or purchased and installed by the bank). As input we used scarcelyavailable mainframe system documentation and knowledge of several expert technical operators. Asa result, we obtained a diverse list of options ranging from very low-level system tracing, over hooksinto language environments handling communication between different programming languagesto high-level logging of module use for identifying dead applications over time. Afterwards, weadded the option of instrumenting the code at several moments during the build process. Note thatnone of the options were ready to use ‘as is’.
Secondly, we organised a meeting with the technical experts to discuss the feasibility of eachoption and sorted them according to their impact given the following requirements.
(R1) The infrastructure should be usable on the QA environment to ensure sufficient data quality.(R2) The granularity should be at least at module level.(R3) System and organisational impact should be minimal.(R4) The production environment should, under no circumstances, be endangered or modified.
The combination of requirements R1 and R4 ruled out all the options involving code instrumen-tation (pattern 9.3) because internal policy dictates that the QA environment is a mirror of the nextproduction release. Therefore, all instrumented binaries would ripple through into production.While this is not a technical limitation, we did not have the political power to change this policy.The combination of requirements R3 and R2 made us abuse the high-level monitoring tool (pat-
tern 9.1) DORANA4, as it provides a high-level, system-wide logging of load modules. A loadmodule is the compiled binary of a COBOL program, henceforward called module. Using DORANA
introduced no extra impact on the systems because it was already running in the background,whereas the impact of the more detailed system tracing tools was at that time unknown.
When stating requirement R2, we expected this would be sufficient for our feature location purposesbecause these banking systems are created using functional decomposition with entities like mainfunctions and sub-functions. Since both are encapsulated in their own COBOL module, a profilingtool with module granularity is able to discriminate between the two. However, should we needfiner granularity, e.g., during incremental analysis, DORANA will no longer be sufficient.
After having chosen the DORANA tool, we had to customize the set-up for it to provide correctinput data for the dynamic analysis step. The main problem we encountered here was the isolationof scenarios on the mainframe. As mentioned in Section 3.6 (p.24), one of the strengths ofmainframe is the ability to simultaneously support thousands of users. DORANA keeps track of
4http://www-304.ibm.com/jct09002c/gsdod/solutiondetails.do?solution=15645
70
6.1. REPLICATION EXPERIMENT
how many times each mainframe user accesses each module. Thus, having a dedicated mainframeuser to execute scenarios would provide all the necessary information to filter out our executionprofiles. Unfortunately, most systems running on mainframe are calculation intensive back-ends tovarious front-ends running on other systems. Interaction with mainframe is typically handled by atransaction manager, such as IMS5 or CICS6, which runs as a dedicated transaction manager user.Therefore, we lack all user information in the DORANA logs. Clearly, the assumption that one canisolate herself or operate the system as only user (A4) is not valid in this context. Consequently,we had to look for other ways to identify our execution profiles from the complete DORANA
log.
As a first countermeasure, we used transaction isolation. A transaction, used by the transactionmanager, is defined by a main function (essentially an entry-point into the back-end). All trans-actions starting from such an entry-point can be technically isolated to run in a separate region,which makes them identifiable in the logs. Furthermore, all calls to subsequent sub-functionsoriginating from this entry-point will execute in the same region because they are part of the sametransaction. However, this presumes that the domain expert knows in advance which entry-point(s)will be used by each scenario. This is a risk, as we are limiting the search space of the dynamicanalysis using potentially incomplete information. Thus, we will have to take it into account wheninterpreting the results. On the other hand, isolating the correct entry-point dramatically reducesthe noise in the DORANA logs, i.e., instead of receiving all transactional activity, we can now filterto only obtain activity from the desired entry-points. However, it is still possible that other usersare using the same entry-point at the same time.
As a second countermeasure, we minimize the timeframe in which we execute our scenarios andreset the log before and after. Clearly, this is not a waterproof countermeasure. Luckily, we candetect whether or not the logs have been polluted by comparing the number of times each mainfunction has been accessed with the number of times it should have been accessed when executingthe scenarios. If the numbers do not match, the logs are polluted and the scenarios should beexecuted again.
Similar to isolating our use of the system, we should also be able to distinguish between ourdifferent scenarios. Currently, we can only do this by resetting the log between each scenario.Unfortunately, this can only be done by technical operators with sufficient privileges who are noteven in the same geographical location. This clearly invalidates assumption (A5), making it a morelabour intensive and error-prone step due to the resulting synchronization overhead.
6.1.5 Portfolio Management System
After having set-up the profiling infrastructure, we were able to apply the feature location techniqueon the Portfolio Management System as introduced in Section 4.2 (p.28). In short, the systemprovides the back-end for keeping track of all financial possessions of a client (e.g., securities and
5 IMS is IBM’s premier transaction & hierarchical database management system. It simply stands for InformationManagement System.
6CICS is a family of application servers from IBM which provides online transaction management and connectivity. Itstands for Customer Information Control System.
71
CHAPTER 6. FEATURE LOCATION
savings) in a so called portfolio and managing this portfolio based on the client’s profile. Clientscan create, inspect, modify and regroup their own portfolios and even simulate buy and sell actionsto see the effect on a certain portfolio. Important back-end features include calculating the realvalue of possessions (i.e., how much are my shares worth at this moment) and calculating howcertain possessions are spread over a portfolio (e.g., to perform some risk analyses).
The system is coded in two different 3GL languages, namely APS and VAG, from which COBOL
code is generated that runs on an IBM z/OS mainframe. Since there is a one-to-one mappingbetween APS/VAG modules and COBOL modules, the transformation preserves the modulestructure and our “granularity at module level” requirement (R2) remains valid. The systemconsists of more than 1.8M lines of VAG code and more than 1.2M lines of APS code, distributedover 2343 executable COBOL modules of which 1230 are interacting with other modules in thesystem. The other 1113 are stand-alone modules such as isolated maintenance modules andstand-alone batch programs.
Comparing these numbers to the industrial cases used by Eisenbarth et al. [2003], we may concludethat our system is larger, but that the scale of our concept analysis will be smaller due to coarsergranularity of our computational units (COBOL modules versus C functions).
Features The bank is currently conducting an architectural prestudy for a Global PortfolioManagement System, which should extend the scope of the current system to other Europeancountries. This is not just a technical matter because different countries have different regulationsand market conditions, which is why the entire Portfolio Management domain architecture is beingreevaluated. One of the building blocks of such a domain architecture are Business Logic Services,i.e., functionalities that can be grasped and used by business people and are implemented as afeature with observable behaviour. Since this matches the definition given in Section 6.1.1 (p.64),the technique should be applicable.
For this case, the architects were particularly interested in the feature for calculating the real valueof possessions (henceforward called value feature) and the feature for calculating the spreadover a portfolio (henceforward called spread feature), because these features won’t change inthis global context and, thus, could potentially be reused. As the domain expert of the systemwas confident that he could identify the modules implementing these features, it was a goodopportunity for us to test the technique in the field for the first time. He stated the followingexpectations:
(E1) Both the value feature and the spread feature are located in a few modules (about 10),i.e., the implementation is not scattered all over the system.
(E2) Both features work closely together but are cleanly separated, i.e., they have their ownmodules.
Scenarios All scenarios we created could be performed via a web-interface, which constitutesone of the interactive front-ends for which the system under study provides the back-end. Thisweb-interface allows for several ways to access a portfolio, such as inspecting it, asking for areport about it or simulating changes in it, all potentially invoking the value and spread feature.
72
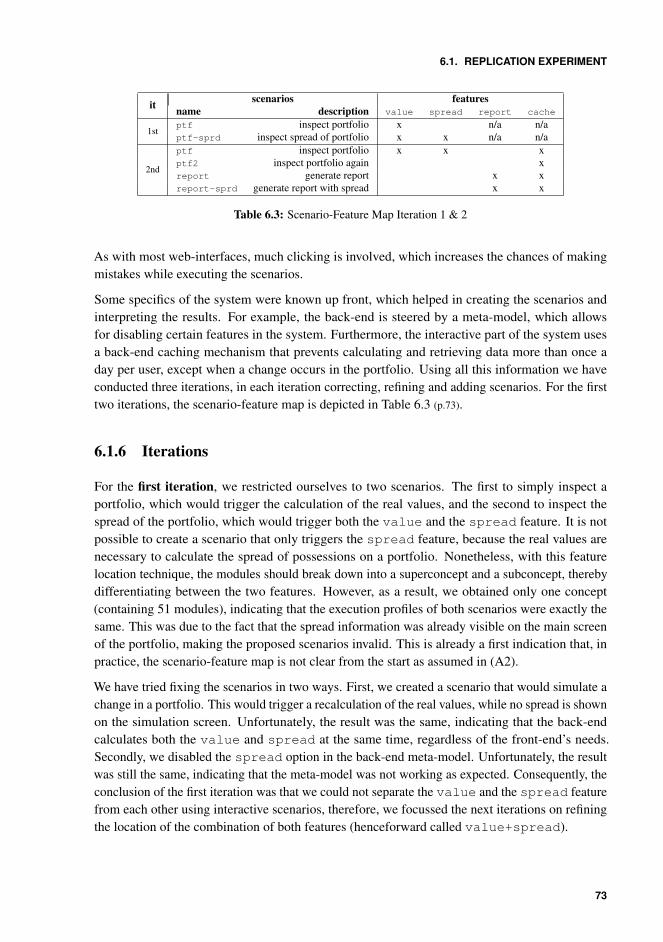
6.1. REPLICATION EXPERIMENT
it scenarios featuresname description value spread report cache
1stptf inspect portfolio x n/a n/aptf-sprd inspect spread of portfolio x x n/a n/a
2nd
ptf inspect portfolio x x xptf2 inspect portfolio again xreport generate report x xreport-sprd generate report with spread x x
Table 6.3: Scenario-Feature Map Iteration 1 & 2
As with most web-interfaces, much clicking is involved, which increases the chances of makingmistakes while executing the scenarios.
Some specifics of the system were known up front, which helped in creating the scenarios andinterpreting the results. For example, the back-end is steered by a meta-model, which allowsfor disabling certain features in the system. Furthermore, the interactive part of the system usesa back-end caching mechanism that prevents calculating and retrieving data more than once aday per user, except when a change occurs in the portfolio. Using all this information we haveconducted three iterations, in each iteration correcting, refining and adding scenarios. For the firsttwo iterations, the scenario-feature map is depicted in Table 6.3 (p.73).
6.1.6 Iterations
For the first iteration, we restricted ourselves to two scenarios. The first to simply inspect aportfolio, which would trigger the calculation of the real values, and the second to inspect thespread of the portfolio, which would trigger both the value and the spread feature. It is notpossible to create a scenario that only triggers the spread feature, because the real values arenecessary to calculate the spread of possessions on a portfolio. Nonetheless, with this featurelocation technique, the modules should break down into a superconcept and a subconcept, therebydifferentiating between the two features. However, as a result, we obtained only one concept(containing 51 modules), indicating that the execution profiles of both scenarios were exactly thesame. This was due to the fact that the spread information was already visible on the main screenof the portfolio, making the proposed scenarios invalid. This is already a first indication that, inpractice, the scenario-feature map is not clear from the start as assumed in (A2).
We have tried fixing the scenarios in two ways. First, we created a scenario that would simulate achange in a portfolio. This would trigger a recalculation of the real values, while no spread is shownon the simulation screen. Unfortunately, the result was the same, indicating that the back-endcalculates both the value and spread at the same time, regardless of the front-end’s needs.Secondly, we disabled the spread option in the back-end meta-model. Unfortunately, the resultwas still the same, indicating that the meta-model was not working as expected. Consequently, theconclusion of the first iteration was that we could not separate the value and the spread featurefrom each other using interactive scenarios, therefore, we focussed the next iterations on refiningthe location of the combination of both features (henceforward called value+spread).
73
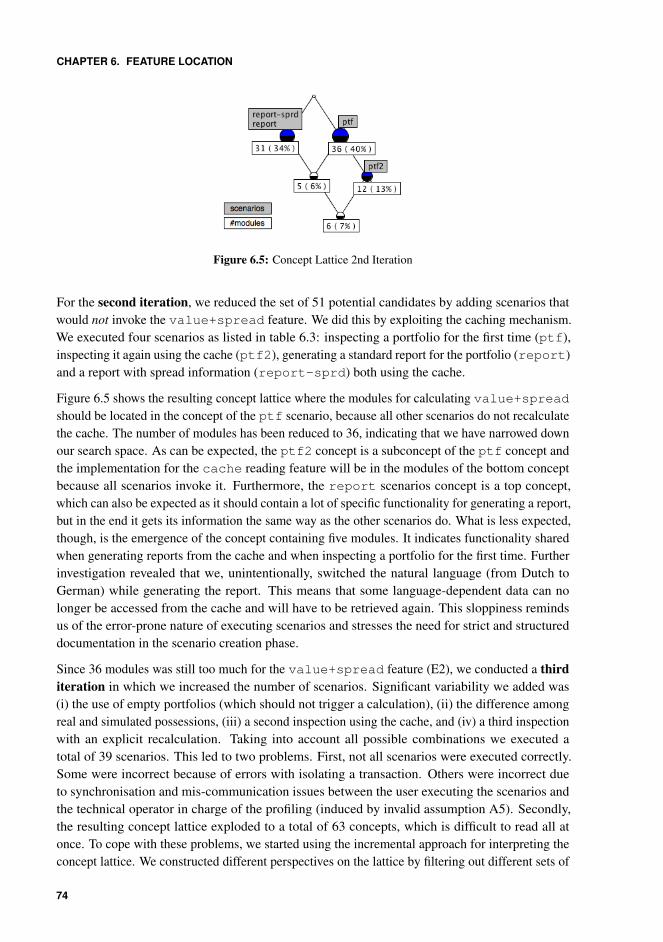
CHAPTER 6. FEATURE LOCATION
Figure 6.5: Concept Lattice 2nd Iteration
For the second iteration, we reduced the set of 51 potential candidates by adding scenarios thatwould not invoke the value+spread feature. We did this by exploiting the caching mechanism.We executed four scenarios as listed in table 6.3: inspecting a portfolio for the first time (ptf),inspecting it again using the cache (ptf2), generating a standard report for the portfolio (report)and a report with spread information (report-sprd) both using the cache.
Figure 6.5 shows the resulting concept lattice where the modules for calculating value+spreadshould be located in the concept of the ptf scenario, because all other scenarios do not recalculatethe cache. The number of modules has been reduced to 36, indicating that we have narrowed downour search space. As can be expected, the ptf2 concept is a subconcept of the ptf concept andthe implementation for the cache reading feature will be in the modules of the bottom conceptbecause all scenarios invoke it. Furthermore, the report scenarios concept is a top concept,which can also be expected as it should contain a lot of specific functionality for generating a report,but in the end it gets its information the same way as the other scenarios do. What is less expected,though, is the emergence of the concept containing five modules. It indicates functionality sharedwhen generating reports from the cache and when inspecting a portfolio for the first time. Furtherinvestigation revealed that we, unintentionally, switched the natural language (from Dutch toGerman) while generating the report. This means that some language-dependent data can nolonger be accessed from the cache and will have to be retrieved again. This sloppiness remindsus of the error-prone nature of executing scenarios and stresses the need for strict and structureddocumentation in the scenario creation phase.
Since 36 modules was still too much for the value+spread feature (E2), we conducted a thirditeration in which we increased the number of scenarios. Significant variability we added was(i) the use of empty portfolios (which should not trigger a calculation), (ii) the difference amongreal and simulated possessions, (iii) a second inspection using the cache, and (iv) a third inspectionwith an explicit recalculation. Taking into account all possible combinations we executed atotal of 39 scenarios. This led to two problems. First, not all scenarios were executed correctly.Some were incorrect because of errors with isolating a transaction. Others were incorrect dueto synchronisation and mis-communication issues between the user executing the scenarios andthe technical operator in charge of the profiling (induced by invalid assumption A5). Secondly,the resulting concept lattice exploded to a total of 63 concepts, which is difficult to read all atonce. To cope with these problems, we started using the incremental approach for interpreting theconcept lattice. We constructed different perspectives on the lattice by filtering out different sets of
74
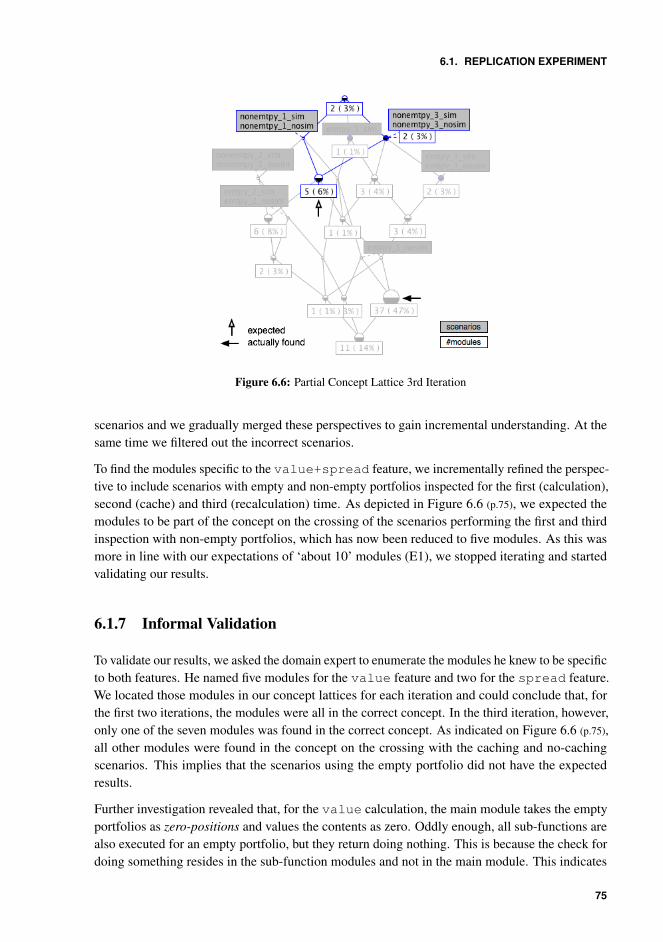
6.1. REPLICATION EXPERIMENT
Figure 6.6: Partial Concept Lattice 3rd Iteration
scenarios and we gradually merged these perspectives to gain incremental understanding. At thesame time we filtered out the incorrect scenarios.
To find the modules specific to the value+spread feature, we incrementally refined the perspec-tive to include scenarios with empty and non-empty portfolios inspected for the first (calculation),second (cache) and third (recalculation) time. As depicted in Figure 6.6 (p.75), we expected themodules to be part of the concept on the crossing of the scenarios performing the first and thirdinspection with non-empty portfolios, which has now been reduced to five modules. As this wasmore in line with our expectations of ‘about 10’ modules (E1), we stopped iterating and startedvalidating our results.
6.1.7 Informal Validation
To validate our results, we asked the domain expert to enumerate the modules he knew to be specificto both features. He named five modules for the value feature and two for the spread feature.We located those modules in our concept lattices for each iteration and could conclude that, forthe first two iterations, the modules were all in the correct concept. In the third iteration, however,only one of the seven modules was found in the correct concept. As indicated on Figure 6.6 (p.75),all other modules were found in the concept on the crossing with the caching and no-cachingscenarios. This implies that the scenarios using the empty portfolio did not have the expectedresults.
Further investigation revealed that, for the value calculation, the main module takes the emptyportfolios as zero-positions and values the contents as zero. Oddly enough, all sub-functions arealso executed for an empty portfolio, but they return doing nothing. This is because the check fordoing something resides in the sub-function modules and not in the main module. This indicates
75
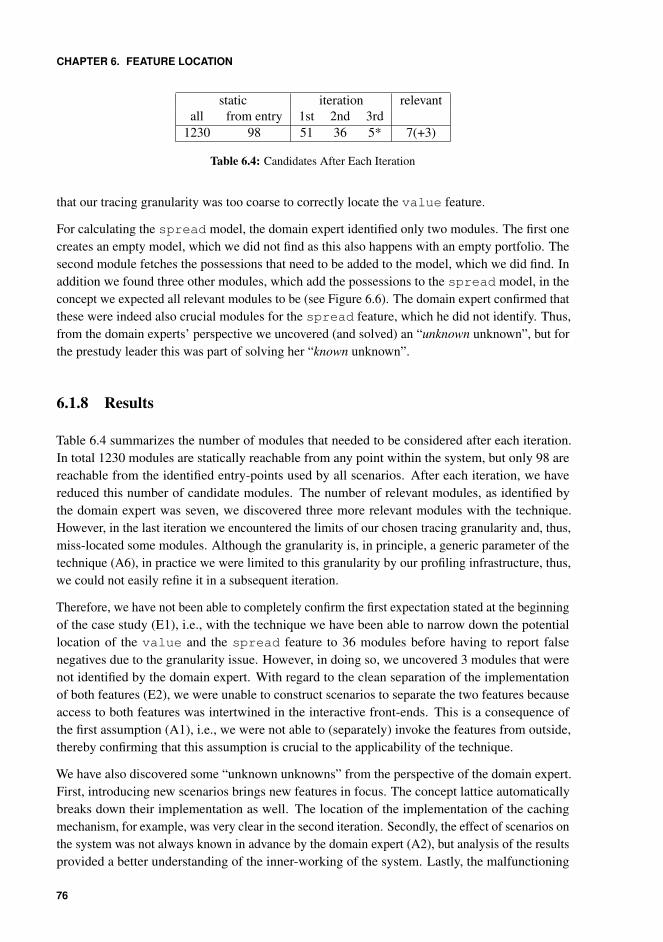
CHAPTER 6. FEATURE LOCATION
static iteration relevantall from entry 1st 2nd 3rd
1230 98 51 36 5* 7(+3)
Table 6.4: Candidates After Each Iteration
that our tracing granularity was too coarse to correctly locate the value feature.
For calculating the spread model, the domain expert identified only two modules. The first onecreates an empty model, which we did not find as this also happens with an empty portfolio. Thesecond module fetches the possessions that need to be added to the model, which we did find. Inaddition we found three other modules, which add the possessions to the spread model, in theconcept we expected all relevant modules to be (see Figure 6.6). The domain expert confirmed thatthese were indeed also crucial modules for the spread feature, which he did not identify. Thus,from the domain experts’ perspective we uncovered (and solved) an “unknown unknown”, but forthe prestudy leader this was part of solving her “known unknown”.
6.1.8 Results
Table 6.4 summarizes the number of modules that needed to be considered after each iteration.In total 1230 modules are statically reachable from any point within the system, but only 98 arereachable from the identified entry-points used by all scenarios. After each iteration, we havereduced this number of candidate modules. The number of relevant modules, as identified bythe domain expert was seven, we discovered three more relevant modules with the technique.However, in the last iteration we encountered the limits of our chosen tracing granularity and, thus,miss-located some modules. Although the granularity is, in principle, a generic parameter of thetechnique (A6), in practice we were limited to this granularity by our profiling infrastructure, thus,we could not easily refine it in a subsequent iteration.
Therefore, we have not been able to completely confirm the first expectation stated at the beginningof the case study (E1), i.e., with the technique we have been able to narrow down the potentiallocation of the value and the spread feature to 36 modules before having to report falsenegatives due to the granularity issue. However, in doing so, we uncovered 3 modules that werenot identified by the domain expert. With regard to the clean separation of the implementationof both features (E2), we were unable to construct scenarios to separate the two features becauseaccess to both features was intertwined in the interactive front-ends. This is a consequence ofthe first assumption (A1), i.e., we were not able to (separately) invoke the features from outside,thereby confirming that this assumption is crucial to the applicability of the technique.
We have also discovered some “unknown unknowns” from the perspective of the domain expert.First, introducing new scenarios brings new features in focus. The concept lattice automaticallybreaks down their implementation as well. The location of the implementation of the cachingmechanism, for example, was very clear in the second iteration. Secondly, the effect of scenarios onthe system was not always known in advance by the domain expert (A2), but analysis of the resultsprovided a better understanding of the inner-working of the system. Lastly, the malfunctioning
76
6.2. LESSONS LEARNED
meta-model was a big “unknown” to the maintainers.
6.2 Lessons Learned
To summarize the experience gained through this replication experiment, we list some lessonslearned in the form of good practices and trade-offs. In addition, we revisit the assumptions aslisted in Table 6.1 (p.67) to highlight the difficulties we encountered when applying the promisingfeature location technique by Eisenbarth et al. [2003] in the context of mainframe enterpriseapplications.
6.2.1 The Power of Iteration
One of the assumptions made by Eisenbarth et al. [2003] is that “the analyst knows in advancewhich features are invoked by a scenario” (A2). While this is indeed a prerequisite for scenariocreation, in practice, the outcome of this step is rarely correct from the start due to the complexityof (and lack of knowledge about) these legacy systems. However, these mistakes usually translateinto a very unexpected breakdown in concepts during concept lattice creation. A good practicewhen confronted with such an unexpected event is to first question the validity of the scenariosand only afterwards question the implementation of the system. Thus, while in our experienceassumption A2 does not hold, in practice, the scenario-feature map can be incrementally correctedby refining and adding scenarios and features. In addition, we have confirmed that incrementalanalysis of large concept lattices is very valuable. This shows that iteration really is the keycharacteristic and strength of the technique.
When iteration is embedded in a technique, one should also consider when to stop iterating, aso called stop criterion. This is a tricky thing during comprehension as there are always more“unknown unknowns”. Therefore, it is essential to have clear goals at the beginning of a casestudy, so you can verify at any time whether you have met the goals. For feature location, thegoal is simply to identify the computational units specific to a certain feature. Validation shouldbe done manually, therefore, a good stop criterion is when the expected time needed to validatethe remaining candidates manually is smaller than the expected time needed to conduct anotheriteration.
6.2.2 Scenarios as Sensitivity Point
As with most techniques based on dynamic analysis, the results are very sensitive to the qualityof the scenarios. At the same time, the scenarios themselves (both creating and executing them)are very sensitive to errors. Hence, we call the scenarios the sensitivity point of the technique,similar to the term used in architectural analysis when a certain quality of an architecture is verysensitive to a certain architectural decision. When something changes in the sensitivity point, thecorresponding quality of the architecture should be reevaluated [Clements et al., 2002].
77
CHAPTER 6. FEATURE LOCATION
With this technique, a small error during scenario creation or execution can have a big impact onthe resulting concept lattice. In our industrial context, invalid assumptions A2 and A5 makes theseerrors even more likely. To minimize this risk, it is good practice to carefully record your actionsduring scenario execution, including all technical and domain-specific variables, and update thescenario documentation as you incrementally refine the scenarios. We conclude that these invalidassumptions have a significant impact on the usability of the technique. However, these can bealleviated with careful planning and execution of scenarios.
6.2.3 Realistic Scenarios versus Flexible Data Collection
Eisenbarth et al. [2003] discuss the trade-off between the space required to store runtime informa-tion and the desired level of detail, additionally, they argue that information overload of the analystshould also be taken into account. Therefore, based on assumption A6, they promote incrementalanalysis with the option of refining the runtime information for a subset of the system duringincremental analysis. However, in practice, the granularity of the computational units is limited byother factors.
In our industrial context, one such limiting factor stems from the choice of environment. This posesa trade-off between the representativity of the data and the technical flexibility of the environment.As discussed in Section 6.1.4 (p.69), the closer you are to using a live environment, the better thedata quality. In data-oriented environments, this is crucial for the quality of the scenarios. On theother hand, the closer you are to using a live environment, the more restricted your options will befor retrieving execution profiles.
Similar trade-offs are discussed in more detail in Chapter 9 (p.117), where we discuss severalways to obtain run-time information. For now, we conclude that, while assumption A6 is valid inprinciple, it has limitations in practice which can be avoided with proper planning but do have asignificant impact on the applicability of the technique.
6.2.4 The Problem of Isolation
Assumptions A3 and A4 state that the system under study can somehow be lifted from its ‘naturalhabitat’ and can run in isolation. This is usually not the case with mainframe systems. Therefore,other techniques should be used to obtain a clean execution profile, potentially endangering thevalidity of the results.
We have reduced the noise by identifying and isolating the entry-points of each scenario. However,since this identification was done by the domain expert, it poses a threat to the internal validityof the results. Indeed, we are looking for all possibly relevant computational units for a certainfeature, but we are telling the technique in advance where to look. Therefore, we might miss somecomputational units. We can work around this issue by identifying all possible entry-points eitherstatically, via the front-end code, or dynamically, by monitoring the link between the front-end andthe back-end.
78
6.3. ATTEMPTED ADJUSTMENTS
In addition, we have reset the log after each scenario and found a way to identify pollutedprofiles, so we can either discard the corrupted scenario or perform it again. However, thisinvalidates assumption A5 because resetting the log has to be done by a technical operator dueto the strict division boundaries in large mechanistic organizations which is also reflected in theprivileges.
We conclude that assumptions A3 and A4 were invalid in our industrial context, which posed asignificant impact on the applicability of the technique. However, using some countermeasures, wewere able to make the technique applicable in our set-up. Unfortunately, these countermeasuresresult in a significant overhead, thereby invalidating A5 and jeopardizing the ability to performrapid incremental and iterative analysis.
6.3 Attempted Adjustments
After our experiences with the replication experiment on the Portfolio Management System, wehave tried to apply feature location on other systems and within other organizations. Takinginto account (i) the shortcomings of our set-up to extract run-time information in the replicationexperiment, (ii) the different analysis needs for different systems, and (iii) the different toolsavailable in other organizations, we had to find new ways to gather the necessary data to successfullyperform feature location. In this section, we list several failed attempts to do so, because the causesof these failures provide valuable information for practitioners interested in conducting similaranalyses.
6.3.1 STROBE as Tracing Facility
When attempting to apply this feature location technique in another organization, the first thingwe had to do was find a way to capture an execution profile from a running system. During thisprocess we also looked for tools available within the organization which we could abuse to achieveour goals. One such tool is STROBE7.
In short, STROBE is a performance monitoring tool from compuware that reports on how applicationprograms use resources in a mainframe environment. STROBE employs a sampling technique thatperiodically takes snapshots of an applications execution and stores this data in a sample dataset. From this sample data set, several reports can be generated regarding the performance of theapplication under study. For example, it can show which lines of code, among perhaps thousands,are using significant amounts of system resources.
By using this sampling technique, compuware has found a way to do performance monitoring withvery little impact, i.e., no changes to the code or the system are necessary and performance impactis linear to the sampling rate, not to the characteristics of the application under study. As such,STROBE can be used in a production environment without disrupting normal operations. However,for our needs this sampling technique seems to be a bad fit. Sampling provides no guarantee on
7http://www.compuware.com/solutions/strobe.asp
79
CHAPTER 6. FEATURE LOCATION
recovering all computational units that have been executed. Only those computational units inwhich ‘enough time’ is spent will be sampled. Here, the meaning of ‘enough time’ mostly dependson the sampling rate, i.e., how many times per minute STROBE will look at the application and logwhich computational unit is being executed.
Clearly, this approach is insufficient if one would, for example, want to trace the execution of eachprogram statement. However, in practice we might be able to increase the sampling rate to a pointwhere we would be able to trace all modules being executed.
To test this idea, we set up a quick feasibility study (pattern 10.1) to see whether the resulting sampledata set could be useful in practice. We created a scenario which involved using the web interfaceof an application and set the sampling rate of STROBE to its maximum, namely 150,000 samplesper minute or 2,500 samples per second. At the same time, we traced the transactions submittedfrom the web interface to the mainframe back-end. Remember from Section 6.1.4 (p.69) that atransaction is characterized by one main function compiled into a module and exposed to theoutside, which subsequently uses various sub-functions also compiled into separate modules. Afterexecuting the scenario, we extracted a report from the sample data set containing all the modulesthat had been sampled. We compared this list of modules to the list of transactions we monitored.The comparison showed us that the sample data set — not even taking into account sub-functions— missed some main functions.
Thus, using STROBE to obtain module level run-time information was not feasible on the applicationunder study because the maximal sampling rate was too low to identify all transactions, let alone allmodules. However, performing this Quick Feasibility Study (pattern 10.1) only cost us one man-day:not a high price to pay for the potential benefits of finding a built-in tool that can provide thenecessary data.
6.3.2 Dynamic Feature Location at Statement Level
After conducting the experiments on the Portfolio Management System, we decided to investigateanother system within the same organization, namely OSIRIS. One characteristic of the system isthat it has several very large programs. Taking into account our experience with the granularityissues on the Portfolio Management System, it was clear that finer granularity was needed. Hence,we set out to perform dynamic feature location on OSIRIS with statement-level granularity byInstrumenting the Source Code (pattern 9.3).
Solution in the small As a first step, we set out to build a proof of concept that would be able toinstrument a small part of the system, capture its execution and process the results in a meaningfulway. This feasibility study (pattern 10.1) had to show us quickly whether it was possible to get tothis fine-grained level of granularity before making a serious investment to apply it on the entiresystem.
Recall that OSIRIS is a system created with the CA GEN CASE TOOL, which generates COBOL
code that is compiled and run on the mainframe. As one of the few systems within the organization,it still runs on an old technical platform. Because of its dependence on CA GEN it has not yet
80
6.3. ATTEMPTED ADJUSTMENTS
been migrated to the new standard platform. As a drawback, this results in even less built-in toolsto use for tracing. On the positive side, it gives us a bit more flexibility as how to manipulate theenvironment since we don’t have to take into account impact on other systems. Furthermore, dueto the nature of the system, the data is of similar quality both in the DEV environment and the QA
environment. This means we can perform our experiments on the DEV environment.
Taking into account all the above characteristics, we decided our best option would be to instrumentthe source code (pattern 9.3) of the generated COBOL using DISPLAY statements. More specifically,each executed line of CA GEN code will be logged. This is feasible because the CA GEN CASE
TOOL keeps track of the CA GEN line numbers when generating the COBOL sources. Listing 6.1(p.82) shows two CA GEN statements with original line numbers 8 and 9, which are transformed bythe CA GEN CASE TOOL to the COBOL code in Listing 6.2 (p.82). Notice the compute-statementson lines 1 and 3 of Listing 6.2 that clearly refer to line 8 and 9 of the CA GEN code by setting thevalue of a line counter variable. Thus, lines 4 to 17 are the COBOL counterpart of line 9 of CAGEN code. Listing 6.3 (p.82) shows how we have simply added a DISPLAY statement on lines 2and 5, that is, after each COBOL line that sets the CA GEN line counter variable, to capture thenecessary run-time information.
To perform the instrumentation of the generated COBOL source code, we use a very simplePERL script listed in Listing 6.4 (p.84). It searches for all lines containing this COMPUTE
LAST-STATEMENT-NUM-statement using a regular expression and adds a line to display thenecessary information. We download all generated COBOL source files from the mainframe to aUNIX machine, run the PERL script for each file and upload the instrumented source files back tothe mainframe where they are recompiled. Hence, when we run the system with the recompiledbinaries, output will be written to the SYSOUT on mainframe which we can collect after eachscenario.
We tested our technique on a handful of source files implementing some mainframe screens withwhich users can set and adjust archival settings of the system, i.e., when will data be archived. Itwas chosen as a technical proof of concept because it was small, self-contained and nobody wasworking on that part of the system so no ongoing maintenance activities would be disturbed.
As execution scenarios, we started the application and simply followed the options on the screens:adding a setting, modifying or removing an existing setting, inspecting (non-)existing settingsand stopping the application. Figure 6.7 (p.83) shows the resulting concept lattice. The gray boxesrepresent the executed scenarios, the white boxes represent the number of statements executed overall COBOL source files that have been instrumented. We did not relate features to the scenarios,because this was merely a technical proof of concept.
Now that we are working at the level of code statements, more effort should be invested in thepresentation of the results. Clearly, a list of line numbers is insufficient for comfortable analysis.We envision an integrated approach in which a concept lattice as in Figure 6.7 (p.83) is used asa navigation tool through the code. The user would be able to select one or more concepts thatrepresent a feature which will result in a list of affected modules. In each module, the affectedstatements would be highlighted. For example, Figure 6.8 (p.83) shows the ten (=2+8) lines of CAGEN code which have been executed during the ‘stop application’ scenario.
81
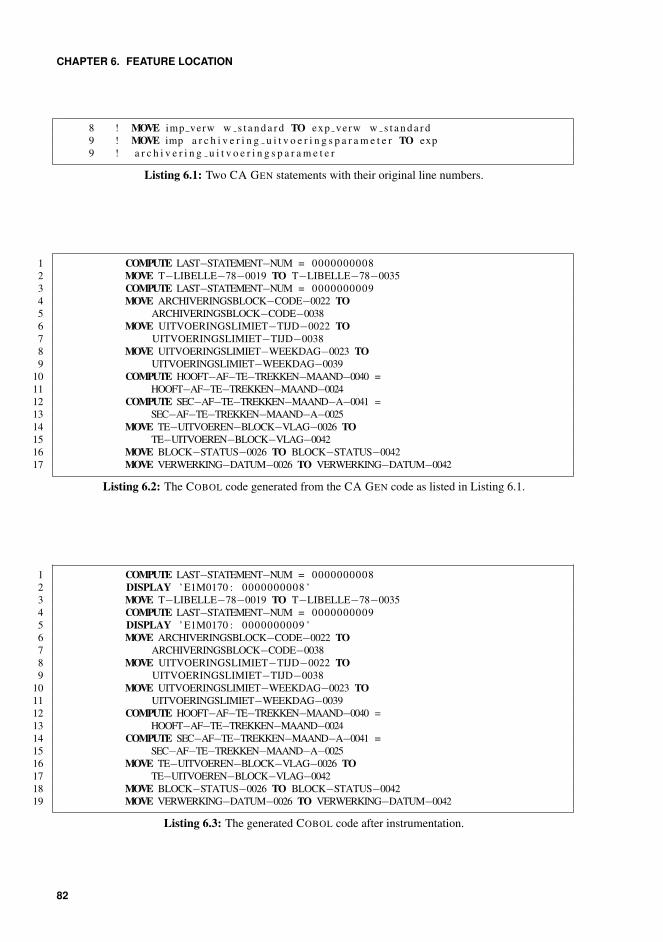
CHAPTER 6. FEATURE LOCATION
8 ! MOVE imp verw w s t a n d a r d TO exp verw w s t a n d a r d9 ! MOVE imp a r c h i v e r i n g u i t v o e r i n g s p a r a m e t e r TO exp9 ! a r c h i v e r i n g u i t v o e r i n g s p a r a m e t e r
Listing 6.1: Two CA GEN statements with their original line numbers.
1 COMPUTE LAST−STATEMENT−NUM = 00000000082 MOVE T−LIBELLE−78−0019 TO T−LIBELLE−78−00353 COMPUTE LAST−STATEMENT−NUM = 00000000094 MOVE ARCHIVERINGSBLOCK−CODE−0022 TO5 ARCHIVERINGSBLOCK−CODE−00386 MOVE UITVOERINGSLIMIET−TIJD−0022 TO7 UITVOERINGSLIMIET−TIJD−00388 MOVE UITVOERINGSLIMIET−WEEKDAG−0023 TO9 UITVOERINGSLIMIET−WEEKDAG−0039
10 COMPUTE HOOFT−AF−TE−TREKKEN−MAAND−0040 =11 HOOFT−AF−TE−TREKKEN−MAAND−002412 COMPUTE SEC−AF−TE−TREKKEN−MAAND−A−0041 =13 SEC−AF−TE−TREKKEN−MAAND−A−002514 MOVE TE−UITVOEREN−BLOCK−VLAG−0026 TO15 TE−UITVOEREN−BLOCK−VLAG−004216 MOVE BLOCK−STATUS−0026 TO BLOCK−STATUS−004217 MOVE VERWERKING−DATUM−0026 TO VERWERKING−DATUM−0042
Listing 6.2: The COBOL code generated from the CA GEN code as listed in Listing 6.1.
1 COMPUTE LAST−STATEMENT−NUM = 00000000082 DISPLAY ’E1M0170 : 0000000008 ’3 MOVE T−LIBELLE−78−0019 TO T−LIBELLE−78−00354 COMPUTE LAST−STATEMENT−NUM = 00000000095 DISPLAY ’E1M0170 : 0000000009 ’6 MOVE ARCHIVERINGSBLOCK−CODE−0022 TO7 ARCHIVERINGSBLOCK−CODE−00388 MOVE UITVOERINGSLIMIET−TIJD−0022 TO9 UITVOERINGSLIMIET−TIJD−0038
10 MOVE UITVOERINGSLIMIET−WEEKDAG−0023 TO11 UITVOERINGSLIMIET−WEEKDAG−003912 COMPUTE HOOFT−AF−TE−TREKKEN−MAAND−0040 =13 HOOFT−AF−TE−TREKKEN−MAAND−002414 COMPUTE SEC−AF−TE−TREKKEN−MAAND−A−0041 =15 SEC−AF−TE−TREKKEN−MAAND−A−002516 MOVE TE−UITVOEREN−BLOCK−VLAG−0026 TO17 TE−UITVOEREN−BLOCK−VLAG−004218 MOVE BLOCK−STATUS−0026 TO BLOCK−STATUS−004219 MOVE VERWERKING−DATUM−0026 TO VERWERKING−DATUM−0042
Listing 6.3: The generated COBOL code after instrumentation.
82
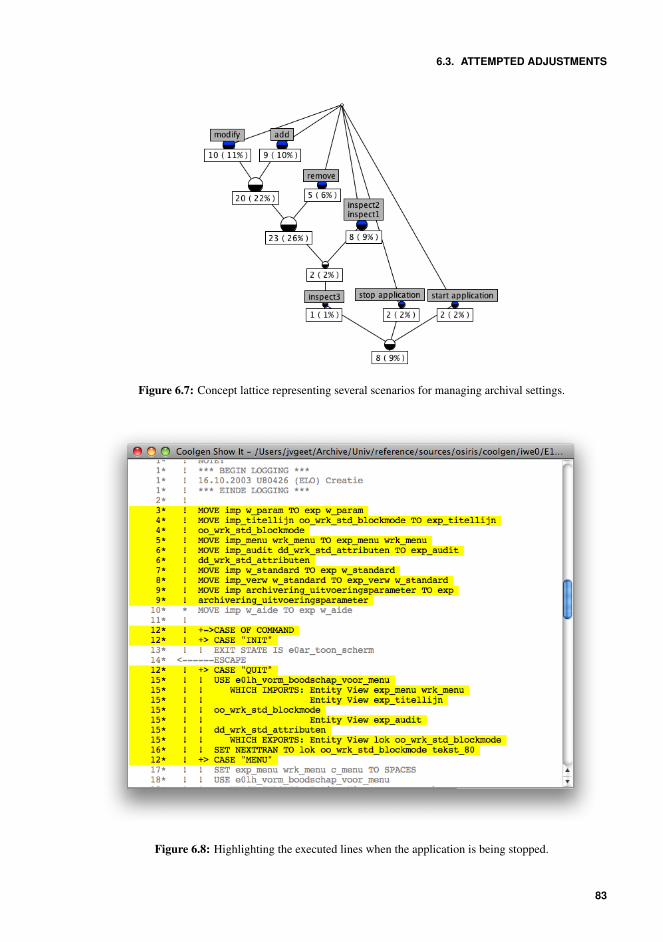
6.3. ATTEMPTED ADJUSTMENTS
Figure 6.7: Concept lattice representing several scenarios for managing archival settings.
Figure 6.8: Highlighting the executed lines when the application is being stopped.
83
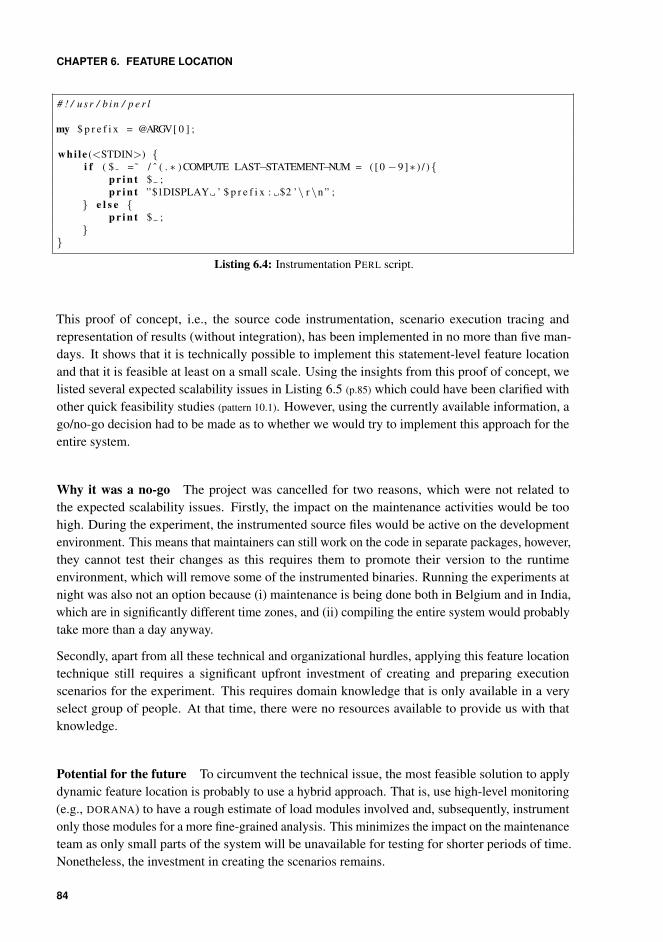
CHAPTER 6. FEATURE LOCATION
# ! / u s r / b i n / p e r l
my $ p r e f i x = @ARGV[ 0 ] ;
whi le (<STDIN>) {i f ( $ =˜ / ˆ ( . ∗ ) COMPUTE LAST−STATEMENT−NUM = ( [ 0 −9 ]∗ ) / ){
p r i n t $ ;p r i n t ”$1DISPLAY ’ $ p r e f i x : $2 ’\ r \n ” ;
} e l s e {p r i n t $ ;
}}
Listing 6.4: Instrumentation PERL script.
This proof of concept, i.e., the source code instrumentation, scenario execution tracing andrepresentation of results (without integration), has been implemented in no more than five man-days. It shows that it is technically possible to implement this statement-level feature locationand that it is feasible at least on a small scale. Using the insights from this proof of concept, welisted several expected scalability issues in Listing 6.5 (p.85) which could have been clarified withother quick feasibility studies (pattern 10.1). However, using the currently available information, ago/no-go decision had to be made as to whether we would try to implement this approach for theentire system.
Why it was a no-go The project was cancelled for two reasons, which were not related tothe expected scalability issues. Firstly, the impact on the maintenance activities would be toohigh. During the experiment, the instrumented source files would be active on the developmentenvironment. This means that maintainers can still work on the code in separate packages, however,they cannot test their changes as this requires them to promote their version to the runtimeenvironment, which will remove some of the instrumented binaries. Running the experiments atnight was also not an option because (i) maintenance is being done both in Belgium and in India,which are in significantly different time zones, and (ii) compiling the entire system would probablytake more than a day anyway.
Secondly, apart from all these technical and organizational hurdles, applying this feature locationtechnique still requires a significant upfront investment of creating and preparing executionscenarios for the experiment. This requires domain knowledge that is only available in a veryselect group of people. At that time, there were no resources available to provide us with thatknowledge.
Potential for the future To circumvent the technical issue, the most feasible solution to applydynamic feature location is probably to use a hybrid approach. That is, use high-level monitoring(e.g., DORANA) to have a rough estimate of load modules involved and, subsequently, instrumentonly those modules for a more fine-grained analysis. This minimizes the impact on the maintenanceteam as only small parts of the system will be unavailable for testing for shorter periods of time.Nonetheless, the investment in creating the scenarios remains.
84

6.3. ATTEMPTED ADJUSTMENTS
( 1 ) Mass Uploadi s s u e −− How easy i s i t t o up l oa d a b a t c h o f 10 ,000 f i l e s t o mainframe ?a l t e r n a t i v e −− I n s t r u m e n t t h e s o u r c e code on t h e mainframe i t s e l f .
( 2 ) S i n g l e Changeman Packagei s s u e −− A changeman package g e t s e x p o n e n t i a l l y s l o w e r wr t t h e number o f
members i n t h e package . I t c o u l d be i m p o s s i b l e i n p r a c t i c e t o commita l l changes i n one package
a l t e r n a t i v e −− One package p e r subsys tem , r e s u l t i n g i n more work ondependency management .
( 3 ) Mass C o m p i l a t i o ni s s u e −− How long w i l l i t t a k e t o r e c o m p i l e t h e e n t i r e sys tem . Rough
e s t i m a t e s say a day or l o n g e r .i s s u e −− What w i l l t h i s r e c o m p i l a t i o n c o s t i n t e r m s of CPU c y c l e s , which
a r e t y p i c a l l y a l s o c h a r g e d on mainframe ?a l t e r n a t i v e −− n / a
( 4 ) Trace Data S i z ei s s u e −− Simply d i s p l a y i n g each s t a t e m e n t e v e r y t ime i t i s e x e c u t e d c o u l d
l e a d t o ve ry l a r g e t r a c e s .a l t e r n a t i v e −− Implement a s m a r t e r t r a c i n g mechanism t h a n COBOL DISPLAY
s t a t e m e n t s . For example , r e p r e s e n t each s t a t e m e n t a s one b i t t h a t canbe t r u e o r f a l s e . Th i s w i l l p roduce e x e c u t i o n p r o f i l e s which a r el i n e a r wr t t o t h e s i z e o f t h e sys tem .
( 5 ) S c e n a r i o I s o l a t i o ni s s u e −− We need t o be a b l e t o i n d i c a t e s t a r t and end of a s c e n a r i o i n t h e
e x e c u t i o n t r a c e . C u r r e n t l y we manua l ly keep t r a c k of p o s i t i o n s i nt h e e x e c u t i o n t r a c e .
a l t e r n a t i v e −− R e d i r e c t and c l e a r SYSOUT a f t e r each s c e n a r i o i f p o s s i b l e .a l t e r n a t i v e −− Implement a program t h a t does n o t h i n g b u t p r i n t a d i v i d e r
l i n e t o SYSOUT .
Listing 6.5: Expected technical scalability issues
85
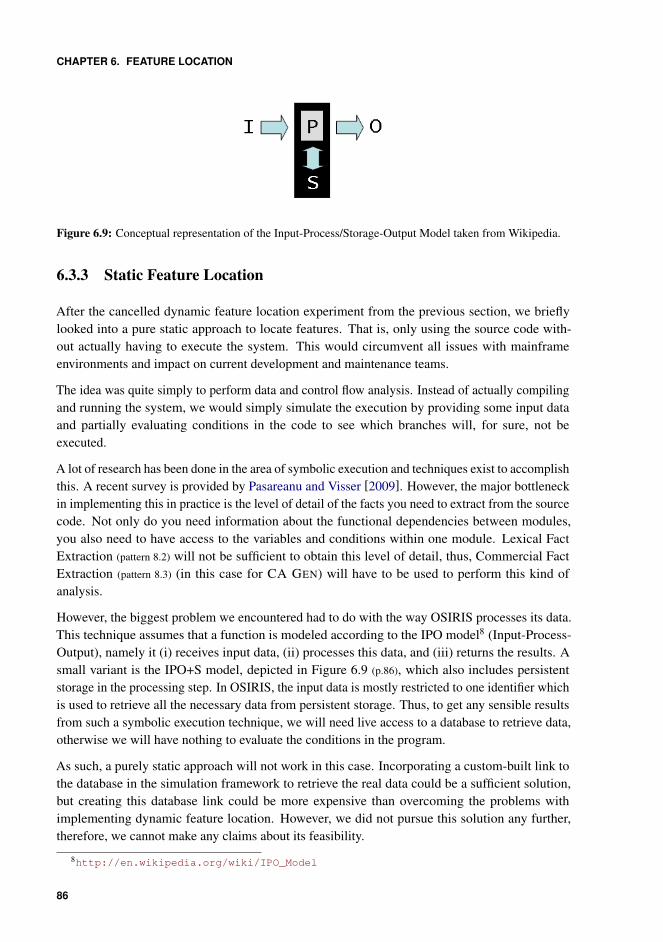
CHAPTER 6. FEATURE LOCATION
Figure 6.9: Conceptual representation of the Input-Process/Storage-Output Model taken from Wikipedia.
6.3.3 Static Feature Location
After the cancelled dynamic feature location experiment from the previous section, we brieflylooked into a pure static approach to locate features. That is, only using the source code with-out actually having to execute the system. This would circumvent all issues with mainframeenvironments and impact on current development and maintenance teams.
The idea was quite simply to perform data and control flow analysis. Instead of actually compilingand running the system, we would simply simulate the execution by providing some input dataand partially evaluating conditions in the code to see which branches will, for sure, not beexecuted.
A lot of research has been done in the area of symbolic execution and techniques exist to accomplishthis. A recent survey is provided by Pasareanu and Visser [2009]. However, the major bottleneckin implementing this in practice is the level of detail of the facts you need to extract from the sourcecode. Not only do you need information about the functional dependencies between modules,you also need to have access to the variables and conditions within one module. Lexical FactExtraction (pattern 8.2) will not be sufficient to obtain this level of detail, thus, Commercial FactExtraction (pattern 8.3) (in this case for CA GEN) will have to be used to perform this kind ofanalysis.
However, the biggest problem we encountered had to do with the way OSIRIS processes its data.This technique assumes that a function is modeled according to the IPO model8 (Input-Process-Output), namely it (i) receives input data, (ii) processes this data, and (iii) returns the results. Asmall variant is the IPO+S model, depicted in Figure 6.9 (p.86), which also includes persistentstorage in the processing step. In OSIRIS, the input data is mostly restricted to one identifier whichis used to retrieve all the necessary data from persistent storage. Thus, to get any sensible resultsfrom such a symbolic execution technique, we will need live access to a database to retrieve data,otherwise we will have nothing to evaluate the conditions in the program.
As such, a purely static approach will not work in this case. Incorporating a custom-built link tothe database in the simulation framework to retrieve the real data could be a sufficient solution,but creating this database link could be more expensive than overcoming the problems withimplementing dynamic feature location. However, we did not pursue this solution any further,therefore, we cannot make any claims about its feasibility.
8http://en.wikipedia.org/wiki/IPO_Model
86
6.4. SUMMARY
6.4 Summary
In this chapter we have applied the dynamic feature location technique by Eisenbarth et al. [2003]in the context of mainframe enterprise applications. Most of the difficulties we have encounteredare rooted in the assumption that one can lift the system under study from its natural habitat toinvestigate in isolation. In our context, this assumption is unrealistic at best. As such, the biggestissue with applying dynamic feature location is setting up sufficient infrastructure to capture thenecessary run-time information from the system under study with as little impact as possible to itsenvironment. The setup in our replication experiment accomplished this, but triggered a numberof other issue regarding isolation of scenarios and execution profiles and accuracy of results.Furthermore, although we confirmed that rapid iterations are the key to successful feature location,our setup endangers the ability to explore freely using iterative and incremental analysis.
Looking for other ways to obtain sufficient run-time information, we experienced that abusingexisting tools is not that easy and that both technical implications and organizational impactplay an import role. However, Quick Feasibility Studies (pattern 10.1) can help to discard certainpossibilities more quickly with more confidence, thereby decreasing the barrier to at least trying to(ab)use existing infrastructure. Furthermore, the patterns in Chapter 9 (p.117) give an overview ofpossible ways to capture run-time information, including a discussing of the trade-offs betweenthe different forces in play. As such, practitioners can use them to find a suitable mechanism intheir context.
87

CHAPTER 6. FEATURE LOCATION
88
Chapter 7
Redocumentation
Plans get you into things, but you’ve got to work your way out.— Will Rogers
Knowledge about a software system can be explicit or implicit. Explicit knowledge takes the formof documentation, which is tangible and reusable by other people. Implicit knowledge, on the otherhand, resides in the heads of the experts; it is less tangible and more difficult to reuse. Mechanisticorganizations, trying to industrialize the software development process as best as possible, strive tohave as much explicit knowledge as possible. However, as stated before, the availability of thisknowledge is often unsatisfactory, especially in legacy systems as experts retire, documentationgets outdated or is not there at all [Demeyer et al., 2008].
Redocumentation is the process of recovering (hence, the ‘re-’ prefix) documentation that existedor should have existed [Chikofsky and Cross, 1990]. It can be done manually or automatically.Manual redocumentation requires labour from the experts (original developers, maintainers,architects, users or others). It is tedious, error-prone, not intellectually stimulating and can onlybe applied if the experts are available. Automatic redocumentation seems much more promising,as it does not require manual labour [van Deursen and Kuipers, 1999]. Nonetheless, some thingscannot be automated.
As a reverse engineering technique, redocumentation is very much focussed on the data gatheringand knowledge organization activity, but not on the information exploration activity. As such,redocumentation is different from the previous two techniques discussed in this dissertation becauseit is all about recovering structural facts about the software system and explicitizing them in amore human-readable and accessible documentation format to enable subsequent informationexploration. Thus, real comprehension, which is inevitably a human process, is not part of thisreverse engineering technique.
Thus, documentation enables comprehension, which is essential to efficiently evolve and maintain
CHAPTER 7. REDOCUMENTATION
a software system. Since the documentation is typically lacking or out of date, we set out to studythe applicability of redocumentation in the context of mainframe enterprise applications. As such,we report about a redocumentation experience from the field which provides insights on what to(and what not to) automate and how to accomplish this. The chapter is structured as follows. InSection 7.1 (p.90) we present more details about the context in which this study was performed.Afterwards, in Section 7.2 (p.92), we sketch the redocumentation process we applied and we finishwith an overview of all lessons we learned in Section 7.3 (p.97). The purpose of these lessons istwofold: first, practitioners (e.g., technical designers and maintainers) can use them to improve theusability, quality and maintainability of the documentation they create; second, researchers can usethem to improve their (re)documentation tools and methods.
7.1 Project Context
This section establishes a context in which the study was performed. It elaborates on the organiza-tion and its typical development methods, illustrating the need for documentation. Furthermore, itexplains the documentation standards within the organization, some specifics about the systemunder study and the actual goals of the redocumentation effort.
7.1.1 Organization
As explained before organizations either have a more flexible organic culture or a more structuredmechanistic culture [Burns and Stalker, 1994]. This dissertation focusses on organizations thatadopt a mechanistic culture thereby favoring a more structured, industrial approach to the softwaredevelopment lifecycle. This results in strict rules and standard operating procedures in which allemployees have clearly defined responsibilities. Communication between these units of labour istypically facilitated by comprehensive documentation [Vinekar and Huntley, 2010].
The maintenance of the system on which we report, will soon be outsourced in order to cutexpenses [Tas and Sunder, 2004]. In general, it is more and more common to outsource or off-shoreparts of the development process, such as the maintenance [Ahmed, 2006]. Clearly, comprehensivedocumentation is a prerequisite here, because the subcontractor cannot fall back on the implicitknowledge which is present in the heads of the experts.
7.1.2 Documentation Standard
The organization uses an enterprise-wide documentation standard which is largely based onComponent Based UML [Cheesman and Daniels, 2000], tailored to the specific structure of typicalbanking applications. Furthermore, this standard is supported by MEGA1, a general purposedocumentation tool which is highly customizable. At its core it has only two notions: objectswith certain characteristics and links between objects with certain characteristics. To support
1http://www.mega.com/
90
7.1. PROJECT CONTEXT
the rigorous documentation process, the MEGA tool has been customized to support this tailoredversion of UML.
There are documentation guidelines for all phases of the software development life-cycle. On thedomain level, for example, diagrams are defined to document the business processes within thatdomain, indicate which parts of these processes are automated and which systems are responsiblefor it. On system-level, functional documentation is required in the form of use cases andconceptual data models. In turn, these have to be linked to technical documentation containing allfunctions, database tables, screens, batch jobs and the dependencies among them in several UMLclass diagrams. Furthermore, the purpose of each function is documented as a comment and thelogical steps within that function are documented in UML sequence diagrams.
Some parts of this information are easy to retrieve automatically, other parts are not. For example,it is usually possible to retrieve technical data dependencies from the source code, but one cannotautomatically retrieve the logical steps of a program from the source code because this requireshuman interpretation.
7.1.3 System under Study
The system under study is the Custody Services Back-end as introduced in Section 4.3 (p.30). Itis largely implemented in CA GEN, a CASE tool which stores its information not in plain textsource code but in a dedicated, proprietary repository.
The system is currently undergoing a technical conversion for two reasons. First, it aims to moveaway from the CA GEN environment, which will no longer be supported, and replace it with EGL,a platform-independent, business-oriented language that is being introduced throughout the entireorganization. Second, it aims to move away from an outdated mainframe environment which iscurrently only being supported to run this one system created in CA GEN.
When the technical conversion project started, there was no documentation about OSIRIS availablein MEGA. However, since the maintenance being done on the current version of OSIRIS (inparallel with the technical conversion) is being outsourced, it is necessary to document the requiredchanges very well. Therefore, the MEGA documentation is created on an as-needed basis, i.e., if afunction needs change (1) the function is documented as-is, (2) the change is documented, and (3)the documentation is sent to the subcontractors for implementation. As such, some documentationis already available in the MEGA tool.
Although the documentation standard itself is very well documented and clearly articulates whichthings should be documented and how, there are two ways in which OSIRIS cannot adhere tothis standard. Firstly, the documentation standard has been created under the assumption thatmainframe systems will only be used on the back-end, i.e., without direct interaction with theend-user. This is indeed a policy being pushed within the organization, however, our legacy systemstill uses mainframe screens to interact with end-users. These screens are not provided in thedocumentation standard. Secondly, a subsystem is defined as a set of data and a set of functionsworking on that data. Functions can be exposed to other systems but the data will always beencapsulated within the subsystem (much like with component based development). However,
91
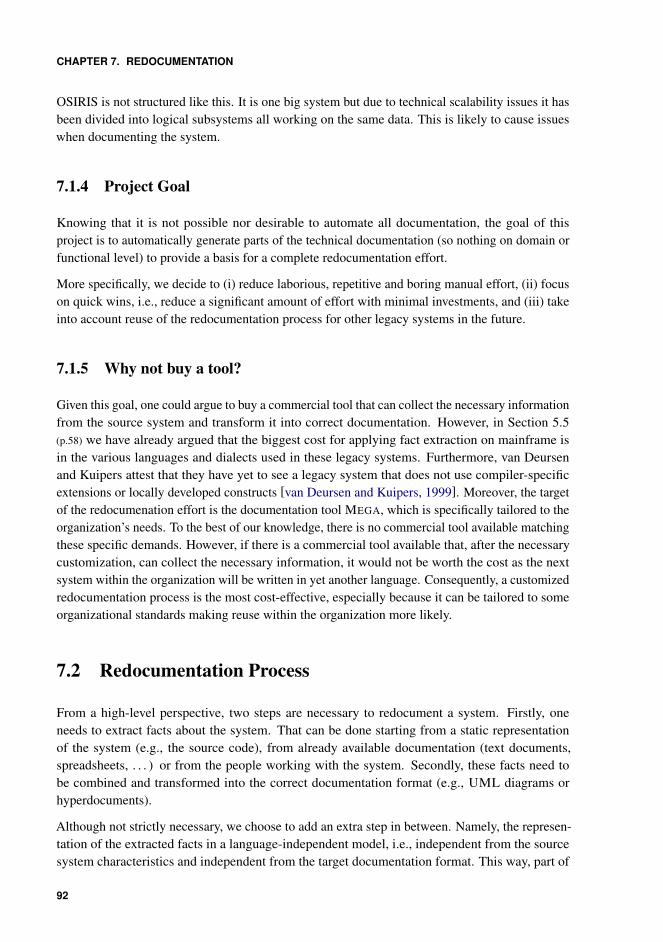
CHAPTER 7. REDOCUMENTATION
OSIRIS is not structured like this. It is one big system but due to technical scalability issues it hasbeen divided into logical subsystems all working on the same data. This is likely to cause issueswhen documenting the system.
7.1.4 Project Goal
Knowing that it is not possible nor desirable to automate all documentation, the goal of thisproject is to automatically generate parts of the technical documentation (so nothing on domain orfunctional level) to provide a basis for a complete redocumentation effort.
More specifically, we decide to (i) reduce laborious, repetitive and boring manual effort, (ii) focuson quick wins, i.e., reduce a significant amount of effort with minimal investments, and (iii) takeinto account reuse of the redocumentation process for other legacy systems in the future.
7.1.5 Why not buy a tool?
Given this goal, one could argue to buy a commercial tool that can collect the necessary informationfrom the source system and transform it into correct documentation. However, in Section 5.5(p.58) we have already argued that the biggest cost for applying fact extraction on mainframe isin the various languages and dialects used in these legacy systems. Furthermore, van Deursenand Kuipers attest that they have yet to see a legacy system that does not use compiler-specificextensions or locally developed constructs [van Deursen and Kuipers, 1999]. Moreover, the targetof the redocumenation effort is the documentation tool MEGA, which is specifically tailored to theorganization’s needs. To the best of our knowledge, there is no commercial tool available matchingthese specific demands. However, if there is a commercial tool available that, after the necessarycustomization, can collect the necessary information, it would not be worth the cost as the nextsystem within the organization will be written in yet another language. Consequently, a customizedredocumentation process is the most cost-effective, especially because it can be tailored to someorganizational standards making reuse within the organization more likely.
7.2 Redocumentation Process
From a high-level perspective, two steps are necessary to redocument a system. Firstly, oneneeds to extract facts about the system. That can be done starting from a static representationof the system (e.g., the source code), from already available documentation (text documents,spreadsheets, . . . ) or from the people working with the system. Secondly, these facts need tobe combined and transformed into the correct documentation format (e.g., UML diagrams orhyperdocuments).
Although not strictly necessary, we choose to add an extra step in between. Namely, the represen-tation of the extracted facts in a language-independent model, i.e., independent from the sourcesystem characteristics and independent from the target documentation format. This way, part of
92
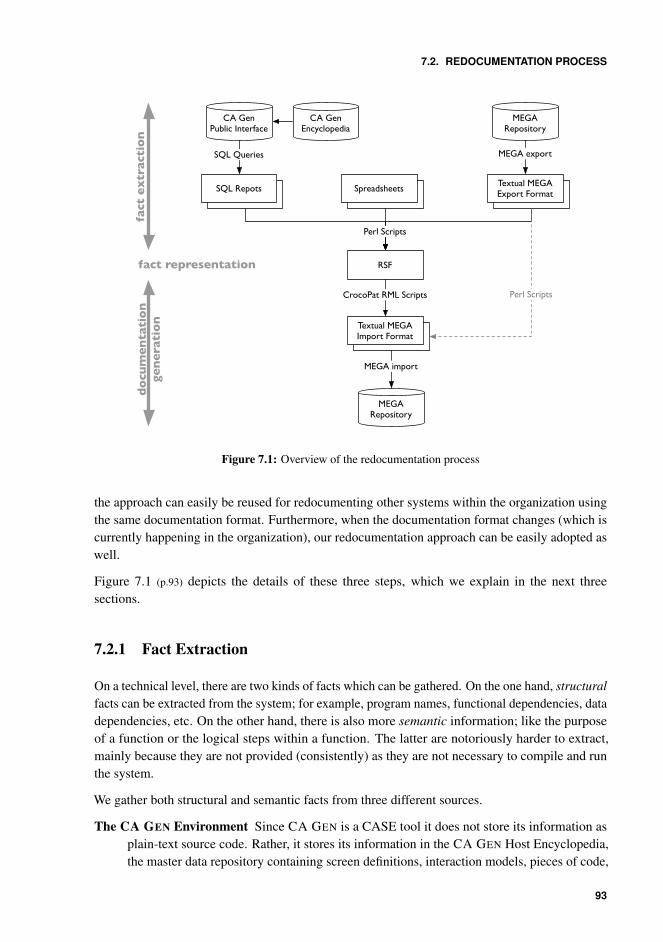
7.2. REDOCUMENTATION PROCESS
MEGA Repository
CA Gen Encyclopedia
CA Gen Public Interface
SQL RepotsSQL Repots
Excel SheetsSpreadsheets
Excel SheetsTextual MEGA Export Format
RSF
Excel SheetsTextual MEGA Import Format
MEGA Repository
SQL Queries
Perl Scripts
CrocoPat RML Scripts
MEGA export
MEGA import
Perl Scripts
fact
ex
trac
tio
n
fact representation
do
cum
en
tati
on
gen
era
tio
n
Figure 7.1: Overview of the redocumentation process
the approach can easily be reused for redocumenting other systems within the organization usingthe same documentation format. Furthermore, when the documentation format changes (which iscurrently happening in the organization), our redocumentation approach can be easily adopted aswell.
Figure 7.1 (p.93) depicts the details of these three steps, which we explain in the next threesections.
7.2.1 Fact Extraction
On a technical level, there are two kinds of facts which can be gathered. On the one hand, structuralfacts can be extracted from the system; for example, program names, functional dependencies, datadependencies, etc. On the other hand, there is also more semantic information; like the purposeof a function or the logical steps within a function. The latter are notoriously harder to extract,mainly because they are not provided (consistently) as they are not necessary to compile and runthe system.
We gather both structural and semantic facts from three different sources.
The CA GEN Environment Since CA GEN is a CASE tool it does not store its information asplain-text source code. Rather, it stores its information in the CA GEN Host Encyclopedia,the master data repository containing screen definitions, interaction models, pieces of code,
93
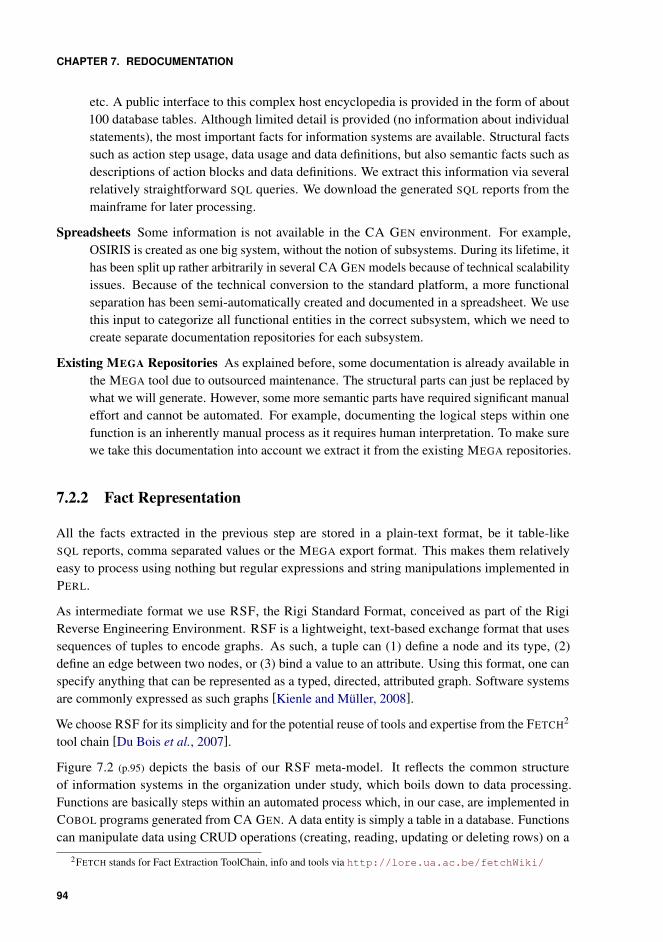
CHAPTER 7. REDOCUMENTATION
etc. A public interface to this complex host encyclopedia is provided in the form of about100 database tables. Although limited detail is provided (no information about individualstatements), the most important facts for information systems are available. Structural factssuch as action step usage, data usage and data definitions, but also semantic facts such asdescriptions of action blocks and data definitions. We extract this information via severalrelatively straightforward SQL queries. We download the generated SQL reports from themainframe for later processing.
Spreadsheets Some information is not available in the CA GEN environment. For example,OSIRIS is created as one big system, without the notion of subsystems. During its lifetime, ithas been split up rather arbitrarily in several CA GEN models because of technical scalabilityissues. Because of the technical conversion to the standard platform, a more functionalseparation has been semi-automatically created and documented in a spreadsheet. We usethis input to categorize all functional entities in the correct subsystem, which we need tocreate separate documentation repositories for each subsystem.
Existing MEGA Repositories As explained before, some documentation is already available inthe MEGA tool due to outsourced maintenance. The structural parts can just be replaced bywhat we will generate. However, some more semantic parts have required significant manualeffort and cannot be automated. For example, documenting the logical steps within onefunction is an inherently manual process as it requires human interpretation. To make surewe take this documentation into account we extract it from the existing MEGA repositories.
7.2.2 Fact Representation
All the facts extracted in the previous step are stored in a plain-text format, be it table-likeSQL reports, comma separated values or the MEGA export format. This makes them relativelyeasy to process using nothing but regular expressions and string manipulations implemented inPERL.
As intermediate format we use RSF, the Rigi Standard Format, conceived as part of the RigiReverse Engineering Environment. RSF is a lightweight, text-based exchange format that usessequences of tuples to encode graphs. As such, a tuple can (1) define a node and its type, (2)define an edge between two nodes, or (3) bind a value to an attribute. Using this format, one canspecify anything that can be represented as a typed, directed, attributed graph. Software systemsare commonly expressed as such graphs [Kienle and Muller, 2008].
We choose RSF for its simplicity and for the potential reuse of tools and expertise from the FETCH2
tool chain [Du Bois et al., 2007].
Figure 7.2 (p.95) depicts the basis of our RSF meta-model. It reflects the common structureof information systems in the organization under study, which boils down to data processing.Functions are basically steps within an automated process which, in our case, are implemented inCOBOL programs generated from CA GEN. A data entity is simply a table in a database. Functionscan manipulate data using CRUD operations (creating, reading, updating or deleting rows) on a
2FETCH stands for Fact Extraction ToolChain, info and tools via http://lore.ua.ac.be/fetchWiki/
94
7.2. REDOCUMENTATION PROCESS
Module
Function Data
FunctionBelongsToModule DataBelongsToModule
ModuleBelongsToModule
DataOperation(CRUD)
Invokes
Figure 7.2: Basic RSF meta-model
Function
Batch Online Reusable
Screen
implements
File Report
reads/writes generates public/private
Figure 7.3: Different functions within RSF meta-model
table and invoke other functions to delegate some of its work. Both functions and data entitiesbelong to a module, which in our case represents a part of a subsystem.
Figure 7.3 (p.95) shows the different kinds of functions that are available. A function can be (1) abatch job used in bulk data processing, (2) an online step represented by a mainframe screen forinteractive processing by a user, or (3) a reusable piece of functionality used by all three kindsof functions. A reusable function can either be public or private indicating whether or not it isan exposed functionality of the subsystem. A batch job typically reads and writes files in bulkand generates a report. These batch characteristics are denoted in gray because they are not yetincorporated into our redocumentation process.
7.2.3 Documentation Generation
After collecting all facts of OSIRIS in one RSF file, we process it to generate the desired documenta-tion format. For this, we use CROCOPAT, a graph query engine by Dirk Beyer [Beyer et al., 2005].It supports the querying of large software models in RSF using PROLOG-like Relation Manipu-lation Language (RML) scripts. This way we can, for example, easily extract all the differentinteractions of a specific function, or an entire call-graph starting from an online screen.
Of course, for documentation purposes, this information has to be loaded into a documentationtool. For this, we use the textual MEGA input format. In essence, this is no more than a sequence of.Create and .Connect statements, to add certain objects to the MEGA repository and connect
95
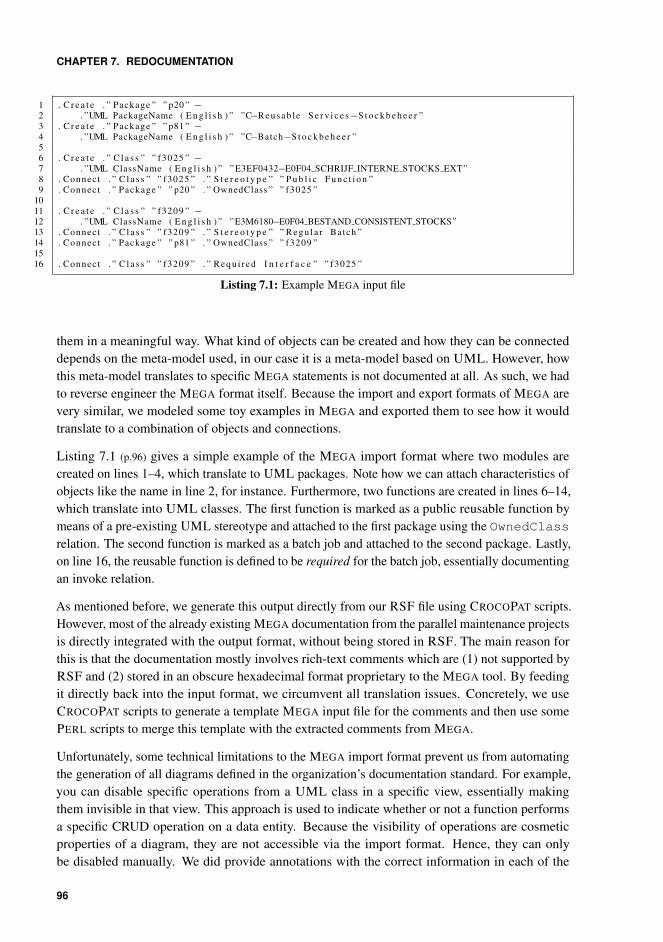
CHAPTER 7. REDOCUMENTATION
1 . C r e a t e . ” Package ” ” p20 ” −2 . ”UML PackageName ( E n g l i s h ) ” ”C−R e u s a b l e S e r v i c e s−S t o c k b e h e e r ”3 . C r e a t e . ” Package ” ” p81 ” −4 . ”UML PackageName ( E n g l i s h ) ” ”C−Batch−S t o c k b e h e e r ”56 . C r e a t e . ” C l a s s ” ” f3025 ” −7 . ”UML ClassName ( E n g l i s h ) ” ” E3EF0432−E0F04 SCHRIJF INTERNE STOCKS EXT”8 . Connect . ” C l a s s ” ” f3025 ” . ” S t e r e o t y p e ” ” P u b l i c F u n c t i o n ”9 . Connect . ” Package ” ” p20 ” . ” OwnedClass ” ” f3025 ”
1011 . C r e a t e . ” C l a s s ” ” f3209 ” −12 . ”UML ClassName ( E n g l i s h ) ” ”E3M6180−E0F04 BESTAND CONSISTENT STOCKS”13 . Connect . ” C l a s s ” ” f3209 ” . ” S t e r e o t y p e ” ” R e g u l a r Batch ”14 . Connect . ” Package ” ” p81 ” . ” OwnedClass ” ” f3209 ”1516 . Connect . ” C l a s s ” ” f3209 ” . ” R e q u i r e d I n t e r f a c e ” ” f3025 ”
Listing 7.1: Example MEGA input file
them in a meaningful way. What kind of objects can be created and how they can be connecteddepends on the meta-model used, in our case it is a meta-model based on UML. However, howthis meta-model translates to specific MEGA statements is not documented at all. As such, we hadto reverse engineer the MEGA format itself. Because the import and export formats of MEGA arevery similar, we modeled some toy examples in MEGA and exported them to see how it wouldtranslate to a combination of objects and connections.
Listing 7.1 (p.96) gives a simple example of the MEGA import format where two modules arecreated on lines 1–4, which translate to UML packages. Note how we can attach characteristics ofobjects like the name in line 2, for instance. Furthermore, two functions are created in lines 6–14,which translate into UML classes. The first function is marked as a public reusable function bymeans of a pre-existing UML stereotype and attached to the first package using the OwnedClassrelation. The second function is marked as a batch job and attached to the second package. Lastly,on line 16, the reusable function is defined to be required for the batch job, essentially documentingan invoke relation.
As mentioned before, we generate this output directly from our RSF file using CROCOPAT scripts.However, most of the already existing MEGA documentation from the parallel maintenance projectsis directly integrated with the output format, without being stored in RSF. The main reason forthis is that the documentation mostly involves rich-text comments which are (1) not supported byRSF and (2) stored in an obscure hexadecimal format proprietary to the MEGA tool. By feedingit directly back into the input format, we circumvent all translation issues. Concretely, we useCROCOPAT scripts to generate a template MEGA input file for the comments and then use somePERL scripts to merge this template with the extracted comments from MEGA.
Unfortunately, some technical limitations to the MEGA import format prevent us from automatingthe generation of all diagrams defined in the organization’s documentation standard. For example,you can disable specific operations from a UML class in a specific view, essentially makingthem invisible in that view. This approach is used to indicate whether or not a function performsa specific CRUD operation on a data entity. Because the visibility of operations are cosmeticproperties of a diagram, they are not accessible via the import format. Hence, they can onlybe disabled manually. We did provide annotations with the correct information in each of the
96
7.3. LESSONS LEARNED
UML diagrams so maintainers are reminded to fix it and can do so without needing additionalinformation.
7.3 Lessons Learned
In this section, we enumerate and explain the lessons we learned when applying the redocumenta-tion process of Section 7.2 (p.92) on the software system as explained in Section 7.1 (p.90). They areall based on observations we made in this real-life case. The purpose is twofold: first, practitionerscan use them to improve the usability, quality and maintainability of the documentation they create;second, researchers can use them to improve their (re)documentation tools and methods. Wepresent the lessons in an arbitrary order.
7.3.1 Only document relevant parts
While collaborating with the banking company, it became clear that they had only very limitedresources to spend on the creation and maintenance of documentation. This was quite surpris-ing, given that the banking company has a more mechanistic culture and adopts industrializedapproaches in which documentation is essential to the software development process.
Nevertheless, we were hard-pressed for time to automatically generate a basis which can be com-pleted manually (there is a strict deadline on which the manual documentation starts). Therefore,we had to prioritize the kind of views and documentation we would tackle first. Our initial thoughtwas to take the documentation standard of the organization and start with those things that are theeasiest to automate and the most mundane, repetitive and error-prone to do manually. However,this assumes that all views are equally important and should be there in the end anyway. In practicethis is not the case, especially because the documentation standards are not necessarily constructedby the people who actually create and maintain the documentation. Rather, the standard reflects anice to have view on documentation, but as long as the necessary resources are not available toactually produce the documentation, those parts with the most practical value should be tackledfirst.
The lesson we learn from these observations are twofold. Not only the effort of generating docu-mentation should be considered, but also the effort for maintaining the generated documentationhas to be taken into account when performing a (re)documentation effort. For those reasons, itseems that one should only document the parts that will be relevant and that will be maintained andkept up to date. A prioritization of what to document should be a part of the (re)documentationprocess.
7.3.2 Less is more
We observed that when performing automated redocumentation, it is very easy to get carriedaway and generate documentation just because you have access to the facts. More documentation,
97
CHAPTER 7. REDOCUMENTATION
however, is not always better. Feedback from the maintenance team learned us that there are twomotivations for avoiding an over-production of documentation. First, a huge amount of documen-tation might lead to an information overload for the users of the documentation, which makesthe documentation itself becomes less usable. Second, the trustworthiness of the documentationdecreases as huge documentation repositories have a reputation of not being maintained andconsequently are suspected of containing outdated information. This suspicion results in a furtherlack of commitment to keep the documentation up to date: a typical example of a self-fulfillingprophecy.
The lesson we learn from this observation is that we should not only ask whether we can generatethe documentation, but also whether we should. The main criteria should be whether or not thegenerated documentation will be used and whether or not it will be maintained. If the answerto any of those questions is no, the redocumentation effort will have been in vain resultingin documentation that will soon be outdated again. We conclude that one should only createdocumentation that will be used and maintained. It is best to have little documentation that is easyto understand and that can be fully trusted.
7.3.3 Make documentation usable
The system under study has a rather artificial structure in which one subsystem contains all the datathat is used by the other subsystems. As the documentation policy states that the description of thedata is only included in the subsystem defining the data and not in the subsystem using the data,all the documentation that explains the data is grouped into one repository. This is rather annoyingfrom a documentation point of view, where maintainers claim they would benefit more fromhaving the documentation available where they use or plan to use the data. Indeed, this hinders themaintenance process and makes the maintainers sometimes guess about the data documentationinstead of looking it up.
The lesson we learn here is that the structure of the documentation has to support the way it willbe used. The available information has to be easily accessible there where it is required.
7.3.4 Do not duplicate documentation
During redocumentation, we observed that the maintainers were not always satisfied with how thedocumentation was structured throughout the system. In Subsection 7.3.3 we already elaboratedon the situation in which the data documentation is only included in the subsystem where it isdefined, and not where it is used. To help the maintainers, we suggested to include the descriptionalso in the subsystems using the data. However, this suggestion was refused because this meansthat every time something changes about the data, the documentation potentially has to be updatedin nine different locations. Something even the maintainers admitted would not happen.
We learn that it is not a good approach to duplicate documentation, as this would increase themaintenance costs of the documentation. Moreover, it might bring along inconsistencies withinthe information specified in the multiple copies. Instead, we suggest to use references to the
98
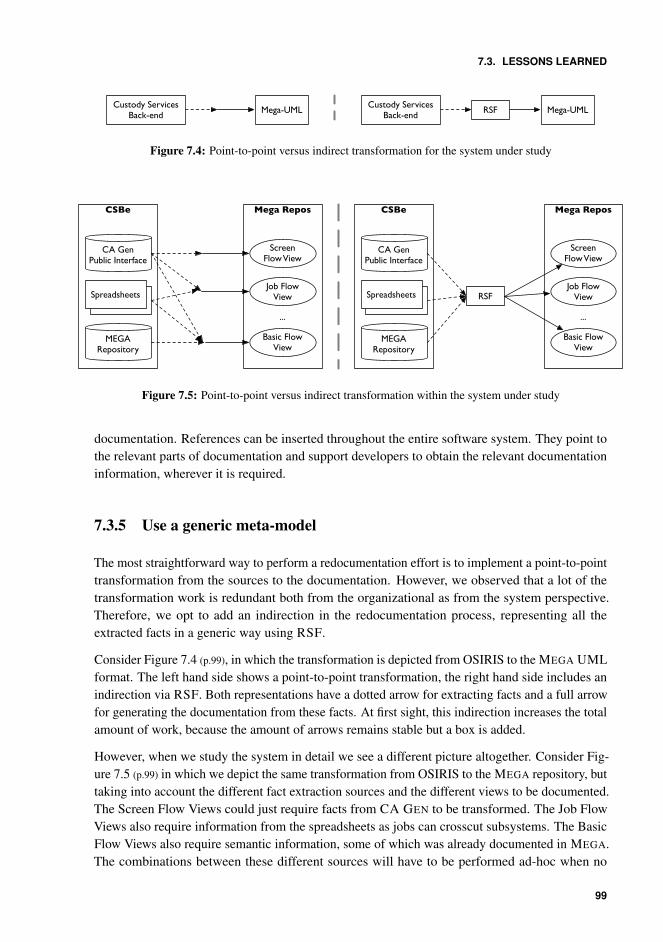
7.3. LESSONS LEARNED
Mega-UMLCustody Services Back-end RSF Mega-UMLCustody Services
Back-end
Figure 7.4: Point-to-point versus indirect transformation for the system under study
CSBe
MEGA Repository
CA GenPublic Interface
Excel SheetsSpreadsheets
Mega Repos
Screen Flow View
Job Flow View
Basic Flow View
...
CSBe
MEGA Repository
CA GenPublic Interface
Excel SheetsSpreadsheets RSF
Mega Repos
Screen Flow View
Job Flow View
Basic Flow View
...
Figure 7.5: Point-to-point versus indirect transformation within the system under study
documentation. References can be inserted throughout the entire software system. They point tothe relevant parts of documentation and support developers to obtain the relevant documentationinformation, wherever it is required.
7.3.5 Use a generic meta-model
The most straightforward way to perform a redocumentation effort is to implement a point-to-pointtransformation from the sources to the documentation. However, we observed that a lot of thetransformation work is redundant both from the organizational as from the system perspective.Therefore, we opt to add an indirection in the redocumentation process, representing all theextracted facts in a generic way using RSF.
Consider Figure 7.4 (p.99), in which the transformation is depicted from OSIRIS to the MEGA UMLformat. The left hand side shows a point-to-point transformation, the right hand side includes anindirection via RSF. Both representations have a dotted arrow for extracting facts and a full arrowfor generating the documentation from these facts. At first sight, this indirection increases the totalamount of work, because the amount of arrows remains stable but a box is added.
However, when we study the system in detail we see a different picture altogether. Consider Fig-ure 7.5 (p.99) in which we depict the same transformation from OSIRIS to the MEGA repository, buttaking into account the different fact extraction sources and the different views to be documented.The Screen Flow Views could just require facts from CA GEN to be transformed. The Job FlowViews also require information from the spreadsheets as jobs can crosscut subsystems. The BasicFlow Views also require semantic information, some of which was already documented in MEGA.The combinations between these different sources will have to be performed ad-hoc when no
99
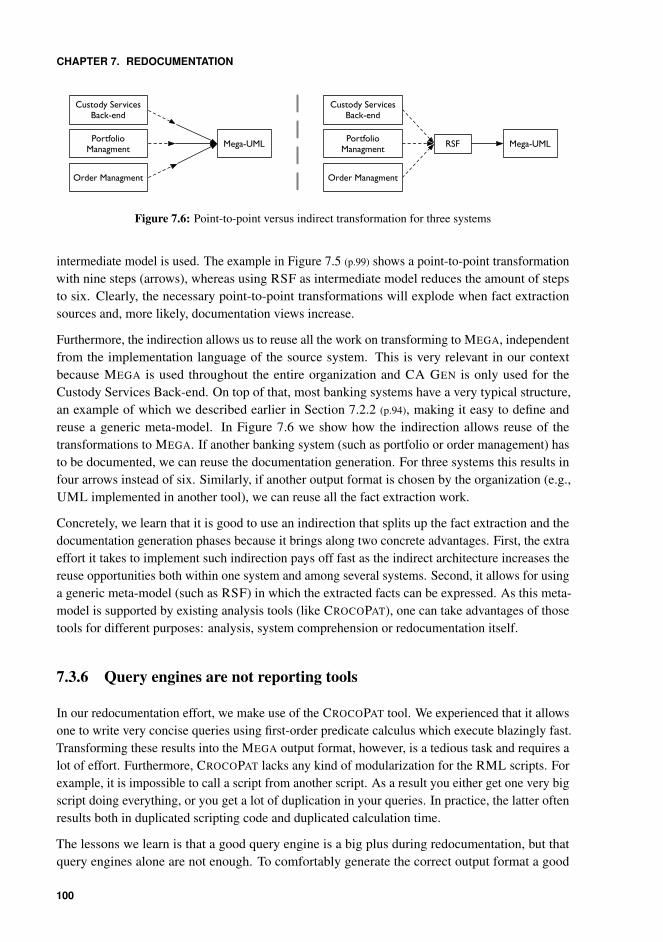
CHAPTER 7. REDOCUMENTATION
Mega-UML
Custody Services Back-end
Portfolio Managment
Order Managment
RSF Mega-UML
Custody Services Back-end
Portfolio Managment
Order Managment
Figure 7.6: Point-to-point versus indirect transformation for three systems
intermediate model is used. The example in Figure 7.5 (p.99) shows a point-to-point transformationwith nine steps (arrows), whereas using RSF as intermediate model reduces the amount of stepsto six. Clearly, the necessary point-to-point transformations will explode when fact extractionsources and, more likely, documentation views increase.
Furthermore, the indirection allows us to reuse all the work on transforming to MEGA, independentfrom the implementation language of the source system. This is very relevant in our contextbecause MEGA is used throughout the entire organization and CA GEN is only used for theCustody Services Back-end. On top of that, most banking systems have a very typical structure,an example of which we described earlier in Section 7.2.2 (p.94), making it easy to define andreuse a generic meta-model. In Figure 7.6 we show how the indirection allows reuse of thetransformations to MEGA. If another banking system (such as portfolio or order management) hasto be documented, we can reuse the documentation generation. For three systems this results infour arrows instead of six. Similarly, if another output format is chosen by the organization (e.g.,UML implemented in another tool), we can reuse all the fact extraction work.
Concretely, we learn that it is good to use an indirection that splits up the fact extraction and thedocumentation generation phases because it brings along two concrete advantages. First, the extraeffort it takes to implement such indirection pays off fast as the indirect architecture increases thereuse opportunities both within one system and among several systems. Second, it allows for usinga generic meta-model (such as RSF) in which the extracted facts can be expressed. As this meta-model is supported by existing analysis tools (like CROCOPAT), one can take advantages of thosetools for different purposes: analysis, system comprehension or redocumentation itself.
7.3.6 Query engines are not reporting tools
In our redocumentation effort, we make use of the CROCOPAT tool. We experienced that it allowsone to write very concise queries using first-order predicate calculus which execute blazingly fast.Transforming these results into the MEGA output format, however, is a tedious task and requires alot of effort. Furthermore, CROCOPAT lacks any kind of modularization for the RML scripts. Forexample, it is impossible to call a script from another script. As a result you either get one very bigscript doing everything, or you get a lot of duplication in your queries. In practice, the latter oftenresults both in duplicated scripting code and duplicated calculation time.
The lessons we learn is that a good query engine is a big plus during redocumentation, but thatquery engines alone are not enough. To comfortably generate the correct output format a good
100
7.3. LESSONS LEARNED
reporting tool is necessary to complement a query engine.
7.3.7 Be opportunistic when extracting facts
We choose to keep the fact extraction very lightweight. We extract most of the CA GEN facts usingSQL queries, limiting the information to what is available in the public interface of the host encyclo-pedia. All other necessary facts we extract using lexical techniques [Murphy and Notkin, 1996],for example, when processing already existing documentation. Performing a full syntactic analysisis not cost-effective, especially because this is a one-time operation, and no other systems use theCA GEN environment.
In general, we promote Opportunistic Fact Extraction (pattern 8.1), i.e., looking for tools in thedevelopment and build process that already do much of the hard work, and merge all these bits andpieces of information into a coherent model.
7.3.8 Not everything can/should be automated
We started out with the premise that as much as possible should be automated. Of course,some factors prevent full automation. Firstly, some type of information might be needed in thedocumentation but not available as facts to be extracted. For example, semantic information on thepurpose of some functions or how they represent real-world objects is not necessarily available inthe code or any other documentation. This kind of information requires human interpretation andis, thus, by default not automatable. Secondly, some technical limitations could prevent automationthat, in principle, should not pose a problem. For example, at the end of Section 7.2.3 (p.95) weexplain how the MEGA import format does not cover all features of the MEGA tool, necessitatingmanual corrections.
Besides the fact that some things are impossible to automate, it is not necessarily desirable toautomate all things that are possible. For example, the diagrams we import in MEGA lack a layout.They are drawn on the screen using a built-in layout algorithm which is not very human readable.It is possible to define the position of elements on a diagram, which we can use to create our ownlayout algorithm that would, to some extent, be more human readable. However, the investment ofcreating such an algorithm is bigger than manually layouting the diagrams on an as-needed basis.Especially because manual intervention will be necessary anyway.
We learn that full automatic redocumentation is not possible. Technical barriers and lackingsemantic information necessitate a human in the loop. Furthermore, full automation is notdesirable as the cost of automation can exceed the cost of doing it manually: only automate whatis cost-effective.
7.3.9 Get regular user feedback
Because we base ourselves on the documentation standard which is used throughout the entireorganization, it is not necessary to involve the users too much. In this case, users are those who
101
CHAPTER 7. REDOCUMENTATION
create, use and maintain the documentation. Nonetheless, we opted to include regular user feedbackbecause we made the following observations: (1) not all parts of the documentation standardare documented equally well, (2) mapping the legacy system constructs to the documentationstandard is not always straightforward, especially because the legacy system does not adhere toall organizational standards, (3) not all parts of the standard are equally maintainable in practice,so we had to prioritize based on usefulness, and (4) not all constructs, as defined in MEGA, arepossible to import automatically into MEGA, therefore some issues had to be flagged for manualfixing.
We learn that, although documentation standards are available in these kinds of organizations, it isstill best to work iteratively and include regular user feedback. This way, one can quickly focuson the most relevant parts, resolve system-specific oddities in consensus and omit irrelevant orharmful parts early in the process.
7.4 Summary
The availability and quality of software documentation is often unsatisfactory, especially for legacysystems. To overcome this problem one can recover documentation about the subject system usingautomatic and manual redocumentation. We report about a redocumentation experience fromthe field which provides insights on what to automate (and what not to) and how to accomplishthis.
We applied redocumentation on the Custody Services Back-end of a large Belgian bank, whichuses an enterprise-wide documentation standard based on UML implemented in MEGA (a generalpurpose documentation tool which is highly customizable). As the maintenance of this system isin the process of being outsourced, the organization needs to make sure that the documentation isup to date. Currently, there is very little documentation available about the system, and most of itis contained within the CA GEN environment which will become obsolete. Therefore, we wereasked to provide documentation within the MEGA tool. More specifically, we aim to (i) reducetedious manual effort, (ii) focus on quick wins, and (iii) take into account possible reuse of thetechnique on other systems.
Our redocumentation process consists of two phases. First, we extract facts about the system.For that, we use existing artifacts such as the source code, already available documentation andthe people working with the system. Second, we transform the extracted facts into the correctdocumentation format. We adopt an iterative approach, in which we frequently present our findingsto the experts. In turn, the experts provide feedback that we use to improve our redocumentationefforts.
Finally, we report on our experience with applying redocumentation techniques in this industrialsetting. Most notably, we learned that (1) not everything can be automated, nor should it be, (2)“less is more” also applies to (re)documentation, and (3) using a generic meta-model is not onlyadvantageous for reuse in later projects, but it also pays off for an isolated redocumentation effort.Both academics and practitioners can take advantage of the best practices represented by theselessons. While the latter can use them to improve the usability, quality and maintainability of the
102

7.4. SUMMARY
documentation they generate, the former can use them to improve their (re)documentation toolsand methods.
103

CHAPTER 7. REDOCUMENTATION
104

Part III
Patterns

Chapter 8
Fact Extraction
Perfectionism spells P-A-R-A-L-Y-S-I-S.— Winston Churchill
Documentation — if available at all — is unreliable at best. System experts are scarce, overworkedand tend to be close to retirement. Therefore, the system itself (and source code in particular) isthe only true source of information that will always be available1. However, plain-text source codecontains an abundance of information and can be tedious to interpret manually. Furthermore, mostanalysis techniques and tools require a more structured format as input. Therefore, facts need to beextracted from the source code to be more easily interpreted by humans and/or tools.
We define a fact as any piece of structural information about a software system that can be extractedor derived from the source code. This can range from the name of a system to the types of the localvariables in a function; from the name of the author of a piece of code to a complexity measure ofa module; from database dependencies to the control flow within a routine.
The problem we tackle in this chapter is how to obtain these facts from your system. This problemis difficult for several reasons.
Parsing is difficult Parsing and compiling a piece of code in a specific language is difficult, asevidenced by an entire research field on compiler technology. However, on the mainframe this ismade more difficult due to the several vendor-specific dialects of, for example, COBOL that haveorganically grown over the years. This makes it very difficult to create standard, reusable tools toparse one language.
Legacy comes with many languages Due to the long-living nature of the legacy systems,it is not uncommon for one system to use a mix of languages. Some are used for dedicated
1We assume the source code itself has not been lost. Although even then information can be extracted from eitherexecutables or a running system.
CHAPTER 8. FACT EXTRACTION
purposes, such as JCL for job control or SQL for querying databases and will be used in almostall systems. Others are more general purpose of nature and are used to implement the businesslogic. A wide variety of these 3GL and 4GL languages are used throughout a typical organizationwith no apparent consistency. Furthermore, these languages interact with each other, resulting incross-language dependencies which adds another level of complexity to the problem.
Forces
Furthermore, several forces are at play that need to be balanced.
Granularity Do you just need a list of all your functions, or do you also need the dependenciesbetween them? Is a list of identifiers enough or do you also need the function arguments andreturn type? What about the data? Will it suffice to have an overview of all the persistent data ordo you need information on all variables, their scope and how they interact with the functions?Is every little statement important or are you actually just looking for a broad overview of yourapplication portfolio? Facts occur on all levels of abstraction, depending on the detail requiredyour fact extraction methods can vary a lot.
Precision How important is the precision of the extracted facts for you? Will the world end whenyour automatic fact extraction misses two of your 5000 function because of an exotic languageconstruct. If you just need the facts to monitor trends in quality indicators, then these two skippedfunctions won’t make that much of a difference, especially when you consistently ignore thesefunctions over time. On the other hand, if you need it for very fine grained impact or dead codeanalysis, these two imprecisions might even inhibit the execution of the analysis.
Resources How much time, effort and money are you willing to put into it? Is this a one-timedeal because the facts will never change? In that case you might even consider gathering factsmanually instead of buying a package you will use once. On the other hand, the enormous size ofthe system might make manual extraction prohibitively expensive and buying a package might bethe more economic option. Or maybe it concerns a critical yet volatile part of your business thatneeds constant monitoring, for which a serious investment is more than warranted.
Overview
Figure 9.1 (p.119) shows an overview of the Fact Extraction patterns and how they can be applied.When in need of certain facts, one should always try to Gather Available Facts (pattern 8.1) first. Ifthis is not feasible or sufficient, one can complement the available facts by Performing Text-BasedFact Extraction (pattern 8.2) using lexical techniques on the source code. Only when this is does notprovide sufficient information, one should consider Buying a Commercial Fact Extractor (pattern 8.3).Furthermore, to evaluate the feasibility of Gathering Available Facts (pattern 8.1) and PerformingText-Based Fact Extraction (pattern 8.2), one can use Quick Feasibility Studies (pattern 10.1).
108
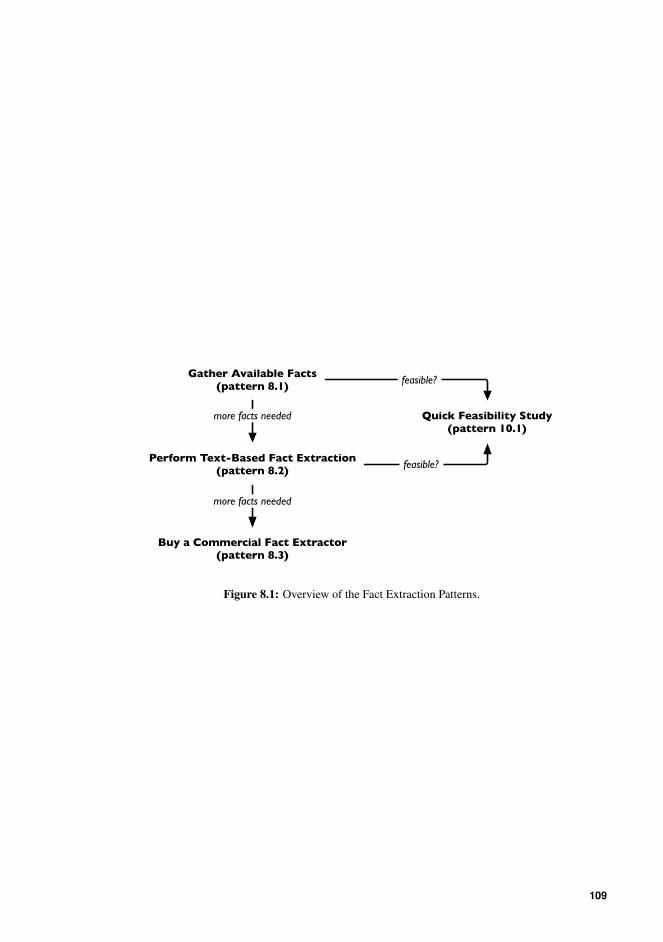
Gather Available Facts(pattern 8.1)
Perform Text-Based Fact Extraction(pattern 8.2)
Buy a Commercial Fact Extractor(pattern 8.3)
Quick Feasibility Study(pattern 10.1)
feasible?
feasible?
more facts needed
more facts needed
Figure 8.1: Overview of the Fact Extraction Patterns.
109
CHAPTER 8. FACT EXTRACTION
8.1 Gather Available Facts
also known as ‘Opportunistic Fact Extraction’
ProblemHow can you obtain the necessary facts about a software system without having to fully analyzethe source code yourself?
This problem is difficult because
• the source code provides a lot of detailed information requiring a lot of work to fully extract,• one software system can use many implementation languages.
Yet, solving this problem is feasible because
• you don’t need all the details, a limited amount of information is enough to answer yourquestion,
• build and management tools already parse and interpret the source code. Some of thatinformation is available to you.
SolutionGather already available facts about a software system that have been obtained by other tools inyour standard development process.
For example:
• Your change management environment can give you a listing of all your compilation units.• During the build process, some cross-reference information will most likely be collected
by the change management environment. Although access to this information is usuallythrough an application with limited functionality, a customized SQL query directly on thecorrect database tables will get you the bare data.
• Some parsers have an option to dump an internal representation of the code (a parse tree).In that case, the parser has done all the hard work, you just need to interpret the dump.For example, most COBOL compilers accept the XREF compiler option to dump a cross-reference report.
Hint Make sure you establish a good relationship with the supporting departments in yourorganization. For some of these options you will have to cooperate with technical operators to getthe necessary clearance. They might also be able to point you to other options you don’t knowabout.
Trade-offs+ Since these tools are used to build your system, you know the information they provide is
correct, i.e., there will be no imprecisions.
110
8.1. GATHER AVAILABLE FACTS
+ These tools are available for all languages you use in the build process (although optionsmay vary).
+ Depending on what is available, you might gain access to many facts with little or noinvestment.
– Not all tools provide this internal information. Even if they do, it is usually just partialinformation. You are limited to what they expose.
– You will still need to glue together all the information you gather from different tools.– Information about the tools is usually very limited, especially when you want to use them in
an exotic way.
Known UsesIn Section 5.5.1 (p.59) we explain how we gathered available facts from the mainframe changemanagement environment for the Portfolio Management System. This change managementenvironment keeps track of language-independent cross-reference information which was importantbecause the Portfolio Management System was implemented with a mix of APS (1.2M lines) andVAG (1.8M lines). This saved us the cost of extracting facts for each language separately.
In Chapter 7 (p.89) we gathered facts from various sources to redocument OSIRIS. Most notably,we created SQL queries to extract facts directly from the exposed representation of the CASE toolCA GEN in which OSIRIS is mainly implemented. Although it did not contain all the informationwe needed, it set us well on our way.
FETCH2 is an open source fact extraction tool chain that is built on the philosophy of reusing andabusing existing tools and glueing them together to obtain the necessary information and analyzeit appropriately. For fact extraction, it mainly relies on SOURCENAVIGATOR3, a multi-languageIDE project initiated by Red Hat. The main advantage of the IDE is its robustness against variouslanguage constructs and dialects. Furthermore, it also incorporates various metrics calculation toolsto complement the information from SOURCENAVIGATOR. As such, FETCH has been successfullyused in industry to analyze various C and C++ systems [Du Bois et al., 2007].
Related PatternsConsider conducting a Quick Feasibility Study (pattern 10.1) to see whether a certain facility canget you the required facts. If not all facts are available you can Perform Text-Based Fact Extrac-tion (pattern 8.2) or Buy a Commercial Fact Extractor (pattern 8.3) to complete your set of necessaryfacts.
2FETCH stands for Fact Extraction ToolChain, info and tools via http://lore.ua.ac.be/fetchWiki/3http://sourcenav.sourceforge.net/
111
CHAPTER 8. FACT EXTRACTION
8.2 Perform Text-Based Fact Extraction
also known as ‘Lexical Fact Extraction’
ProblemHow can you obtain the necessary facts from the source code of a software system without havingto fully analyze the source code yourself?
This problem is difficult because
• the source code provides a lot of detailed information requiring a lot of work to fully extract,• one software system can use many implementation languages.
Yet, solving this problem is feasible because
• you don’t need all the details, a limited amount of information is enough to answer yourquestion,
• most programming languages use some constructs and keywords that are easily recognizable.
SolutionUse simple text processing tools to extract facts from the free-form source code.
The most simple example of this are text-based search tools such as GREP4 for UNIX like systems orthe SCAN command for mainframe. To use this for fact extraction, a certain degree of automationis desirable. Lightweight scripting languages with support for regular expressions (or anythingelse that matches textual patterns) are perfect for this.
Support for regular expressions is commonplace in UNIX based system, but not on mainframesystems. Nonetheless, we know of some powerful string manipulation commands in REXX thatcould be sufficient.
Hint To process the source code with UNIX based tools, you will have to download the sourcesfrom mainframe. Most emulators provide a way to download files separately. However, this isinfeasible to download the sources of an entire software system. FTP access to download files inbulk is usually possible. Ask the supporting departments how to set it up.
Trade-offs+ More robust against syntactic variations and exotic language constructs. Therefore, more
likely to be reusable in other systems as well.+ Requires significantly less resources and commitment than parsing an entire language.– There is a limit to the detail of the facts extracted like this. You will, for example, not always
have enough information to perform reliable data or control flow analysis.– This will most likely result in an incomplete model with many imprecisions.
4http://www.gnu.org/software/grep/
112
8.2. PERFORM TEXT-BASED FACT EXTRACTION
Known UsesFor the Document Generation and Management System in Section 5.2.1 (p.37), we have extractedfunctional dependencies between COBOL programs essentially by searching for the string ‘CALLprogramName’ in all the source files. Afterwards we related the names of the COBOL files to theprogram names in the CALL statements. While this was not perfect (some filtering had to be done)it was blazingly fast and served our purpose.
[van Deursen and Kuipers, 1998] have used similar lexical analysis techniques to perform rapidsystem understanding for two COBOL systems from the financial services industry. The mainbenefit they articulate is the flexibility of lexical analysis. They have also experienced this flexibilitywhen extracting functional dependencies. One system used an indirection via an ASSEMBLER
program to invoke other programs. Therefore, the CALL statements had to be interpreted differently.The other system used CICS constructs which essentially provides two other ways to invokeprograms. Their fact extraction method based on lexical analysis was easily adapted to incorporatethese exotic constructs. They attest that this would not have been so easy to do with the twocommercial solutions they were investigating simultaneously.
[Murphy and Notkin, 1996] have created a lexical source model extractor which allows for easy,hierarchical pattern matching based on regular expressions. They have used it to extract implicitinvokes in the FIELD programming environment 5. These implicit invokes are used to elegantlycombine a combination of tools within the environment. But they were not extracted by any toolon the market. They the advantages over a parse-tree based tool as more robust, more flexible,easier to implement and faster to execute. On the downside, these lexical techniques are, of course,less precise and less complete.
Related PatternsThis pattern works particularly well in combination with Gathering Available Facts (pattern 8.1) tocomplement what was not available. Moreover, Gathering Available Facts (pattern 8.1) will mostlikely also require some text-based post processing. That is, you can also Perform Text-BasedFact Extraction (pattern 8.2) on other listings than source code. Furthermore, consider conductinga Quick Feasibility Study (pattern 10.1) to see whether it is feasible to Perform Text-Based FactExtraction (pattern 8.2) for your needs.
5http://www.cs.brown.edu/˜spr/research/envfield.html
113
CHAPTER 8. FACT EXTRACTION
8.3 Buy a Commercial Fact Extractor
also known as ‘Commercial Fact Extraction’
Problem
How can you obtain very detailed facts for fine-grained analysis?
This problem is difficult because
• detailed facts require detailed parsing for which all language and compiler peculiarities willhave to be taken into account,
• this kind of expertise is most likely too expensive to have in-house.
Yet, solving this problem is feasible because
• someone else has done it before you.
Solution
Buy a fact extractor for your particular language (dialect). Pay a consultant to tweak, deploy andintegrate their tools into your environment. Pay the consultants some more to educate you andyour colleagues about the tool.
Trade-offs
+ A commercial fact extractor usually comes with an analysis framework, putting you well onyour way for solving current and future problems.
+ Although expensive, it is most likely cheaper than building and maintaining a fact extractorin-house.
– A commercial fact extractor will not work out-of-the-box. Not only will integration benecessary, some exotic constructs you use will not be supported. Make sure they are willingto adjust their tools.
– Besides money, it will also cost time and resources from your part to help with the integrationand education.
Known Uses
We did not find any published case material supporting the use of commercial fact extractors.However, we know of several companies offering such services and tools. Since they have beenaround for many years, some organizations use their services and tools enough for them to stay inbusiness.
114

8.3. BUY A COMMERCIAL FACT EXTRACTOR
Related PatternsConsider Gathering Available Facts (pattern 8.1) and Performing Text-Based Fact Extraction (pat-
tern 8.2) before Buying a Commercial Fact Extractor (pattern 8.3).
115

CHAPTER 8. FACT EXTRACTION
116
Chapter 9
Trace Capturing
In God we trust; all others must bring data.— W. Edwards Deming
Where Chapter 8 (p.107) shows how fact extraction can provide the basis for studying the structureof a software system, this chapter explores different ways to obtain run-time information to studythe behavior of a software system.
Capturing behavior is inherently more difficult than extracting structure from a system. Firstof all, to study behavior you need a running system. This implies that the system is completeand correct (you need to be able to build it), and that all runtime dependencies are satisfied (youneed to be able to execute it). Secondly, a typical system does not just process things by itself, itresponds to external stimuli. As such, scenarios need to be available to provide predefined stimuli.Possibly, a human is necessary to execute these scenarios as well. Lastly, it is not enough to make asystem do something, at the same time, you need to be able to monitor what the system is actuallydoing.
The latter is what this chapter focusses on: facilities to help capture run-time behavioral informationwhen providing external stimuli to a running system.
Forces
Several forces need to be balanced when choosing a particular technique to capture run-timeinformation.
Structural Granularity Which level of granularity is necessary to perform your analysis. Doyou just need a list of subsystems used within a specific scenario? Are you interested in the fullrun-time interaction of all different functions. Do you need an overview of all executed statements,
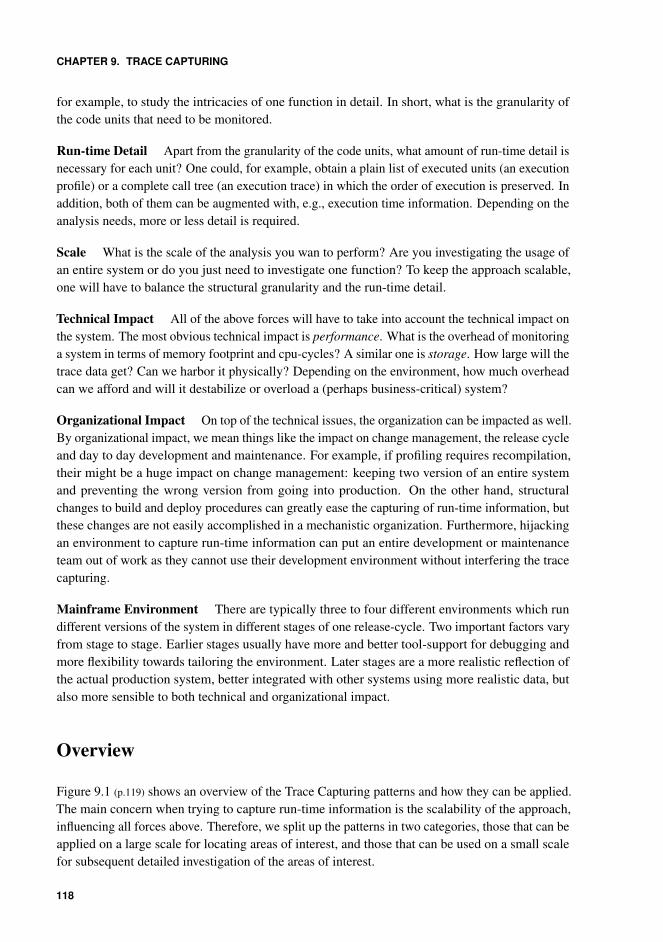
CHAPTER 9. TRACE CAPTURING
for example, to study the intricacies of one function in detail. In short, what is the granularity ofthe code units that need to be monitored.
Run-time Detail Apart from the granularity of the code units, what amount of run-time detail isnecessary for each unit? One could, for example, obtain a plain list of executed units (an executionprofile) or a complete call tree (an execution trace) in which the order of execution is preserved. Inaddition, both of them can be augmented with, e.g., execution time information. Depending on theanalysis needs, more or less detail is required.
Scale What is the scale of the analysis you wan to perform? Are you investigating the usage ofan entire system or do you just need to investigate one function? To keep the approach scalable,one will have to balance the structural granularity and the run-time detail.
Technical Impact All of the above forces will have to take into account the technical impact onthe system. The most obvious technical impact is performance. What is the overhead of monitoringa system in terms of memory footprint and cpu-cycles? A similar one is storage. How large will thetrace data get? Can we harbor it physically? Depending on the environment, how much overheadcan we afford and will it destabilize or overload a (perhaps business-critical) system?
Organizational Impact On top of the technical issues, the organization can be impacted as well.By organizational impact, we mean things like the impact on change management, the release cycleand day to day development and maintenance. For example, if profiling requires recompilation,their might be a huge impact on change management: keeping two version of an entire systemand preventing the wrong version from going into production. On the other hand, structuralchanges to build and deploy procedures can greatly ease the capturing of run-time information, butthese changes are not easily accomplished in a mechanistic organization. Furthermore, hijackingan environment to capture run-time information can put an entire development or maintenanceteam out of work as they cannot use their development environment without interfering the tracecapturing.
Mainframe Environment There are typically three to four different environments which rundifferent versions of the system in different stages of one release-cycle. Two important factors varyfrom stage to stage. Earlier stages usually have more and better tool-support for debugging andmore flexibility towards tailoring the environment. Later stages are a more realistic reflection ofthe actual production system, better integrated with other systems using more realistic data, butalso more sensible to both technical and organizational impact.
Overview
Figure 9.1 (p.119) shows an overview of the Trace Capturing patterns and how they can be applied.The main concern when trying to capture run-time information is the scalability of the approach,influencing all forces above. Therefore, we split up the patterns in two categories, those that can beapplied on a large scale for locating areas of interest, and those that can be used on a small scalefor subsequent detailed investigation of the areas of interest.
118
(Ab)use a Debugger(pattern 9.2)
not feasible
(Ab)Use High-Level Monitoring Tools
(pattern 9.1)
not feasible
Trace Capturing
locate areas of interest
investigate areas of interestQuick Feasibility Study
(pattern 10.1)
feasible?
feasible?
large scale
small scale
Instrument Source Code (Coarse-Grained)
(pattern 9.3)
Instrument Source Code (Fine-Grained)
(pattern 9.3)
Figure 9.1: Overview of the Trace Capturing Patterns.
For locating areas of interest using run-time information, one should first try to (Ab)use High-levelMonitoring Tools (pattern 9.1). If it is not feasible, one can try to perform coarse-grained SourceCode Instrumentation (pattern 9.3). When having identified the areas of interest, one can investigatethem in more detail by capturing more detailed run-time information. To do this, one should firsttry to (Ab)use a Debugger (pattern 9.2) or other profiling tools in your development environment.If it is not feasible, one can try to perform fine-grained Source Code Instrumentation (pattern 9.3).Investigating the feasibility of abusing existing infrastructure can be supported by Quick FeasibilityStudies (pattern 10.1).
119
CHAPTER 9. TRACE CAPTURING
9.1 (Ab)use a High-Level Monitoring Tool
ProblemHow to obtain sufficient run-time information to locate areas of interest in a large system?
This problem is difficult because
• adjusting the system under study to provide run-time information is not always possible orallowed.
Yet, solving this problem is feasible because
• you don’t need very fine-grained and detailed information to find an area of interest,• mainframes typically have some high-level monitoring tools in place in production and
pre-production.
SolutionAbuse the output of a high-level monitoring tool, such as DORANA1 or OMEGAMON2, to obtain avery coarse-grained execution profile.
Hint Make sure you establish a good relationship with the supporting departments in yourorganization. For all these options you will have to cooperate with technical operators to getthe necessary clearance. They might also be able to point you to other options you don’t knowabout.
Trade-offs+ Organizational and technical impact are minimal as these tools typically run 24/7 on
(pre)production systems for ensuring accountability, generating statistics or enabling post-mortem problem resolution.
+ Since impact is low, you can use the pre-production environment and, thus, have access torealistic data and a stable, reliable version of the system under study.
+ This approach scales very well to entire systems as these tools typically run enterprise-wide.– Structural granularity is usually very coarse-grained, it is not suited for detailed analysis.– You have little to no customization options. You will have to take the structural granularity
and run-time detail ‘as is’.
Known UsesIn Section 6.1.4 (p.69) we explain how we abuse DORANA— a tool that provides system-widelogging of load modules — to obtain the necessary run-time information to locate features in thePortfolio Management System. Due to its small technical and organizational impact, this approachallowed us to perform our experiments on the pre-production environment with realistic data. On
1http://www.ubiquity.com.au/products_Dorana.php2http://en.wikipedia.org/wiki/IBM_OMEGAMON
120
9.1. (AB)USE A HIGH-LEVEL MONITORING TOOL
the other hand, we ran into trouble pin-pointing the exact location of some features due to thecoarse granularity.
Arias et al. [2008] gather information from the processes and threads controlled by the operatingsystem (OS) to uncover execution dependencies of the Philips MRI software at an architecturallevel. Concretely they monitor (i) libraries representing subsystems being loaded by the OS, (ii)data accessed in the form of file accesses or database calls, (iii) CPU and memory usage by the OS.The main advantage of the approach is its non-intrusive nature, they collect up-to-date run-timeinformation without touching the source code or creating overhead.
Related PatternsYou can (Ab)use a High-Level Monitoring Tool (pattern 9.1) to uncover areas of interest within thesystem under study. Capturing more fine-grained run-time information can be accomplished by(Ab)using a Debugger (pattern 9.2) or Instrumenting Source Code (pattern 9.3) which can monitor theuncovered areas of interest in more detail while discarding other areas. Furthermore, considerconducting a Quick Feasibility Study (pattern 10.1) to see whether it is feasible to (Ab)use a High-Level Monitoring Tool (pattern 9.1) for your needs.
121
CHAPTER 9. TRACE CAPTURING
9.2 (Ab)use a Debugger
ProblemHow to obtain fine-grained and detailed run-time information to investigate area of interest?
This problem is difficult because
• capturing fine-grained and detailed run-time information has a major impact on the system,• you need hooks into the existing system to capture the run-time information.
Yet, solving this problem is feasible because
• you already know where to look, so you dan’t have to monitor the entire system,• you are actively maintaining the system, hence, you have debug and profiling tools available.
SolutionAbuse a debugger or other profiling tools in your development environment to generate trace outputwhich you can process afterwards to fit your analysis needs.
Hint You might need to alter some parameters of your debugger that you normally don’t use.Ask a supporting department for a course or a manual on the debugger you use. They might alsobe able to point you to other options you don’t know about.
Trade-offs+ You are familiar with the infrastructure as you use it often during development and mainte-
nance activities.+ Structural granularity and run-time detail is usually very fine-grained, including monitoring
the value of variables.– To provide this fine-grained and detailed information, it usually eats up a lot of resources,
especially the memory foot-print can cause problems.– It does not scale to full system tracing. As such, you need to make sure you have located the
areas of interest in advance.– Debuggers are only available on the development environment. If reliable data is necessary
to obtain useful run-time information, it will have to be produced from scratch or copiedover from the (pre-)production environemnt.
Known UsesBefore abusing DORANA to obtain the necessary run-time information to locate features in thePortfolio Management System in Section 6.1.4 (p.69), we tried using XPEDITER, the standarddebugging tool for mainframe in the organization. We found it very easy to tweak the profiling andobtain the information we needed. We soon realized, however, that we could not monitor morethan a dozen modules simultaneously before filling up the memory available to our mainframeprofile. After increasing our dedicated memory to its maximum, we could still only monitor about
122

9.2. (AB)USE A DEBUGGER
30 modules simultaneously. Furthermore, using XPEDITER we can only trigger execution in aninteractive manner, thus, monitoring batch jobs is impossible. Clearly, this approach was infeasibleto be used on an entire system, nonetheless, the potential for focussed fine-grained tracing isenormous.
Related PatternsFirst (Ab)use a High-Level Monitoring Tool (pattern 9.1) to better delineate the area of interest,because you cannot debug an entire system at once. Conduct a Quick Feasibility Study (pattern 10.1)
to see whether it is feasible to (Ab)using a Debugger (pattern 9.2) for your needs. If not, consider In-strumenting Source Code (pattern 9.3). When (Ab)using a Debugger (pattern 9.2), consider PerformingText-Based Fact Extraction (pattern 8.2) to transform the debug output to a format usable for youranalysis needs.
123
CHAPTER 9. TRACE CAPTURING
9.3 Instrument Source Code
ProblemHow to capture run-time information from a software system without tool support.
This problem is difficult because
• you need hooks into the existing system to capture the run-time information,• you cannot rely on tools to do the dirty work.
Yet, solving this problem is feasible because
• you are actively maintaining the system, hence, you have the ability to change and rebuildthe system.
SolutionInstrument the source code by adding monitoring statements to all the places of interest.
Instrumenting source code for very fine-grained run-time information is typically not that hardto do: just provide a DISPLAY statement before each original statement. Similarly, instrumenta-tion for very coarse-grained information is usually doable as well, provide a logging statementwhen entering or when invoking a module, which typically have clear boundaries. However,everything in between can be more difficult, especially when facing less structured programminglanguages. In particular, GOTO statements and other structure-breaking constructs can cause a lotof issues.
Furthermore, one should take into account the intent of capturing run-time information. Whenlooking for areas of interest on a large scale, use coarse-grained instrumentation to limit technicalimpact. Nonetheless, organizational impact remains a bottleneck as you have to modify andrecompile all source code, as such, it affects the change management environment and concurrentdevelopment and maintenance activities. When investigating certain areas in more detail, usefine-grained instrumentation. The small scale of the investigation will limit technical and organiza-tional impact, however, one will most likely be limited to the development environment for suchexperiment.
Hint Adding these extra statements is labour-intensive when instrumenting more than a sourcecode files. Therefore, this instrumentation is best automated with some kind of script that changesthe source code. Consider using lexical techniques, like we propose when Performing Text-BasedFact Extraction (pattern 8.2), for quick and low-cost automated instrumentation.
Trade-offs+ You do not need to rely on exotic tools or infrastructure, which never perfectly fit your
needs.+ Structural granularity is not an issue: you have full control over what is monitored.+ Relatively easy to implement on a small scale.
124
9.3. INSTRUMENT SOURCE CODE
– Instrumenting source code requires recompilation of that code. Depending on the scale, thiscan have a significant technical and organizational impact.
– Manual instrumentation is tedious, but automating instrumentation can be difficult dependingon the programming language used and the granularity and run-time detail needed.
– Brute force approaches can have a huge technical impact on system resources when actuallymonitoring the system.
– Reliable data might have to be migrated to the development environment.
Known UsesIn Section 6.3.2 (p.80) we performed source code instrumentation on a small part of OSIRIS. Theimplementation was very straightforward and allowed us to obtain run-time information withstatement-level granularity. However, we were not able to use this approach on the entire systemdue to excessive organizational impact. In particular, the fact that the entire environment would beunavailable for normal maintenance activities was unacceptable.
Eisenbarth et al. [2003] used source code instrumentation on an industry-scale C system (not onmainframe). They were able to recompile the system in a separate environment. As such, they hadno organizational issues. Using source code instrumentation, they were able to tailor the solutionto their monitoring needs with little effort.
Related PatternsConsider (Ab)using a High-Level Monitoring tool (pattern 9.1) to better delineate the area of interest,as such, you only have to instrument a small part of the source code. Consider (Ab)using aDebugger (pattern 9.2) for obtaining fine-grained run-time information when you are not able tochange the source code.
125

CHAPTER 9. TRACE CAPTURING
126
Chapter 10
Process Patterns
CHAPTER 10. PROCESS PATTERNS
10.1 Quick Feasibility Study
ContextSeveral approaches are possible to tackle a certain reverse engineering problem. Some approachesare intuitively more feasible than others, other could be more beneficial.
ProblemAn available tool or method might be useful to solve a problem at hand, but you lack experienceand the expertise to make the decision.
This problem is difficult because
• you lack sufficient experience to make a judgement call,• documentation of the potential tool or method is usually not conclusive regarding custom
problems.
Yet, solving this problem is feasible because
• someone in the organization will have at least ‘some’ experience with the tool or method,otherwise it would not be available,
• well-designed experiments can quickly invalidate an option.
SolutionSetup a simple experiment to invalidate the use of a certain tool or method in your context. If‘successful’ you can quickly discard the option and look for alternatives. If not, you either will havegained experience to pose a new invalidation question or you will have gained enough confidenceto take the risk and use it.
Hint Keep the experiment as small as possible and set up new experiments in an iterative andincremental fashion.
Trade-offs+ You can discard options with more confidence.+ When lucky, you can get a quick win.– Setting up such experiments takes time, you might be better off spending your resources on
implementing something that will work for sure.
Known UsesIn Section 6.3.1 (p.79) we have conducted such a small feasibility study to investigate the usabilityof STROBE, a sample-based monitoring tool, to capture a full system trace on module level. Weincreased the sampling rate to its maximum and compared the results (monitored statementsaggregated to their containing function) with all transactions (main functions accessible via
128
10.1. QUICK FEASIBILITY STUDY
transaction manager) that had been executed. As a result, we observed that some main functionshad not been monitored by STROBE, thus, it would surely not be useful to monitor all functions.This feasibility study has been conducted in one man-day, after which we could safely discard thisoption from all future discussions and start looking for viable alternatives.
In Section 6.3.2 (p.80) we tested the feasibility of statement-level source code instrumentation forcapturing a full execution trace. We have built a prototype to instrument a handful of modules,recompile them on mainframe, execute them and process the results offline. It took us five man-days to implement this prototype and it showed us that it was technically feasible to do sourcecode instrumentation on a small scale. Of course, this does not prove this approach will work on arealistic scale. However, we did pass the first few hurdles and uncovered new unknowns, whichwe listed in Listing 6.5 (p.85), that can be tackled with subsequent feasibility studies.
Related PatternsThis pattern is very similar to the Build Prototypes (pattern A.4) pattern which is extensively used inAgile Software Development [Coplien and Harrison, 2005, page 49].
129

CHAPTER 10. PROCESS PATTERNS
130

Part IV
Conclusions

Chapter 11
Conclusions andRecommendations
Learn to pause . . .or nothing worthwhile will catch up to you.
— Doug King
11.1 Research Questions Revisited
Reverse Engineering
What is the goal of reverse engineering?
What are the characteristics of state-of-the-art reverse engineering techniques?
The ultimate goal of reverse engineering is to support a human to acquire knowledge aboutan existing software system. We have identified three characteristics that will enable a reverseengineering technique to effectively help reach this goal: (i) it can be used as a starting pointfor knowledge acquisition, even without prior knowledge available; (ii) it must support rapidincremental and iterative analysis to verify or reject hypotheses, and (iii) it must reveal unknownsthat facilitate the formulation of new hypotheses. The latter two characteristics focus on supportingthe human learning process which is iterative and incremental by nature.
CHAPTER 11. CONCLUSIONS AND RECOMMENDATIONS
The Financial Services Industry
What are the characteristics of organizations in the financial services industry?
What are the characteristics of mainframes used in the financial services industry?
Organizations from the financial services industry typically have a mechanistic culture favoringplan-based development processes. As such they promote labor specialization resulting in clearlydelineated tasks and impose rigorous processes supported by standardized tools to maintaincentralized control.
Mainframes nicely reflect the urge to maintain centralized control. They have been originallyinvented to fulfill the automation needs of these mechanistic organizations. As such, the organiza-tional structures and rigorous processes are clearly visible in the mainframe, allowing for littleflexibility. Nonetheless, there is no system better suited to perform commercial data processing,the prime concern for organizations in the financial services industry.
Who can benefit from reverse engineering in the financial services industry?
From our observations — but without any empirical evidence — we have identified two areasin which we believe these organizations can benefit from reverse engineering techniques: duringprestudies for evolutionary development and during routine maintenance. As such, the followingpractitioners can benefit the most from reverse engineering: (i) prestudy leaders when studying thefeasibility or estimating the cost of a proposed project, (ii) technical designers when confrontedwith technical questions from a prestudy leader or when deciding whether a change request is tobe considered routine maintenance, (iii) maintainers when asked to implement a change to a partof the system they do not know very well.
Resulting Difficulties
Which factors — both technical and organizational — make it difficult to apply reverseengineering in the financial services industry?
Many Languages and Variants All forms of reverse engineering have a data gathering activity.Crucial to many techniques is the extraction of structural facts about the source code. However, inthe context of mainframes a lot of different languages and language variants are used. Obtainingstandardized tooling to do this fact extraction is not possible, extracting facts for all these languagesis not feasible, buying commercial fact extractors for all these languages is too costly. Usually,the latter is even impossible because not all languages and variants are commercially supported.Furthermore, none of these commercial fact extractors will work out-of-the-box, customization isalways required.
Mainframes are not Visual We have identified software views as a promising technique fora human to explore a software system in a more tangible way. However, this is not possible onmainframe systems as they do not support a visual environment. Disconnecting the visualizationsfrom the development environment will hold back the full potential of the technique, especially
134
11.1. RESEARCH QUESTIONS REVISITED
for maintainers who need a strong link with the code. However, more and more the developmentenvironment itself is disconnected from the mainframe, only leaving compilation and execution tothe mainframe. This opens up new possibilities to integrate software views into the developmentenvironment. Apart from routine maintenance, software views can also be very useful in the settingof a prestudy. Here, the disconnection from mainframe is less of an issue as prestudy leaders areless concerned with the actual code.
Isolation is a Pain When applying dynamic analyses, which we did when performing featurelocation, the main concern is isolation. The assumption that you can lift a system from its naturalhabitat in such a rigorously structured environment is unrealistic at best. Applying dynamicanalyses on a live environment poses new isolation issues. How can one distinguish betweenown usage and unrelated system usage? How can one distinguish between different executionscenarios? All these issues can be solved by introducing an extra mainframe environment with thenecessary infrastructure, however, the excessively high operational costs of mainframes make thisprohibitively expensive.
Lacking Tool Support Although tool support for the development process and the supportingprocesses is typically pretty advanced and commonly used on mainframe, tools specificallysupporting reverse engineering are seldom available. For example, obtaining reliable executiontraces on a live environment, taking into account all the isolation issues, should be possible withthe necessary supporting infrastructure.
Mechanistic Culture The mechanistic culture and plan-based approach is at odds with theiterative and exploratory nature of reverse engineering. For example, applying one iteration of thefeature location technique requires a lot of pre-planning due to the the technical operators fromsupporting departments involved. As such, rapid turn-around cycles were not possible, therebyseverely hampering the usefulness of these techniques for efficient knowledge acquisition.
Rules Not Rooted in Practice All these rigorous rules and procedures are in place to optimizeand maintain control over an industrialized process. However, not all these rules are rooted inpractice. For example, when conducting a redocumentation effort, it became clear that the imposeddocumentation formats were not always considered useful or beneficial for the people workingwith the documentation. As such, there is a lack of commitment to create and — more importantly— maintain the documentation. While reverse engineering techniques can help create mandatorydocumentation, it is of little use to create it to adhere to rules that have lost touch with reality. Evenmore, it is counterproductive to do so because lack of maintenance to the documentation will makeit unreliable and, thus, unusable for acquiring knowledge.
135
CHAPTER 11. CONCLUSIONS AND RECOMMENDATIONS
11.2 Recommendations
What Can Organizations Do?
What can organizations do to better support reverse engineering?
The cost of applying reverse engineering techniques on an ad-hoc project-per-project basis iscurrently excessively high for organizations in the financial services industry, mainly due to theirmechanistic culture and lack of tool support. The only way to really tackle this problem is tostreamline the mainframe infrastructure and to incorporate reverse engineering in the organizationalprocesses. In order to do so, we recommend two gradual transformations.
Industrialize Reverse Engineering Although we have portrayed reverse engineering as anorganic process, stressing the need for exploration, iteration and human interaction, some activitieswithin the reverse engineering process can be industrialized. For example, in many cases thedata gathering activity is a prime candidate for such mechanistic automation. Just like the verymechanistic build and deploy process in forward engineering, one can have a similar mechanisticfact extraction process building a knowledge base that can be used afterwards. A next step couldbe the automation of documentation generation or — more useful — automatic verification ofdocumentation conformance. The general idea is to automate and incorporate as much as feasibleinto the current industrial development practices.
Agilize Organizational Processes It is imperative that organizations recognize knowledgeacquisition as a human process best supported by tools. It is a natural learning process which isiterative and incremental by nature. Less rigorous processes and procedures can help facilitatefaster turn-around cycles. Furthermore, one should minimize documentation that needs to be keptup to date manually and maximize tool support for system comprehension. Being able to use thesetools to their full potential also implies providing a secure work environment that enables andpromotes exploration and interaction.
Reverse engineering needs to be taken into account from the start, instead of being considered asan after-thought. It should become a natural part of the software development life-cycle, gettingequal attention and tool support as forward engineering.
What Can The Research Community Do?
What can the research community do to better support reverse engineering in thefinancial services industry?
Cross-Language Dependencies We have identified the extraction and analysis of cross-languagedependencies as an interesting research domain. Results from that domain can be of great im-portance within the financial services industry. As such, we would like to encourage the cur-rent researchers to continue their efforts and urge them not to forget the typical mainframelanguages.
136
11.2. RECOMMENDATIONS
Empirical and Industrial Research The focus of the reverse engineering community is stillvery much on creating new techniques in vitro that look fancy and work under laboratory conditions.However, for some reason these techniques are not adopted by industry. Therefore, we urge theentire reverse engineering community to do more empirical research to show the benefit of applyingreverse engineering. This way, the industry might be more inclined to apply it as well. Furthermore,we urge the community to do more industrial research to see how these techniques hold up underrealistic circumstances, also taking into account organizational intricacies. This way, we caninvestigate which difficulties reduce or eliminate the benefit of applying reverse engineering inindustry and and start addressing them.
Keep it Simple! In his keynote on the 2010 Symposium On Applied Computing1, WillyZwaenepoel attributed the lack of adoption of research ideas to the following contradiction:
In order to have your idea accepted at a major conference, it needs to be complex. In or-der for your idea to have any impact in industry, it must be simple and comprehensibleto the above-average programmer.
He has observed that simple papers tend to get rejected and complex papers tend to get accepted,without any regard for the applicability of the idea in realistic circumstances. Although we do notintend to start a controversy on the academic reviewing and publishing system, we do agree thatresearch should be more rooted in practice. There is no use in adding complexity to a technique tosolve problems that do not really exist. Thus, we urge the research community to focus more onsolving problems that exist in real life with techniques that are as simple as possible.
What Can Practitioners Do?
What can practitioners do to work around these difficulties while waiting for theirorganization and the research community to catch up?
Be Opportunistic While waiting for decent tooling and adapted procedures, practitioners shouldbe opportunistic when trying to acquire knowledge. Many scattered bits and pieces of informationabout a software system are already available in mainframe environments, thus practitioners canGathering Available Facts (pattern 8.1) to reason about. Furthermore, practitioners should build agood relationship with the supporting departments and get an overview of the facilities that areavailable. Do not be afraid to start Quick Feasibility Studies (pattern 10.1) to check the potential ofavailable tools for different purposes.
Be Lazy A nice motto in life is to get the most done with the least possible effort. As such,practitioners should avoid repetitive tasks: when you have done something twice, consider automa-ting it. Performing Text-Based Fact Extraction (pattern 8.2) and combining available facts are niceexamples of this. Again, a good relationship with the supporting departments is desirable.
Be Courageous Maximize the use of your flexible development environment, explore thepossibilities. Spend some time trying to patch together a bit of ‘tool’ support for acquiring
1http://www.acm.org/conferences/sac/sac2010/
137
CHAPTER 11. CONCLUSIONS AND RECOMMENDATIONS
knowledge about the software system you are working on. Share your knowledge with others.Show your increase in productivity to management. Constructively apply bottom-up pressure toget better tool support and organizational support.
Be a Student Most importantly, one should never stop learning. Learn from fellow practitionersby reading books, studying patterns and sharing experiences. Contribute (as this the best way tolearn) by teaching newcomers and documenting useful patterns as you discover them. Never stopbeing a student.
11.3 Concluding Thoughts
In the book, ‘Artful Making: what managers need to know about how artists work’, Austin andDevin explore the differences between industrial making and artful making. Where industrialmaking focusses on replication of products and optimizing the process to do that, artful making isall about reconceiving, innovating and creating a workspace that allows it. By drawing a parallelwith how a theatre company creates a play, they argue that software development — being subjectto so much unpredictable change — should be considered a form of artful making and should bemanaged accordingly [Austin and Devin, 2003].
The financial services industry, operating in a mechanistic culture, takes the industrial approachof software engineering, which is not necessarily bad because IT is not the core business of thefinancial services industry. They focus on replicating and optimizing the process to build softwaresystems that support their core business. They have no need to be innovative or revolutionaryin that respect. But of course, the existing systems should not hamper the ability of business toinnovate. On the other hand, reverse engineering — and system comprehension in particular — isan inherently creative process. It is the artful (re)making of an existing system in the human mind,it is a natural learning process that cannot be replicated as it will be different each time.
We believe that this mismatch between the artful (re)making of reverse engineering and theindustrial making of software development on the mainframe in the financial services industry isthe main cause for the issues identified in this dissertation.
Nonetheless, we firmly believe that the financial services industry can greatly benefit from incorpo-rating reverse engineering in their processes. Therefore, we hope to have given the organizationssome useful pointers to accomplish this, to have persuaded more researchers to do in vivo research,and to have encouraged practitioners to start or continue to use reverse engineering.
138
Part V
Appendices

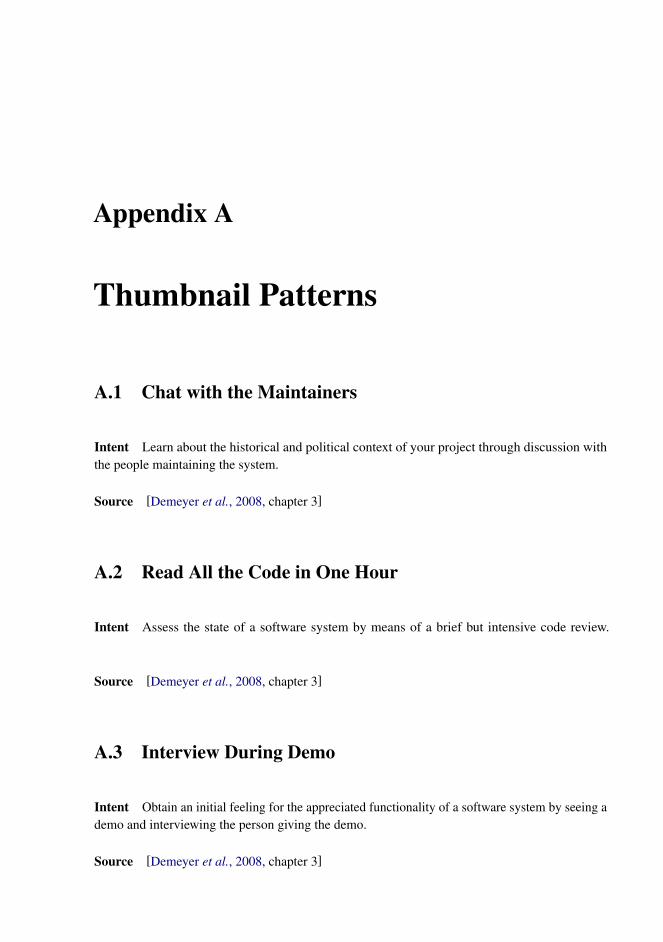
Appendix A
Thumbnail Patterns
A.1 Chat with the Maintainers
Intent Learn about the historical and political context of your project through discussion withthe people maintaining the system.
Source [Demeyer et al., 2008, chapter 3]
A.2 Read All the Code in One Hour
Intent Assess the state of a software system by means of a brief but intensive code review.
Source [Demeyer et al., 2008, chapter 3]
A.3 Interview During Demo
Intent Obtain an initial feeling for the appreciated functionality of a software system by seeing ademo and interviewing the person giving the demo.
Source [Demeyer et al., 2008, chapter 3]

APPENDIX A. THUMBNAIL PATTERNS
A.4 Build Prototypes
Intent Test requirements ad design decisions to reduce risk of wasted cost and missed expecta-tions by building a prototype.
Source [Coplien and Harrison, 2005, page 49]
142
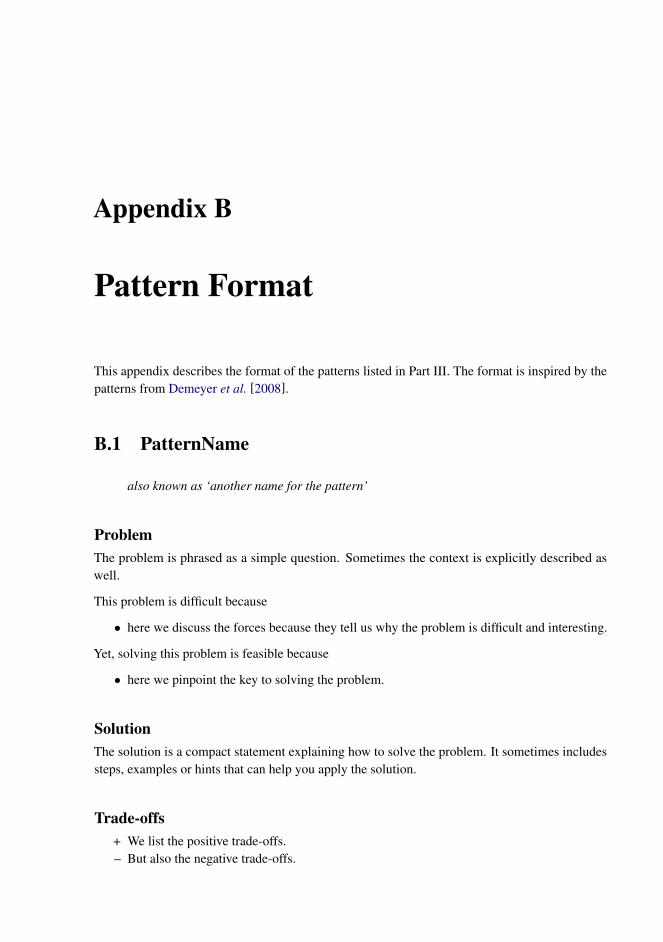
Appendix B
Pattern Format
This appendix describes the format of the patterns listed in Part III. The format is inspired by thepatterns from Demeyer et al. [2008].
B.1 PatternName
also known as ‘another name for the pattern’
ProblemThe problem is phrased as a simple question. Sometimes the context is explicitly described aswell.
This problem is difficult because
• here we discuss the forces because they tell us why the problem is difficult and interesting.
Yet, solving this problem is feasible because
• here we pinpoint the key to solving the problem.
SolutionThe solution is a compact statement explaining how to solve the problem. It sometimes includessteps, examples or hints that can help you apply the solution.
Trade-offs+ We list the positive trade-offs.– But also the negative trade-offs.

APPENDIX B. PATTERN FORMAT
Known UsesWe list some known uses of the pattern, either from our own experience by referencing a part ofthe dissertation, or from literature by referencing other work.
Related PatternsWe list some related patterns, mostly to show the interaction between the different patterns fromthis dissertation.
144
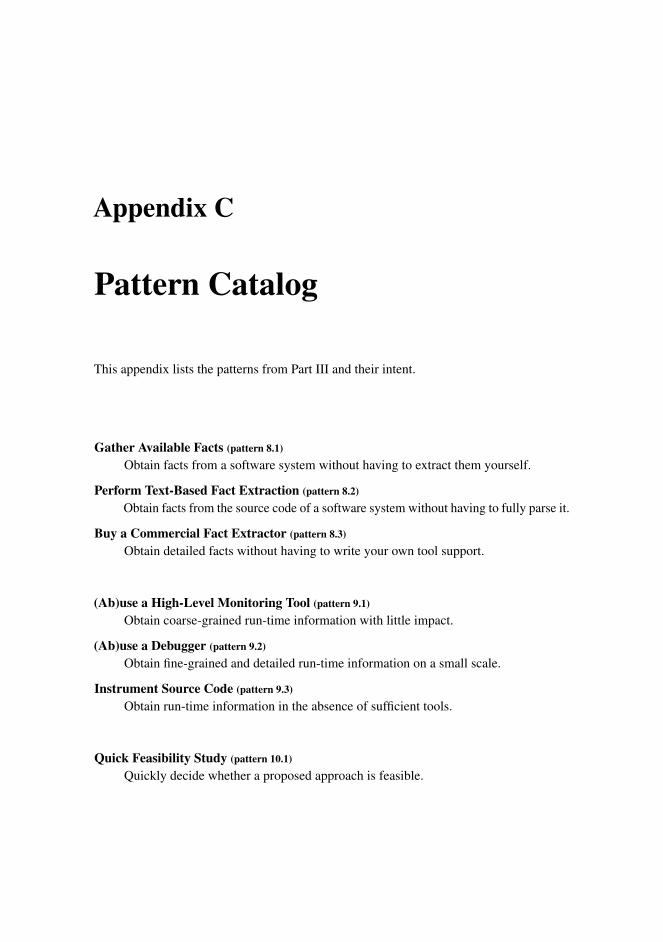
Appendix C
Pattern Catalog
This appendix lists the patterns from Part III and their intent.
Gather Available Facts (pattern 8.1)
Obtain facts from a software system without having to extract them yourself.
Perform Text-Based Fact Extraction (pattern 8.2)
Obtain facts from the source code of a software system without having to fully parse it.
Buy a Commercial Fact Extractor (pattern 8.3)
Obtain detailed facts without having to write your own tool support.
(Ab)use a High-Level Monitoring Tool (pattern 9.1)
Obtain coarse-grained run-time information with little impact.
(Ab)use a Debugger (pattern 9.2)
Obtain fine-grained and detailed run-time information on a small scale.
Instrument Source Code (pattern 9.3)
Obtain run-time information in the absence of sufficient tools.
Quick Feasibility Study (pattern 10.1)
Quickly decide whether a proposed approach is feasible.

APPENDIX C. PATTERN CATALOG
146
Bibliography
[Adar, 2006] Eytan Adar. Guess: a language and interface for graph exploration. In CHI ’06:Proceedings of the SIGCHI conference on Human Factors in computing systems, pages 791–800.ACM Press, 2006. [38]
[Ahmed, 2006] Rana Ejaz Ahmed. Software maintenance outsourcing: Issues and strategies.Computers & Electrical Engineering, 32(6):449 – 453, 2006. [90]
[Alexander et al., 1977] Christopher Alexander, Sara Ishikawa, and Murray Silverstein. A PatternLanguage: Towns, Buildings, Construction (Center for Environmental Structure Series). OxfordUniversity Press, later printing edition, August 1977. [13]
[Ambler et al., 2005] Scott Ambler, John Nalbone, and Michael Vizdos. The Enterprise UnifiedProcess: extending the rational unified process. Prentice Hall Press, Upper Saddle River, NJ,USA, 2005. [23]
[Arias et al., 2008] T. Arias, P. Avgeriou, and P. America. Analyzing the actual execution of alarge software-intensive system for determining dependencies. In Reverse Engineering, 2008.WCRE ’08. 15th Working Conference on, pages 49 –58, 15-18 2008. [121]
[Austin and Devin, 2003] Rob Austin and Lee Devin. Artful making: what managers need toknow about how artists work. FT Press, 2003. [138]
[Beck and Cunningham, 1987] Kent Beck and Ward Cunningham. Using pattern languages forobject-oriented programs. In OOPSLA-87 workshop on the Specification and Design forObject-Oriented Programming, September 1987. [14]
[Beck, 2010] Kent Beck. Perspective: The inevitability of evolution. IEEE Software, 27:28–29,2010. [4]
[Bennett and Rajlich, 2000] Keith H. Bennett and Vaclav T. Rajlich. Software maintenance andevolution: a roadmap. In ICSE ’00: Proceedings of the Conference on The Future of SoftwareEngineering, pages 73–87, New York, NY, USA, 2000. ACM. [xv, 4, 5, 10]
[Beyer et al., 2005] Dirk Beyer, Andreas Noack, and Claus Lewerentz. Efficient relational calcu-lation for software analysis. IEEE Transactions on Software Engineering, 31:137–149, 2005.[95]

BIBLIOGRAPHY
[Boehm and Turner, 2003] Barry Boehm and Richard Turner. Balancing Agility and Discipline:A Guide for the Perplexed. Addison-Wesley Longman Publishing Co., Inc., Boston, MA, USA,2003. [18]
[Brodie and Stonebraker, 1995] M.L. Brodie and M. Stonebraker. Migrating legacy systems:gateways, interfaces & the incremental approach. Morgan Kaufmann Publishers Inc. SanFrancisco, CA, USA, 1995. [4]
[Burns and Stalker, 1994] Tom Burns and G. M. Stalker. The Management of Innovation. OxfordUniversity Press, 1994. [17, 90]
[Chan et al., 2007] Diana Chan, Florence Fontan, Simonetta Rosati, and Daniela Russo. Thesecurities custody industry. Technical Report 68, Occasional Paper Series from EuropeanCentral Bank, August 2007. [30]
[Cheesman and Daniels, 2000] John Cheesman and John Daniels. UML components: a simpleprocess for specifying component-based software. Addison-Wesley Longman Publishing Co.,Inc., Boston, MA, USA, 2000. [90]
[Chikofsky and Cross, 1990] E.J. Chikofsky and II Cross, J.H. Reverse engineering and designrecovery: a taxonomy. Software, IEEE, 7(1):13–17, Jan 1990. [xv, 7, 8, 89]
[Clements et al., 2002] Paul Clements, Rick Kazman, and Mark Klein. Evaluating SoftwareArchitectures: Methods and Case Studies. Addison-Wesley Professional, January 2002. [35,77]
[Coplien and Harrison, 2005] James O. Coplien and Neil B. Harrison. Organizational Patterns ofAgile Software Development. Prentice-Hall, Inc., Upper Saddle River, NJ, USA, 2005. [14, 129,142]
[Cornelissen et al., 2009] Bas Cornelissen, Andy Zaidman, Arie van Deursen, Leon Moonen, andRainer Koschke. A systematic survey of program comprehension through dynamic analysis.IEEE Transactions on Software Engineering, 2009. [64]
[d’Adderio et al., 2002] Luciana d’Adderio, Rick Dewar, Ashley Lloyd, and Perdita Stevens. Hasthe pattern emperor any clothes?: a controversy in three acts. SIGSOFT Softw. Eng. Notes,27(1):31–35, 2002. [14]
[De Schutter, 2006] Kris De Schutter. Aspect oriented revitalisation of legacy software throughlogic meta-programming. PhD thesis, Universiteit Gent, 2006. [57]
[Dejonghe, 2007] Alexander Dejonghe. De ontwikkeling van een visualisatietool voor legacycobol code. Master’s thesis, Universiteit Gent, 2007. [57]
[Demeyer et al., 2008] Serge Demeyer, Stephane Ducasse, and Oscar Nierstrasz. Object-OrientedReengineering Patterns. Square Bracket Associates, 2008. [4, 9, 12, 14, 35, 50, 51, 89, 141,143]
[Dewar, 1999] Rick Dewar. Characteristics of legacy system reengineering. In EuroPlop, 1999.[9]
148
BIBLIOGRAPHY
[Du Bois et al., 2007] Bart Du Bois, Bart Van Rompaey, Karel Meijfroidt, and Eric Suijs. Sup-porting reengineering scenarios with fetch: an experience report. Electronic Communicationsof the EASST, 8, 2007. [94, 111]
[Ebbers et al., 2006] Mike Ebbers, Wayne O’Brien, and Bill Ogden. Introduction to the NewMainframe: z/OS Basics, volume SG24-6366-00 of RedBooks. IBM, July 2006. [25]
[Eisenbarth et al., 2003] T. Eisenbarth, R. Koschke, and D. Simon. Locating features in sourcecode. Software Engineering, IEEE Transactions on, 29(3):210–224, March 2003. [xvi, 64, 65,66, 67, 69, 72, 77, 78, 87, 125]
[Erl, 2009] Thomas Erl. SOA Design Patterns. Prentice Hall PTR, Upper Saddle River, NJ, USA,2009. [14]
[Feathers, 2004] Michael Feathers. Working Effectively with Legacy Code. Prentice Hall PTR,Upper Saddle River, NJ, USA, 2004. [14]
[Fowler, 2002] Martin Fowler. Patterns of Enterprise Application Architecture. Addison-WesleyLongman Publishing Co., Inc., Boston, MA, USA, 2002. [14, 24]
[Frick et al., 1994] Arne Frick, Andreas Ludwig, and Heiko Mehldau. A fast adaptive layoutalgorithm for undirected graphs. In GD ’94: Proceedings of the DIMACS InternationalWorkshop on Graph Drawing, pages 388–403, London, UK, 1994. Springer-Verlag. [39]
[Gamma et al., 1995] Erich Gamma, Richard Helm, Ralph Johnson, and John Vlissides. Designpatterns: elements of reusable object-oriented software. Addison-Wesley Longman PublishingCo., Inc., Boston, MA, USA, 1995. [14]
[Hohpe and Woolf, 2003] Gregor Hohpe and Bobby Woolf. Enterprise Integration Patterns: De-signing, Building, and Deploying Messaging Solutions. Addison-Wesley Longman PublishingCo., Inc., Boston, MA, USA, 2003. [14]
[Homann et al., 2004] Ulrich Homann, Michael Rill, and Andreas Wimmer. Flexible valuestructures in banking. Commun. ACM, 47(5):34–36, 2004. [4]
[IEEE, 1999] IEEE. IEEE Standard for Software Maintenance, IEEE Std 1219-1998, volume 2.IEEE Press, 1999. [10]
[Kerievsky, 2004] Joshua Kerievsky. Refactoring to Patterns. Pearson Higher Education, 2004.[14]
[Kienle and Muller, 2008] Holger M. Kienle and Hausi A. Muller. The rigi reverse engineeringenvironment. In 1st International Workshop on Academic Software Development Tools andTechniques, 2008. [94]
[Kitchenham et al., 1999] Barbara A. Kitchenham, Guilherme H. Travassos, Anneliese vonMayrhauser, Frank Niessink, Norman F. Schneidewind, Janice Singer, Shingo Takada, RistoVehvilainen, and Hongji Yang. Towards an ontology of software maintenance. Journal ofSoftware Maintenance, 11(6):365–389, 1999. [21]
[Kruchten, 2003] Philippe Kruchten. The Rational Unified Process: An Introduction. Addison-Wesley Longman Publishing Co., Inc., Boston, MA, USA, 2003. [xv, 18, 21, 23]
149

BIBLIOGRAPHY
[Lanza and Ducasse, 2003] Michele Lanza and Stephane Ducasse. Polymetric views-a lightweightvisual approach to reverse engineering. IEEE Trans. Softw. Eng., 29(9):782–795, 2003. [xv, 35,36, 60]
[Lehman, 1979] M. M. Lehman. On understanding laws, evolution, and conservation in thelarge-program life cycle. Journal of Systems and Software, 1:213 – 221, 1979. [4, 10]
[Lientz et al., 1978] B. P. Lientz, E. B. Swanson, and G. E. Tompkins. Characteristics of applica-tion software maintenance. Commun. ACM, 21(6):466–471, 1978. [10, 21]
[Mens and Demeyer, 2008] T. Mens and S. Demeyer, editors. Software Evolution. Springer,March 2008. [4, 13]
[Mitchell and Mancoridis, 2006] BS Mitchell and S. Mancoridis. On the automatic modulariza-tion of software systems using the bunch tool. Software Engineering, IEEE Transactions on,32(3):193–208, 2006. [38, 44]
[Muller et al., 2000] Hausi A. Muller, Jens H. Jahnke, Dennis B. Smith, Margaret-Anne Storey,Scott R. Tilley, and Kenny Wong. Reverse engineering: a roadmap. In ICSE ’00: Proceedingsof the Conference on The Future of Software Engineering, pages 47–60, New York, NY, USA,2000. ACM. [13]
[Murphy and Notkin, 1996] Gail C. Murphy and David Notkin. Lightweight lexical source modelextraction. ACM Trans. Softw. Eng. Methodol., 5(3):262–292, 1996. [101, 113]
[Pasareanu and Visser, 2009] Corina S. Pasareanu and Willem Visser. A survey of new trends insymbolic execution for software testing and analysis. International Journal on Software Toolsfor Technology Transfer (STTT), 11(4):339–353, 2009. [86]
[Stephens, 2008] David Stephens. What On Earth is a Mainframe? — An Introduction to IBMzSeries Mainframes and z/OS Operating System for Total Beginners. Longpela Expertise, firstedition, October 2008. [25]
[Storey et al., 1997] M.-A.D. Storey, F.D. Fracchia, and H.A. Mueller. Cognitive design elementsto support the construction of a mental model during software visualization. In 5th InternationalWorkshop on Program Comprehension, page 17, Los Alamitos, CA, USA, 1997. IEEE ComputerSociety. [12]
[Swanson, 1976] E. Burton Swanson. The dimensions of maintenance. In ICSE ’76: Proceedingsof the 2nd international conference on Software engineering, pages 492–497, Los Alamitos,CA, USA, 1976. IEEE Computer Society Press. [21]
[Tas and Sunder, 2004] Jeroen Tas and Shyam Sunder. Financial services business process out-sourcing. Commun. ACM, 47(5):50–52, 2004. [90]
[Tilley et al., 1996] Scott R. Tilley, Dennis B. Smith, and Santanu Paul. Towards a framework forprogram understanding. In Program Comprehension, International Workshop on, page 19, LosAlamitos, CA, USA, 1996. IEEE Computer Society. [11]
150
BIBLIOGRAPHY
[Tonella et al., 2007] Paolo Tonella, Marco Torchiano, Bart Du Bois, and Tarja Systa. Empiricalstudies in reverse engineering: state of the art and future trends. Empirical Software Engineering,12(5):551–571, 2007. [4, 5, 8, 9, 13]
[van Deursen and Kuipers, 1998] Arie van Deursen and Tobias Kuipers. Rapid system under-standing: Two cobol case studies. In Proceedings of the International Workshop on ProgramComprehension (IWPC), pages 90–97. IEEE Computer Society, 1998. [113]
[van Deursen and Kuipers, 1999] Arie van Deursen and Tobias Kuipers. Building documentationgenerators. In Software Maintenance, IEEE International Conference on, page 40, Los Alamitos,CA, USA, 1999. IEEE Computer Society. [89, 92]
[Van Geet and Demeyer, 2007] Joris Van Geet and Serge Demeyer. Lightweight visualisationsof cobol code for supporting migration to SOA. Electronic Communications of the EASST, 8,2007. [37]
[Van Geet and Demeyer, 2009] Joris Van Geet and Serge Demeyer. Feature location in cobolmainframe systems: an experience report. In IEEE International Conference on SoftwareMaintenance (ICSM), 2009. [-]
[Van Geet and Demeyer, 2010] Joris Van Geet and Serge Demeyer. Reverse engineering on themainframe - lessons learned from “in vivo” research. IEEE Software Special Issue on SoftwareEvolution, July 2010. [-]
[Van Geet et al., 2010] Joris Van Geet, Peter Ebraert, and Serge Demeyer. Redocumentation of alegacy banking system: an experience report. In IWPSE-EVOL ’10: Proceedings of the JointERCIM Workshop on Software Evolution (EVOL) and International Workshop on Principles ofSoftware Evolution (IWPSE), pages 33–41, New York, NY, USA, 2010. ACM. [-]
[Vinekar and Huntley, 2010] Vishnu Vinekar and Christopher L. Huntley. Agility versus maturity:Is there really a trade-off? Computer, 43:87–89, 2010. [xvii, 17, 18, 90]
[Ware, 2000] Colin Ware. Information visualization: perception for design. Morgan KaufmannPublishers Inc., San Francisco, CA, USA, 2000. [35]
[Wilde and Scully, 1995] Norman Wilde and Michael C. Scully. Software reconnaissance: map-ping program features to code. Journal of Software Maintenance, 7(1):49–62, 1995. [63]
[Wills and Cross, 1996] Linda M. Wills and James H. Cross, II. Recent trends and open issues inreverse engineering, pages 165–172. Kluwer Academic Publishers, Norwell, MA, USA, 1996.[5]
[Xia and Lee, 2004] Weidong Xia and Gwanhoo Lee. Grasping the complexity of is developmentprojects. Commun. ACM, 47(5):68–74, 2004. [19]
151