Embed Size (px)
Citation preview
MULTIVARIATE PROCESS VARIABILITY MONITORING FOR GENERAL
SAMPLE SIZE
REVATHI A/P SAGADAVAN
UNIVERSITI TEKNOLOGI MALAYSIA

MULTIVARIATE PROCESS VARIABILITY MONITORING FOR GENERAL
SAMPLE DESIGN
REVATHI A/P SAGADAVAN
A thesis submitted in fulfilment of the
requirements for the award of the degree of
Doctor of Philosophy (Mathematics)
Faculty of Science
Universiti Teknologi Malaysia
MARCH 2016

iii
To my beloved family and friends

iv
ACKNOWLEDGEMENT
First and foremost, praises and thanks to the God, the Almighty, for His
showers of blessings throughout my research work to complete the research
successfully. I would like to express my deep and sincere gratitude to Professor Dr.
Maman Abdurachman Djauhari who was my main supervisor from 15 February 2012
until 17 April 2014 when he was contract Professor at Universiti Teknologi Malaysia
(UTM). After he joined Universitas Pasundan, Bandung, Indonesia from 1 May 2014
until 7 September 2014 and then join Universiti Putra Malaysia (UPM) as Fellow
Researcher at Institute for Mathematical Research (INSPEM) from 8 September
2014 until present, he is my co-supervisor. His dynamism, vision, sincerity and
motivation have deeply inspired me. He has taught me the methodology to carry out
the research and to present the research works as clearly as possible. It was a great
privilege and honor to work and study under his guidance. I am extremely grateful
for what he has offered me. I am extending my heartfelt thanks Assoc. Prof. Dr.
Ismail Mohamad, who was my co-supervisor from 15 February 2012 until 17 April
2014 and switched as Main Supervisor from that until present, for his acceptance and
patience during the discussion I had with him on research work and thesis
preparation. I am extremely grateful to my parents for their love, prayers, caring and
sacrifices for educating and preparing me for my future. Also I express my thanks to
my brothers, sisters, sisters in law and brothers in laws for their support and valuable
prayers. Finally, my thanks go to all my friends who have give moral support and be
there for me when I need them. Last but not least, I would like to thank INSPEM and
UPM library for allow me to use their resources.

v
ABSTRACT
In multivariate setting, from time to time, process variability is summarized
and numerically represented as a covariance matrix, say S. It is generally measured
as a non-negative real valued function of S such that the more scattered the
population, the larger the value of the function and vice versa. In the literature, the
three most popular functions are total variance (TV), generalized variance (GV) and
vector variance (VV). Algebraically, TV is the sum of all eigenvalues of S, GV is
the product of those eigenvalues, and VV is their sum of squares. The last two
measures are designed for large sample size. If GV is to detect large shift in
covariance matrix, VV is for small shift. Even though these measures can also be
used for small sample size but the control limits must be determined based on
heuristic approach. In order for those control limits to be related to the probability of
false alarm, a control charting procedure that monitors multivariate variability
changes is introduced in this thesis. The methodology is by maximizing the
summation of conditional variances for all possible permutations or order of
variables. This chart can be used to monitor process variability regardless of the
sample size. Under normality, its exact distribution is derived. For practical
purposes, when the sample size is small, we introduce the use of Solomon and
Stephen’s approximation to that distribution with adjusted-probability of false alarm.
The advantage of the proposed chart is that it could detect very small magnitude of
disturbance in correlation structure which cannot be detected by existing charts.
Besides that, the order of variables will lead to better diagnostic features. The
performance of the proposed chart in terms of average run length (ARL) is very
promising. Some industrial application examples are presented to illustrate the
advantages of the proposed chart.

vi
ABSTRAK
Dalam aturan multivariat, dari semasa ke semasa, proses kebolehubahan
diringkaskan dan diwakili secara berangka sebagai matriks kovarians, katalah S. Ia
secara umumnya diukur sebagai fungsi bernilai nyata tak negatif S demikian
sehingga semakin bertaburan sesuatu populasi, semakin besar nilai fungsi dan
sebaliknya. Dalam literasi, tiga fungsi yang paling popular adalah jumlah varians
(TV), varians umum (GV) dan varians vektor (VV). Secara algebra, TV ialah hasil
tambah semua nilai eigen S, GV ialah hasil darab nilai eigen yang berkenaan dan VV
ialah jumlah kuasa dua nilai eigen tersebut. Dua pengukuran yang terakhir direka
untuk saiz sampel yang besar. Jika GV adalah untuk mengesan anjakan besar dalam
matriks kovarians, VV adalah untuk mengesan anjakan yang kecil. Bahkan kedua-
dua pengukuran ini boleh juga digunakan untuk saiz sampel yang kecil tetapi had
kawalan mesti ditentukan berdasarkan pendekatan heuristik. Untuk membolehkan
had kawalan tersebut dikaitkan kepada kebarangkalian isyarat palsu, prosedur carta
kawalan yang memantau perubahan kebolehubahan multivariat diperkenalkan dalam
tesis ini. Metodologi berkenaan ialah dengan memaksimumkan penjumlahan varians
bersyarat bagi semua pilihatur yang mungkin atau aturan pembolehubah. Carta ini
boleh digunakan untuk memantau proses kebolehubahan tanpa mengira saiz sampel.
Dalam keadaan normal, taburan yang tepat telah diterbitkan. Untuk tujuan praktikal,
apabila saiz sampel kecil, kami memperkenalkan penggunaan penghampiran
Solomon dan Stephen kepada taburan yang diselaraskan dengan kebarangkalian
isyarat palsu. Kelebihan carta yang dicadangkan ialah dapat mengesan magnitud
gangguan yang kecil dalam struktur korelasi yang tidak dapat dikesan oleh carta
sedia ada. Selain daripada itu, susunan pembolehubah akan dapat memberikan ciri
diagnostik yang lebih baik. Prestasi carta yang dicadangkan dari segi purata panjang
jalan (ARL) adalah sangat baik. Beberapa contoh pengunaan dalam industri
dibentangkan untuk menggambarkan kelebihan carta yang dicadangkan.

vii
TABLE OF CONTENTS
CHAPTER TITLE PAGE
DECLARATION ii
DEDICATION iii
ACKNOWLEDGEMENTS iv
ABSTRACT v
ABSTRAK vi
TABLE OF CONTENTS vii
LIST OF TABLES xi
LIST OF FIGURES xii
1 INTRODUCTION 1
1.1 Background of the study 1
1.2 Statement of the Problem 4
1.3 Objectives of the Study 5
1.4 Scope of the Study 6
1.5 Contributions of the Study 7
1.6 Limitation of the Study 8
1.6 Organization of the Thesis 9
2 LITERATURE REVIEW 12
2.1 Multivariate Process Control 12
2.1.1 Process Target 13
2.1.2 Process Variability 16
2.2 Existing Measures of Dispersion 17

viii
2.2.1 Total Variance 17
2.2.2 Generalized Variance 18
2.2.3 Vector Variance 20
2.2.4 Critiques to the Existing Measures 22
2.3 Properties of Control Chart 23
2.4 Summary on Multivariate Process Variability
Monitoring 24
2.5 Opportunity for Improvement 25
2.6 Summary 26
3 RESEARCH METHODOLOGY 27
3.1 Distribution of Sample Covariance Matrix 27
3.1.1 Exact Distribution of Sample
Covariance Matrix 28
3.1.2 Asymptotic Distribution of Sample
Covariance Matrix 29
3.2 Control Limits of GV- chart and VV- chart 29
3.3 Control Chart Construction Procedure 30
3.4 Situations in Multivariate Process Variability
Monitoring 33
3.5 Summary 35
4 EXTENSION OF VARIABILITY CHARTS 36
4.1 Generalized Variance Chart 36
4.1.1 Parameter Estimation for GV Chart 37
4.1.1.1 Single Sample Case 37
4.1.1.2 m Independent Samples
with Equal Sample Size 41
4.1.1.3 General Sampling Design 45
4.2 Vector Variance Chart 48
4.2.1 Parameter Estimation for VV Chart 49
4.2.1.1 Single Sample Case 50

ix
4.2.1.2 m Independent Samples
with Equal Sample Size 51
4.2.1.3 General Sampling Design 53
4.3 Summary 55
5 PROPOSED CONTROL CHART 56
5.1 Proposed Multivariate Dispersion Measure 56
5.1.1 Definition of Proposed Measure 56
5.1.2 Computational Aspects 60
5.2 Background of the [ ( *)]Max tr S 60
5.3 Properties of the Proposed Measure 62
5.4 Computation Algorithm 63
5.4.1 Example 65
5.5 Distributional Property 67
5.5.1 The Exact Distribution 67
5.5.2 Approximation Distribution 68
5.5.2.1 Solomon and Stephen
Approximation 69
5.5.2.2 Normal Approximation 74
5.6 Control Charting 78
5.6.1 Large Sample Size 78
5.6.2 Small Sample Size 79
5.7 Summary 80
6 ASYMPTOTIC PERFORMANCE 81
6.1 Average Run Length 81
6.2 Performance Analysis 83
6.2.1 Case p=3 84
6.2.2 Case p=4 86
6.2.3 Case p=6 88
6.2.4 Discussion 89
6.3 Advantages and Limitations 90

x
6.4 Summary 91
7 ILLUSTRATIVE EXAMPLES 92
7.1 Guidelines of Out-of- Control Signals 92
7.2 Teaching and Learning Process Monitoring 93
7.2.1 GV Chart 95
7.2.2 VV Chart 96
7.2.3 Discussion 98
7.3 Production Process of Flanges Monitoring 99
7.3.1 Discussion 103
7.4 Summary 104
8 CONCLUSIONS AND FUTURE WORKS 105
8.1 Conclusions 105
8.1.1 First Issue: General Sampling Design 105
8.1.2 Second Issue: New Measure to
Multivariate Variability 106
8.1.3 Third Issue : Multivariate Variability
Control Chart for Small n 106
8.2 Directions of Future Research 107
REFERENCES 108
Appendices A-G 115

xi
LIST OF TABLES
TABLE NO TITLE PAGE
2.1 References on the multivariate process variability 24
5.1 Respective Tr(S*) values 66
5.2 PPCC values for certain (n,p) 74
5.3 p- values of AD normality test for p=2 76
5.4 p- values of AD normality test for p=3 77
5.5 p- values of AD normality test for p=4 77
6.1 Preparation for Solomon Stephen Approximation 84
6.2 1ARL for p=3, n=5 for certain shifts in covariance
matrix 85
6.3 Preparation for Solomon Stephen Approximation 86
6.4 1ARL for p=4, n=5 for certain shift in covariance
matrix 87
6.5 Preparation for Solomon Stephen Approximation 88
6.6 1ARL for p=6, n=10 for certain shift in covariance
matrix 89
7.1 Sample covariance matrices, Si of teaching and
learning process 94
7.2 GV values and the control limits 95
7.3 VV values and the control limits 96
7.4 Sample Covariance Matrices 99
7.5 Summary of [ ( )]iMax tr S values 101
7.6 Preparation for Solomon Stephen Approximation 102
xii
LIST OF FIGURES
FIGURE NO TITLE PAGE
1.1 Summary of the thesis content 11
3.1 The situation in process variability monitoring 34
5.1 QQ-plot between theoretical and approximated
distributions for (n,p) =(5,3) 71
5.2 QQ-plot between theoretical and approximated
distributions for (n,p) =(10,3) 71
5.3 QQ-plot between theoretical and approximated
distributions for (n,p) =(8,4) 72
5.4 QQ-plot between theoretical and approximated
distributions for (n,p) =(10,4) 72
5.5 QQ-plot between theoretical and approximated
distributions for (n,p) =(8,6) 73
5.6 QQ-plot between theoretical and approximated
distributions for (n,p) =(10,6) 73
7.1 GV chart of teaching and learning process 96
7.2 VV chart of teaching and learning process 97
7.3 ( ( ))iMax Tr S chart of flanges production 103

xiii
LIST OF ABBREVIATION
GV - Generalized variance
VV - Vector variance
TV - Total variance
IGV - Improved generalized variance
OOC - Out- of control
MEWMA - Multivariate exponentially weighted moving average
MCUSUM - Multivariate cumulative sum
PCA - Principle component analysis
LCL - Lower control limit
UCL - Upper control limit
CL - Control limit
PPCC - Probability plot correlation coefficient
Q-Q plot - Quantile-Quantile Plot

xiv
LIST OF APPENDICES
APPENDIX TITILE PAGE
A Papers Published During the Authors Candidature 115
B Matlab Programming Code of ARL Computation
for p= 3 117
C Matlab Programming Code of ARL Computation
for p= 4 120
D Matlab Programming Code of ARL Computation
for p= 6 124
E Matlab Programming Code of Normality Check
for p= 2 129
F Matlab Programming Code of Normality Check
for p= 3 133
G Matlab Programming Code of Normality Check
for p= 4 137

CHAPTER 1
INTRODUCTION
The aim of this chapter is to introduce the importance of this research. In
Section 1.1, the background of the problem will be discussed. In section 1.2, the
discussion will be on the problem statement which is the sole ingredient for the
output of this thesis. The following section will cover the objectives of this research.
The scope of the study, thesis organization and significance of the study will be
presented in Section 1.4, Section 1.5 and Section 1.6, respectively.
1.1 Background of the Study
In industrial practices, a process is always monitored to make sure that it goes
on the right track with the quality that intended. A process can be monitored in
terms of its process target and variability. The monitoring process of the latter is
more difficult than the former which, in this era, is getting more attention. This is
because variability is reciprocal to quality. The smaller the variability of a process
the higher the quality of that particular process and conversely. Thus, to ensure the
quality of the process, variability must be monitored. In multivariate setting, which
means that more than one interrelated quality characteristics need to be monitored
simultaneously, the situation becomes more crucial due to the difficulty of defining
and measuring process variability.
2
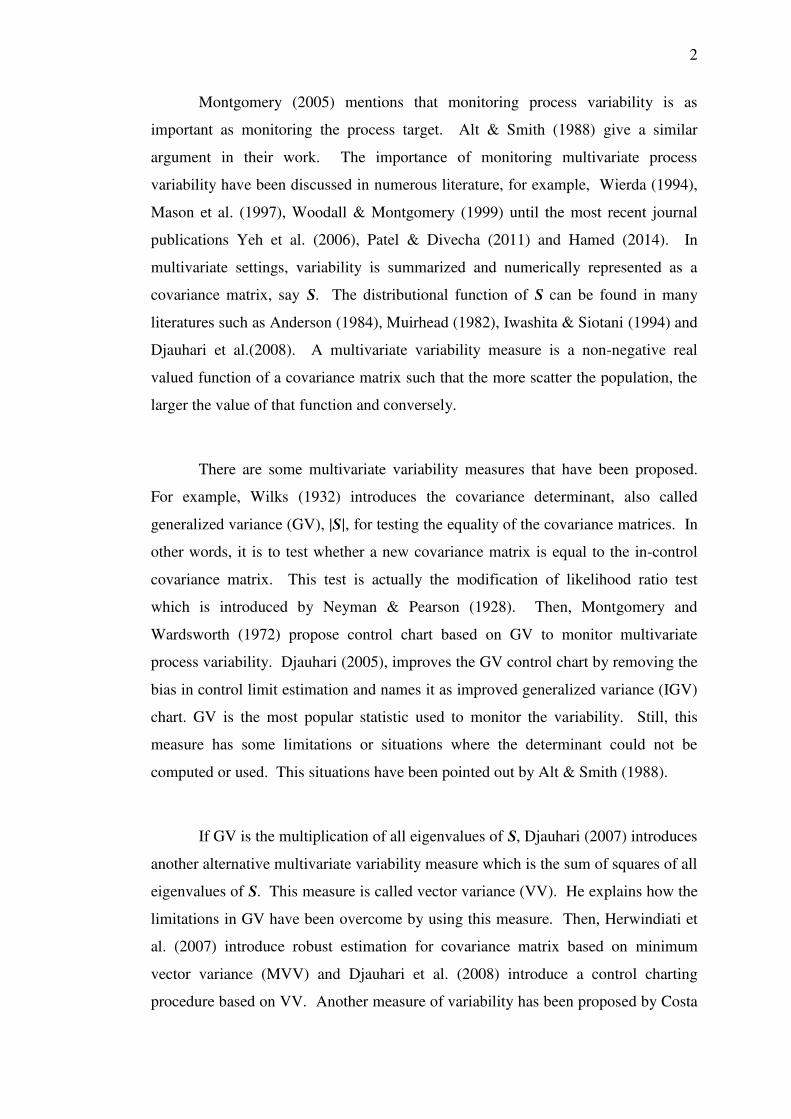
Montgomery (2005) mentions that monitoring process variability is as
important as monitoring the process target. Alt & Smith (1988) give a similar
argument in their work. The importance of monitoring multivariate process
variability have been discussed in numerous literature, for example, Wierda (1994),
Mason et al. (1997), Woodall & Montgomery (1999) until the most recent journal
publications Yeh et al. (2006), Patel & Divecha (2011) and Hamed (2014). In
multivariate settings, variability is summarized and numerically represented as a
covariance matrix, say S. The distributional function of S can be found in many
literatures such as Anderson (1984), Muirhead (1982), Iwashita & Siotani (1994) and
Djauhari et al.(2008). A multivariate variability measure is a non-negative real
valued function of a covariance matrix such that the more scatter the population, the
larger the value of that function and conversely.
There are some multivariate variability measures that have been proposed.
For example, Wilks (1932) introduces the covariance determinant, also called
generalized variance (GV), |S|, for testing the equality of the covariance matrices. In
other words, it is to test whether a new covariance matrix is equal to the in-control
covariance matrix. This test is actually the modification of likelihood ratio test
which is introduced by Neyman & Pearson (1928). Then, Montgomery and
Wardsworth (1972) propose control chart based on GV to monitor multivariate
process variability. Djauhari (2005), improves the GV control chart by removing the
bias in control limit estimation and names it as improved generalized variance (IGV)
chart. GV is the most popular statistic used to monitor the variability. Still, this
measure has some limitations or situations where the determinant could not be
computed or used. This situations have been pointed out by Alt & Smith (1988).
If GV is the multiplication of all eigenvalues of S, Djauhari (2007) introduces
another alternative multivariate variability measure which is the sum of squares of all
eigenvalues of S. This measure is called vector variance (VV). He explains how the
limitations in GV have been overcome by using this measure. Then, Herwindiati et
al. (2007) introduce robust estimation for covariance matrix based on minimum
vector variance (MVV) and Djauhari et al. (2008) introduce a control charting
procedure based on VV. Another measure of variability has been proposed by Costa

3
& Machado (2009). The statistic, named VMAX , is constructed based on the
standardized sample variance of p quality characteristics. This statistic is said to be
faster in detecting the process changes and better in identifying an out of control
signal compared to GV.
Those statistics lead to the construction of control charts for monitoring
multivariate process variability. The sole objective of those control charts is to
monitor whether the process is in-control. In the literature there are three famous
charts which are total variance (TV) chart, GV or IGV chart and VV chart. All these
statistics can be viewed as a result of algebraic diagonalization. However, algebraic
diagonalization has some limitations; it provides us only with a necessary condition
for two covariance matrices to be equal to each other.
TV chart will not be included in the discussion as it involves only the
variances and not the covariance among the variables. The latter two charts are more
widely used in real life. These measures have their own limitations. Besides that,
the exact distribution is difficult to be derived or impractical for p>2. The control
limits for these charts are constructed based on probability limit or 3 sigma principle.
When probability limit is used, the false alarm is known but it is only applicable for
large sample size. Meanwhile, 3- sigma principle chart is applicable for both large
and small sample size but the disadvantage of this method is that the probability of
false alarm is unknown.
If the probability of false alarm is taken into account in the determination of
its control limits, then a large sub-group size is needed. However, this is not
favorable in manufacturing industry environment because: (i) in this industry data
collection is not cheap, it is time consuming, and thus only limited sub-group size is
available during monitoring operations, and (ii) fast and accurate decision is the main
concern from management. In practice, the available charts are more suitable to
detect large shift in the covariance structures and applicable for equal subgroup size.

4
If the probability of false alarm is taken into account in the determination of
its control limits, then a large sub-group size is needed. However, this is not
favorable in manufacturing industry environment because: (i) in this industry data
collection is not cheap, it is time consuming, and thus only limited sub-group size is
available during monitoring operations, and (ii) fast and accurate decision is the main
concern from management.
These limitations and challenges lead to the outcome of this thesis. There are
three open problems to be tackled. In this thesis, a new measure to monitor
multivariate process variability is constructed. This measure is helpful in detecting
small shift in covariance structure where the existing charts are not able to do so.
The exact distribution of the measure will be derived. The control limits with known
false alarm will also be constructed for both large and small sample size. Then, this
measure will be extended to be used in all sample size or general sampling design.
The control limits of GV and VV chart for general sampling design are also derived.
The implementation of the proposed measure will be demonstrated by using user
friendly software. The extension of the existing charts and the proposed one will
also be developed to cover service industry, where sub - group size cannot be
controlled. At the end, some industrial examples based on manufacturing industry
and service industry will be presented to illustrate the advantages of the proposed
methods.
1.2 Statement of the Problem
Research backround presented in the previous section leads us to the
following research problem. In previous works, the three most popular measures of
multivariate dispersion, are TV, GV and VV. These measures are a positive, real
valued functions of S. These functions are defined as an algebraic function.
Algebraically, TV is the sum of all eigenvalues of S, GV is the product of all
eigenvalues, and VV is the sum of squares of all eigenvalues.

5
These measures pose some drawbacks. Although, they are used widely in
practice, the signals in the chart are clueless about the exact root causes. In this
situation a measure which can be more effective as variability measure with better
diagnostic features is needed. It is worth noting that until present, there exists no
comparable charting technique for the case where the subgroup size, n, is small and
the control limits are defined based on probability limits. The advantage of this
technique is that the probablity of false alarm is known. Moreover, it can detect the
overall shift in covariance structure, while the existing charts are designed to detect
the large shift.
Thus, the main obstacle that need to be tackled in this thesis is to find a
control charting method which can detect small shift in covariance structure. On the
other hand, the generalization of the existing charts with varying sample size is
needed. Therefore, this research is basically a research in mathematical statistics to
develop a statistical tool which can overcome the limitations of existing control
charts without neglecting its applications.
1.3 Objectives of Study
The intention of this study is to handle the limitations of the existing
multivariate process variability control charting procedure and introduce a new one.
There are five main objectives in this study.
(i). To construct a new measure of multivariate process variability with better
diagnostic features.
(ii). To derive the distribution of the proposed measure to understand its
behaviour.
(iii). To develop control chart to monitor multivariate process variability based on
probability limit for the case where sample size, n, is small.

6
(iv). To derive the existing control limits of GV and VV chart for equal subgroup
size.
(v). To modify the control limits of GV and VV chart for general sampling
design.
At the end of this study, author believe that the research achieved all the objectives
above.
1.4 Scope of Study
The research is focused on process variability monitoring in multivariate
settings. It covers three main aspects; theoretical, computational and practical
aspects.
(i) Theoretical aspects
In order to have a better understanding about multivariate process variability
monitoring and controlling, author have derived and discussed the readily available
control charts, i.e., GV chart and VV chart. The control limits of these charts are
then derived for general sampling design. Then, a new multivariate variability
measure having better diagnostic features is constructed. The distribution of this
measure is derived. In order to monitor the variability, a control chart based on this
measure with probability limits is introduced. Its power is investigated in terms of
average run length (ARL). ARL is the most commonly used metric to validate the
performance of the control chart.
(ii) Computational Aspects
From computational point of view, the scope of study covers the simulation
experiments to illustrate the convergence of the new measure towards the asymptotic

7
distributions. An algorithm to compute the proposed measure and a chart
construction are discussed too. Finally, simulation experiments on its ARL is carried
out to show the power of proposed chart. A user friendly software, constructed in
MATLAB system and in MS Excel System, are also developed for computation
purpose.
(iii) Practical Aspects
Application in real industrial problems is presented and discussed to show the
advantages of the new measure and its corresponding control chart developed in this
thesis.
1.5 Contributions of the Study
This study offers few contributions. There exists no comparable control
charting technique for the case where sample size, n, is small and the control limits
are defined based on probability limits. By defining the control limits based on
probability limit users will be aware of the exact false alarm risk. This will be the
main contribution of this study. Besides that, this study will explicitly contribute to
the statistical process variability control as follows :
I. A new measure of multivariate process variability with more
promising diagnostic feature.
II. A new multivariate process variability monitoring based on the
proposed measure.
III. Two theorems based on Solomon and Stephens approximation and
normal approximation of new measure is discovered
IV. Control chart which is able to detect small shift in the covariance
matrix.
V. Algorithm to compute the new measure and construct the
corresponding control chart.

8
VI. Derivation of existing GV and VV chart control limits for the case of
one sample and m equal samples.
VII. Extend the usage of GV and VV charts to the general sampling
design.
VIII. Better understanding about the variance or covariance shift by using
the existing charts and the new chart simultaneously.
In brief, this study is believed to give a significant impact on statistical
process control in general and multivariate process variability monitoring in
particular.
1.6 Limitation of the Study
This study is limited to process variability monitoring in multivariate setting.
In this situation, the thesis is only focusing on monitoring process when observations
are available as batch data or subgroups. Thus, it is limited to n>1. Also, the
extended GV chart and VV chart are only applicable when large sample size is
available. But, the proposed chart do not require sample size restriction as it can be
used for both large and small sample size. The restrictions of the charts in terms
performance are listed as below:
(i) GV chart is suitable to be used in the situation where the covariance structure
experiencing large shift. It is not sensitive towards small shifts in covariance
structure.
(ii) VV chart is more appropriate to be used in the case where covariance
structure poses small shift . This chart also can be used for large shift but
more appropriate to be used in small shift cases.
9
(iii) The proposed chart is able to detect the variance shift in both small shift and
large shift. But, according to correlation shift it is more appropriate to be
used to detect very small shift in correlation and not the large shift .
The limitations have been discussed in terms of availability of sample size as
well as the performance. In conclusion, it will be more appropriate to use all the
three charts simultaneously to understand the situation in process variability in detail
as they react to different type of situations.
1.7 Organization of the Thesis
This thesis is organized into seven chapters. The first chapter is to give an
overall idea about the research work. It covers the aim and the need of doing this
research. Thus, it includes some backgrounds about the research work together with
the problem statement, objectives of research, scope or limitation of research, and
also the significant contributions of the study in the statistical quality control area.
The second chapter will cover the literature review which is essential for this
particular research activity. It represents the past work of researchers regarding
multivariate process variability control. In this chapter, there will be a discussion
regarding past works on multivariate process variability, the existing multivariate
variability measures and their advantages and also weaknesses. It also includes
different approaches in defining control limits of the control charts for monitoring
multivariate process variability and how the performance of the chart is being
evaluated. In the last part of this chapter, an overall view on the proposed solution
will be presented.
Chapter 3 is devoted for the extension of GV and VV charts which make
them enable to be used in general sampling design. There will also be detailed
derivation of control limits for both charts in all three cases; (i) one sample, (ii) m
equal subgroup size and (iii) m unequal subgroup size. In addition, the exact and

10
asymptotic distribution of covariance matrix is also described. Chapter 4 will cover
the main objective of this thesis. The new control chart based on the new measure is
proposed. Two different approaches in computing the measure will be covered in
this chapter. An algorithm to calculate the measure is given too. Besides that, the
exact and also asymptotic distribution of the new measure will be discussed. Lastly,
the control chart construction for large sample size and small sample size will close
the presentation of this chapter.
Next, in Chapter 5 there will be an exploration of asymptotic performance of
the proposed chart. First, the power function of the proposed measure will be
derived and it is followed by an evaluation of its performance for different number of
variables. In the last part of this chapter the advantages and limitations of the
proposed measure and chart will be discussed. In Chapter 6, applications of the
methods developed in this research will be found, not only in manufacturing industry
but also in service industry. The presentation of this thesis will be closed with some
conclusions and also some suggestions for the future research works in Chapter 7.
The overall thesis is summarized in Figure 1.1.

11
Chapter 2: Literature Review
Multivariate process control
Existing measures of
Dispersion
Properties of Control Chart
Opportunity for
Improvement
Critiques to exsiting
variability measures
Chapter 3: General Sampling Design
GV- chart VV- chart
Chapter 5: Asymptotic Performance
Average Run Length
Performance Analysis Advantages and
Limitations
Figure 1.1: Summary of the thesis content
Chapter 1: Introduction
Research Background
Problem Statement
Research Objectives
Scope of the
Research
Research Contributions
Thesis Organization
Chapter 4: Proposed Methodology
Proposed measure
Computation Algorithm
Distributional Aspects
Control Chart Construction
Chapter 7: Conclusions and Direction for Future work
Chapter 6: Illustrative Examples
Teaching and Learning Process Monitoring Production Process of Flanges Monitoring

108
REFERENCES
Alt, F. B. (1985). Multivariate Quality Control. Encyclopedia of Statistical Sciences,
Vol 6. Wiley, New York.
Alt, F. B., & Smith, N. D. (1988). Multivariate Process Control. Handbook of
Statistics, 7: 333-351, (Krishnaiah, P.R. and Rao, C.R.Eds), Elsevier Science
Publishers.
Alves, C.C., Samohyl, R.W., & Henning, E. (2010). Application of multivariate
cumulative sum control charts (MCUSUM) for monitoring a machining
process. XVI International Conference on Industrial Engineering and
Operations Management.. Sao Carlos, SP, Brazil, 12-15 October 2010.
Anderson, T. W. (1984). An Introduction to Multivariate Analysis. 2nd Edition. New
York : John Wiley and Sons, Inc.
Aparisi, F., Jabaioyes, J., & Carrion, A. (1999). Statistical Properties of thr |S|
Multivariate Control Chart. Communication in Statistics - Theory and
Methods. 28(11). 2671- 2686.
Avendano, G., Aparisi, F., & Sanz, J. (2010). Interpreting the Out - of - Control
Signals of the Generalized Variance |S| Control Chart. Proceeding of the 2010
IEEE IEEM. 1588-1591.
Barbosa, E.P., Gneri, M.A., & Meneguetti, A. (2007). |S| control chart for
multivariate process variability monitoring based on Cornish- Fisher
Correction and Meijer- G Function.
Bersimis. S., Psarakis.S., & Panaretos.J. (2007). Multivariate Statistical Process
Control Charts: An Overview. Quality And Reliability Engineering
International. 23:517–543.
Bisgaard, S., & Huang, X. (2008). Visualizing Principle Components Analysis for
Multivariate Process Data. Journal of Quality Technology. 40(3): 299-309.
Chatterjee, S., & Hadi, A.S. (1988) Sensitivity Analysis in Linear Regression. New
York, John Wiley & Sons.

109
Cleroux, R., & Ducharme, G. R. (1989). Vector Correlation for Eliptical
Distributions. Communication in Statistics- Theory and Methods. 18(4):
1441-1454.
Costa, A.F.B., & Machado, M.A.G. (2009). A New Chart Based on Sample
Variances for Monitoring the Covariance Matrix of Multivariate Processes.
International Journal of Advance Manufacturing Technology 41: 770 - 779.
Crosier, R. B. (1988). Multivariate Generalization of Cumulative Sum Quality-
Control Schemes. Technometrics. 30: 291-302.
Croux, C., & Haesbroeck, G. (1999). Influence Function and Efficiency of The
Minimum Covariance Determinant Scatter Matrix Estimator. Journal of
Multivariate Analysis. 71: 161–190.
Davis, R. B. (1999). Designing S- Charts with Two Average Run Length Constraints.
Journal of Quality Technology. 31(2): 246-248.
Davis, R. B. (2004). Constructing Control Charts with Average Run Lengths
Constraints. Proceedings of the American Society for Engineering Education
Annual Conference & Exposition.
Djauhari, M. A. (2005). Improved Monitoring of Multivariate Process Variability.
Journal of Quality Technology, 37(1), 32-39.
Djauhari, M. A. (2007). A Measure of Multivariate Data Concentration. Journal of
Applied Probability & Statistics. 2(2): 139-155.
Djauhari, M. A. (2010). A Multivariate Process Variablity Monitoring Based on
Individual Observations. Journal of Modern Applied Science. 4(10): 91-96.
Djauhari, M. A. (2011). Geometric Interpretation of Vector Variance.
MATEMATIKA. 27(1): 51-57.
Djauhari, M. A., Mahsuri, M., & Herwindiati, D.E., (2008). Multivariate Process
Variability Monitoring . Communications in Statistics- Theory and Method,
37(11), 1742 - 1754.
Djauhari, M.A. (2009). Asymptotic Distribution of Sample Covariance Determinant.
MATEMATIKA. Volume 25, Number 1, 79 - 85.
Djauhari, M. A. (2011). Manufacturing Process Variability: A Review. ASM Science
Journal. 5(2): 123-137.
Fuchs, C., & Kenett, R.S. (1998). Multivariate Quality Control. Marcel Dekker: New
York.

110
Grambow, S., & Stromberg, A.J. (1998). Combining the EID and FSA for Computing
the Minimum Volume Ellipsoid, Department of Statistics, University of
Kentucky.
Hadi, A. S. (1992). Identifying Multivariate Outliers in Multivariate Data. Journal of
Royal Statistical Society B. 53: 761-771.
Hamed, M.S. (2014). Generalized Variance Chart for Multivariate Quality Control
Process Procedure with Application. Applied Mathematical Sciences 8(163):
8137-8151.
Hawkins, D. M. (1991). Regression Adjustment for Variables In Multivariate Quality
Control. Journal of Quality Technology. 25:175-182.
Herwindiati, D. E., Djauhari, M. A., & Mahsuri, M. (2007). Robust Multivariate
Outlier Labelling. Journal of Communication in Statistics - Computation and
Simulation, 36: 1287 - 1294.
Hogg, R. V., Mckean, J. W., & Craig, A. T. (2004). Introduction to Mathematical
Statistics. Sixth Edition. Pearson Prentice Hall. Upper Saddle River, New
Jersey.
Hotelling, H. (1931). The Generalization of Student's Ratio. Ann.Math.Stat. 2
(3):360-378.
Hotelling, H. (1947). Multivariate Quality Control.Techniques of Statistical Analysis.
McGraw-Hill, New York. 111-184.
Huwang, L., Yeh, A. B., & Wu, C. W. (2007). Monitoring Multivariate Process
Variablity for Individual Observations. Journal of Quality Technology. 39(3):
258-278.
Iwashita, T., & Siotani, M. (1994). Asymptotic Distributions of Functions of a
Sample Covariance Matrix Under the Elliptical Distribution. Canadian
Journal of Statistics. 22(2): 273-283.
Jensen, W. A., Birch, J. B., & Woodall, W. H. (2007). High Breakdown Point
Estimation Methods for Phase I Multivariate Control Charts. Quality and
Reliability Engineering International. 23(5):615-629.
Johnson, R. A., & Winchern, D. W. (2007). Applied Multivariate Statistical
Analysis. 6th Edition. New York: John Wiley.

111
Khoo, M.B.C., & Quah, S.H. (2003). Multivariate Control Chart for Process
Dispersion Based on Individual Observations. Quality Engineering.15
(4): 639–642.
Kollo, T., & Rosen, D. V.(2005). Advanced Multivariate Statistics with Matrices.
First Edition. Springer.
Kowal, R. R. (1971). Disadvantages of the Generalized Variance as A Measure of
Variability. Biometrics. 27(1): 213-216.
Lowry,C.A., Woodall,W.H., Champ, C.W., & Rigdon,S.E. (1992). A multivariate
exponentially weighted moving average control chart. Technometrics. 34(1):
46-53.
Lowry, C.A., & Montgomery, D.C. (1995). A Review of Multivariate Control
Charts. IIE Transactions . 27:800–810.
Mahalanobis, P.C. (1930). On tests and measures of groups divergence. Journal and
Proceedings of the Asiatic Society of Bengal. 26: 541-588.
Mardia, K. V., Kent, J. T., & Bibby, J. M. (2000). Multivariate Analysis. 7th ed.
Academic Press.
Mason, R. L., Tracy, N.D., & Young, J. C. (1995). Decomposition of T2 for
Multivariate Control Chart Interpretation. Journal of Quality Technology.
27(2): 109-119.
Mason, R. L., Champ, C.V., Tracy, N.D., Wierda, S. J., & Young, J. C. (1997).
Assessment of Multivariate Process Control Techniques; A Discussion on
Statistically - Based Process Monitoring and Control. Journal of Quality
Technology. 29(2): 140 - 143.
Mason, R.L., Chou, Y.M., & Young, J.C. (2009). Monitoring Variation In A
Multivariate Process When The Dimension Is Large Relative To The Sample
Size. Communications in Statistics – Theory and Methods, 38: 939 – 951
Mason, R.L., Chou, Y.M., & Young, J.C. (2010). Decomposition Of Scatter Ratio
Used In Monitoring Multivariate Process Variability. Communications in
Statistics – Theory and Methods, 39: 2128- 2145.
Mason, R.L., Chou, Y.M., & Young, J.C. (2011). Detecting And Interpretation Of A
Multivariate Signal Using Combined Charts. Communications in Statistics –
Theory and Methods, 40: 942 – 957.
Mason, R.L., Tracy, N. D., & Young, J.C. (1995). Decomposition for Multivariate
Control Chart Interpretation. Journal of Quality Technology. 27(2): 99-108.

112
Mason, R.L., Young, J.C. (2001). Implementing Multivariate Statistical Process
Control Using Hotelling's 2T Statistic. Quality Progress, April: 71-73.
Mason, R.L., & Young, J.C. (2002). Multivariate Statistical Process Control with
Industrial Applications. ASA-SIAM Series on Statistics and Applied
Probability.
Mathai, A. M. (1972). The Exact Non-Central Distribution of the Generalized
Variance. Ann. Inst. Stat. Math. 24: 53-65.
Memar, A.O., & Niaki, S.T.A. (2009). New Control Charts for Monitoring
Covariance Matrix With Individual Observations. Quality and Reliability
Engineering International. 25: 821–838.
Molnau, W.E., Runger, G.C., Montgomery, D.C.,Skinner, K.R., & Loendo, E.N.
(2001). A Program for ARL Calculation for Multivariate EWMA Charts.
Journal of Quality Technology. 33(4).
Montgomery, D.C., & Wardsworth, H.M. (1972). Some Techniques for Multivariate
Quality Control Applications. ASQC Technical Conference Transactions.
427-435.
Montgomery, D.C. (2005). Introduction to Statistical Quality Control. Fifth Edition.
John Wiley and Son, Inc.,NY.
Muirhead, R. J. (1982). Aspect of Multivariate Statistical Theory. John Wiley &
Sons, Inc : New York.
Mustonen, S. (1997). A Measure for Total Variability in Multivariate Normal
Distribution. Computational Statistics & Data Analysis, 23 : 321 - 334.
Neyman, J., & Pearson, E.S. (1928). On the Use and Interpretation of Certain Test
Criteria for Purposes of Statistical Inference. Biometrika, 20 (A), 175 - 240.
6(2): 116-120.
NIST/SEMATECH (2012) Engineering Statistics: E-handbook of Statistical
Methods. http://www.e-booksdirectory.com/details.php?ebook=4025 .
Oakland,J. (2006). Multivariate Statistical Process Control Charts: An Overview.
Quality And Reliability Engineering International:23 : 517 – 543..
Patel, A. K., & Divecha, J. (2011). Modified Exponentially Weighted Moving
Average (EWMA) Control Chart for An Analytical Process Data. Journal of
Chemical Engineering and Materials Sciences. 2(1): 12-20.
Pena, D., & Rodriguez, J. (2005). Descriptive Measures of Multivariate Scatter and
Linear Dependence. Journal of Multivariate Analysis. 85: 361–374.

113
Prabhu, S. S., & Runger G.C. (1997). Designing a Multivariate EWMA Control
Chart. Journal of Quality Technology. 29(1): 8-15.
Reynolds, M. R., & Stoumbos, Z. G. (2006). Comparisons of Some Exponentially
weighted Moving Average Control Charts for Monitoring the Process Mean
and Variance. Technometrics, 48(4):550-567.
Rousseeuw, P. J. (1985). Multivariate Estimation with High Breakdown Point, in
Mathematical Statistics and Applications, Reidel Publishing Company.
Ryan, T.P. (2000). Statistical Methods for Quality Improvement, 3rd edition. John
Wiley & Sons, Inc.: New Jersey.
Saghir. A. (2015). The Bivariate Dispersion Control Charts for Non-Normal
Processes. International Journal of Production Research. 53(7): 1964–1979.
Salleh, R. M., & Djauhari, M. A. (2010). Robust Start up Stage for Beltline
Moulding Process Variablitiy Monitoring Using Vector Variance. Journal of
Fundemental Sciences. 6(1): 68-72.
Scranton, R., Runger, G. C., Keats, J. B., & Montgomery, D.C. (1996). Efficient
Shift Detection Using Multivariate Control Charts And Principal Components
Exponentially-Weighted Moving Average. Quality and Reliability
Engineering International. 12:165-171.
Serfling, R. J. (1980). Approximation Theorems of Mathematical Statistics. New
York: John Wiley & Sons.
Solomon, H., & Stephens, M. A. (1977). Distribution of a Sum of Weighted Chi-
Square Variables. Journal of American Statistical Association, 72, 881-885.
Sparks R.S. (1992). Quality Control with Multivariate Data. Australian Journal of
Statistics. 34:375–390.
Sullivan, J. H., & Woodall, W. H. (1996). A Comparison of Multivariate Control
Charts for Individual Observation. Journal of Quality Technology. 28(4):
398-408.
Tang, P. F., & Barnett, N. S. (1996). Dispersion Control for Multivariate Processes.
Australian Journal of Statistics. 38(3): 235-251.
Tracy, N. D., & Young, J. C. (1992). Multivariate Control Charts for Monitoring
Individual Observations. Journal of Quality Technology. 24: 88-95.
Wheeler, D. J., & Chambers, D. S. (1992). Understanding Statistical Process
Control, (2nd Ed). Knoxville, TN: SPC.

114
Whittaker, J. (2008). Graphical Models in Applied Multivariate Statistics. John
Wiley & Sons.
Wierda, S. J. (1994). Multivariate Statistical Process Control - Recent Results and
Directions for Future Research. Statistica Neerlandica. 48(2): 147 - 168.
Wilks, S. S. (1932). Certain Generalizations in the Analysis of Variance. Biometrika,
24 (3), 471 - 494.
Woodall, W. H., & Ncube, M. M. (1985). Multivariate CUSUM Quality-Control
Procedures. Technometrics. 27: 285-292
Woodall, W. H., & Montgomery, D. C. (1999). Research Issues and Ideas in
Statistical Process Control. Journal of Quality Technology. 31(4): 376-386.
Woodall, W. H. (2000). Controversies and Contradictions in Statistical Process
Control. Journal of Quality Technology. 32(4): 341-350.
Xie, M., & Goh, T.N. (1997). The Use of Probability Limits for Process Control
Based on Geometric Distribution. International Journal of Quality &
Reliability Management. 14(1): 64 - 73.
Yeh, A.B., Huwang, L., & Wu, Y.F.(2004). A Likelihood-Ratio-Based EWMA
Control Chart For Monitoring Variability Of Multivariate Normal Processes.
IIE Transactions. 36: 865– 879.
Yeh, A.B., Lin, D.K.J., & McGrath, R.N. (2006). Multivariate Control Charts for
Monitoring Covariance Matrix : Review. Quality Technology & Quantitative
Management. Vol 3, No.4, pp. 415 - 436.
Zhang, L., & Govindaraju, K. (2007). On Probability Limits for Phase II S Control
Chart. International Journal of Statistics. LXV(3) : 305- 318.

115
Appendix A
PAPERS PUBLISHED DURING THE AUTHORS CANDIDATURE
Sagadavan, R., & Djauhari, M. A. (2013, September). Autocorrelated multivariate
process control: A geometric Brownian motion approach. In INTERNATIONAL
CONFERENCE ON MATHEMATICAL SCIENCES AND STATISTICS 2013
(ICMSS2013): Proceedings of the International Conference on Mathematical
Sciences and Statistics 2013 (Vol. 1557, No. 1, pp. 571-575). AIP Publishing.
(Web of Science)
Sagadavan, R., Djauhari, M.A., & Mohamad, I. (2014, December). Estimation of
population generalized variance: Application in service industry. In Industrial
Engineering and Engineering Management (IEEM), 2014 IEEE International
Conference on (pp. 132-136). IEEE.
Sagadavan, R., & Djauhari, M. A. (2012)Process Variability Monitoring Based on
Individual Observations: A Partial Least Squares Approach. In International
Conference on Statistics in Science, Business and Engineering 2012(ICSSBE2012)
10-12 September 2012, Langkawi, Malaysia.
Sagadavan, R., Djauhari, M.A., & Mohamad, I. Generalized Variance Chart: Root
Causes Analysis. International Statistical Institute Regional Statistics Conference
2014, November (2014), Kula Lumpur, Malaysia.

116
Sagadavan, R., Djauhari, M.A., & Mohamad, I. Multivariate Process Variability
Monitoring For General Sampling Design. Proceeding of 3rd
International Science
Postgraduate Conference 2015(ISPC2015) Faculty of Science, UniversitiTeknologi
Malaysia.
Sagadavan, R., Djauhari, M.A., & Mohamad, I. Generalized Variance Chart: Root
Causes Analysis. Mathematics Postgraduate Colloqium 2014, Department of
Mathematical Sciences, UTM Johor Bharu.