Embed Size (px)
Citation preview
Progress Report
RETROFIT CATHODIC PROTECTION OF MARINE PIPELINES ASSOCIATED
WITH PETROLEUM PRODUCTION
submitted to
Minerals Management Service Department of the Interior
prepared by
Dr. William H. Hartt, Professor and Director Center for Marine Materials
Department of Ocean Engineering Florida Atlantic University - Sea Tech Campus
101 North Beach Road Dania Beach, Florida 33004
May 18, 2000
TECHNICAL SUMMARY
Marine oil and gas transportation pipelines have been in service in the Gulf of Mexico for almost 50
years. These lines are invariably protected from external corrosion by a combination of coatings and
cathodic protection (cp); however, the design life of such protection systems upon older lines has now been
exceeded in many cases and retrofitting may soon be required. This project was initiated in 1997 for the
purpose of establishing criteria and protocols for design of pipeline retrofit cp systems. This report
describes progress that has been made to-date although the research remains ongoing. The building block
of the study has been development of a first-principles based equation that projects potential attenuation
and anode current output for a cp system comprised of multiple galvanic anodes. This equation
incorporates all relevant terms, including I) anode (electrolyte) and metallic path resistances, 2) coating
quality, 3) pipe current density demand, 4) pipe and anode dimensions, and 5) electrolyte properties. This
is in contract to previous approaches, including the equations of rvtorgan and Uhlig and Boundary Element
Modeling computer programs. which exclude one or more of these terms. Accuracy and utility of the
equation with regard to projection of I) potential profiles, 2) anode current output, and 3) current density
demand (a parameter that is critical to retrofit cp design) has been demonstrated. Also important is the fact
that maximized spacing of anode sleds (such sleds are invariably a part of pipeline cp retrofits) can be
projected from the equation, whereas none of the existing alternative approaches permit this. A companion
effort is addressing design of anode sleds per se. Relatedly, progress has also been in adapting the recently
developed Slope Parameter cp design method to pipelines, although this is likely to be of use more in cp
design for new rather than for retrofit installations. In the remainder of the project, efforts will be focused
upon continued development of the first-principles based equation and its application to design and to
development of a simplified retrofit design format spreadsheet.
ii
TABLE OF CONTENTS
1. EXECUTIVE SUMMARY ii
2. TABLE OF CONTENTS Ill
3. INTRODUCTION
General I Present Design Protocol for Cathodic Protection of Offshore Platforms 5
4. PROJECT OBJECTIVES 9
5. PROPOSED SLOPE PARAMETER DESIGN METHOD 10
6. PROPOSED INCLUSIVE POTENTIAL ATTENUATION AND ANODE CURRENT OUTPUT EQUATION I3
The Governing Equation 13 Verification and Comparison of Approaches 14 Effect of Anode Spacing and Pipe Current Density Demand upon
Potential Attenuation and Current Output 18 Verification and Qualification of the Slope Parameter Design Method 22 Range of Applicability of the Slope Parameter Design Approach 23
7. CONCLUDING REMARKS 25
8. BIBLIOGRAPHY 26
111
INTRODUCTION
General
While pipelines are generally recognized as the safest means of transportation for oil and gas
offshore, still failures occur because of I) material and equipment problems, 2) operational errors, 3)
corrosion, 4) storms/mud slides, and 5) third party incidents (mechanical damage). These, in tum, can
result in pollution, loss of product availability, repair expenses, business interruption, and litigation.
Several reports and publications are available that evaluate the occurrence and cause of offshore Gulf of
Mexico pipeline failures ( 1-3). These indicate that 690 pipeline accidents of sufficient magnitude to be
recorded by the MMS occurred during the twenty year period from 1967 to 1987. Of these, 343 (50
percent) resulted from corrosion with a total of 85 percent of these being documented as involving either
external or general attack. During this same period the failure rate increased at an average of over two per
year. This trend is thought to have been a consequence of I) increased pipeline population and offshore
construction activity with time and 2) aging of the pipeline infrastructure. At the same time, relatively little
attention has been directed toward this particular problem (external corrosion of marine oil and gas
pipelines), as evidenced by the fact that the 1991 International Workshop on Offshore Pipeline Safety (4)
included only one paper which explicitly focused upon this topic.
Structural and high strength steels have historically been the only economically viable material for
construction of marine petroleum transport pipelines. However, the inherent lack of corrosion resistance of
this material class in sea \Nater and the consequences of pipeline failure require that corrosion control
systems be designed, installed, and maintained such that a high degree of reliability is realized. Reliability
considerations have becon1e magnified in recent years with the transition from relatively shallow to
deepwater installations. While cathodic protection (cp) has historically been employed as the sole
corrosion control methodology for the submerged portion of petroleum production platforms, both mobile
and fixed, the one-dimensional nature of pipelines is such that the combined use of coatings with cp is
required. In the former case (platforms), anode resistance and current density demand are the fundamental
parameters that are important in cp design. For pipelines, however, coating quality and metallic path
resistance must also be taken into account, at least in the generalized case. Pipeline cp systems can be of
either the impressed current or galvanic type; however, applicability of the former is normally limited to I)
proximity of landfall whereby protection is provided seaward by a shore-based rectifier and anode bed to a
distance that is defined by the "throwing power" of the system and 2) a pipeline run between two platforms
where the pipe length is sufficiently short that the entire line can be protected by a single rectifier and
anode or anode template at one or both ends. In each case, the limiting distance to which protection is
affected is defined by the voltage drop along the metallic pipeline that arises in conjunction with the current
return to ground. The higher the coating quality, the less the pipe current demand and the greater the
distance to which protection is extended. However, coating quality of marine pipelines has invariably been
below that of buried onshore counterparts so that this distance is considerably less in the former case than
the latter. Also, achievement of adequate protection at a distant point likely involves overprotection in the
vicinity of the rectifier. Such overprotection can cause coating damage with time, in which case the pipe
current demand increases and the distance to which protection is extended becomes less. Because of these
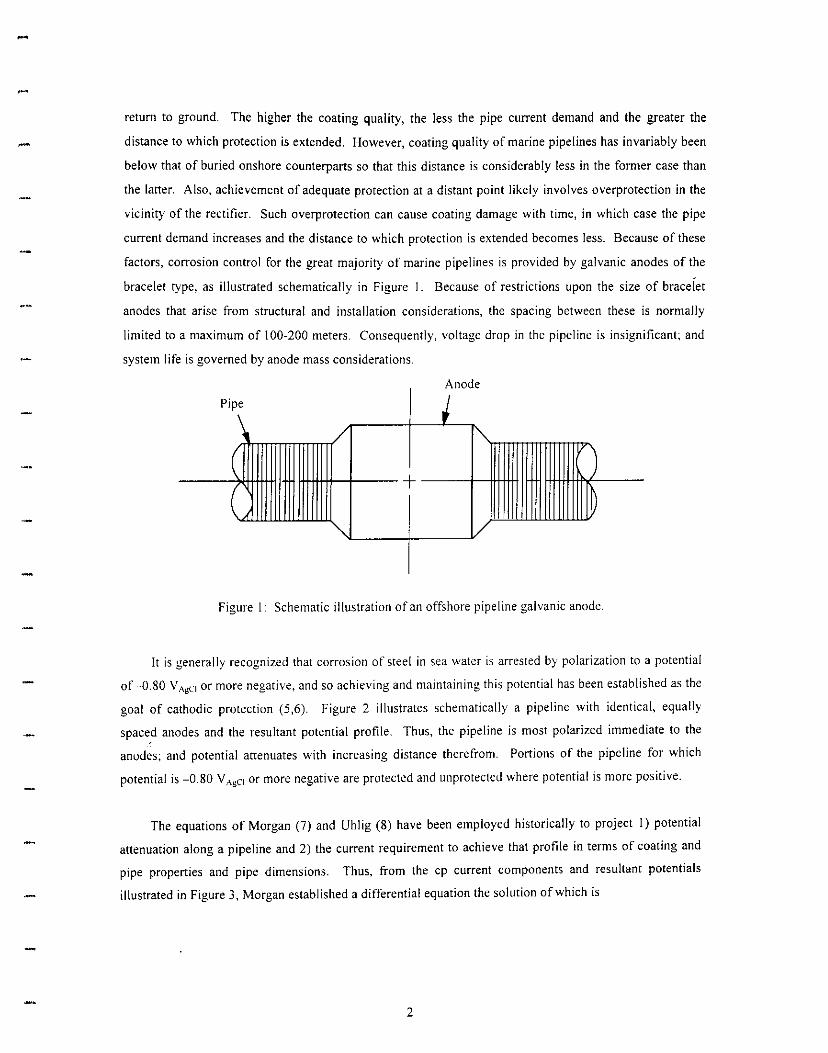
factors, corrosion control for the great majority of marine pipelines is provided by galvanic anodes of the
bracelet type, as illustrated schematically in Figure I. Because of restrictions upon the size of braceiet
anodes that arise from structural and installation considerations, the spacing between these is normally
limited to a maximum of I 00-200 meters. Consequently, voltage drop in the pipeline is insignificant; and
system life is governed by anode mass considerations.
Anode
Pipe J / " (
+(, ~
" /
Figure 1: Schematic illustration of an offshore pipeline galvanic anode.
It is generally recognized that corrosion of steel in sea water is arrested by polarization to a potential
of ~0.80 VAgCI or more negative, and so achieving and maintaining this potential has been established as the
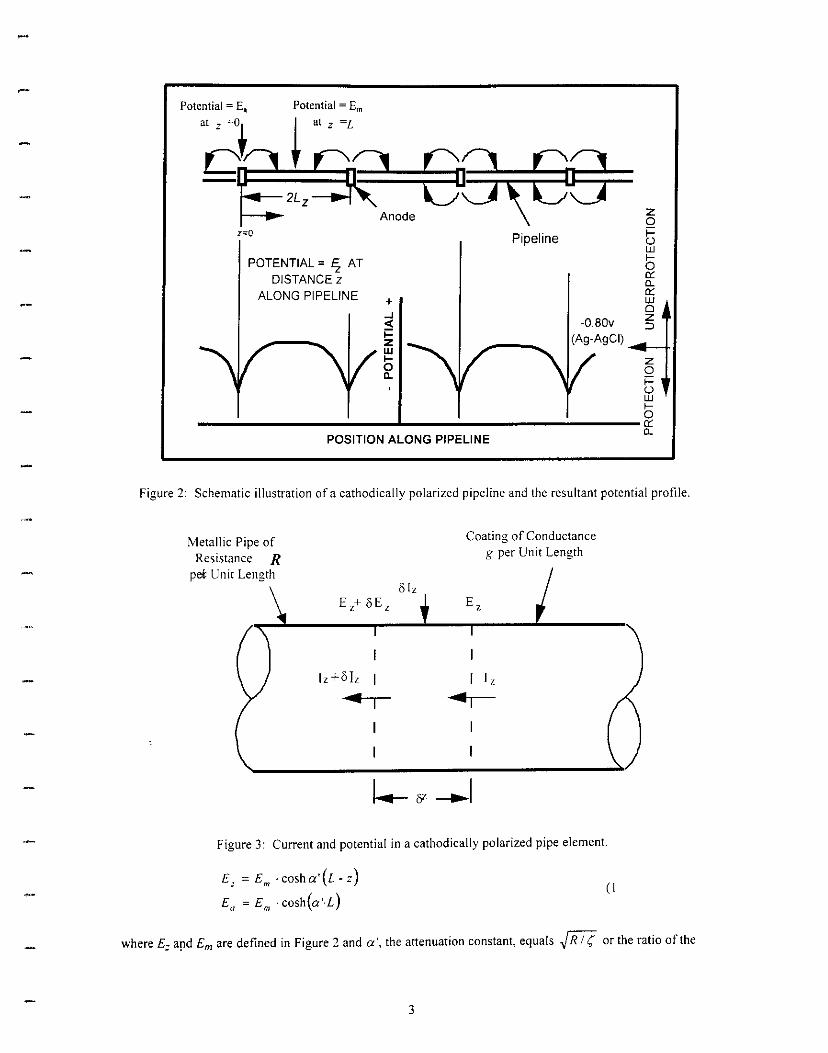
goal of cathodic protection (5,6). Figure 2 illustrates schematically a pipeline with identical, equally
spaced anodes and the resultant potential profile. Thus, the pipeline is most polarized immediate to the
anodes; and potential attenuates with increasing distance therefrom. Portions of the pipeline for which
potential is -0.80 VAgCI or more negative are protected and unprotected where potential is more positive.
The equations of Morgan (7) and Uhlig (8) have been employed historically to project I) potential
attenuation along a pipeline and 2) the current requirement to achieve that profile in terms of coating and
pipe properties and pipe dimensions. Thus, from the cp current components and resultant potentials
illustrated in Figure 3, Morgan established a differential equation the solution of which is
2
Potential = Em
z=O
POTENTIAL = s; AT
z 0
Pipeline ti w b
DISTANCE z ALONG PIPELINE
-0.80v
Q'. D.. Q'. w 0 z :::i
+ ..J <(;::: z w .... 0 D..
(Ag-AgCI) ---+
POSITION ALONG PIPELINE
8 lz E,+ SE,
lz +8 lz I, ...
Coating of ConductanceMetallic Pipe of g per Unit LengthResistance R
pet Unit Length
Figure 2: Schematic illustration of a cathodically polarized pipeline and the resultant potential profile.
Figure 3: Current and potential in a cathodically polarized pipe element.
E, =Em· cosha'(l - z) ( 1
Eu= Em ·cosh(a'·l)
where E; apd Em are defined in Figure 2 and a', the attenuation constant, equals ~RI ( or the ratio of the
3
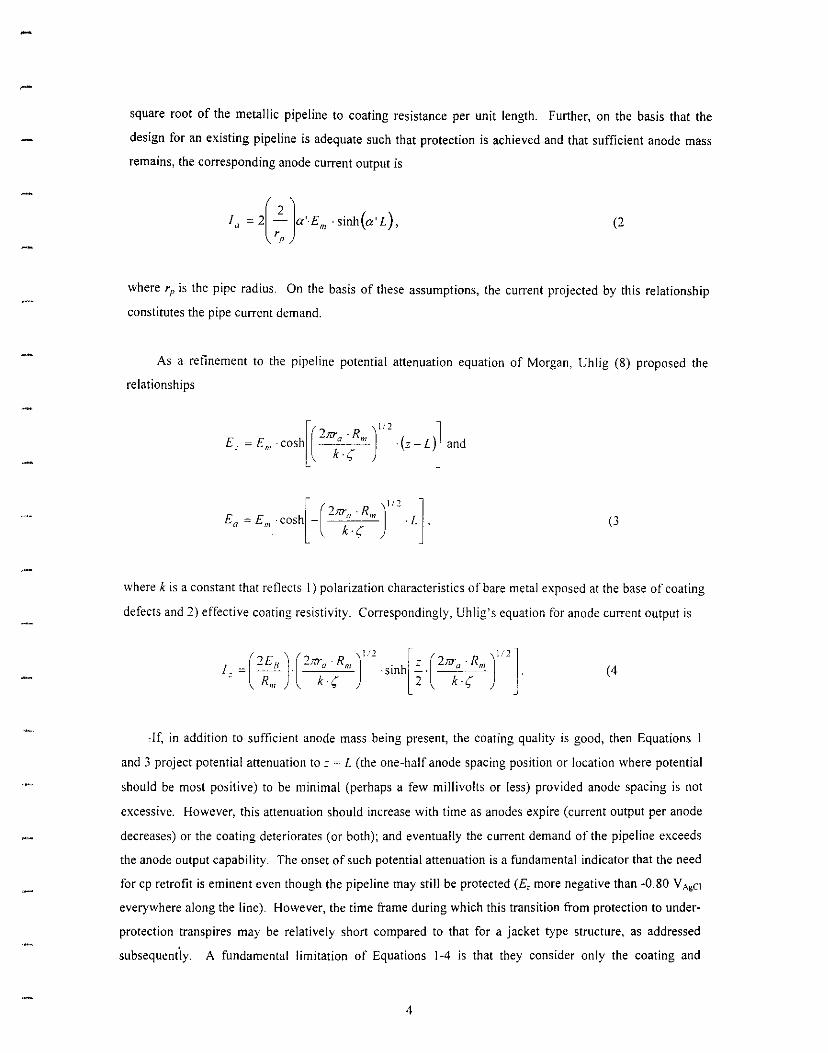
square root of the metallic pipeline to coating resistance per unit length. Further, on the basis that the
design for an existing pipeline is adequate such that protection is achieved and that sufficient anode mass
remains, the corresponding anode current output is
(2
where rP is the pipe radius. On the basis of these assumptions, the current projected by this relationship
constitutes the pipe current demand.
As a refinement to the pipeline potential attenuation equation of Morgan, Uhlig (8) proposed the
relationships
1(7 )112 l L ~ E,,, coshl -~a SR,,, (z-l)J and
(3
where k is a constant that reflects 1) polarization characteristics of bare metal exposed at the base of coating
defects and 2) effective coating resistivity. Correspondingly, Uhlig's equation for anode current output is
(4
Jf, in addition to sufficient anode mass being present, the coating quality is good, then Equations I
and 3 project potential attenuation to z ~ l (the one-half anode spacing position or location where potential
should be most positive) to be minimal (perhaps a few millivolts or less) provided anode spacing is not
excessive. However, this attenuation should increase with time as anodes expire (current output per anode
decreases) or the coating deteriorates (or both); and eventually the current demand of the pipeline exceeds
the anode output capability. The onset of such potential attenuation is a fundamental indicator that the need
for cp retrofit is eminent even though the pipeline may still be protected (£, more negative than -0.80 V ,,c1 everywhere along the line). However, the time frame during which this transition from protection to under
protection transpires may be relatively short compared to that for a jacket type structure, as addressed
subsequently. A fundamental limitation of Equations 1-4 is that they consider only the coating and
4
pipeline, but not anode, resistance terms. Consequently, this approach precludes I) optimization of anode
spacing and 2) evaluation of anode expiration and the onset of under-protection. Also, the potential profile
that is projected may by non-conservative (less protective) than is actually the case.
More recently, Boundary Element Modeling (BEM) has been applied to analysis of potential
attenuation along pipelines and anode current output. This approach utilizes a numerical algorithm for the
solution of a Laplace type governing equation,
, a'¢ a'¢ a'¢V' ¢::--, +--,+--::0, (5ax- cy- 8z 2
that describes the potential variation in an electrolyte. To model an electrochemical process, the Laplace
equation is used in conjunction with specified boundary conditions that portray the geometry and effects of
electrical sources and sinks. However, while this approach incorporates the electrolyte and coating
resistance terms, it excludes the metallic pipe path component. Consequently, it can provide no
quantitative information relevant to optimization of anode or anode ground bed spacing.
Present Design Protocol for Cathodic Protection of Offshore Platforms
Cathodic protection design procedures have evolved historically according to:
I. Trial and error.
2. Ohm's la\v employing a single, long-term current density (9).
3. Ohm's law and rapid polarization employing three design current densities, an initial (io), mean,
(i,,,), and final (i;) (5,6).
4. The slope parameter method (I 0-13 ).
Accc;rdingly, practices 2) and 3) are based upon the equation
I ~ ¢, -¢a (6 a R ,
a
where
la= individual anode current output,
¢, ~ closed circuit cathode potential,
¢;~closed circuit anode potential, and
5
¢ (Steel)corr ¢-I Kinetics for
Oxygen Reduction
+ c < ~
>
¢corr< f:: /R,,:z lJ.l
0
f '"" 0.. ¢corr
¢co" (Anode)
CURRENT
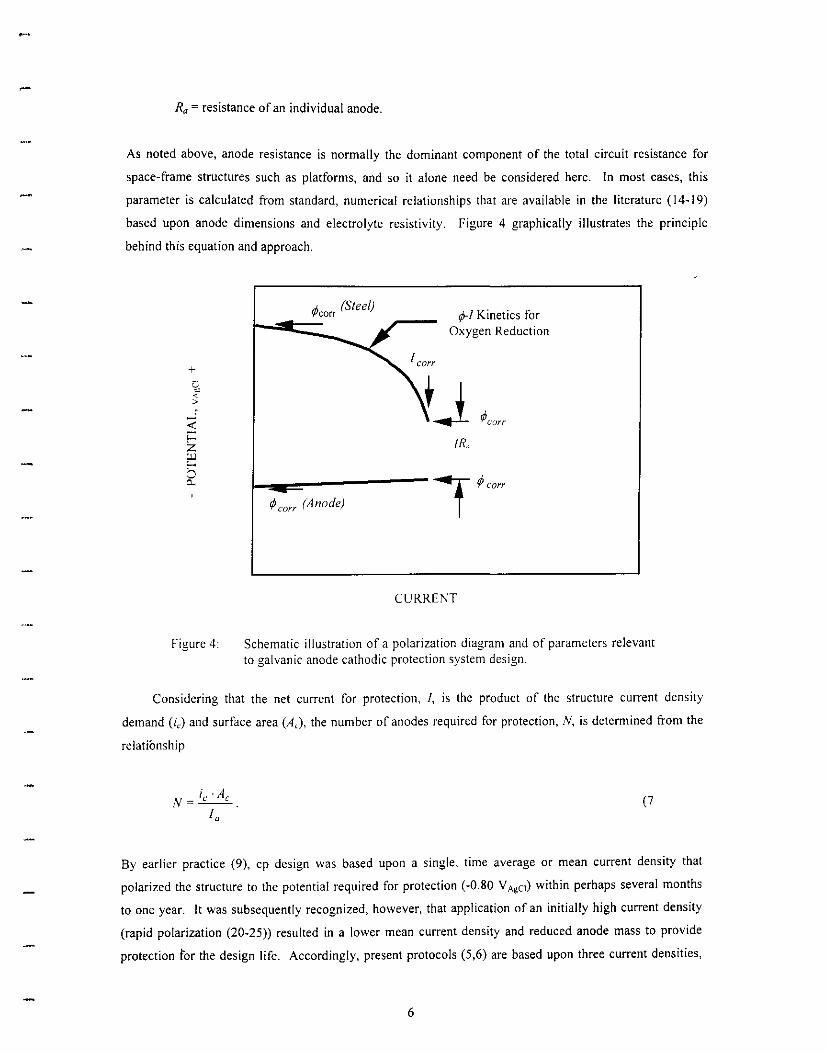
Ra ~ resistance of an individual anode.
As noted above, anode resistance is normally the dominant component of the total circuit resistance for
space-trame structures such as platforms, and so it alone need be considered here. In most cases, this
parameter is calculated tram standard, numerical relationships that are available in the literature ( 14-19)
based upon anode dimensions and electrolyte resistivity. Figure 4 graphically illustrates the principle
behind this equation and approach.
Figure 4: Schematic illustration of a polarization diagram and of parameters relevant to galvanic anode cathodic protection system design.
Considering that the net current for protection, I, is the product of the structure current density
demand (iJ and surface area (AJ, the number of anodes required for protection, N, is determined tram the
relatiOnship
(7
By earlier practice (9), cp design was based upon a single, time average or mean current density that
polarized the structure to the potential required for protection (-0.80 V Agci) within perhaps several months
to one year. It was subsequently recognized, however, that application of an initially high current density
(rapid polarization (20-25)) resulted in a lower mean current density and reduced anode mass to provide
protection tor the design life. Accordingly, present protocols (5,6) are based upon three current densities,
6
an initial (i,,), mean Um), and final (i1), where the first is relatively high and is realized upon initial
deployment, the second is the time-averaged value, and the last reflects what is required near the end of the
design life. Values for i,, and i1 are determined by substituting each of these parameters for i,. in Equations 5
and 6 with the number of anodes being determined therefrom. On the other hand, im is calculated from the
mass balance relationship
(8
where
r~ design life of the cp suystem,
C ~anode current capacity, and
).\!=weight of an individual anode.
Invariably, the number of anodes determined according to each of the three calculations is different with
the largest being specified. For uncoated structures this is usually i0 • Consequently, the system is over
designed in terms of the other two current densities. This arises because the procedure is an algorithm
rather than being first principles based.
More recently, the slope parameter approach (I 0-13) to galvanic cp system design was developed
based upon a modification of Equation 6 as
(9
where R, is the total circuit resistance. This relationship projects a linear interdependence between (A. and(.
provided R,, A0 and 1A are constant. That this is normally the case has been confirmed by both laboratory
and field measurements (10-13). For space frame type structures with multiple galvanic anodes,
(IO
with the product R, ·A, being defined as the slope parameter, S, such that
(11
7
Substitution of the latter expression into Equation 8 then yields
(12
Upon defining an appropriate value for S, all terms on the right side are known from the design choices;
and so the process is reduced to determination of the optimum combination of Ra and w. This may be
accomplished in terms of anodes of standard dimensions or, perhaps more effectively, by specifying ~n
elongated anode or dualnodes (26). Thus, if anode resistance is represented in terms of Dwight's modified
equation,
( 13
where
p ~electrolyte resistivity,
I~ anode length, and
r =equivalent anode radius,
then the left side of Equation 12 becomes
(14
where
p' ~anode density and
v ~volume fraction of the anode that is galvanic metal as opposed to core.
The required number of anodes can then be calculated from Equation 11.
Harn et al. ( 11) projected that the slope parameter based design approach yields a 32 percent
reduction in anode mass in the case of typically sized structures compared to design according to present
recommended practice (5,6). This arises because Equation 14 is first principles based and incorporates
both im and i,,, the former explicitly and the latter implicitly via the slope parameter. As such, design can be
8
-optimized in terms of both parameters instead of just one. An alternative view is that, of the two terms on
the left side of Equation 14, Ru determines i 0 while w relates to im.
Present Design Protocol for Cathodic Protection of Marine Pipelines
Two fundamental differences between offshore platforms and pipelines are, first, the three
dimensional nature of the former compared to one dimensional for the latter and, second, the fact that
pipelines are invariably coated while platforms are normally not. Because of the second consideration,
design of the cp system for pipelines precludes(;; and im alone or perhaps i1 also need be taken into account
Thus, marine pipeline cp design (5,6) considers the current demand,/"' as
( 15
where ic is normally in the range 60-170 mA/m 2 depending upon pipe depth, temperature, sea water versus
mud exposure, and whether or not the calculation is for the mean (le= / 111)or final (/". = !1) condition, where
Im is the time-averaged net current and 11 is the net current near the end of the design life. Correspondingly,
the net anode mass, M, is determined ti-om a modified form of Faraday's law,
M = 8,760·/,, ·T (16
u·C
where 11 is a utilization factor; and current output of individual anodes is calculated from Equation 6. The
number of bracelet anodes that are spaced equally alone the pipeline is then determined as
(17
A shonfall of the above analysis is it assumes that the spacing between anodes is limited such that metallic
path resistance is negligible. Consequently, this method is not applicable to designs that call for
maximizing anode or anode sled spacing, as is likely to be critical in the case of retrofits.
PROJECT OBJECTIVES
Oil and gas transponation pipelines have now been in service in shallow Gulf of Mexico waters for as
9
-
long as about five decades. During this time, the technology for protecting these fi"om external corrosion
has evolved such that it is now recognized that the cp criteria and approaches used for earlier generation
lines may not have been adequately conservative. Specific examples of this include the following:
I. The spacing of galvanic anodes on early generation pipelines was typically one-quarter mile (400 m). However, present designs involve spacings as short as 120 m to account for the possibility of electrical connection damage during the laying operation such that some anodes are lost or do not properly activate.
2. Pipeline laying technology has improved with time such that damage to anodes upon installation "is less likely.
3. Performance is generally better for anodes produced today compared to those of several decades ago.
Additional concerns are, first, the life of older pipelines has often been extended beyond that for which the
cp system was originally designed; second, pipeline corrosion inspections are often neither sufficiently
sensitive or sufficiently comprehensive to necessarily disclose problems: and, third, pipelines may
experience modified service conditions. The present project was initiated in 1997 with the objective of
defining criteria and a standardized practice for retrofitting the cathodic protection system on older marine
pipelines. This report describes progress that has been made to-date. Activities have involved, first,
modification of the Slope Parameter cp design method to pipelines and, second, development of a first
principles based equation for potential attenuation alone a pipeline and anode current output. These, along
with the implications of each are described belo\v.
PROPOSED SLOPE PARAMETER DESIGN METHOD
Application of Equation 9 to a coated, cathodically polarized pipeline requires that I) spacing
between anodes be sufficiently small that nietallic path resistance is negligible, 2) pipe resistance to sea
water is negligible, 3) all current enters the pipe at holidays in the coating (bare areas), and 4) 1A and ¢,are
constant with both time and position. As a consequence of I) and 2), R, "'R,; and from 3),
21r·rp·Las A(-(lJ ::: -~'---- ( 18
y
where A,m is the pipe surface area protected by a single anode, y is the ratio of total pipe surface area to
bare surface area (this parameter is a modification of the coating breakdown factor,);:., that was introduced
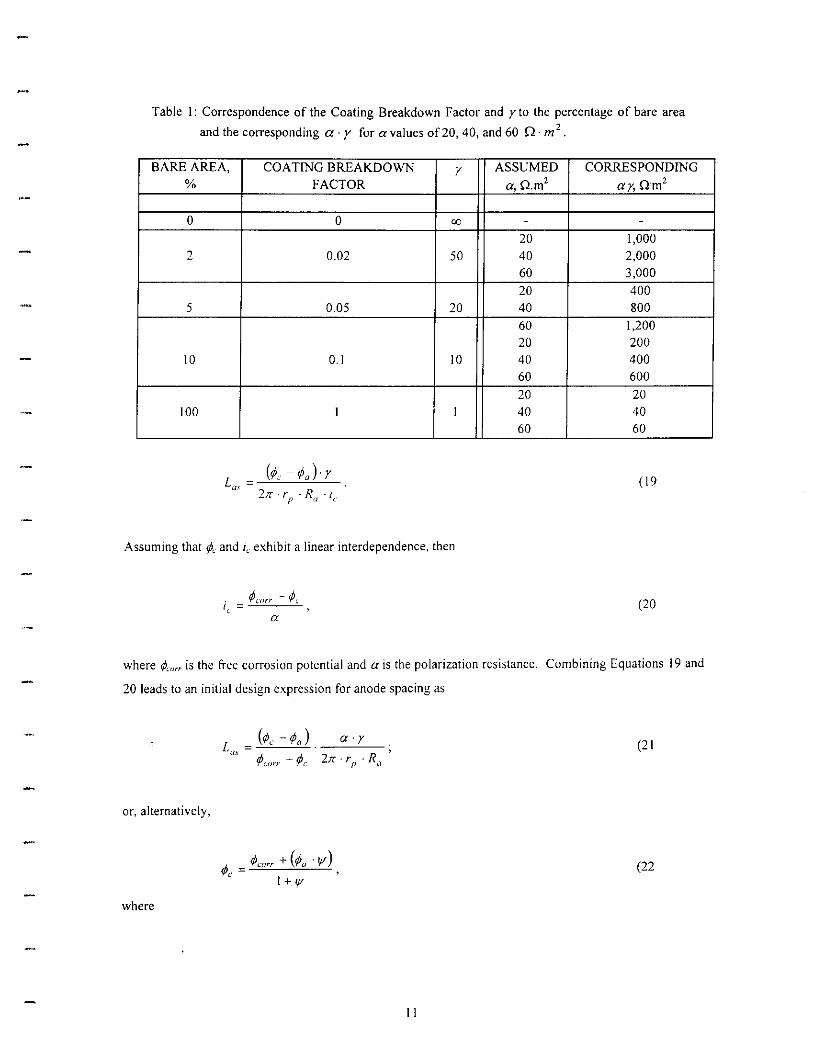
in conjunction with Equation 15), and La.i· is the anode spacing or 2L. Table I provides a comparison
between y and the coating breakdown factor, f.. Combining Equations 9 and 18 and solving for La.• then
yields
10
a·r
Table I: Correspondence of the Coating Breakdown Factor and y to the percentage of bare area 2and the corresponding a· r for a values of20, 40, and 60 0 · m •
BARE AREA, %
COATING BREAKDOWN FACTOR
r ASSUMED
a,O.m2 CORRESPONDING
ay, Om2
0 0 co - -
2 0.02 50 20 40 60
1,000 2,000 3,000
5 0.05 20 20 40
400 800
10 0.1 10
60 20 40 60
1,200 200 400 600
100 1 1 20 40 60
20 40 60
( 19
Assuming that ¢,_ and i(. exhibit a linear interdependence, then
a (20
where rA-,,rr is the free corrosion potential and a is the polarization resistance. Combining Equations 19 and
20 leads to an initial design expression for anode spacing as
(21
or, alternatively,
t/J, ~ t/Jrnn + (¢u •ljl)' (22 1+ ljl
where
11
a·r I// = ------
2tr · rr · las · Ra
The corresponding design life can be calculated from the modified version of Equation 8,
w·C·uT=---- (23
Finally, upon combining Equations 18, 20, and 23,
T = ..,---w_·_C~·u_·a_·~r__
(¢corr - ¢c). 2Jr . r r . la.1· (24
Since the term 21r · rP · Lw · R0
I y (Equation 24) is equivalent to S (Equation 9), this approach is termed
the Slope Parameter method for pipeline cp design. However, the magnitude of this slope parameter differs
from that of bare steel (10-13) by a factor of l/y. On the basis that an upper limit of im for most pipeline cp
designs is 75 mAlm' (at ¢, = -0.80 V A,;<Agc1), then a :;, 2.0 Qm'. Considering further a realistic upper limit
for the coating breakdown factor as seven percent (y= 14.3) leads to the likely range for a· y being equal
or greater than 30 0 · m 2 .
The initial step for a given design then is to calculate a baseline L(/\' in terms of a y, Ra (actually, anode
surface area or dimensions using, for example. McCoy's formula (27), and ¢,(design cathode potential)
using Equation 21. Upon substitution of this Las into Equation 15 and possibly with iteration via Equation
24 (such iteration may be necessary since anode dimensions and ware interrelated and changes in these, in
addition to changes in l"' and a y, result in a different¢, and T. as calculated by Equation 24), wand Tare
optimized.
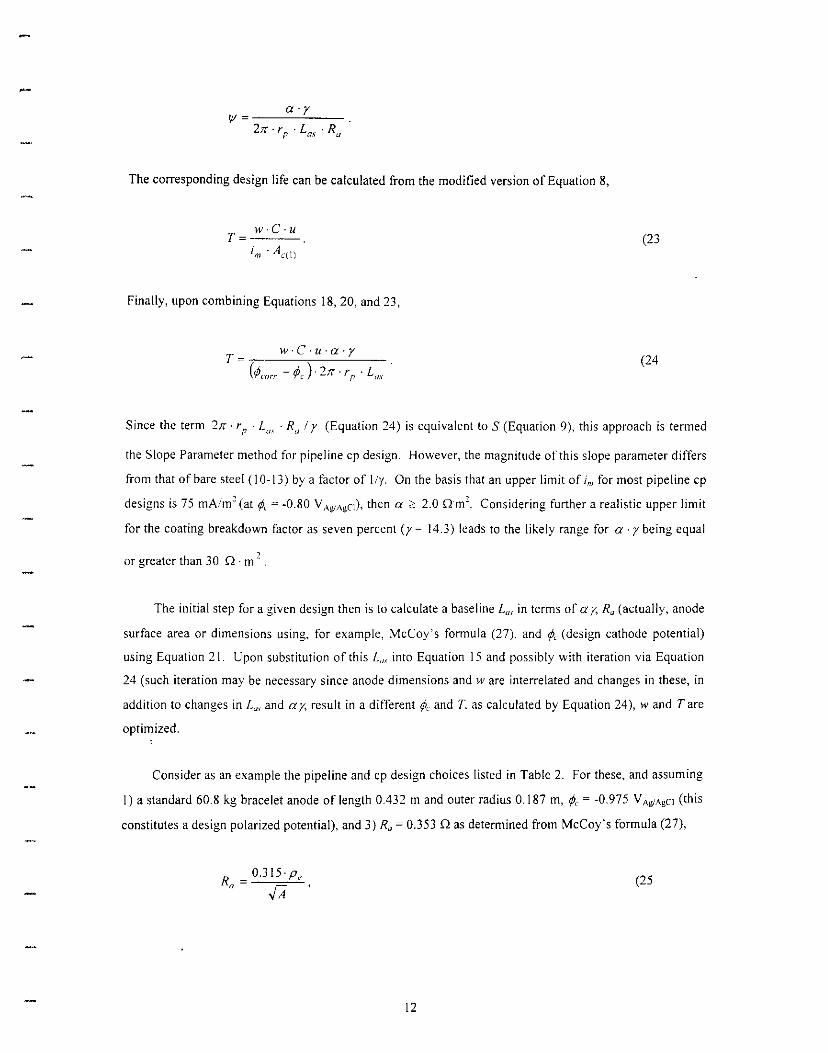
Consider as an example the pipeline and cp design choices listed in Table 2. For these, and assuming
I) a standard 60.8 kg bracelet anode of length 0.432 m and outer radius 0.187 m, ¢, = -0.975 V AglAgCt (this
constitutes a design polarized potential), and 3) Ra= 0.353 Q as determined from McCoy's formula (27),
R = 0.315·p, a .{A (25
12
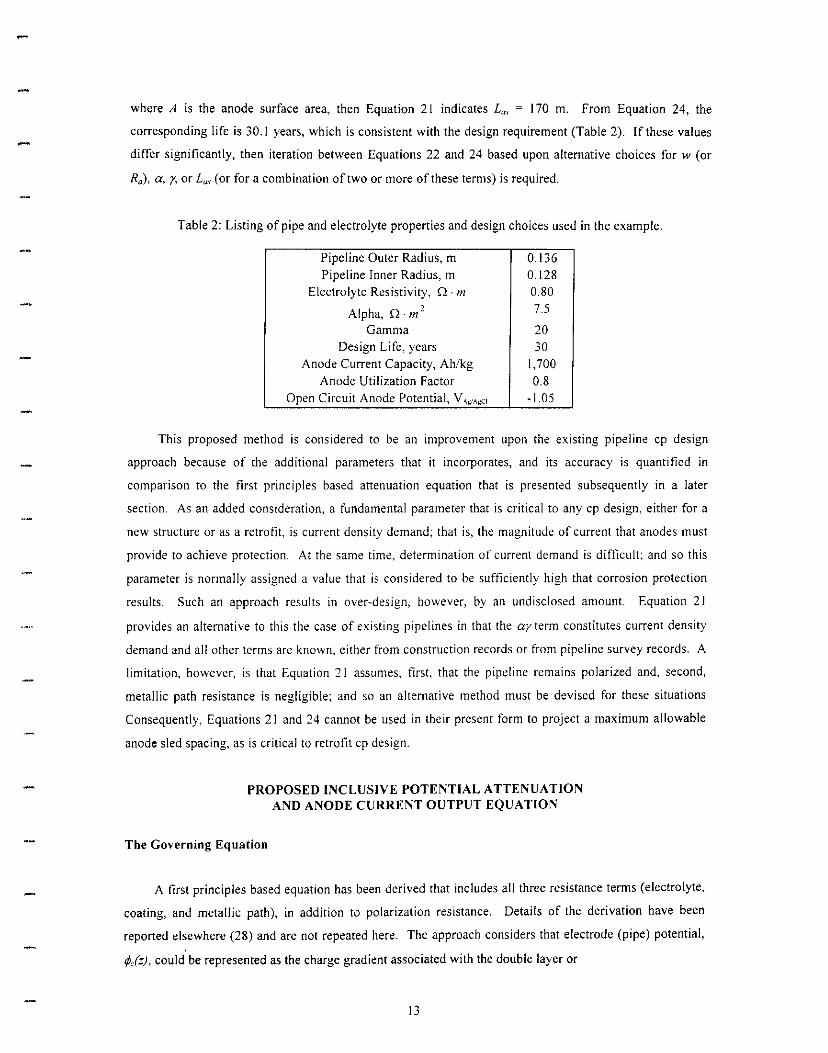
where A is the anode surface area, then Equation 21 indicates La., ~ 170 m. From Equation 24, the
corresponding life is 30. l years, which is consistent with the design requirement (Table 2). If these values
differ significantly, then iteration between Equations 22 and 24 based upon alternative choices for w (or
R,), a, y, or La.' (or for a combination of two or more of these terms) is required.
Table 2: Listing of pipe and electrolyte properties and design choices used in the example.
Pipeline Outer Radius, m 0.136 Pipeline Inner Radius, m 0.128
Electrolyte Resistivity, Q. m 0.80
Alpha, O · m 2 7.5
Gamma 20 Design Life, years 30
Anode Current Capacity, Ah/kg 1,700
Anode Utilization Factor 0.8 Open Circuit Anode Potential, V "WAgc1 -l.05
This proposed method is considered to be an improvement upon the existing pipeline cp design
approach because of the additional parameters that it incorporates, and its accuracy is quantified in
comparison to the first principles based attenuation equation that is presented subsequently in a later
section. As an added consideration, a fundamental parameter that is critical to any cp design, either for a
new structure or as a retrofit, is current density demand; that is, the magnitude of current that anodes must
provide to achieve protection. At the same time, determination of current demand is difficult; and so this
parameter is nonnally assigned a value that is considered to be sufficiently high that corrosion protection
results. Such an approach results in over-design, however, by an undisclosed amount. Equation 21
provides an alternative to this the case of existing pipelines in that the ay term constitutes current density
demand and all other terms are known, either from construction records or from pipeline survey records. A
limitation, however, is that Equation 21 assumes, first, that the pipeline remains polarized and, second,
metallic path resistance is negligible; and so an alternative method must be devised for these situations
Consequently, Equations 21 and 24 cannot be used in their present form to project a maximum allowable
anode sled spacing, as is critical to retrofit cp design.
PROPOSED INCLUSIVE POTENTIAL ATTENUATION AND ANODE CURRENT OUTPUT EQUATION
The Governing Equation
A first principles based equation has been derived that includes all three resistance terms (electrolyte,
coating, and metallic path), in addition to polarization resistance. Details of the derivation have been
reported elsewhere (28) and are not repeated here. The approach considers that electrode (pipe) potential,
¢Jz), could be represented as the charge gradient associated with the double layer or
13
(26
where Um(z) and UJz) are the metallic and electrolyte potentials, respectively, and K,,1 accounts for the fact
that ¢Jz) must be measured relative to a reference potential (constant). Also,
(27
where EJz) is the magnitude of polarization. Further, upon taking the second derivative of Equations 26
and 27 and combining,
(28
Development of expressions for each of the three component terms, £,_., U,m and Ue, and substitution of
these into Equation 28 led to the governing equation
(29J z
where r,, is the radius of identical spherical anode superimposed upon the pipe at intervals of2l and
ay
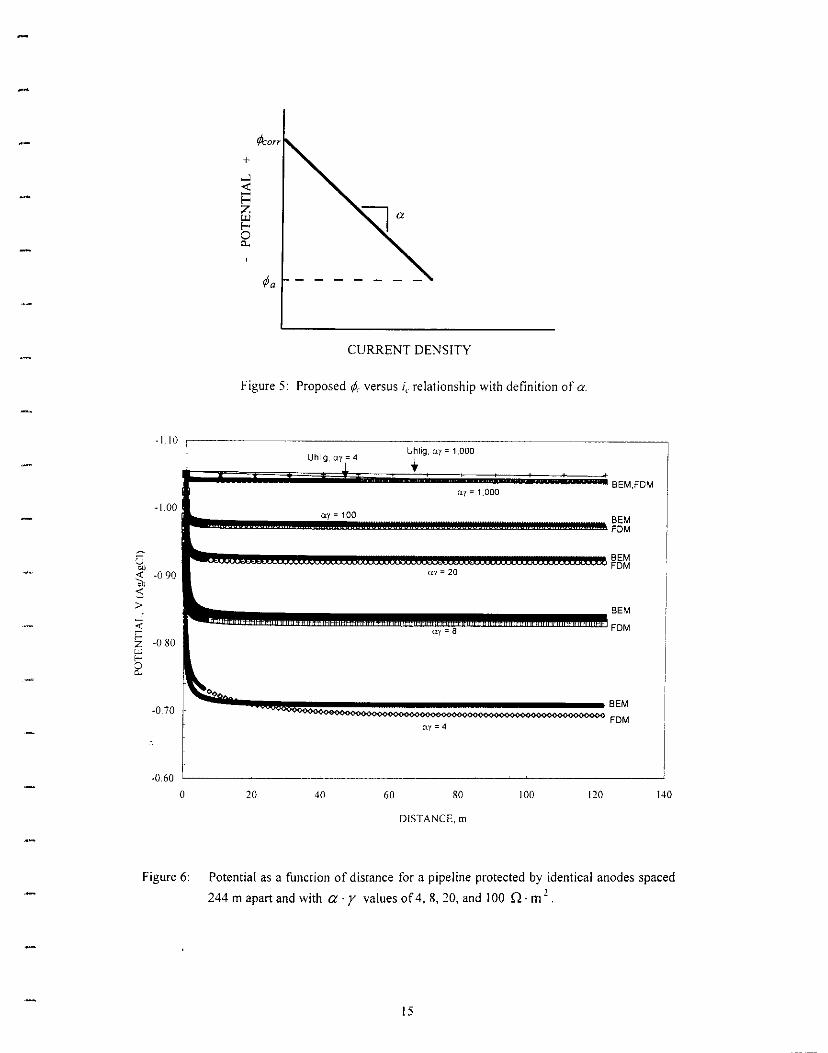
where p, is electrolyte resistivity, A linear relationship was assumed between ¢, and i, such that a may be
visualized, as shown in Figure 5. Because there is no known solution to Equation 29, it must be solved
numerically. This was done using a Finite Difference Method (FDM).
Verification and Comparison of Approaches
Figure 6 presents a plot of pipe potential as a function of distance from an anode as determined by I)
Equation 3, 2) Boundary Element Modeling (BEM), and 3) a Finite Difference Method (FDM) solution of
14
-I 10 ,.----Uhlig, ay = 1,000
Uhlig, ay; 4 ... '==1 BEM,FDM !
ay =1,000
-1.00 ay = 100 BEM
FDM
~ u °" <
"' -0.90 U"f =20
BEM FDM
:'.S > BEM
:;; I-z -0.80
ay - B FDM
'" I-
it ~"'
-0.70 BEM
ay =4 FDM
-0.60
0 20 40 60 80 100 120 140
DISTANCE, m
+ ..J <f::: z UJ lo 0..
CURRENT DENSITY
Figure 5: Proposed¢, versus;. relationship with definition of a.
Figure 6: Potential as a function of distance for a pipeline protected by identical anodes spaced
244 m apart and with a -y values of 4, 8, 20, and I 00 Q · m 2 .
15
2
Equation 29 for a · y values of 4, 20, 100, and 1,000 Q · m 2 (an a· y of 4 n ·m 2 corresponds to a bare
pipe with a current density demand of I 00 mA/m2 at -1.05 VAg/Agc1, whereas an a · y of 1,000 Q · m
corresponds, for example, to four percent bare area (y ~ 25) and a ~ 40 n · m 2 (current density demand
of 10 mA/m2
at -1.05 VAg1Agc1)). As such, these represent realistic extremes of conditions that are likely to
be encountered in practice. Other pipe and electrolyte parameters are as listed in Table 3. For these
conditions, the solutions to Equation 3 are relatively insensitive to coating quality and current density
demand (a· y) and are non-conservative compared to the BEM and Equation 29 results in that they predict
greater cathodic polarization. The Equation 29 and BEM potential profiles, on the other hand, are in good
mutual agreement. These are characterized by a potential decay within approximately the first 10 m of the
anode, the magnitude of which is determined by 1) anode resistance (dimensions and electrolyte resistivity)
and 2) the pipe current demand (a · y ). For each specific case, potential is relatively constant and 1s
defined by the voltage drop associated with the anode. The finding that the FDM plateau potential is
slightly more negative than the BEM one and that the magnitude of this difference is inversely related to
a · r is probably due to inclusion of the metallic path resistance term in the former solution and its
exclusion in the latter. Ho\vever, the difference in the two plateau potentials is not considered to be of
practical significance. Because of the close correspondence between the BEM and FDM results and
because BEM is a proven methodology for quantitatively characterizing potential fields, it is concluded that
the FDM solution to Equation 29 is an appropriate means for projecting potential attenuation along
pipelines and anode current output.
Table 3: Pipe and electrolyte parameters for the analyses sho\vn in Figure 6.
Pipeline Outer Radius, m
Pipeline Inner Radius, m
Anode Spacing, 2L. m
Equivalent Sphere radius of Anode, m
Electrolyte Resistivity, Q m
Pipe Resistivity, Q m
Free Corrosion Pipe Potential, VAg/,\gc1
Anode Potential, V Ag1Agc1
0.136
0.128
244
0.201
0.30
l 7xlo-•
-0.65
-1.05
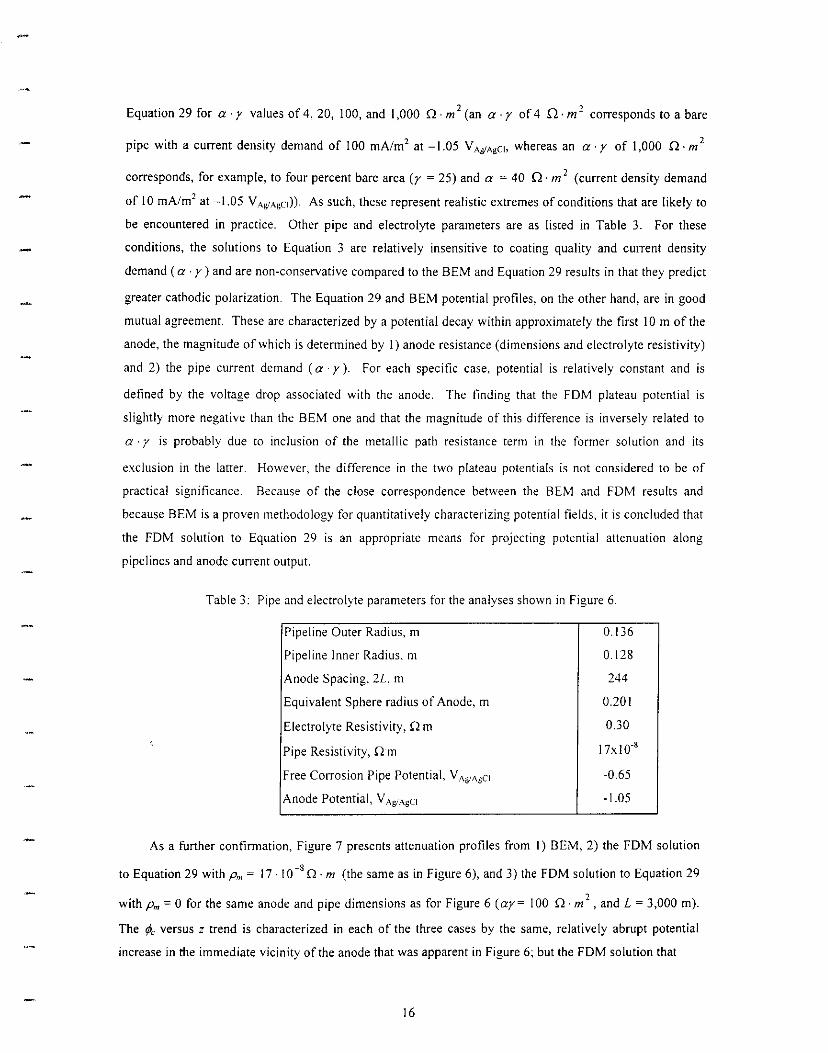
As a further confirmation, Figure 7 presents attenuation profiles from 1) BEM, 2) the FDM solution
to Equation 29 with Pm ~ 17 · 1 o-• Q · m (the same as in Figure 6), and 3) the FDM solution to Equation 29
2with Pm= 0 for the same anode and pipe dimensions as for Figure 6 (ay~ 100 Q · m , and L = 3,000 m).
The ¢>, versus z trend is characterized in each of the three cases by the same, relatively abrupt potential
increase in rhe immediate vicinity of the anode that was apparent in Figure 6; but the FDM solution that
16
..-----------------------------~
-LOO ---- - ····1;--BEM
l--o-- FDM w/Ohmic .-0 95 ~-~!~.~~
~ -0_90
> ~
-0.85..i <f::: 15 f-< 0 0..
-0_80
-0_75
-0.65
0 500 1000 l 500 2000 2500 3000
DISTANCE FROM ANODE. m
-l.05
Figure 7: Comparison of BEM and FDM solutions to Equation 29 where the latter reflect presence and absence of the metallic path resistance term.
includes the metallic path resistance term exhibits a further attenuation, albeit of a lesser magnitude, along
the entire range of:, whereas the BEM and FDM solution that does not consider metallic path resistance
essentially superimpose with little additional attenuation beyond the vicinity of the anode. Thus, while the
BEM and FDM (metallic path resistance term included) solutions are essentially the same for relatively
small l, the latter projects increasing attenuation compared to the former with increasing anode spacing.
On the other hand, it can be shown that Equation 29 reduces to the Uhlig expresion for Ra = 0.
Consequently, potential attenuation projected by BEM is non-conservative for situations where metallic
path resistance is not negligible; and the Uhlig equation is non conservative in cases where anode resistance
is not negligible. It is concluded that Equation 29 provides a means for accurately assessing potential
attenuation along a cathodically polarized pipeline and is likely to be the most accurate method for
situations where both E~(z) and £ 111 (:) are not negligible. The research effort is now focusing upon
strategies whereby Equation 29 can be integrated into retrofit pipeline cp design protocols.
Anode current output can be determined from both BEM and the FDM solution of Equation 29, since
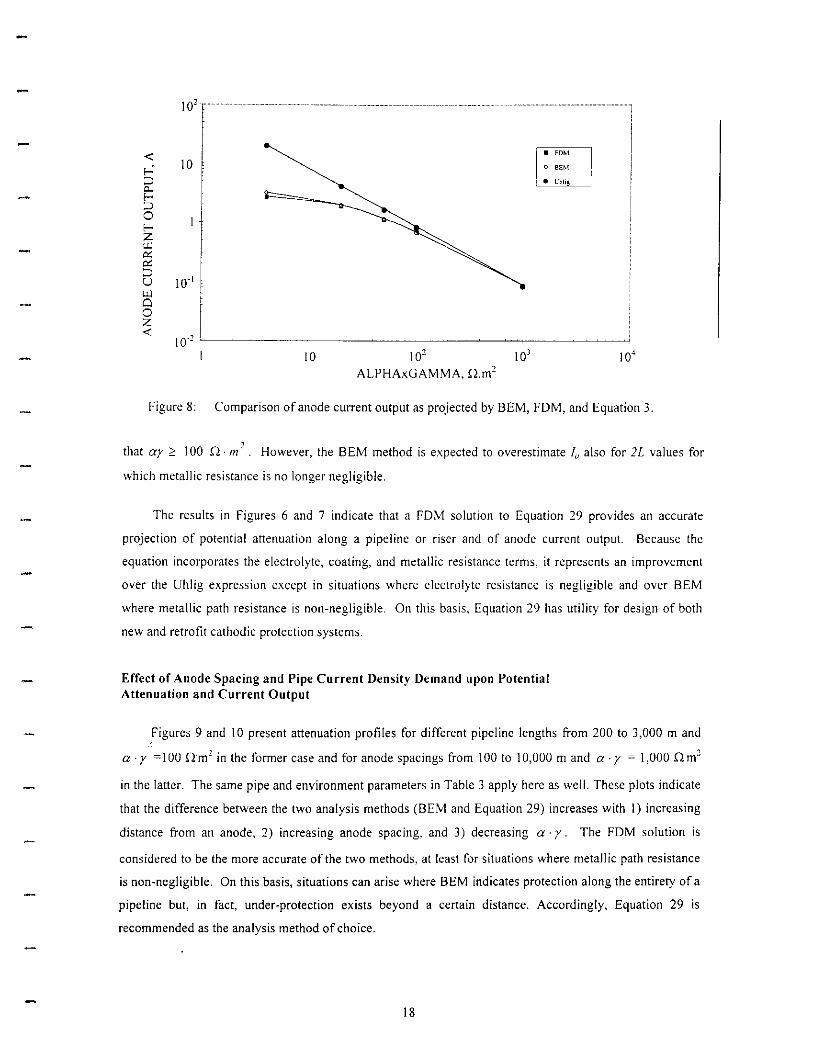
EJz) is proportional to current demand which, in turn, dictates/". Thus, Figure 8 presents a plot of la
versus ayas determined by BEM, the FDM solution to Equation 29, and Uhlig (Equation 3) based upon the
same pipe and electrolyte parameters that were employed in conjunction with Figures 6 and 7. This reveals
that results from the former two methods (BEM and FDM) are in excellent mutual agreement, whereas
Uhlig's equation overestimated la in the lower ayrange, presumably because of failure of this expression to
adequately address the near-field and the greater influence of the near-field at relatively low ay. The Uhlig
expression projects Ia with reasonable accuracy in cases where current demand and coating quality are such
17
0
102 •.....
< I • FDM
10 I 0 BEMI-·; ::i ~~-a. 1-::i
1--< ;z: UJ
i2 ::i u UJ Cl 0;z: < r
10·2 ~'~~~~~~~~~~~~~~~~~~~~~~~~~~~~~~
I 10 102 101 I 04
ALPHAxGAMMA, rl.m 2
Figure 8: Comparison of anode current output as projected by BEM, FDM, and Equation 3.
that ay 2: 100 rl · m· ' However, the BEM method is expected to overestimate/" also for 2l values for
which metallic resistance is no longer negligible.
The results in Figures 6 and 7 indicate that a FDM solution to Equation 29 provides an accurate
projection of potential attenuation along a pipeline or riser and of anode current output. Because the
equation incorporates the electrolyte, coating, and metallic resistance terms, it represents an improvement
over the Uhlig expression except in situations where electrolyte resistance is negligible and over BEM
where metallic path resistance is non-negligible. On this basis, Equation 29 has utility for design of both
new and retrofit cathodic protection systems.
Effect of Anode Spacing and Pipe Current Density Demand upon Potential Attenuation and Current Output
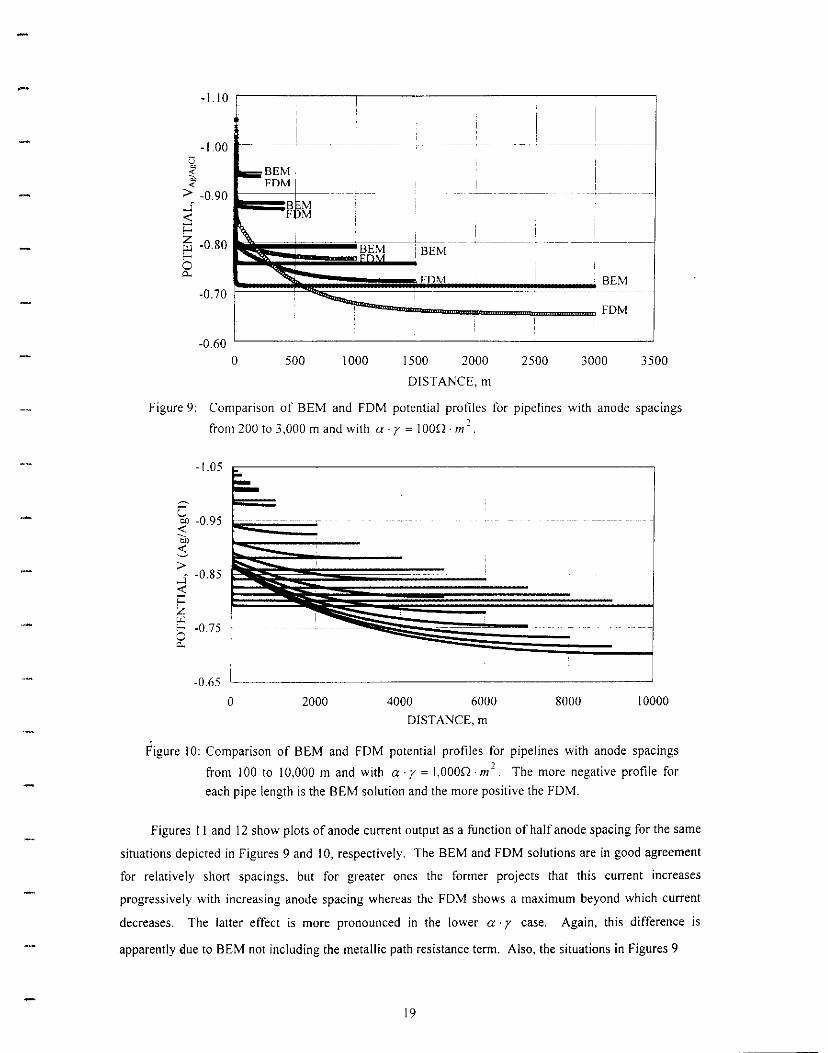
Figures 9 and 10 present attenuation profiles for different pipeline lengths from 200 to 3,000 m and
a · y =I 00 nm' in the former case and for anode spacings from I 00 to I 0,000 m and a · y = 1,000 nm'
in the latter. The same pipe and environment parameters in Table 3 apply here as well. These plots indicate
that the difference between the two analysis methods (BEM and Equation 29) increases with I) increasing
distance from an anode, 2) increasing anode spacing, and 3) decreasing a· y. The FDM solution is
considered to be the more accurate of the two methods, at least for situations where metallic path resistance
is non-negligible. On this basis, situations can arise where BEM indicates protection along the entirety of a
pipeline but, in fact, under-protection exists beyond a certain distance. Accordingly, Equation 29 is
recommended as the analysis method of choice.
18
-l.10 r--------~---------------~
------ t--l.00 u ~
~ > -0.90 1c-----+-- ------+--..s <f:::
~ -0. 80 ,=~~~§~~~'BiE;M~-~-~-i1;-~;,,:~~~::_:__ ____:_:_:--:-~::::_!_:_:_:--::-~-FBD-EMM -0.70
-0.60 0 500 1000 1500 2000 2500 3000 3500
DISTANCE, m
Figure 9: Comparison of BEM and FDM potential profiles for pipelines with anode spacings
from 200 to 3,000 m and with a· r = IOOQ · m·.'
0 2000 4000 6000 8000 10000
DISTANCE, m
Figure I 0: Comparison of BEM and FDM potential profiles for pipelines with anode spacings
from 100 to 10,000 m and with a· r = 1,000!1 · m2 . The more negative profile for
each pipe length is the BEM solution and the more positive the FDM.
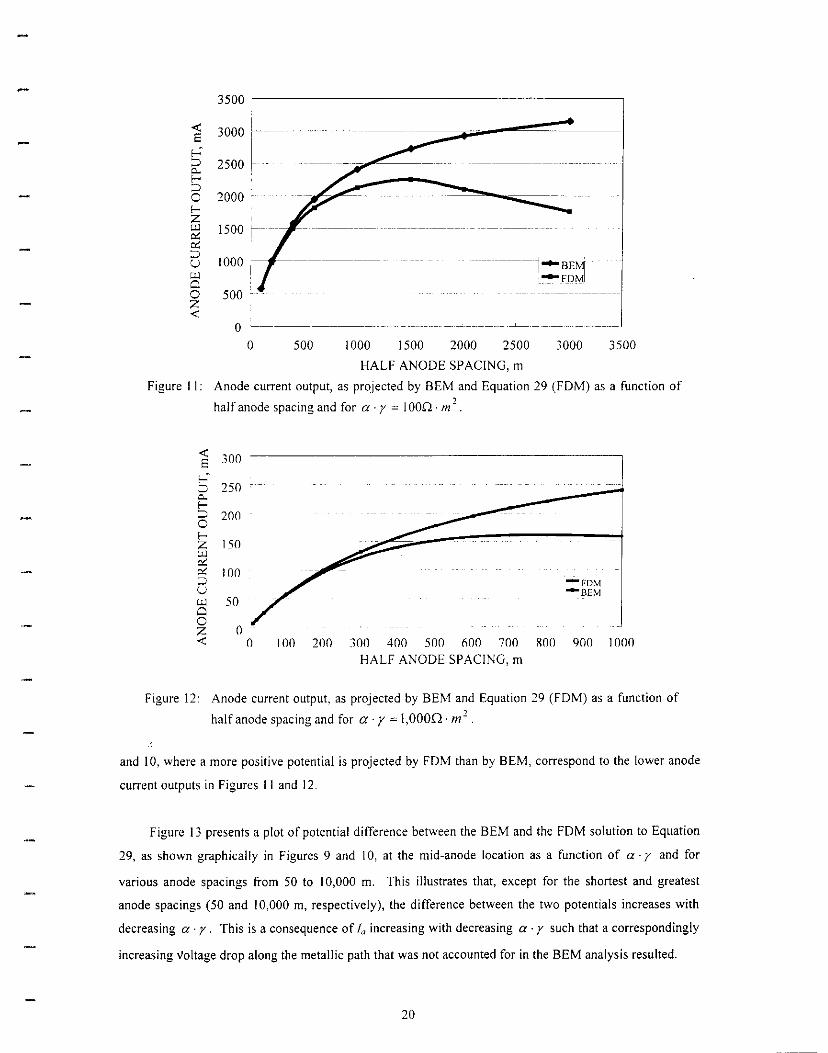
Figures 11 and 12 show plots of anode current output as a function of half anode spacing for the same
situations depicted in Figures 9 and I 0, respectively. The BEM and FDM solutions are in good agreement
for relatively short spacings, but for greater ones the former projects that this current increases
progressively with increasing anode spacing whereas the FDM shows a maximum beyond which current
decreases. The latter effect is more pronounced in the lower a · r case. Again, this difference is
apparently due to BEM not including the metallic path resistance term. Also, the situations in Figures 9
- l.05
~
u ~ -0.95
'"' ~ >.s -0.85 < f:: @ f -0.75 0 "
-0.65
19
3500
I"~---< 3000 ------~;.;;.-------=~----E f-' ::i 2500 ~ 0.. f ::i 0 2000 f :z: ' UJ 1500 1---c<: c<: ::i -H-------1-BE.u 1000 UJ o~F_Q~Cl 0 500:z: < 0 ________________[_____
0 500 1000 1500 2000 2500 3000 3500
HALF ANODE SPACING, m
Figure 11: Anode current output, as projected by BEM and Equation 29 (FDM) as a function of
half anode spacing and for a · y = 1OOQ · m 2 .
<E c-· ::i 0.. f ::i 0 f:z: UJ c<: c<: ::i u UJ Cl 0:z: <(
300
250
200
150
100
50
0 0 I 00 200 300 400 500 600 700 800 900 I 000
HALF ANODE SPACING, m
Figure 12: Anode current output, as projected by BEM and Equation 29 (FDM) as a function of
half anode spacing and for a· y = I,OOOQ · m 2 .
and 10, where a more positive potential is projected by FDM than by BEM, correspond to the lower anode
current outputs in Figures I I and 12.
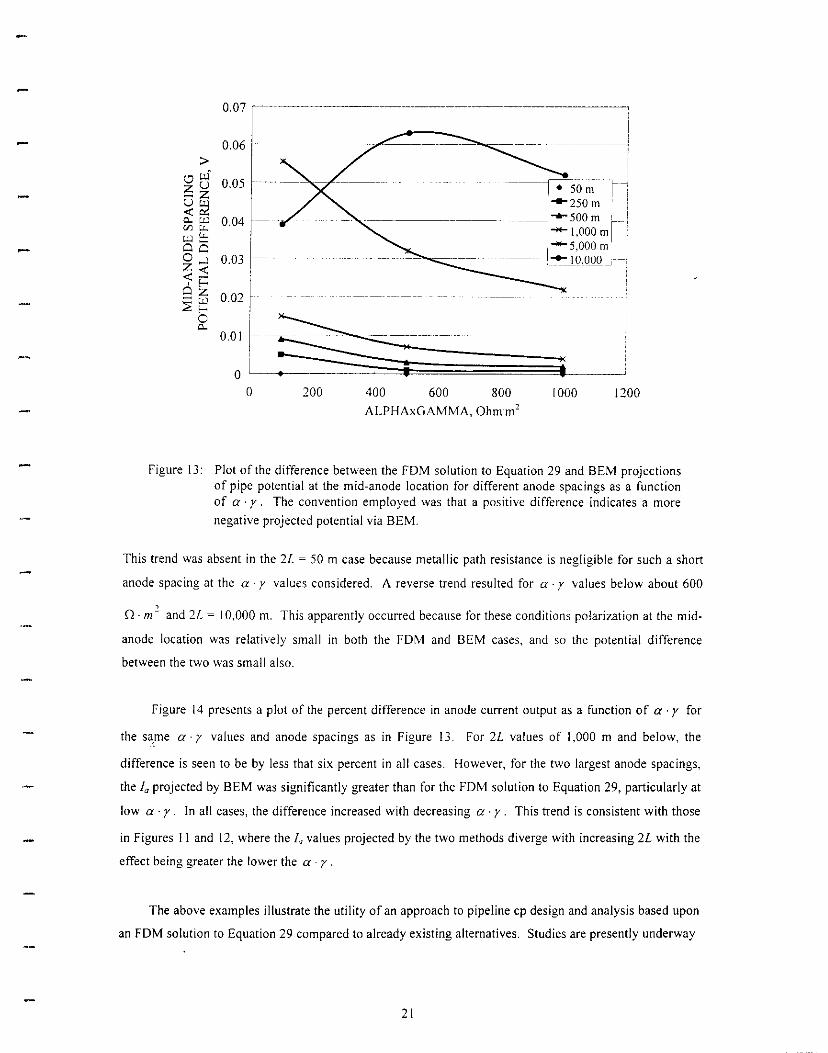
Figure 13 presents a plot of potential difference between the BEM and the FDM solution to Equation
29, as shown graphically in Figures 9 and I0, at the mid-anode location as a function of a · y and for
various anode spacings from 50 to l 0,000 m. This illustrates that, except for the shortest and greatest
anode spacings (50 and I 0,000 m, respectively), the difference between the two potentials increases with
decreasing a· y. This is a consequence of Ia increasing with decreasing a· y such that a correspondingly
increasing voltage drop along the metallic path that was not accounted for in the BEM analysis resulted.
20
----r•som
--j""*""500m
- -
·-------~'0.06
0.05 I --2so m
' 0.04 f--1,000 mj -s.ooom
0.03 ~-- i-+-10000 ' __ _J
0.02 f
0.01 r-~o I :--:-:--= .:-,------.
0 200 400 600 800 1000 1200 ALPHAxGAMMA, Ohm m2
Figure 13: Plot of the difference between the FDM solution to Equation 29 and BEM projections of pipe potential at the mid-anode location for different anode spacings as a function of a · y. The convention employed was that a positive difference indicates a more
negative projected potential via BEM.
This trend was absent in the 2l ~ 50 m case because metallic path resistance is negligible for such a short
anode spacing at the a · y values considered. A reverse trend resulted for a· y values below about 600
, 0 · m- and 2l ~ I0,000 m. This apparently occurred because for these conditions polarization at the mid-
anode location was relatively small in both the FDM and BEM cases, and so the potential difference
between the two was small also.
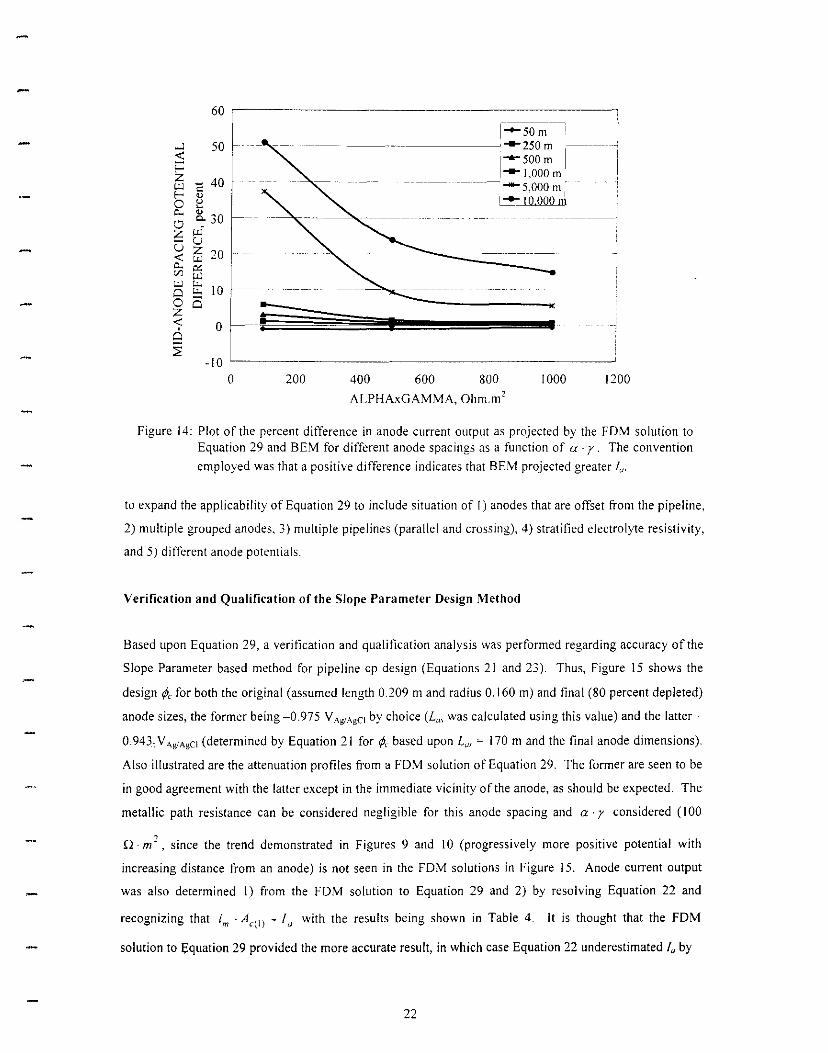
Figure 14 presents a plot of the percent difference in anode current output as a function of a· y for
the sa_me a· y values and anode spacings as in Figure 13. For 2L values of 1,000 m and below, the
difference is seen to be by less that six percent in all cases. However, for the two largest anode spacings,
the Ia projected by BEM was significantly greater than for the FDM solution to Equation 29, particularly at
low a · y. In all cases, the difference increased with decreasing a· y. This trend is consistent with those
in Figures 11 and 12, where the Ia values projected by the two methods diverge with increasing 2L with the
effect being greater the lower the a . r.
The above examples illustrate the utility of an approach to pipeline cp design and analysis based upon
an FDM solution to Equation 29 compared to already existing alternatives. Studies are presently underway
21
--------- -----< w I ···
0
Cl.
Ci"' 1-· ~
<
Cl
[/)
w IO
0 L_.
w "
------~---2som ,
-
;z
Ci ~
-IO I 0 200 400 600 800 1000 1200
ALPHAxGAMMA, Ohm.m'
60
..J 50 < i==;z w E 40
0 f--< '" u Cl.
~
~ 300 w'2'::: u u ;z 20
1-som ---1
-soom I 1
-1,000 m 1.-.
1
_,._ 5,000 m ·
L:!'" 1 0 000 n\ ---------:
Figure 14: Plot of the percent difference in anode current output as projected by the FDM solution to Equation 29 and BEM for different anode spacings as a function of a · r. The convention
employed was that a positive difference indicates that BEM projected greater/,.
to expand the applicability of Equation 29 to include situation of I) anodes that are offset from the pipeline,
2) multiple grouped anodes, 3) multiple pipelines (parallel and crossing), 4) stratified electrolyte resistivity,
and 5) different anode potentials.
Verification and Qualification of the Slope Parameter Design Method
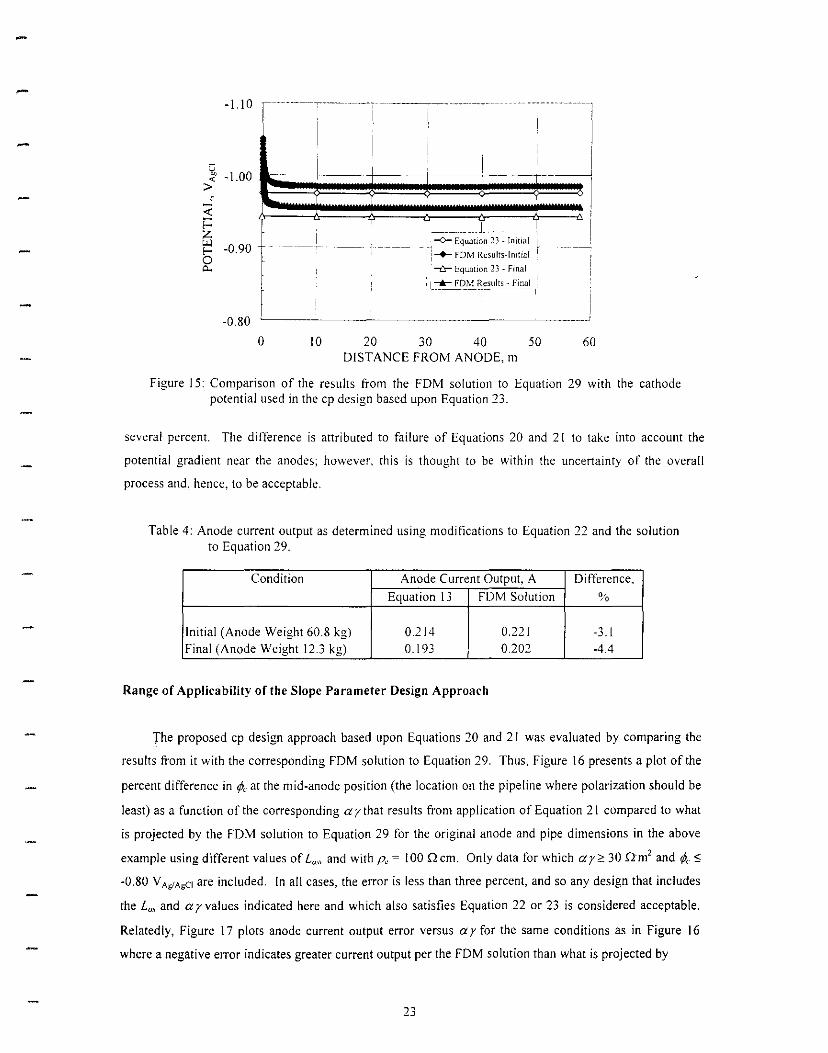
Based upon Equation 29, a verification and qualification analysis was performed regarding accuracy of the
Slope Parameter based method for pipeline cp design (Equations 21 and 23). Thus, Figure 15 shows the
design 1A for both the original (assumed length 0.209 m and radius 0.160 m) and final (80 percent depleted)
anode sizes, the former being-0.975 VAg1AgCI by choice (l,, was calculated using this value) and the latter
0.943,VAi;IAgCI (determined by Equation 21for1A based upon l,, ~ 170 m and the final anode dimensions).
Also illustrated are the attenuation profiles from a FDM solution of Equation 29. The former are seen to be
in good agreement with the latter except in the immediate vicinity of the anode, as should be expected. The
metallic path resistance can be considered negligible for this anode spacing and a · y considered (I 00
f.l · m 2, since the trend demonstrated in Figures 9 and 10 (progressively more positive potential with
increasing distance from an anode) is not seen in the FDM solutions in Figure 15. Anode current output
was also determined I) from the FDM solution to Equation 29 and 2) by resolving Equation 22 and
recognizing that im · Aqi: , I, with the results being shown in Table 4. It is thought that the FDM
solution to I;:quation 29 provided the more accurate result, in which case Equation 22 underestimated I, by
22
-l. l 0
~ ~ -1.00 > ~-~~~-~~-~~~~T~----~I
I
_; < f:: .---- J
-<>-Equation 23 - Initial~ -0.90 -! j-+- FDM Results-Initial0 +
I"- ~Equation 23 - Final
' 1.......- FDM Results - Final ~ ---------------------1
~--- ------------------~-0.80
0 IO 20 30 40 50 60 DISTANCE FROM ANODE, m
Figure 15: Comparison of the results from the FDM solution to Equation 29 with the cathode potential used in the cp design based upon Equation 23.
several percent. The difference is attributed to failure of Equations 20 and 21 to take into account the
potential gradient near the anodes; however, this is thought to be within the uncertainty of the overall
process and, hence, to be acceptable.
Table 4: Anode current output as determined using modifications to Equation 22 and the solution to Equation 29.
Condition Anode Current Output, A Difference, cyoEquation 13 FDM Solution
Initial (Anode Weight 60.8 kg) 0.214 0.221 -3. l Final (Anode Weight 12.3 kg) 0.193 0.202 -4.4
Range of Applicability of the Slope Parameter Design Approach
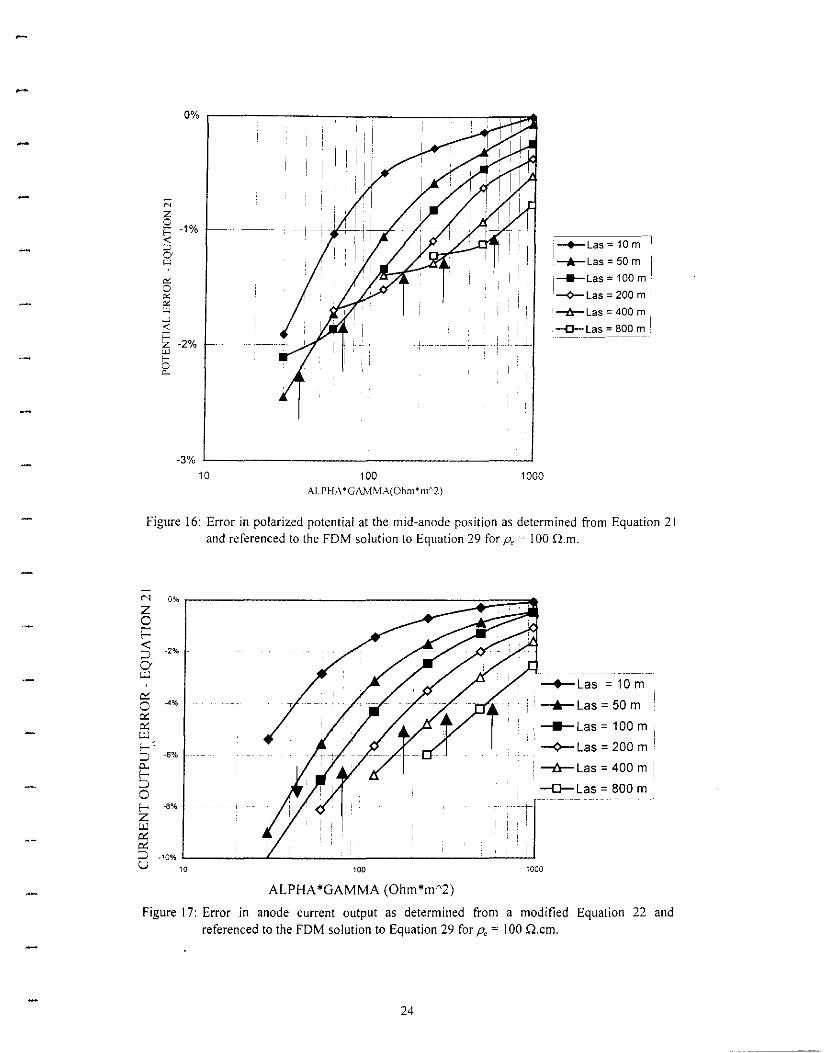
The proposed cp design approach based upon Equations 20 and 21 was evaluated by comparing the
results from it with the corresponding FDM solution to Equation 29. Thus, Figure 16 presents a plot of the
percent difference in 1A at the mid-anode position (the location on the pipeline where polarization should be
least) as a function of the corresponding a y that results from application of Equation 21 compared to what
is projected by the FDM solution to Equation 29 for the original anode and pipe dimensions in the above
2example using different values of l"·" and with p, ~ 100 Ocm. Only data for which ay?: 30 Om and 1A :5
-0.80 VAg/AgCI are included. In all cases, the error is less than three percent, and so any design that includes
the la., and a y values indicated here and which also satisfies Equation 22 or 23 is considered acceptable.
Relatedly, Figure 17 plots anode current output error versus a y for the same conditions as in Figure 16
where a negative error indicates greater current output per the FDM solution than what is projected by
23
;:;
5 - -1o/o ~ :0 0
'" --Las=10m l
1
-+-Las= 50 m I
----Las = 100 m · 1
-¢-Las= 200 m I
1 -tr-Las = 400 m I
-0-Las =BOO m '
10 100 1000
N 0%
z 0 f:: «: :J -2%
0 u.J
-+-Las = 10 m o,; 0 o,; o,; u.J I .
-4% ' ' _...,_Las = 50 m
. ---Las= 100 m , I
--¢-Las = 200 m :J -6%
a.. I
---tr- Las = 400 m I :J 0 -a- Las = 800 m
I -8% -------- ----+
z u.J
g2 :J -10% u 10 100 1000
ALPHA *GAMMA (Ohm*mA2)
, ~
. I
. ---: i I
Figure 17: Error in anode current output as determined from a modified Equation 22 and
ALPHA*GAMMA(Ohm*m/\2)
Figure 16: Error in polarized potential at the mid-anode position as determined from Equation 21 and referenced to the FDM solution to Equation 29 for p, = I00 n.m.
referenced to the FDM solution to Equation 29 for p, = 100 fl.cm.
24
Equation 21. The percent error in current output at a particular ayis greater than for potential (Figure 16)
but is still considered acceptable for most engineering applications. Similarly, for the same design
parameters but with a 15 ncm electrolyte, the maximum mid-spacing potential and anode current output
errors are -1.5 and -5.0 percent, respectively, which are less than for the I 00 Qcm electrolyte. In the latter
case, an additional calculation is necessary to confirm that adequate anode mass is available. Then by
resolving Equation 23 using defined values for all other parameters (C ~ 1700 Ah/kg and u ~0.8), the
minimum acceptable a y for anodes to achieve a 30 yr design life (that is, to maintain rf><. '.>-0.80 V Ag/Agc 1)
was determined. The results of this calculation, along with the corresponding ¢c values, as calculated
iteratively using Equations 21 and 23, are listed in Table 5 and are indicated for each la, in Figure 16 by an
arrow (no arrow is shown for La.i = I0 m since the minimum a y for this anode spacing is below 30 fl m2.
In the high a y regime, the errors are relatively small (the negative error indicates greater polarization
according to the FDM solution compared to Equation 23 ), they converge with increasing a y, and order in
proportion to anode spacing (larger error the greater the anode spacing). The proposed design method has
the advantage of providing an iterative approach whereby different parameters, including anode spacing
and cathode potential, can be optimized.
Table 5: Listing of the minimum allowable a· y and the corresponding resultant cathode
potential to achieve a 30 yr design life using a 60.8 kg anode, on a 0.271 m diameter pipeline in I 00 r.! m seawater.
ANODE MINIMUM ALLOWABLE RESULTANT CATHODE SPACING, m ALPHA*GAMMA, r.!.m 2 POTENTIAL, V M,,c1
10 7 -0.910
50 35 -0.910
100 70 -0.910
200 141 -0.910
400 282 -0.910
800 565 -0.910
CONCLUDING REMARKS
The results to-date from this project are somewhat academic and are presently not in a useful format
for the practicing engineer. In this regard, work is continuing with the ultimate goal of establishing criteria
and a protocol for design of retrofit cp systems upon marine pipelines. It is intended that this will be
provided in a spreadsheet format. Remaining issues that are to be addressed as a part of achieving this goal
include the following:
I. Electrolyte resistivity stratification.
2. . Displaced rather than superimposed anodes.
25
3. Variable anode potentials.
4. Variable anode spacings.
5. Interpretation of survey data.
6. Protection extending from a platform.
7. Parallel pipes.
8. Crossing and joining pipes.
Efforts are also ongoing to expand the project to include industry participation. It is considered that on.ly
by doing this can the full potential of this research be realized.
BIBLIOGRAPHY
1. T. Andersen and A. 1v1isund, "Pipeline Reliability: An Investigation of Pipeline Failure Characteristics and Analysis of Pipeline Failure Rates for Submarine and Cross-Country Pipelines," J. Pet. Technology, April, I 983, p. 709.
2. '"Analysis of the MMS Pipeline Leaks Report for the Gulf of Mexico, Texaco USA, 133 W. Santa Clara, Ventura, CA 93001, October 25, 1985.
3. J. S. Mandke, "Corrosion Causes Most Pipeline Failures in the Gulf of Mexico, Oil and Gas Journal, October 29, 1990, p. 40.
4. C. Weldon and D. Kroon, "Corrosion Control Survey Methods for Offshore Pipelines," Proceedings International Workshop on Offshore Pipeline Safety, New Orleans, Dec. 4-6, 1991, p. 196.
5. Morgan, J., Cathodic Protection, Macmillan, New York, 1960, pp. 140-143.
6. Uhlig, H. H. and Revie, R. W., Corrosion and Corrosion Control, Third Edition, John Wiley and Sons, New York, 1985, p. 223.
7. "Cathodic Protection Design," DnV Recommended Practice RP-101, Det Norske Veritas Industri Norge AS, 1993.
8. "Pipeline Cathodic Protection - Part 2: Cathodic Protection of Offshore Piipelines," Working D_ocument ISO/TC 67/SC 2 NP 14489, International Standards Organization, May 1, 1999.
9. "Corrosion Control of Steel-Fixed Offshore Platforms Associated with Petroleum Production", NACE Standard RP 0176, NACE, Houston, 1976.
10. Wang, W., Hartt, W. H., and Chen, S., Corrosion, vol. 52, 1996, p. 419.
11. W. H. Hartt, Chen, S., and Townley, D. W., Corrosion, vol. 54, 1998, p 317.
12. Townley, D. W., "Unified Design Equation for Offshore Cathodic Protection," paper no. 97473 presented at CORROSION/97, March 9-14, 1997, New Orleans.
13. "Design of Galvanic Anode Cathodic Protection Systems for Offshore Structures," NACE International Publication 7LI 98, NACE International, Houston, TX, 1998.
26
14. Dwight, H.B., Electrical Engineering, Vol. 55, 1936, p. 1319.
15. Sunde, E. D., Earth Conduction Effects in Transmission Systems, Dover Publications, Inc., New York, 1968.
16. McCoy, J.E., Transactions Institute a/Marine Engineers, Vol. 82, 1970, p. 210.
I 7. Cochran, J. C., "A Correlation of Anode-to-Electrolyte Resistance Equations Used in Cathodic Protection," paper no. I 69 presented at CORROSION/82, March 22-26, 1982, Houston.
18. Strommen, R., Materials Performance, Vol. 24(3), 1985, p. 9.
I 9. Cochran, J. C., "Additional Anode-to-Electrolyte Resistance Equations Useful in Offshore Cathodic Protection," paper no. 254 presented at CORROSlON/84, April 2-6, 1984, New Orleans.
20. Foster, T., and Moores, V. G., "Cathodic Protection Current Demand of Various Alloys in Sea Water," paper no. 295 presented at CORROSION/86, March I 7-2, I 986, Houston.
2 I. Mollan, R. and Anderson, T. R., "Design of Cathodic Protection Systems," paper no. 286 presented at CORROSION/86, March 17-2, 1986, Houston.
22. Fischer, K. P.. Sydberger, T. and Lye, R., "Field Testing of Deep Water Cathodic Protection on the Norwegian Continental Shelf," paper no. 67 presented at CORROSION/87, March 9-I 3, I 987, San Francisco.
Fischer, K. P. and Finnegan, J. E., "Cathodic Protection Behavior of Steel in Sea Water and the Protective Properties of the Calcareous Deposits," paper no. 582 presented at CORROSION/89, April 17-21, 1989, New Orleans.
24. Schrieber, C. F. and Reding, J., "Application Methods for Rapid Polarization of Offshore Structures," paper no. 381 presented at CORROSION/90, April 23-27, 1990, Las Vegas.
25. Mateer, M. W. and Kennelley, K. J., "Design of Platform Anode Retrofits Using Measured Structure Current Density", paper no. 526 presented at CORROSION/93, March 8-12, 1993, New Orleans.
26. Burk, J. D., "Dualnode Field Performance Evaluation - Cathodic Protection for Offshore Structures," paper no. 309 presented at CORROSION/9 I, March 11-14, I 99 I, Cincinnati.
27. McCoy, J. E., "Corrosion Control by Cathodic Protection - Theoretical and Design Concepts for Marine Applications", The Institute of Marine Engineers Transactions, Vol. 82, 1970, p. 210.
28. P. Pierson, K. Bethune, W. H. Hartt, and P. Anathakrishnan, "A New Equation for Potential Attenuation and Anode Current Output Projection for Cathodically Polarized Marine Pipelines and Risers," Corrosion, Vol. 56, 2000, p. 350.
27


![DNVGL-RP-F103 Cathodic protection of submarine … Final anode sizing and distribution of anodes (see [6.7]) ... Cathodic protection of pipelines can be achieved using galvanic (also](https://img.dokumen.tips/doc/110x75/5ae4bbc97f8b9a29048b496f/dnvgl-rp-f103-cathodic-protection-of-submarine-final-anode-sizing-and-distribution.jpg)


