Embed Size (px)
Citation preview

Rethinking Social Inequality and Why it Matters
Abstract: As distinct from income or wealth inequality, ‘social inequality’ is currently poorly
understood and, at best, unevenly measured. We take a first step towards building a
consistent framework to conceptualize and measure social inequality. We characterize social
inequality as the relative position of individuals along a number of dimensions that measure
achieved outcomes and perceived access to services as prerequisites to actively participate in
the life of a community and achieve outcomes in the future. Using survey data from twelve
Central and Eastern European countries we construct an index of social inequality that we
compare with other measures of inequality, and we use to identify which countries are more
or less socially advantaged. We find that cross-national patterns of social inequality differ
significantly from patterns derived from measures of income inequality. This is important
since countries with less social inequality have higher levels of economic performance and
stronger political institutions.
Key Words: Inequality; Democracy; Measurement; Central and Eastern Europe.
EUREQUAL project ‘Social Inequality and Why It Matters for the Economic and
Democratic Development of Europe and Its Citizens: Post-Communist Central and Eastern
Europe in Comparative Perspective’, funded by the European Commission under contract No
028920 (CIT5), Framework 6.
Dr. Chiara Binelli
Department of Economics
University of Southampton
Southampton SO17 1BJ
United Kingdom
Dr. Matthew Loveless
School of Politics & International Relations
Rutherford College
University of Kent
Canterbury CT2 7NX
United Kingdom
Prof. Stephen Whitefield
Department of Politics and International Relations
The University of Oxford
Manor Road
Oxford, OX1 3UQ
United Kingdom
Prepared for the
Fifth meeting of the Society for the Study of Economic Inequality (ECINEQ) Bari (Italy), 22-24 July 2013
PLESAE DO NOT CITE: WORKING DRAFT

1. INTRODUCTION
Since the seminal contribution of Amartya Sen (1992) a substantial body of work has
converged on the notion that measuring inequality in several dimensions better informs our
understanding of larger societal profiles since inequalities in different dimensions tend to
move together and influence each other. In the subsequently large literature that has emerged,
a commonly used label for multidimensional inequality is ‘social inequality’, which has been
used mostly as a catch-all concept rather than a distinct and coherent concept.1 While the
term is sometimes used to refer to multiple disparities in material wealth in society, little
attention is given to its character and specificities (Milanovic 2005; Bollen and Jackman
1985). Therefore, social inequality remains a vague concept compared with work on
inequality in individual dimensions such as in income (Milanovic 1998; Atkinson 1999),
wealth (Cagetti and De Nardi 2008), labour market segmentation, gender and ethnicity
(Schrover et al. 2007), welfare status (Layte and Whelan 2003), skills and training (Devroye
and Freeman 2002), health (Marmot and Wilkinson 1999), and housing (Morris and Winn
1990), to name but a few.
Our aim here is to develop a framework to better conceptualize and measure social
inequality. We face two primary constraints in achieving this, one theoretical and one
methodological. The former constraint is the choice of dimensions to measure social
inequality; the latter constraint is aggregating these necessary dimensions without introducing
intractable complexity. We address the theoretical question of the choice of dimensions by
conceptualizing social inequality with Sen’s capability approach in which individuals’
1 As a simple example, the entry for ‘social inequality’ in the Social Science Encyclopaedia
(Kuper and Kuper 2004) simply says, ‘see inequality’, or in the International Encyclopaedia
of the Social Sciences (Darity 2009) there is no further mention or separate category.

wellbeing depends on their effective freedom to achieve their life goals and full potential
(1992, 1999). We argue that reaching this full potential depends both on having achieved
fundamental outcomes such as income, education, and health, as well as on individuals’
access to services, which, we argue, is instrumental to actively participate in the life of a
community and to effectively achieve outcomes in the future. In this way we can identify a
set of minimally required dimensions that proxy fundamental outcomes and vehicles to
achieve future outcomes. Methodologically, we propose a simple procedure to aggregate the
dimensions into one index by using a weighted average of inequality measures across the
chosen dimensions empirically weighted by their relative importance.
The findings provide several potential, if ambitious, contributions to the thinking about
inequality by proposing an index that measures disparities both in terms of actual
achievements and of how individuals perceive their capabilities to achieve outcomes in the
future. The main results suggest that our theory-based social inequality index delivers a better
conceptualization of how inequality matters to individuals. Further, given that our index
outperforms the more commonly used measures of income inequality in predicting cross-
national variation in economic and political conditions, social inequality defined in this way
provides a better aggregate measure of how inequalities co-vary with national economic and
political performance.
2. MEASURING INEQUALITY IN MANY DIMENSIONS
By viewing social inequality as intrinsically multi-dimensional, an important question is
how to aggregate the data on different dimensions into one index. There is an extensive
literature on the multi-dimensional measurement of inequality. At one end, there are authors
who draw conclusions on the overall evolution of inequality by comparing changes in
inequality in separate dimensions (e.g. Slottje, Scully, Hirschberg and Hayes 1991; Easterlin

2000; Hobijn and Franses 2001; Neumayer 2003). A disadvantage of this approach is that it
makes it difficult to formulate an overall conclusion of the extent of inequality if inequality in
one dimension has evolved differently from inequality in another dimension. At the other end,
there are approaches that first construct a composite multi-dimensional index and then
measure the inequality in that index (e.g. Becker et al. 2005; Fischer 2003; McGillivray and
Pilarisetti 2004; Noorbakhsh 2006). The disadvantage of this approach is that it reduces the
multi-dimensional nature of the problem to one dimension.
A middle approach lies in between these two extremes by using recently developed
measures of multi-dimensional inequality. This middle approach has the advantage of
avoiding the reduction of a multi-dimensional problem to a one-dimensional one while yet
producing an overall index of inequality. Two sophisticated versions of this approach are
Decancq et al. (2009) and Decancq and Lugo (2009a) that construct a multi-dimensional
inequality index which combines the information on inequality in different dimensions with
the information on the correlation between these dimensions through weights and substitution
parameters, the former building a multi-dimensional inequality Atkinson index and the latter
building a multi-dimensional Gini index. Both indexes are derived within a theory-based
framework that allows testing the robustness of the results to the theoretical assumptions that
are used to build the indexes. However, at the same time, the theory-based framework has a
level of sophistication that limits a wide application and use of the indexes. Two multi-
dimensional indexes that make use of a simplified version of this middle approach are the
Human Opportunity Index (HOI) that measures disparities in the distribution of access to
basic services for children (Paes de Barros et al. 2009), and the inequality-adjusted HDI
(IHDI) that measures wellbeing accounting for the distribution of human development across
individuals (Foster et al. 2005). Both the HOI and the IHDI require simple computations and
assume that each dimension included in the index weights equally.
In this paper we also propose a simplified version of this middle approach by computing a
simple weighted average of inequality indexes. However, and importantly, differently from
both the IHDI and the HOI, we relax the assumption of equal weights, which imposes an
arbitrary choice on the relative importance of each dimension in the index. Rather, we let the
data inform the choice of the weights by performing a factor analysis, which we will describe
in Section 4.
2.1 CONSTRUCTING A MULTI-DIMENSIONAL INEQUALITY INDEX
Let us assume that there are M relevant dimensions along which to measure inequality and
that these dimensions can be measured in an interpersonal comparable way. Let ij
mx denote
the value of individual i in country j for dimension m and let the vector ),...,( 1
ij
M
ijij xxx
summarize the values across all M dimensions for individual i in country j. Let jX define the
matrix of all values across all M dimensions for all individuals in country j. The overall index
of inequality for a given country j, )( jj XI , which can be rewritten for simplicity as )(XI j ,
can be defined as a function of the M inequality indexes )( j
m
j
m xI , m=1,..,M, computed by
aggregating the values of each of the M dimensions for all N individuals in a given country.
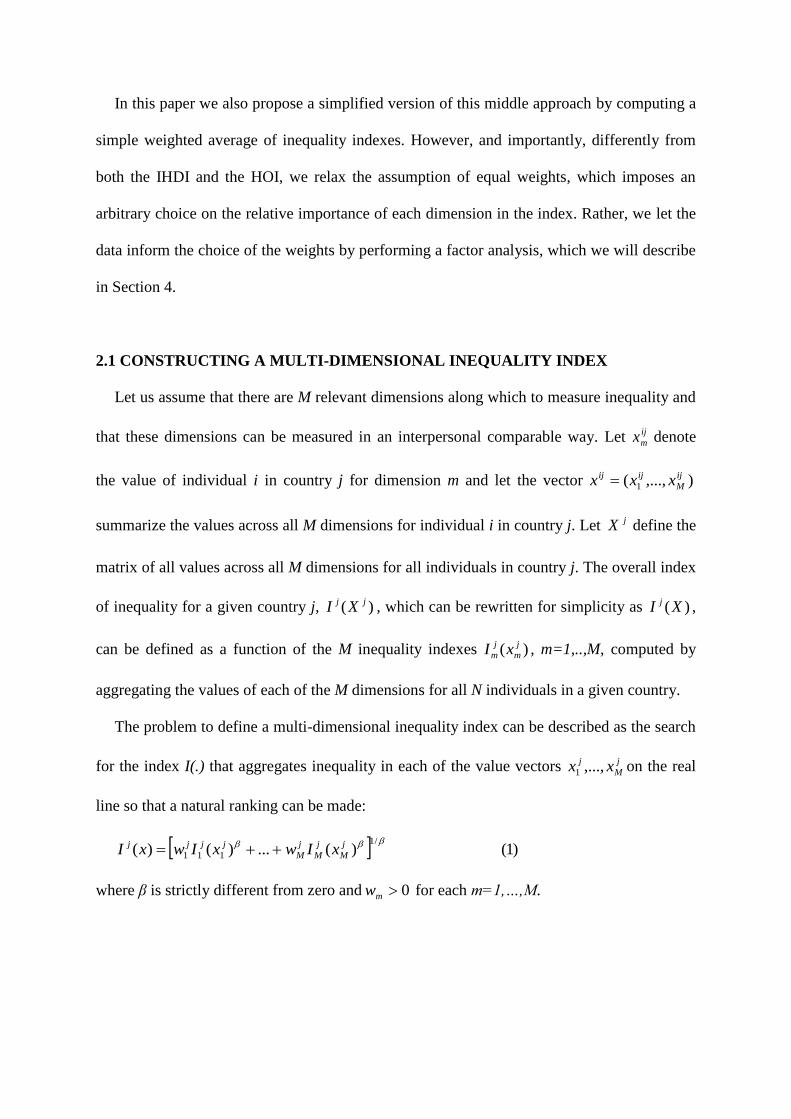
The problem to define a multi-dimensional inequality index can be described as the search
for the index I(.) that aggregates inequality in each of the value vectors j
M
j xx ,...,1 on the real
line so that a natural ranking can be made:
)1()(...)()(/1
111
j
M
j
M
j
M
jjjj xIwxIwxI
where β is strictly different from zero and 0mw for each m=1,…,M.

Therefore, the index I(x) is defined as a simple weighted average of order β of )( mm xI
with weights j
mw , which are allowed to vary by country.2
Given a chosen set of M dimensions, three main components characterize the index I(x):
the parameter β, the M inequality indexes )( j
m
j
m xI , and the weights j
mw . The parameter β is
related to the elasticity of substitution, σ, between pairs of dimensions. For a given pair of
dimensions h and g,
1
1hg . The smaller the β, the bigger the substitutability between
two given dimensions, that is the more we need to decrease one dimension in order to
increase another dimension by one unit while keeping the level of the index I(x) constant. By
specifying the index I(x) in equation (1) we implicitly assume the same degree of
substitutability for all pairs of dimensions. Further, we assume that β=1, so that equation (1)
reduces to the standard weighted arithmetic average.
In order to compute the inequality index )( j
m
j
m xI by country and dimension, we normalize
and rescale the data by subtracting the minimum value and by dividing by the difference
between the maximum and the minimum value, and we compute the Theil index of each m
dimension.3
Finally, we aggregate the M inequality indexes into the overall inequality index for
country j. We do so by computing the weighted arithmetic average of the )( j
m
j
m xI inequality
2 As noted by Decancq and Lugo (2009b), Blackorby and Donaldson (1982) provide an
axiomatic characterization of the mean and Maasoumi (1986) provides an information-
theoretic justification of this class of indexes.
3 The Theil index satisfies the four basic properties desirable in an inequality measure
(Shorrocks 1980). As such it has been extensively used in several inequality analyses
(Galbraith 2012).

indexes for country j with the j
mw weights specified in equation (1). Instead of arbitrarily
imposing equal weights, we will use a factor analysis to let the data inform our choice of the
weights (see Section 4).4 Therefore, overall, our approach simply consists of two main steps:
first, use empirical data to compute the weights, and, second, use these weights to compute a
weighted average.
2.2 CHOICE OF DIMENSIONS
Having identified a simple method to aggregate multiple dimensions in one index, we are
faced with the theoretical question of the choice of which dimensions to include. The multi-
dimensional measurement of inequality is motivated by Amartya Sen’s
“capabilities/functionings” approach, which is based on the core concept that wellbeing
depends on the individuals’ effective freedom to achieve their life goals and full potential or
their own wellbeing (Sen 1992, 1999). Therefore, in theory, capability accounting should
measure the real freedom that people enjoy in trying to achieve their desired – even if only
potential – goals.
A number of important previous contributions (e.g. Anand et al. 2007; Alkire 2010) have
established that a prerequisite for the fulfilment of individuals’ wellbeing is achieving
outcomes in several dimensions. Simply, wellbeing is intrinsically multi-dimensional and
therefore inequality should as well be consistently measured along a number of dimensions.
Our innovation here is arguing that individuals’ wellbeing and effective freedom to achieve
4 Factor analysis is one of several different alternatives to estimate the weights from empirical
data (see Decancq and Lugo 2009b for a comprehensive review of the literature and
Chiappero-Martinetti and Esposito 2008 for an example of computing weights by using direct
empirical evidence on the relative importance attached to each dimension that will enter the
aggregate index).

depend not only on what a person has actually achieved, measured by completed past
outcomes such as one’s level of income, but also, and as importantly, on what a person
expects to be able to achieve in the future. Actual and future achievements are related since
future achievements depend on what has been already achieved as well as on how actual
achievements will allow for an active participation in the life of the community where one
lives. To our mind, a crucial prerequisite for this active participation is an effective access to
health care and education, which we see as fundamental vehicles for social cohesion and
equal opportunities. In other words, our argument is that a capabilities-based measure of
social inequality includes disparities both in actual achievements and in individuals’ access to
health care and education, which, we argue, is instrumental to actively participate in the life
of a community and to effectively achieve outcomes in the future. The importance of access
to services is paramount: inequality in any given measurable dimension is much more
problematic in a society characterized by a skewed distribution of access to health care and
education than in a society where access to services is more widely available (Binelli and
Loveless 2010).
Therefore, we see social inequality as a multi-dimensional inequality measure of actual
achievements and access to services, and we propose our index as the first attempt to measure
disparities in both sets of dimensions. In order to accomplish this task we will use a dataset
that allows measuring both sets of dimensions, described next.
3. DATA
Data collection for this paper was carried out as part of the EUREQUAL project ‘Social
Inequality and Why It Matters for the Economic and Democratic Development of Europe and
Its Citizens: Post-Communist Central and Eastern Europe in Comparative Perspective’,
funded by the European Commission under contract No 028920 (CIT5), Framework 6.

Fieldwork was conducted by national surveys administered by polling institutes in each
country via face-to-face interviews on the basis of stratified national random probability
samples in the spring of 2007. The final dataset includes surveys conducted in 13 CEE
countries (Belarus, Bulgaria, Czech Republic, Estonia, Hungary, Latvia, Lithuania, Moldova,
Poland, Romania, Russia, Slovakia, and Ukraine) with each country’s data weighted to
N=1000.
The EUREQUAL surveys provide a unique opportunity to bring to an empirical test our
theory of social inequality. First, the countries of post-Soviet Central and Eastern Europe
(CEE) including Russia provide a unique examination of the issue of inequality. This region’s
re-orientation away from Soviet Communism towards market economies and political
democracy has met with wide ranging levels of success. Instructively, these countries began a
process of transformation at nearly the same time but achieved substantial dissimilarity in
consolidation of economic and political institutions. Two-thirds of the countries in our
sample, including Hungary, Poland, and the Czech Republic, are members of the European
Union and thus represent near ideal transition cases toward these institutional arrangements
while others, such as Russia and Ukraine, have demonstrated more troubled or partial
transitions. We see this as an advantage over existing studies. Countries of recent and on-
going transition present crucial cases of inequality because it challenges the new ‘rules of the
game’. That is, rather than merely troubling established democracies, inequality is more
relevant to regime stability and legitimacy in non-established democracies as inequality in
Germany, the UK, or even the US, does not threaten the edifice of democratic politics. A
multi-dimensional inequality index – one that captures how individuals experience inequality
- therefore contributes to our knowledge about the extent, stability, and quality of democratic
outcomes given the wide variation in outcomes found in our sample.

Second, and as importantly, the dataset includes two variables that report individuals’
perceived access to health care and education, which respondents were asked to compare to
“…the average access in the country as a whole.” These two variables allow us to measure
self-reported access to services and thus to empirically substantiate the innovative component
of our index. In order to measure achieved outcomes we include households’ income,
individuals’ health status and education level. We have chosen these three variables as the
minimum number of achieved outcomes, in congruence with other work that has established
them as fundamental to capture wellbeing, as best described in the long debate that motivated
the introduction of the HDI, which also measures countries’ level of achievement along these
three dimensions (Fukuda-Parr 2003). Appendix A provides full details on the questions used
to elicit information on each of these five variables. Since Poland does not have a response
for perceived access to education, complicating its comparability, we drop it from our sample.
We use a total of 12 countries: Belarus, Bulgaria, Czech Republic, Estonia, Hungary, Latvia,
Lithuania, Moldova, Romania, Russia, Slovakia, and Ukraine.
Taken together, the five dimensions that we include in the index are fundamental to
enhance the individual’s capability set by allowing individuals to lead a satisfactory and
rewarding life. Taking away any one of someone’s income, health, education or preventing
access to health care and education would restrict an individual’s capability set and thus
reduce his/her level of wellbeing.
4. COMPUTING THE WEIGHTS USING FACTOR ANALYSIS
Having chosen the dimensions to include in the index, we compute the dimension and
country-specific j
mw weights specified in equation (1) by using exploratory factor analysis.
Table 1 presents the results, which show clear cross-national variation across the individual
factor loadings.

<Table 1 about here>
Table 1 shows that in each country the two access variables load strongly and more so
than any of the three other variables suggesting that the access to services variables are a
crucial determinant of our inequality index. This preliminary finding is in congruence with
our argument that a capabilities-based measure of social inequality includes disparities in
individuals’ access to services, which, we argue, is instrumental to actively participate in the
life of a community and to effectively achieve outcomes in the future.
4.1 VALIDATION OF ACCESS VARIABLES
While we see the inclusion of the two access variables as a way to better capture
capabilities, we recognize that these variables are subjective and as such can leave themselves
open to a number of competing interpretations. We therefore assess the quality of these data
through a validation exercise by correlating individuals’ self-reported levels of access to
health and education with a number of existing and objective measures of health care and
education provision.
We start with individuals’ perceived access to education. We validate the data by using
both a measure of availability or provision of education proxied by enrolment rates, and a
measure of quality of education given by the students-teacher ratio as a proxy for class
crowding and learning effectiveness.
The United Nations Educational, Scientific and Cultural Organization (UNESCO)
provide cross-country data on enrolment rates and students-teacher ratios at different levels of
education for each year between 1999 and 2008. First, while data on enrolment rates are
available at each level of education from pre-primary to tertiary, data on students-teacher

ratios are only available up to secondary education.5 Second, while students-teacher ratios
suffer from several missing values in 2007 and 2008, they are reported for most of the
countries in our sample for each year between 2003 and 2006. This is not too limiting as we
assert that dynamism in the educational environment is more likely to be registered by
respondents than stasis. That is, given these data, we expect to find that individuals would
positively rate their access to education if education quality has been improving and vice
versa. Therefore, in order to assure consistency between our indicators and to reduce
measurement error we focus on secondary education and we compute changes in enrolment
rates and students-teacher ratios between 2003 and 2006. We proceed by computing the
correlation between our multi-dimensional index and the changes in enrolment rates and
students/teacher ratios.
<Table 2 about here>
The first and second column of Table 2 show that both changes in overall secondary
enrolments and in public schools only are strongly, positively, and significantly correlated
with the mean level of perceived access to education (by country). In addition, we find that
access to education is also strongly, positively, and significantly correlated with
students/teacher ratio, which suggests that while more students were able to enrol in school
and thus experienced an increased access to education, they did so in crowded schools since
the number of teachers did not increase proportionally.
5 The full dataset is publicly available at
http://stats.uis.unesco.org/unesco/ReportFolders/ReportFolders.aspx?IF_ActivePath=P,50&I
F_Language=eng. As the EUREQUAL surveys were conducted in 2007, it is appropriate to
use data that precedes individuals’ perceptions.

We now move to the second access variable, that is individuals’ perceived levels of
access to health. The World Health Organization (WHO) provides several comparable cross-
country measures of the quality of the health system and the effectiveness of health care
provision.6 Overall, we would expect that in countries with higher expenditure on health and
positive indicators of health, individuals would recognize this and indicate a higher access to
health care. Therefore, we correlate four indicators with the mean of individuals’ perception
of access to health care by country: life expectancy at birth; per capita government
expenditure on health (in PPP, 2006); per capita total expenditure on health (at average
exchange rate, 2006); and the amount of social security expenditure on health as a percentage
of general government expenditure on health (in 2006).
<Table 3 about here>
Table 3 shows that the correlation between each of the indicators of health care provision
from the WHO dataset and perceived access to health is positive and significant (for Social
Security expenditure at the p≤0.10 level) lending support to the validity of our ‘access to
health’ variable.
5. MULTI-DIMENSIONAL INEQALITY INDEX: RESULTS
Having chosen the dimensions to include in our index, validated our use of the access
questions, and obtained the weights using factor analysis, we can proceed to compute the
multi-dimensional inequality index I(x) in equation (1) for each of the 12 countries in the
sample. Figure 1 presents the index by country. Being a simple weighted average of Theil
inequality indexes, the index is very easy to read: the higher the score, the higher the level of
multi-dimensional inequality.
<Figure 1 about here>
6 The full dataset is publicly available at http://www.who.int/whosis/en/

Slovakia has the lowest level of multi-dimensional inequality and Moldova the highest
with a difference of nine percentage points between them. For these post-Soviet states, the
variation in the quality and extent of both democratization and market liberalization match
the generally expected contours of these related processes. While it may seem somewhat
counter-intuitive to see countries such as Russia, Lithuania, and Hungary (and the Czech
Republic and Belarus) having similar levels of social inequality, our multi-dimensional index
of social inequality is a weighted average of achieved and potential outcomes (in the form of
‘access’). The balancing of actual and potential outcomes is one facet of the contribution of
our index and in order to further assess the validity of this balance, we perform a series of
competitive, robustness checks.
5.1 ROBUSTNESS
We perform two main validity checks of our index: first, we assess the importance and the
role of the weights by recomputing the index when imposing equal weights; second, we
assess the importance of the inclusion of the two access variables by recomputing the index
without them. Table 4 reports the results of our baseline index together with the index
without the access variables and the index with equal weights.
<Table 4 about here>
Comparison between the full index and the multidimensional index with equal weights
(columns 1 and 2 in Table 4) suggests that the assumption of equal weights does not
substantially affect the cross-country inequality pattern (r=0.93, p≤0.01, N=12). As well,
Moldova remains the highest inequality and Slovakia the lowest. On the contrary, the pattern
changes substantially when we compute the index without the access variables (compare
columns 1 and 3 in Table 4; r=0.32, p≤0.31, N=12). In other words, while the weights may

slightly adjust the loading pattern of the final index (an important if peripheral aspect), the
access variables change the nature of the index beyond mere computational transformations.
6. INEQUALITY AND CROSS-NATIONAL PERFORMANCE
In the literature income inequality has overwhelmingly been the most studied inequality
concept and, as such, the common understanding of inequality is largely couched in narrowly
economic terms. However, a number of studies have shown that changes in income inequality
do not necessarily move predictably with changes in other dimensions of inequality; or, in
other words, that being economically poor or having a low income is not necessarily a good
indicator of being disadvantaged (e.g. Narayan et al. 2000, Alkire 2010).
Further, inequality in non-income dimensions has large impacts on development as
countries with less human development tend to have greater inequality in more dimensions,
or, in other words, that more human development is associated with less inequality (Alkire
2011). Likewise, the distribution of income is at best a mediocre predictor of the distribution
of non-income dimensions of individuals’ wellbeing. Not surprisingly, therefore, aggregate
income inequality, even when coupled with individual socio-economic locations, remains an
unreliable predictor of broader social, economic, and political opportunities in individuals’
lives (Bartels 2008; Kaltenhaler et al. 2008; Bollen and Jackman 1985; Goodin and Dryzek
1980).7 Consistently, previous work has shown that changes in uni-dimensional inequality
indexes such as changes in income inequality fail to account for substantial cross-national
7 While the cross-national covariance between national-level measures of income inequality
and many social ills is well documented (Bartels 2008; Wilkinson and Pickett 2009), the link
between individuals’ experiences of economic inequalities and social, economic, and political
outcomes is much weaker.

variation in macro indicators that affect wellbeing (e.g. Binelli and Loveless 2010; Loveless
2009).
Given the findings of this previous literature, it may not be unreasonable to argue that the
poor macro-performance of income inequality may be due to income - alone - being unable to
capture information on the set of disparities that matter for individuals’ lives. We address this
by computing the correlations between the most commonly used indicator for income
inequality, namely the Gini index for income inequality, and a set of standard political and
economic macro-indicators. In particular, we consider ‘Political Stability’, ‘Government
Effectiveness’ measures (‘Governance Matters VIII’ project of the World Bank; Kaufmann et
al. 2009), and Freedom House Score, all measured in 2007, as indicators of political
performance; the 2007 GDP per capita and the 5 year growth of GDP per capita between
2002 and 2007 as economic indicators.
Table 5 presents the results. In congruence with recent findings in the literature, we find
that income inequality fails to move in coordination with each economic and political
indicator in any meaningful way. This finding is somewhat disconcerting as the Gini index
for income inequality is a frequently used and often relied upon indicator of not only
disparities in income but also as a proxy of other disparities that impact the lives of
individuals. In contrast to this assumption, our index is constructed to capture much of the
non-income inequality that affects individuals. By including not only achieved outcomes
(among which income), but also perceived access to health and education, we expect the
index to provide a better indicator of the inequality that matters to individuals and their
societies, and thus to countries’ economic and political progress.
<Tables 5 & 6 about here>
Table 6 presents the correlation coefficients between our multi-dimensional inequality
index (MDII) and the same macro variables considered in Table 5. In contrast to the poor

performance of the Gini index for income inequality, it does correlate strongly and in the
expected direction with both government effectiveness scores as well as the Freedom House
scores.8 The correlations suggest that richer countries with better political institutions (at α-
level 90% or higher) tend to exhibit lower multi-dimensional inequality.9
Further, to place both the Gini and our indices in direct comparison, Table 7 presents the
results of a series of OLS regressions where each macro variable is regressed against our the
MDII and of the Gini index for income inequality.
<Table 7 about here>
The regression results in Table 7 strengthen the findings in Table 5 and 6. Controlling for
the Gini index, not only does our social inequality index retain statistical significance for
government effectiveness and the Freedom House scores, it does so as the Gini for income
inequality fails to reach significance with all the macro variables. There is no issue of multi-
collinearity as our social inequality index is not correlated with the level of Gini index of
income inequality (r=-0.06, p≤0.84, N=12; although it is moderately correlated with the
change in the Gini index for income inequality from 2002 to 2007; r=-0.58, p≤0.06, N=12).
Finally, and consistently with the high correlation between our index and the index with
equal weights, while the MDII with equal weights reproduces this macro-performance by
strongly correlating both with the political and with the economic aggregates (e.g. strongly
correlating with GDP per capita at r=-0.61, p≤0.03, N=12), the index without the access
8 The Freedom House scores are intuitively reversed so that a high score is lower freedom.
We have retained that here.
9 We suggest to include GDP per capita as the significance is just less than 90% alpha such
that, given the number of observations (N=12), it is misses statistical significance by a
hundredth of one percent.

variables reproduces the poor performance of the Gini for income inequality by being
uncorrelated with all macro variables.10
All these results taken together provide evidence that inequalities in non-income
dimensions, and in particular in access to services, have an important independent
explanatory power that cannot be effectively proxied by variation in income, and that these
non-income inequalities are the driving force of our index as a better indicator of the
inequality that matters to individuals. In other words, the results show that the crucial source
of variation that is allowing our index to better explain macro-economic and political changes
is provided primarily by the two access variables, which provides supporting evidence for our
capability-based concept of social inequality as reflecting disparities both in actual
achievements and - crucially - in access to services, which we see as instrumental for a full
achievement of the ‘freedom to achieve’. The question now is: why and how the access
variables help better predicting political and economic performance? We discuss this next.
6.1 DISCUSSION
Our index, driven by the “access” variables, links with higher levels of political stability
and governmental effectiveness in the same straightforward manner of the congruency
between political culture and political regime type (Almond and Verba 1963). Countries
characterized by a relatively high level of individuals who perceive the ability to act in their
own interest correspond to our understanding of both healthy democratic citizenship and
democratic processes (ibid.; Dahl 1971; Bandura 2001). Yet, if the possibility of exercising
this efficacy does not exist or does so inconsistently or poorly, or is perceived as such,
realization of citizens’ full political or social potentials are likely limited. Thus while
individuals’ income may indicate various levels of sufficiency or potential for action (as a
10
All results are available from the authors upon request.

distribution of ‘starting points’), the perceived availabilities to actually improve one’s
prospects and actively participate in the life of the community where one lives as well
depends on the provision and access to fundamental services such as health and education.
Therefore, a multi-dimensional index comprising of actual achievements and of access to
services that are a gateway to future achievements more closely aligns with the foundations
of a democratic society.
The important role of disparities in access to services makes a twofold contribution to the
existing literature. First, the inclusion of the access variables adds to the extant models of
inequality that rely exclusively on achieved outcomes. This approach allows us to assess
individuals’ own perceptions of their availabilities to achieve their potential thus producing a
more complete understanding of what the nature of multi-dimensional ‘social inequality’ in a
given society might look like. Rather than reductively assuming that disparities in income are
sufficient to understand the distribution of advantages and disadvantages in society, the
evidence here validates our re-conception of inequality and what it entails, which leads us to
the second part of this contribution.
If we take the MDII to better represent inequality as it exists in several dimensions and as
a function of how individual perceive their potentialities in their respective societies, we are
led to a clearer understanding as to why countries with less social inequality have better
economic performance and stronger democratic political institutions. The normative
relationship between inequality (and inequalities) and democratic political institutions is
fairly well understood (Lichbach 1989; Karl 2000) as the redistribution of the goods of
society is a founding feature of successful democratization and long-term success (Boix
2003). When the market distorts the distribution of goods, democratic remedies are essential
if and when citizens are dissatisfied with inadequate government responses (Dahl 1971). To
the degree that these political institutions fail to offer solutions, they can be perceived to

broken and are thus de-legitimized. Again, as the evidence here shows, where and when this
happens is not revealed by using uni-dimensional measures of income inequality.
How representatives are our findings? As above, while a less common region for study,
countries of Central and Eastern Europe (CEE) provide the means to rigorously test a new
conceptualization and strategy to measure multi-dimensional inequality. Most of what we
know about the relationship between inequality and political institutions come from
established democracies; that is, countries in which the political institutions are established
with little concern for backsliding or ‘alternative solutions’. Given the broad set of
inequalities has been growing unevenly across CEE over this period (Milanovic 1998, 2005;
Förster, et al, 2005), there have been strong calls for return to more egalitarian approaches as
not only were employment opportunities insufficient to maintain a standard of living but also
the goods of market economies were seen to be distributed in a distorted manner (Loveless
and Whitefield 2011; Kelley and Zagorski 2004; Örkeny and Székelyi 2000). Like the West,
but particularly pernicious in less established democracies, these perceptions and the presence
of high levels of inequality in the region have led to declines in political engagement, such as
voting (Karakoc forthcoming) and the perception of high levels of corruption (Loveless and
Whitefield 2011b).
The role of inequalities is acutely relevant for CEE which is representative not only of
post-Soviet states (including Central Asia) but also of other transitional states and regions,
most notably Latin America. Both of these regions have and continue to struggle with
consolidating democratic and market institutions as well as achieving relatively equitable
distributions of public and social goods for their respective societies. Membership in the
European Union of some of the countries examined here also has relevance to many of the
countries of Southern Europe including Greece, Spain, and the Balkans, and smaller
European countries such as Portugal and Ireland. Thus, despite a specific path to this point,
the current situations of the countries of CEE have generalizability to a number of other
regions and countries.
7. CONCLUSION
The aim of this paper is to develop a framework to conceptualize and measure social
inequality. We propose a capabilities-based measure of social inequality that includes
disparities in achieved outcomes (income, education and health status) and in individuals’
access to health care and education, which, we argue, is instrumental to actively participate in
the life of a community and to effectively achieve outcomes in the future. Our multi-
dimensional index of inequality outperforms the more common uni-dimensional indicator of
income inequality by better predicting important economic and political outcomes. This
improvement is due to the inclusion of two access variables - access to health care and access
to education – that incorporate the perceptions of disparities in two fundamental dimensions
along which individuals directly experience inequality. The inclusion of the access variables
innovates our understanding of how inequalities shape people’s lives and builds a strong case
to elicit access-type questions in surveys that aim at measuring multi-dimensional inequality.
We aim to have contributed three key things. One, we have provided a novel
conceptualization of social inequality as a capability-based inequality concept that measures
disparities along both achieved outcomes and access to services as a fundamental means to
actively participate in the life of the community when one lives and thus effectively achieve
outcomes in the future. And we have done so with a simple aggregating procedure: a
weighted average of inequality measures in the relevant dimensions. To be clear, we do not
assert that our index as it is specified represents a final model. A number of alternative
dimensional specifications are clearly available; however, we do assert that our index
contains essential dimensions. Most importantly, it is the inclusion of both achieved
outcomes and variables that measure how these achieved outcomes can allow further
achievements in the future that constitute our main contribution to the study of multi-
dimensional inequality.
Two, we have found that cross-national patterns of social inequality differ significantly
from patterns identified when using more common comparative inequality measures such as
the Gini index for income inequality. In addition, and just as importantly, countries that have
less social inequality exhibit better economic performance and stronger democratic political
institutions. While income inequality matters for individual choices when it is measured at a
disaggregated level at which it is directly experienced by individuals in their daily life such as
among their neighbors or peers (e.g. Stark and Taylor 1991), when at the aggregate level it
merely indicates an environment in which broader sets of disparities are activated. That is,
rising levels of income inequality in a given country often only exacerbate - rather than
capture - the more salient disparities as individuals experience them. Empirically, rising
income inequality is necessary - but not sufficient - to understand how inequalities act in
concert to constrain both societies and the individuals that constitute them.
Three, and given both above, the empirical results that we present validate our
conceptualization of inequality as it matters to and it is perceived by individuals. In countries
in which actual achievements and perceived access to important social institutions are higher,
we find better performing political institutions and higher national-level economic
achievement. While not asserting a causal relationship, this is indicative of a relationship
suggesting, for the most part, that countries with high levels of inequality are countries in
which most people would prefer not to live. If this is the case, the innovation about the
thinking and structure of inequality that we propose provides insights into what inequality
means as an indicator of the actual quality of life in a given country. While an enormous
amount of literature exists for the more common income inequality, future research should

aim at examining the connection of the index produced here to cross-national differences in
which political, economic and social factors play an important role in generating future
opportunities.

REFERENCES
Alkire, Sabina. 2011. “Equality and Economic Development: Are Egalitarian Societies More
Successful?”, slides presented on March 8th
2011, St. Anthony College, University of
Oxford.
Alkire, Sabina. 2010. “Multidimensional Poverty and its Discontents”, paper presented at the
10th
EUDN Conference, 1 December, Paris, France.
Almond, Gabriel A. and Sidney Verba. 1963. The Civic Culture. Princeton University Press:
Princeton, NJ.
Anand, Paul, Graham, Hunter, Ian, Carter, Keith Dowding, Francesco Guala, and Martin Van
Hees. 2007. “Measuring Human Capabilities”, Open University Discussion Paper No. 53.
Atkinson, Anthony B. 1999. “Income Inequality in the UK” Health Economics 8(4): 283–288.
Bandura, Albert. 2001. “Social Cognitive Theory of Mass Communication” Media
Psychology 3:265-99.
Bartels, Larry. 2008. Unequal Democracy: The Political Economy of the New Gilded Age.
Princeton: Princeton University Press.
Becker, Gary S., Tomas J., Philipson, and Rodrigo R., Soares. 2005. “The quantity and
quality of life and the evolution of world inequality” American Economic Review 95(1):
277–291.
Binelli, Chiara, and Matthew, Loveless. 2010. “Social and Income Inequality: A New
Concept of Relative Poverty”, invited talk at Amnesty International. Piacenza, Italy: May
29.
Blackorby, Charles, and David, Donaldson. 1982. “Ratio-scale and translation-scale full
interpersonal comparability without domain restrictions: admissible social-evaluation
functions” International Economic Review 23(2): 249-68.
Boix, Charles. 2003. Democracy and Redistribution. Cambridge University Press.
Bollen, Kenneth A., and Robert W., Jackman. 1985. “Political Democracy and the Size
Distribution of Income” American Sociological Review 50(4):438-457.
Cagetti, Marco, and Maria Cristina De Nardi. 2008. "Wealth Inequality: Data And Models"
Macroeconomic Dynamics 12(S2): 285-313.
Chiappero-Martinetti, Entica, and Luca, Esposito. 2008. “Multi-dimensional Poverty
Measurement: Restricted and Unrestricted Hierarchy among Poverty Dimensions”, OPHI
Working Paper.
Dahl, Robert. 1971. Polyarchy. Yale University Press.

Darity, William A. 2009. International Encyclopedia of the Social Sciences New York:
Macmillan.
Decancq Koen, Andre’, Decoster, and Erik, Schokkaert. 2009. “The Evolution of World
Inequality in Wellbeing” World Development 37(1): 11-25.
Decancq, Koen, and Lugo, Maria Ana. 2009a. “Measuring Inequality of Wellbeing with a
Correlation-Sensitive Multi-dimensional Gini Index”, University of Oxford Department of
Economics Discussion Paper Series 459.
Decancq, Koen, and Lugo, Maria Ana. 2009b. “Weights in Multi-dimensional Indices of
Wellbeing”, Mimeo.
Devroye, Dan, and Richard B., Freeman. 2002. “Does inequality in skills explain inequality
of earnings across advanced countries?” CEPDP, 552. CEP, London School of Economics
and Political Science, London, UK.
Easterlin, Richard A. 2000. “The worldwide standard of living since 1800” Journal of
Economic Perspectives 14(1): 7–26.
Fischer, Stanley. 2003. “Globalization and its challenges” American Economic Review 93(2):
1–30.
Förster,, M., D. Jesuit, and T. Smeeding. 2005. “Regional Poverty and Income Inequality in
Central and Eastern Europe: Evidence from the Luxembourg Income Study” in R. Kanbur
and A. J. Venables (eds.), Spatial Inequality and Development. Oxford: Oxford University
Press. pp. 311-347.
Foster James E., Luis F., Lopez-Calva, and Miguel Szekely. 2005. “Measuring the
Distribution of Human Development: methodology and an application to Mexico” Journal
of Human Development 6(1): 5-25.
Fukuda-Parr, Sakiko. 2003. "The Human Development Paradigm: Operationalizing Sen’s
Ideas on Capabilities" Feminist Economics 9 (2–3): 301–317.
Galbraith, James K. 2012. Inequality and Instability. New York: Oxford University Press.
Goodin, Robert E., and John, Dryzek. 1980. “Rational Participation: The Politics of Relative
Power” British Journal of Political Science 10(3): 273-92.
Hobijn, Bart, and Phil Hans, Franses. 2001. “Are living standards converging?” Structural
Change and Economic Dynamics 12(2): 171–200.
Kaltenhaler, Karl, Stephen, Ceccoli, and Ronald, Gelleny. 2008. “Attitudes toward
Eliminating Income Inequality in Europe” European Union Politics 9(2):217-241.
Karakoc, Ekrem. (forthcoming) “Economic Inequality and its Asymmetric Effect on Civic
Engagement: Evidence from Post-communist Countries” European Political Science
Review

Karl, Terry Lynn. 2000. “Economic Inequality and Democratic Instability” Journal of
Democracy 11(1):149-156.
Kelley, Jonathan, and Krzysztof, Zagorski. 2004. “Economic Change and the Legitimation of
Inequality: The Transition From Socialism to the Free Market in Poland and Hungary,
1987-1994” Research in Social Stratification and Mobility 22: 319-364.
Kuper, Adam, and Jessica, Kuper. 2004. The Social Science Encyclopedia, Routledge.
Layte, Richard, and Christopher T., Whelan. 2003. “Moving In and Out of Poverty: The
Impact of Welfare Regimes on Poverty Dynamics in the EU” European Societies 5(2):
167-191.
Lichbach, Mark Irving. 1989. “An Evaluation of "Does Economic Inequality Breed Political
Conflict?” World Politics 41(4):431-470.
Loveless, Matthew. 2009. “The Political Consequences of Social Inequality: Central and
Eastern Europe” presented at the International Sociological Association, Research
Committee on Social Stratification and Mobility (RC28) Annual Meeting. Beijing, China:
May 14-16.
Loveless, Matthew, and Sthephen, Whitefield. 2011a. “Being Unequal and Seeing Inequality:
Explaining the Political Significance of Social Inequality in New Market Democracies”
European Journal of Political Research 50: 239–266.
Loveless, Matthew and Stephen, Whitefield. 2011b. “Corruption in Central and Eastern
Europe: Perceptions, Inequality, and Legitimacy” presented at the Mid-west Political
Science Association Annual Meeting. Chicago, IL: 31 March-3 April.
Maasoumi, Esfandiar. 1986. “The measurement and decomposition of multi-dimensional
inequality” Econometrics 54(4): 991-97.
Marmot, Michael, and, Richard, Wilkinson. 1999. Social Determinants of Health. Oxford:
Oxford University Press.
McGillivray, Mark, and, J. Ram, Pillarisetti. 2004. “International inequality in wellbeing”
Journal of International Development 16: 563–574.
Milanovic, Branko. 1998. Income, Inequality and Poverty during the Transition from Planned
to Market Economy. The World Bank; Washington D.C.
Milanovic, Branko. 2005. Worlds Apart. Measuring International and Global Inequality.
Princeton University Press; Princeton
Morris, Jenny, and, Martin, Winn. 1990. Housing and Social Inequality. Hilary Shipman Ltd.
Narayan, Deepa, Raj Patel, Kai Schafft, Anne Rademacher, and Sarah Koch-Schulte (eds.).
2000. Voices of the Poor: Can Anyone Hear Us? World Bank: New York, N.Y: Oxford
University Press.

Neumayer, Erik. 2003. “Beyond Income: Convergence in Living Standards, Big Time”
Structural Change and Economic Dynamics, 14(3): 275–296.
Noorbakhsh, Farhad. 2006. “International convergence or higher inequality in human
development, evidence from 1975–2002” WIDER Research Paper Series 2006-15.
Norton, Michael I. and Dan Ariely. 2011. “Building a Better America—One Wealth Quintile
at a Time” Perspectives on Psychological Science 6(1): 9–12.
Örkeny, Antal, and, Maria, Székelyi. 2000. “Views on Social Inequality and the Role of the
State: Post transformation Trends in Eastern and Central Europe” Social Justice Research
13(2):199-218.
Paes de Barros, Ricardo, Francisco H. G., Ferreira, Jose’ R., Molinas Vega, and Jaime
Saavedra Chanduvi (eds.). 2009. Measuring Inequality of Opportunities in Latin America
and the Caribbean. The World Bank.
Schrover, Marlou, Joanne, Van der Leun, and, Chris, Quispel. 2007. "Niches, Labour Market
Segregation, Ethnicity and Gender" Journal of Ethnic and Migration Studies 33(4): 529-
540.
Sen, Amartya K.. 1992. Inequality Reexamined. Oxford: Oxford University Press.
Sen, Amartya K.. 1999. Development as Freedom. Oxford: Oxford University Press.
Shorrocks, Anthony F. 1980. “The Class of Additively Decomposable Inequality Measures”
Econometrica 48(3): 613-625.
Slottje, Daniel J., Gerald, Scully, Joseph G. Hirschberg, and, Kathy J., Hayes. 1991.
Measuring the Quality of Life Across Countries. Westview Press.
Stark, Oded, and J. Edward,Taylor. 1991. “Migration Incentives, Migration Types: The Role
of Relative Deprivation” The Economic Journal 101(408): 1163-1178.
Wilkinson, Richard G., and Kate Pickett. 2009. The Spirit Level: Why More Equal Societies
Almost Always Do Better. London: Penguin
Whitefield, Stephen. 2002. ‘The Political Economy of Targeting and Poverty Alleviation in
Ukraine’ Post-Soviet Affairs 18: 71-97.

TABLES AND FIGURES
Table 1: Exploratory Factor Analysis
Income Health Education
Access:
Health
Access:
Education N
Eigenvalu
e
Differenc
e
Belarus 0.43 0.29 0.41 0.77 0.77 750 1.63 1.34
Bulgaria 0.60 0.49 0.61 0.76 0.73 641 2.09 1.84
Czech Rep 0.55 0.41 0.55 0.56 0.69 674 1.57 1.40
Estonia 0.29 0.32 0.20 0.78 0.76 681 1.41 0.82
Hungary 0.38 0.21 0.44 0.73 0.72 609 1.43 1.12
Latvia 0.52 0.47 0.38 0.79 0.78 691 1.88 1.64
Lithuania 0.43 0.42 0.37 0.88 0.89 685 2.09 1.71
Moldova 0.33 0.41 0.38 0.73 0.73 646 1.49 1.25
Romania 0.51 0.39 0.61 0.81 0.82 1084 2.12 1.88
Russia 0.33 0.33 0.25 0.83 0.83 1369 1.66 1.46
Slovakia 0.39 0.39 0.52 0.65 0.72 698 1.51 1.39
Ukraine 0.27 0.46 0.36 0.83 0.83 1196 1.78 1.59

Table 2: Correlation Between Perceptions of Access to Education and National-level
Indicators of Availability and Quality of Education
Change in Total
Secondary
Enrolment Rate
2003-2006
Change in
Secondary
Enrolment Rate
2003-2006: Public
Change in
Students/Teacher
ratio at Secondary
2003-2006
Mean Perception
of Access to
Education
r=0.91
(p≤0.001)
N=12
r=0.89
(p≤0.001)
N=11*
r=0.90
(p≤0.001)
N=11**
P=Probability Two-Tailed; T-Test
Source: United Nations Educational, Scientific and Cultural Organization (UNESCO)
Notes:
* Bulgaria is dropped since there are no data on Secondary Enrolment Rate.
**Estonia is dropped since there are no data on Secondary Students/Teacher ratio.

Table 3: Correlation Between Perceptions of Access to Health Care and National-level
Indicators of Health Care Provision
Life
expectancy
at birth
in 2006
General government
expenditure on
health as % of total
expenditure on
health in 2006
Per capita total
expenditure on
health in 2006
Social security expenditure
on health as % of general
government expenditure
on health in 2006
Mean Perception
of to Health Care
r=0.69
(p≤0.014)
N=12
r=0.82
(p≤0.001)
N=12
r=0.72
(p≤0.009)
N=12
r=0.51
(p≤0.089)
N=12
P=Probability Two-Tailed; T-Test
Source: World Health Organization (WHO)

Table 4: Multi-dimensional Inequality Index
Baseline Full Index Equal Weights No Access Variables
Belarus 0.071 0.076 0.068
Bulgaria 0.087 0.088 0.117
Czech Republic 0.077 0.078 0.132
Estonia 0.073 0.082 0.061
Hungary 0.088 0.100 0.124
Latvia 0.093 0.098 0.129
Lithuania 0.080 0.084 0.154
Moldova 0.152 0.189 0.345
Romania 0.123 0.127 0.181
Russia 0.082 0.088 0.087
Slovakia 0.059 0.064 0.158
Ukraine 0.089 0.088 0.347

Table 5: Correlation Between Gini Index for Income Inequality and Macro Indicators
Gini Index 2007
Political Performance
Political Stability r= -0.25 (p≤0.43, N=12)
Government Effectiveness r= -0.06 (p≤0.85, N=12)
Freedom House Score r= 0.24 (p≤0.46, N=12)
Economic Performance
GDP per capita r= -0.18 (p≤0.58, N=12)
5 year per capita
GDP growth
r= -0.01 (p≤0.99, N=12)

Table 6: Correlation Between MDII and Macro Indicators
MDII
Political Performance
Political Stability r=-0.23 (p≤0.48, N=12)
Government Effectiveness r=-0.62 (p≤0.03, N=12)
Freedom House Score r=0.61 (p≤0.03, N=12)
Economic Performance
GDP per capita r=-0.47 (p≤0.11, N=12)
5 year per capita
GDP growth
r=-0.17 (p≤0.59, N=12)

Table 7: Regression Results of Macro Indicators on MDII and Gini Index
Political
Stability
Government
Effectiveness
Freedom
House Score
GDP
per capita
5 year
per capita
GDP
growth
MDII -6.42
(8.14) -23.23*
(9.61)
55.15*
(21.49)
-82026.5
(47808.83)
-18.64
(34.84)
Gini Index
2007
-0.03
(0.04)
-0.02
(0.04)
0.11
(0.09)
-160.18
(215.11)
-0.01
(0.16)
Constant 1.87
(1.40)
2.74
(1.65)
-5.93
(3.69) 18237.89*
(8228.16)
3.26
(5.99)
R2 0.12 0.39 0.45 0.27 0.04
N=12; Beta (standard error): * p<0.05, ** p<0.01
Source: EUREQUAL Mass Publics Surveys 2007

Figure 1: Multi-dimensional Inequality Index
0.00
0.02
0.04
0.06
0.08
0.10
0.12
0.14
0.16
Multidimensional Inequality Index

APPENDIX A: MEASUREMENT APPENDIX
Individual-level variables from EUREQUAL Survey:
Income: (L6a): “Can you tell me please what is your own monthly income before taxes from your
work, pension and any other sources of income, such as child benefit, family allowances, etc. that
you may have? ” Open-ended response: Hungary, Moldova, and Romania. Income range categories:
Belarus, Bulgaria, the Czech Republic, Estonia, Latvia, Lithuania, Poland, Russia, Slovakia, and
Ukraine. We also produced a trifurcated version of income (based on the distribution by thirds) that
produced a similar outcome.
Health: M1: How would you describe your health in general? 5: Excellent; 4: Good; 3: Average; 2:
Poor; 1: Very Poor.
Education: all countries were adjusted to the ISCED 1997. 0: Pre-primary; 1: Primary; 2: Lower
secondary; 3: Upper secondary; 4: Post-secondary, non-tertiary; 5: First stage tertiary; 6: Second
stage tertiary leading to an advanced research qualification.
Access to Health Care: L7f: Now, please compare your household’s access to health care with the
average access in the country as a whole? Would you say that your household’s health care access is:
1: Well below average; 2: Below average; 3: Somewhat below average; 4: Average; 5: Somewhat
above average; 6: Above average; 7: Well above average; Do not know (recoded to missing).
Access to Education: L7g: Now, please compare your household’s access to education with the
average access in the country as a whole? Would you say that your household’s access to education
is: 1: Well below average; 2: Below average; 3: Somewhat below average; 4: Average; 5: Somewhat
above average; 6: Above average; 7: Well above average; Do not know (recoded to missing).
Macro-level variables:
GDP per capita (2002-2007): World Bank data: www.worldbank.org/data.html
GINI (2002-2007): United Nations Development Programme: http://hdr.undp.org/en/statistics/data/
Freedom House scores (2002-2007): http://www.freedomhouse.org/
Governance Scores (2002-2007): including Rule of Law, Governmental Effectiveness, Control of
Corruption, and Regulatory Quality. Source: Daniel Kaufmann, Aart Kraay and Massimo Mastruzzi
(2009). "Governance Matters VIII: Governance Indicators for 1996-2008". World Bank Policy
Research June 2009.