Embed Size (px)
Citation preview

This chapter presents a sophisticated approach for track-ing student cohorts from entry through departure withinan institution. It describes how a researcher can create astudent tracking model to perform longitudinal researchon student cohorts.
Retention Tracking Using Institutional Data
Fred Lillibridge
Longitudinal research is the collection and analysis of data at discrete timeintervals over a period of time. The model described in this chapter wasdeveloped by an institutional research (IR) office to track students by semes-ter in order to explore what happened over time to students who enteredthe college during a specific semester. These students make up a cohort,defined as a group of students who meet a set of common conditions. Didthey persist, stop out, transfer, graduate, or drop out of college?
The model was developed to produce the data necessary to completethe Integrated Postsecondary Education Data System (IPEDS) GraduationRate Survey (GRS) in compliance with the Student Right-to-Know andCampus Security Act of 1990. The act requires postsecondary educationentities that receive Title IV financial aid funds to compile and release theinstitutionwide graduation rate to all students. Typical retention rates arefall to spring, fall to fall, and fall to fall to fall. Completion rates are pro-duced for entering cohorts after three years and beyond.
Notice the model for complying with the GRS focuses on enrollmentand certificate and degree completion. It does not delve into questionsrelated to course-taking patterns, movement through remedial to college-level coursework, course completion ratios, grade point averages, or othermeasures of academic success. In contrast to the rich findings possiblethrough transcript analysis, tracking the enrollment and completion of stu-dent cohorts yields information at the macro level of an institution.
19
2
NEW DIRECTIONS FOR COMMUNITY COLLEGES, no. 143, Fall 2008 © 2008 Wiley Periodicals, Inc.Published online in Wiley InterScience (www.interscience.wiley.com) • DOI: 10.1002/cc.332

20 STUDENT TRACKING IN THE COMMUNITY COLLEGE
NEW DIRECTIONS FOR COMMUNITY COLLEGES • DOI: 10.1002/cc
The specific approach to longitudinal research presented in this chap-ter allows the researcher to measure student flow, persistence, and comple-tion over time. The model is used to calculate a variety of retention andcompletion rates, and it allows the researcher to show results by incorpo-rating the model in a supplemental spreadsheet.
Start with Data
Gaining access to institutional data is the first step of the research process.Institutional researchers will likely discover that other campus units con-trol the data they need. Establishing an effective relationship with the datacustodians is essential to success. The information technology unit and IRoffice often do not look at data in the same way. Most transactional data sys-tems are designed to support essential college operations and not to supplydata for IR offices.
The IR office needs to establish a consistent procedure to extract datafrom the student information system and store it on a secure computer orserver. At a minimum, this needs to be done at two critical times duringeach semester: on the official census date and following the end of thesemester after grades are posted. Generally these files are called the censusand final files. Together they can be used to establish a basic data warehouse.
Institutional researchers also need to develop procedures to make surethe extracted data are accurate. Data must be cleaned by examining dataanomalies and working with student services offices and other data custodi-ans to correct miscodes and find and enter missing data. Decisions must bemade about what data should be updated. It is usually necessary to updatestudent ID numbers that may have changed or been corrected because a stu-dent’s unique identification code serves as the key variable used to join orlink his or her records from different data files. Many researchers also find ituseful to update grades that may have changed after the final file was created.
Anyone conducting or evaluating longitudinal studies should be awarethat no student information system is perfect. Data errors result from mis-takes in data entry and incorrect data supplied by students. Also, studentsbehave in ways that are inconsistent with our textbook descriptions ofenrollment. For example, students may sit in on classes but not registeruntil later in the term or even after the semester ends. They may register formultiple sections of the same course during the same semester or registerfor lower-level prerequisites after completing the higher-level course in asequence. Researchers must weigh the costs of pursuing and achieving dataperfection against the benefits, taking into consideration how and by whomthe data will be used and the impact of using imperfect data.
Next, the data files need to be frozen so that changes can no longer bemade. The decision about when to extract and then freeze the data is up tothe researcher. It is important to do this so that research findings will hit thesame data over time and produce consistent results. It is not unusual to

21RETENTION TRACKING USING INSTITUTIONAL DATA
NEW DIRECTIONS FOR COMMUNITY COLLEGES • DOI: 10.1002/cc
delay the final freeze for a year or more. The IR office should then secure thedata files so that unauthorized individuals cannot access them. Data files alsoneed to be backed up early and often. It is important that copies of the datafiles be put in a safe place other than the location where the data warehouseis stored so that a single disaster will not destroy both sets of files.
Data Files
This model relies on a series of flat files that contain text or ASCII data in afixed field format. This approach offers several advantages. Flat files makeit possible for the researcher to use the files with all types of software (SAS,SPSS, Access, Excel). Most researchers have preferences about which soft-ware tools they want to use. This approach has an added advantage in allow-ing researchers to use many tools to access the data files and permittingadaptation to future software changes. The IR office should have access totext editor software to edit these large files.
The longitudinal model relies on several basic files created from inter-nal data sources. Virtually all institutions have these data, although the easeof accessing them varies. Each record in a file contains one or more keys thatpermit joining records from a number of files by matching keys. A key maybe a student identification code, a course reference, or another identifier.
Student Demographic File. The most important file is the studentdemographic file. It contains data elements about individual students thattypically come from the admissions and registration system. Individual stu-dent records are often referred to as unit record data. There is one record perstudent, containing variables or data fields such as a student identificationcode, name, date of birth, sex, race or ethnicity, high school information,major, cumulative GPA, cumulative credit hours, placement test scores, andother available student-specific data. Each variable has one or more values.For example, the variable sex generally has two values, male and female.Because there is just one record per student, the number of these recordswhen totaled is the unduplicated head count for the semester, year, or othertime period being examined.
Semester Course File. The semester course file contains informationabout a student’s enrollment during a particular term. A course file is cre-ated for the official census date and at the end of the semester. There will beone record per student per enrolled course. The file contains variables suchas the term, course prefix, course number, course section, credits, and finalgrade. Each record has two keys: a student ID and course number. The totalof these records will equate to a seat count or the total number of seats occu-pied by students in all classes. Seat count is a duplicated head count becauseeach student is counted as many times as the number of courses in whichhe or she is enrolled.
Course Schedule File. This file describes the course being taught andcontains variables such as term, instructor information, number of students

22 STUDENT TRACKING IN THE COMMUNITY COLLEGE
NEW DIRECTIONS FOR COMMUNITY COLLEGES • DOI: 10.1002/cc
enrolled, available seats, mode of instruction, and time and location of thecourse. This file keys on course, which consists of course prefix, number,and section.
Certificate and Degree Completion File. This file contains student com-pletion data, including degrees earned, certificates earned, or any othercompletions recognized by the college, and the semester the student com-pleted each degree or certificate. The student identification number is the key.The model requires that a degree master file be created. This file contains asingle record for each student. Each record shows awarded degrees or certifi-cates for all of the semesters in the certificate and degree completion file. Inany semester, a student could have received a certificate, a degree, or neither.If a student is awarded both a certificate and a degree, the value is set to degreebecause the model considers a degree to be a better outcome than a certificate.
Other Files. Other internal files will add value to the student trackingmodel if the data are available. Data about financial aid allow researchers toexamine differences in persistence and completion by financial aid status.When possible, the IR office should collect data about interventions fur-nished by the institution. These could include tutor center contacts andactivity, advisor contacts, class attendance, and student survey results. To beusable in this model, these data need to be keyed on student ID.
External Transfer Data File. Any student tracking model is enhancedby inclusion of transfer data. Student transfers are considered positive out-comes for community college students. Other institutions, the state highereducation office, or the National Student Clearinghouse must supply thesefiles through data sharing agreements. Such agreements must comply withthe provisions of the Family Educational Rights and Privacy Act.
Student Tracking Model
The student tracking model example in this chapter measures student out-comes from fall 2004 to spring 2007. The model uses data from fall and springsemesters except for transfer and completion data; degrees and certificatesawarded or transfers that occur in summer sessions are coded as the priorspring. Because this model is used to find retention and graduation rates,summer sessions are not deemed critical. Adding summer semesters to themodel will increase complexity and reduce the clarity of results. Even thoughsummer sessions are not used in this model, it is important for an IR office tocreate semester files for summer sessions just as for fall and spring semesters.
Step One: Establish the Cohort. The first step is to determine whichstudents will be in the study cohort. Students included in a particular stu-dent tracking cohort must meet a set of common conditions. Because thesemester Student Demographic File contains specific student variables, allthat is required to create a cohort is to select the desired variables and theirvalues. The most common cohort used in institutional research focuses onnew students who did not attend college prior to attending the current insti-

23RETENTION TRACKING USING INSTITUTIONAL DATA
NEW DIRECTIONS FOR COMMUNITY COLLEGES • DOI: 10.1002/cc
tution. The IPEDS Graduation Rate Survey (GRS) for community collegesuses a cohort of first-time, full-time, degree-seeking students as the unit ofstudy. An example of a cohort is all first-time students who were full-time,degree-seeking students in fall 2004. It would be easy to add a filter to selectonly Hispanic full-time, degree-seeking students or first-time students whotook and passed a specific course or courses, such as developmental math.Other examples of cohorts are students entering with a GED, students in alearning community, or any other combination of values found in the Stu-dent Demographic File or the Semester Course File.
A cohort file or dataset is created and then merged by student ID withoutcomes data to create a longitudinal record by semester for each studentin the cohort. The file structures are identical for every semester, so all thatis necessary to create a cohort for another semester is to change the nameof the file that is being processed; for example, instead of accessing the fall2004 file the researcher uses the fall 2005 file.
Step Two: Determine Student Outcomes for Each Semester. UsingIR data, the researcher can determine these institutional outcomes for eachstudent: a student can persist, stop out (leave for one or more terms andthen return), or earn a degree or certificate during any semester. With exter-nal files, the researcher can explore whether a student enrolled in anothercollege or university after leaving the home institution. As an aside, it is dif-ficult to track a student who is unknown; an unknown student is definedas one who is not enrolled, did not enroll in any subsequent semesters, ordoes not appear on any external transfer files. We presume these studentshave dropped out, but the researcher lacks data to know this with certainty.
The model is intended to lower the number of students with values ofunknown by replacing the unknown value with other outcome values. Thisis primarily done by using transfer and certificate or degree completion data.Determination of all outcome values in the model is made in a hierarchicalsequence by processing if-then statements that set the outcome variablevalue for all semesters in the study. Table 2.1 illustrates the outcomes for thesame student for each of five semesters. Boldface depicts a change in statusfor the student from one step in the process classification process to the next.
Step 2A: Distinguish Persisters and Unknowns. A persister is a studentwho continues to be enrolled at the college; an unknown is a student whosestudent ID is not found in the Semester Course file. To determine which stu-dents are persisters or unknowns, process each Semester Course file inchronological sequence using SAS or a similar analysis tool. A variablenamed for the semester (for example, SP05) is created. If the student ID isfound in the cohort file and in the spring 2005 Semester Course file, thevalue for variable SP05 is coded as persist. If the student ID is found in the cohort file but not in the SP05 Semester Course file, the value for vari-able SP05 is coded as unknown. The same is done for the fall 2005 semes-ter (FA05) file. A variable named FA05 is created and assigned a value ofpersist or unknown depending on whether the student ID matches between

24 STUDENT TRACKING IN THE COMMUNITY COLLEGE
NEW DIRECTIONS FOR COMMUNITY COLLEGES • DOI: 10.1002/cc
Table 2.1. Student Outcomes by Semester
Description StudentStep of Step ID SP05 FA05 SP06 FA06 SP07
2a Distinguish 111111 Persist Unknown Unknown Persist Unknownpersisters and unknowns
2b Determine 111111 Persist StopOut StopOut Persist Unknownstop outs
2c Determine 111111 Persist StopOut StopOut Persist Transfertransfers
2d Determine 111111 Persist StopOut StopOut Cert Transfercertificate completers
2e Determine 111111 Persist StopOut StopOut Degree Transferdegree completers
the cohort file and the FA05 Semester Course file. This is done for everysemester in the study. The variables FA04 (from which the cohort is definedin this example), SP05, FA05, SP06, FA06, and SP07 are created for eachstudent in the cohort. Each variable has a value of either persist orunknown.
The results shown in Table 2.1 resemble a slot machine. This is a goodanalogy because it is easy to imagine a slot machine with a wheel for eachsemester. The possible student outcomes used by the tracking model areplaced in sequence on each wheel. The values of each wheel click into placeas the sequence steps are processed. Table 2.1 indicates that a student in thecohort with student ID 111111 was enrolled or persisted in SP05 and FA06but was not enrolled or unknown in FA05, SP06, and SP07.
Step 2B: Determine Stop Outs. Step 2B determines if an unknown isreally a stop out, a student who was not enrolled in the semester understudy but did reenroll in a future semester. Logical if-then statements areagain used to establish this value for each student in the cohort. Looking atTable 2.1, we see that the value for variable FA06 is persist. So although stu-dent 111111 did not persist in either FA05 or SP06, the values for the vari-ables need to be changed from unknown to stop out. The logic is this: ifFA06 equals persist and FA05 equals unknown, then FA05 equals stop out,and if FA06 equals persist and SP06 equals unknown, then SP06 equals stopout. Although the coding may seem tedious, it can be done very quickly andefficiently by copying and using search and replace. The coding logic usedto create the other outcome values is very similar. Table 2.1 shows thechanges to the slot machine resulting from this recoding.
At this point, it is useful to mention that the order in which changesare made in the slot machine matters because some outcomes are consid-
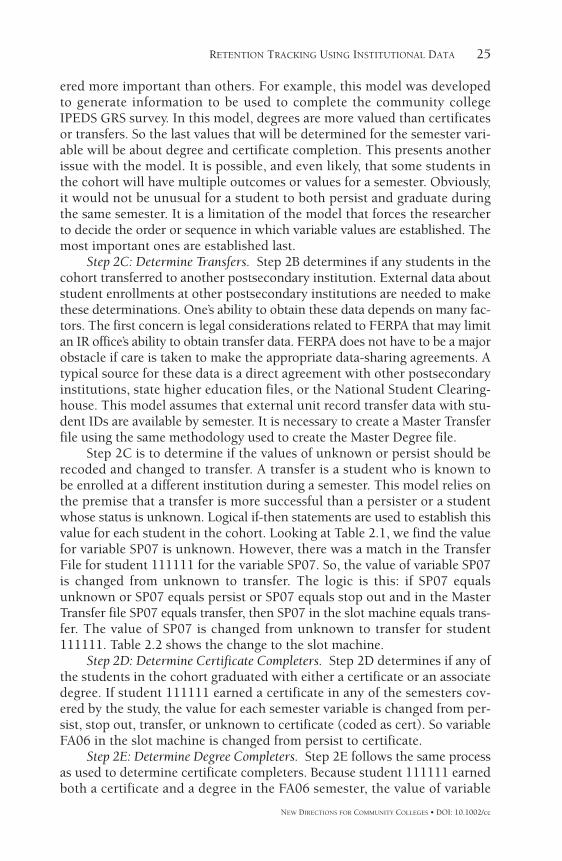
25RETENTION TRACKING USING INSTITUTIONAL DATA
NEW DIRECTIONS FOR COMMUNITY COLLEGES • DOI: 10.1002/cc
ered more important than others. For example, this model was developedto generate information to be used to complete the community collegeIPEDS GRS survey. In this model, degrees are more valued than certificatesor transfers. So the last values that will be determined for the semester vari-able will be about degree and certificate completion. This presents anotherissue with the model. It is possible, and even likely, that some students inthe cohort will have multiple outcomes or values for a semester. Obviously,it would not be unusual for a student to both persist and graduate duringthe same semester. It is a limitation of the model that forces the researcherto decide the order or sequence in which variable values are established. Themost important ones are established last.
Step 2C: Determine Transfers. Step 2B determines if any students in thecohort transferred to another postsecondary institution. External data aboutstudent enrollments at other postsecondary institutions are needed to makethese determinations. One’s ability to obtain these data depends on many fac-tors. The first concern is legal considerations related to FERPA that may limitan IR office’s ability to obtain transfer data. FERPA does not have to be a majorobstacle if care is taken to make the appropriate data-sharing agreements. Atypical source for these data is a direct agreement with other postsecondaryinstitutions, state higher education files, or the National Student Clearing-house. This model assumes that external unit record transfer data with stu-dent IDs are available by semester. It is necessary to create a Master Transferfile using the same methodology used to create the Master Degree file.
Step 2C is to determine if the values of unknown or persist should berecoded and changed to transfer. A transfer is a student who is known to be enrolled at a different institution during a semester. This model relies onthe premise that a transfer is more successful than a persister or a studentwhose status is unknown. Logical if-then statements are used to establish thisvalue for each student in the cohort. Looking at Table 2.1, we find the valuefor variable SP07 is unknown. However, there was a match in the TransferFile for student 111111 for the variable SP07. So, the value of variable SP07is changed from unknown to transfer. The logic is this: if SP07 equalsunknown or SP07 equals persist or SP07 equals stop out and in the MasterTransfer file SP07 equals transfer, then SP07 in the slot machine equals trans-fer. The value of SP07 is changed from unknown to transfer for student111111. Table 2.2 shows the change to the slot machine.
Step 2D: Determine Certificate Completers. Step 2D determines if any ofthe students in the cohort graduated with either a certificate or an associatedegree. If student 111111 earned a certificate in any of the semesters cov-ered by the study, the value for each semester variable is changed from per-sist, stop out, transfer, or unknown to certificate (coded as cert). So variableFA06 in the slot machine is changed from persist to certificate.
Step 2E: Determine Degree Completers. Step 2E follows the same processas used to determine certificate completers. Because student 111111 earnedboth a certificate and a degree in the FA06 semester, the value of variable

26 STUDENT TRACKING IN THE COMMUNITY COLLEGE
NEW DIRECTIONS FOR COMMUNITY COLLEGES • DOI: 10.1002/cc
SP07
Table 2.2. Persistence and Completion
Cohort: First-Time Full-Time Degree-Seeking Students; N = 250 Frequency Percent
Persist 60 24.0Stop out 0 0Transfer 5 2.0Certificate 15 6.0Degree 20 8.0Unknown 150 60.0Total 250 100.0
FA06 is changed from cert to degree. This is done because the researcher hasused a trumping rule that considers earning a degree to be more importantthan earning a certificate. Here is the final logic: if FA06 equals unknown orFA06 equals persist or FA06 equals stop out or FA06 equals transfer or FA06equals cert and in the Master Degree file FA06 equals degree, then FA06 equalsdegree. The value of FA06 is changed because FA06 equaled certificate for stu-dent 111111. Table 2.3 shows the change to the slot machine.
Step Three: Analyze the Data. The basic pieces of the student track-ing model are in place. For each student in the cohort, we know the stu-dent’s behavior in each semester: persistence, stop out, transfer, earned acertificate, earned a degree, or unknown. The researcher next must analyzethe results for the model. This is done by counting the number of studentswith each value in each of the semester variables SP05, FA05, SP06, FA06,and SP07. Variable SP07 is especially important because it shows the finalfrequency count for each value (persist, stop out, transfer, certificate, degree,and unknown). The total frequency count for the values of the cohort foreach semester (variable) must be equal to the total count in the study cohort.
Table 2.2 gives an example of this frequency distribution. The researcherwill notice problems with this analysis. First, the frequency count for the stopout value is 0. This is because of the logic used to create the value. It is knownthat these students returned because we have the student’s enrollment infor-mation for subsequent semesters. There is no subsequent semester to SP07in this model because it is the last year for which we have semester data files.The final semester in the study will always show a stop out count of 0. Thesestudents are best understood by looking at earlier semesters in the study.
Another problem is that the model does not fully report the swirl effectsof students who may transfer and return, earn a certificate and a degree, orearn a degree and then return to college to take more classes. The modeldeals with these conditions by creating additional values. The complexityof the logical if-then statements increases as more outcome variable valuesare added to the model. These values are sequenced in the order in which

Tab
le 2
.3.
Per
sist
ence
an
d C
omp
leti
on b
y Sem
este
r
FA
04SP
05F
A05
SP06
FA
06SP
07
Deg
ree
00%
00%
73%
73%
208%
Cer
tifi
cate
00%
31%
21%
00%
156%
Per
sist
ed25
010
0%16
666
%11
546
%94
38%
7731
%60
24%
Stop
ou
t28
11%
3012
%17
7%10
4%0
0%T
ran
sfer
10%
73%
10%
104%
52%
Un
know
n55
22%
9538
%12
650
%14
056
%15
060
%
Not
en
roll
ed, c
ompl
eted
deg
ree
00%
00%
00%
52%
00%
Not
en
roll
ed, c
ompl
eted
cer
tifi
cate
00%
00%
10%
00%
00%
En
roll
ed a
fter
com
plet
ion
00%
00%
21%
00%
00%
Ear
ned
deg
ree
afte
r ce
rtif
icat
e0
0%0
0%0
0%1
0%0
0%E
arn
ed a
ddit
ion
al c
erti
fica
te0
0%0
0%0
0%0
0%0
0%E
arn
ed a
ddit
ion
al d
egre
e0
0%0
0%0
0%0
0%0
0%T
otal
stu
den
ts in
coh
ort
250
250
250
250
250
250
Cu
mu
lati
ve d
egre
es0
0%0
0%7
3%14
6%34
14%
Cu
mu
lati
ve c
erti
fica
tes
00%
31%
52%
52%
208%
Tot
al u
niq
ue
com
plet
ers
00%
31%
125%
198%
5422
%
Sum
mar
y fo
r m
odel
FA
04SP
05F
A05
SP06
FA
06SP
07C
ompl
eter
0%1%
5%8%
22%
Per
sist
ed10
0%66
%46
%38
%31
%24
%St
op o
ut
11%
12%
7%4%
0%T
ran
sfer
0%3%
0%4%
2%U
nkn
own
22%
38%
50%
56%
60%

28 STUDENT TRACKING IN THE COMMUNITY COLLEGE
NEW DIRECTIONS FOR COMMUNITY COLLEGES • DOI: 10.1002/cc
they appear in the model. The value FinDeg is processed first. I have givenan illustration of how the value is shown in Table 2.3, which summarizesmodel results for the FA04 cohort.
Value FinDeg counts the number of students who completed or finisheda degree and did not enroll again; it appears in the table as not enrolled, com-pleted degree. Value FinCert counts the number of students who completedor finished a certificate and did not enroll again; it appears in the table as notenrolled, completed certificate. Value Back counts the number of students whocame back to college after completing a certificate or degree; it appears inthe table as back. Value 1st Deg counts the number of students who areawarded their first degree after they were awarded a certificate; it appears inthe table as earned degree after certificate. Value X Cert counts the numberof students who earned a second certificate; it appears in the table as earnedadditional certificate. Value X Deg counts the number of students who earneda second degree; it appears in the table as earned additional degree.
There is another, larger problem with the SP07 frequency distributionin Table 2.3 that the researcher must solve. The table shows the number ofcertificates and degrees as fifteen and twenty. However, these are just thecounts for SP07 and do not include students who may have earned a degreeor certificate in an earlier semester, or students who were awarded morethan one certificate or degree during the semesters in the study. One easyway to solve this problem is to use a spreadsheet to analyze the data andcalculate a cumulative count of completers in the study cohort. Thisprocess could be automated using SAS or SPSS; transferring the modelresults from SAS or SPSS output to a spreadsheet takes little time and givesthe researcher an opportunity to better understand the numbers and inter-pret the results.
Step Four: Use a Spreadsheet to Calculate Total Completers. Start bycreating a new value called completer. A completer is a student who earnsa certificate or degree. Begin by determining when the student was awarded acertificate and then determine when the student was awarded a degree. Thegoal is to find the total number of students who first completed for each semes-ter by summing the count for first degree or first certificate. By developing acompleter value that accumulates the number of first certificates and degrees,it is possible to show the model’s most important completion outcomes results.
Step Five: Show the Results. In addition to presenting results in tables,stacked column charts are especially useful to illustrate the results for subsetsof the cohort. Results can be put into a spreadsheet to produce charts or trans-ferred to PowerPoint. In that application, toggling between charts can empha-size differences between subgroups. Figures 2.1 and 2.2 show model resultsfor students new to the college in fall 2004 who did and did not pass devel-opmental English. The differences are immediately evident; note especiallythe increased percentage of persisters for members of the cohort who passeddevelopmental English compared to those who did not, and the correspond-ing reduction in the percentage of students in the “unknown” category.

29RETENTION TRACKING USING INSTITUTIONAL DATA
NEW DIRECTIONS FOR COMMUNITY COLLEGES • DOI: 10.1002/cc
Figure 2.1. New Students, Fall 2004, Passed Developmental English
Note: N taking course = 1,140; N passing course = 900.
Figure 2.2. New Students, Fall 2004, Did Not PassDevelopmental English
Note: N taking course = 1,140; N not passing course = 240.
The Student Tracking Model Can Evolve
The student tracking model can become very complex if the researcher hasavailable historical data and adds additional values to the model. Such amodel may be needed to adequately explain quite complex student behav-ior. For example, researchers may find it useful to refine the transfer data to

30 STUDENT TRACKING IN THE COMMUNITY COLLEGE
NEW DIRECTIONS FOR COMMUNITY COLLEGES • DOI: 10.1002/cc
identify the institutions to which a large number of students transfer and todepict students who earn a degree after transfer. Other values that might beadded to the model are the number of times a student transfers to anothercollege and whether the student returns to the home college after transfer-ring. The research could also examine majors and degrees earned at trans-fer institutions, if data are available.
A Student Tracking Model is a useful tool for institutional offices. Itallows the researcher to select a student cohort to study on the basis of stu-dent attributes or performance. The cohort can be tracked over time andoutcomes charted to produce a picture of student success. It takes time tocreate a Student Tracking Model, but the results it produces will be wellworth the effort.
FRED LILLIBRIDGE is the campus institutional effectiveness and planning officerat Doña Ana Community College in Las Cruces, New Mexico.