Embed Size (px)
Citation preview
7/22/2019 Retail Trade in McAllen, TX
http://slidepdf.com/reader/full/retail-trade-in-mcallen-tx 1/18
Retail Trade
McAllen is the retail center of South Texas and Northern Mexico, drawing from a consumer base of over 10 million people within a 200-mileradius.In the bi-national metropolitan area, McAllen retailers serve a market population of 1.8 million. McAllen is represented by 40 of America’s top100 retailers and is ranked 3rd in Texas in per capita sales tax receipts.
La Plaza remains one of the Simon Properties highest grossing retail malls (per square foot) in the United States, boasting average sales of over$650 per square foot. Many national retailers located there are among the most profitable stores in their chains. The mall is known to generatemore than 18 million visitors annually.
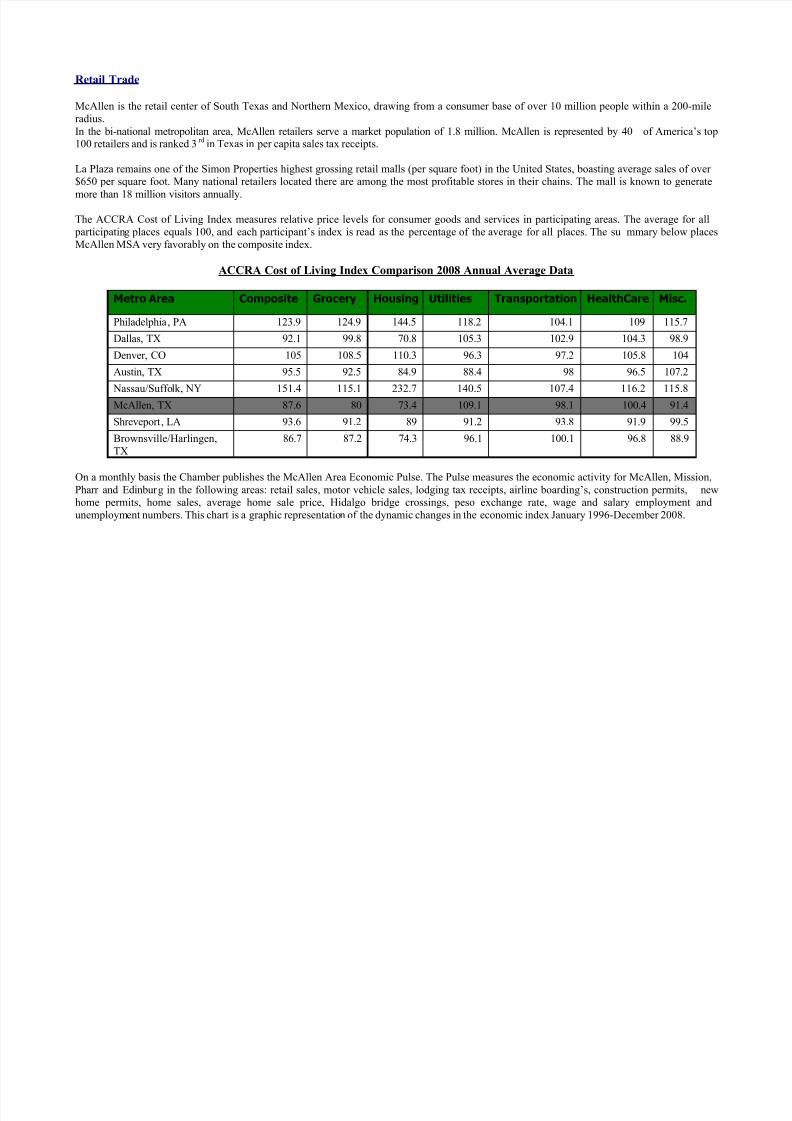
The ACCRA Cost of Living Index measures relative price levels for consumer goods and services in participating areas. The average for all participating places equals 100, and each participant’s index is read as the percentage of the average for all places. The summary below placesMcAllen MSA very favorably on the composite index.
ACCRA Cost of Living Index Comparison 2008 Annual Average Data
Metro Area Composite Grocery Housing Utilities Transportation HealthCare Misc.
Philadelphia, PA 123.9 124.9 144.5 118.2 104.1 109 115.7
Dallas, TX 92.1 99.8 70.8 105.3 102.9 104.3 98.9
Denver, CO 105 108.5 110.3 96.3 97.2 105.8 104
Austin, TX 95.5 92.5 84.9 88.4 98 96.5 107.2
Nassau/Suffolk, NY 151.4 115.1 232.7 140.5 107.4 116.2 115.8
McAllen, TX 87.6 80 73.4 109.1 98.1 100.4 91.4
Shreveport, LA 93.6 91.2 89 91.2 93.8 91.9 99.5
Brownsville/Harlingen,TX
86.7 87.2 74.3 96.1 100.1 96.8 88.9
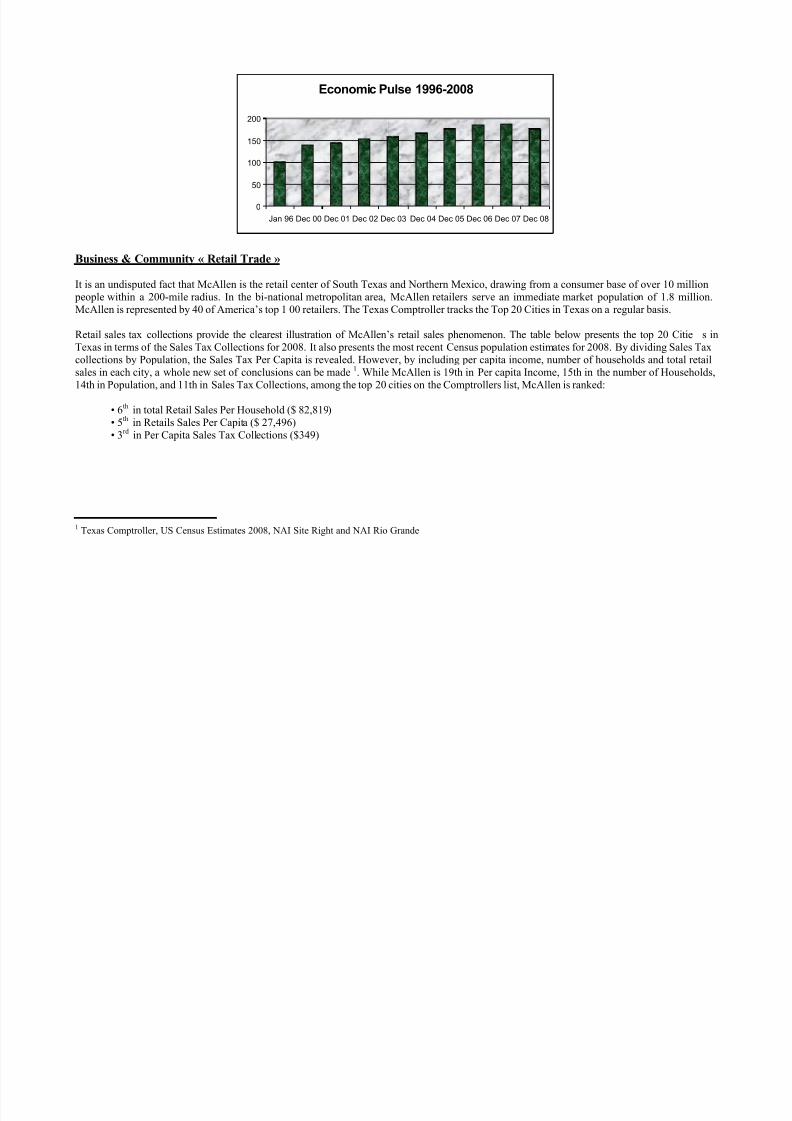
On a monthly basis the Chamber publishes the McAllen Area Economic Pulse. The Pulse measures the economic activity for McAllen, Mission,Pharr and Edinbur g in the following areas: retail sales, motor vehicle sales, lodging tax receipts, airline boarding’s, construction permits, newhome permits, home sales, average home sale price, Hidalgo bridge crossings, peso exchange rate, wage and salary employment andunemployment numbers. This chart is a graphic representation of the dynamic changes in the economic index January 1996-December 2008.
7/22/2019 Retail Trade in McAllen, TX
http://slidepdf.com/reader/full/retail-trade-in-mcallen-tx 2/18
Business & Community « Retail Trade »
It is an undisputed fact that McAllen is the retail center of South Texas and Northern Mexico, drawing from a consumer base of over 10 million people within a 200-mile radius. In the bi-national metropolitan area, McAllen retailers serve an immediate market population of 1.8 million.McAllen is represented by 40 of America’s top 100 retailers. The Texas Comptroller tracks the Top 20 Cities in Texas on a regular basis.
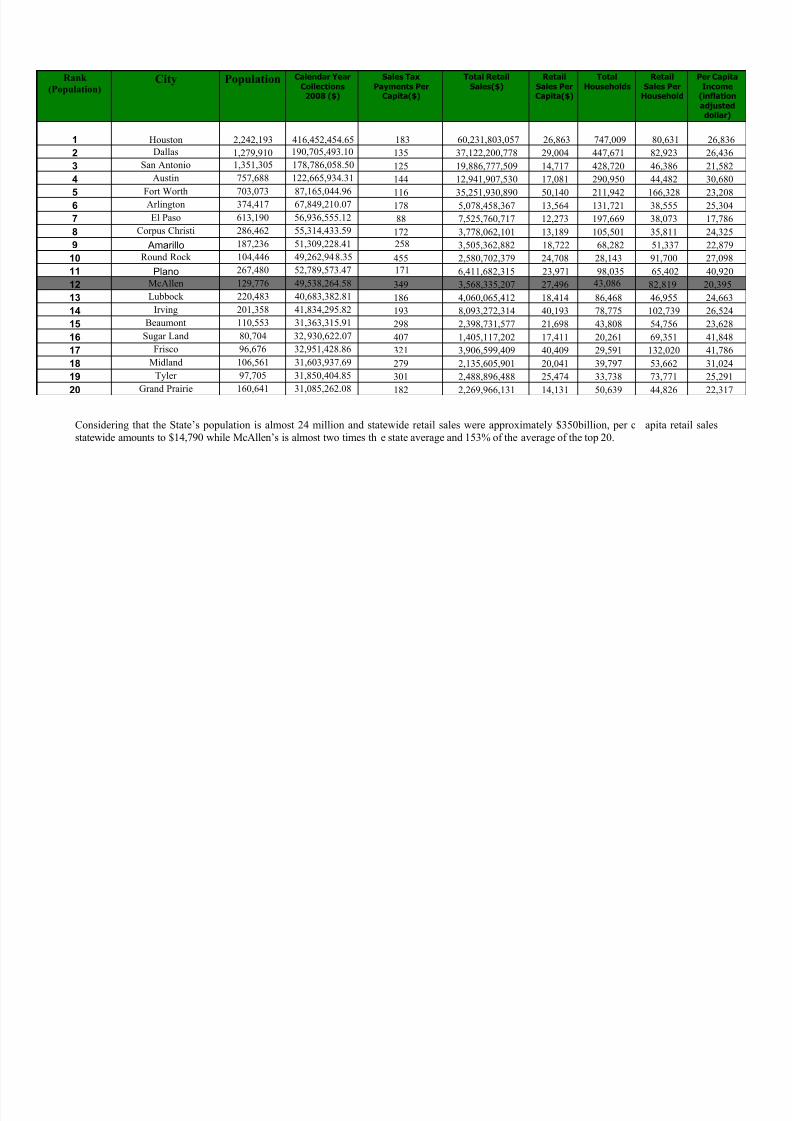
Retail sales tax collections provide the clearest illustration of McAllen’s retail sales phenomenon. The table below presents the top 20 Citie s inTexas in terms of the Sales Tax Collections for 2008. It also presents the most recent Census population estimates for 2008. By dividing Sales Taxcollections by Population, the Sales Tax Per Capita is revealed. However, by including per capita income, number of households and total retailsales in each city, a whole new set of conclusions can be made1. While McAllen is 19th in Per capita Income, 15th in the number of Households,14th in Population, and 11th in Sales Tax Collections, among the top 20 cities on the Comptrollers list, McAllen is ranked:
• 6
th
in total Retail Sales Per Household ($ 82,819)• 5th in Retails Sales Per Capita ($ 27,496)• 3rd in Per Capita Sales Tax Collections ($349)
1 Texas Comptroller, US Census Estimates 2008, NAI Site Right and NAI Rio Grande
Economic Pulse 1996-2008
0
50
100
150
200
Jan 96 Dec 00 Dec 01 Dec 02 Dec 03 Dec 04 Dec 05 Dec 06 Dec 07 Dec 08
7/22/2019 Retail Trade in McAllen, TX
http://slidepdf.com/reader/full/retail-trade-in-mcallen-tx 3/18
Rank
(Population)City Population Calendar Year
Collections2008 ($)
Sales TaxPayments Per
Capita($)
Total RetailSales($)
RetailSales PerCapita($)
TotalHouseholds
RetailSales Per
Household
Per CapitaIncome
(inflationadjusteddollar)
1 Houston 2,242,193 416,452,454.65 183 60,231,803,057 26,863 747,009 80,631 26,8362 Dallas 1,279,910 190,705,493.10 135 37,122,200,778 29,004 447,671 82,923 26,436
3 San Antonio 1,351,305 178,786,058.50 125 19,886,777,509 14,717 428,720 46,386 21,582
4 Austin 757,688 122,665,934.31 144 12,941,907,530 17,081 290,950 44,482 30,680
5 Fort Worth 703,073 87,165,044.96 116 35,251,930,890 50,140 211,942 166,328 23,208
6 Arlington 374,417 67,849,210.07 178 5,078,458,367 13,564 131,721 38,555 25,304
7 El Paso 613,190 56,936,555.12 88 7,525,760,717 12,273 197,669 38,073 17,786
8 Corpus Christi 286,462 55,314,433.59 172 3,778,062,101 13,189 105,501 35,811 24,325
9 Amarillo 187,236 51,309,228.41 258 3,505,362,882 18,722 68,282 51,337 22,879
10 Round Rock 104,446 49,262,948.35 455 2,580,702,379 24,708 28,143 91,700 27,098
11 Plano 267,480 52,789,573.47 1716,411,682,315 23,971 98,035 65,402 40,920
12 McAllen 129,776 49,538,264.58 349 3,568,335,207 27,496 43,086 82,819 20,395
13 Lubbock 220,483 40,683,382.81 186 4,060,065,412 18,414 86,468 46,955 24,663
14 Irving 201,358 41,834,295.82 193 8,093,272,314 40,193 78,775 102,739 26,524
15 Beaumont 110,553 31,363,315.91 298 2,398,731,577 21,698 43,808 54,756 23,628
16 Sugar Land 80,704 32,930,622.07 407 1,405,117,202 17,411 20,261 69,351 41,848
17 Frisco 96,676 32,951,428.86 321 3,906,599,409 40,409 29,591 132,020 41,786
18 Midland 106,561 31,603,937.69 279 2,135,605,901 20,041 39,797 53,662 31,024
19 Tyler 97,705 31,850,404.85 301 2,488,896,488 25,474 33,738 73,771 25,291
20 Grand Prairie 160,641 31,085,262.08 182 2,269,966,131 14,131 50,639 44,826 22,317
Considering that the State’s population is almost 24 million and statewide retail sales were approximately $350billion, per c apita retail salesstatewide amounts to $14,790 while McAllen’s is almost two times the state average and 153% of the average of the top 20.
7/22/2019 Retail Trade in McAllen, TX
http://slidepdf.com/reader/full/retail-trade-in-mcallen-tx 4/18
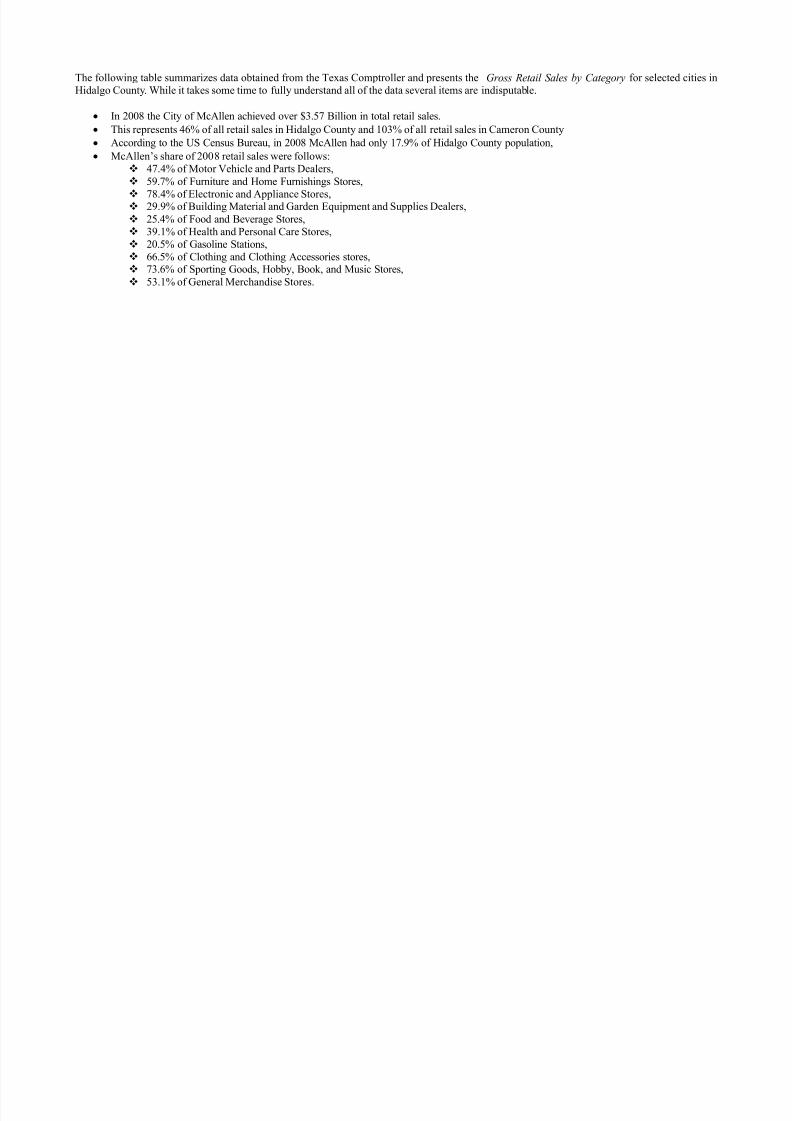
The following table summarizes data obtained from the Texas Comptroller and presents the Gross Retail Sales by Category for selected cities inHidalgo County. While it takes some time to fully understand all of the data several items are indisputable.
In 2008 the City of McAllen achieved over $3.57 Billion in total retail sales.
This represents 46% of all retail sales in Hidalgo County and 103% of all retail sales in Cameron County
According to the US Census Bureau, in 2008 McAllen had only 17.9% of Hidalgo County population,
McAllen’s share of 2008 retail sales were follows: 47.4% of Motor Vehicle and Parts Dealers, 59.7% of Furniture and Home Furnishings Stores, 78.4% of Electronic and Appliance Stores, 29.9% of Building Material and Garden Equipment and Supplies Dealers,
25.4% of Food and Beverage Stores, 39.1% of Health and Personal Care Stores, 20.5% of Gasoline Stations, 66.5% of Clothing and Clothing Accessories stores, 73.6% of Sporting Goods, Hobby, Book, and Music Stores,
53.1% of General Merchandise Stores.
7/22/2019 Retail Trade in McAllen, TX
http://slidepdf.com/reader/full/retail-trade-in-mcallen-tx 5/18
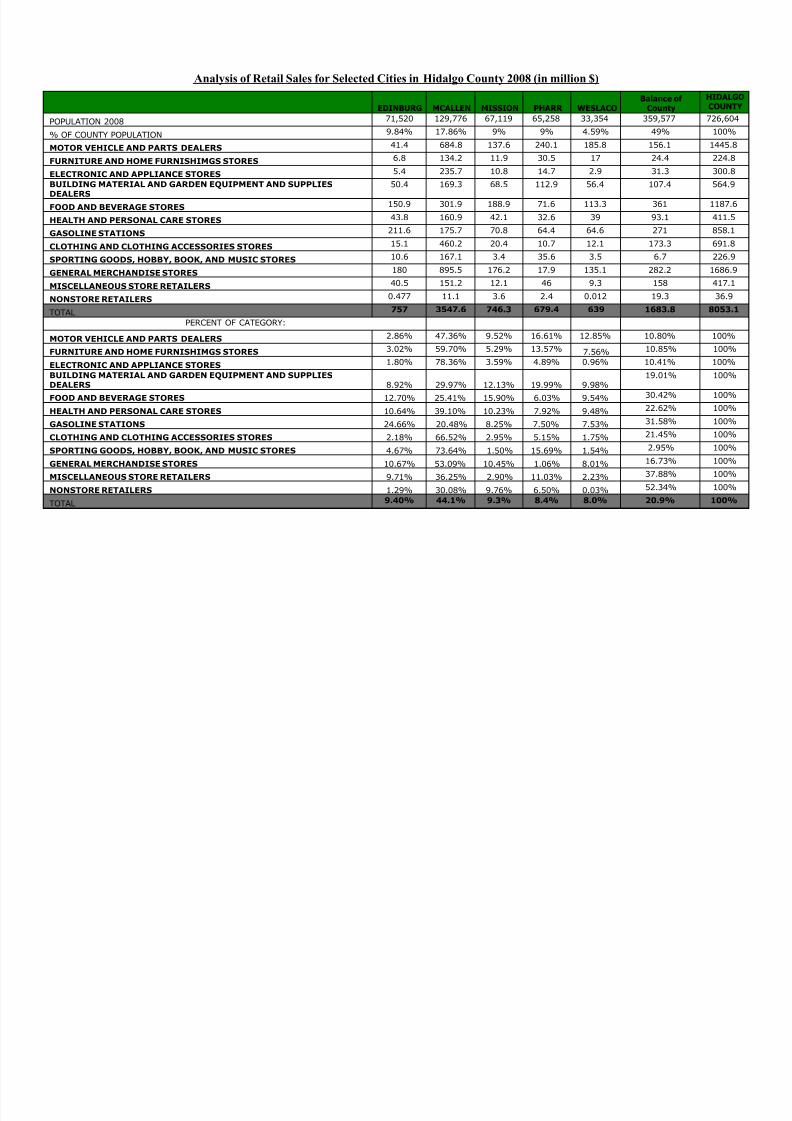
Analysis of Retail Sales for Selected Cities in Hidalgo County 2008 (in million $)
EDINBURG MCALLEN MISSION PHARR WESLACOBalance of
County
HIDALGOCOUNTY
POPULATION 2008 71,520 129,776 67,119 65,258 33,354 359,577 726,604
% OF COUNTY POPULATION
9.84% 17.86% 9% 9% 4.59% 49% 100%
MOTOR VEHICLE AND PARTS DEALERS 41.4 684.8 137.6 240.1 185.8 156.1 1445.8
FURNITURE AND HOME FURNISHIMGS STORES 6.8 134.2 11.9 30.5 17 24.4 224.8
ELECTRONIC AND APPLIANCE STORES 5.4 235.7 10.8 14.7 2.9 31.3 300.8
BUILDING MATERIAL AND GARDEN EQUIPMENT AND SUPPLIES
DEALERS50.4 169.3 68.5 112.9 56.4 107.4 564.9
FOOD AND BEVERAGE STORES 150.9 301.9 188.9 71.6 113.3 361 1187.6
HEALTH AND PERSONAL CARE STORES 43.8 160.9 42.1 32.6 39 93.1 411.5
GASOLINE STATIONS 211.6 175.7 70.8 64.4 64.6 271 858.1
CLOTHING AND CLOTHING ACCESSORIES STORES 15.1 460.2 20.4 10.7 12.1 173.3 691.8
SPORTING GOODS, HOBBY, BOOK, AND MUSIC STORES 10.6 167.1 3.4 35.6 3.5 6.7 226.9
GENERAL MERCHANDISE STORES180 895.5 176.2 17.9 135.1 282.2 1686.9
MISCELLANEOUS STORE RETAILERS 40.5 151.2 12.1 46 9.3 158 417.1
NONSTORE RETAILERS 0.477 11.1 3.6 2.4 0.012 19.3 36.9
TOTAL 757 3547.6 746.3 679.4 639 1683.8 8053.1
PERCENT OF CATEGORY:
MOTOR VEHICLE AND PARTS DEALERS 2.86% 47.36% 9.52% 16.61% 12.85% 10.80% 100%
FURNITURE AND HOME FURNISHIMGS STORES 3.02% 59.70% 5.29% 13.57% 7.56% 10.85% 100%
ELECTRONIC AND APPLIANCE STORES 1.80% 78.36% 3.59% 4.89% 0.96% 10.41% 100%
BUILDING MATERIAL AND GARDEN EQUIPMENT AND SUPPLIES
DEALERS 8.92% 29.97% 12.13% 19.99% 9.98%
19.01% 100%
FOOD AND BEVERAGE STORES 12.70% 25.41% 15.90% 6.03% 9.54% 30.42% 100%
HEALTH AND PERSONAL CARE STORES 10.64% 39.10% 10.23% 7.92% 9.48%
22.62% 100%
GASOLINE STATIONS 24.66% 20.48% 8.25% 7.50% 7.53% 31.58% 100%
CLOTHING AND CLOTHING ACCESSORIES STORES 2.18% 66.52% 2.95% 5.15% 1.75% 21.45% 100%
SPORTING GOODS, HOBBY, BOOK, AND MUSIC STORES 4.67% 73.64% 1.50% 15.69% 1.54% 2.95% 100%
GENERAL MERCHANDISE STORES 10.67% 53.09% 10.45% 1.06% 8.01% 16.73% 100%
MISCELLANEOUS STORE RETAILERS 9.71% 36.25% 2.90% 11.03% 2.23% 37.88% 100%
NONSTORE RETAILERS 1.29% 30.08% 9.76% 6.50% 0.03% 52.34% 100%
TOTAL 9.40% 44.1% 9.3% 8.4% 8.0% 20.9% 100%
7/22/2019 Retail Trade in McAllen, TX
http://slidepdf.com/reader/full/retail-trade-in-mcallen-tx 6/18
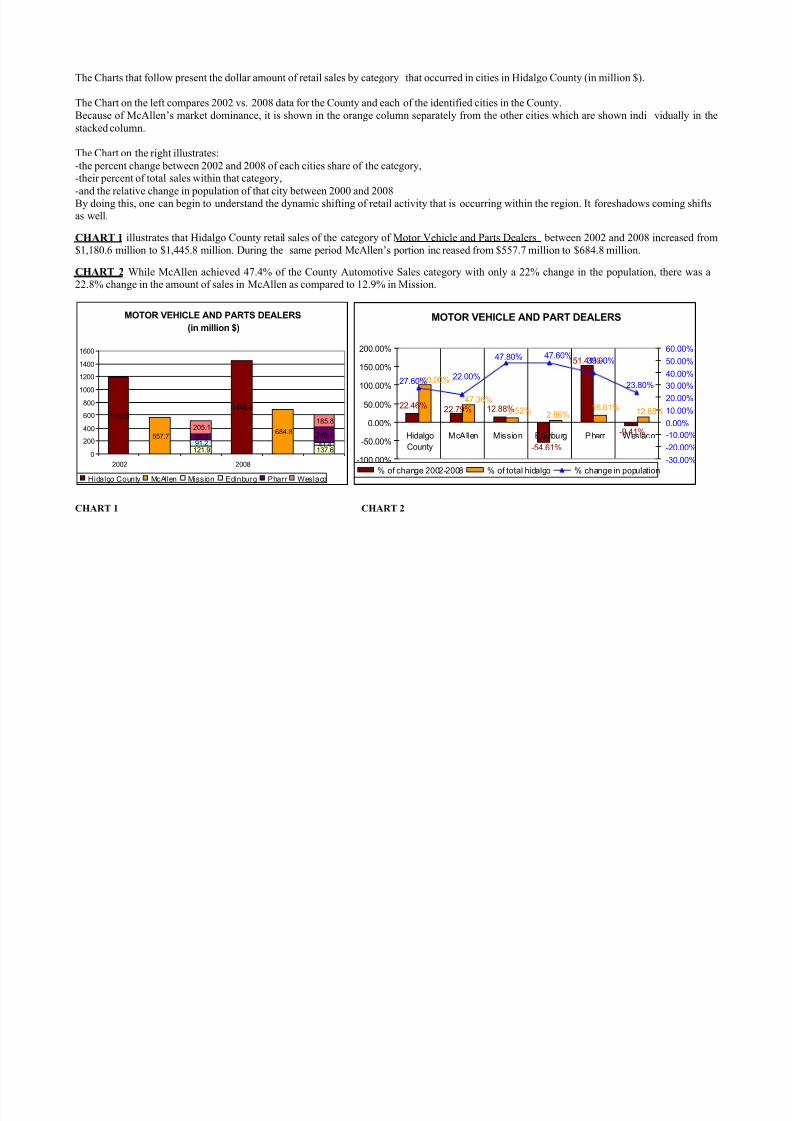
The Charts that follow present the dollar amount of retail sales by category that occurred in cities in Hidalgo County (in million $).
The Chart on the left compares 2002 vs. 2008 data for the County and each of the identified cities in the County.Because of McAllen’s market dominance, it is shown in the orange column separately from the other cities which are shown indi vidually in thestacked column.
The Chart on the right illustrates:-the percent change between 2002 and 2008 of each cities share of the category,-their percent of total sales within that category,-and the relative change in population of that city between 2000 and 2008By doing this, one can begin to understand the dynamic shifting of retail activity that is occurring within the region. It foreshadows coming shiftsas well.
CHART 1 illustrates that Hidalgo County retail sales of the category of Motor Vehicle and Parts Dealers between 2002 and 2008 increased from$1,180.6 million to $1,445.8 million. During the same period McAllen’s portion increased from $557.7 million to $684.8 million.
CHART 2 While McAllen achieved 47.4% of the County Automotive Sales category with only a 22% change in the population, there was a22.8% change in the amount of sales in McAllen as compared to 12.9% in Mission.
CHART 1 CHART 2
MOTOR VEHICLE AND PARTS DEALERS
(in million $)
1180.6
1445.8
557.7 684.8
121.9 137.691.2 41.495.5 240.1205.1
185.8
0
200
400
600
800
1000
1200
1400
1600
2002 2008
Hidalgo County McAllen Mission Edinburg Pharr Weslaco
MOTOR VEHICLE AND PART DEALERS
12.88%
151.41%
22.46% 22.79%
-9.41%
-54.61%
47.36%16.61%
2.86%
100.00%
12.85%9.52%
27.60% 22.00%
47.80% 47.60%39.90%
23.80%
-100.00%
-50.00%
0.00%
50.00%
100.00%
150.00%
200.00%
Hidalgo
County
McAllen Mission Edinburg Pharr Weslaco
-30.00%
-20.00%
-10.00%
0.00%10.00%
20.00%
30.00%
40.00%
50.00%
60.00%
% of change 2002-2008 % of total hidalgo % change in population
7/22/2019 Retail Trade in McAllen, TX
http://slidepdf.com/reader/full/retail-trade-in-mcallen-tx 7/18
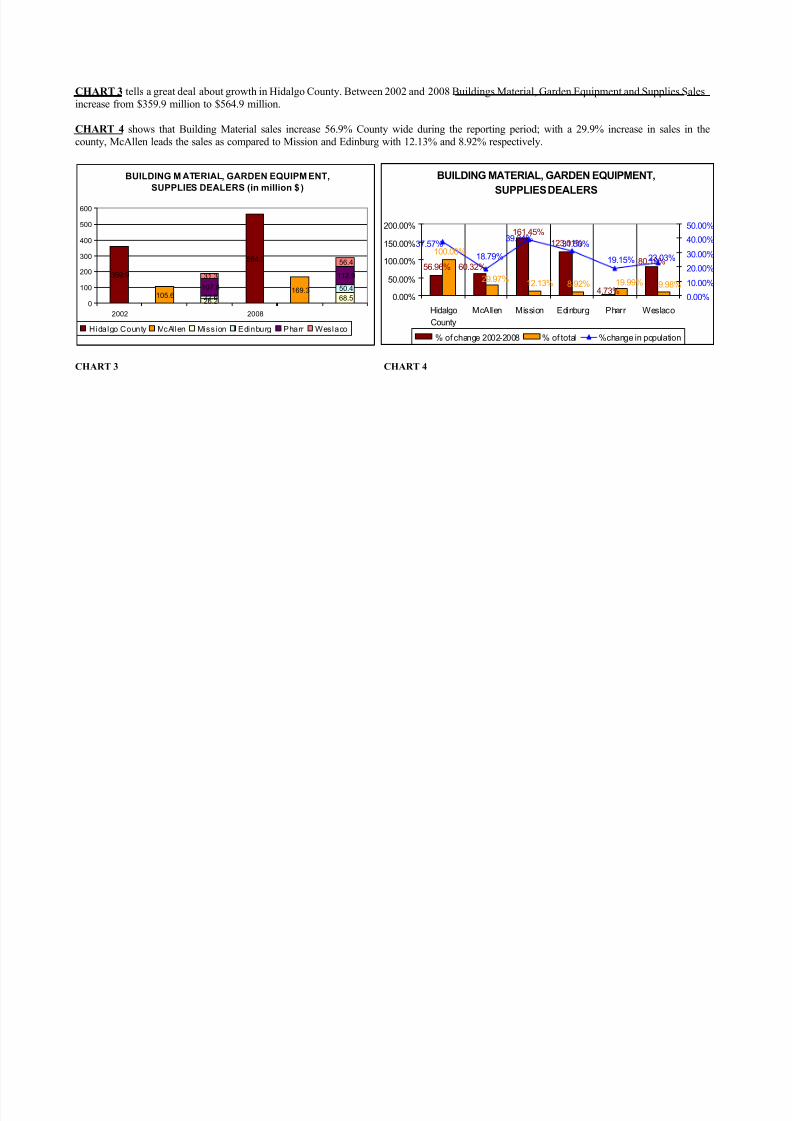
CHART 3 tells a great deal about growth in Hidalgo County. Between 2002 and 2008 Buildings Material, Garden Equipment and Supplies Salesincrease from $359.9 million to $564.9 million.
CHART 4 shows that Building Material sales increase 56.9% County wide during the reporting period; with a 29.9% increase in sales in the
county, McAllen leads the sales as compared to Mission and Edinburg with 12.13% and 8.92% respectively.
CHART 3 CHART 4
BUILDING M ATERIAL, GARDEN EQUIPM ENT,
SUPPLIES DEALERS (in million $ )
359.9
564.9
105.6 169.3
26.2 68.522.6
50.4107.8112.931.3
56.4
0
100
200
300
400
500
600
2002 2008
Hidalgo County McAllen Mission Edinburg Pharr Weslaco
BUILDING MATERIAL, GARDEN EQUIPMENT,
SUPPLIES DEALERS
56.96%
123.01%100.00%
8.92%4.73%
80.19%
161.45%
60.32%
19.99% 9.98%12.13%29.97%
23.03%19.15%
31.50%39.34%
18.79%
37.57%
0.00%
50.00%
100.00%
150.00%
200.00%
Hidalgo
County
McAllen Mission Edinburg Pharr Weslaco
0.00%
10.00%
20.00%
30.00%
40.00%
50.00%
% of change 2002-2008 % of total %change in population
7/22/2019 Retail Trade in McAllen, TX
http://slidepdf.com/reader/full/retail-trade-in-mcallen-tx 8/18
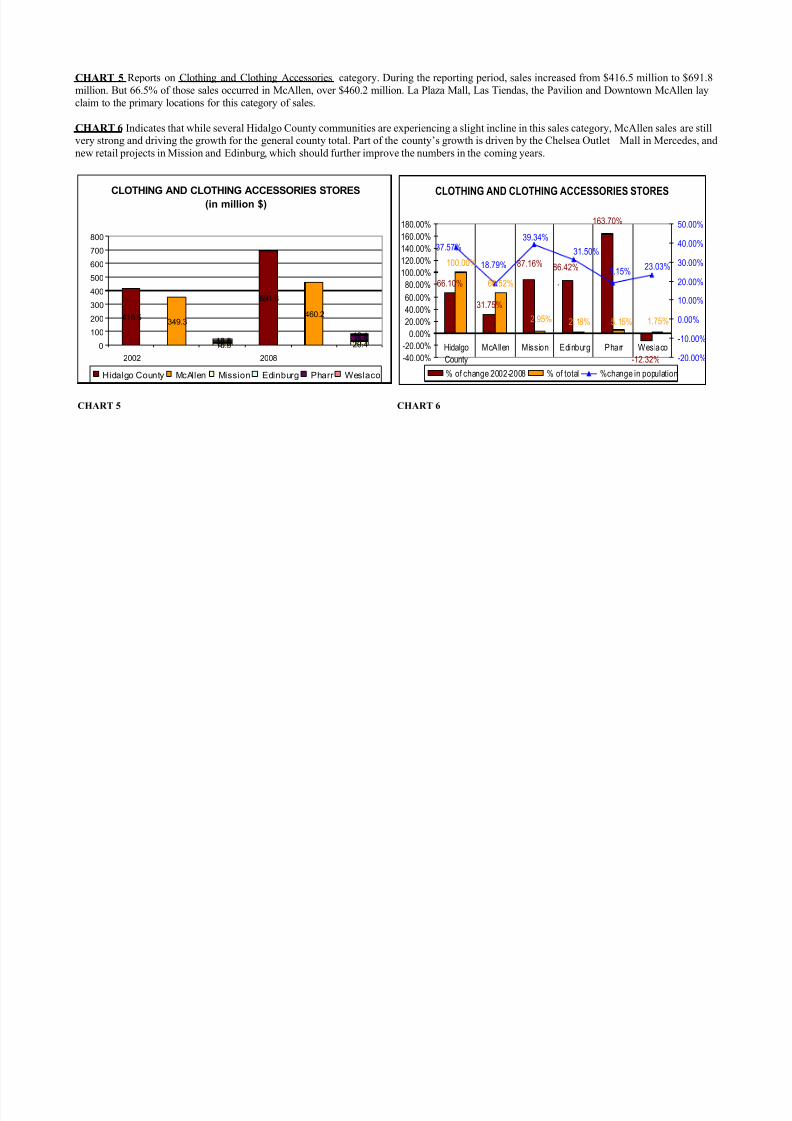
CHART 5 Reports on Clothing and Clothing Accessories category. During the reporting period, sales increased from $416.5 million to $691.8million. But 66.5% of those sales occurred in McAllen, over $460.2 million. La Plaza Mall, Las Tiendas, the Pavilion and Downtown McAllen layclaim to the primary locations for this category of sales.
CHART 6 Indicates that while several Hidalgo County communities are experiencing a slight incline in this sales category, McAllen sales are still
very strong and driving the growth for the general county total. Part of the county’s growth is driven by the Chelsea Outlet Mall in Mercedes, andnew retail projects in Mission and Edinburg, which should further improve the numbers in the coming years.
CHART 5 CHART 6
CLOTHING AND CLOTHING ACCESSORIES STORES
(in million $)
416.5
691.8
349.3460.2
10.9 20.48.1 15.113.5 35.613.8 12.1
0
100
200
300
400
500
600
700
800
2002 2008
Hidalgo County McAllen Mission Edinburg Pharr Weslaco
CLOTHING AND CLOTHING ACCESSORIES STORES
66.10%
31.75%
100.00%
66.52%
87.16% 86.42%
163.70%
-12.32%
2.95% 2.18% 5.15% 1.75%
23.03%19.15%
31.50%
39.34%
18.79%
37.57%
-40.00%
-20.00%
0.00%
20.00%
40.00%
60.00%
80.00%100.00%
120.00%
140.00%
160.00%
180.00%
Hidalgo
County
McAllen Mission Edinburg Pharr Weslaco-20.00%
-10.00%
0.00%
10.00%
20.00%
30.00%
40.00%
50.00%
% of change 2002-2008 % of total %change in population
`
7/22/2019 Retail Trade in McAllen, TX
http://slidepdf.com/reader/full/retail-trade-in-mcallen-tx 9/18
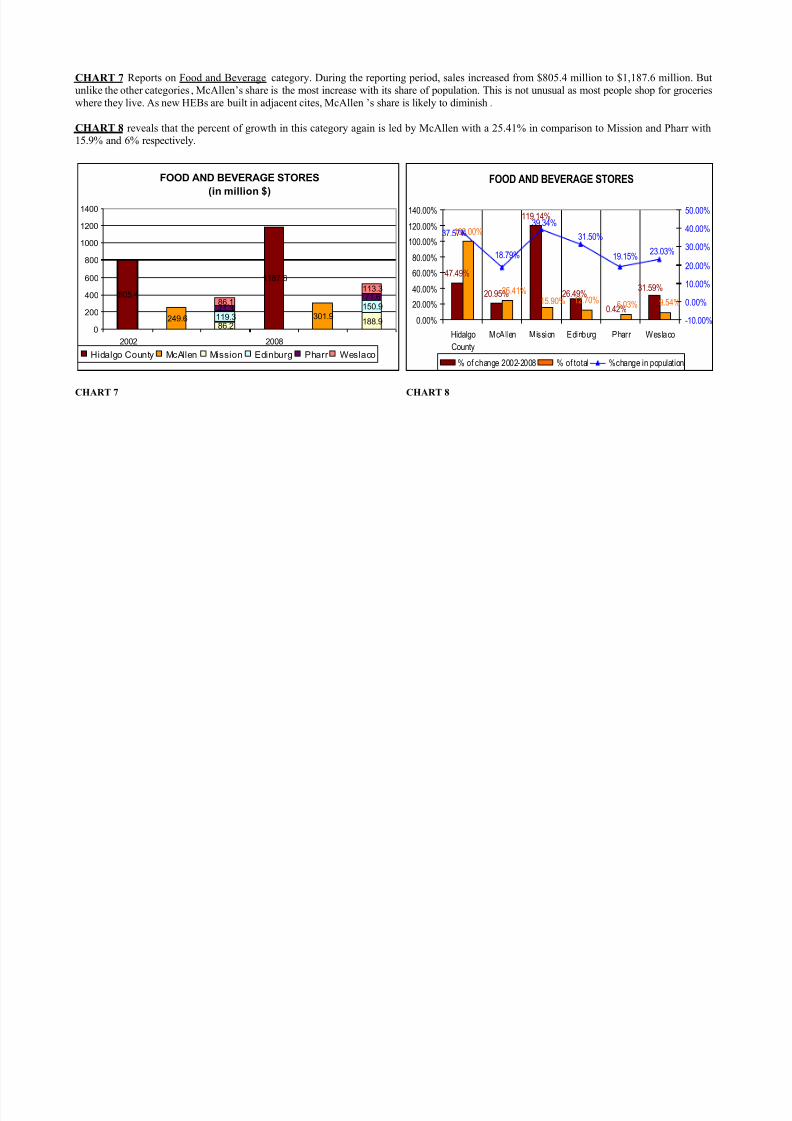
CHART 7 Reports on Food and Beverage category. During the reporting period, sales increased from $805.4 million to $1,187.6 million. Butunlike the other categories, McAllen’s share is the most increase with its share of population. This is not unusual as most people shop for grocerieswhere they live. As new HEBs are built in adjacent cites, McAllen’s share is likely to diminish.
CHART 8 reveals that the percent of growth in this category again is led by McAllen with a 25.41% in comparison to Mission and Pharr with
15.9% and 6% respectively.
CHART 7 CHART 8
FOOD AND BEVERAGE STORES
(in million $)
805.4
1187.6
249.6 301.986.2
188.9119.3
150.971.3
71.686.1
113.3
0
200
400
600
800
1000
1200
1400
2002 2008
Hidalgo County McAllen Mission Edinburg Pharr Weslaco
FOOD AND BEVERAGE STORES
47.49%
20.95%
119.14%
100.00%
12.70%
31.59%26.49%
0.42% 9.54%6.03%15.90%
25.41%
23.03%19.15%
31.50%
39.34%37.57%
18.79%
0.00%
20.00%
40.00%60.00%
80.00%
100.00%
120.00%
140.00%
Hidalgo
County
McAllen Mission Edinburg Pharr Weslaco
-10.00%
0.00%
10.00%
20.00%
30.00%
40.00%
50.00%
% of change 2002-2008 % of total %change in population
7/22/2019 Retail Trade in McAllen, TX
http://slidepdf.com/reader/full/retail-trade-in-mcallen-tx 10/18
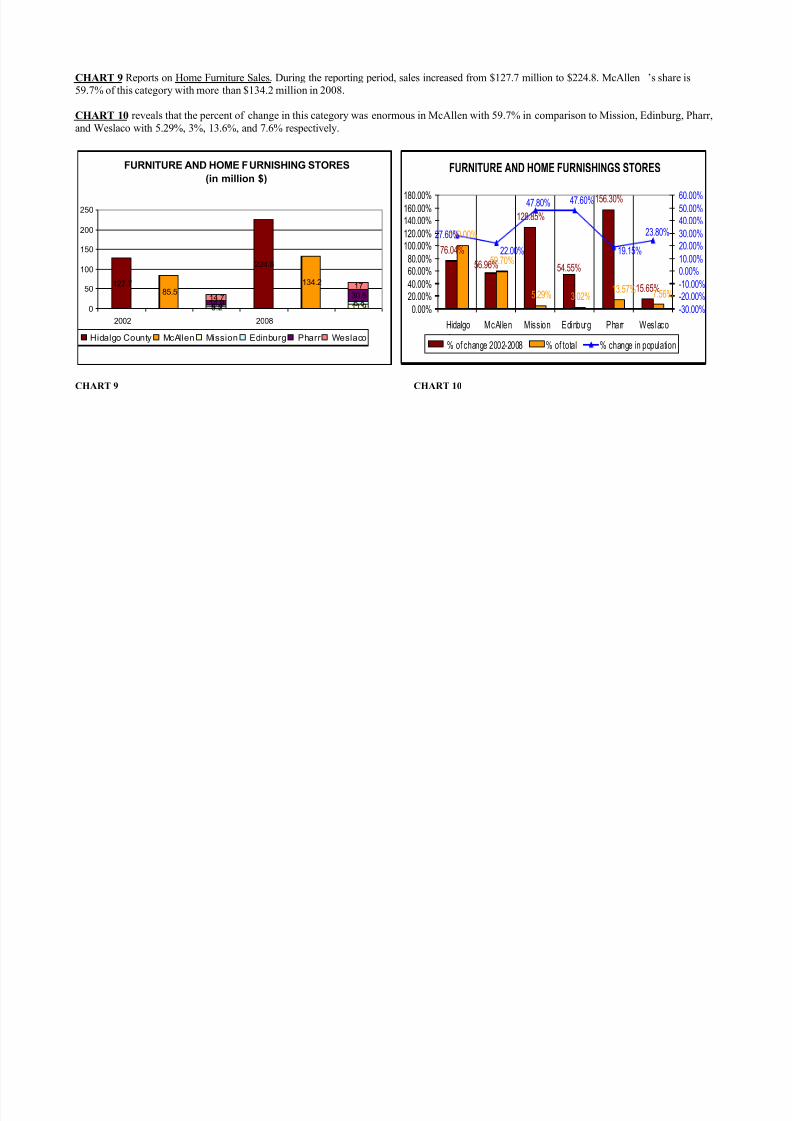
CHART 9 Reports on Home Furniture Sales. During the reporting period, sales increased from $127.7 million to $224.8. McAllen ’s share is59.7% of this category with more than $134.2 million in 2008.
CHART 10 reveals that the percent of change in this category was enormous in McAllen with 59.7% in comparison to Mission, Edinburg, Pharr,and Weslaco with 5.29%, 3%, 13.6%, and 7.6% respectively.
CHART 9 CHART 10
FURNITURE AND HOME FURNISHING STORES
(in million $)
127.7
224.8
85.5
134.2
5.2 11.94.4 6.811.930.514.7
17
0
50
100
150
200
250
2002 2008
Hidalgo County McAllen Mission Edinburg Pharr Weslaco
FURNITURE AND HOME FURNISHINGS STORES
128.85%
156.30%
15.65%
100.00%
59.70%
5.29% 3.02%
54.55%56.96%
76.04%
13.57% 7.56%
23.80%
19.15%
47.60%
22.00%
47.80%
27.60%
0.00%
20.00%40.00%
60.00%80.00%
100.00%120.00%
140.00%160.00%
180.00%
Hidalgo
County
McAllen Mission Edinburg Pharr Weslaco
-30.00%
-20.00%-10.00%
0.00%10.00%
20.00%30.00%
40.00%50.00%
60.00%
% of change 2002-2008 % of total % change in population
7/22/2019 Retail Trade in McAllen, TX
http://slidepdf.com/reader/full/retail-trade-in-mcallen-tx 11/18
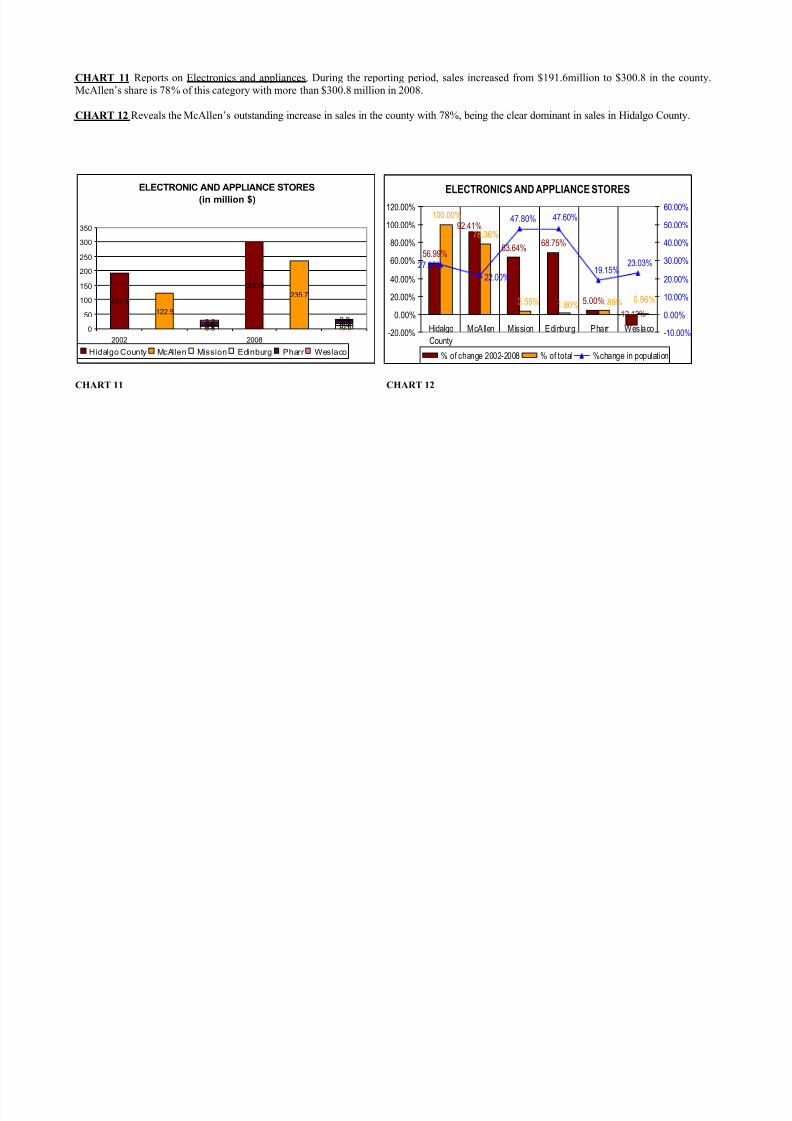
CHART 11 Reports on Electronics and appliances. During the reporting period, sales increased from $191.6million to $300.8 in the county.McAllen’s share is 78% of this category with more than $300.8 million in 2008.
CHART 12 Reveals the McAllen’s outstanding increase in sales in the county with 78%, being the clear dominant in sales in Hidalgo County.
CHART 11 CHART 12
ELECTRONIC AND APPLIANCE STORES
(in million $)
191.6
300.8
122.5
235.7
6.6 10.83.2 5.414 14.63.3 2.9
0
50
100
150
200
250
300
350
2002 2008
Hidalgo County McAllen Mission Edinburg Pharr Weslaco
ELECTRONICS AND APPLIANCE STORES
56.99% 63.64%
68.75%
5.00%
100.00%
78.36%92.41%
-12.12%
3.59% 1.80% 4.89% 0.96%
27.60%
22.00%
47.80% 47.60%
19.15%23.03%
-20.00%
0.00%
20.00%
40.00%
60.00%
80.00%
100.00%
120.00%
Hidalgo
County
McAllen Mission Edinburg Pharr Weslaco-10.00%
0.00%
10.00%
20.00%
30.00%
40.00%
50.00%
60.00%
% of change 2002-2008 % of total %change in population
7/22/2019 Retail Trade in McAllen, TX
http://slidepdf.com/reader/full/retail-trade-in-mcallen-tx 12/18
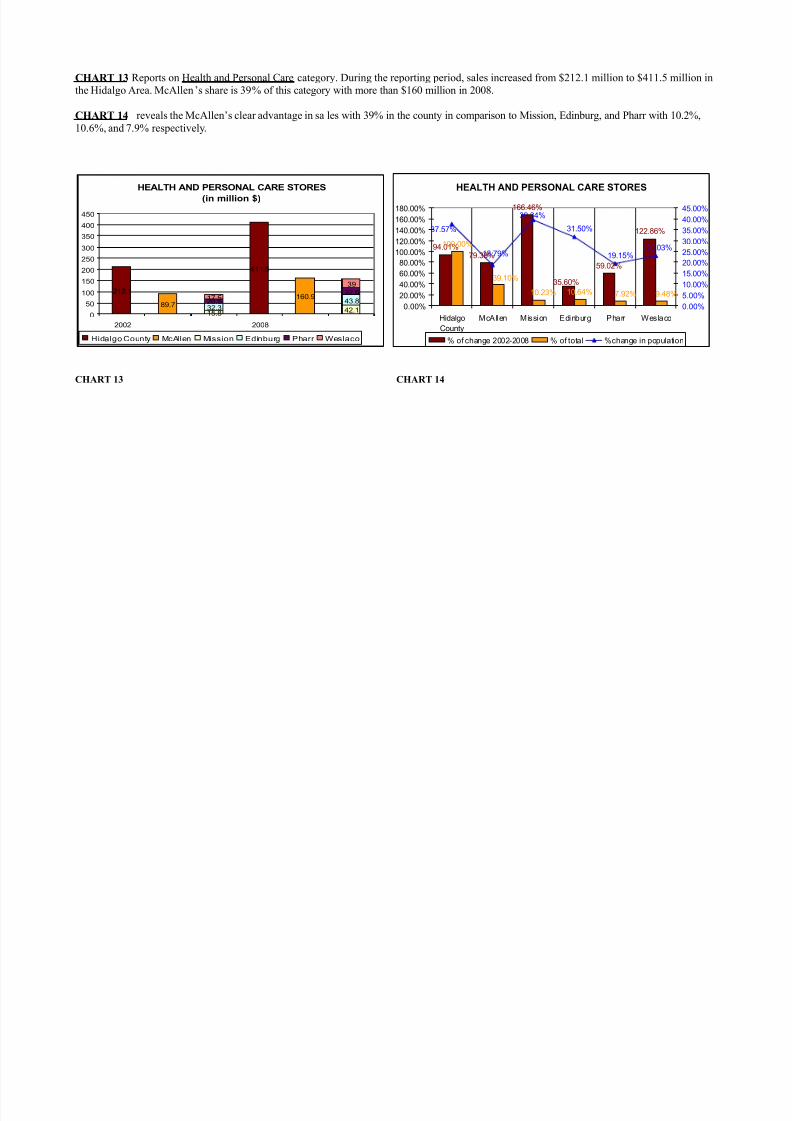
CHART 13 Reports on Health and Personal Care category. During the reporting period, sales increased from $212.1 million to $411.5 million inthe Hidalgo Area. McAllen’s share is 39% of this category with more than $160 million in 2008.
CHART 14 reveals the McAllen’s clear advantage in sa les with 39% in the county in comparison to Mission, Edinburg, and Pharr with 10.2%,10.6%, and 7.9% respectively.
CHART 13 CHART 14
HEALTH AND PERSONAL CARE STORES
(in million $)
212.1
411.5
89.7160.9
15.8 42.132.343.820.5
32.617.5
39
0
50
100
150
200
250
300
350
400
450
2002 2008
Hidalgo County McAllen Mission Edinburg Pharr Weslaco
HEALTH AND PERSONAL CARE STORES
94.01%
166.46%
59.02%
122.86%
100.00%
10.64%
79.38%
35.60%
10.23% 9.48%7.92%
39.10%
23.03%19.15%
31.50%
39.34%
18.79%
37.57%
0.00%
20.00%
40.00%60.00%
80.00%
100.00%
120.00%
140.00%
160.00%
180.00%
Hidalgo
County
McAllen Mission Edinburg Pharr Weslaco
0.00%
5.00%
10.00%15.00%
20.00%
25.00%
30.00%
35.00%
40.00%
45.00%
% of change 2002-2008 % of total %change in population
7/22/2019 Retail Trade in McAllen, TX
http://slidepdf.com/reader/full/retail-trade-in-mcallen-tx 13/18
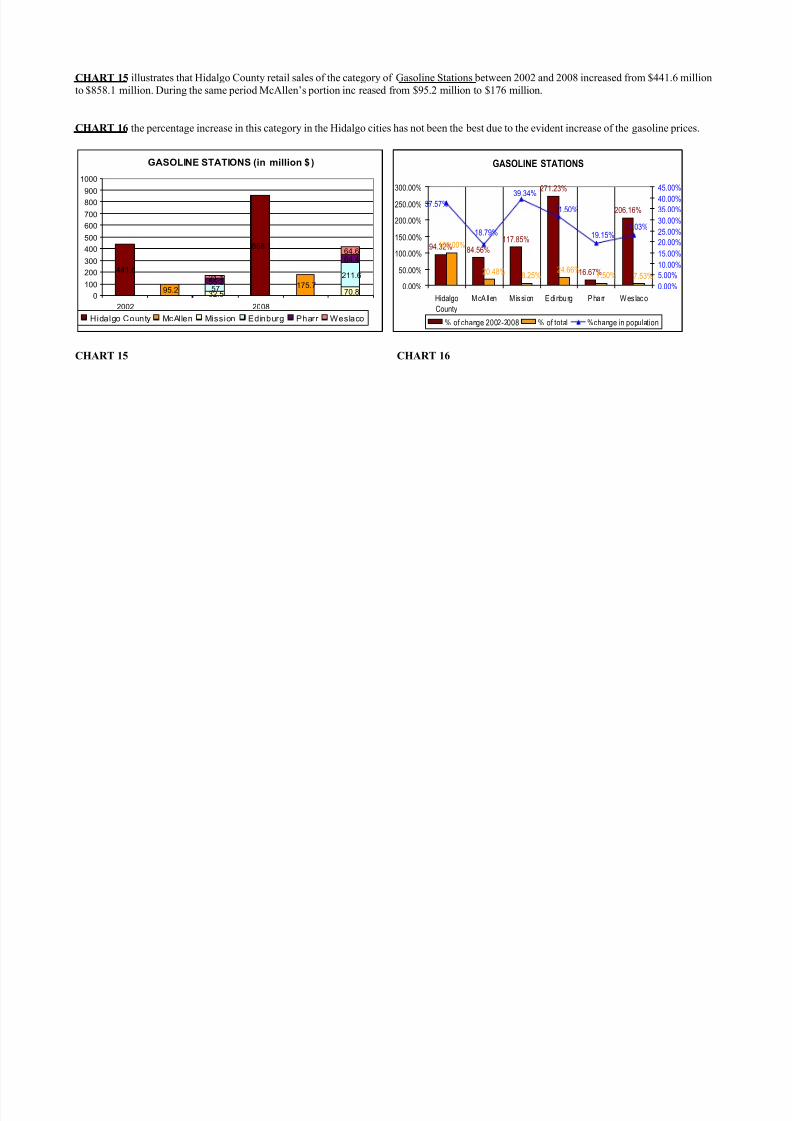
CHART 15 illustrates that Hidalgo County retail sales of the category of Gasoline Stations between 2002 and 2008 increased from $441.6 millionto $858.1 million. During the same period McAllen’s portion increased from $95.2 million to $176 million.
CHART 16 the percentage increase in this category in the Hidalgo cities has not been the best due to the evident increase of the gasoline prices.
CHART 15 CHART 16
GASOLINE STATIONS (in million $ )
441.6
858.1
95.2 175.7
32.5 70.857211.655.2
64.4
21.1
64.6
0
100
200
300
400
500
600
700
800
900
1000
2002 2008
Hidalgo County McAllen Mission Edinburg Pharr Weslaco
GASOLINE STATIONS
94.32% 84.56%
117.85%
271.23%
16.67%
206.16%
100.00%
7.53%7.50%8.25%
24.66%20.48%
23.03%19.15%
31.50%
39.34%
18.79%
37.57%
0.00%
50.00%
100.00%
150.00%
200.00%
250.00%
300.00%
Hidalgo
County
McAll en M ission Edinburg Pharr Wes laco
0.00%5.00%
10.00%
15.00%
20.00%
25.00%
30.00%
35.00%
40.00%
45.00%
% of change 2002-2008 % of total %change in population
7/22/2019 Retail Trade in McAllen, TX
http://slidepdf.com/reader/full/retail-trade-in-mcallen-tx 14/18
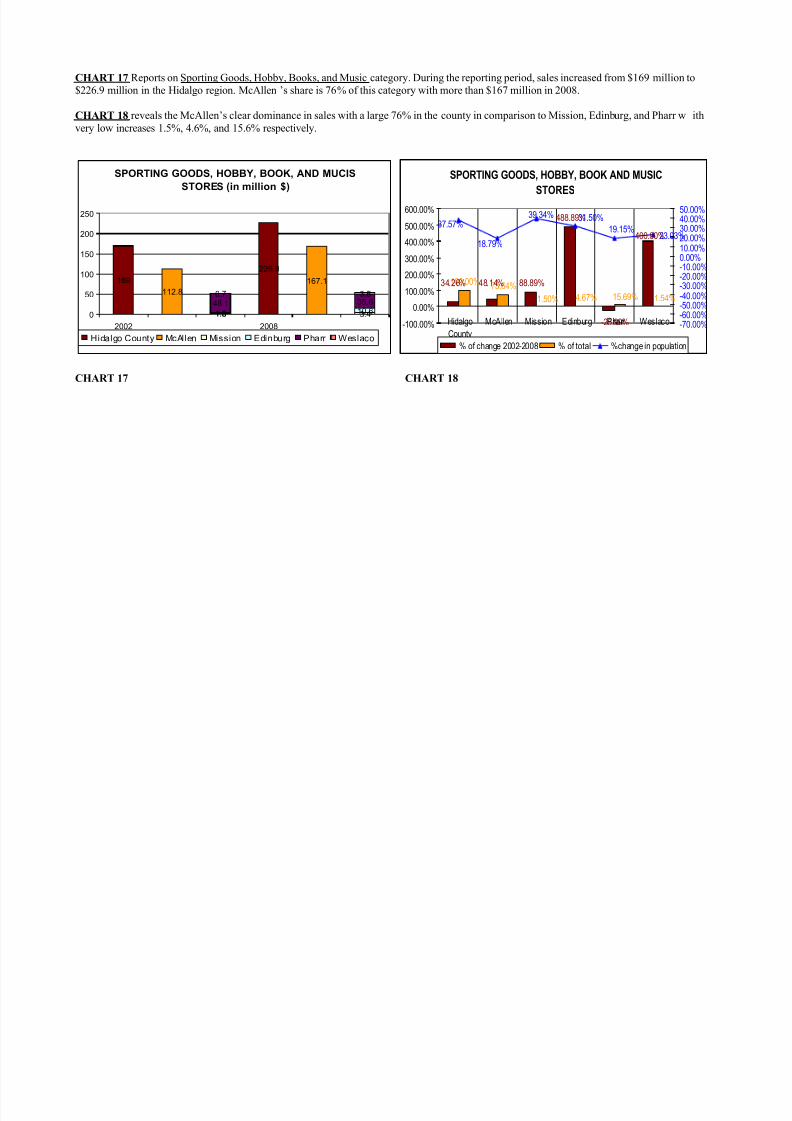
CHART 17 Reports on Sporting Goods, Hobby, Books, and Music category. During the reporting period, sales increased from $169 million to$226.9 million in the Hidalgo region. McAllen’s share is 76% of this category with more than $167 million in 2008.
CHART 18 reveals the McAllen’s clear dominance in sales with a large 76% in the county in comparison to Mission, Edinburg, and Pharr withvery low increases 1.5%, 4.6%, and 15.6% respectively.
CHART 17 CHART 18
SPORTING GOODS, HOBBY, BOOK, AND MUCIS
STORES (in million $)
169
226.9
112.8
167.1
1.8 3.41.8 10.648.1 35.60.7 3.5
0
50
100
150
200
250
2002 2008
Hidalgo County McAllen Mission Edinburg Pharr Weslaco
SPORTING GOODS, HOBBY, BOOK AND MUSIC
STORES
88.89%
488.89%
100.00% 73.64%34.26% 48.14%
-25.99%
400.00%
15.69% 1.54%4.67%1.50%
23.03%19.15%
31.50%39.34%
18.79%
37.57%
-100.00%
0.00%
100.00%200.00%
300.00%
400.00%
500.00%
600.00%
Hidalgo
County
McAllen Mission Edinburg Pharr Weslaco -70.00%-60.00%-50.00%-40.00%-30.00%-20.00%
-10.00%0.00%10.00%20.00%30.00%40.00%50.00%
% of change 2002-2008 % of total %change in population
7/22/2019 Retail Trade in McAllen, TX
http://slidepdf.com/reader/full/retail-trade-in-mcallen-tx 15/18
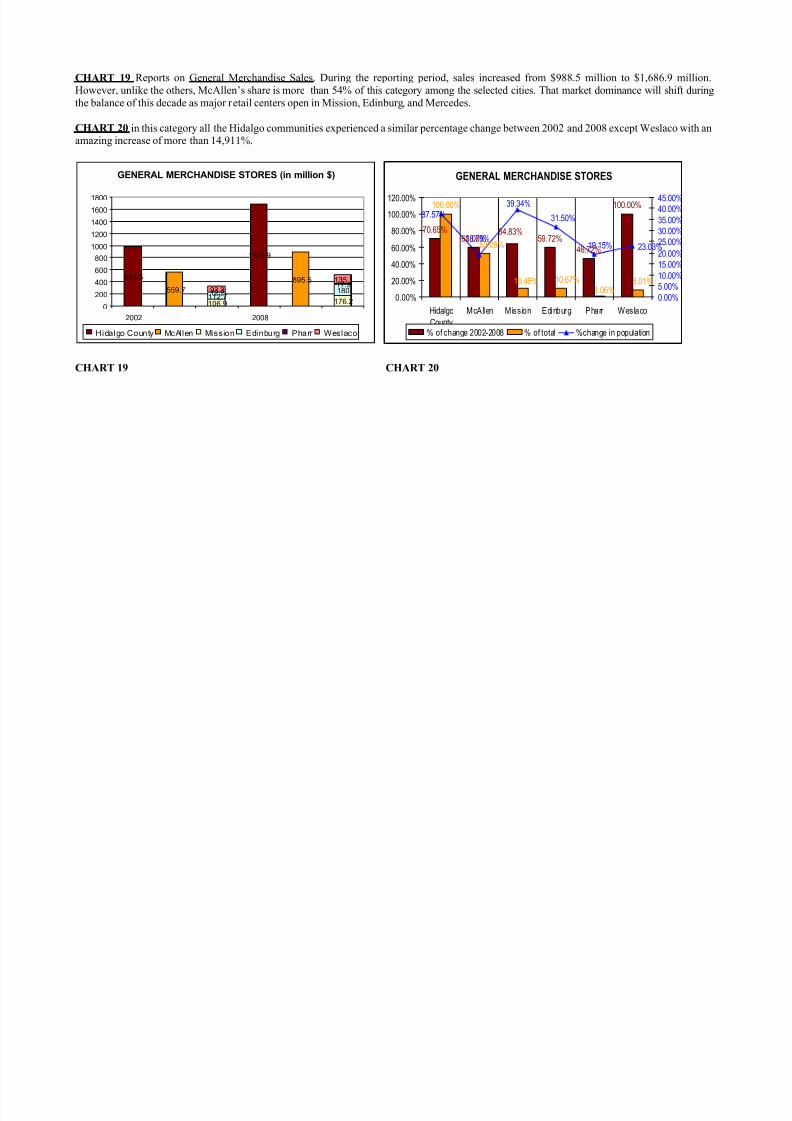
CHART 19 Reports on General Merchandise Sales. During the reporting period, sales increased from $988.5 million to $1,686.9 million.However, unlike the others, McAllen’s share is more than 54% of this category among the selected cities. That market dominance will shift duringthe balance of this decade as major retail centers open in Mission, Edinburg, and Mercedes.
CHART 20 in this category all the Hidalgo communities experienced a similar percentage change between 2002 and 2008 except Weslaco with an
amazing increase of more than 14,911%.
CHART 19 CHART 20
GENERAL MERCHANDISE STORES (in million $)
988.5
1686.9
559.7895.5
106.9 176.2112.7
18012.217.9
93.3135.1
0
200
400
600
800
1000
1200
1400
1600
1800
2002 2008
Hidalgo County McAllen Mission Edinburg Pharr Weslaco
GENERAL MERCHANDISE STORES
70.65%60.00% 59.72%
46.72%
100.00%100.00%
64.83%
10.45% 10.67% 8.01%
53.09%
1.06%
23.03%19.15%
31.50%
39.34%
18.79%
37.57%
0.00%
20.00%
40.00%
60.00%
80.00%
100.00%
120.00%
Hidalgo
County
McAllen Mission Edinburg Pharr Weslaco
0.00%
5.00%10.00%
15.00%
20.00%
25.00%
30.00%
35.00%
40.00%
45.00%
% of change 2002-2008 % of total %change in population

7/22/2019 Retail Trade in McAllen, TX
http://slidepdf.com/reader/full/retail-trade-in-mcallen-tx 16/18
CHART 21 Reports on Miscellaneous Sales. During the reporting period, sales increased from $291.9 million to $417.1. This increase is directlyrelated to overall increases in all retail sales during the same period. McAllen’s share is 36% of this category with more than $151 million in 2008.
CHART 22 reveals that, McAllen experienced the highest increase in store retail sales with 36% in comparison with the very low increase of theother cities.
CHART 21 CHART 22
MISCELLANEOUS STORE RETAILERS
(in million $)
291.9
417.1
168.3 151.2
8.2 12.119.5 40.520.6
469.1
9.3
0
50
100
150
200
250
300
350
400
450
2002 2008
Hidalgo County McAllen Mission Edinburg Pharr Weslaco
MISCELLANEOUS STORE RETAILERS
42.89%
-10.16%
47.56%
107.69%123.30%
2.20%
100.00%
36.25%
2.90% 9.71% 11.03%2.23%
23.03%
19.15%
31.50%39.34%
18.79%
37.57%
-20.00%
0.00%
20.00%
40.00%
60.00%
80.00%
100.00%
120.00%
140.00%
Hidalgo
County
McAllen Mission Edinburg Pharr Weslaco -20.00%
-10.00%
0.00%10.00%
20.00%
30.00%
40.00%
50.00%
% of change 2002-2008 % of total %change in population
7/22/2019 Retail Trade in McAllen, TX
http://slidepdf.com/reader/full/retail-trade-in-mcallen-tx 17/18
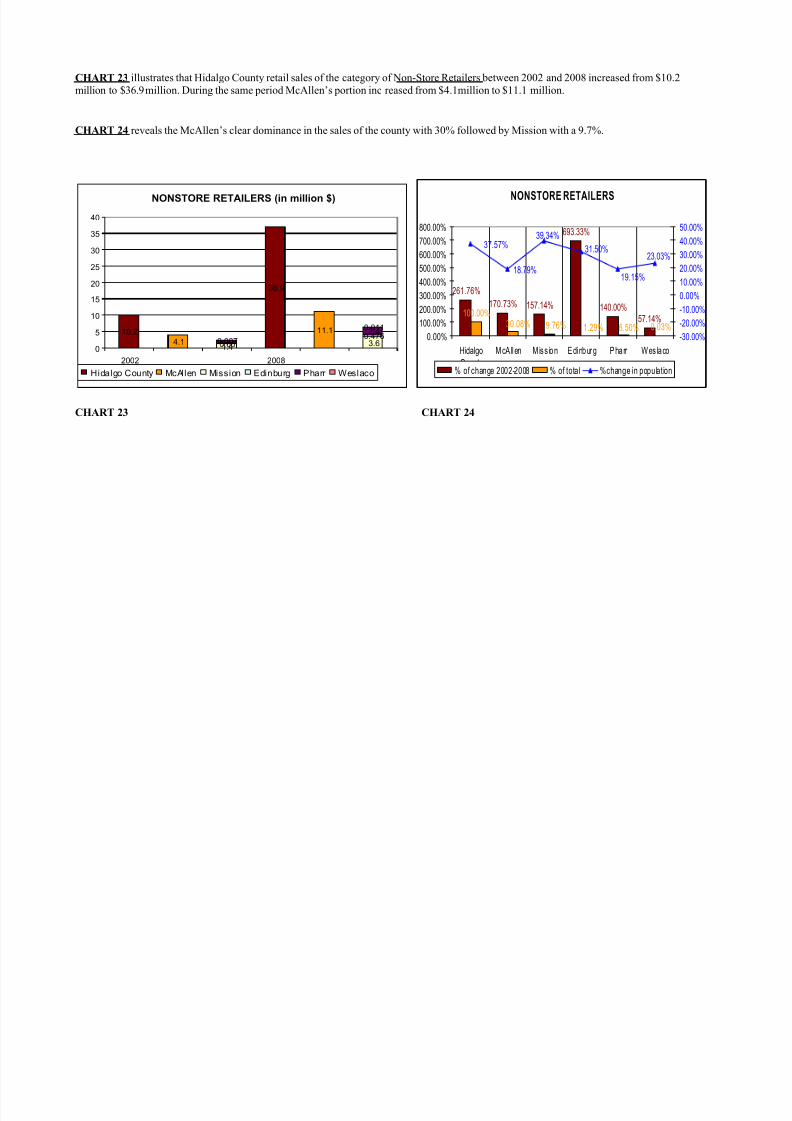
CHART 23 illustrates that Hidalgo County retail sales of the category of Non-Store Retailers between 2002 and 2008 increased from $10.2million to $36.9million. During the same period McAllen’s portion increased from $4.1million to $11.1 million.
CHART 24 reveals the McAllen’s clear dominance in the sales of the county with 30% followed by Mission with a 9.7%.
CHART 23 CHART 24
NONSTORE RETAILERS (in million $)
10.2
36.9
4.1
11.1
1.4 3.60.060.476
1
2.4
0.007
0.011
0
5
10
15
20
25
30
35
40
2002 2008
Hidalgo County McAllen Mission Edinburg Pharr Weslaco
NONSTORE RETAILERS
261.76%
170.73% 157.14%
693.33%
140.00%57.14%
100.00%
0.03%6.50%30.08% 9.76% 1.29%
18.79%
23.03%
19.15%
31.50%
39.34%37.57%
0.00%
100.00%
200.00%
300.00%
400.00%
500.00%
600.00%
700.00%
800.00%
Hidalgo
County
McAll en M iss ion Edinburg Pharr Wes laco
-30.00%
-20.00%
-10.00%
0.00%
10.00%
20.00%
30.00%
40.00%
50.00%
% of change 2002-2008 % of total %change in population
7/22/2019 Retail Trade in McAllen, TX
http://slidepdf.com/reader/full/retail-trade-in-mcallen-tx 18/18
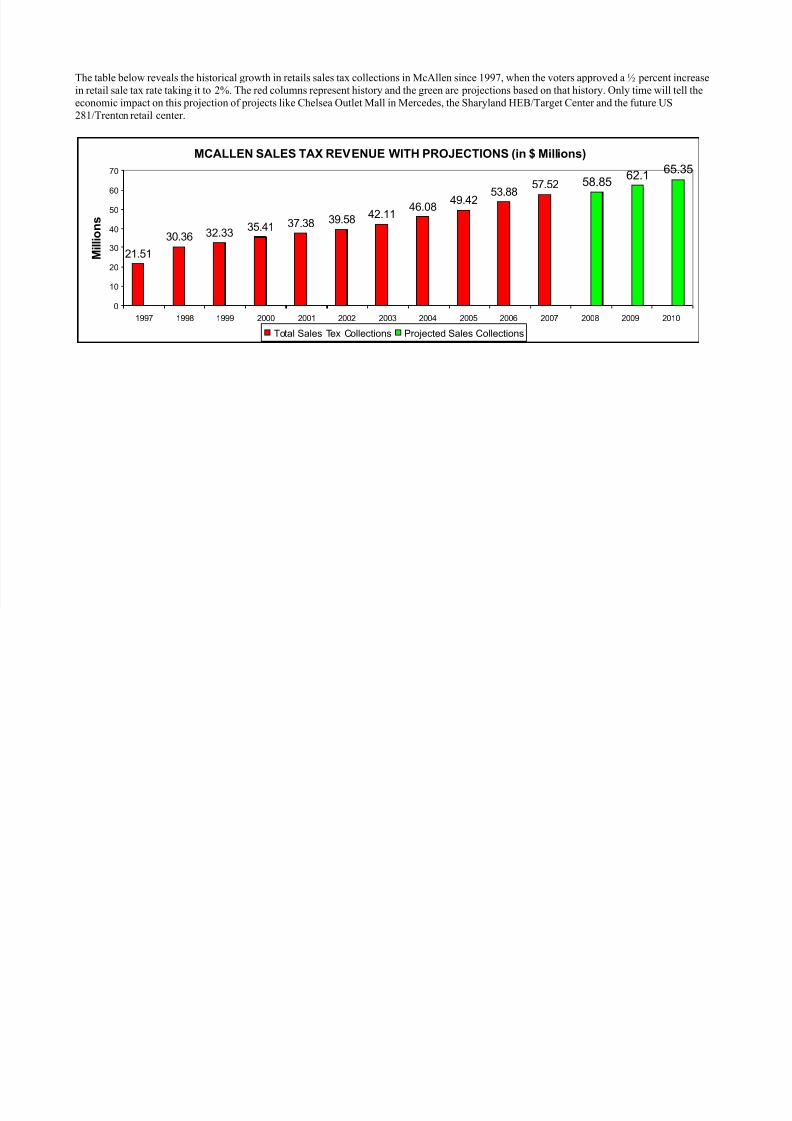
The table below reveals the historical growth in retails sales tax collections in McAllen since 1997, when the voters approved a ½ percent increasein retail sale tax rate taking it to 2%. The red columns represent history and the green are projections based on that history. Only time will tell theeconomic impact on this projection of projects like Chelsea Outlet Mall in Mercedes, the Sharyland HEB/Target Center and the future US281/Trenton retail center.
MCALLEN SALES TAX REVENUE WITH PROJECTIONS (in $ Millions)
21.51
30.36 32.33 35.41 37.38 39.58 42.11
46.08 49.42
53.88 57.52 58.85
62.1 65.35
0
10
20
30
40
50
60
70
1997 1998 1999 2000 2001 2002 2003 2004 2005 2006 2007 2008 2009 2010
M i l l i o n s
Total Sales Tex Collections Projected Sales Collections