Embed Size (px)
Citation preview
Retail and Shopper Trends
Asia Pacific 2010The latest in retailing
and shopper trends for the FMCG industry
August 2010
2
About The Nielsen CompanyWe are a leading global information and measurement company that provides clients with a comprehensive understanding of consumers and consumer behavior. We deliver critical media and marketing information, analytics and industry expertise about what consumers watch (consumer interaction with television, online and mobile) and what consumers buy on a global and local basis. Our information, insights and solutions help our clients maintain and strengthen their market positions and identify opportunities for profitable growth. We have a presence in approximately 100 countries, including many developing and emerging markets, and hold leading market positions in many of our services and geographies. Based on the strength of the Nielsen brand, our scale and the breadth and depth of our solutions, we believe we are the global leader in measuring and analyzing consumer behavior in the segments in which we operate.
BUYOur Buy segment provides retail transactional measurement data, consumer behavior information and analytics primarily to businesses in the consumer packaged goods industry. Our extensive database of retail and consumer information, combined with our advanced analytical capabilities, helps generate strategic insights that influence our clients’ key business decisions.
We track billions of sales transactions per month in retail outlets in approximately 100 countries around the world and our data is used by our clients to measure their sales and market share. We are the only company offering such extensive global coverage for consumer packaged goods.
Our Buy products and services also enable our clients to better manage their brands, uncover new sources of demand, launch and grow new products, analyze their sales, improve their marketing mix and establish stronger consumer relationships.
WATCHOur Watch segment provides viewership data and analytics primarily to the media and advertising industries across television, online and mobile screens.
Within our Watch segment, our ratings are the primary metrics used to determine the value of programming and advertising in the U.S. total television advertising marketplace. In addition to the United States, we measure television viewing in 29 countries. We also measure markets that account for approximately 80% of global internet users and offer mobile measurement services in 10 countries, including the United States, where we are the market leader.
Our Watch data is used by our media clients to understand their audiences, establish the value of their advertising inventory and maximize the value of their content, and by our advertising clients to plan and optimize their spending.
3
ContentsExecutive Summary
• Retail & Shopper Trends in Asia Pacific 2010 4
Regional Highlights
• Grocery Share of Trade in Asia 8
• Share of trade for modern self-service outlets 8
• Share of trade for modern self-service outlets 9
• Total FMCG Nominal Growth in 2009 9
• Total FMCG Growth in 2009 9
• Grocery store numbers in Asia Pacific 10
• Traditional grocery trade 2009 v 2000 10
• % of Male Shoppers in South/ South-East Asia (2009 vs. 2002) 11
• % of Main Shoppers who are Housewives 11
• % of Urban Shoppers Using Hypermarkets Regularly 12
• Frequency of Visiting Hypermarkets 12
• % of Urban Shoppers Using Supermarkets Regularly 13
• Frequency of Visiting Supermarkets 13
• % of Shoppers Focused on Promotions 14
• Trade Concentration Share for Top 5 Chains 14
• Trade Concentration Share for Top 5 Chains 15
• Private Label Share of Total Market 15
Country Highlights
Pacific
• Australia 16
• New Zealand 17
North Asia
• China 19
• Taiwan 21
• Hong Kong 23
• Korea 25
South-East Asia
• Singapore 27
• Malaysia 29
• Thailand 31
• Indonesia 33
• Philippines 35
• Vietnam 37
South Asia
• India 39
• Sri Lanka 41
Country Highlights include:
• Retail Structure – Store Numbers
• Shoppers Usage of Modern Trade Store Types
• Modern Trade Retailers – Banner Names and Numbers
• Share of Trade
4
2009 a tough year for retailers in most Asia Pacific markets but light appearing at the end of the tunnel
Volume growth down in 2009: Throughout the Asia Pacific region, countries experienced a lower level of grocery sales growth in 2009 compared to the very strong performance in 2008. Discounting the effects of lower inflation on absolute sales dollars, volume growth was significantly lower in many markets.
The strongest performing markets in 2009 were India and Vietnam, where sales values increased by nearly 15% compared to 2008. In China and Indonesia, markets that had consistently enjoyed double-digit growth over the last 5 years, the growth rate slowed down to +3% and +5% respectively. China has seen a strong recovery though since Q4 2009 and is now back to 11% growth in Q1 driven by a strong demand for food categories.
In the more developed markets of Hong Kong, Singapore and Korea, where grocery sales had benefited from the economic difficulties as consumers spent less on eating out, we saw growth rates slowing down in the 2nd half of 2009 as consumer sentiment became more positive. In Singapore where the sales of basic groceries such as cooking oil grew strongly in 2009 we are now seeing growth switching back to personal care, health and more premium products. Both New Zealand and Australia also showed continued steady sales growth of over 6% last year.
Surging consumer confidence in 2010: The latest consumer confidence index in the Asia Pacific region, as surveyed by Nielsen globally, continued to improve in 2009 and reached an index score of 101 in Q2 2010, an increase of 23 points from Q1 2009. Globally, the consumer confidence index reached its highest level since Q3 2007, at 93 points in Q2 2010.
Executive Summary
Retail & Shopper Trends 2010Peter GaleManaging Director – Retailer ServicesAsia Pacific, Middle East & AfricaThe Nielsen Company
The big increase in the consumer index for the Asia Pacific region was led by Vietnam (+18) and Singapore (+5). The region also took 6 of the top 10 spots globally, in terms of consumer confidence: India (129), Indonesia (119), Vietnam (119) The Philippines (113), Singapore (112) and Australia (108). Of these countries, India and Indonesia occupied the top 2 positions globally.
In Q2 2010, 43% of consumers in the region felt good about spending on items they want and need over the next 12 months, compared to 36% in Q3 2009. While consumers are also saying that they plan to change their spending to save on household expenses, they plan to spend their spare cash in areas including Clothes and New Technology which should be positive for the Hypermarket channel, which suffered from the cut back in general merchandise sales during 2009. They also plan to increase spending on out-of- home entertainment which may be less positive for the grocery trade, particularly in developed markets, where the move to entertaining at home had a positive effect on grocery sales in 2009.
The “2000’s” - a decade of change for grocery retailing in Asia
Over the last 10 years we saw a massive change to the grocery retail business across Asia, driven by retailer investment in new stores. The number of modern trade stores has been growing by over 16,000 stores a year with the total store count increasing from less than 50,000 to close to 220,000.
Modern trade on the rise: Across the region, the modern trade now accounts for 53% of the packaged grocery sales tracked by Nielsen, from the 35% share in 2000. This shift of consumer spending of nearly 2% per annum has been strongest in North Asia – led by China where the importance of modern trade increased on average by 3%
China and Korea are fastest changing markets: While there has been significant store growth in all markets, the biggest story of the decade was clearly the expansion seen in the China market. China alone accounted for over 100,000 new stores or more than 60% of the total new store investment and equivalent to a 1000% increase in a 10 year period. Subsequently the modern trade share increased from 34% to 64% during the decade with all formats driving that growth.
5
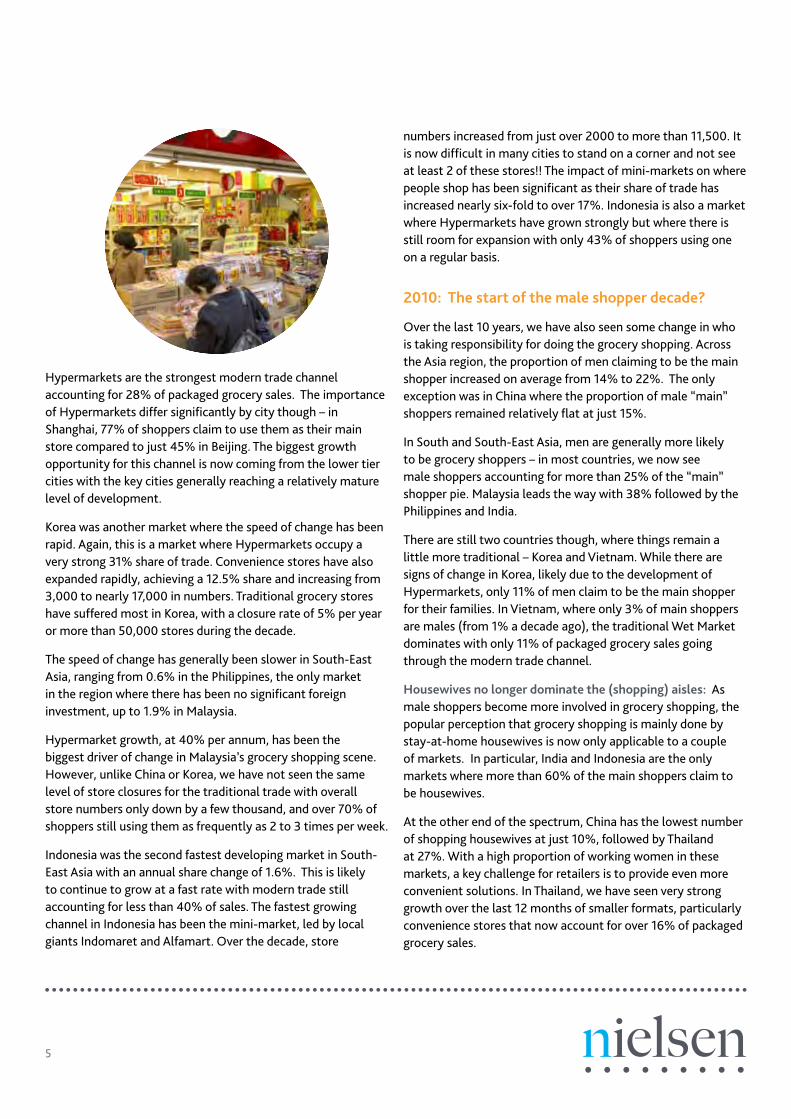
Hypermarkets are the strongest modern trade channel accounting for 28% of packaged grocery sales. The importance of Hypermarkets differ significantly by city though – in Shanghai, 77% of shoppers claim to use them as their main store compared to just 45% in Beijing. The biggest growth opportunity for this channel is now coming from the lower tier cities with the key cities generally reaching a relatively mature level of development.
Korea was another market where the speed of change has been rapid. Again, this is a market where Hypermarkets occupy a very strong 31% share of trade. Convenience stores have also expanded rapidly, achieving a 12.5% share and increasing from 3,000 to nearly 17,000 in numbers. Traditional grocery stores have suffered most in Korea, with a closure rate of 5% per year or more than 50,000 stores during the decade.
The speed of change has generally been slower in South-East Asia, ranging from 0.6% in the Philippines, the only market in the region where there has been no significant foreign investment, up to 1.9% in Malaysia.
Hypermarket growth, at 40% per annum, has been the biggest driver of change in Malaysia’s grocery shopping scene. However, unlike China or Korea, we have not seen the same level of store closures for the traditional trade with overall store numbers only down by a few thousand, and over 70% of shoppers still using them as frequently as 2 to 3 times per week.
Indonesia was the second fastest developing market in South-East Asia with an annual share change of 1.6%. This is likely to continue to grow at a fast rate with modern trade still accounting for less than 40% of sales. The fastest growing channel in Indonesia has been the mini-market, led by local giants Indomaret and Alfamart. Over the decade, store
numbers increased from just over 2000 to more than 11,500. It is now difficult in many cities to stand on a corner and not see at least 2 of these stores!! The impact of mini-markets on where people shop has been significant as their share of trade has increased nearly six-fold to over 17%. Indonesia is also a market where Hypermarkets have grown strongly but where there is still room for expansion with only 43% of shoppers using one on a regular basis.
2010: The start of the male shopper decade?
Over the last 10 years, we have also seen some change in who is taking responsibility for doing the grocery shopping. Across the Asia region, the proportion of men claiming to be the main shopper increased on average from 14% to 22%. The only exception was in China where the proportion of male “main” shoppers remained relatively flat at just 15%.
In South and South-East Asia, men are generally more likely to be grocery shoppers – in most countries, we now see male shoppers accounting for more than 25% of the “main” shopper pie. Malaysia leads the way with 38% followed by the Philippines and India.
There are still two countries though, where things remain a little more traditional – Korea and Vietnam. While there are signs of change in Korea, likely due to the development of Hypermarkets, only 11% of men claim to be the main shopper for their families. In Vietnam, where only 3% of main shoppers are males (from 1% a decade ago), the traditional Wet Market dominates with only 11% of packaged grocery sales going through the modern trade channel.
Housewives no longer dominate the (shopping) aisles: As male shoppers become more involved in grocery shopping, the popular perception that grocery shopping is mainly done by stay-at-home housewives is now only applicable to a couple of markets. In particular, India and Indonesia are the only markets where more than 60% of the main shoppers claim to be housewives.
At the other end of the spectrum, China has the lowest number of shopping housewives at just 10%, followed by Thailand at 27%. With a high proportion of working women in these markets, a key challenge for retailers is to provide even more convenient solutions. In Thailand, we have seen very strong growth over the last 12 months of smaller formats, particularly convenience stores that now account for over 16% of packaged grocery sales.
6
Hypermarket growth stalls: a short term effect?
One of the clear effects of the 2009 economic downturn was a halt in the forward march of Hypermarkets in many countries. In a number of countries such as Korea and Taiwan, we saw Hypermarkets lose as much as 1% share as shoppers used them slightly less frequently. This was quite possibly an effort from shoppers to try to save money by avoiding the larger stores where they are faced with more non-discretionary spending temptations.
At the same time, many countries saw a growth in the usage of smaller supermarkets or mini-markets, stores that offer shoppers a more convenient local grocery shopping option and lower travelling costs.
In Korea, the number of shoppers who used supermarkets as their main channel increased from 17% to 23%, reversing a declining trend we had seen for more then 10 years. Regular use of Supermarkets also increased for the first time in many years in Taiwan, Indonesia and Thailand, markets that have had strong development of Hypermarkets. Whether this trend continues through 2010, as consumer confidence returns and shoppers start to increase their spending, remains to be seen.
It is possible that Hypermarkets may find growth harder to come by in a number of markets, with retailers continuing to invest in smaller formats, offering shoppers more convenient “top-up” shopping. In many cases the smaller formats are being opened by the leading Hypermarket chains in an effort to expand their footprint to smaller catchment areas that cannot support a larger store, or to capture spending from different shopping trips other than the main “stock-up” trip. The development of this multi-format strategy in Asia follows a retail trend we see being implemented globally.
Shoppers become more focused on value in 2009
A prominent impact of the economic downturn on shopper’s behavior was an increased focus on value across all markets. This was partly due to the economic downturn, but was also retailer driven with the amount of retailer promotional activity increasing sharply in a number of markets.
The proportion of shoppers who claim to be promotion seekers increased noticeably, particularly in some of the developing markets such as Vietnam, India and China. Malaysia was another market where promotions became even more important despite it already having one the highest proportions of promotion-sensitive consumers.
In Korea, 34% of shoppers’ choice of stores to patronize is influenced by the stores’ promotional leaflets, nearly 20% more than the average for the region. The story is different in Indonesia, where shoppers were less inclined to buy based on promotional offers. As sales dropped sharply, shoppers were more likely to focus on buying the brands that they trusted rather than risking their money on products they were not familiar with, even if these were priced competitively. Indonesia is also the country where the highest proportion of shoppers (81%), claims to choose stores purely based on convenience (store location). This may well be due to the preponderance of conveniently located mini-markets.
So, what is going to happen during the next decade?
Many of the trends we have seen over the last decade will no doubt continue.
Size matters: There will be further growth in large format stores offering consumers low prices, a wide assortment and a spacious shopping environment, particularly in the developing markets. In countries where they are already dominant, there may well be a challenge from more convenient smaller format stores and also a need for retailers to refresh their offer to capture and/or keep the interest of shoppers.
Convenience: Convenience stores typified by 7-Eleven will continue to grow strongly in all countries, with a big driver of this likely to include an ever-expanding offer in food services as well as many other services aimed at making everyday life even more convenient.
Concentration of trade: Retailer concentration will increase very much at the same rate that we saw over the last few years, shifting by 1 to 2% annually. The occasional bigger changes will be driven by mergers and acquisitions as retailers strive to drive profitability through size.
The traditional trade will remain an important retail channel in most developing markets, although they will lose share at a rate of about 1% per year. For the region, this is likely to be slower than the preceding decade as there will not be the same size of impact from China.
While India will have a lot of focus from a regional perspective with investment being ramped up again over the next few years, the speed of change is unlikely to bear much resemblance to what was experienced in China. While we still saw 16% growth
7
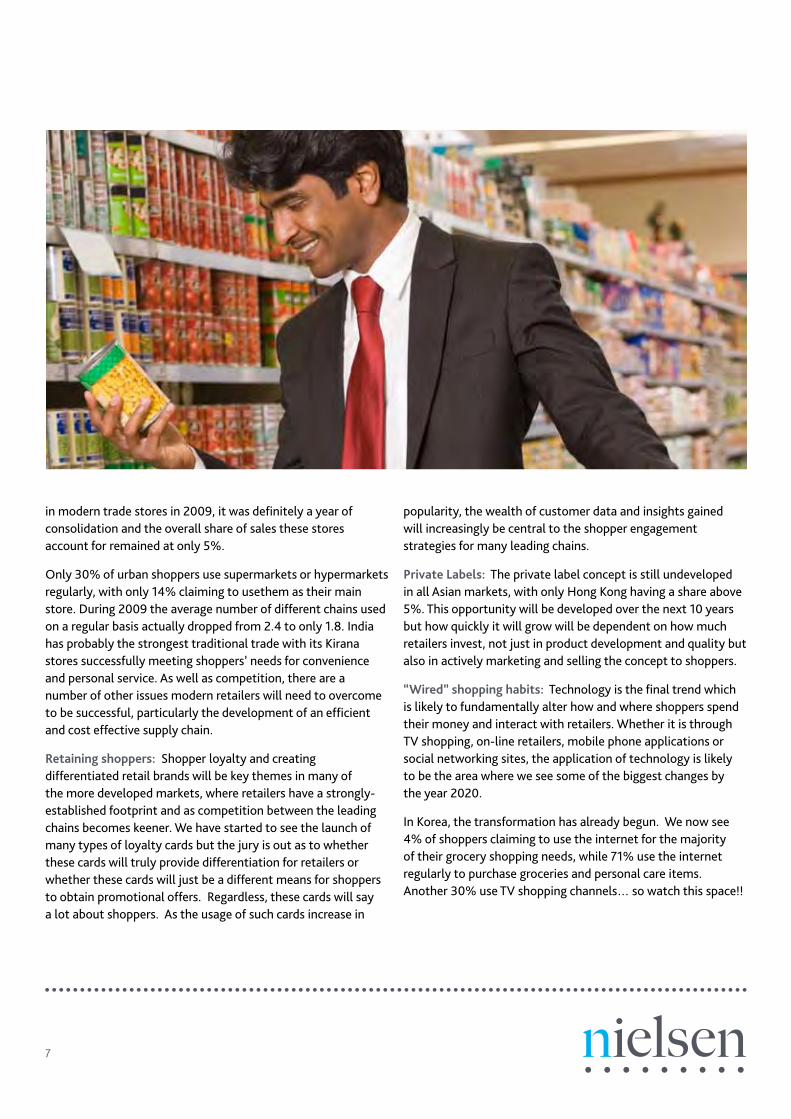
in modern trade stores in 2009, it was definitely a year of consolidation and the overall share of sales these stores account for remained at only 5%.
Only 30% of urban shoppers use supermarkets or hypermarkets regularly, with only 14% claiming to usethem as their main store. During 2009 the average number of different chains used on a regular basis actually dropped from 2.4 to only 1.8. India has probably the strongest traditional trade with its Kirana stores successfully meeting shoppers’ needs for convenience and personal service. As well as competition, there are a number of other issues modern retailers will need to overcome to be successful, particularly the development of an efficient and cost effective supply chain.
Retaining shoppers: Shopper loyalty and creating differentiated retail brands will be key themes in many of the more developed markets, where retailers have a strongly-established footprint and as competition between the leading chains becomes keener. We have started to see the launch of many types of loyalty cards but the jury is out as to whether these cards will truly provide differentiation for retailers or whether these cards will just be a different means for shoppers to obtain promotional offers. Regardless, these cards will say a lot about shoppers. As the usage of such cards increase in
popularity, the wealth of customer data and insights gained will increasingly be central to the shopper engagement strategies for many leading chains.
Private Labels: The private label concept is still undeveloped in all Asian markets, with only Hong Kong having a share above 5%. This opportunity will be developed over the next 10 years but how quickly it will grow will be dependent on how much retailers invest, not just in product development and quality but also in actively marketing and selling the concept to shoppers.
“Wired” shopping habits: Technology is the final trend which is likely to fundamentally alter how and where shoppers spend their money and interact with retailers. Whether it is through TV shopping, on-line retailers, mobile phone applications or social networking sites, the application of technology is likely to be the area where we see some of the biggest changes by the year 2020.
In Korea, the transformation has already begun. We now see 4% of shoppers claiming to use the internet for the majority of their grocery shopping needs, while 71% use the internet regularly to purchase groceries and personal care items. Another 30% use TV shopping channels… so watch this space!!

8
Grocery Share of Trade in Asia
53% of packaged grocery products are now sold through modern self-service stores across the Asia region
Regional Highlights
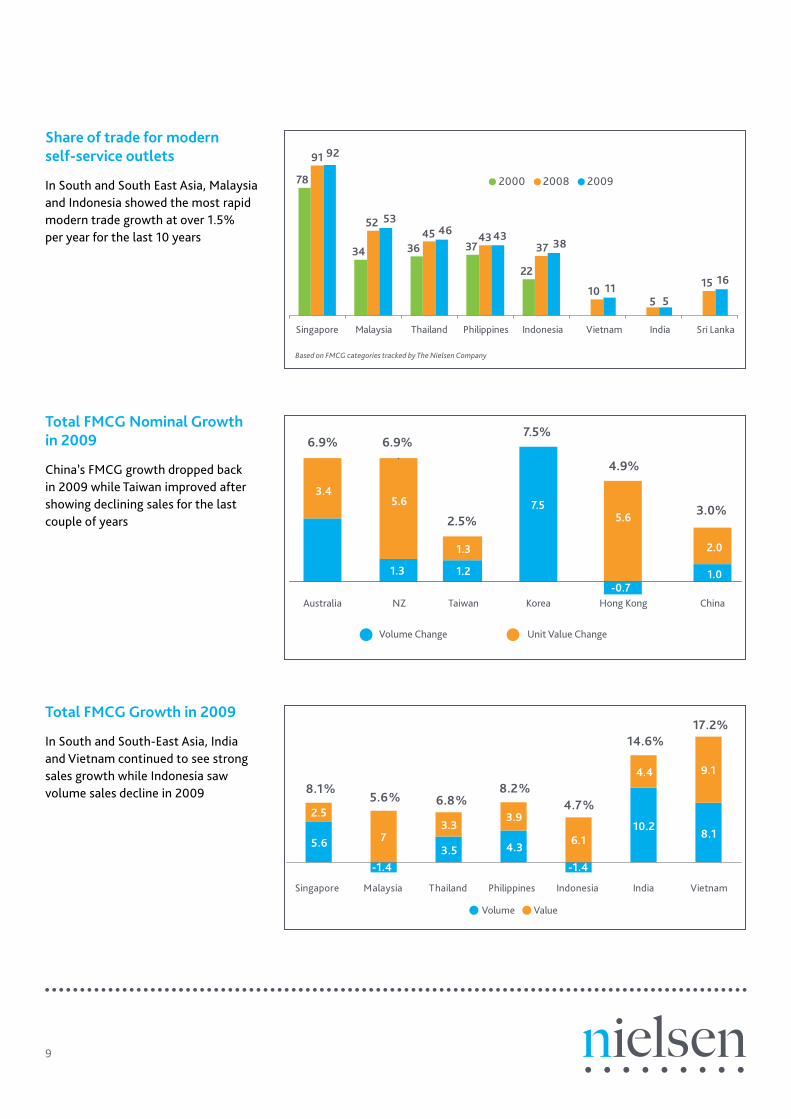
Share of trade for modern self-service outlets
China has been the most dynamic market in the world during the last 10 years with the modern trade share increasing by 3% a year to 64%
44 46 48 50 52 52 5335 39 41
2000 2001 2002 2003 2004 2005 2006 2007 2008 2009
Modern Self Service Trade Traditional Counter Service
65 61 59 56 54 52 50 48 4748
8287 86
74
92 94
63
86 86
34
63 64
ChinaKoreaTaiwanHK
2000 2008 2009
Based on FMCG categories tracked by The Nielsen CompanyChina excluded villages
9
Share of trade for modern self-service outlets
In South and South East Asia, Malaysia and Indonesia showed the most rapid modern trade growth at over 1.5% per year for the last 10 years
Total FMCG Nominal Growth in 2009
China’s FMCG growth dropped back in 2009 while Taiwan improved after showing declining sales for the last couple of years
Total FMCG Growth in 2009
In South and South-East Asia, India and Vietnam continued to see strong sales growth while Indonesia saw volume sales decline in 2009
Singapore Malaysia Thailand Philippines Indonesia India Vietnam
Volume Value
5.6
-1.43.5 4.3
-1.4
10.28.1
2.5
73.3
3.9
6.1
4.4 9.1
8.1% 5.6% 6.8%
8.2% 4.7%
14.6% 17.2%
78
34 36 37
22
4337
105
15
92
5346 43
38
115
16
52
91
45
Singapore Malaysia Thailand Philippines Indonesia Vietnam India Sri Lanka
2000 2008 2009
Volume Change Unit Value Change
Australia NZ Taiwan Korea Hong Kong China
3.4
3.5
6.9% 6.9%
5.6
1.3
2.5%
7.5%
4.9%
3.0%
1.3
1.2
7.55.6
2.0
1.0-0.7
Based on FMCG categories tracked by The Nielsen Company

10
Grocery store numbers in Asia Pacific
Traditional grocery stores increased by 1 million in the last decade but the modern trade store numbers grew by an average of 35% per annum
Traditional grocery trade 2009 vs. 2000
In developing countries the number of Traditional Stores continues to increase and in most countries Modern Trade share growth is significantly slower than developed markets
Traditional Grocery Modern Trade
13.1 million11.9 million
48,500
217,318
2000 20102009
2.3% 1.4% 2.0%3.0%
1.9%0.4% 1.0%
0.3%1.6%
0.6%
-3.0%-2.0% -2.0%
-1.0% -1.0%
6.0%
1.0%1.0%2.0%
-5.0%
Korea Singapore Taiwan China Malaysia HK Thailand India Indonesia Philippines
Modern Trade Annual Share Growth Annual % Change in Traditional Stores
Source: Nielsen retail census
Source: Nielsen retail census
11
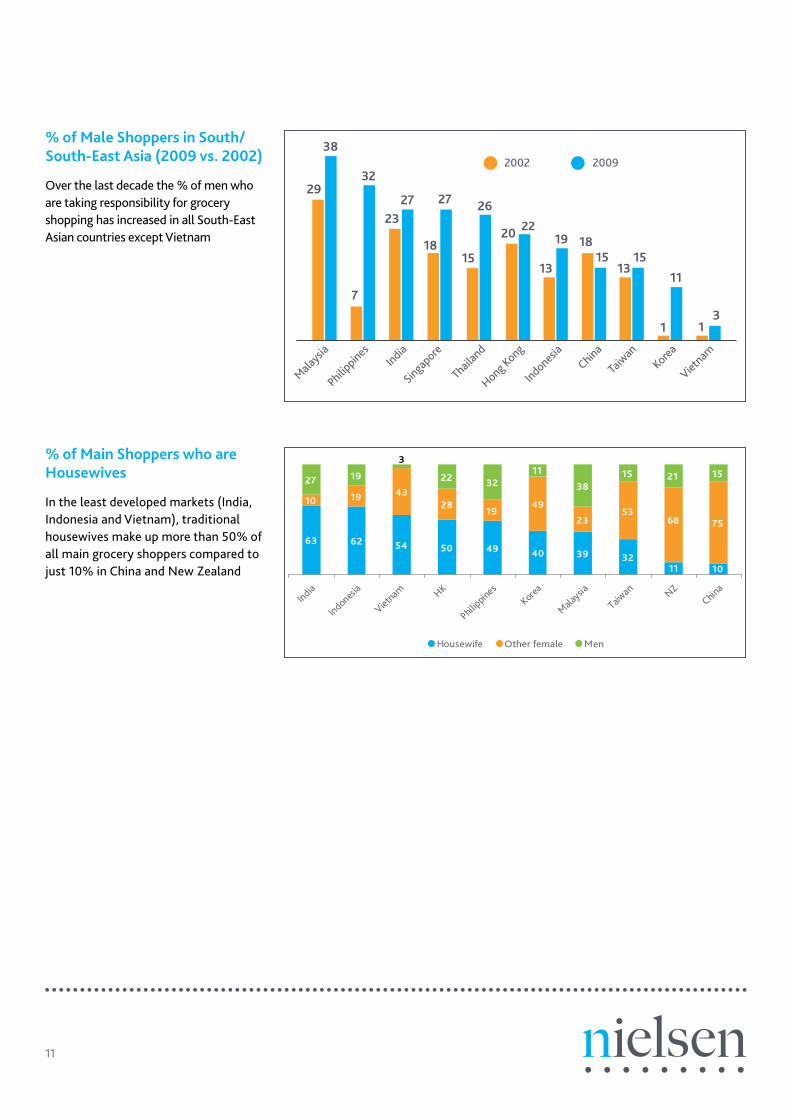
% of Male Shoppers in South/South-East Asia (2009 vs. 2002)
Over the last decade the % of men who are taking responsibility for grocery shopping has increased in all South-East Asian countries except Vietnam
% of Main Shoppers who are Housewives
In the least developed markets (India, Indonesia and Vietnam), traditional housewives make up more than 50% of all main grocery shoppers compared to just 10% in China and New Zealand
2002 2009
Singapore
Philippines
Taiw
an
India
Thailan
d
Malaysia
Indonesia
China
Korea
Vietnam
Hong Kong
29
38
32
2327
18
27
15
7
26
20 22
13 13
19 1815 15
1
11
13
3
27 19 22 3211
3821
India
Indonesia
Vietnam HK
Philippines
Korea
Taiwan
Malaysia NZ
China
Housewife Other female Men
63 62 54 50 49 40 39
10
10 19 4328
1949
5323 68 75
1515
3211
12
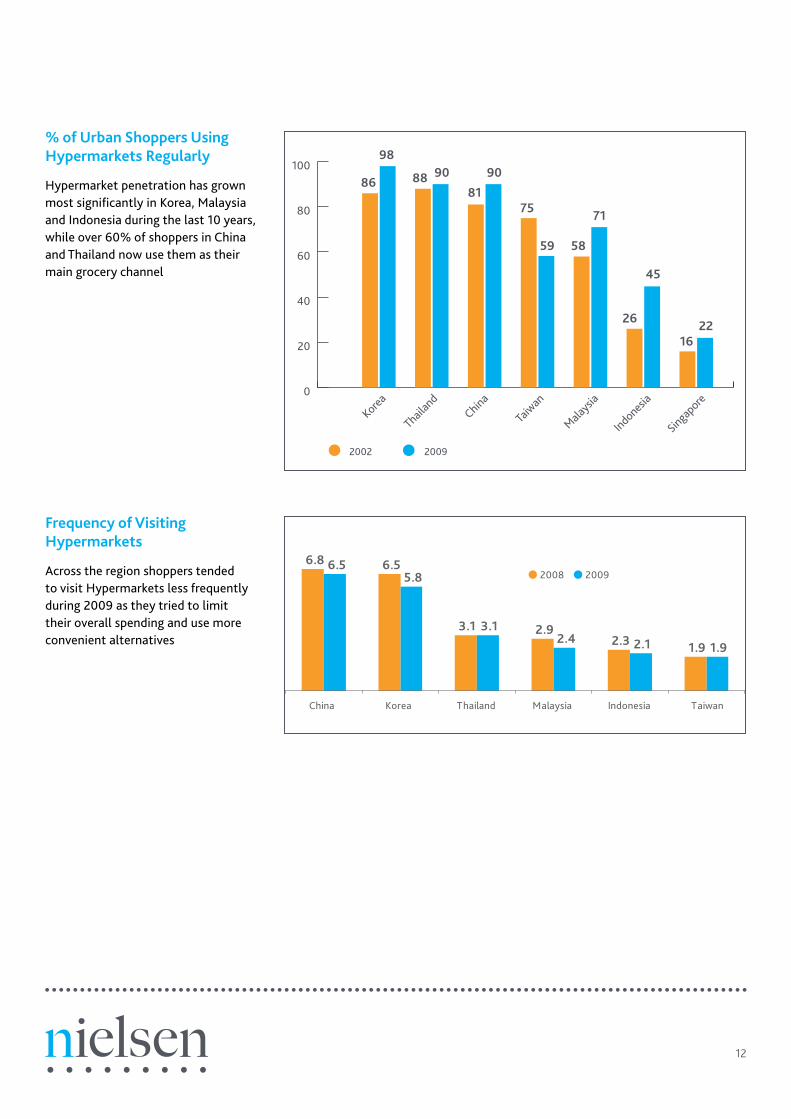
Frequency of Visiting Hypermarkets
Across the region shoppers tended to visit Hypermarkets less frequently during 2009 as they tried to limit their overall spending and use more convenient alternatives
% of Urban Shoppers Using Hypermarkets Regularly
Hypermarket penetration has grown most significantly in Korea, Malaysia and Indonesia during the last 10 years, while over 60% of shoppers in China and Thailand now use them as their main grocery channel
2002 2009
Singapore
Taiw
an
Thailan
d
Malaysia
Indonesia
China
Korea
86
0
20
40
60
80
10098
88 90
81
90
75
59 58
71
26
45
1622
6.8 6.5
3.1 2.92.3 1.9
6.55.8
3.12.4 2.1 1.9
2008 2009
China Korea Thailand Malaysia Indonesia Taiwan

13
Frequency of Visiting Supermarkets
Shoppers used the more convenient Supermarkets more frequently during 2009 in a number of countries, including Thailand and Taiwan
8.7
6.6 6.5
3.2
2.2 2.2 2.1
9.1
6.7 6.5
2.8 3.12.5 2.2
Hong Kong Singapore China Malaysia Thailand Taiwan Indonesia
2008 2009
% of Urban Shoppers Using Supermarkets Regularly
In Thailand, Indonesia, Taiwan and Korea we saw Supermarket penetration improve after a decade of losing shoppers
2002 2008
Taiw
an
Thailan
d
Malaysia
Indonesia
China
Korea
93
2009
0
20
40
60
80
100
8389
75 78 7886
8177
70
42
61
76
41
54 56
32
43
14
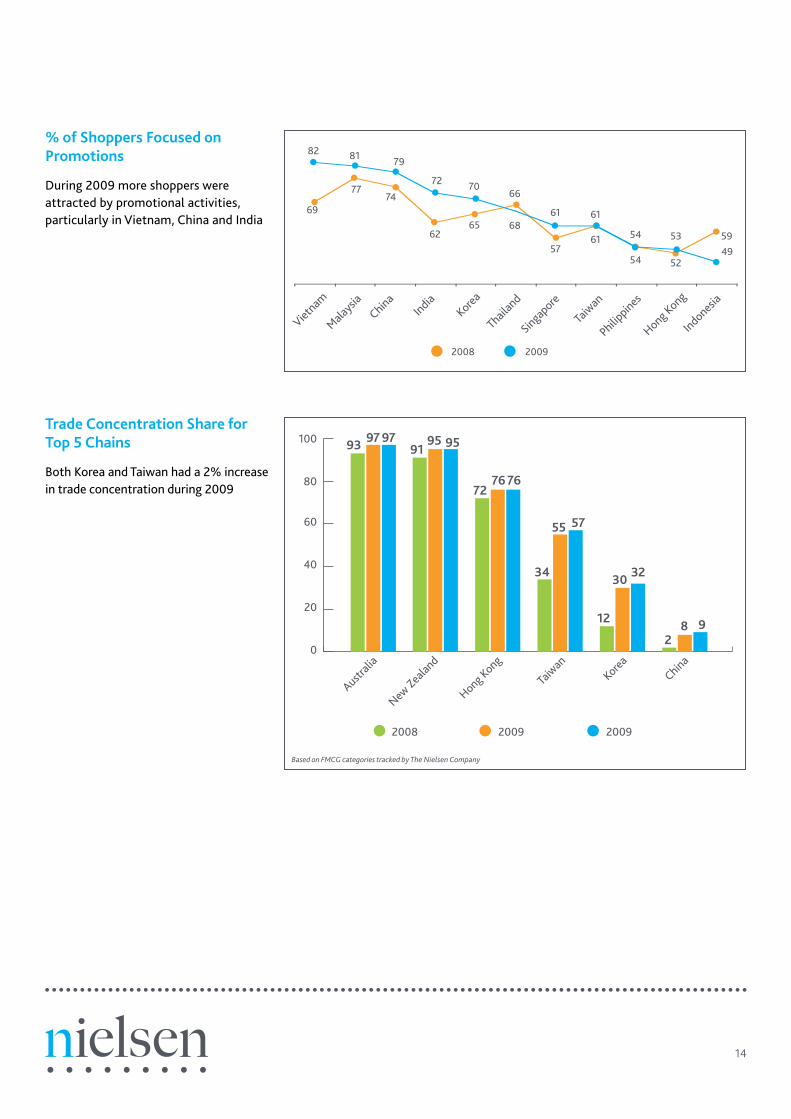
% of Shoppers Focused on Promotions
During 2009 more shoppers were attracted by promotional activities, particularly in Vietnam, China and India
Trade Concentration Share for Top 5 Chains
Both Korea and Taiwan had a 2% increase in trade concentration during 2009
2008 2009
82 81 79
69
7774
72
6265
7066
61 61
54 53 5949
5254
6157
68
Singapore
Philippines
Taiw
an
India
Thailan
d
Malaysia
Indonesia
China Korea
Vietnam
Hong Kong
2008 2009
Australi
aChina
Korea
Taiw
an
Hong Kong
2009
0
20
40
60
80
100
New Zea
land
93 97 9791
95 95
7276 76
34
55 57
12
30 32
28 9
Based on FMCG categories tracked by The Nielsen Company
15
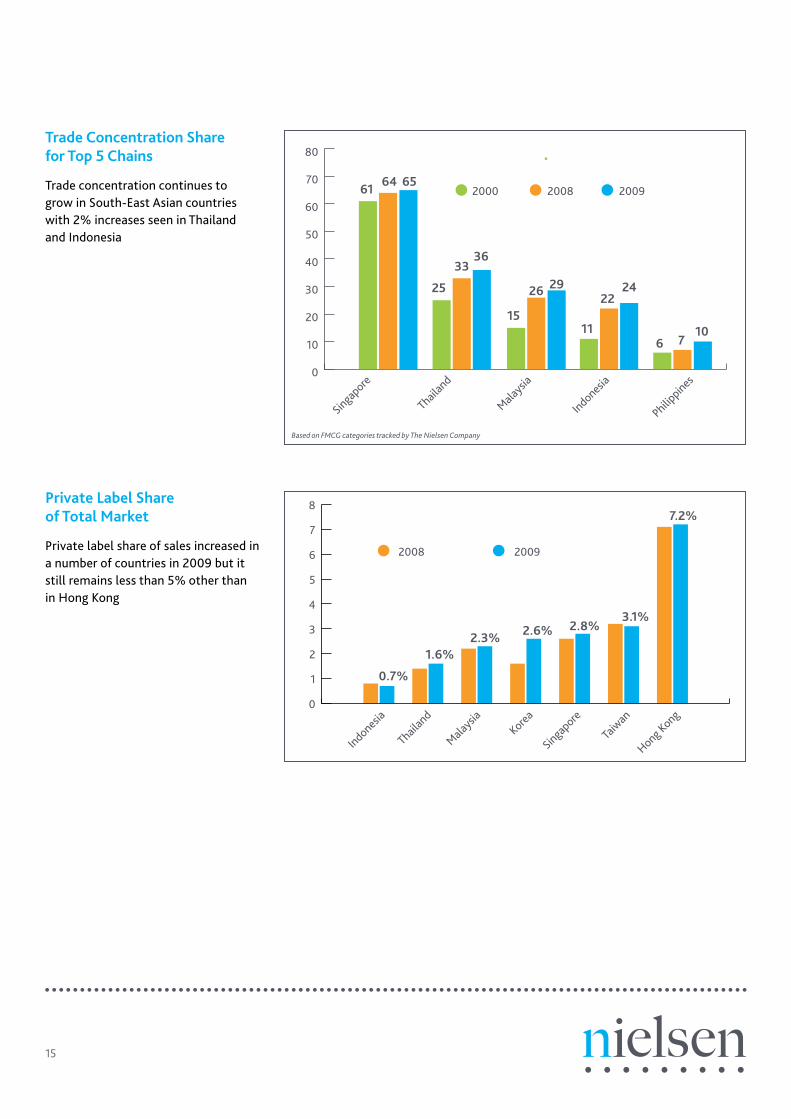
Trade Concentration Share for Top 5 Chains
Trade concentration continues to grow in South-East Asian countries with 2% increases seen in Thailand and Indonesia
Private Label Share of Total Market
Private label share of sales increased in a number of countries in 2009 but it still remains less than 5% other than in Hong Kong
2000 2008
Singapore
Philippines
Thailan
d
Malaysia
Indonesia
2009
0
10
20
30
40
50
60
70
80
61 64 65
25
3336
1511 10
2224
6 7
2926
2008 2009
Indonesia
0
1
2
3
4
5
6
7
87.2%
Thailan
d
Malaysia
Korea
Singapore
Taiw
an
Hong Kong
3.1%2.8%2.6%2.3%
1.6%
0.7%
Based on FMCG categories tracked by The Nielsen Company
16
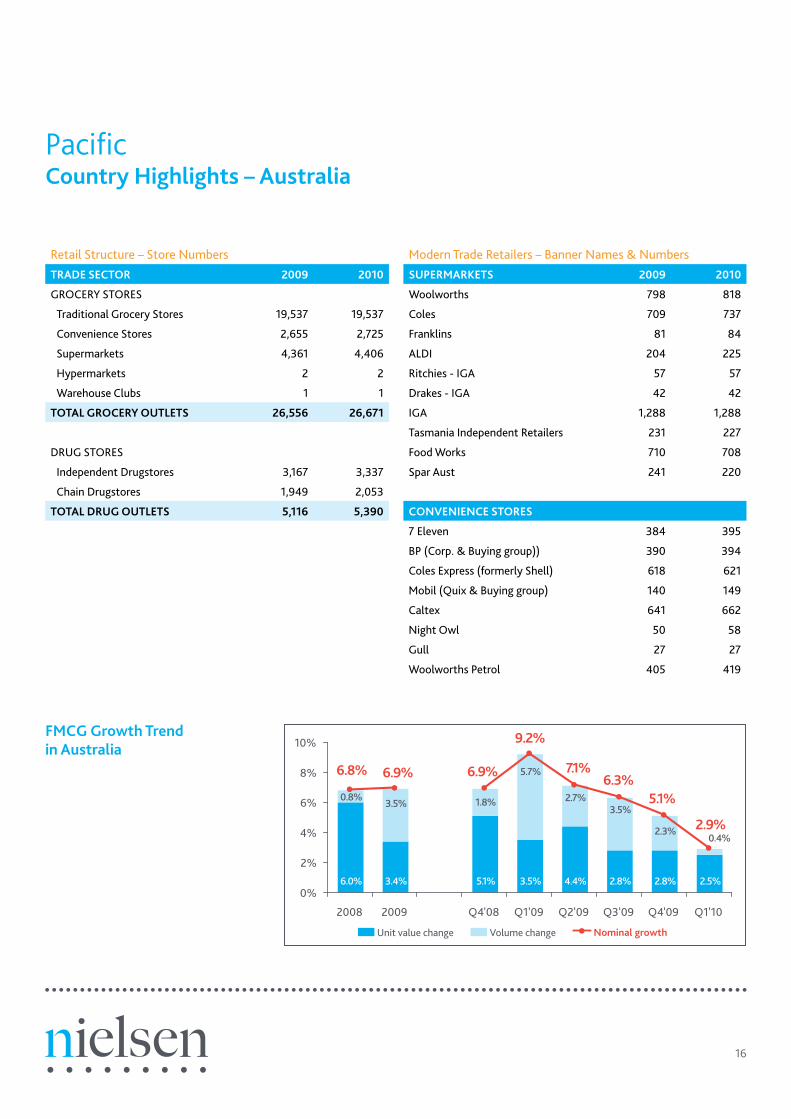
PacificCountry Highlights – Australia
Retail Structure – Store NumbersTRADE SECTOR 2009 2010
GROCERY STORES
Traditional Grocery Stores 19,537 19,537
Convenience Stores 2,655 2,725
Supermarkets 4,361 4,406
Hypermarkets 2 2
Warehouse Clubs 1 1
TOTAL GROCERY OUTLETS 26,556 26,671
DRUG STORES
Independent Drugstores 3,167 3,337
Chain Drugstores 1,949 2,053
TOTAL DRUG OUTLETS 5,116 5,390
Modern Trade Retailers – Banner Names & NumbersSUPERMARKETS 2009 2010
Woolworths 798 818
Coles 709 737
Franklins 81 84
ALDI 204 225
Ritchies - IGA 57 57
Drakes - IGA 42 42
IGA 1,288 1,288
Tasmania Independent Retailers 231 227
Food Works 710 708
Spar Aust 241 220
CONVENIENCE STORES
7 Eleven 384 395
BP (Corp. & Buying group)) 390 394
Coles Express (formerly Shell) 618 621
Mobil (Quix & Buying group) 140 149
Caltex 641 662
Night Owl 50 58
Gull 27 27
Woolworths Petrol 405 419
6.0% 3.4% 5.1% 3.5% 4.4% 2.8% 2.8% 2.5%
1.8%
5.7%
2.7%3.5%
0.4%
0.8%3.5%
2.3%
6.9%
9.2%
6.3%5.1%
2.9%
6.8% 6.9% 7.1%
2008 2009 Q4'08 Q1'09 Q2'09 Q3'09 Q4'09 Q1'10
0%
2%
4%
6%
8%
10%
Unit value change Volume change Nominal growth
FMCG Growth Trendin Australia

17
PacificCountry Highlights – New Zealand
Retail Structure – Store NumbersTRADE SECTOR 2009 2010
GROCERY STORES
Dairies 2897 2897
Convenience Stores 1435 1460
Supermarkets 381 388
TOTAL GROCERY OUTLETS 4,713 4,745
DRUG STORES
Pharmacies 962 931
TOTAL DRUG OUTLETS 5,116 5,390
Modern Trade Retailers – Banner Names & NumbersSUPERMARKETS 2009 2010
Pak'N Save 47 48
New World 134 134
Foodtown 29 20
Countdown 63 103
Super Value 52 54
Woolworth's 56 29
CONVENIENCE STORES
Caltex 115 109
BP Connect/Express 78 78
Mobil Pegasus/On the Run 86 86
Shell Select 214 203
Gull 35 35
18
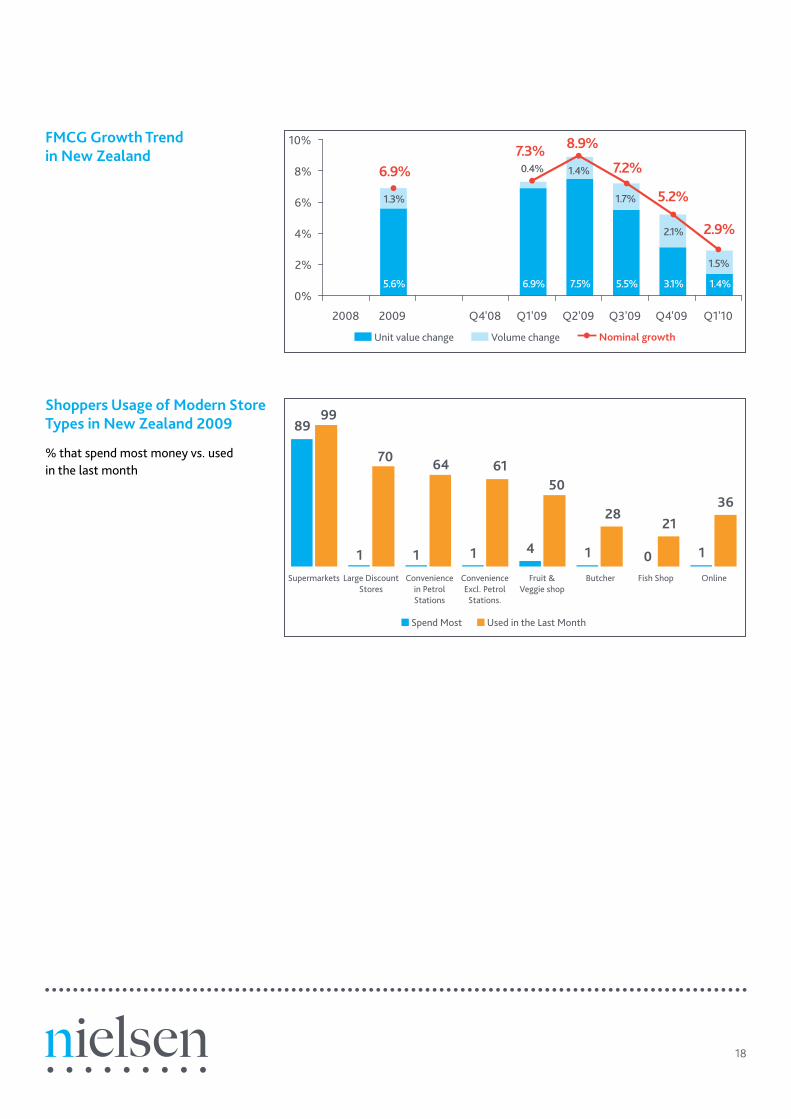
Shoppers Usage of Modern Store Types in New Zealand 2009
% that spend most money vs. used in the last month
1 1
2821
36
89
1 1 41
99
70 64 6150
Supermarkets Large DiscountStores
Conveniencein PetrolStations
ConvenienceExcl. Petrol
Stations.
Fruit &Veggie shop
Butcher Fish Shop Online
0
Spend Most Used in the Last Month
5.6% 6.9% 7.5% 5.5% 3.1% 1.4%
0.4% 1.4%
1.7%
1.5%
1.3%
2.1%
7.3%7.2%
5.2%
2.9%
6.9%
8.9%
2008 2009 Q4'08 Q1'09 Q2'09 Q3'09 Q4'09 Q1'10
0%
2%
4%
6%
8%
10%
Unit value change Volume change Nominal growth
FMCG Growth Trend in New Zealand
19
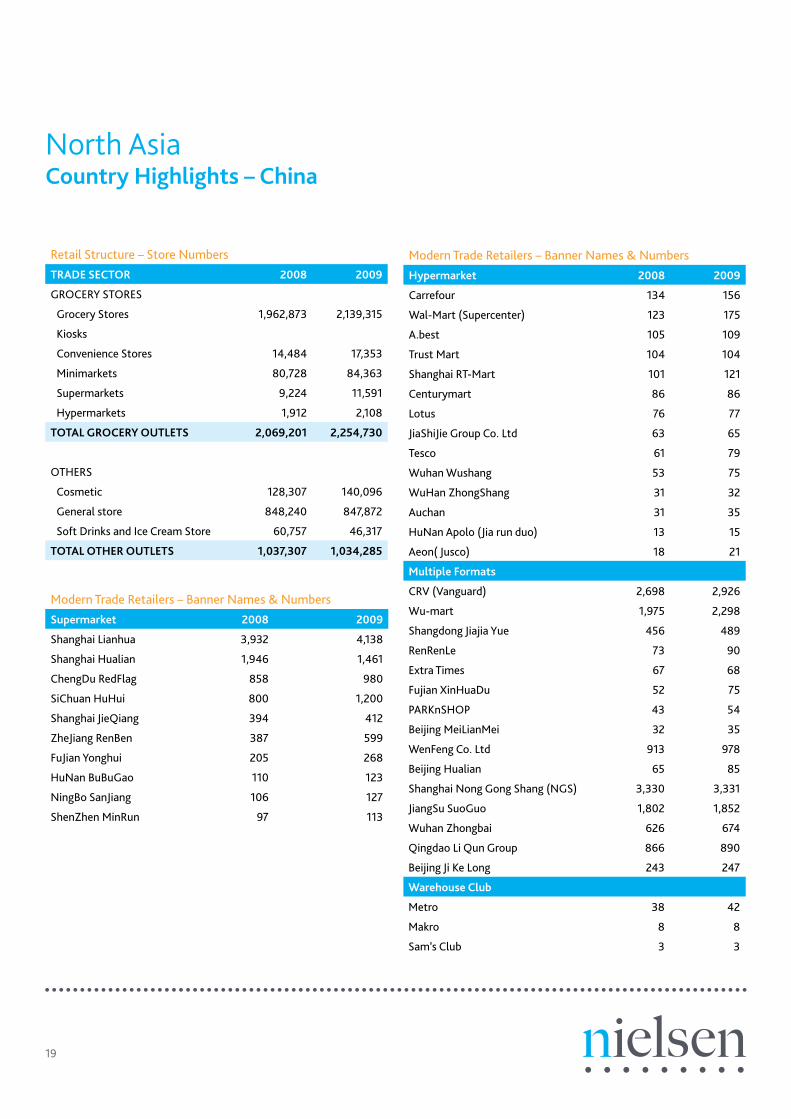
North Asia Country Highlights – China
Retail Structure – Store NumbersTRADE SECTOR 2008 2009
GROCERY STORES
Grocery Stores 1,962,873 2,139,315
Kiosks
Convenience Stores 14,484 17,353
Minimarkets 80,728 84,363
Supermarkets 9,224 11,591
Hypermarkets 1,912 2,108
TOTAL GROCERY OUTLETS 2,069,201 2,254,730
OTHERS
Cosmetic 128,307 140,096
General store 848,240 847,872
Soft Drinks and Ice Cream Store 60,757 46,317
TOTAL OTHER OUTLETS 1,037,307 1,034,285
Modern Trade Retailers – Banner Names & NumbersHypermarket 2008 2009
Carrefour 134 156
Wal-Mart (Supercenter) 123 175
A.best 105 109
Trust Mart 104 104
Shanghai RT-Mart 101 121
Centurymart 86 86
Lotus 76 77
JiaShiJie Group Co. Ltd 63 65
Tesco 61 79
Wuhan Wushang 53 75
WuHan ZhongShang 31 32
Auchan 31 35
HuNan Apolo (Jia run duo) 13 15
Aeon( Jusco) 18 21
Multiple Formats
CRV (Vanguard) 2,698 2,926
Wu-mart 1,975 2,298
Shangdong Jiajia Yue 456 489
RenRenLe 73 90
Extra Times 67 68
Fujian XinHuaDu 52 75
PARKnSHOP 43 54
Beijing MeiLianMei 32 35
WenFeng Co. Ltd 913 978
Beijing Hualian 65 85
Shanghai Nong Gong Shang (NGS) 3,330 3,331
JiangSu SuoGuo 1,802 1,852
Wuhan Zhongbai 626 674
Qingdao Li Qun Group 866 890
Beijing Ji Ke Long 243 247
Warehouse Club
Metro 38 42
Makro 8 8
Sam’s Club 3 3
Modern Trade Retailers – Banner Names & NumbersSupermarket 2008 2009
Shanghai Lianhua 3,932 4,138
Shanghai Hualian 1,946 1,461
ChengDu RedFlag 858 980
SiChuan HuHui 800 1,200
Shanghai JieQiang 394 412
ZheJiang RenBen 387 599
FuJian Yonghui 205 268
HuNan BuBuGao 110 123
NingBo SanJiang 106 127
ShenZhen MinRun 97 113

20
Shoppers Usage of Modern Store Types in China 2009
% that spend most money vs. used in the last month
China Share of Trade
In China, Hypermarkets gained 1% share of market during 2009 as the traditional trade continued to slowly lose share
2.0% 2.9%1.3%
0.9% 1.0%
2.2%
-1.2% -0.7%
0.2%
8.8%
1.0%8.2%
1.7% 1.1%
9.2%11.0%
3.0%
0.6%
2008 2009 Q4'08 Q1'09 Q2'09 Q3'09 Q4'09 Q1'10
-2%
0%
2%
4%
6%
8%
10%
12%
Unit value change Volume change Nominal growth
62
20
1 0
9077
26
8
Hypermarkets Supermarkets Convenience Stores Personal Care/ Drugstores
Spend Most Used in last Month
26.6
36.7 36.7
27.7
36.7 35.6
Hypermarket Other Modern Trade Traditional Grocery
2008 2009
FMCG Growth Trendin China
Based on FMCG categories tracked by The Nielsen Company
21
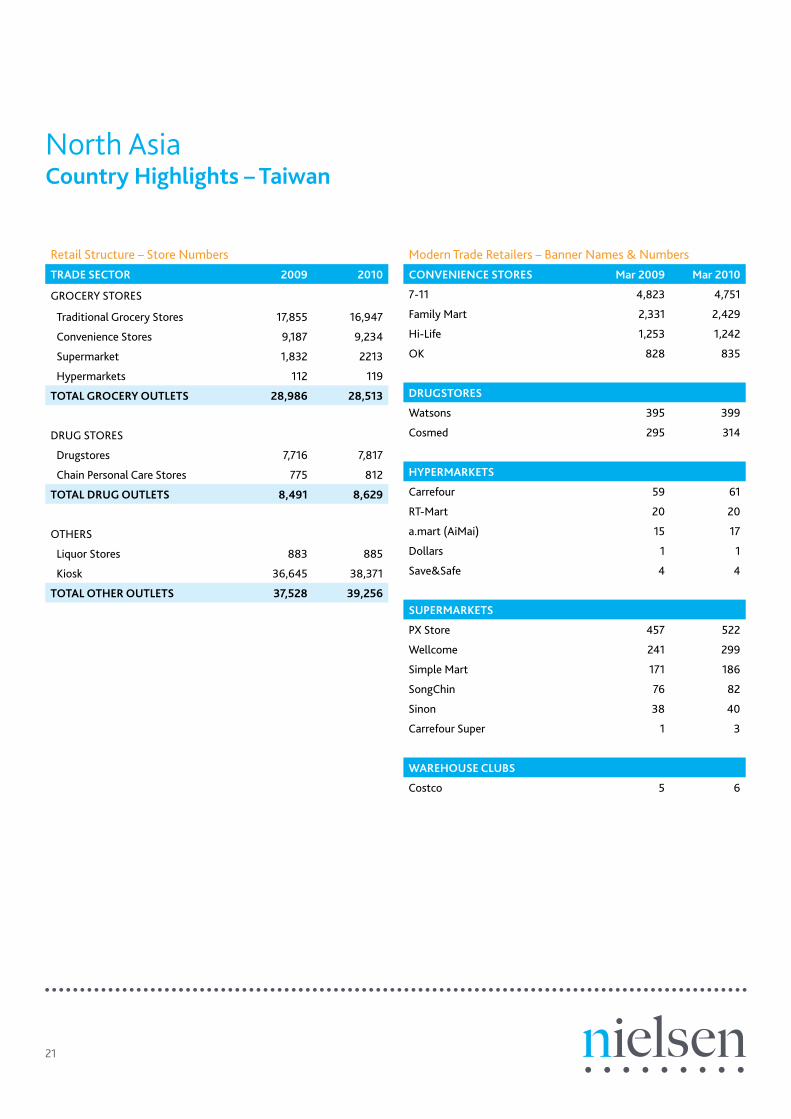
North Asia Country Highlights – Taiwan
Retail Structure – Store NumbersTRADE SECTOR 2009 2010
GROCERY STORES
Traditional Grocery Stores 17,855 16,947
Convenience Stores 9,187 9,234
Supermarket 1,832 2213
Hypermarkets 112 119
TOTAL GROCERY OUTLETS 28,986 28,513
DRUG STORES
Drugstores 7,716 7,817
Chain Personal Care Stores 775 812
TOTAL DRUG OUTLETS 8,491 8,629
OTHERS
Liquor Stores 883 885
Kiosk 36,645 38,371
TOTAL OTHER OUTLETS 37,528 39,256
Modern Trade Retailers – Banner Names & NumbersCONVENIENCE STORES Mar 2009 Mar 2010
7-11 4,823 4,751
Family Mart 2,331 2,429
Hi-Life 1,253 1,242
OK 828 835
DRUGSTORES
Watsons 395 399
Cosmed 295 314
HYPERMARKETS
Carrefour 59 61
RT-Mart 20 20
a.mart (AiMai) 15 17
Dollars 1 1
Save&Safe 4 4
SUPERMARKETS
PX Store 457 522
Wellcome 241 299
Simple Mart 171 186
SongChin 76 82
Sinon 38 40
Carrefour Super 1 3
WAREHOUSE CLUBS
Costco 5 6

22
Taiwan Share of Trade
Chain supermarkets and modern personal care stores continued to show the strongest performance in Taiwan during 2009
Shoppers Usage of Modern Store Types in Taiwan 2009
% that spend most money vs. used in the last month
4.6%
1.3%
4.4%2.9%
1.8%
-0.7%-1.3%
-0.6%-3.9%
0.0%
-1.1%
3.9% 1.2%
-6.2%
1.2% 4.3%
0.5% 2.9% 3.2% 3.0%
0.6%
-1.6%
2.5% 0.7%
2008 2009 Q4'08 Q1'09 Q2'09 Q3'09 Q4'09 Q1'10-8%
-6%
-4%
-2%
0%
2%
4%
6%
Unit value change Volume change Nominal growth
FMCG Growth Trendin Taiwan
Hypermarkets Supermarkets ConvenienceStores
Personal Care/Drugstores
Post Exchange
Spend Most Used in the Last Month
40
717
321
5944
95
27
63
22.918.2
9.6
28.7
11.96.8
1.9
22.3 19.9
9.0
28.8
12.46.0
1.6
Hypermarkets ChainSuper
OtherSuper
ConvenienceStore
Drugstores Traditional Other
2008 2009
Based on FMCG categories tracked by The Nielsen Company
* Taipei, Kaohsiung, Taichung,
23
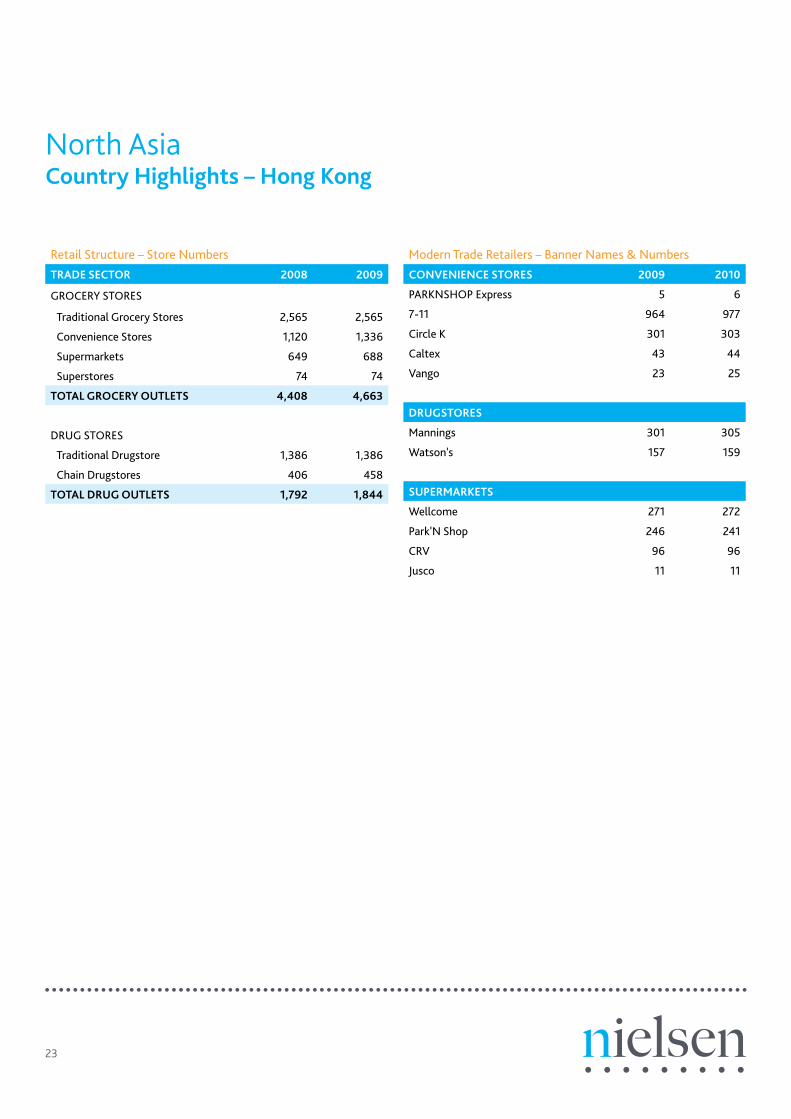
North Asia Country Highlights – Hong Kong
Retail Structure – Store NumbersTRADE SECTOR 2008 2009
GROCERY STORES
Traditional Grocery Stores 2,565 2,565
Convenience Stores 1,120 1,336
Supermarkets 649 688
Superstores 74 74
TOTAL GROCERY OUTLETS 4,408 4,663
DRUG STORES
Traditional Drugstore 1,386 1,386
Chain Drugstores 406 458
TOTAL DRUG OUTLETS 1,792 1,844
Modern Trade Retailers – Banner Names & NumbersCONVENIENCE STORES 2009 2010
PARKNSHOP Express 5 6
7-11 964 977
Circle K 301 303
Caltex 43 44
Vango 23 25
DRUGSTORES
Mannings 301 305
Watson's 157 159
SUPERMARKETS
Wellcome 271 272
Park'N Shop 246 241
CRV 96 96
Jusco 11 11
24
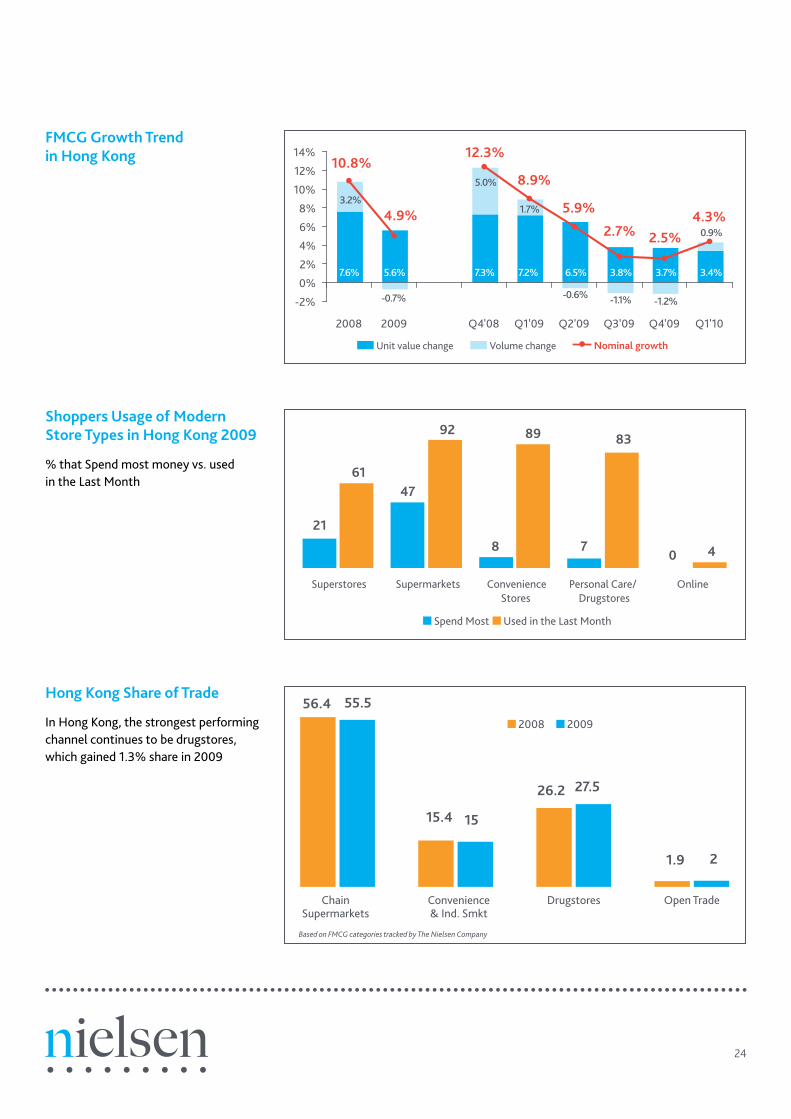
Shoppers Usage of Modern Store Types in Hong Kong 2009
% that Spend most money vs. used in the Last Month
Hong Kong Share of Trade
In Hong Kong, the strongest performing channel continues to be drugstores, which gained 1.3% share in 2009
7.6% 5.6% 7.3% 7.2% 6.5% 3.8% 3.7% 3.4%
5.0%
1.7%
-0.6% -1.1%
0.9%
3.2%
-0.7% -1.2%
12.3%
8.9%
2.7% 2.5%4.3%
10.8%
4.9% 5.9%
2008 2009 Q4'08 Q1'09 Q2'09 Q3'09 Q4'09 Q1'10
-2%
0%
2%
4%
6%
8%
10%
12%
14%
Unit value change Volume change Nominal growth
70
8
47
21
4
838992
61
Superstores Supermarkets ConvenienceStores
Personal Care/ Drugstores
Online
Spend Most Used in the Last Month
Open TradeChain Supermarkets
Convenience& Ind. Smkt
Drugstores
21.9
27.526.2
1515.4
56.4 55.52008 2009
FMCG Growth Trend in Hong Kong
Based on FMCG categories tracked by The Nielsen Company
25
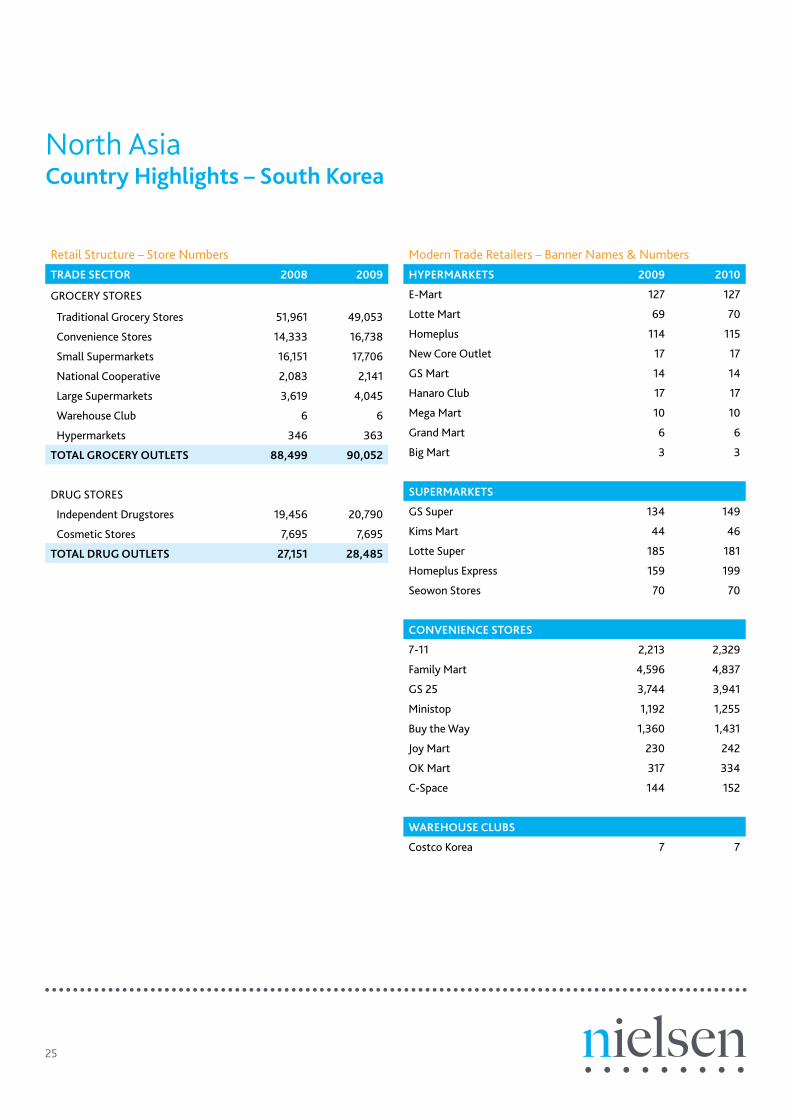
North Asia Country Highlights – South Korea
Retail Structure – Store NumbersTRADE SECTOR 2008 2009
GROCERY STORES
Traditional Grocery Stores 51,961 49,053
Convenience Stores 14,333 16,738
Small Supermarkets 16,151 17,706
National Cooperative 2,083 2,141
Large Supermarkets 3,619 4,045
Warehouse Club 6 6
Hypermarkets 346 363
TOTAL GROCERY OUTLETS 88,499 90,052
DRUG STORES
Independent Drugstores 19,456 20,790
Cosmetic Stores 7,695 7,695
TOTAL DRUG OUTLETS 27,151 28,485
Modern Trade Retailers – Banner Names & NumbersHYPERMARKETS 2009 2010
E-Mart 127 127
Lotte Mart 69 70
Homeplus 114 115
New Core Outlet 17 17
GS Mart 14 14
Hanaro Club 17 17
Mega Mart 10 10
Grand Mart 6 6
Big Mart 3 3
SUPERMARKETS
GS Super 134 149
Kims Mart 44 46
Lotte Super 185 181
Homeplus Express 159 199
Seowon Stores 70 70
CONVENIENCE STORES
7-11 2,213 2,329
Family Mart 4,596 4,837
GS 25 3,744 3,941
Ministop 1,192 1,255
Buy the Way 1,360 1,431
Joy Mart 230 242
OK Mart 317 334
C-Space 144 152
WAREHOUSE CLUBS
Costco Korea 7 7

26
Shoppers Usage of Modern Store Types in Korea 2009
% that spend most money vs. used in the last month
Korea Share Of Trade
Chain supermarkets and convenience stores gained share in Korea while Hypermarkets lost 1 share point in 2009
0.0%
-2.8% 1.0%
2.3% 4.1% 4.6%
9.1%
8.9%
7.7%5.3%
1.2%
-0.2%
7.5%
4.3%
8.9% 6.1% 7.6% 8.4%
5.8%7.5%
8.7%
2008 2009 Q4'08 Q1'09 Q2'09 Q3'09 Q4'09 Q1'10-4%
-2%
0%
2%
4%
6%
8%
10%
Unit value change Volume change Nominal growth
0 41
23
58716059
8998
Hypermarket Supermarket ConvenienceStore
Pharmacy Online
Spend most money Used in the last Month
31.6
9.4 10.1 11.8 12.5 10.613.9
30.6
10.2 10.1 12.5 12.3 10.6 13.7
Hypermarkets ChainSupermarkets
IndependentSupermarkets
Convenience Minimarkets NationalCoop
TraditionalTrade
2008 2009
FMCG Growth Trend in South Korea
Based on 71 FMCG categories tracked by The Nielsen Company

27
South-East Asia Country Highlights – Singapore
Retail Structure – Store NumbersTRADE SECTOR 2008 2009
GROCERY STORES
Traditional Grocery Stores 1,675 1,639
Convenience Stores 449 492
Petrol Convenience Stores 200 200
Supermarkets 239 253
Minimarket 503 503
Hypermarkets 12 12
TOTAL GROCERY OUTLETS 3,078 3,099
DRUG STORES
Traditional Medical Stores 312 304
Chain Drugstore 264 279
TOTAL DRUG OUTLETS 576 583
Modern Trade Retailers – Banner Names & NumbersHYPERMARKETS Mar 2009 Feb 2010
Giant 8 8
Carrefour 2 2
FairPrice Xtra 3 3
SUPERMARKETS
NTUC FairPrice 85 94
Cold Storage 41 45
Shop N Save 50 50
Sheng Siong 22 23
CONVENIENCE STORES
7-Eleven (Petrol Mart) 64 64
7-Eleven 367 420
SPC 38 38
Caltex 30 30
Cheers 65 75
Cheers by FairPrice 48 44
FairPrice Xpress 19 21
MINIMARKET
Econ Minimart 3 0
i-econ 97 94
DRUGSTORES
Guardian 117 126
Watson's 100 103
Unity Healthcare 39 43
28
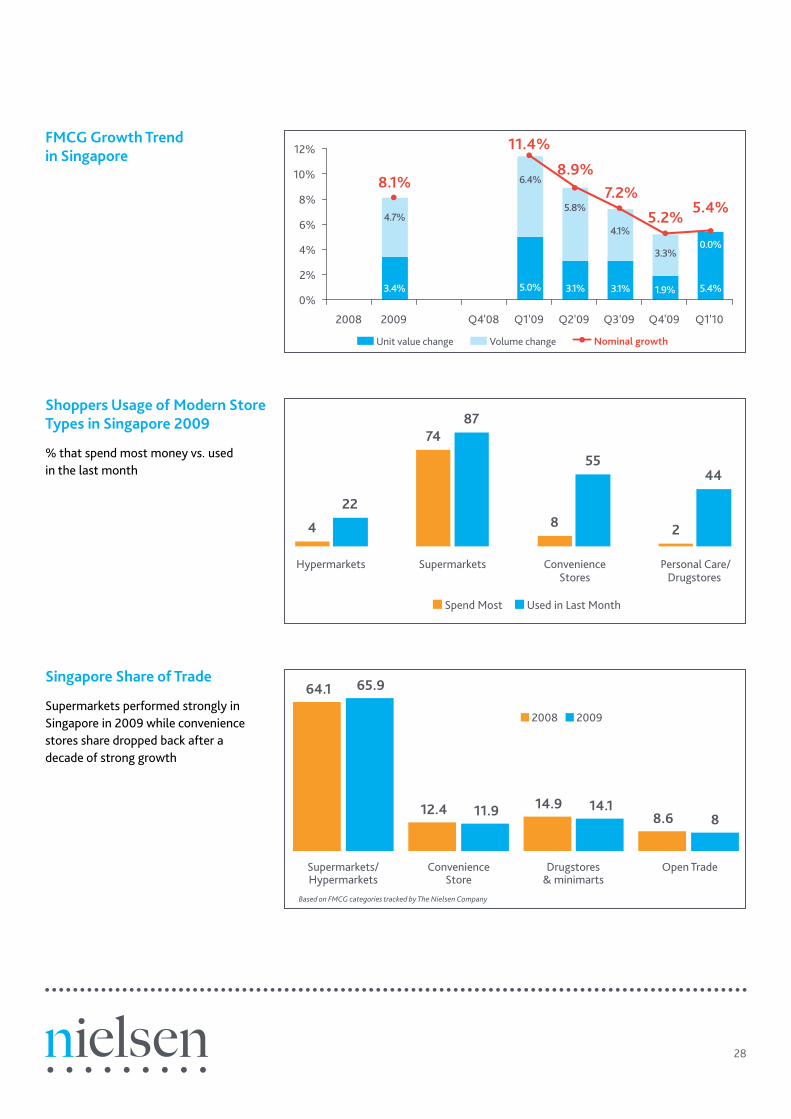
Shoppers Usage of Modern Store Types in Singapore 2009
% that spend most money vs. used in the last month
Singapore Share of Trade
Supermarkets performed strongly in Singapore in 2009 while convenience stores share dropped back after a decade of strong growth
3.4% 5.0% 3.1% 3.1% 1.9% 5.4%
6.4%
5.8%
4.1%0.0%
4.7%
3.3%
11.4%
7.2%
5.2%5.4%
8.1%8.9%
2008 2009 Q4'08 Q1'09 Q2'09 Q3'09 Q4'09 Q1'10
0%
2%
4%
6%
8%
10%
12%
Unit value change Volume change Nominal growth
4
74
8 2
22
87
5544
Hypermarkets Supermarkets ConvenienceStores
Personal Care/Drugstores
Spend Most Used in Last Month
64.1
12.4 14.98.6
65.9
11.9 14.18
Supermarkets/Hypermarkets
ConvenienceStore
Drugstores& minimarts
Open Trade
2008 2009
FMCG Growth Trend in Singapore
Based on FMCG categories tracked by The Nielsen Company

29
South-East Asia Country Highlights – Malaysia
Retail Structure – Store NumbersTRADE SECTOR 2008 2009
GROCERY STORES
Provision Shops 30,611 30,357
Convenience Stores 3,184 3,293
Supermarket 735 753
Hypermarkets 84 96
TOTAL GROCERY OUTLETS 34,614 34,499
DRUG STORES
Traditional Medical Store 2,476 2,322
Chain/Independent Drugstore 1,925 2,012
Sundry toiletry stores 3,009 2,782
TOTAL DRUG OUTLETS 7,410 7,116
Modern Trade Retailers – Banner Names & NumbersHYPERMARKETS 2009 2010
Giant 32 36
Carrefour 17 22
Sunshine 1 1
Tesco 21 24
Tesco Extra 8 8
SUPERMARKETS
The Store 74 52
Billion 32 30
Sunshine 5 3
Ngiu Kee 10 9
Jusco 21 25
Giant 63 65
Cold Storage 22 19
CONVENIENCE STORES
7-Eleven 998 1,016
Petronas 550 579
Shell Select 283 336
Caltex Starmart 211 203
Mobil 201 201
BHP 165 145
Esso 164 164
DRUGSTORES
Guardian 331 343
Watsons 208 209
PharmaCare 16 9
MINIMARKET
99 Speedmart 123 174
30
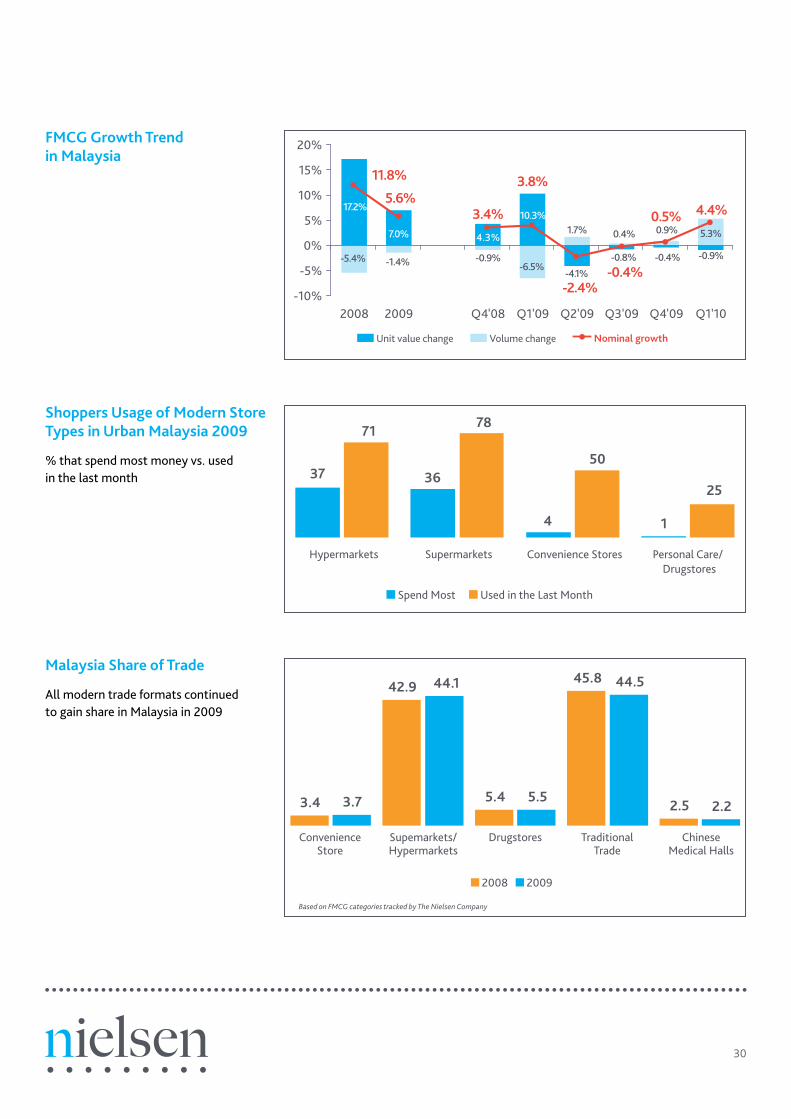
Shoppers Usage of Modern Store Types in Urban Malaysia 2009
% that spend most money vs. used in the last month
Malaysia Share of Trade
All modern trade formats continued to gain share in Malaysia in 2009
17.2%
7.0% 4.3%
10.3%
-4.1%
-0.8% -0.4%-6.5%
1.7% 0.4% 5.3%
-0.9%
0.9%
-0.9%-1.4%-5.4%
3.4%
3.8%
0.5%
-0.4%
4.4%
-2.4%
5.6%
11.8%
2008 2009 Q4'08 Q1'09 Q2'09 Q3'09 Q4'09 Q1'10-10%
-5%
0%
5%
10%
15%
20%
Unit value change Volume change Nominal growth
14
363725
50
7871
Hypermarkets Supermarkets Convenience Stores Personal Care/ Drugstores
Spend Most Used in the Last Month
3.4
42.9
5.4
45.8
2.53.7
44.1
5.5
44.5
2.2
ConvenienceStore
Supemarkets/Hypermarkets
Drugstores TraditionalTrade
ChineseMedical Halls
2008 2009
FMCG Growth Trend in Malaysia
Based on FMCG categories tracked by The Nielsen Company
31
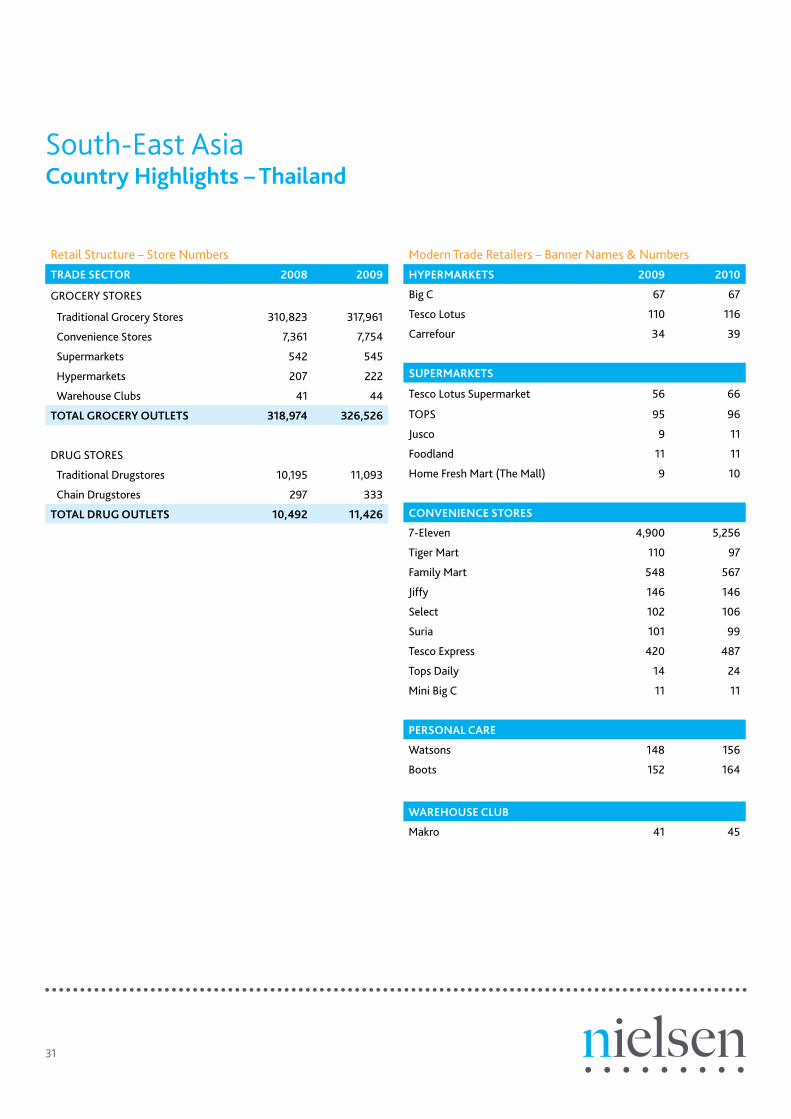
South-East Asia Country Highlights – Thailand
Retail Structure – Store NumbersTRADE SECTOR 2008 2009
GROCERY STORES
Traditional Grocery Stores 310,823 317,961
Convenience Stores 7,361 7,754
Supermarkets 542 545
Hypermarkets 207 222
Warehouse Clubs 41 44
TOTAL GROCERY OUTLETS 318,974 326,526
DRUG STORES
Traditional Drugstores 10,195 11,093
Chain Drugstores 297 333
TOTAL DRUG OUTLETS 10,492 11,426
Modern Trade Retailers – Banner Names & NumbersHYPERMARKETS 2009 2010
Big C 67 67
Tesco Lotus 110 116
Carrefour 34 39
SUPERMARKETS
Tesco Lotus Supermarket 56 66
TOPS 95 96
Jusco 9 11
Foodland 11 11
Home Fresh Mart (The Mall) 9 10
CONVENIENCE STORES
7-Eleven 4,900 5,256
Tiger Mart 110 97
Family Mart 548 567
Jiffy 146 146
Select 102 106
Suria 101 99
Tesco Express 420 487
Tops Daily 14 24
Mini Big C 11 11
PERSONAL CARE
Watsons 148 156
Boots 152 164
WAREHOUSE CLUB
Makro 41 45

32
Shoppers Usage of Modern Store Types in Urban Thailand 2009
% that spend most money vs. used in the last month
Thailand Share of Trade
Convenience stores in Thailand remain one the fastest growing trade channels in the region, reaching 16.3% in 2009
5.1%
3.3% 4.6% 3.2% 3.1% 3.0% 3.5% 2.3%
5.0%
4.5%3.0%
2.3%3.8%
5.8%
3.5% 4.5%
9.6%
7.7%
5.3%
8.0%
6.1%
10.9%
6.8% 6.1%
2008 2009 Q4'08 Q1'09 Q2'09 Q3'09 Q4'09 Q1'10
0%
2%
4%
6%
8%
10%
12%
Unit value change Volume change Nominal growth
64
225 0
90
61
86
12
Hypermarkets Supermarkets Convenience Stores Personal Care/ Drugstores
Spend Most Used in Last Month
30.5
14.7
54.8
30.1
16.3
53.5
Super/Hypermarket Convenience Store Open Trade
2008 2009
FMCG Growth Trend in Thailand
Based on FMCG categories tracked by The Nielsen Company excluding cigarettes

33
South-East Asia Country Highlights – Indonesia
Retail Structure – Store NumbersTRADE SECTOR 2008 2009
GROCERY STORES
Traditional Grocery Stores 2,469,465 2,520,757
Convenience Stores 267 358
Minimarket 10,607 11,569
Supermarket 1,571 1,146
Hypermarkets 127 141
Warehouse Clubs 26 26
TOTAL GROCERY OUTLETS 2,482,063 2,533,997
DRUG STORES
Traditional Drugstores 18,193 18,597
Chain Drugstores 419 463
TOTAL DRUG OUTLETS 18,612 19,060
Modern Trade Retailers – Banner Names & NumbersCONVENIENCE STORES 2009 2010
Circle K 238 259
Mini Mart 36 36
Am/pm 28 28
Alfa Express 32
7-Eleven 3
PETROL STORES
Bright (Pertamina) 42 96
Select (Shell) 36 45
Surya (Petronas) 21
Bonjour (Total) 3
DRUG STORES
Century 193 208
Guardian 189 196
Boston 51 53
Shop In 2 2
Watsons 4 4
HYPERMARKETS
Carrefour 42 45
Carrefour ex ALFA 16 16
Giant 26 34
Hypermart 43 46
MINIMARKETS
Indomaret 3,312 3,892
Alfamart 2,896 3,422
Star Mart 122 124
Yomart 177 220
Alfa MIDI 60 109
Modern Trade Retailers – Banner Names & NumbersSUPERMARKETS 2009 2010
Hero 52 41
Giant 55 59
Ramayana 93 93
Matahari / Foodmart 23 23
Carrefour Express 14 15
Yogya and Griya 56 57
Super Indo 64 65
Gelael 15 15
Borma 23 24
Macan Yaohan 8 13
Hardy's 11 13
Sri Ratu 8 7
WAREHOUSE CLUBS
Makro/Lotte 19 19
Indogrosir 6 6
Goro 1 1

34
Shoppers Usage of Modern Store Types in Urban Indonesia 2009
% that spend most money vs. used in the last month
Indonesia Share of Trade
The story remains the same in Indonesia with the growth coming from the mini-market format which gained a further 2 share points to over 17% of total FMCG sales
14.8% 6.1% 14.8% 10.4% 6.4% 3.4% 2.7% 2.2%
1.0%
-3.5% -2.6% -1.4%
6.2%
6.3%
-1.4%
0.3%
15.8%
6.9%
2.0%3.0%
8.4%
21.1%
4.7% 3.8%
2008 2009 Q4'08 Q1'09 Q2'09 Q3'09 Q4'09 Q1'10
-5%
0%
5%
10%
15%
20%
25%
Unit value change Volume change Nominal growth
0
302415 13
78
5445
Hypermarkets Supermakets Minimarts Personal Care Stores
Spend Most Used in the Last Month
21.115.4
63.5
20.9 17.2
61.8
Hyper/ Supermarkets Minimarkets Traditional Grocery
2008 2009
FMCG Growth Trend in Indonesia
Based on FMCG categories tracked by The Nielsen Company
* Jakarta-Tangerang-Bekasi-Depok, Bandung, Surabaya and Makasar
35
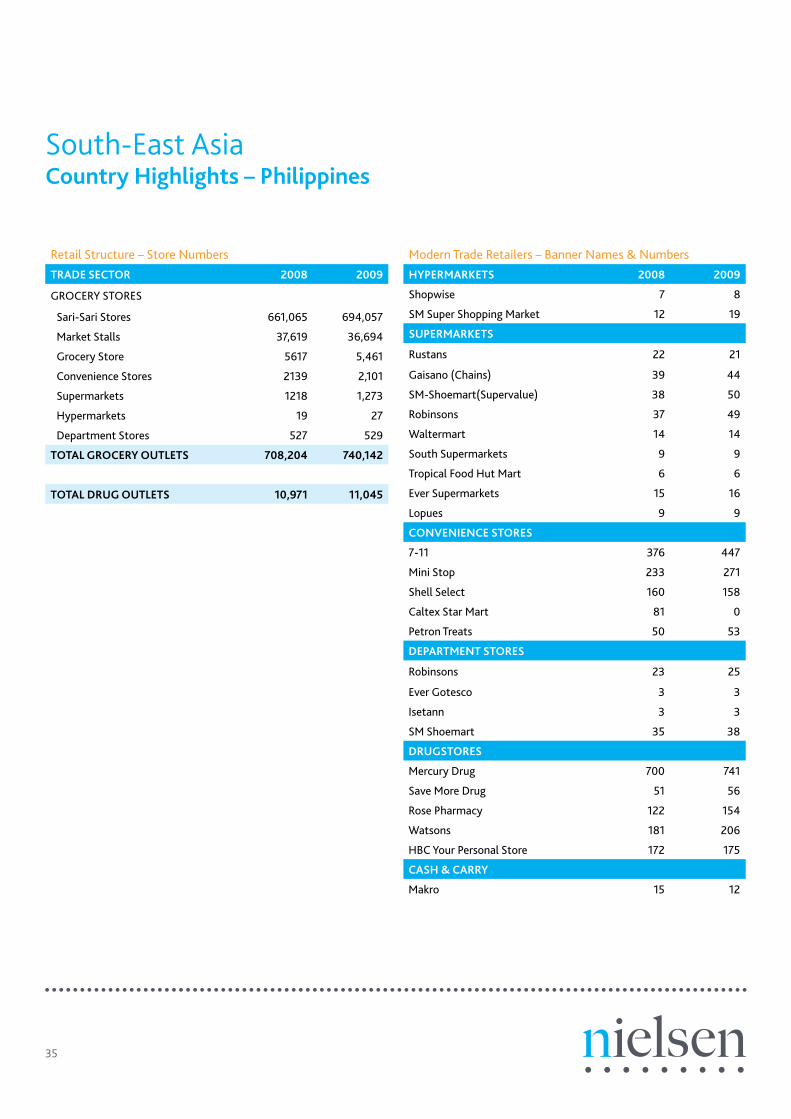
South-East Asia Country Highlights – Philippines
Retail Structure – Store NumbersTRADE SECTOR 2008 2009
GROCERY STORES
Sari-Sari Stores 661,065 694,057
Market Stalls 37,619 36,694
Grocery Store 5617 5,461
Convenience Stores 2139 2,101
Supermarkets 1218 1,273
Hypermarkets 19 27
Department Stores 527 529
TOTAL GROCERY OUTLETS 708,204 740,142
TOTAL DRUG OUTLETS 10,971 11,045
Modern Trade Retailers – Banner Names & NumbersHYPERMARKETS 2008 2009
Shopwise 7 8
SM Super Shopping Market 12 19
SUPERMARKETS
Rustans 22 21
Gaisano (Chains) 39 44
SM-Shoemart(Supervalue) 38 50
Robinsons 37 49
Waltermart 14 14
South Supermarkets 9 9
Tropical Food Hut Mart 6 6
Ever Supermarkets 15 16
Lopues 9 9
CONVENIENCE STORES
7-11 376 447
Mini Stop 233 271
Shell Select 160 158
Caltex Star Mart 81 0
Petron Treats 50 53
DEPARTMENT STORES
Robinsons 23 25
Ever Gotesco 3 3
Isetann 3 3
SM Shoemart 35 38
DRUGSTORES
Mercury Drug 700 741
Save More Drug 51 56
Rose Pharmacy 122 154
Watsons 181 206
HBC Your Personal Store 172 175
CASH & CARRY
Makro 15 12
36
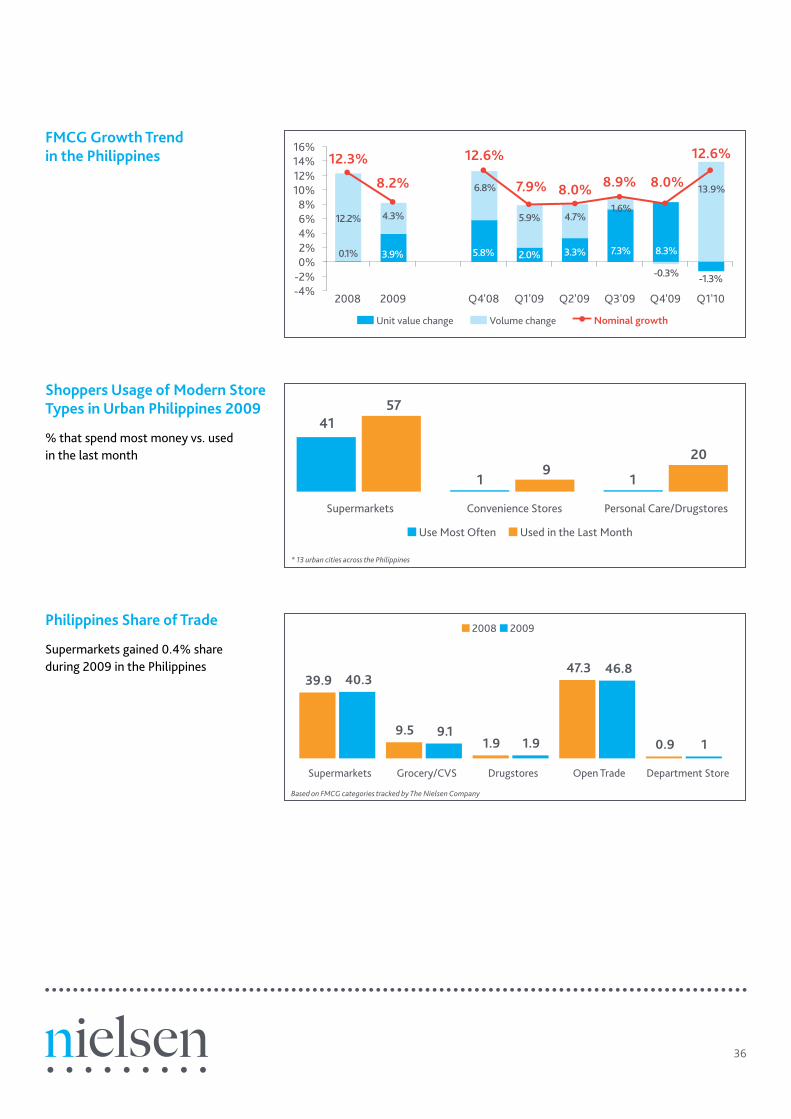
Shoppers Usage of Modern Store Types in Urban Philippines 2009
% that spend most money vs. used in the last month
Philippines Share of Trade
Supermarkets gained 0.4% share during 2009 in the Philippines
0.1% 3.9% 5.8% 2.0% 3.3% 7.3% 8.3%
6.8%
5.9% 4.7%1.6%
13.9%
-1.3%
12.2% 4.3%
-0.3%
12.6%
7.9% 8.9% 8.0%
12.3%
8.2% 8.0%
12.6%
2008 2009 Q4'08 Q1'09 Q2'09 Q3'09 Q4'09 Q1'10-4%-2%0%2%4%6%8%
10%12%14%16%
Unit value change Volume change Nominal growth
11
41
209
57
Supermarkets Convenience Stores Personal Care/Drugstores
Use Most Often Used in the Last Month
39.9
9.51.9
47.3
0.9
40.3
9.11.9
46.8
1
Supermarkets Grocery/CVS Drugstores Open Trade Department Store
2008 2009
FMCG Growth Trend in the Philippines
Based on FMCG categories tracked by The Nielsen Company
* 13 urban cities across the Philippines
37
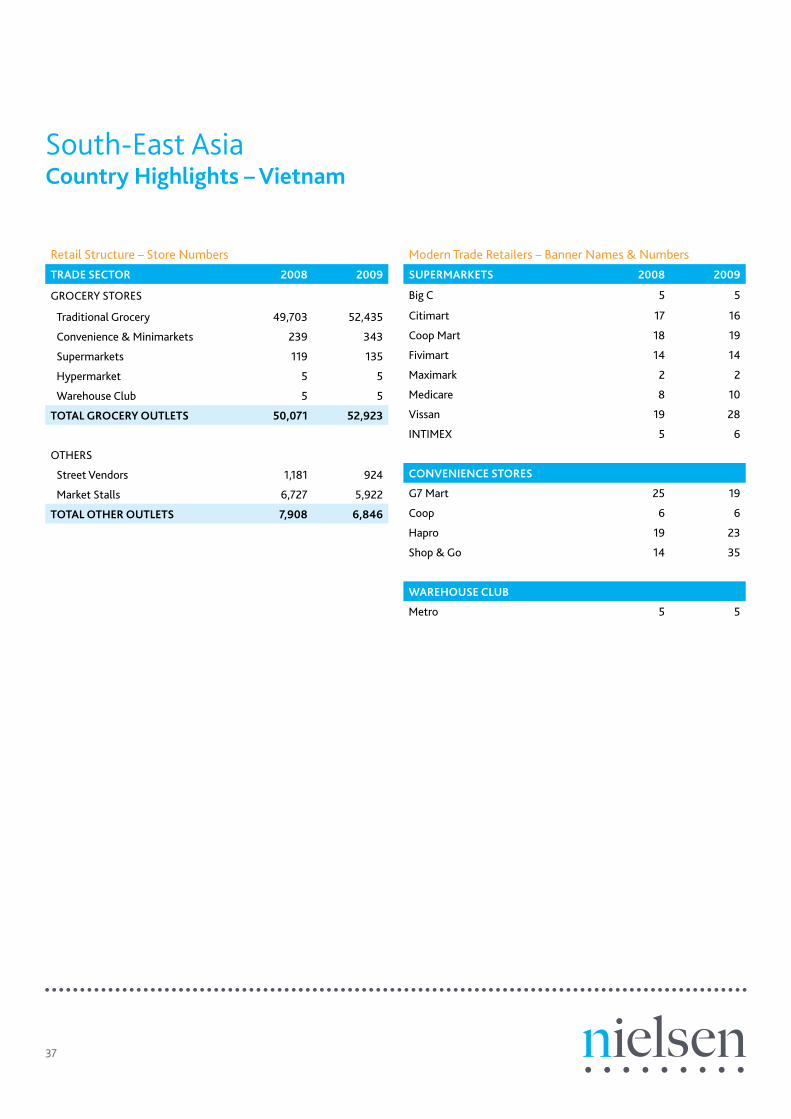
South-East Asia Country Highlights – Vietnam
Retail Structure – Store NumbersTRADE SECTOR 2008 2009
GROCERY STORES
Traditional Grocery 49,703 52,435
Convenience & Minimarkets 239 343
Supermarkets 119 135
Hypermarket 5 5
Warehouse Club 5 5
TOTAL GROCERY OUTLETS 50,071 52,923
OTHERS
Street Vendors 1,181 924
Market Stalls 6,727 5,922
TOTAL OTHER OUTLETS 7,908 6,846
Modern Trade Retailers – Banner Names & NumbersSUPERMARKETS 2008 2009
Big C 5 5
Citimart 17 16
Coop Mart 18 19
Fivimart 14 14
Maximark 2 2
Medicare 8 10
Vissan 19 28
INTIMEX 5 6
CONVENIENCE STORES
G7 Mart 25 19
Coop 6 6
Hapro 19 23
Shop & Go 14 35
WAREHOUSE CLUB
Metro 5 5

38
Shoppers Usage of Modern Store Types in Urban Vietnam 2009
% that spend most money vs. used in the last month
Vietnam Share of Trade
The modern trade Vietnam now accounts for 11% of grocery sales
14.0% 9.1% 16.8% 14.1% 11.0% 6.0% 4.6% 5.0%
20.9%
6.8% 8.9%
6.8%
22.1%
28.7%
8.1%11.4%
37.7%
20.9%
12.8%16.0%
27.1%
42.7%
17.2% 19.9%
2008 2009 Q4'08 Q1'09 Q2'09 Q3'09 Q4'09 Q1'10
0%5%
10%15%20%25%30%35%40%45%
Unit value change Volume change Nominal growth
43
5 0 0
90
37
319
0
20
40
60
80
100
Supermarket Hypermarkets Convenience Store Personal CareStores
Spend Most Used in the Last Month
10
90
11
89
Modern Trade Traditional Trade
2008 2009
FMCG Growth Trend in Vietnam
Based on FMCG categories tracked by The Nielsen Company

39
South-East Asia Country Highlights – India
Retail Structure – Store NumbersTRADE SECTOR 2008 2009
GROCERY STORES
Provision Stores 3,998,261 4,022,155
Pan Bidi Outlets 1,787,269 1,830,984
Food Stores 170,727 172,341
Supermarkets 5,242 6,056
General Stores 1,073,418 1,096,938
TOTAL GROCERY OUTLETS 7,034,917 7,128,474
DRUG STORES
Chemist 379,263 390,176
Cosmetic Stores 184,383 186,686
TOTAL DRUG OUTLETS 563,646 576,862
Modern Trade Retailers – Banner Names & NumbersSUPERMARKETS 2009 2010
Reliance Fresh 329 356
Trinethra/Fabmall 378 403
Spencer's Daily 172 131
Spencer's Express 62 44
Spencers Super 14 12
Spencers Fresh 2 1
Apna Bazar 125 135
More for You 266 246
Sabka Bazar 75 60
Foodworld 67 67
Spinach 45 35
Nilgiris 50 33
6TEN 499 270
LM365 44 49
Fresh@ 75 75
Kendriya Bhandar 29 123
Arambagh 27 33
Vishal Megamart 141 145
Wellness 137 156
Magna 61 65
Smart 47 34
Big Apple 44 42
Patel Low Price 11 11
Total 4 4
Kannan 7 9
Hypercity 1 7
Kishore Biyanani's Fair Price 149 93
Amudham 26 27
Maratha Stores 18 20
Supplyco 4 17
Janatha Bazar 8 8
Triveny 12 12
Samavayika 10 15
Dabur New U 7 10
Akbarallys 5 8
Basco 1 1
Modern Trade Retailers – Banner Names & NumbersHYPERMARKETS 2009 2010
Big Bazaar 151 169
Spar Hyper 3 3
Giant-Spencers Hyper 21 19
CONVENIENCE STORES
BPCL In & Out 73 133
Convenio 8 15
HP Speedmart 15 17
Akbarallys 5 8
Club HP 7 22
PHARMACY
Apollo Pharmacy 188 740
Health & Glow 61 65
Medplus Pharmacy 119 570
Medicine Shoppe 18 210
Raj Rajya Sahakari 36 35
Himalaya Ayurvedic 14 95

40
Shoppers Usage of Modern Store Types in India 2009
% that spend most money vs. used in the last month
India Share of Trade
After the strong expansion of the modern trade over the last 5 years in India, 2009 was a year of consolidation with share remaining at 5%
9.2% 4.4% 8.9% 5.6% 2.9% 0.3% 0.8%
8.3% 11.5%12.6%
10.2%
8.9%
10.2%10.4%
17.2%15.5%
9.2%11.0%
17.1%14.6%
19.6%
2008 2009 Q4'08 Q1'09 Q2'09 Q3'09 Q4'09 Q1'100%
5%
10%
15%
20%
25%
Unit value change Volume change Nominal growth
2 91 0
58
7
2817
56
92
Hypermarkets Supermarkets ConvenienceStores
Personal Care/ Drugstores
Traditional
Spend Most Used in last Month
5
95
5
95
Modern Trade Traditional Trade
2008 2009
FMCG Growth Trend in India
Based on FMCG categories tracked by The Nielsen Company

41
15
85
16
84
Supermarkets Traditional Grocery
2008 2009
South-East Asia Country Highlights – Sri Lanka
Retail Structure – Store NumbersTRADE SECTOR 2009 2010
GROCERY STORES
Traditional Grocery Stores 105,392 115,490
Supermarkets 510 958
TOTAL GROCERY OUTLETS 105,902 116,448
DRUG STORES
Traditional Drugstores 2,400 2,346
TOTAL DRUG OUTLETS 2,400 2,346
Modern Trade Retailers – Banner Names & NumbersSUPERMARKETS
Cargills 138 142
Sathosa Retail 105 190
Keells/Super Pola 40 61
Arpico 10 13
Co-op City 263 365
CONVENIENCE STORES
Laugfs 22 31
Sri Lanka Share of Trade
In Sri Lanka, the modern trade continued to steadily gain share in 2009
Based on FMCG categories tracked by The Nielsen Company
Copyright © 2010 The Nielsen Company. All rights reserved. Produced in the USA. Nielsen and the Nielsen logo are trademarks or registered trademarks of CZT/ACN Trademarks, L.L.C. Other product and service names are trademarks or registered trademarks of their respective companies. 2010/1724
For more information, please contact:
Peter GaleManaging Director - Retailer ServicesAsia Pacific, Middle East & AfricaThe Nielsen Company
Phone: +66(0)2673-4660Email: [email protected]
www.nielsen.com